Zip Codes with the Highest Percentage of Population Employed in Arts, Media & Entertainment in Memphis, TN
RELATED REPORTS & OPTIONS
Arts, Media & Entertainment
Memphis
Compare Zip Codes
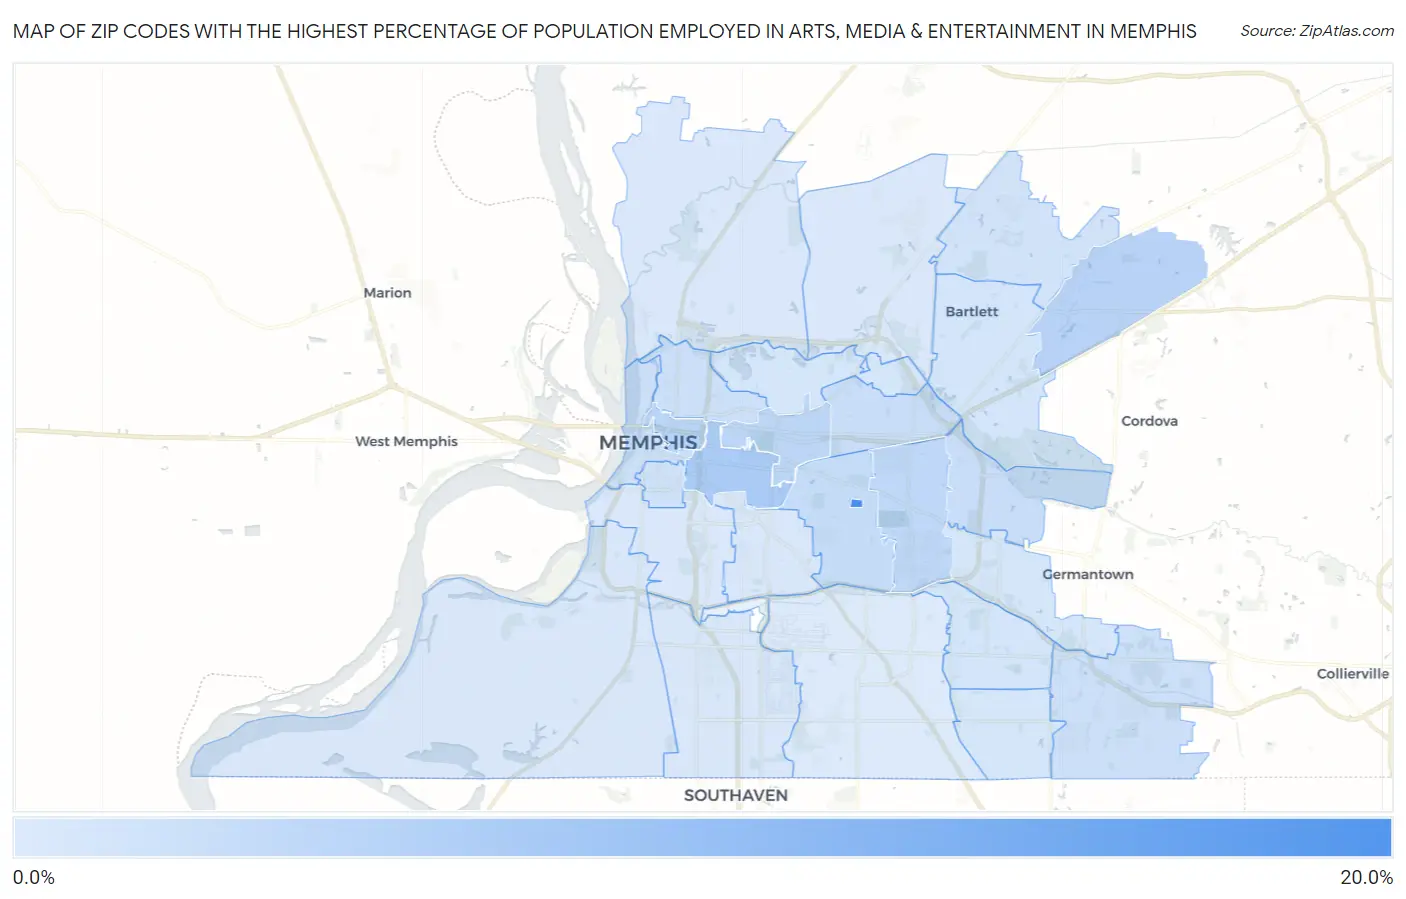
Map of Zip Codes with the Highest Percentage of Population Employed in Arts, Media & Entertainment in Memphis
0.0%
20.0%
Zip Codes with the Highest Percentage of Population Employed in Arts, Media & Entertainment in Memphis, TN
| Zip Code | % Employed | vs State | vs National | |
| 1. | 38152 | 15.3% | 1.9%(+13.4)#4 | 2.1%(+13.2)#158 |
| 2. | 38104 | 5.0% | 1.9%(+3.07)#36 | 2.1%(+2.95)#1,497 |
| 3. | 38133 | 3.7% | 1.9%(+1.72)#61 | 2.1%(+1.60)#2,823 |
| 4. | 38105 | 3.6% | 1.9%(+1.64)#62 | 2.1%(+1.52)#2,945 |
| 5. | 38112 | 3.3% | 1.9%(+1.35)#74 | 2.1%(+1.23)#3,446 |
| 6. | 38117 | 3.0% | 1.9%(+1.04)#84 | 2.1%(+0.924)#4,128 |
| 7. | 38111 | 2.3% | 1.9%(+0.315)#122 | 2.1%(+0.195)#6,570 |
| 8. | 38120 | 2.2% | 1.9%(+0.304)#123 | 2.1%(+0.185)#6,626 |
| 9. | 38122 | 2.0% | 1.9%(+0.101)#139 | 2.1%(-0.018)#7,582 |
| 10. | 38125 | 1.8% | 1.9%(-0.141)#167 | 2.1%(-0.260)#8,973 |
| 11. | 38103 | 1.7% | 1.9%(-0.219)#171 | 2.1%(-0.338)#9,446 |
| 12. | 38107 | 1.6% | 1.9%(-0.330)#182 | 2.1%(-0.449)#10,256 |
| 13. | 38126 | 1.4% | 1.9%(-0.548)#212 | 2.1%(-0.667)#11,762 |
| 14. | 38135 | 1.3% | 1.9%(-0.678)#228 | 2.1%(-0.797)#12,729 |
| 15. | 38134 | 1.1% | 1.9%(-0.810)#243 | 2.1%(-0.929)#13,725 |
| 16. | 38115 | 1.0% | 1.9%(-0.918)#266 | 2.1%(-1.04)#14,626 |
| 17. | 38141 | 0.88% | 1.9%(-1.06)#286 | 2.1%(-1.18)#15,789 |
| 18. | 38119 | 0.87% | 1.9%(-1.07)#288 | 2.1%(-1.19)#15,847 |
| 19. | 38108 | 0.71% | 1.9%(-1.23)#320 | 2.1%(-1.35)#17,139 |
| 20. | 38109 | 0.67% | 1.9%(-1.27)#327 | 2.1%(-1.39)#17,476 |
| 21. | 38114 | 0.60% | 1.9%(-1.34)#342 | 2.1%(-1.46)#18,071 |
| 22. | 38116 | 0.54% | 1.9%(-1.41)#353 | 2.1%(-1.53)#18,563 |
| 23. | 38128 | 0.45% | 1.9%(-1.50)#365 | 2.1%(-1.62)#19,324 |
| 24. | 38127 | 0.43% | 1.9%(-1.51)#368 | 2.1%(-1.63)#19,438 |
| 25. | 38106 | 0.37% | 1.9%(-1.57)#382 | 2.1%(-1.69)#19,863 |
| 26. | 38118 | 0.17% | 1.9%(-1.77)#420 | 2.1%(-1.89)#21,159 |
1
Common Questions
What are the Top 10 Zip Codes with the Highest Percentage of Population Employed in Arts, Media & Entertainment in Memphis, TN?
Top 10 Zip Codes with the Highest Percentage of Population Employed in Arts, Media & Entertainment in Memphis, TN are:
What zip code has the Highest Percentage of Population Employed in Arts, Media & Entertainment in Memphis, TN?
38152 has the Highest Percentage of Population Employed in Arts, Media & Entertainment in Memphis, TN with 15.3%.
What is the Percentage of Population Employed in Arts, Media & Entertainment in Memphis, TN?
Percentage of Population Employed in Arts, Media & Entertainment in Memphis is 1.4%.
What is the Percentage of Population Employed in Arts, Media & Entertainment in Tennessee?
Percentage of Population Employed in Arts, Media & Entertainment in Tennessee is 1.9%.
What is the Percentage of Population Employed in Arts, Media & Entertainment in the United States?
Percentage of Population Employed in Arts, Media & Entertainment in the United States is 2.1%.