Zip Codes with the Highest Percentage of Population Employed in Computer & Mathematics in Crossville, TN
RELATED REPORTS & OPTIONS
Computer & Mathematics
Crossville
Compare Zip Codes
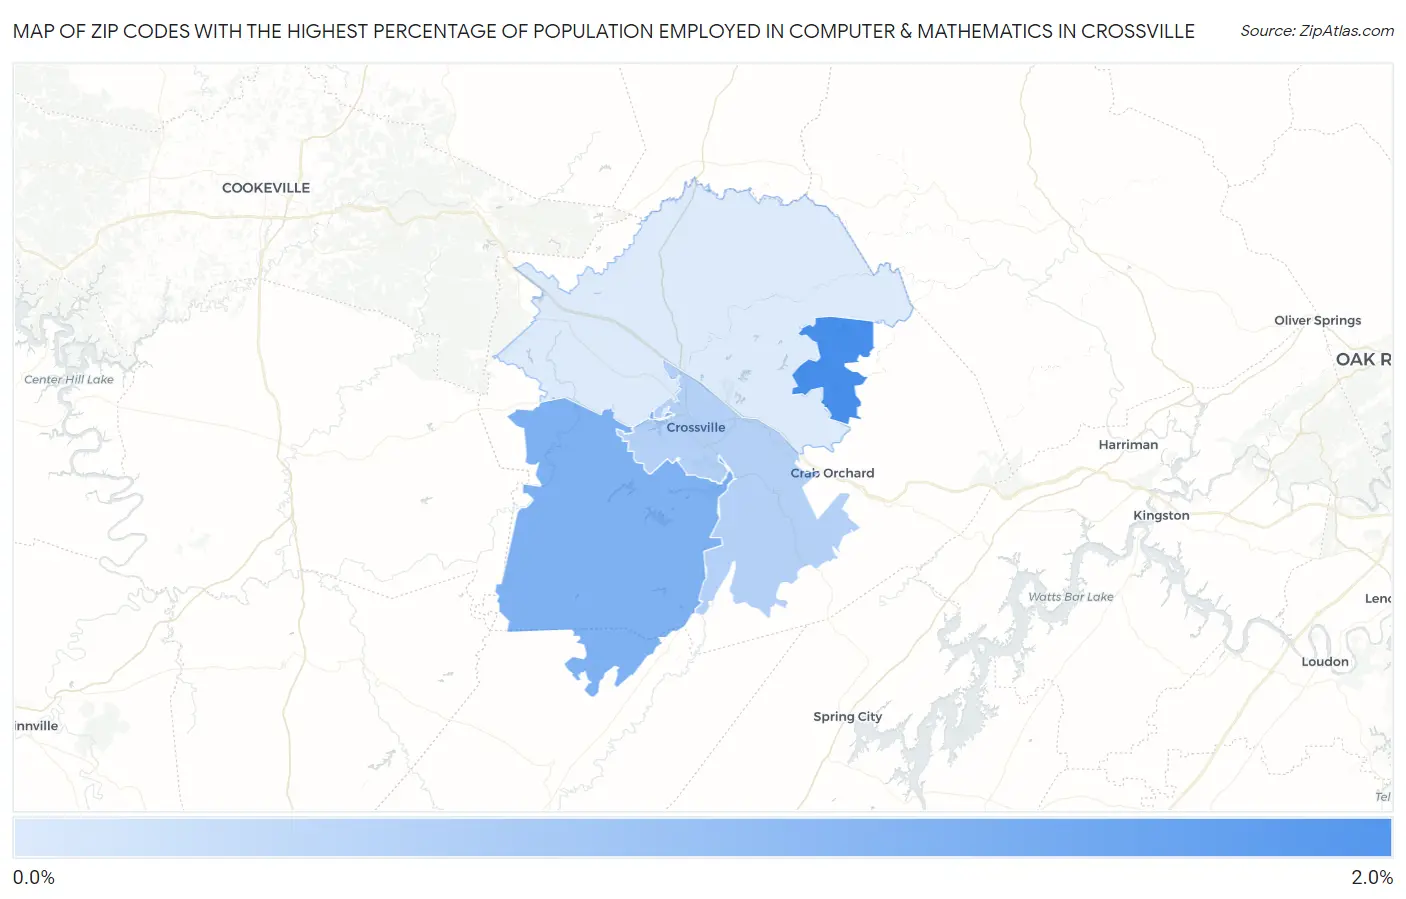
Map of Zip Codes with the Highest Percentage of Population Employed in Computer & Mathematics in Crossville
0.0%
2.0%
Zip Codes with the Highest Percentage of Population Employed in Computer & Mathematics in Crossville, TN
| Zip Code | % Employed | vs State | vs National | |
| 1. | 38558 | 1.8% | 2.6%(-0.796)#220 | 3.5%(-1.74)#12,810 |
| 2. | 38572 | 1.4% | 2.6%(-1.20)#261 | 3.5%(-2.14)#15,024 |
| 3. | 38555 | 1.0% | 2.6%(-1.58)#318 | 3.5%(-2.52)#17,374 |
| 4. | 38571 | 0.69% | 2.6%(-1.89)#365 | 3.5%(-2.83)#19,305 |
1
Common Questions
What are the Top 3 Zip Codes with the Highest Percentage of Population Employed in Computer & Mathematics in Crossville, TN?
Top 3 Zip Codes with the Highest Percentage of Population Employed in Computer & Mathematics in Crossville, TN are:
What zip code has the Highest Percentage of Population Employed in Computer & Mathematics in Crossville, TN?
38558 has the Highest Percentage of Population Employed in Computer & Mathematics in Crossville, TN with 1.8%.
What is the Percentage of Population Employed in Computer & Mathematics in Crossville, TN?
Percentage of Population Employed in Computer & Mathematics in Crossville is 0.19%.
What is the Percentage of Population Employed in Computer & Mathematics in Tennessee?
Percentage of Population Employed in Computer & Mathematics in Tennessee is 2.6%.
What is the Percentage of Population Employed in Computer & Mathematics in the United States?
Percentage of Population Employed in Computer & Mathematics in the United States is 3.5%.