Zip Codes with the Highest Percentage of Population Employed in Arts, Media & Entertainment in Lebanon, TN
RELATED REPORTS & OPTIONS
Arts, Media & Entertainment
Lebanon
Compare Zip Codes
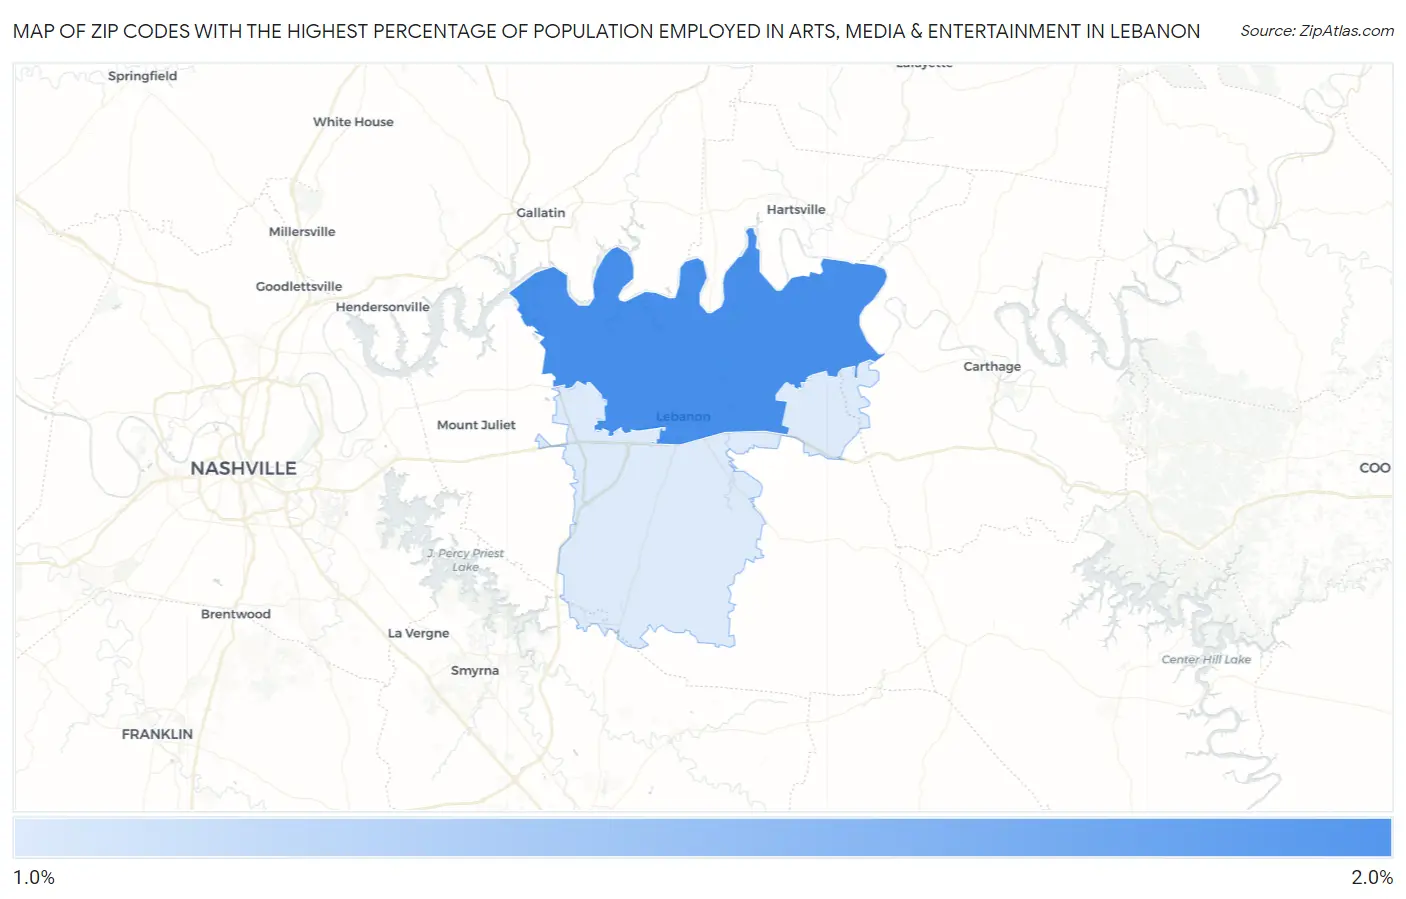
Map of Zip Codes with the Highest Percentage of Population Employed in Arts, Media & Entertainment in Lebanon
0.0%
2.0%
Zip Codes with the Highest Percentage of Population Employed in Arts, Media & Entertainment in Lebanon, TN
| Zip Code | % Employed | vs State | vs National | |
| 1. | 37087 | 1.7% | 1.9%(-0.249)#175 | 2.1%(-0.368)#9,681 |
| 2. | 37090 | 1.6% | 1.9%(-0.342)#185 | 2.1%(-0.462)#10,340 |
1
Common Questions
What are the Top Zip Codes with the Highest Percentage of Population Employed in Arts, Media & Entertainment in Lebanon, TN?
Top Zip Codes with the Highest Percentage of Population Employed in Arts, Media & Entertainment in Lebanon, TN are:
What zip code has the Highest Percentage of Population Employed in Arts, Media & Entertainment in Lebanon, TN?
37087 has the Highest Percentage of Population Employed in Arts, Media & Entertainment in Lebanon, TN with 1.7%.
What is the Percentage of Population Employed in Arts, Media & Entertainment in Lebanon, TN?
Percentage of Population Employed in Arts, Media & Entertainment in Lebanon is 1.9%.
What is the Percentage of Population Employed in Arts, Media & Entertainment in Tennessee?
Percentage of Population Employed in Arts, Media & Entertainment in Tennessee is 1.9%.
What is the Percentage of Population Employed in Arts, Media & Entertainment in the United States?
Percentage of Population Employed in Arts, Media & Entertainment in the United States is 2.1%.