Zip Codes with the Highest Percentage of Population Employed in Construction in Crossville, TN
RELATED REPORTS & OPTIONS
Construction
Crossville
Compare Zip Codes
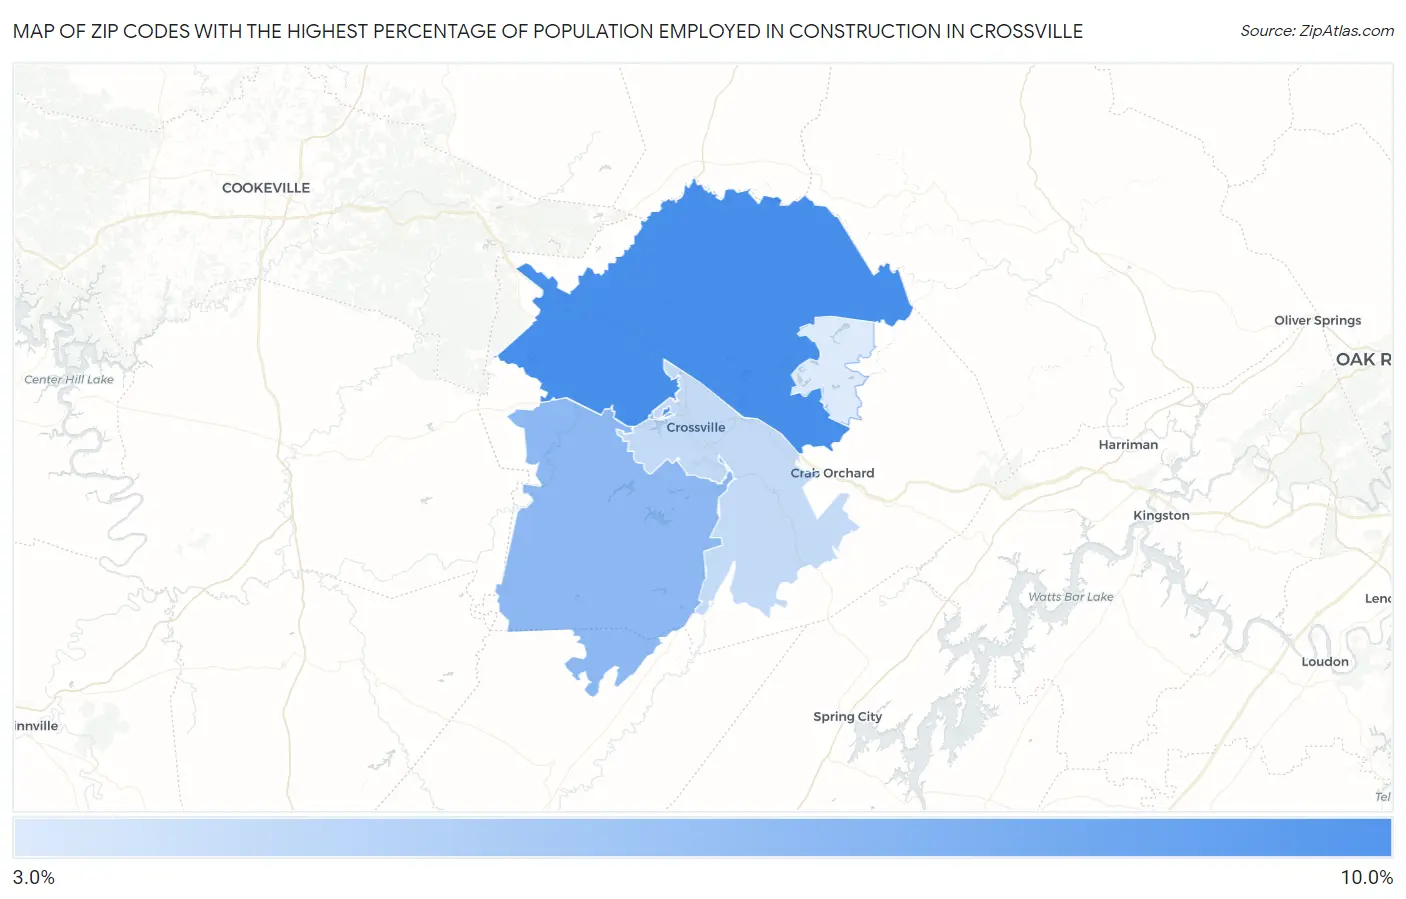
Map of Zip Codes with the Highest Percentage of Population Employed in Construction in Crossville
0.0%
10.0%
Zip Codes with the Highest Percentage of Population Employed in Construction in Crossville, TN
| Zip Code | % Employed | vs State | vs National | |
| 1. | 38571 | 9.6% | 6.8%(+2.85)#187 | 6.9%(+2.75)#9,241 |
| 2. | 38572 | 7.0% | 6.8%(+0.219)#322 | 6.9%(+0.124)#15,755 |
| 3. | 38555 | 4.9% | 6.8%(-1.91)#467 | 6.9%(-2.00)#22,327 |
| 4. | 38558 | 3.9% | 6.8%(-2.84)#517 | 6.9%(-2.94)#24,884 |
1
Common Questions
What are the Top 3 Zip Codes with the Highest Percentage of Population Employed in Construction in Crossville, TN?
Top 3 Zip Codes with the Highest Percentage of Population Employed in Construction in Crossville, TN are:
What zip code has the Highest Percentage of Population Employed in Construction in Crossville, TN?
38571 has the Highest Percentage of Population Employed in Construction in Crossville, TN with 9.6%.
What is the Percentage of Population Employed in Construction in Crossville, TN?
Percentage of Population Employed in Construction in Crossville is 5.4%.
What is the Percentage of Population Employed in Construction in Tennessee?
Percentage of Population Employed in Construction in Tennessee is 6.8%.
What is the Percentage of Population Employed in Construction in the United States?
Percentage of Population Employed in Construction in the United States is 6.9%.