Zip Codes with the Highest Percentage of Population Employed in Arts, Media & Entertainment in Vermont
RELATED REPORTS & OPTIONS
Arts, Media & Entertainment
Vermont
Compare Zip Codes
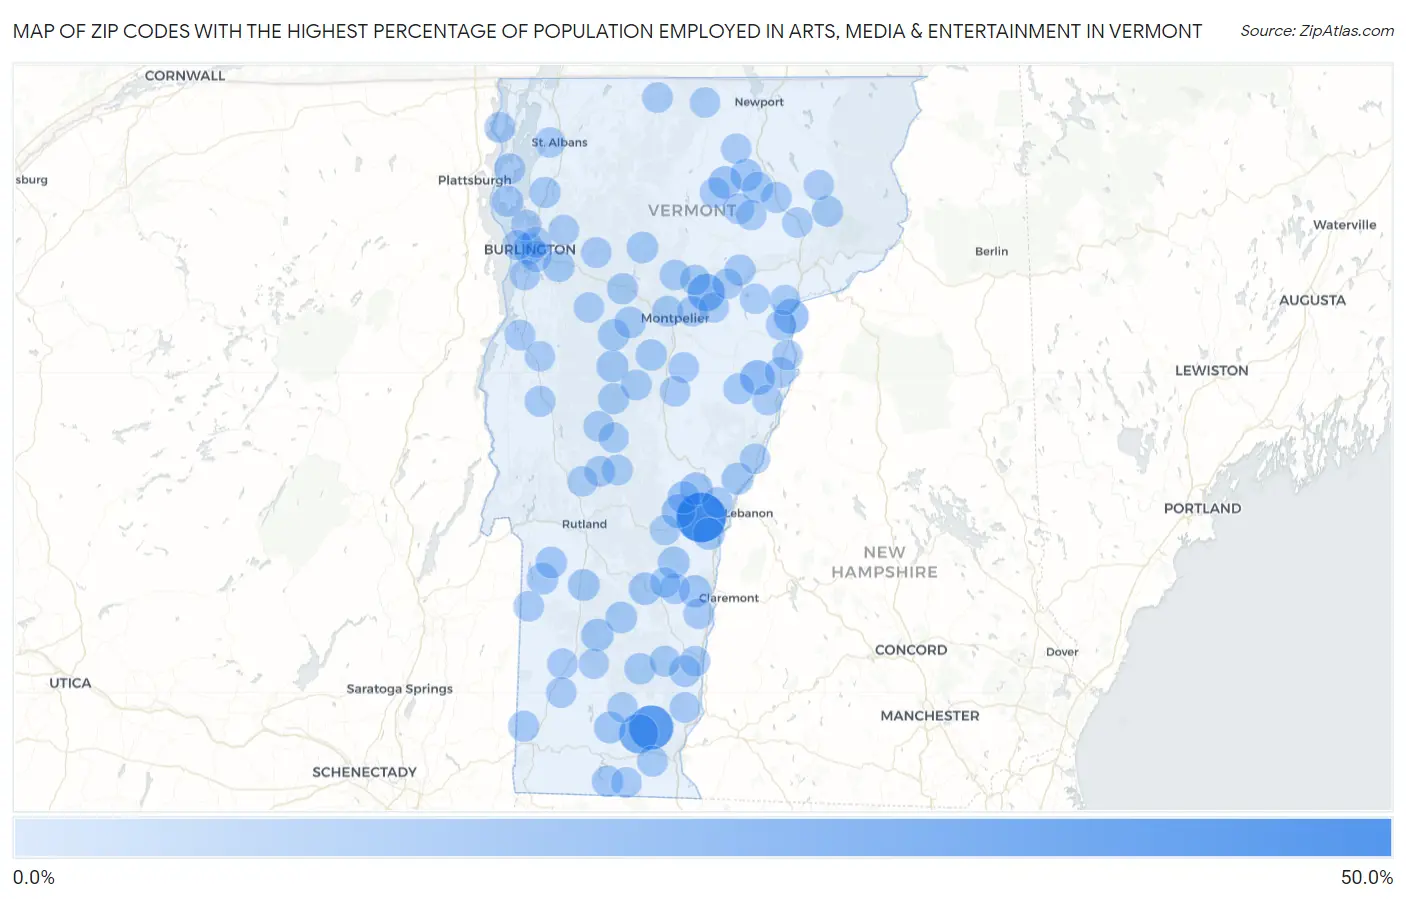
Map of Zip Codes with the Highest Percentage of Population Employed in Arts, Media & Entertainment in Vermont
0.0%
50.0%
Zip Codes with the Highest Percentage of Population Employed in Arts, Media & Entertainment in Vermont
| Zip Code | % Employed | vs State | vs National | |
| 1. | 05073 | 45.5% | 2.7%(+42.8)#1 | 2.1%(+43.4)#17 |
| 2. | 05362 | 33.3% | 2.7%(+30.7)#2 | 2.1%(+31.3)#33 |
| 3. | 05351 | 22.0% | 2.7%(+19.3)#3 | 2.1%(+19.9)#76 |
| 4. | 05666 | 17.6% | 2.7%(+15.0)#4 | 2.1%(+15.6)#122 |
| 5. | 05050 | 12.0% | 2.7%(+9.37)#5 | 2.1%(+9.99)#252 |
| 6. | 05040 | 12.0% | 2.7%(+9.34)#6 | 2.1%(+9.95)#254 |
| 7. | 05091 | 9.8% | 2.7%(+7.12)#7 | 2.1%(+7.73)#389 |
| 8. | 05827 | 7.4% | 2.7%(+4.72)#8 | 2.1%(+5.33)#671 |
| 9. | 05053 | 7.4% | 2.7%(+4.69)#9 | 2.1%(+5.30)#676 |
| 10. | 05067 | 7.1% | 2.7%(+4.47)#10 | 2.1%(+5.08)#725 |
| 11. | 05149 | 7.1% | 2.7%(+4.38)#11 | 2.1%(+5.00)#745 |
| 12. | 05152 | 7.0% | 2.7%(+4.29)#12 | 2.1%(+4.91)#767 |
| 13. | 05875 | 6.6% | 2.7%(+3.90)#13 | 2.1%(+4.51)#857 |
| 14. | 05151 | 6.5% | 2.7%(+3.87)#14 | 2.1%(+4.49)#862 |
| 15. | 05048 | 6.3% | 2.7%(+3.60)#15 | 2.1%(+4.21)#937 |
| 16. | 05674 | 6.0% | 2.7%(+3.37)#16 | 2.1%(+3.99)#1,017 |
| 17. | 05356 | 5.7% | 2.7%(+3.04)#17 | 2.1%(+3.65)#1,153 |
| 18. | 05055 | 5.7% | 2.7%(+3.02)#18 | 2.1%(+3.63)#1,163 |
| 19. | 05062 | 5.7% | 2.7%(+3.01)#19 | 2.1%(+3.62)#1,165 |
| 20. | 05773 | 5.5% | 2.7%(+2.87)#20 | 2.1%(+3.48)#1,224 |
| 21. | 05401 | 5.5% | 2.7%(+2.80)#21 | 2.1%(+3.42)#1,260 |
| 22. | 05672 | 5.3% | 2.7%(+2.62)#22 | 2.1%(+3.24)#1,350 |
| 23. | 05161 | 5.2% | 2.7%(+2.56)#23 | 2.1%(+3.17)#1,381 |
| 24. | 05774 | 5.2% | 2.7%(+2.49)#24 | 2.1%(+3.10)#1,417 |
| 25. | 05673 | 5.1% | 2.7%(+2.42)#25 | 2.1%(+3.03)#1,452 |
| 26. | 05660 | 5.1% | 2.7%(+2.40)#26 | 2.1%(+3.01)#1,462 |
| 27. | 05757 | 5.1% | 2.7%(+2.39)#27 | 2.1%(+3.01)#1,464 |
| 28. | 05486 | 5.0% | 2.7%(+2.36)#28 | 2.1%(+2.98)#1,479 |
| 29. | 05495 | 4.8% | 2.7%(+2.16)#29 | 2.1%(+2.77)#1,594 |
| 30. | 05154 | 4.7% | 2.7%(+2.07)#30 | 2.1%(+2.69)#1,661 |
| 31. | 05663 | 4.7% | 2.7%(+2.01)#31 | 2.1%(+2.63)#1,698 |
| 32. | 05839 | 4.7% | 2.7%(+2.01)#32 | 2.1%(+2.62)#1,703 |
| 33. | 05359 | 4.6% | 2.7%(+1.95)#33 | 2.1%(+2.56)#1,761 |
| 34. | 05361 | 4.6% | 2.7%(+1.90)#34 | 2.1%(+2.52)#1,794 |
| 35. | 05747 | 4.2% | 2.7%(+1.57)#35 | 2.1%(+2.18)#2,099 |
| 36. | 05468 | 4.2% | 2.7%(+1.51)#36 | 2.1%(+2.13)#2,155 |
| 37. | 05676 | 4.1% | 2.7%(+1.47)#37 | 2.1%(+2.08)#2,196 |
| 38. | 05832 | 4.0% | 2.7%(+1.33)#38 | 2.1%(+1.95)#2,362 |
| 39. | 05257 | 4.0% | 2.7%(+1.32)#39 | 2.1%(+1.93)#2,372 |
| 40. | 05602 | 3.9% | 2.7%(+1.27)#40 | 2.1%(+1.88)#2,440 |
| 41. | 05403 | 3.9% | 2.7%(+1.26)#41 | 2.1%(+1.88)#2,449 |
| 42. | 05039 | 3.8% | 2.7%(+1.14)#42 | 2.1%(+1.76)#2,601 |
| 43. | 05647 | 3.8% | 2.7%(+1.12)#43 | 2.1%(+1.73)#2,634 |
| 44. | 05301 | 3.8% | 2.7%(+1.09)#44 | 2.1%(+1.71)#2,669 |
| 45. | 05753 | 3.7% | 2.7%(+1.06)#45 | 2.1%(+1.67)#2,722 |
| 46. | 05866 | 3.7% | 2.7%(+1.05)#46 | 2.1%(+1.67)#2,724 |
| 47. | 05146 | 3.7% | 2.7%(+1.03)#47 | 2.1%(+1.64)#2,765 |
| 48. | 05841 | 3.6% | 2.7%(+0.918)#48 | 2.1%(+1.53)#2,920 |
| 49. | 05456 | 3.5% | 2.7%(+0.786)#49 | 2.1%(+1.40)#3,117 |
| 50. | 05669 | 3.4% | 2.7%(+0.753)#50 | 2.1%(+1.37)#3,173 |
| 51. | 05001 | 3.4% | 2.7%(+0.753)#51 | 2.1%(+1.37)#3,176 |
| 52. | 05762 | 3.4% | 2.7%(+0.715)#52 | 2.1%(+1.33)#3,254 |
| 53. | 05748 | 3.3% | 2.7%(+0.644)#53 | 2.1%(+1.26)#3,395 |
| 54. | 05476 | 3.3% | 2.7%(+0.620)#54 | 2.1%(+1.23)#3,432 |
| 55. | 05482 | 3.3% | 2.7%(+0.619)#55 | 2.1%(+1.23)#3,436 |
| 56. | 05737 | 3.3% | 2.7%(+0.582)#56 | 2.1%(+1.20)#3,498 |
| 57. | 05404 | 3.2% | 2.7%(+0.574)#57 | 2.1%(+1.19)#3,513 |
| 58. | 05465 | 3.2% | 2.7%(+0.560)#58 | 2.1%(+1.17)#3,540 |
| 59. | 05156 | 3.2% | 2.7%(+0.544)#59 | 2.1%(+1.16)#3,573 |
| 60. | 05463 | 3.2% | 2.7%(+0.528)#60 | 2.1%(+1.14)#3,609 |
| 61. | 05346 | 3.2% | 2.7%(+0.498)#61 | 2.1%(+1.11)#3,682 |
| 62. | 05679 | 3.1% | 2.7%(+0.472)#62 | 2.1%(+1.09)#3,743 |
| 63. | 05458 | 3.1% | 2.7%(+0.469)#63 | 2.1%(+1.08)#3,750 |
| 64. | 05051 | 3.1% | 2.7%(+0.434)#64 | 2.1%(+1.05)#3,831 |
| 65. | 05254 | 3.1% | 2.7%(+0.434)#65 | 2.1%(+1.05)#3,833 |
| 66. | 05446 | 3.1% | 2.7%(+0.410)#66 | 2.1%(+1.02)#3,886 |
| 67. | 05101 | 3.1% | 2.7%(+0.378)#67 | 2.1%(+0.992)#3,966 |
| 68. | 05775 | 3.0% | 2.7%(+0.365)#68 | 2.1%(+0.980)#3,993 |
| 69. | 05042 | 3.0% | 2.7%(+0.345)#69 | 2.1%(+0.959)#4,031 |
| 70. | 05651 | 3.0% | 2.7%(+0.319)#70 | 2.1%(+0.933)#4,095 |
| 71. | 05142 | 3.0% | 2.7%(+0.301)#71 | 2.1%(+0.915)#4,146 |
| 72. | 05342 | 3.0% | 2.7%(+0.278)#72 | 2.1%(+0.893)#4,201 |
| 73. | 05826 | 2.9% | 2.7%(+0.275)#73 | 2.1%(+0.889)#4,209 |
| 74. | 05036 | 2.9% | 2.7%(+0.243)#74 | 2.1%(+0.858)#4,294 |
| 75. | 05081 | 2.9% | 2.7%(+0.196)#75 | 2.1%(+0.810)#4,426 |
| 76. | 05252 | 2.9% | 2.7%(+0.182)#76 | 2.1%(+0.796)#4,451 |
| 77. | 05682 | 2.9% | 2.7%(+0.177)#77 | 2.1%(+0.792)#4,468 |
| 78. | 05478 | 2.8% | 2.7%(+0.100)#78 | 2.1%(+0.714)#4,682 |
| 79. | 05842 | 2.8% | 2.7%(+0.093)#79 | 2.1%(+0.707)#4,705 |
| 80. | 05667 | 2.7% | 2.7%(+0.055)#80 | 2.1%(+0.669)#4,820 |
| 81. | 05153 | 2.7% | 2.7%(+0.048)#81 | 2.1%(+0.662)#4,846 |
| 82. | 05871 | 2.7% | 2.7%(+0.032)#82 | 2.1%(+0.647)#4,880 |
| 83. | 05763 | 2.7% | 2.7%(-0.020)#83 | 2.1%(+0.594)#5,048 |
| 84. | 05043 | 2.6% | 2.7%(-0.025)#84 | 2.1%(+0.589)#5,066 |
| 85. | 05658 | 2.6% | 2.7%(-0.030)#85 | 2.1%(+0.585)#5,079 |
| 86. | 05859 | 2.6% | 2.7%(-0.040)#86 | 2.1%(+0.575)#5,114 |
| 87. | 05340 | 2.6% | 2.7%(-0.044)#87 | 2.1%(+0.571)#5,131 |
| 88. | 05850 | 2.6% | 2.7%(-0.044)#88 | 2.1%(+0.571)#5,137 |
| 89. | 05845 | 2.6% | 2.7%(-0.072)#89 | 2.1%(+0.542)#5,221 |
| 90. | 05033 | 2.6% | 2.7%(-0.073)#90 | 2.1%(+0.541)#5,225 |
| 91. | 05355 | 2.6% | 2.7%(-0.124)#91 | 2.1%(+0.490)#5,397 |
| 92. | 05462 | 2.5% | 2.7%(-0.140)#92 | 2.1%(+0.475)#5,438 |
| 93. | 05821 | 2.5% | 2.7%(-0.158)#93 | 2.1%(+0.456)#5,498 |
| 94. | 05452 | 2.5% | 2.7%(-0.185)#94 | 2.1%(+0.429)#5,585 |
| 95. | 05472 | 2.5% | 2.7%(-0.205)#95 | 2.1%(+0.409)#5,655 |
| 96. | 05034 | 2.5% | 2.7%(-0.206)#96 | 2.1%(+0.408)#5,658 |
| 97. | 05648 | 2.4% | 2.7%(-0.245)#97 | 2.1%(+0.370)#5,818 |
| 98. | 05862 | 2.4% | 2.7%(-0.251)#98 | 2.1%(+0.363)#5,840 |
| 99. | 05767 | 2.4% | 2.7%(-0.258)#99 | 2.1%(+0.356)#5,878 |
| 100. | 05408 | 2.4% | 2.7%(-0.265)#100 | 2.1%(+0.350)#5,898 |
Common Questions
What are the Top 10 Zip Codes with the Highest Percentage of Population Employed in Arts, Media & Entertainment in Vermont?
Top 10 Zip Codes with the Highest Percentage of Population Employed in Arts, Media & Entertainment in Vermont are:
What zip code has the Highest Percentage of Population Employed in Arts, Media & Entertainment in Vermont?
05073 has the Highest Percentage of Population Employed in Arts, Media & Entertainment in Vermont with 45.5%.
What is the Percentage of Population Employed in Arts, Media & Entertainment in the State of Vermont?
Percentage of Population Employed in Arts, Media & Entertainment in Vermont is 2.7%.
What is the Percentage of Population Employed in Arts, Media & Entertainment in the United States?
Percentage of Population Employed in Arts, Media & Entertainment in the United States is 2.1%.