Zip Codes with the Highest Percentage of Local Government Employees in Crossville, TN
RELATED REPORTS & OPTIONS
Local Government Employees
Crossville
Compare Zip Codes
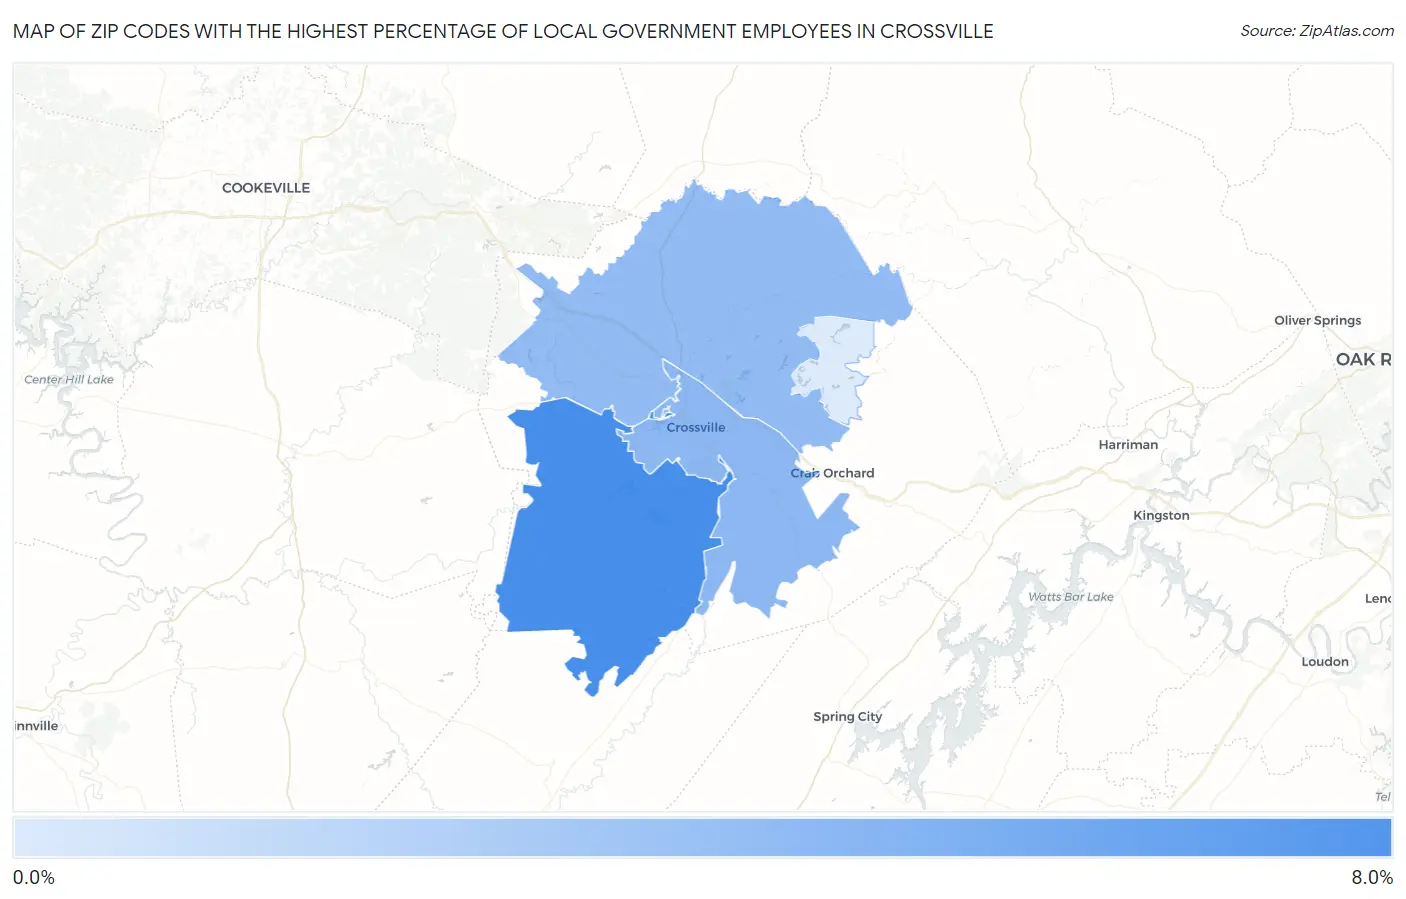
Map of Zip Codes with the Highest Percentage of Local Government Employees in Crossville
0.0%
8.0%
Zip Codes with the Highest Percentage of Local Government Employees in Crossville, TN
| Zip Code | % Local Government Employees | vs State | vs National | |
| 1. | 38572 | 7.7% | 7.1%(+0.683)#290 | 7.2%(+0.509)#13,984 |
| 2. | 38555 | 4.8% | 7.1%(-2.25)#483 | 7.2%(-2.42)#23,603 |
| 3. | 38571 | 4.6% | 7.1%(-2.41)#492 | 7.2%(-2.58)#24,046 |
| 4. | 38558 | 1.6% | 7.1%(-5.50)#578 | 7.2%(-5.67)#29,045 |
1
Common Questions
What are the Top 3 Zip Codes with the Highest Percentage of Local Government Employees in Crossville, TN?
Top 3 Zip Codes with the Highest Percentage of Local Government Employees in Crossville, TN are:
What zip code has the Highest Percentage of Local Government Employees in Crossville, TN?
38572 has the Highest Percentage of Local Government Employees in Crossville, TN with 7.7%.
What is the Percentage of Local Government Employees in Crossville, TN?
Percentage of Local Government Employees in Crossville is 5.1%.
What is the Percentage of Local Government Employees in Tennessee?
Percentage of Local Government Employees in Tennessee is 7.1%.
What is the Percentage of Local Government Employees in the United States?
Percentage of Local Government Employees in the United States is 7.2%.