Terrytown, NE
Terrytown Map
Terrytown Overview
714
TOTAL POPULATION
349
MALE POPULATION
365
FEMALE POPULATION
95.62
MALES / 100 FEMALES
104.58
FEMALES / 100 MALES
38.3
MEDIAN AGE
2.9
AVG FAMILY SIZE
2.1
AVG HOUSEHOLD SIZE
$20,735
PER CAPITA INCOME
$48,125
AVG FAMILY INCOME
$37,250
AVG HOUSEHOLD INCOME
46.4%
WAGE / INCOME GAP [ % ]
53.6¢/ $1
WAGE / INCOME GAP [ $ ]
0.42
INEQUALITY / GINI INDEX
350
LABOR FORCE [ PEOPLE ]
66.5%
PERCENT IN LABOR FORCE
4.0%
UNEMPLOYMENT RATE
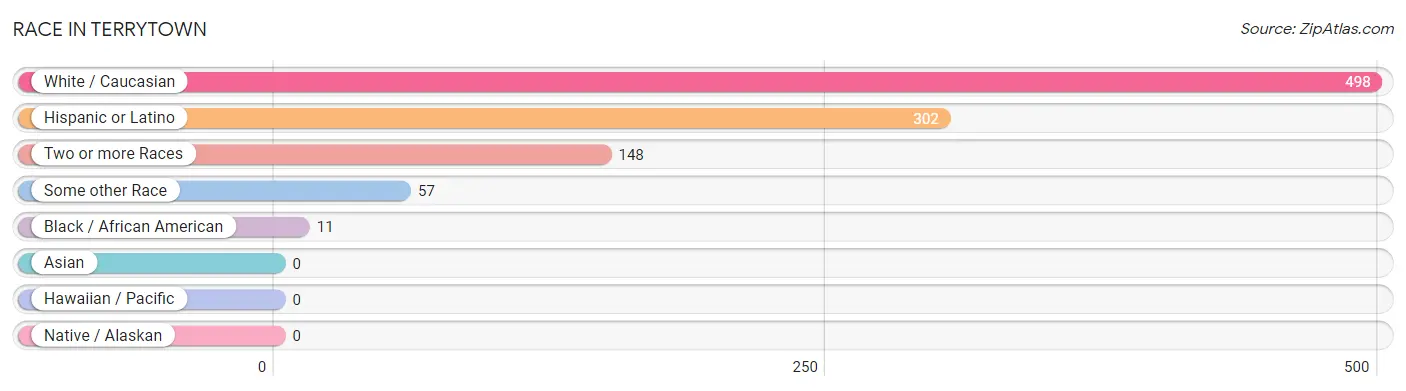
Race in Terrytown
The most populous races in Terrytown are White / Caucasian (498 | 69.8%), Hispanic or Latino (302 | 42.3%), and Two or more Races (148 | 20.7%).
| Race | # Population | % Population |
| Asian | 0 | 0.0% |
| Black / African American | 11 | 1.5% |
| Hawaiian / Pacific | 0 | 0.0% |
| Hispanic or Latino | 302 | 42.3% |
| Native / Alaskan | 0 | 0.0% |
| White / Caucasian | 498 | 69.8% |
| Two or more Races | 148 | 20.7% |
| Some other Race | 57 | 8.0% |
| Total | 714 | 100.0% |
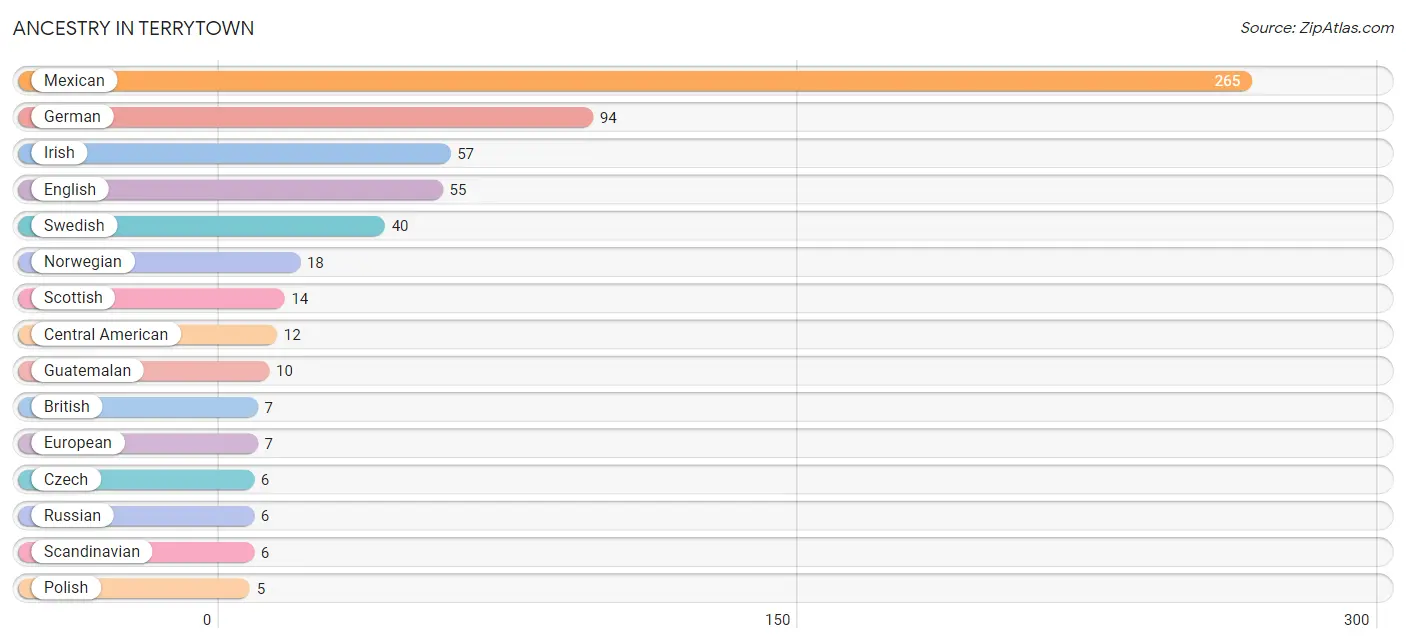
Ancestry in Terrytown
The most populous ancestries reported in Terrytown are Mexican (265 | 37.1%), German (94 | 13.2%), Irish (57 | 8.0%), English (55 | 7.7%), and Swedish (40 | 5.6%), together accounting for 71.6% of all Terrytown residents.
| Ancestry | # Population | % Population |
| American | 3 | 0.4% |
| Belgian | 2 | 0.3% |
| British | 7 | 1.0% |
| Central American | 12 | 1.7% |
| Czech | 6 | 0.8% |
| English | 55 | 7.7% |
| European | 7 | 1.0% |
| German | 94 | 13.2% |
| Guatemalan | 10 | 1.4% |
| Irish | 57 | 8.0% |
| Mexican | 265 | 37.1% |
| Norwegian | 18 | 2.5% |
| Panamanian | 2 | 0.3% |
| Polish | 5 | 0.7% |
| Russian | 6 | 0.8% |
| Scandinavian | 6 | 0.8% |
| Scotch-Irish | 2 | 0.3% |
| Scottish | 14 | 2.0% |
| Swedish | 40 | 5.6% |
| Ukrainian | 1 | 0.1% | View All 20 Rows |
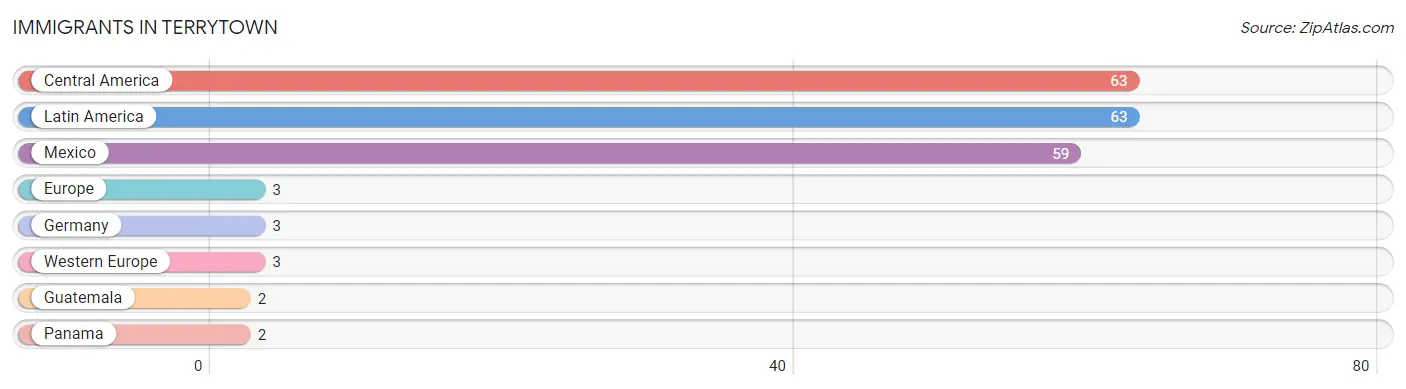
Immigrants in Terrytown
The most numerous immigrant groups reported in Terrytown came from Central America (63 | 8.8%), Latin America (63 | 8.8%), Mexico (59 | 8.3%), Europe (3 | 0.4%), and Germany (3 | 0.4%), together accounting for 26.7% of all Terrytown residents.
| Immigration Origin | # Population | % Population |
| Central America | 63 | 8.8% |
| Europe | 3 | 0.4% |
| Germany | 3 | 0.4% |
| Guatemala | 2 | 0.3% |
| Latin America | 63 | 8.8% |
| Mexico | 59 | 8.3% |
| Panama | 2 | 0.3% |
| Western Europe | 3 | 0.4% | View All 8 Rows |
Sex and Age in Terrytown
Sex and Age in Terrytown
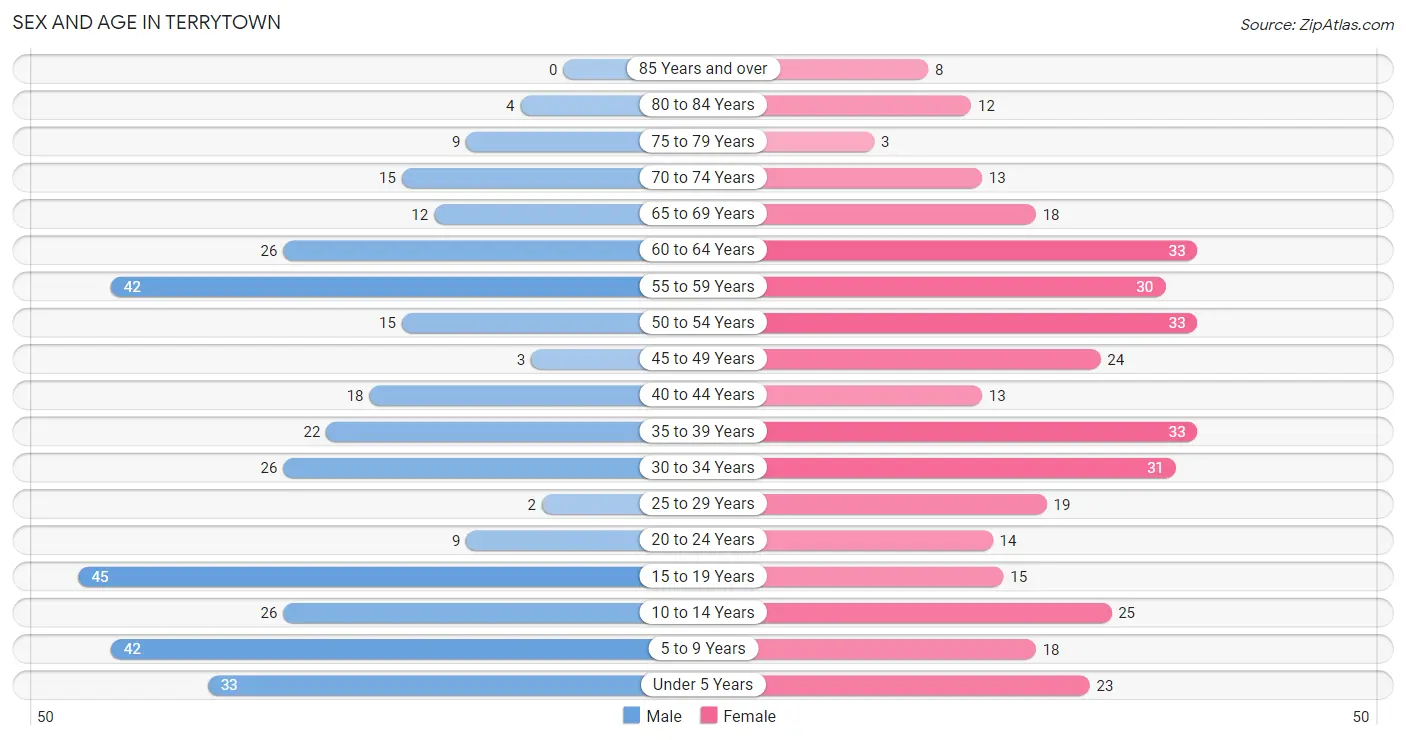
The most populous age groups in Terrytown are 15 to 19 Years (45 | 12.9%) for men and 35 to 39 Years (33 | 9.0%) for women.
| Age Bracket | Male | Female |
| Under 5 Years | 33 (9.5%) | 23 (6.3%) |
| 5 to 9 Years | 42 (12.0%) | 18 (4.9%) |
| 10 to 14 Years | 26 (7.4%) | 25 (6.9%) |
| 15 to 19 Years | 45 (12.9%) | 15 (4.1%) |
| 20 to 24 Years | 9 (2.6%) | 14 (3.8%) |
| 25 to 29 Years | 2 (0.6%) | 19 (5.2%) |
| 30 to 34 Years | 26 (7.4%) | 31 (8.5%) |
| 35 to 39 Years | 22 (6.3%) | 33 (9.0%) |
| 40 to 44 Years | 18 (5.2%) | 13 (3.6%) |
| 45 to 49 Years | 3 (0.9%) | 24 (6.6%) |
| 50 to 54 Years | 15 (4.3%) | 33 (9.0%) |
| 55 to 59 Years | 42 (12.0%) | 30 (8.2%) |
| 60 to 64 Years | 26 (7.4%) | 33 (9.0%) |
| 65 to 69 Years | 12 (3.4%) | 18 (4.9%) |
| 70 to 74 Years | 15 (4.3%) | 13 (3.6%) |
| 75 to 79 Years | 9 (2.6%) | 3 (0.8%) |
| 80 to 84 Years | 4 (1.1%) | 12 (3.3%) |
| 85 Years and over | 0 (0.0%) | 8 (2.2%) |
| Total | 349 (100.0%) | 365 (100.0%) |
Families and Households in Terrytown
Median Family Size in Terrytown
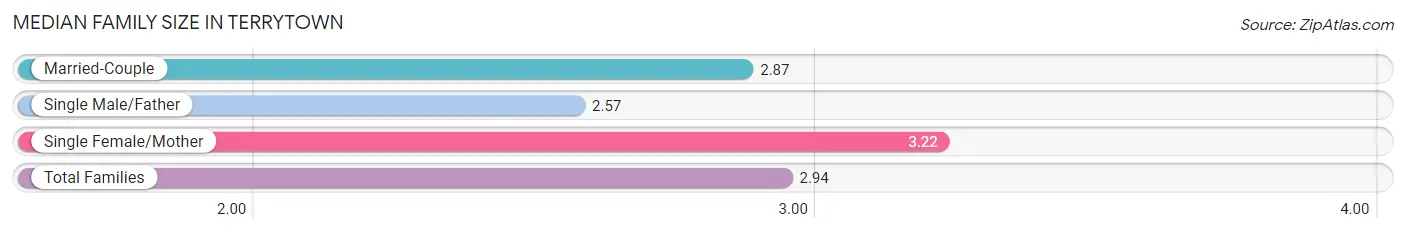
The median family size in Terrytown is 2.94 persons per family, with single female/mother families (45 | 24.9%) accounting for the largest median family size of 3.22 persons per family. On the other hand, single male/father families (7 | 3.9%) represent the smallest median family size with 2.57 persons per family.
| Family Type | # Families | Family Size |
| Married-Couple | 129 (71.3%) | 2.87 |
| Single Male/Father | 7 (3.9%) | 2.57 |
| Single Female/Mother | 45 (24.9%) | 3.22 |
| Total Families | 181 (100.0%) | 2.94 |
Median Household Size in Terrytown
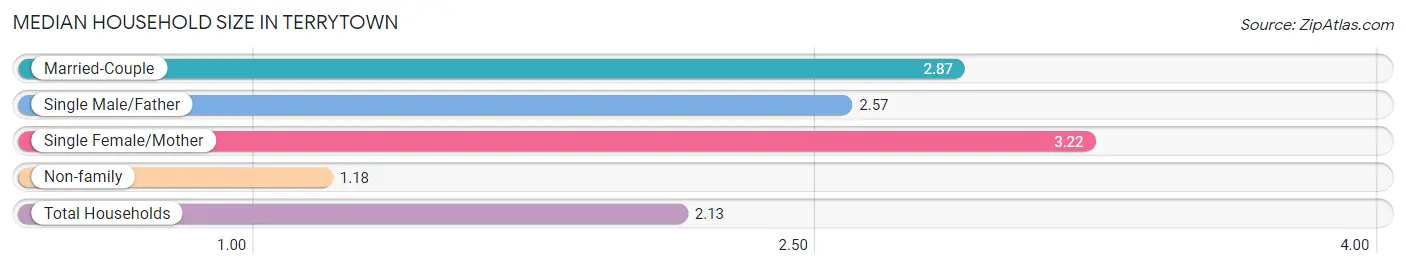
The median household size in Terrytown is 2.13 persons per household, with single female/mother households (45 | 13.4%) accounting for the largest median household size of 3.22 persons per household. non-family households (154 | 46.0%) represent the smallest median household size with 1.18 persons per household.
| Household Type | # Households | Household Size |
| Married-Couple | 129 (38.5%) | 2.87 |
| Single Male/Father | 7 (2.1%) | 2.57 |
| Single Female/Mother | 45 (13.4%) | 3.22 |
| Non-family | 154 (46.0%) | 1.18 |
| Total Households | 335 (100.0%) | 2.13 |
Household Size by Marriage Status in Terrytown
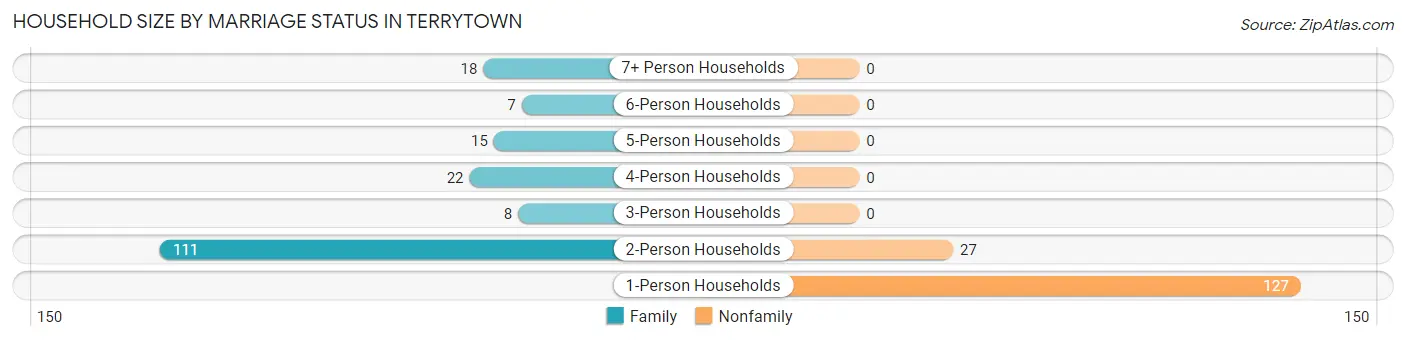
Out of a total of 335 households in Terrytown, 181 (54.0%) are family households, while 154 (46.0%) are nonfamily households. The most numerous type of family households are 2-person households, comprising 111, and the most common type of nonfamily households are 1-person households, comprising 127.
| Household Size | Family Households | Nonfamily Households |
| 1-Person Households | - | 127 (37.9%) |
| 2-Person Households | 111 (33.1%) | 27 (8.1%) |
| 3-Person Households | 8 (2.4%) | 0 (0.0%) |
| 4-Person Households | 22 (6.6%) | 0 (0.0%) |
| 5-Person Households | 15 (4.5%) | 0 (0.0%) |
| 6-Person Households | 7 (2.1%) | 0 (0.0%) |
| 7+ Person Households | 18 (5.4%) | 0 (0.0%) |
| Total | 181 (54.0%) | 154 (46.0%) |
Female Fertility in Terrytown
Fertility by Age in Terrytown
Average fertility rate in Terrytown is 29.0 births per 1,000 women. Women in the age bracket of 15 to 19 years have the highest fertility rate with 133.0 births per 1,000 women. Women in the age bracket of 35 to 50 years acount for 60.0% of all women with births.
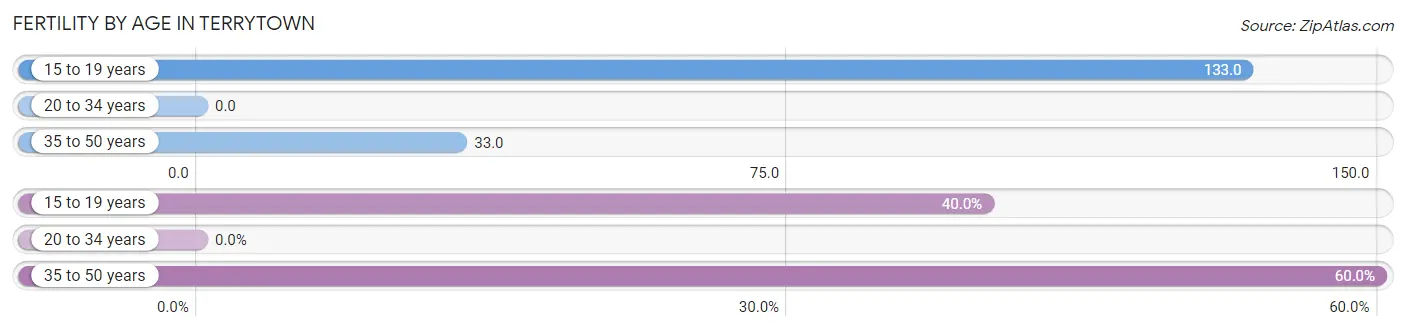
| Age Bracket | Women with Births | Births / 1,000 Women |
| 15 to 19 years | 2 (40.0%) | 133.0 |
| 20 to 34 years | 0 (0.0%) | 0.0 |
| 35 to 50 years | 3 (60.0%) | 33.0 |
| Total | 5 (100.0%) | 29.0 |
Fertility by Age by Marriage Status in Terrytown
60.0% of women with births (5) in Terrytown are married. The highest percentage of unmarried women with births falls into 15 to 19 years age bracket with 100.0% of them unmarried at the time of birth, while the lowest percentage of unmarried women with births belong to 35 to 50 years age bracket with 0.0% of them unmarried.
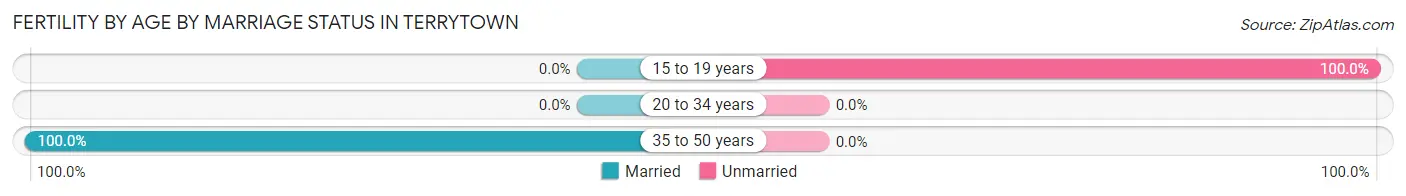
| Age Bracket | Married | Unmarried |
| 15 to 19 years | 0 (0.0%) | 2 (100.0%) |
| 20 to 34 years | 0 (0.0%) | 0 (0.0%) |
| 35 to 50 years | 3 (100.0%) | 0 (0.0%) |
| Total | 3 (60.0%) | 2 (40.0%) |
Fertility by Education in Terrytown
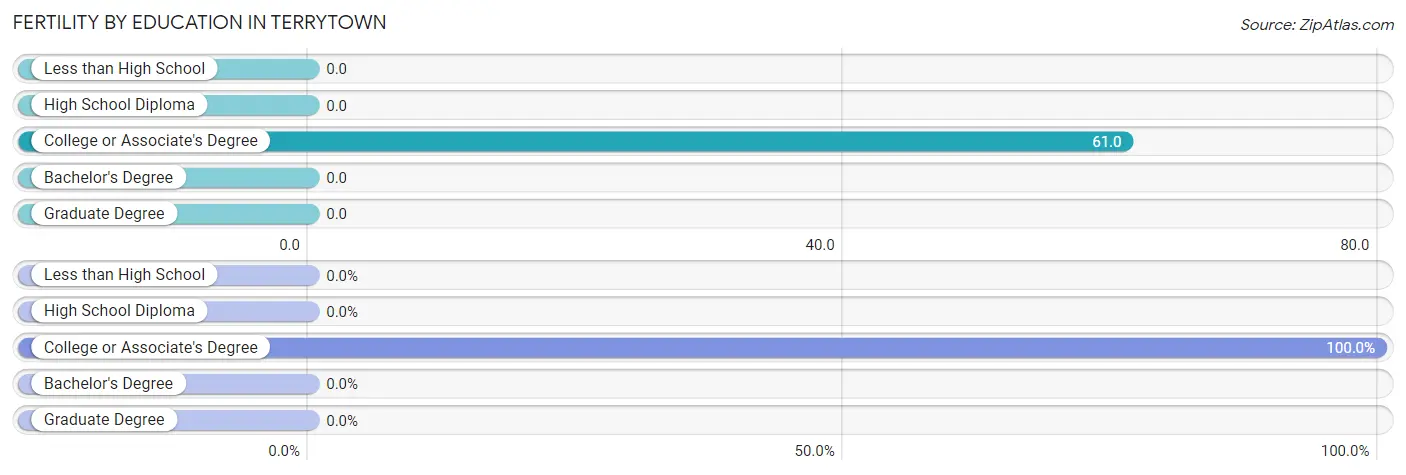
| Educational Attainment | Women with Births | Births / 1,000 Women |
| Less than High School | 0 (0.0%) | 0.0 |
| High School Diploma | 0 (0.0%) | 0.0 |
| College or Associate's Degree | 5 (100.0%) | 61.0 |
| Bachelor's Degree | 0 (0.0%) | 0.0 |
| Graduate Degree | 0 (0.0%) | 0.0 |
| Total | 5 (100.0%) | 29.0 |
Fertility by Education by Marriage Status in Terrytown
40.0% of women with births in Terrytown are unmarried. Women with the educational attainment of college or associate's degree are most likely to be married with 60.0% of them married at childbirth, while women with the educational attainment of college or associate's degree are least likely to be married with 40.0% of them unmarried at childbirth.
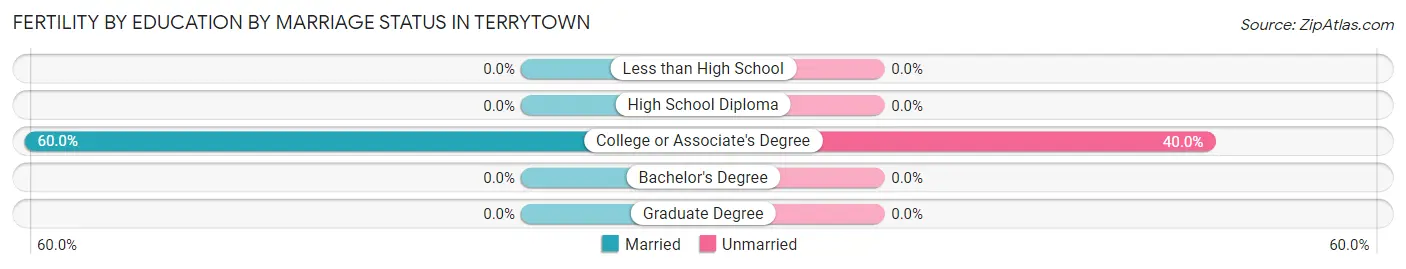
| Educational Attainment | Married | Unmarried |
| Less than High School | 0 (0.0%) | 0 (0.0%) |
| High School Diploma | 0 (0.0%) | 0 (0.0%) |
| College or Associate's Degree | 3 (60.0%) | 2 (40.0%) |
| Bachelor's Degree | 0 (0.0%) | 0 (0.0%) |
| Graduate Degree | 0 (0.0%) | 0 (0.0%) |
| Total | 3 (60.0%) | 2 (40.0%) |
Income in Terrytown
Income Overview in Terrytown
Per Capita Income in Terrytown is $20,735, while median incomes of families and households are $48,125 and $37,250 respectively.
| Characteristic | Number | Measure |
| Per Capita Income | 714 | $20,735 |
| Median Family Income | 181 | $48,125 |
| Mean Family Income | 181 | $56,421 |
| Median Household Income | 335 | $37,250 |
| Mean Household Income | 335 | $45,894 |
| Income Deficit | 181 | $0 |
| Wage / Income Gap (%) | 714 | 46.44% |
| Wage / Income Gap ($) | 714 | 53.56¢ per $1 |
| Gini / Inequality Index | 714 | 0.42 |
Earnings by Sex in Terrytown
Average Earnings in Terrytown are $35,703, $40,536 for men and $21,713 for women, a difference of 46.4%.
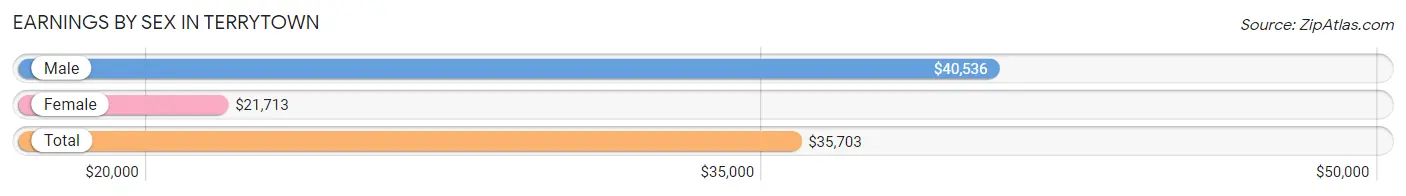
| Sex | Number | Average Earnings |
| Male | 145 (43.1%) | $40,536 |
| Female | 191 (56.9%) | $21,713 |
| Total | 336 (100.0%) | $35,703 |
Earnings by Sex by Income Bracket in Terrytown
The most common earnings brackets in Terrytown are $35,000 to $39,999 for men (29 | 20.0%) and $20,000 to $22,499 for women (27 | 14.1%).
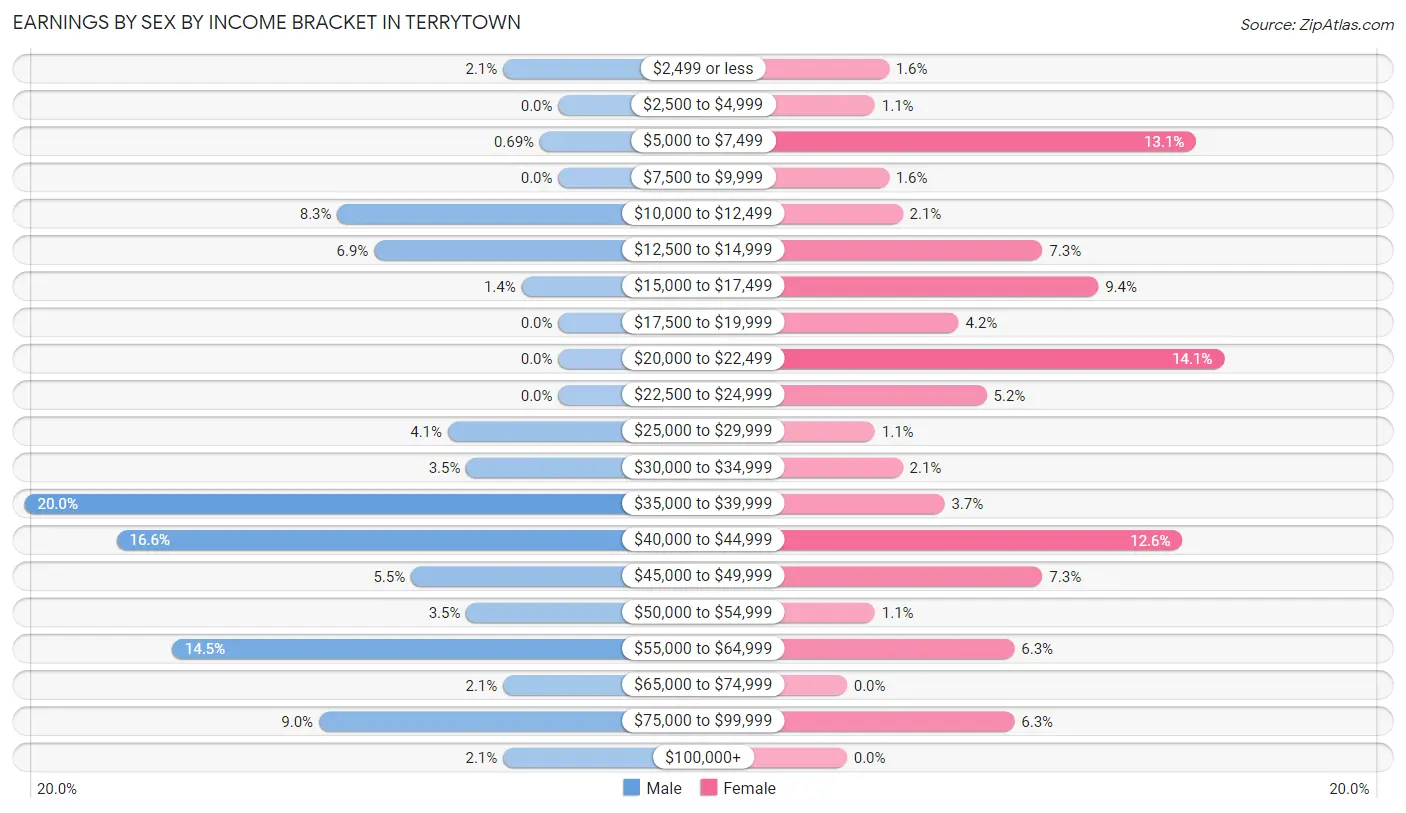
| Income | Male | Female |
| $2,499 or less | 3 (2.1%) | 3 (1.6%) |
| $2,500 to $4,999 | 0 (0.0%) | 2 (1.1%) |
| $5,000 to $7,499 | 1 (0.7%) | 25 (13.1%) |
| $7,500 to $9,999 | 0 (0.0%) | 3 (1.6%) |
| $10,000 to $12,499 | 12 (8.3%) | 4 (2.1%) |
| $12,500 to $14,999 | 10 (6.9%) | 14 (7.3%) |
| $15,000 to $17,499 | 2 (1.4%) | 18 (9.4%) |
| $17,500 to $19,999 | 0 (0.0%) | 8 (4.2%) |
| $20,000 to $22,499 | 0 (0.0%) | 27 (14.1%) |
| $22,500 to $24,999 | 0 (0.0%) | 10 (5.2%) |
| $25,000 to $29,999 | 6 (4.1%) | 2 (1.1%) |
| $30,000 to $34,999 | 5 (3.5%) | 4 (2.1%) |
| $35,000 to $39,999 | 29 (20.0%) | 7 (3.7%) |
| $40,000 to $44,999 | 24 (16.6%) | 24 (12.6%) |
| $45,000 to $49,999 | 8 (5.5%) | 14 (7.3%) |
| $50,000 to $54,999 | 5 (3.5%) | 2 (1.1%) |
| $55,000 to $64,999 | 21 (14.5%) | 12 (6.3%) |
| $65,000 to $74,999 | 3 (2.1%) | 0 (0.0%) |
| $75,000 to $99,999 | 13 (9.0%) | 12 (6.3%) |
| $100,000+ | 3 (2.1%) | 0 (0.0%) |
| Total | 145 (100.0%) | 191 (100.0%) |
Earnings by Sex by Educational Attainment in Terrytown
Average earnings in Terrytown are $41,131 for men and $22,308 for women, a difference of 45.8%. Men with an educational attainment of college or associate's degree enjoy the highest average annual earnings of $58,472, while those with high school diploma education earn the least with $40,329. Women with an educational attainment of graduate degree earn the most with the average annual earnings of $83,000, while those with less than high school education have the smallest earnings of $14,018.
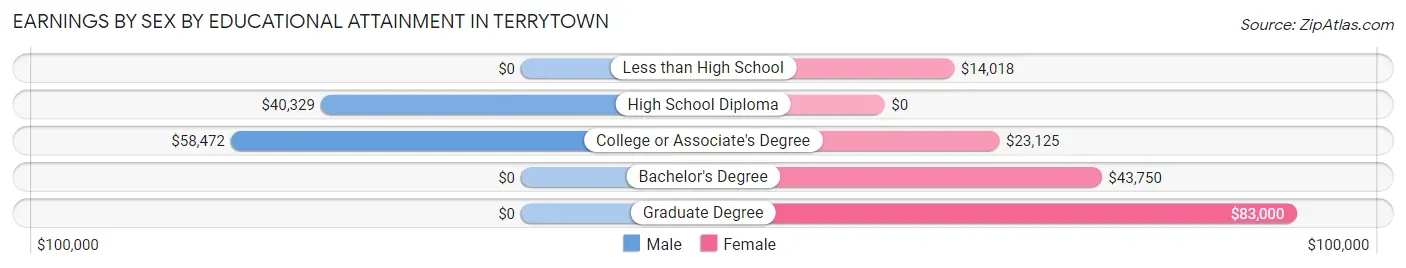
| Educational Attainment | Male Income | Female Income |
| Less than High School | - | - |
| High School Diploma | $40,329 | $0 |
| College or Associate's Degree | $58,472 | $23,125 |
| Bachelor's Degree | - | - |
| Graduate Degree | - | - |
| Total | $41,131 | $22,308 |
Family Income in Terrytown
Family Income Brackets in Terrytown
According to the Terrytown family income data, there are 34 families falling into the $50,000 to $74,999 income range, which is the most common income bracket and makes up 18.8% of all families.
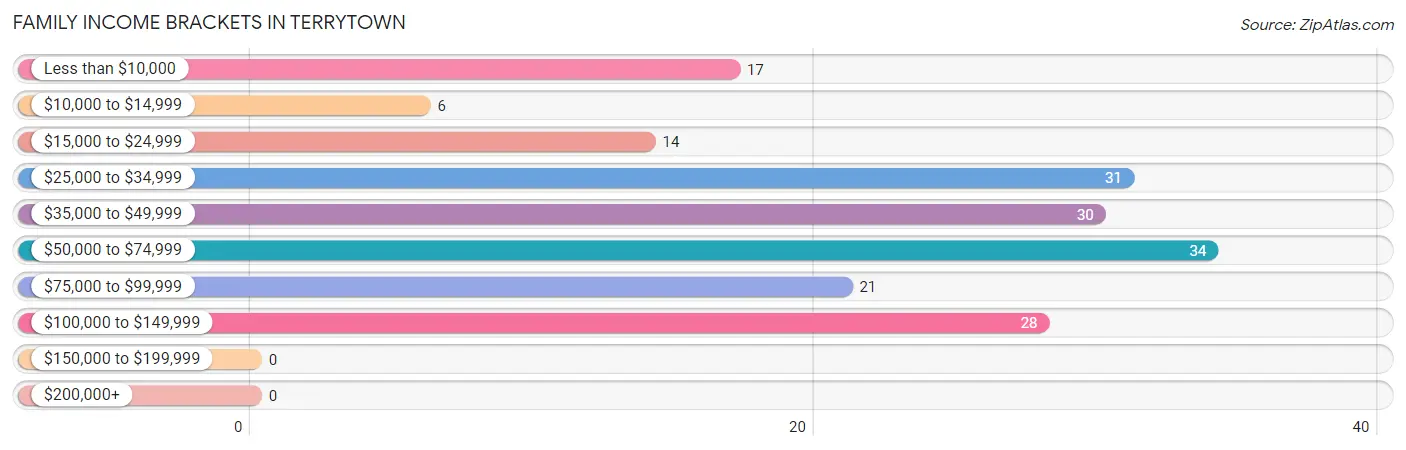
| Income Bracket | # Families | % Families |
| Less than $10,000 | 17 | 9.4% |
| $10,000 to $14,999 | 6 | 3.3% |
| $15,000 to $24,999 | 14 | 7.7% |
| $25,000 to $34,999 | 31 | 17.1% |
| $35,000 to $49,999 | 30 | 16.6% |
| $50,000 to $74,999 | 34 | 18.8% |
| $75,000 to $99,999 | 21 | 11.6% |
| $100,000 to $149,999 | 28 | 15.5% |
| $150,000 to $199,999 | 0 | 0.0% |
| $200,000+ | 0 | 0.0% |
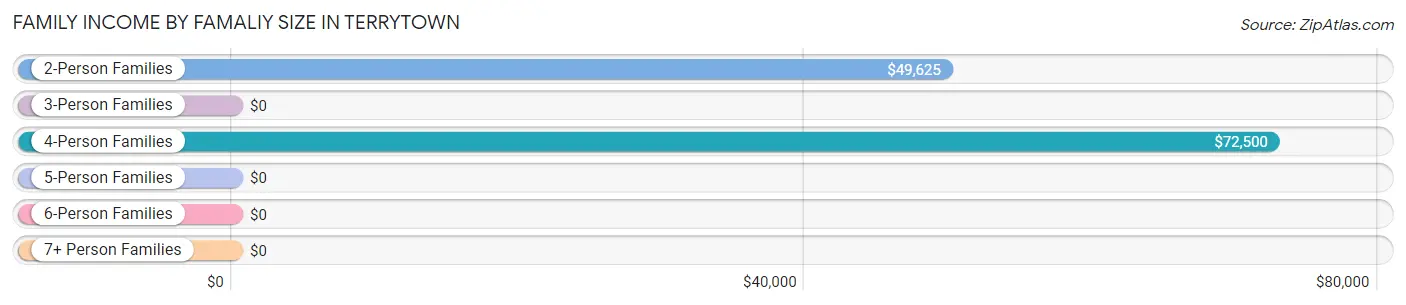
Family Income by Famaliy Size in Terrytown
4-person families (22 | 12.1%) account for the highest median family income in Terrytown with $72,500 per family, while 2-person families (111 | 61.3%) have the highest median income of $24,812 per family member.
| Income Bracket | # Families | Median Income |
| 2-Person Families | 111 (61.3%) | $49,625 |
| 3-Person Families | 8 (4.4%) | $0 |
| 4-Person Families | 22 (12.1%) | $72,500 |
| 5-Person Families | 15 (8.3%) | $0 |
| 6-Person Families | 7 (3.9%) | $0 |
| 7+ Person Families | 18 (9.9%) | $0 |
| Total | 181 (100.0%) | $48,125 |
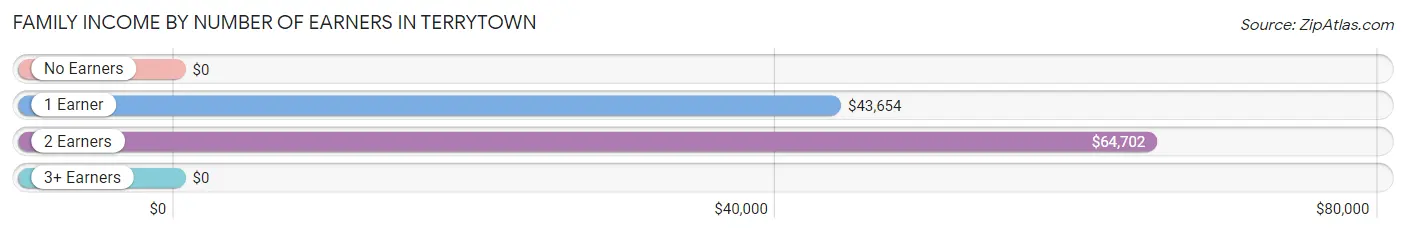
Family Income by Number of Earners in Terrytown
| Number of Earners | # Families | Median Income |
| No Earners | 27 (14.9%) | $0 |
| 1 Earner | 84 (46.4%) | $43,654 |
| 2 Earners | 67 (37.0%) | $64,702 |
| 3+ Earners | 3 (1.7%) | $0 |
| Total | 181 (100.0%) | $48,125 |
Household Income in Terrytown
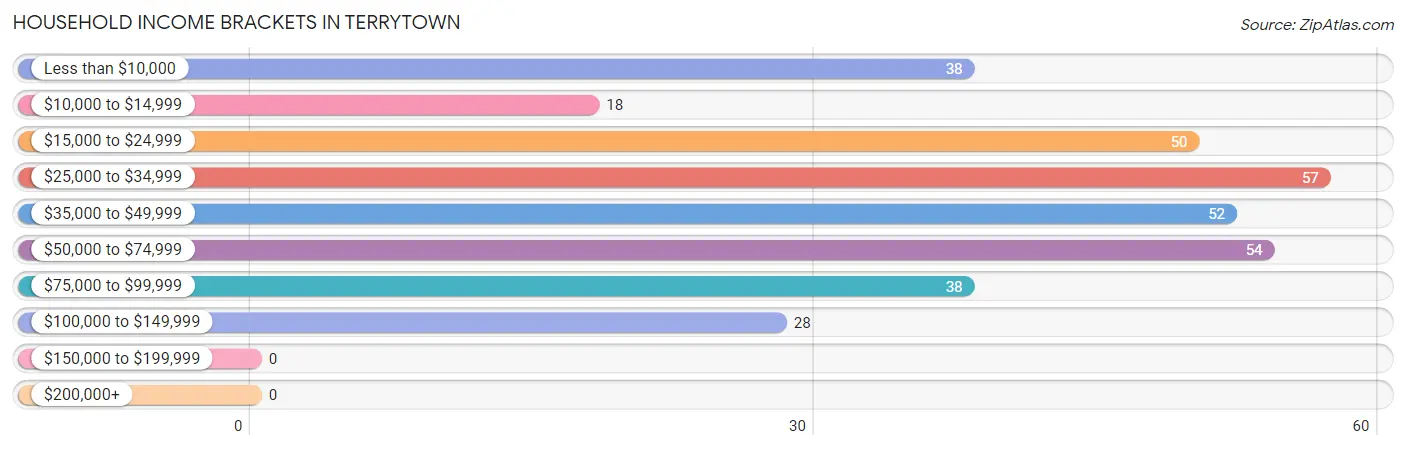
Household Income Brackets in Terrytown
With 57 households falling in the category, the $25,000 to $34,999 income range is the most frequent in Terrytown, accounting for 17.0% of all households.
| Income Bracket | # Households | % Households |
| Less than $10,000 | 38 | 11.3% |
| $10,000 to $14,999 | 18 | 5.4% |
| $15,000 to $24,999 | 50 | 14.9% |
| $25,000 to $34,999 | 57 | 17.0% |
| $35,000 to $49,999 | 52 | 15.5% |
| $50,000 to $74,999 | 54 | 16.1% |
| $75,000 to $99,999 | 38 | 11.3% |
| $100,000 to $149,999 | 28 | 8.4% |
| $150,000 to $199,999 | 0 | 0.0% |
| $200,000+ | 0 | 0.0% |
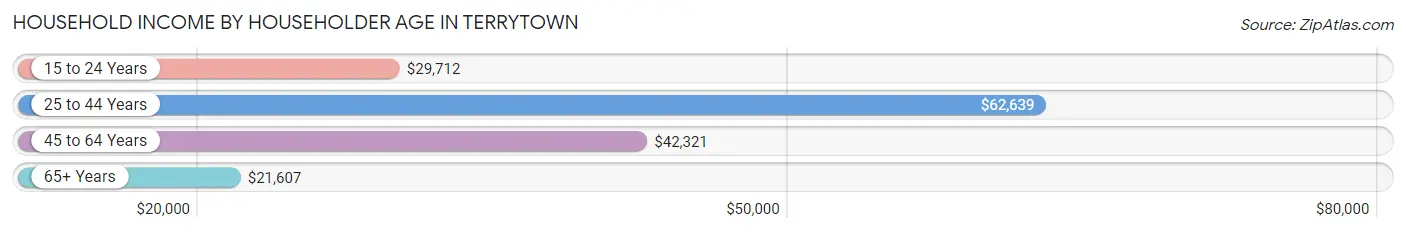
Household Income by Householder Age in Terrytown
The median household income in Terrytown is $37,250, with the highest median household income of $62,639 found in the 25 to 44 years age bracket for the primary householder. A total of 99 households (29.5%) fall into this category. Meanwhile, the 65+ years age bracket for the primary householder has the lowest median household income of $21,607, with 74 households (22.1%) in this group.
| Income Bracket | # Households | Median Income |
| 15 to 24 Years | 23 (6.9%) | $29,712 |
| 25 to 44 Years | 99 (29.5%) | $62,639 |
| 45 to 64 Years | 139 (41.5%) | $42,321 |
| 65+ Years | 74 (22.1%) | $21,607 |
| Total | 335 (100.0%) | $37,250 |
Poverty in Terrytown
Income Below Poverty by Sex and Age in Terrytown
With 31.5% poverty level for males and 29.9% for females among the residents of Terrytown, 16 and 17 year old males and under 5 year old females are the most vulnerable to poverty, with 7 males (100.0%) and 19 females (82.6%) in their respective age groups living below the poverty level.
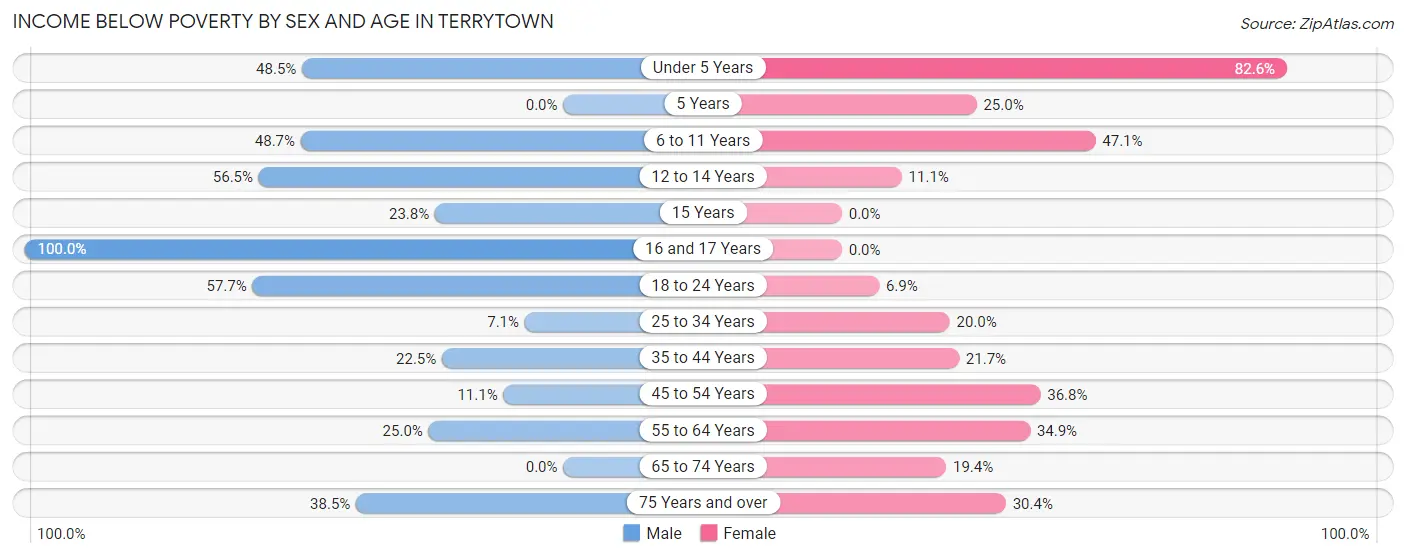
| Age Bracket | Male | Female |
| Under 5 Years | 16 (48.5%) | 19 (82.6%) |
| 5 Years | 0 (0.0%) | 2 (25.0%) |
| 6 to 11 Years | 19 (48.7%) | 8 (47.1%) |
| 12 to 14 Years | 13 (56.5%) | 2 (11.1%) |
| 15 Years | 5 (23.8%) | 0 (0.0%) |
| 16 and 17 Years | 7 (100.0%) | 0 (0.0%) |
| 18 to 24 Years | 15 (57.7%) | 2 (6.9%) |
| 25 to 34 Years | 2 (7.1%) | 10 (20.0%) |
| 35 to 44 Years | 9 (22.5%) | 10 (21.7%) |
| 45 to 54 Years | 2 (11.1%) | 21 (36.8%) |
| 55 to 64 Years | 17 (25.0%) | 22 (34.9%) |
| 65 to 74 Years | 0 (0.0%) | 6 (19.4%) |
| 75 Years and over | 5 (38.5%) | 7 (30.4%) |
| Total | 110 (31.5%) | 109 (29.9%) |
Income Above Poverty by Sex and Age in Terrytown
According to the poverty statistics in Terrytown, males aged 5 years and females aged 18 to 24 years are the age groups that are most secure financially, with 100.0% of males and 93.1% of females in these age groups living above the poverty line.
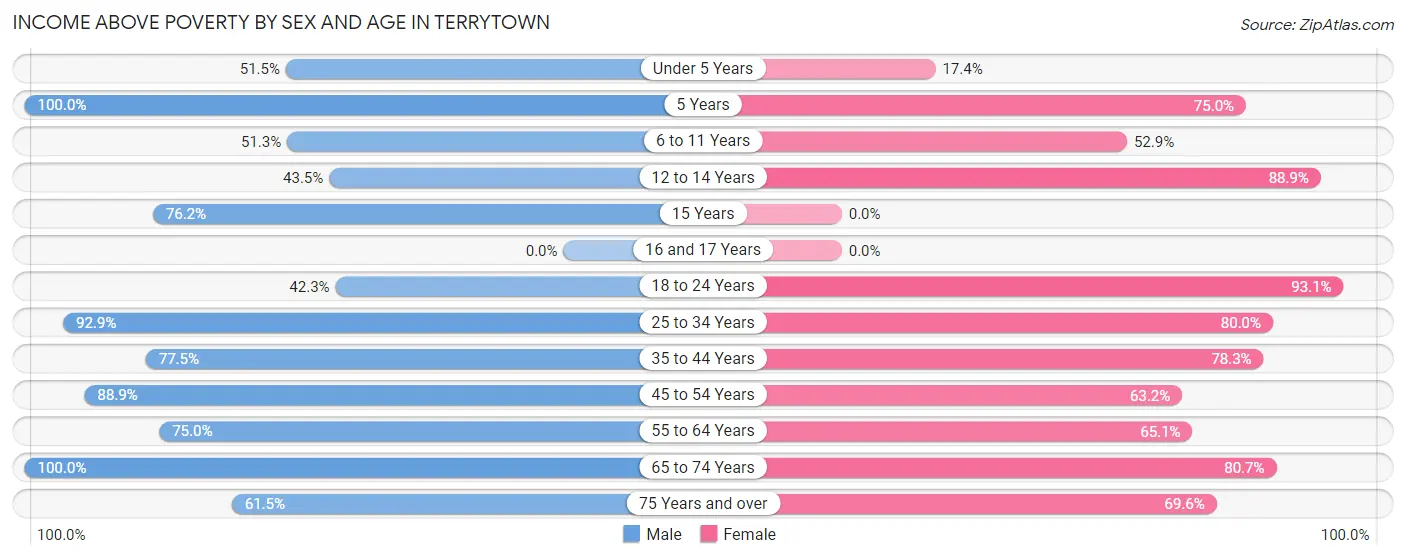
| Age Bracket | Male | Female |
| Under 5 Years | 17 (51.5%) | 4 (17.4%) |
| 5 Years | 6 (100.0%) | 6 (75.0%) |
| 6 to 11 Years | 20 (51.3%) | 9 (52.9%) |
| 12 to 14 Years | 10 (43.5%) | 16 (88.9%) |
| 15 Years | 16 (76.2%) | 0 (0.0%) |
| 16 and 17 Years | 0 (0.0%) | 0 (0.0%) |
| 18 to 24 Years | 11 (42.3%) | 27 (93.1%) |
| 25 to 34 Years | 26 (92.9%) | 40 (80.0%) |
| 35 to 44 Years | 31 (77.5%) | 36 (78.3%) |
| 45 to 54 Years | 16 (88.9%) | 36 (63.2%) |
| 55 to 64 Years | 51 (75.0%) | 41 (65.1%) |
| 65 to 74 Years | 27 (100.0%) | 25 (80.6%) |
| 75 Years and over | 8 (61.5%) | 16 (69.6%) |
| Total | 239 (68.5%) | 256 (70.1%) |
Income Below Poverty Among Married-Couple Families in Terrytown
The poverty statistics for married-couple families in Terrytown show that 10.1% or 13 of the total 129 families live below the poverty line. Families with 5 or more children have the highest poverty rate of 100.0%, comprising of 7 families. On the other hand, families with 1 or 2 children have the lowest poverty rate of 0.0%, which includes 0 families.
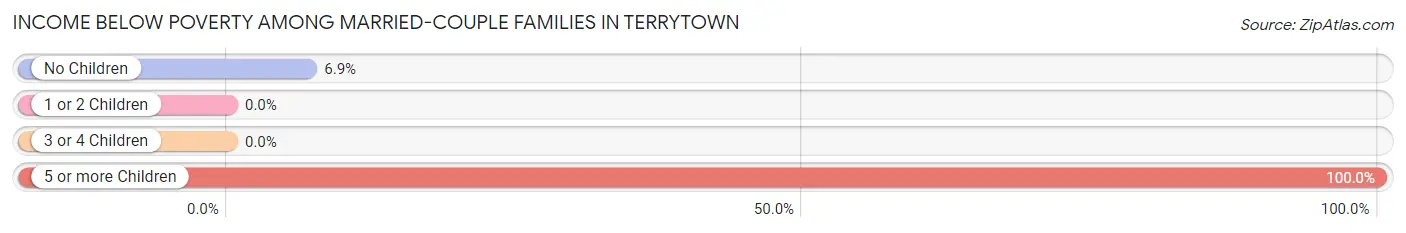
| Children | Above Poverty | Below Poverty |
| No Children | 81 (93.1%) | 6 (6.9%) |
| 1 or 2 Children | 17 (100.0%) | 0 (0.0%) |
| 3 or 4 Children | 18 (100.0%) | 0 (0.0%) |
| 5 or more Children | 0 (0.0%) | 7 (100.0%) |
| Total | 116 (89.9%) | 13 (10.1%) |
Income Below Poverty Among Single-Parent Households in Terrytown
According to the poverty data in Terrytown, 71.4% or 5 single-father households and 64.4% or 29 single-mother households are living below the poverty line. Among single-father households, those with 1 or 2 children have the highest poverty rate, with 3 households (100.0%) experiencing poverty. Likewise, among single-mother households, those with 3 or 4 children have the highest poverty rate, with 7 households (100.0%) falling below the poverty line.
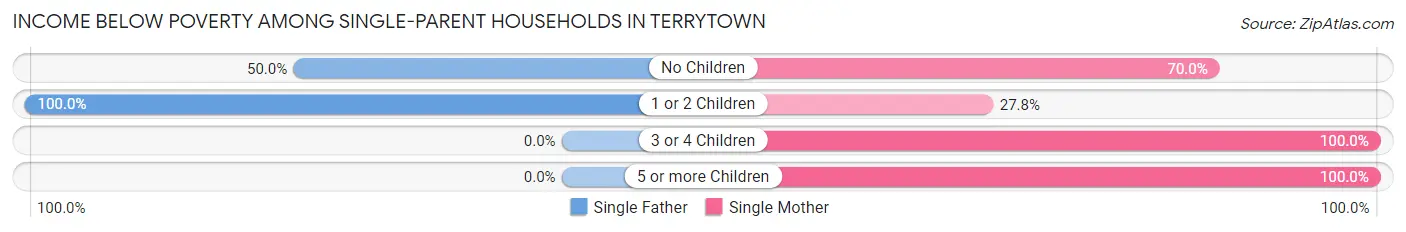
| Children | Single Father | Single Mother |
| No Children | 2 (50.0%) | 7 (70.0%) |
| 1 or 2 Children | 3 (100.0%) | 5 (27.8%) |
| 3 or 4 Children | 0 (0.0%) | 7 (100.0%) |
| 5 or more Children | 0 (0.0%) | 10 (100.0%) |
| Total | 5 (71.4%) | 29 (64.4%) |
Income Below Poverty Among Married-Couple vs Single-Parent Households in Terrytown
The poverty data for Terrytown shows that 13 of the married-couple family households (10.1%) and 34 of the single-parent households (65.4%) are living below the poverty level. Within the married-couple family households, those with 5 or more children have the highest poverty rate, with 7 households (100.0%) falling below the poverty line. Among the single-parent households, those with 3 or 4 children have the highest poverty rate, with 7 household (100.0%) living below poverty.
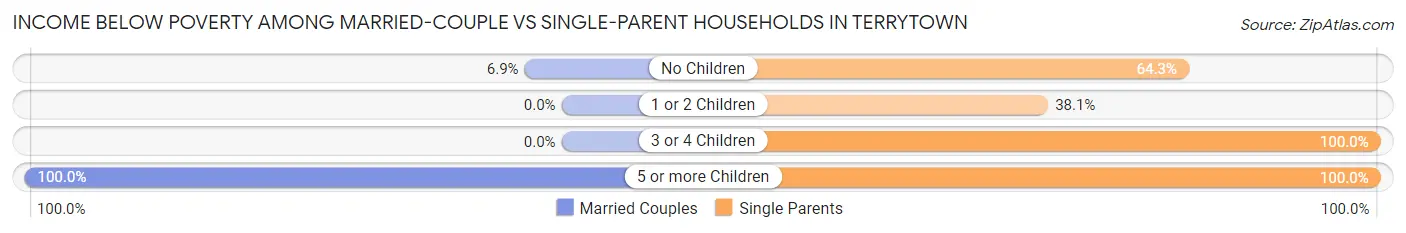
| Children | Married-Couple Families | Single-Parent Households |
| No Children | 6 (6.9%) | 9 (64.3%) |
| 1 or 2 Children | 0 (0.0%) | 8 (38.1%) |
| 3 or 4 Children | 0 (0.0%) | 7 (100.0%) |
| 5 or more Children | 7 (100.0%) | 10 (100.0%) |
| Total | 13 (10.1%) | 34 (65.4%) |
Employment Characteristics in Terrytown
Employment by Class of Employer in Terrytown
Among the 319 employed individuals in Terrytown, private company employees (221 | 69.3%), self-employed (not incorporated) (35 | 11.0%), and local government employees (26 | 8.2%) make up the most common classes of employment.
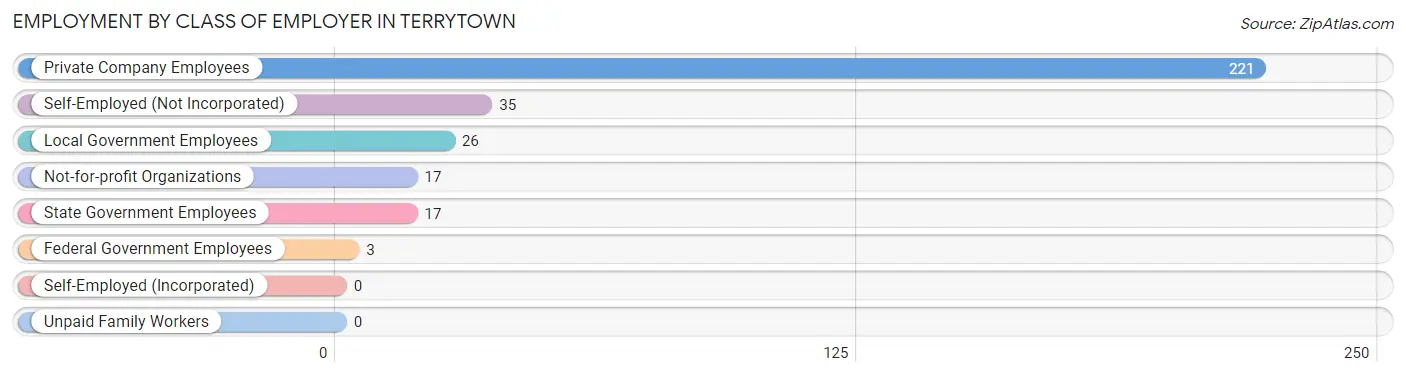
| Employer Class | # Employees | % Employees |
| Private Company Employees | 221 | 69.3% |
| Self-Employed (Incorporated) | 0 | 0.0% |
| Self-Employed (Not Incorporated) | 35 | 11.0% |
| Not-for-profit Organizations | 17 | 5.3% |
| Local Government Employees | 26 | 8.2% |
| State Government Employees | 17 | 5.3% |
| Federal Government Employees | 3 | 0.9% |
| Unpaid Family Workers | 0 | 0.0% |
| Total | 319 | 100.0% |
Employment Status by Age in Terrytown
According to the labor force statistics for Terrytown, out of the total population over 16 years of age (526), 66.5% or 350 individuals are in the labor force, with 4.0% or 14 of them unemployed. The age group with the highest labor force participation rate is 20 to 24 years, with 100.0% or 23 individuals in the labor force. Within the labor force, the 55 to 59 years age range has the highest percentage of unemployed individuals, with 20.0% or 11 of them being unemployed.
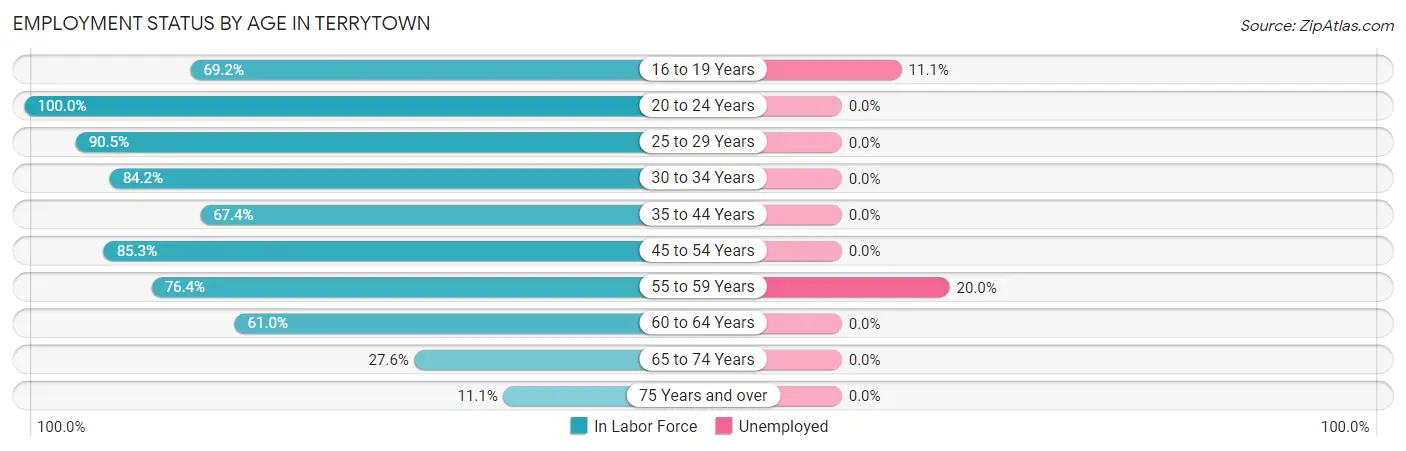
| Age Bracket | In Labor Force | Unemployed |
| 16 to 19 Years | 27 (69.2%) | 3 (11.1%) |
| 20 to 24 Years | 23 (100.0%) | 0 (0.0%) |
| 25 to 29 Years | 19 (90.5%) | 0 (0.0%) |
| 30 to 34 Years | 48 (84.2%) | 0 (0.0%) |
| 35 to 44 Years | 58 (67.4%) | 0 (0.0%) |
| 45 to 54 Years | 64 (85.3%) | 0 (0.0%) |
| 55 to 59 Years | 55 (76.4%) | 11 (20.0%) |
| 60 to 64 Years | 36 (61.0%) | 0 (0.0%) |
| 65 to 74 Years | 16 (27.6%) | 0 (0.0%) |
| 75 Years and over | 4 (11.1%) | 0 (0.0%) |
| Total | 350 (66.5%) | 14 (4.0%) |
Employment Status by Educational Attainment in Terrytown
According to labor force statistics for Terrytown, 75.7% of individuals (280) out of the total population between 25 and 64 years of age (370) are in the labor force, with 3.9% or 11 of them being unemployed. The group with the highest labor force participation rate are those with the educational attainment of bachelor's degree or higher, with 89.3% or 50 individuals in the labor force. Within the labor force, individuals with high school diploma education have the highest percentage of unemployment, with 10.2% or 11 of them being unemployed.
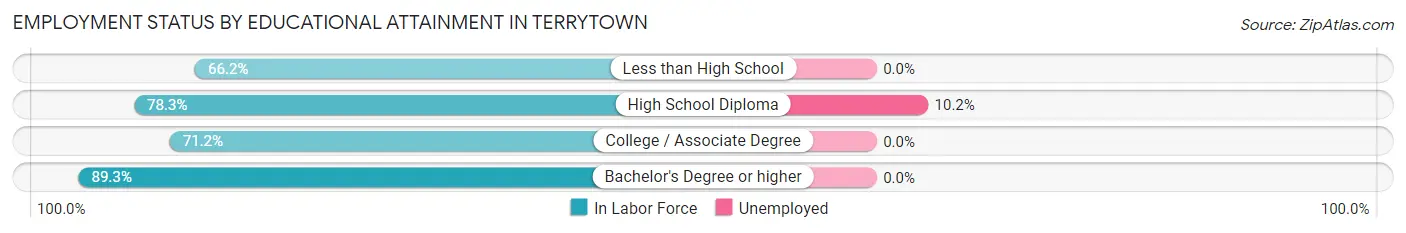
| Educational Attainment | In Labor Force | Unemployed |
| Less than High School | 43 (66.2%) | 0 (0.0%) |
| High School Diploma | 108 (78.3%) | 14 (10.2%) |
| College / Associate Degree | 79 (71.2%) | 0 (0.0%) |
| Bachelor's Degree or higher | 50 (89.3%) | 0 (0.0%) |
| Total | 280 (75.7%) | 14 (3.9%) |
Employment Occupations by Sex in Terrytown
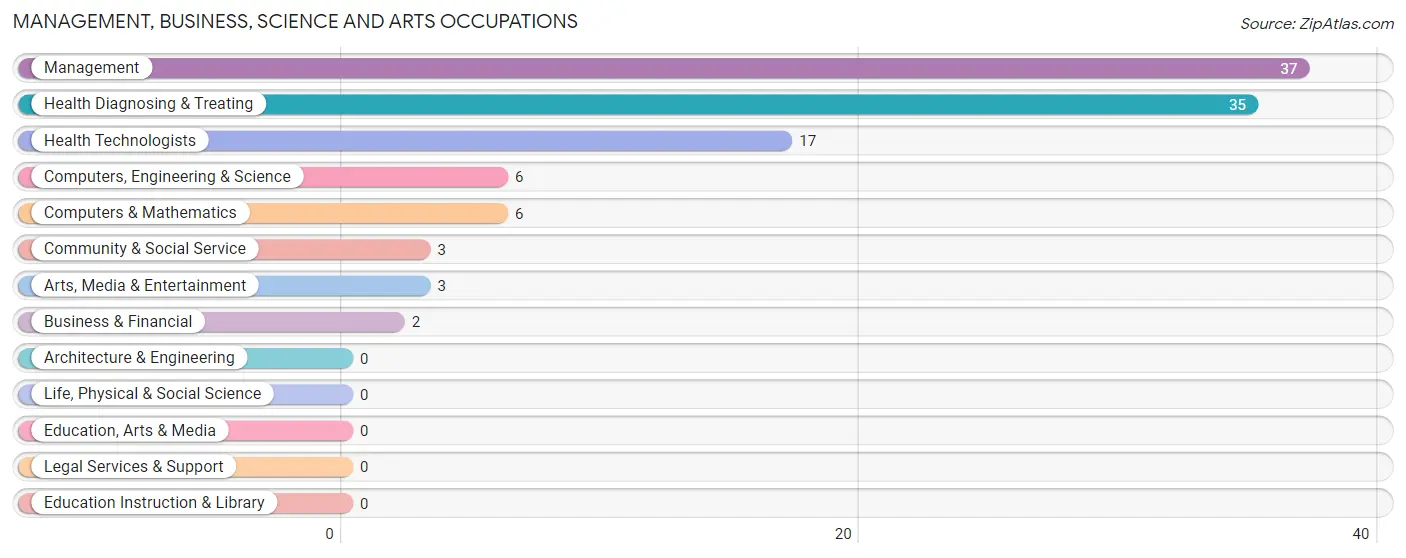
Management, Business, Science and Arts Occupations
The most common Management, Business, Science and Arts occupations in Terrytown are Management (37 | 11.0%), Health Diagnosing & Treating (35 | 10.4%), Health Technologists (17 | 5.1%), Computers, Engineering & Science (6 | 1.8%), and Computers & Mathematics (6 | 1.8%).
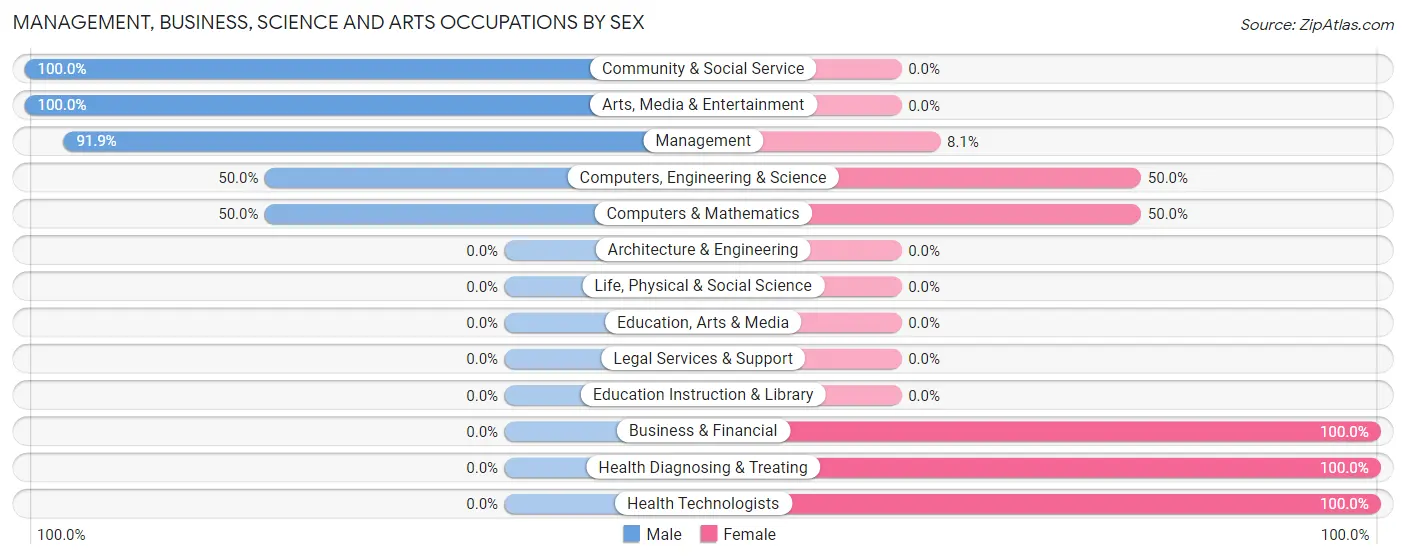
Management, Business, Science and Arts Occupations by Sex
Within the Management, Business, Science and Arts occupations in Terrytown, the most male-oriented occupations are Community & Social Service (100.0%), Arts, Media & Entertainment (100.0%), and Management (91.9%), while the most female-oriented occupations are Business & Financial (100.0%), Health Diagnosing & Treating (100.0%), and Health Technologists (100.0%).
| Occupation | Male | Female |
| Management | 34 (91.9%) | 3 (8.1%) |
| Business & Financial | 0 (0.0%) | 2 (100.0%) |
| Computers, Engineering & Science | 3 (50.0%) | 3 (50.0%) |
| Computers & Mathematics | 3 (50.0%) | 3 (50.0%) |
| Architecture & Engineering | 0 (0.0%) | 0 (0.0%) |
| Life, Physical & Social Science | 0 (0.0%) | 0 (0.0%) |
| Community & Social Service | 3 (100.0%) | 0 (0.0%) |
| Education, Arts & Media | 0 (0.0%) | 0 (0.0%) |
| Legal Services & Support | 0 (0.0%) | 0 (0.0%) |
| Education Instruction & Library | 0 (0.0%) | 0 (0.0%) |
| Arts, Media & Entertainment | 3 (100.0%) | 0 (0.0%) |
| Health Diagnosing & Treating | 0 (0.0%) | 35 (100.0%) |
| Health Technologists | 0 (0.0%) | 17 (100.0%) |
| Total (Category) | 40 (48.2%) | 43 (51.8%) |
| Total (Overall) | 145 (43.1%) | 191 (56.9%) |
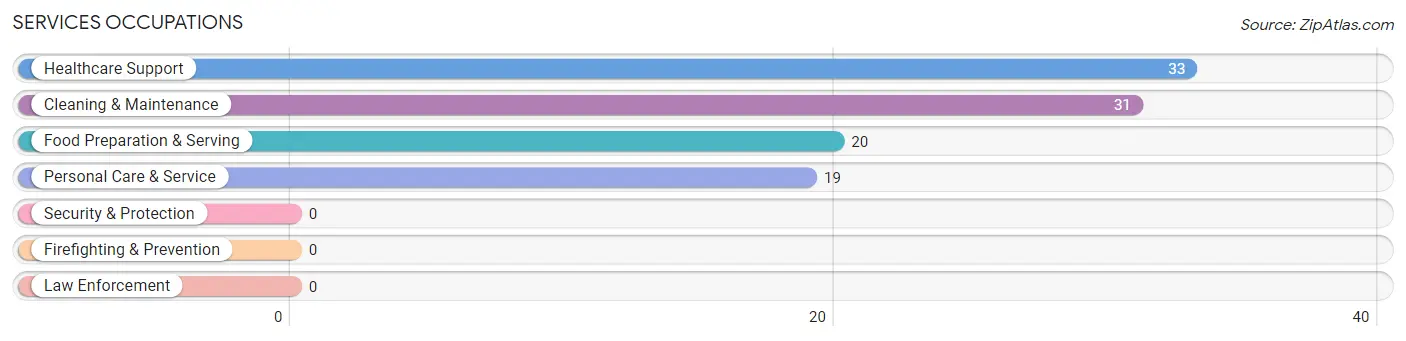
Services Occupations
The most common Services occupations in Terrytown are Healthcare Support (33 | 9.8%), Cleaning & Maintenance (31 | 9.2%), Food Preparation & Serving (20 | 5.9%), and Personal Care & Service (19 | 5.7%).
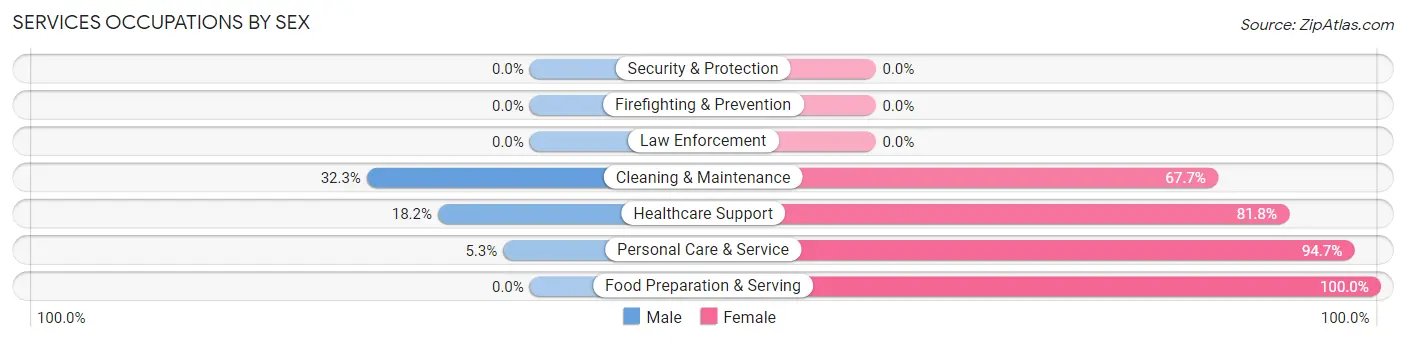
Services Occupations by Sex
Within the Services occupations in Terrytown, the most male-oriented occupations are Cleaning & Maintenance (32.3%), Healthcare Support (18.2%), and Personal Care & Service (5.3%), while the most female-oriented occupations are Food Preparation & Serving (100.0%), Personal Care & Service (94.7%), and Healthcare Support (81.8%).
| Occupation | Male | Female |
| Healthcare Support | 6 (18.2%) | 27 (81.8%) |
| Security & Protection | 0 (0.0%) | 0 (0.0%) |
| Firefighting & Prevention | 0 (0.0%) | 0 (0.0%) |
| Law Enforcement | 0 (0.0%) | 0 (0.0%) |
| Food Preparation & Serving | 0 (0.0%) | 20 (100.0%) |
| Cleaning & Maintenance | 10 (32.3%) | 21 (67.7%) |
| Personal Care & Service | 1 (5.3%) | 18 (94.7%) |
| Total (Category) | 17 (16.5%) | 86 (83.5%) |
| Total (Overall) | 145 (43.1%) | 191 (56.9%) |
Sales and Office Occupations
The most common Sales and Office occupations in Terrytown are Office & Administration (50 | 14.9%), and Sales & Related (9 | 2.7%).
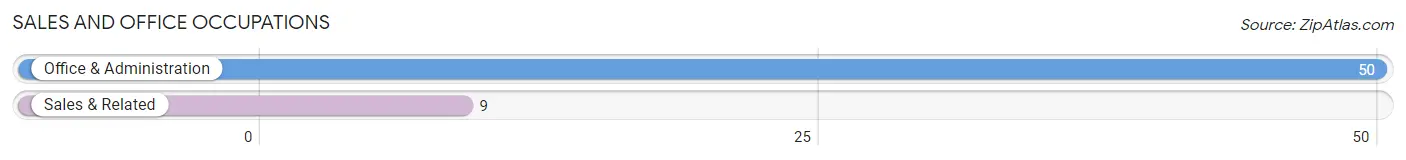
Sales and Office Occupations by Sex
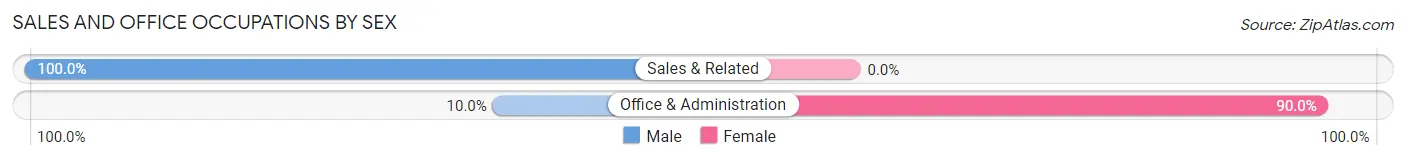
| Occupation | Male | Female |
| Sales & Related | 9 (100.0%) | 0 (0.0%) |
| Office & Administration | 5 (10.0%) | 45 (90.0%) |
| Total (Category) | 14 (23.7%) | 45 (76.3%) |
| Total (Overall) | 145 (43.1%) | 191 (56.9%) |
Natural Resources, Construction and Maintenance Occupations
The most common Natural Resources, Construction and Maintenance occupations in Terrytown are Construction & Extraction (18 | 5.4%), Installation, Maintenance & Repair (16 | 4.8%), and Farming, Fishing & Forestry (3 | 0.9%).
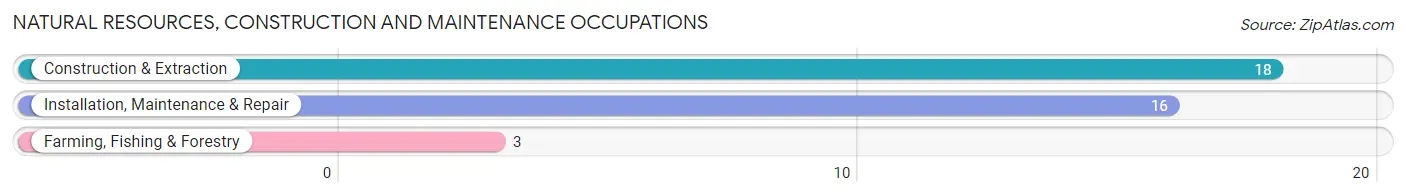
Natural Resources, Construction and Maintenance Occupations by Sex
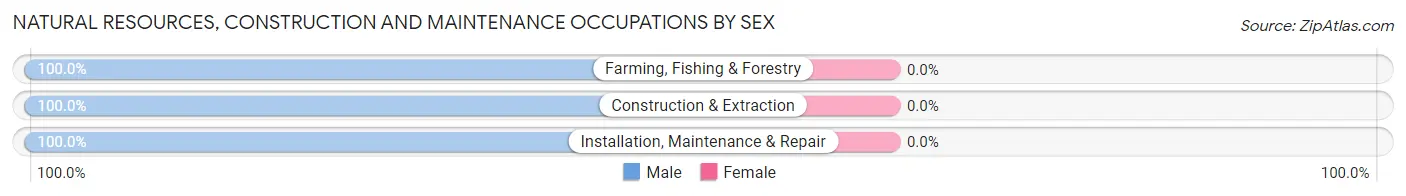
| Occupation | Male | Female |
| Farming, Fishing & Forestry | 3 (100.0%) | 0 (0.0%) |
| Construction & Extraction | 18 (100.0%) | 0 (0.0%) |
| Installation, Maintenance & Repair | 16 (100.0%) | 0 (0.0%) |
| Total (Category) | 37 (100.0%) | 0 (0.0%) |
| Total (Overall) | 145 (43.1%) | 191 (56.9%) |
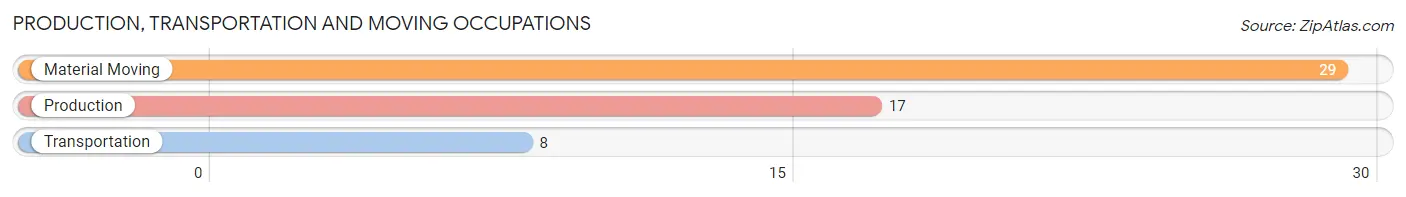
Production, Transportation and Moving Occupations
The most common Production, Transportation and Moving occupations in Terrytown are Material Moving (29 | 8.6%), Production (17 | 5.1%), and Transportation (8 | 2.4%).
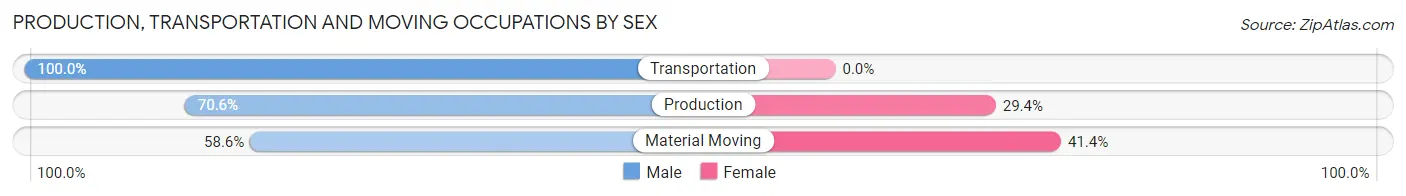
Production, Transportation and Moving Occupations by Sex
| Occupation | Male | Female |
| Production | 12 (70.6%) | 5 (29.4%) |
| Transportation | 8 (100.0%) | 0 (0.0%) |
| Material Moving | 17 (58.6%) | 12 (41.4%) |
| Total (Category) | 37 (68.5%) | 17 (31.5%) |
| Total (Overall) | 145 (43.1%) | 191 (56.9%) |
Employment Industries by Sex in Terrytown
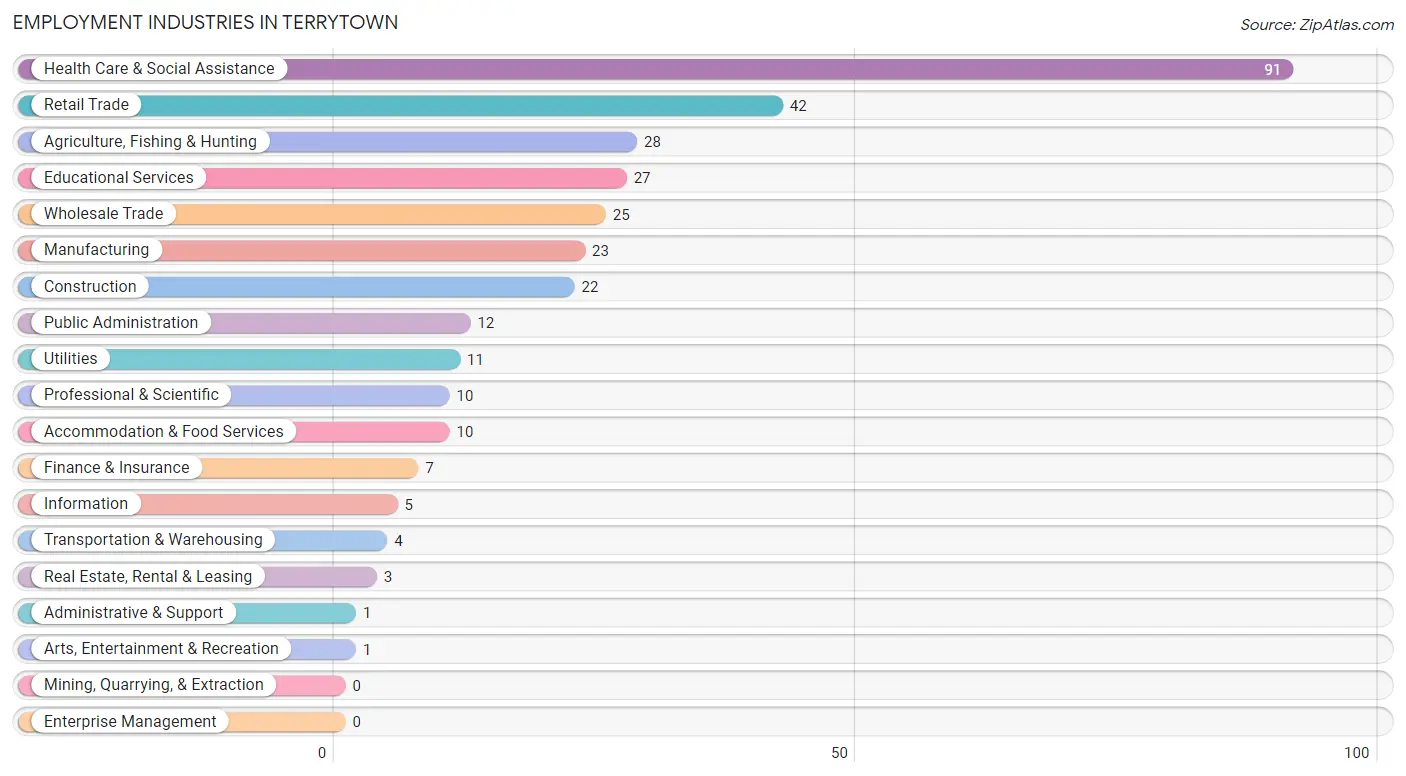
Employment Industries in Terrytown
The major employment industries in Terrytown include Health Care & Social Assistance (91 | 27.1%), Retail Trade (42 | 12.5%), Agriculture, Fishing & Hunting (28 | 8.3%), Educational Services (27 | 8.0%), and Wholesale Trade (25 | 7.4%).
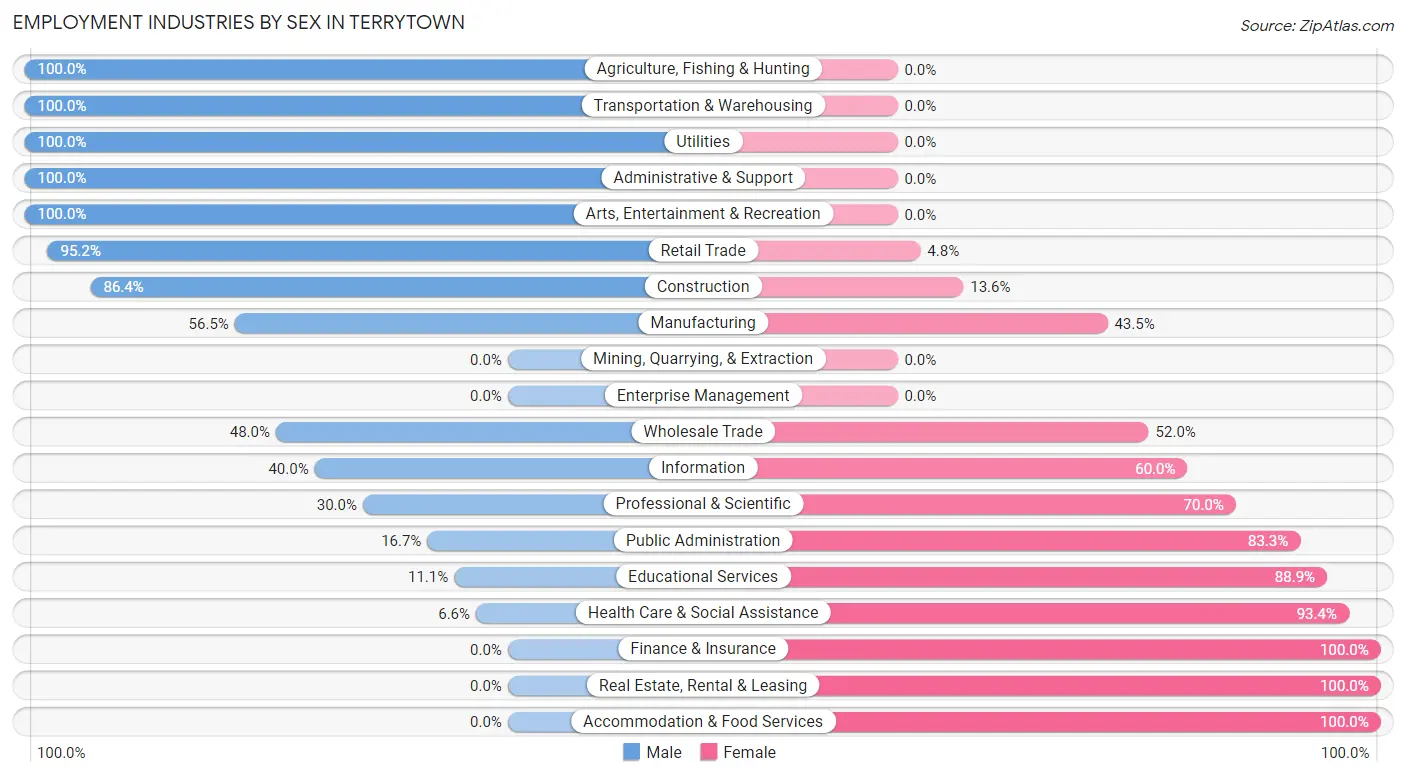
Employment Industries by Sex in Terrytown
The Terrytown industries that see more men than women are Agriculture, Fishing & Hunting (100.0%), Transportation & Warehousing (100.0%), and Utilities (100.0%), whereas the industries that tend to have a higher number of women are Finance & Insurance (100.0%), Real Estate, Rental & Leasing (100.0%), and Accommodation & Food Services (100.0%).
| Industry | Male | Female |
| Agriculture, Fishing & Hunting | 28 (100.0%) | 0 (0.0%) |
| Mining, Quarrying, & Extraction | 0 (0.0%) | 0 (0.0%) |
| Construction | 19 (86.4%) | 3 (13.6%) |
| Manufacturing | 13 (56.5%) | 10 (43.5%) |
| Wholesale Trade | 12 (48.0%) | 13 (52.0%) |
| Retail Trade | 40 (95.2%) | 2 (4.8%) |
| Transportation & Warehousing | 4 (100.0%) | 0 (0.0%) |
| Utilities | 11 (100.0%) | 0 (0.0%) |
| Information | 2 (40.0%) | 3 (60.0%) |
| Finance & Insurance | 0 (0.0%) | 7 (100.0%) |
| Real Estate, Rental & Leasing | 0 (0.0%) | 3 (100.0%) |
| Professional & Scientific | 3 (30.0%) | 7 (70.0%) |
| Enterprise Management | 0 (0.0%) | 0 (0.0%) |
| Administrative & Support | 1 (100.0%) | 0 (0.0%) |
| Educational Services | 3 (11.1%) | 24 (88.9%) |
| Health Care & Social Assistance | 6 (6.6%) | 85 (93.4%) |
| Arts, Entertainment & Recreation | 1 (100.0%) | 0 (0.0%) |
| Accommodation & Food Services | 0 (0.0%) | 10 (100.0%) |
| Public Administration | 2 (16.7%) | 10 (83.3%) |
| Total | 145 (43.1%) | 191 (56.9%) |
Education in Terrytown
School Enrollment in Terrytown
The most common levels of schooling among the 176 students in Terrytown are elementary school (45 | 25.6%), middle school (44 | 25.0%), and high school (37 | 21.0%).
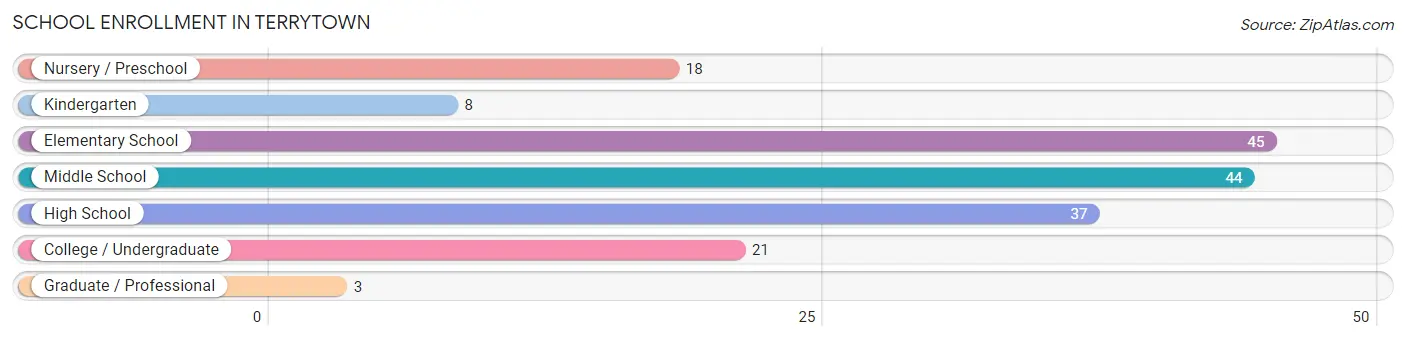
| School Level | # Students | % Students |
| Nursery / Preschool | 18 | 10.2% |
| Kindergarten | 8 | 4.5% |
| Elementary School | 45 | 25.6% |
| Middle School | 44 | 25.0% |
| High School | 37 | 21.0% |
| College / Undergraduate | 21 | 11.9% |
| Graduate / Professional | 3 | 1.7% |
| Total | 176 | 100.0% |
School Enrollment by Age by Funding Source in Terrytown
Out of a total of 176 students who are enrolled in schools in Terrytown, 26 (14.8%) attend a private institution, while the remaining 150 (85.2%) are enrolled in public schools. The age group of 35 years and over has the highest likelihood of being enrolled in private schools, with 3 (75.0% in the age bracket) enrolled. Conversely, the age group of 15 to 17 year olds has the lowest likelihood of being enrolled in a private school, with 28 (100.0% in the age bracket) attending a public institution.
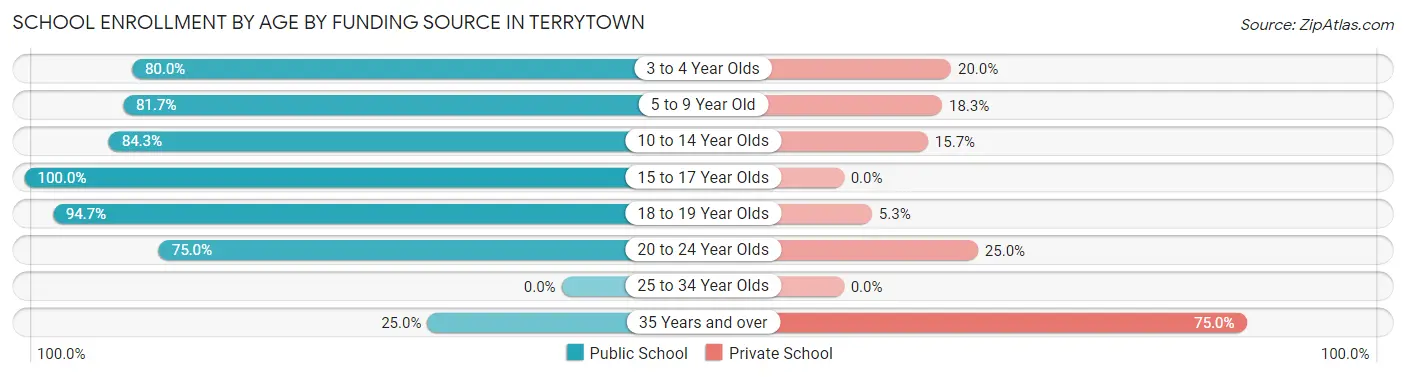
| Age Bracket | Public School | Private School |
| 3 to 4 Year Olds | 8 (80.0%) | 2 (20.0%) |
| 5 to 9 Year Old | 49 (81.7%) | 11 (18.3%) |
| 10 to 14 Year Olds | 43 (84.3%) | 8 (15.7%) |
| 15 to 17 Year Olds | 28 (100.0%) | 0 (0.0%) |
| 18 to 19 Year Olds | 18 (94.7%) | 1 (5.3%) |
| 20 to 24 Year Olds | 3 (75.0%) | 1 (25.0%) |
| 25 to 34 Year Olds | 0 (0.0%) | 0 (0.0%) |
| 35 Years and over | 1 (25.0%) | 3 (75.0%) |
| Total | 150 (85.2%) | 26 (14.8%) |
Educational Attainment by Field of Study in Terrytown
Science & technology (27 | 39.1%), business (21 | 30.4%), psychology (7 | 10.1%), liberal arts & history (6 | 8.7%), and arts & humanities (5 | 7.2%) are the most common fields of study among 69 individuals in Terrytown who have obtained a bachelor's degree or higher.
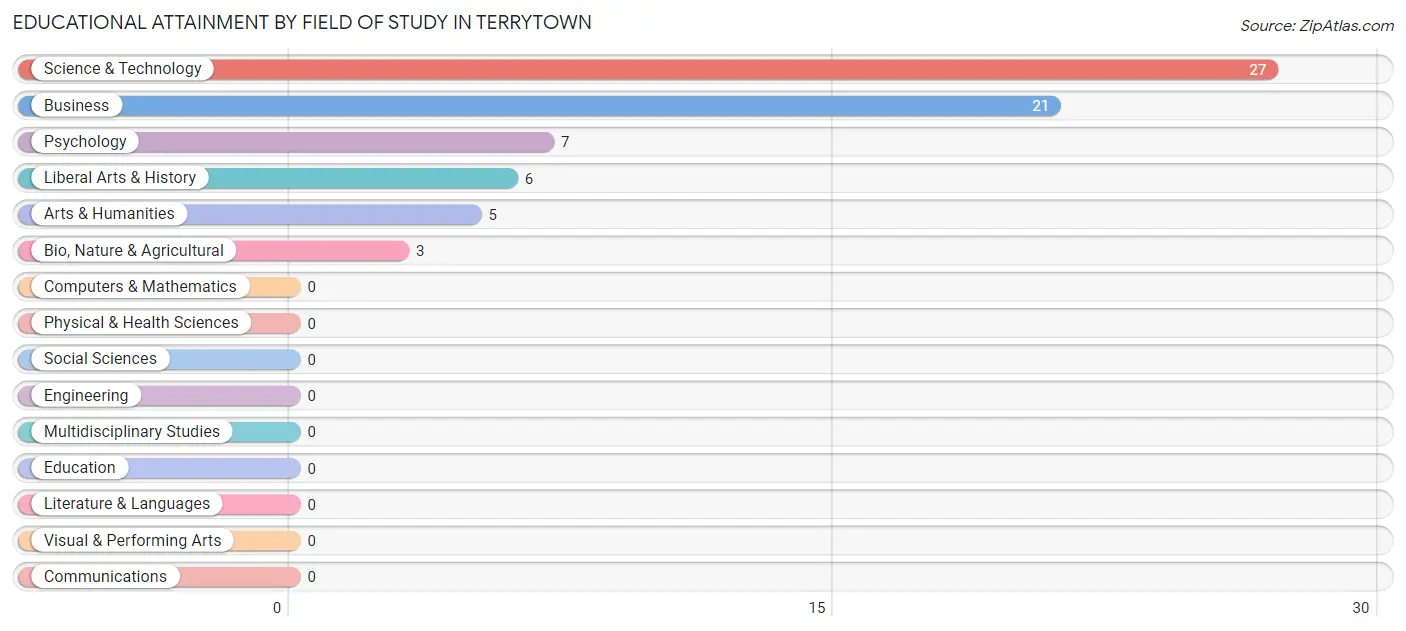
| Field of Study | # Graduates | % Graduates |
| Computers & Mathematics | 0 | 0.0% |
| Bio, Nature & Agricultural | 3 | 4.3% |
| Physical & Health Sciences | 0 | 0.0% |
| Psychology | 7 | 10.1% |
| Social Sciences | 0 | 0.0% |
| Engineering | 0 | 0.0% |
| Multidisciplinary Studies | 0 | 0.0% |
| Science & Technology | 27 | 39.1% |
| Business | 21 | 30.4% |
| Education | 0 | 0.0% |
| Literature & Languages | 0 | 0.0% |
| Liberal Arts & History | 6 | 8.7% |
| Visual & Performing Arts | 0 | 0.0% |
| Communications | 0 | 0.0% |
| Arts & Humanities | 5 | 7.2% |
| Total | 69 | 100.0% |
Transportation & Commute in Terrytown
Vehicle Availability by Sex in Terrytown
The most prevalent vehicle ownership categories in Terrytown are males with 2 vehicles (65, accounting for 46.1%) and females with 2 vehicles (52, making up 36.5%).
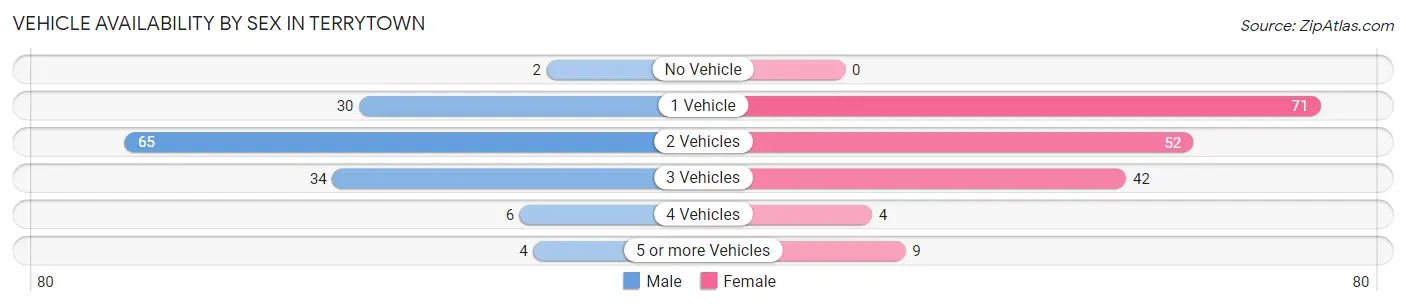
| Vehicles Available | Male | Female |
| No Vehicle | 2 (1.4%) | 0 (0.0%) |
| 1 Vehicle | 30 (21.3%) | 71 (39.9%) |
| 2 Vehicles | 65 (46.1%) | 52 (29.2%) |
| 3 Vehicles | 34 (24.1%) | 42 (23.6%) |
| 4 Vehicles | 6 (4.3%) | 4 (2.2%) |
| 5 or more Vehicles | 4 (2.8%) | 9 (5.1%) |
| Total | 141 (100.0%) | 178 (100.0%) |
Commute Time in Terrytown
The most frequently occuring commute durations in Terrytown are 10 to 14 minutes (89 commuters, 30.9%), 5 to 9 minutes (67 commuters, 23.3%), and 15 to 19 minutes (37 commuters, 12.9%).
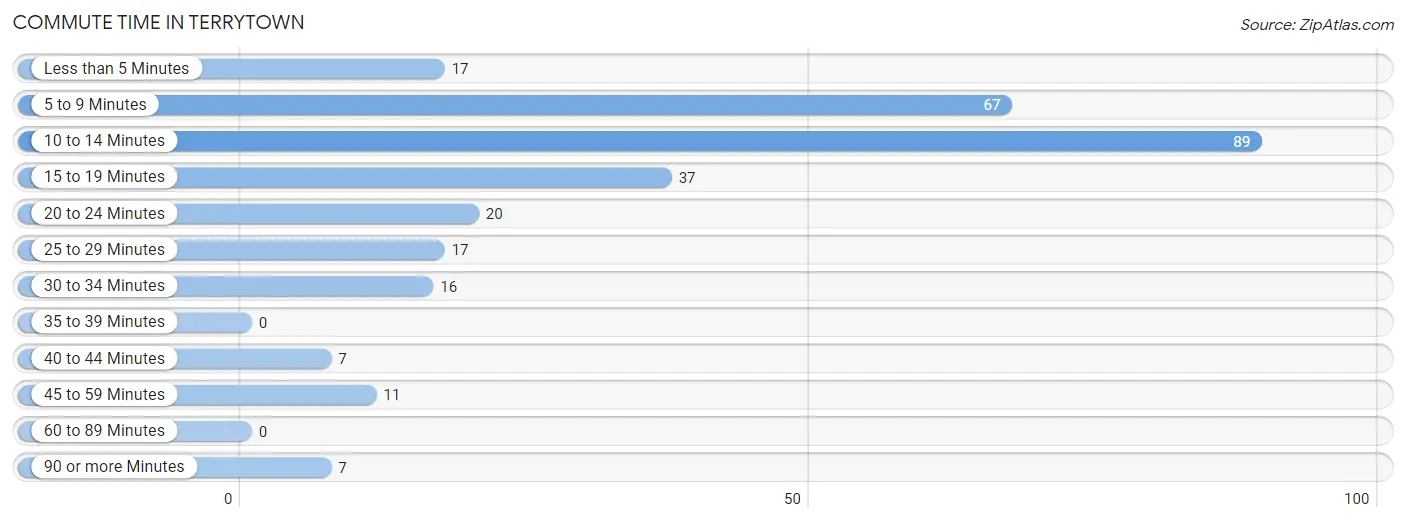
| Commute Time | # Commuters | % Commuters |
| Less than 5 Minutes | 17 | 5.9% |
| 5 to 9 Minutes | 67 | 23.3% |
| 10 to 14 Minutes | 89 | 30.9% |
| 15 to 19 Minutes | 37 | 12.9% |
| 20 to 24 Minutes | 20 | 6.9% |
| 25 to 29 Minutes | 17 | 5.9% |
| 30 to 34 Minutes | 16 | 5.6% |
| 35 to 39 Minutes | 0 | 0.0% |
| 40 to 44 Minutes | 7 | 2.4% |
| 45 to 59 Minutes | 11 | 3.8% |
| 60 to 89 Minutes | 0 | 0.0% |
| 90 or more Minutes | 7 | 2.4% |
Commute Time by Sex in Terrytown
The most common commute times in Terrytown are 5 to 9 minutes (42 commuters, 31.6%) for males and 10 to 14 minutes (75 commuters, 48.4%) for females.
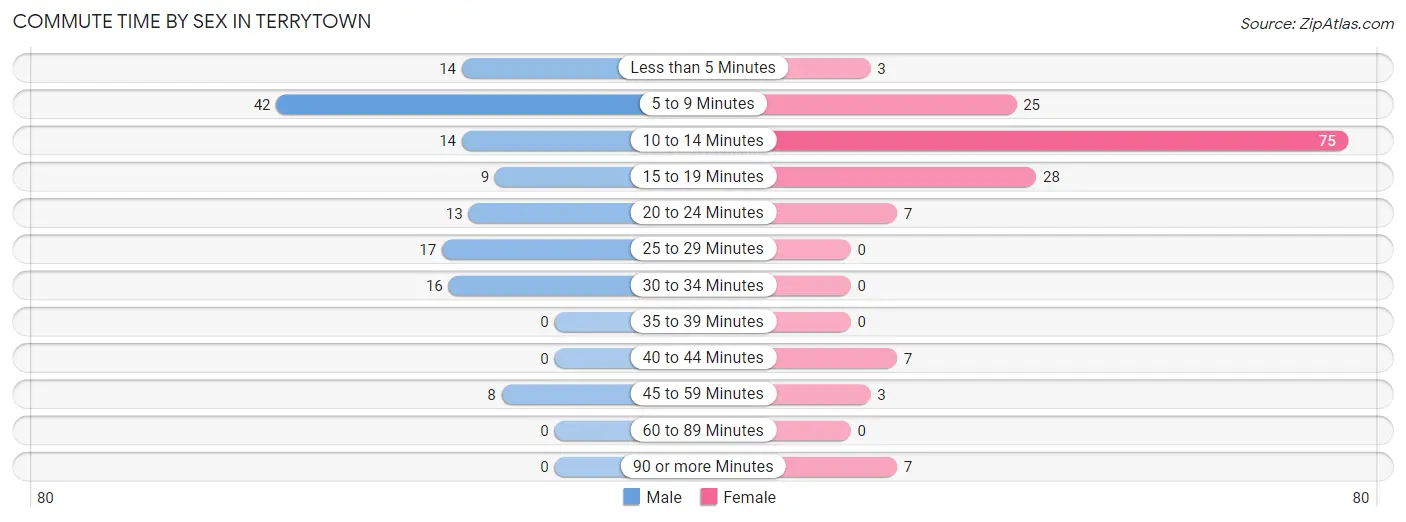
| Commute Time | Male | Female |
| Less than 5 Minutes | 14 (10.5%) | 3 (1.9%) |
| 5 to 9 Minutes | 42 (31.6%) | 25 (16.1%) |
| 10 to 14 Minutes | 14 (10.5%) | 75 (48.4%) |
| 15 to 19 Minutes | 9 (6.8%) | 28 (18.1%) |
| 20 to 24 Minutes | 13 (9.8%) | 7 (4.5%) |
| 25 to 29 Minutes | 17 (12.8%) | 0 (0.0%) |
| 30 to 34 Minutes | 16 (12.0%) | 0 (0.0%) |
| 35 to 39 Minutes | 0 (0.0%) | 0 (0.0%) |
| 40 to 44 Minutes | 0 (0.0%) | 7 (4.5%) |
| 45 to 59 Minutes | 8 (6.0%) | 3 (1.9%) |
| 60 to 89 Minutes | 0 (0.0%) | 0 (0.0%) |
| 90 or more Minutes | 0 (0.0%) | 7 (4.5%) |
Time of Departure to Work by Sex in Terrytown
The most frequent times of departure to work in Terrytown are 7:00 AM to 7:29 AM (33, 24.8%) for males and 9:00 AM to 9:59 AM (37, 23.9%) for females.
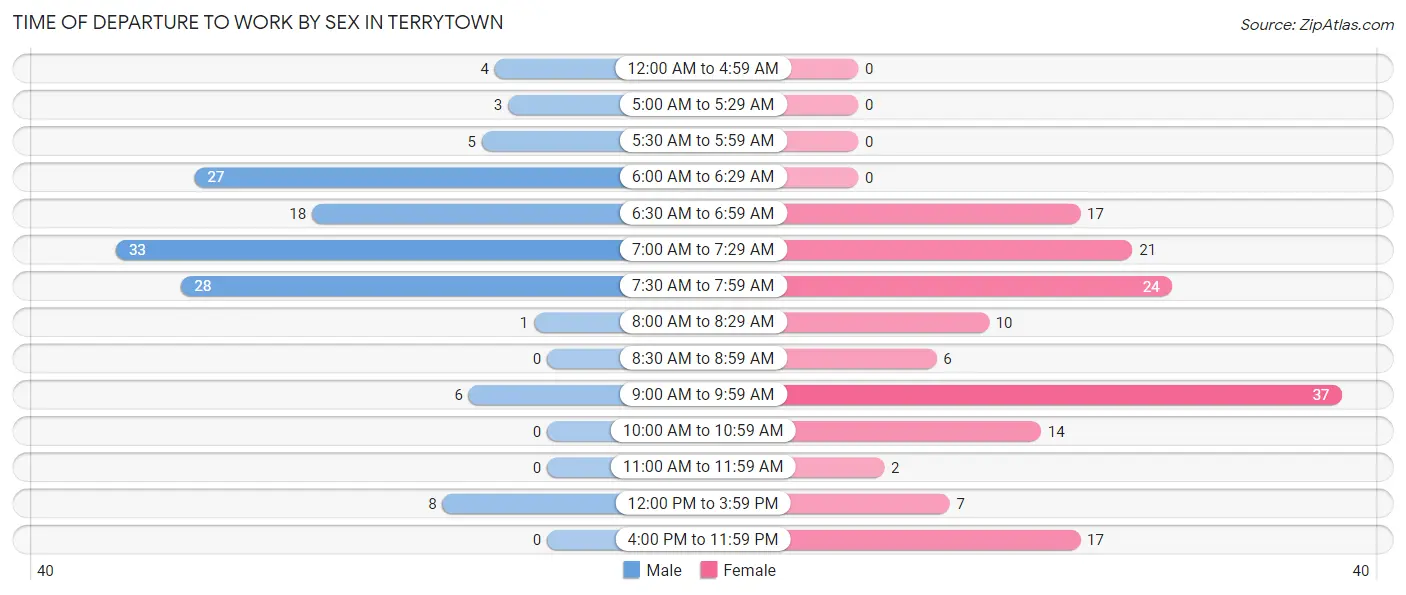
| Time of Departure | Male | Female |
| 12:00 AM to 4:59 AM | 4 (3.0%) | 0 (0.0%) |
| 5:00 AM to 5:29 AM | 3 (2.3%) | 0 (0.0%) |
| 5:30 AM to 5:59 AM | 5 (3.8%) | 0 (0.0%) |
| 6:00 AM to 6:29 AM | 27 (20.3%) | 0 (0.0%) |
| 6:30 AM to 6:59 AM | 18 (13.5%) | 17 (11.0%) |
| 7:00 AM to 7:29 AM | 33 (24.8%) | 21 (13.6%) |
| 7:30 AM to 7:59 AM | 28 (21.0%) | 24 (15.5%) |
| 8:00 AM to 8:29 AM | 1 (0.7%) | 10 (6.5%) |
| 8:30 AM to 8:59 AM | 0 (0.0%) | 6 (3.9%) |
| 9:00 AM to 9:59 AM | 6 (4.5%) | 37 (23.9%) |
| 10:00 AM to 10:59 AM | 0 (0.0%) | 14 (9.0%) |
| 11:00 AM to 11:59 AM | 0 (0.0%) | 2 (1.3%) |
| 12:00 PM to 3:59 PM | 8 (6.0%) | 7 (4.5%) |
| 4:00 PM to 11:59 PM | 0 (0.0%) | 17 (11.0%) |
| Total | 133 (100.0%) | 155 (100.0%) |
Housing Occupancy in Terrytown
Occupancy by Ownership in Terrytown
Of the total 335 dwellings in Terrytown, owner-occupied units account for 186 (55.5%), while renter-occupied units make up 149 (44.5%).
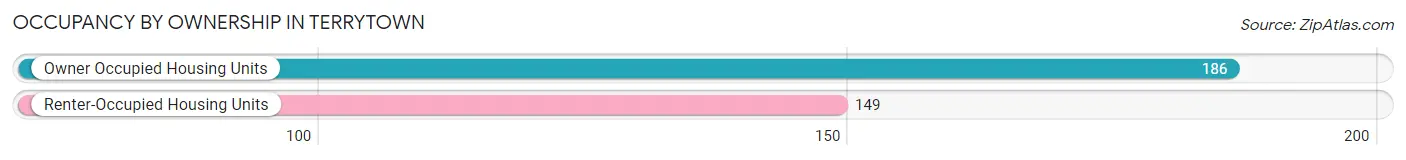
| Occupancy | # Housing Units | % Housing Units |
| Owner Occupied Housing Units | 186 | 55.5% |
| Renter-Occupied Housing Units | 149 | 44.5% |
| Total Occupied Housing Units | 335 | 100.0% |
Occupancy by Household Size in Terrytown
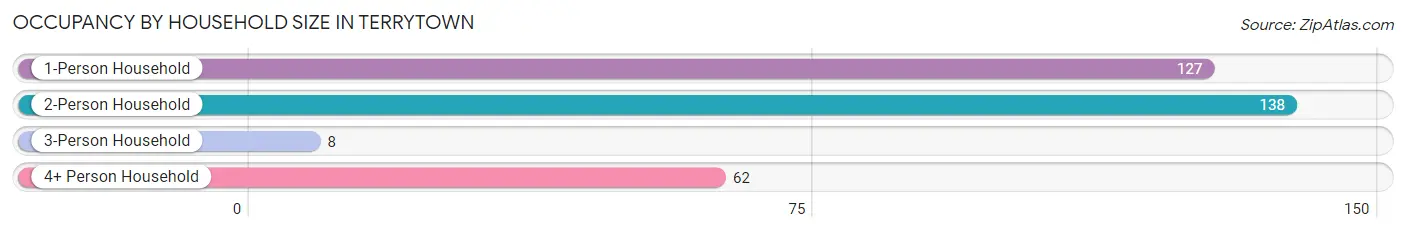
| Household Size | # Housing Units | % Housing Units |
| 1-Person Household | 127 | 37.9% |
| 2-Person Household | 138 | 41.2% |
| 3-Person Household | 8 | 2.4% |
| 4+ Person Household | 62 | 18.5% |
| Total Housing Units | 335 | 100.0% |
Occupancy by Ownership by Household Size in Terrytown
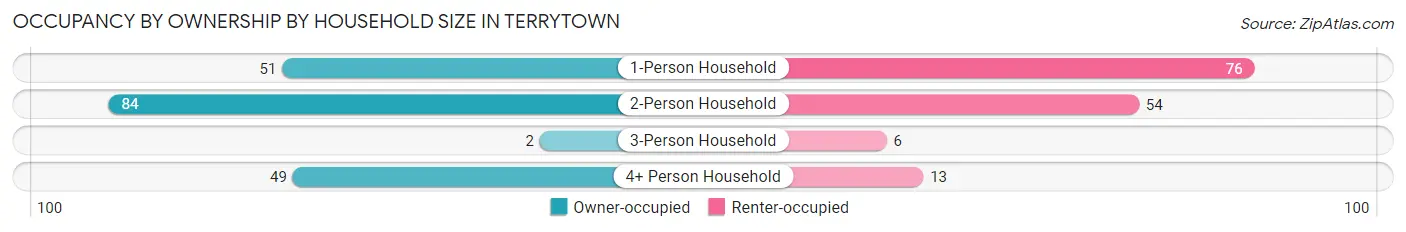
| Household Size | Owner-occupied | Renter-occupied |
| 1-Person Household | 51 (40.2%) | 76 (59.8%) |
| 2-Person Household | 84 (60.9%) | 54 (39.1%) |
| 3-Person Household | 2 (25.0%) | 6 (75.0%) |
| 4+ Person Household | 49 (79.0%) | 13 (21.0%) |
| Total Housing Units | 186 (55.5%) | 149 (44.5%) |
Occupancy by Educational Attainment in Terrytown
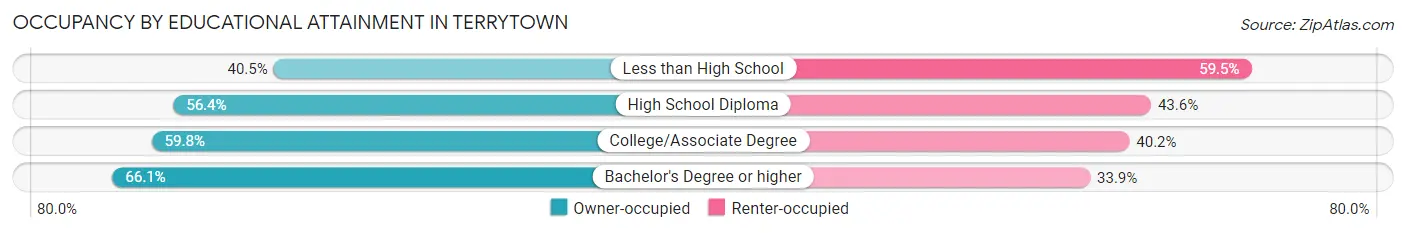
| Household Size | Owner-occupied | Renter-occupied |
| Less than High School | 32 (40.5%) | 47 (59.5%) |
| High School Diploma | 44 (56.4%) | 34 (43.6%) |
| College/Associate Degree | 73 (59.8%) | 49 (40.2%) |
| Bachelor's Degree or higher | 37 (66.1%) | 19 (33.9%) |
Occupancy by Age of Householder in Terrytown
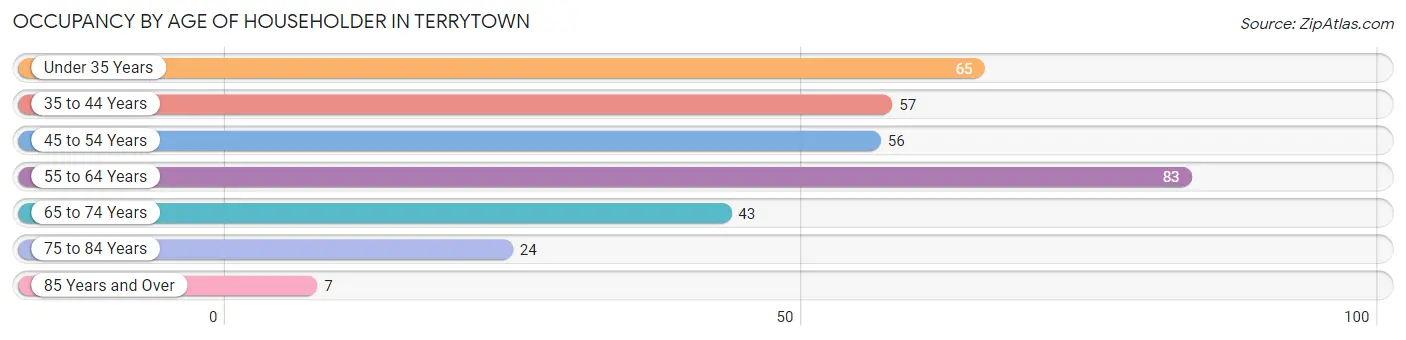
| Age Bracket | # Households | % Households |
| Under 35 Years | 65 | 19.4% |
| 35 to 44 Years | 57 | 17.0% |
| 45 to 54 Years | 56 | 16.7% |
| 55 to 64 Years | 83 | 24.8% |
| 65 to 74 Years | 43 | 12.8% |
| 75 to 84 Years | 24 | 7.2% |
| 85 Years and Over | 7 | 2.1% |
| Total | 335 | 100.0% |
Housing Finances in Terrytown
Median Income by Occupancy in Terrytown
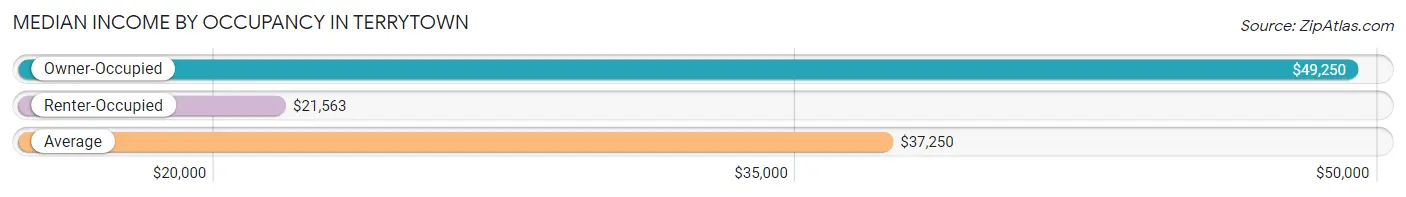
| Occupancy Type | # Households | Median Income |
| Owner-Occupied | 186 (55.5%) | $49,250 |
| Renter-Occupied | 149 (44.5%) | $21,563 |
| Average | 335 (100.0%) | $37,250 |
Occupancy by Householder Income Bracket in Terrytown
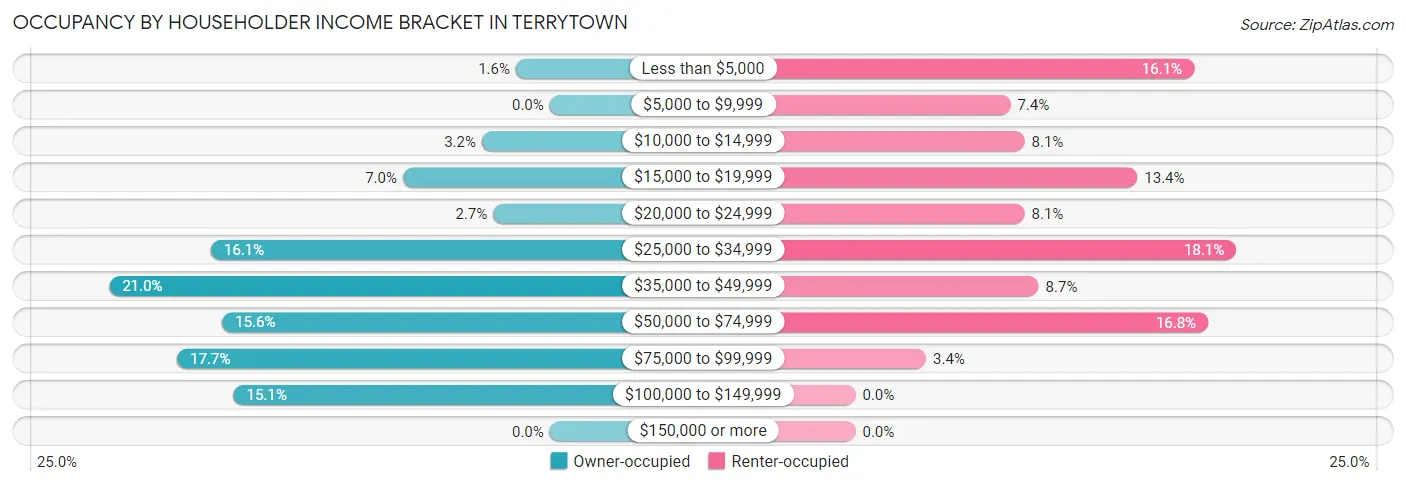
| Income Bracket | Owner-occupied | Renter-occupied |
| Less than $5,000 | 3 (1.6%) | 24 (16.1%) |
| $5,000 to $9,999 | 0 (0.0%) | 11 (7.4%) |
| $10,000 to $14,999 | 6 (3.2%) | 12 (8.1%) |
| $15,000 to $19,999 | 13 (7.0%) | 20 (13.4%) |
| $20,000 to $24,999 | 5 (2.7%) | 12 (8.1%) |
| $25,000 to $34,999 | 30 (16.1%) | 27 (18.1%) |
| $35,000 to $49,999 | 39 (21.0%) | 13 (8.7%) |
| $50,000 to $74,999 | 29 (15.6%) | 25 (16.8%) |
| $75,000 to $99,999 | 33 (17.7%) | 5 (3.4%) |
| $100,000 to $149,999 | 28 (15.0%) | 0 (0.0%) |
| $150,000 or more | 0 (0.0%) | 0 (0.0%) |
| Total | 186 (100.0%) | 149 (100.0%) |
Monthly Housing Cost Tiers in Terrytown
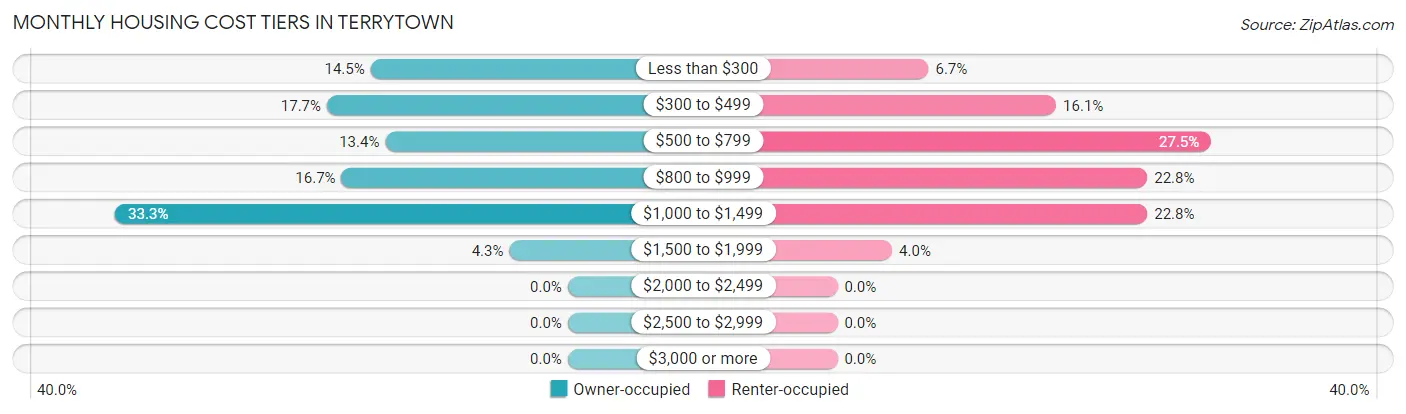
| Monthly Cost | Owner-occupied | Renter-occupied |
| Less than $300 | 27 (14.5%) | 10 (6.7%) |
| $300 to $499 | 33 (17.7%) | 24 (16.1%) |
| $500 to $799 | 25 (13.4%) | 41 (27.5%) |
| $800 to $999 | 31 (16.7%) | 34 (22.8%) |
| $1,000 to $1,499 | 62 (33.3%) | 34 (22.8%) |
| $1,500 to $1,999 | 8 (4.3%) | 6 (4.0%) |
| $2,000 to $2,499 | 0 (0.0%) | 0 (0.0%) |
| $2,500 to $2,999 | 0 (0.0%) | 0 (0.0%) |
| $3,000 or more | 0 (0.0%) | 0 (0.0%) |
| Total | 186 (100.0%) | 149 (100.0%) |
Physical Housing Characteristics in Terrytown
Housing Structures in Terrytown
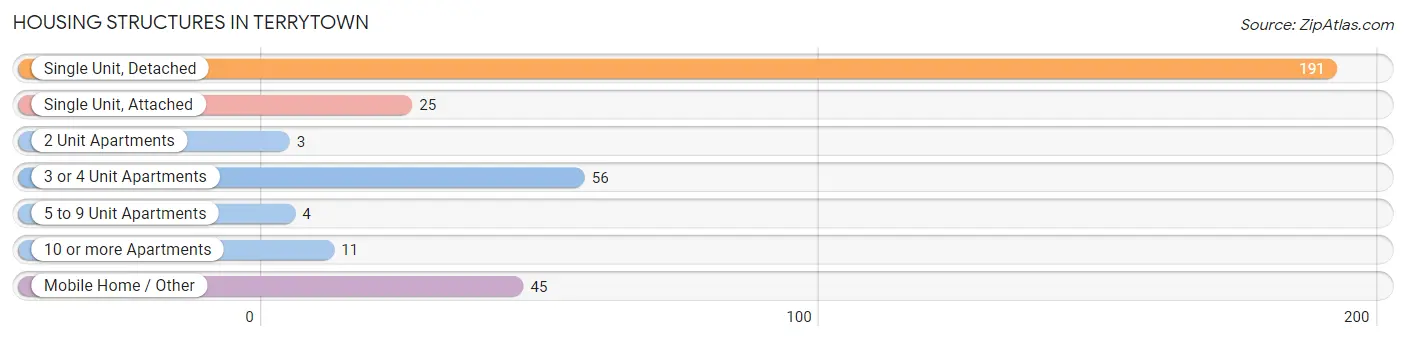
| Structure Type | # Housing Units | % Housing Units |
| Single Unit, Detached | 191 | 57.0% |
| Single Unit, Attached | 25 | 7.5% |
| 2 Unit Apartments | 3 | 0.9% |
| 3 or 4 Unit Apartments | 56 | 16.7% |
| 5 to 9 Unit Apartments | 4 | 1.2% |
| 10 or more Apartments | 11 | 3.3% |
| Mobile Home / Other | 45 | 13.4% |
| Total | 335 | 100.0% |
Housing Structures by Occupancy in Terrytown
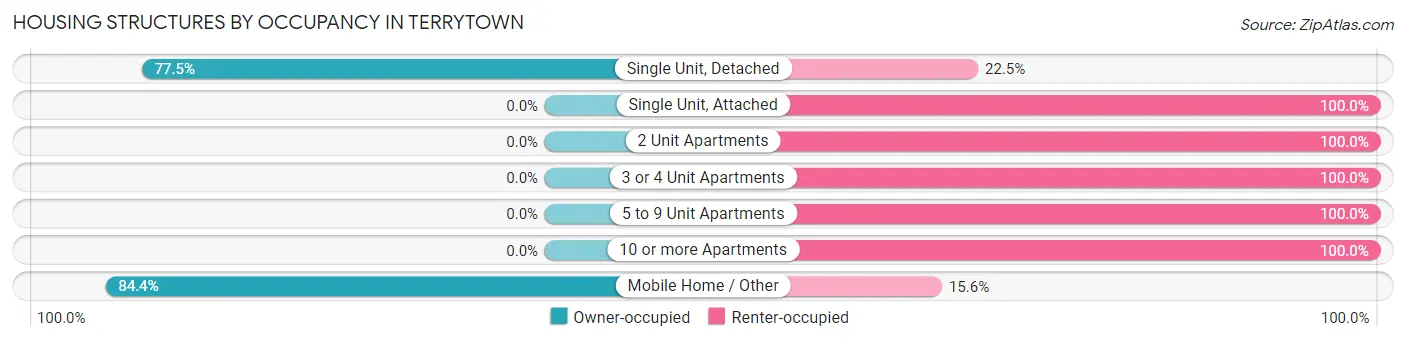
| Structure Type | Owner-occupied | Renter-occupied |
| Single Unit, Detached | 148 (77.5%) | 43 (22.5%) |
| Single Unit, Attached | 0 (0.0%) | 25 (100.0%) |
| 2 Unit Apartments | 0 (0.0%) | 3 (100.0%) |
| 3 or 4 Unit Apartments | 0 (0.0%) | 56 (100.0%) |
| 5 to 9 Unit Apartments | 0 (0.0%) | 4 (100.0%) |
| 10 or more Apartments | 0 (0.0%) | 11 (100.0%) |
| Mobile Home / Other | 38 (84.4%) | 7 (15.6%) |
| Total | 186 (55.5%) | 149 (44.5%) |
Housing Structures by Number of Rooms in Terrytown
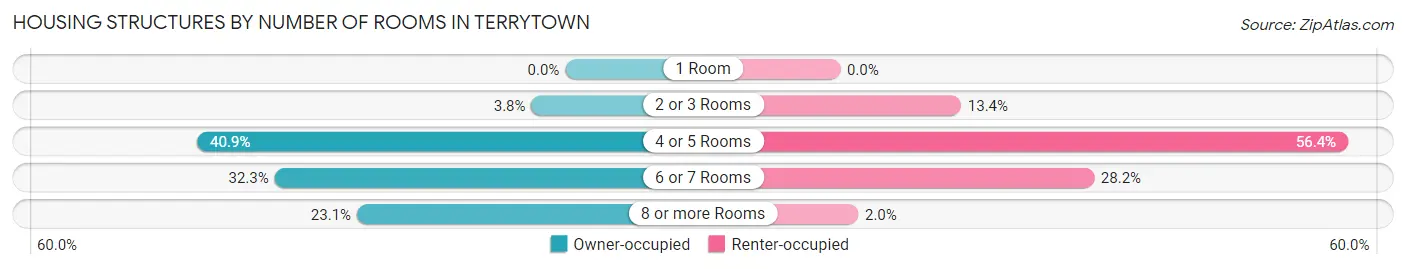
| Number of Rooms | Owner-occupied | Renter-occupied |
| 1 Room | 0 (0.0%) | 0 (0.0%) |
| 2 or 3 Rooms | 7 (3.8%) | 20 (13.4%) |
| 4 or 5 Rooms | 76 (40.9%) | 84 (56.4%) |
| 6 or 7 Rooms | 60 (32.3%) | 42 (28.2%) |
| 8 or more Rooms | 43 (23.1%) | 3 (2.0%) |
| Total | 186 (100.0%) | 149 (100.0%) |
Housing Structure by Heating Type in Terrytown
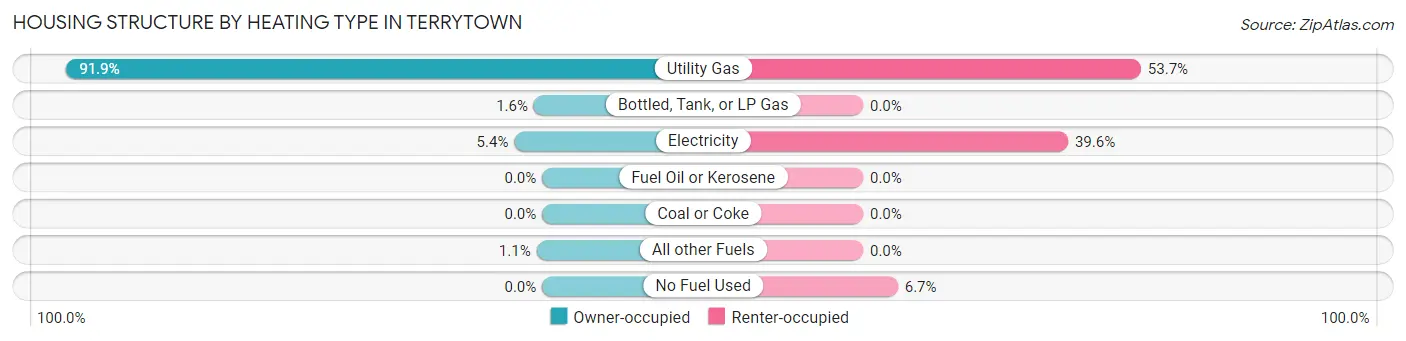
| Heating Type | Owner-occupied | Renter-occupied |
| Utility Gas | 171 (91.9%) | 80 (53.7%) |
| Bottled, Tank, or LP Gas | 3 (1.6%) | 0 (0.0%) |
| Electricity | 10 (5.4%) | 59 (39.6%) |
| Fuel Oil or Kerosene | 0 (0.0%) | 0 (0.0%) |
| Coal or Coke | 0 (0.0%) | 0 (0.0%) |
| All other Fuels | 2 (1.1%) | 0 (0.0%) |
| No Fuel Used | 0 (0.0%) | 10 (6.7%) |
| Total | 186 (100.0%) | 149 (100.0%) |
Household Vehicle Usage in Terrytown
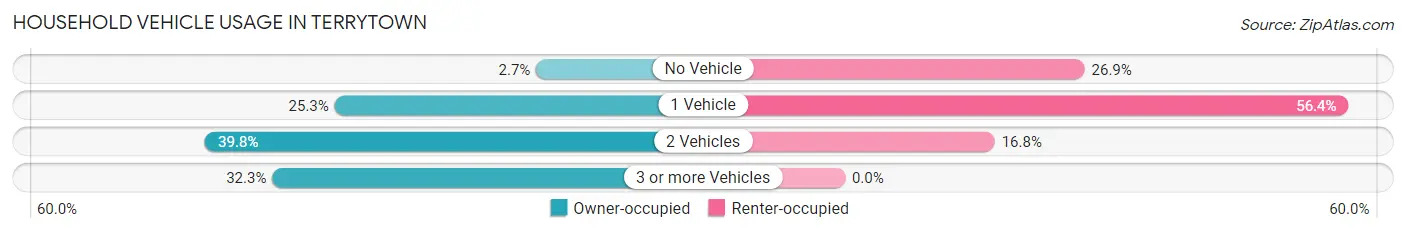
| Vehicles per Household | Owner-occupied | Renter-occupied |
| No Vehicle | 5 (2.7%) | 40 (26.9%) |
| 1 Vehicle | 47 (25.3%) | 84 (56.4%) |
| 2 Vehicles | 74 (39.8%) | 25 (16.8%) |
| 3 or more Vehicles | 60 (32.3%) | 0 (0.0%) |
| Total | 186 (100.0%) | 149 (100.0%) |
Real Estate & Mortgages in Terrytown
Real Estate and Mortgage Overview in Terrytown
| Characteristic | Without Mortgage | With Mortgage |
| Housing Units | 80 | 106 |
| Median Property Value | - | - |
| Median Household Income | $46,250 | $0 |
| Monthly Housing Costs | $353 | $0 |
| Real Estate Taxes | $199 | $7 |
Property Value by Mortgage Status in Terrytown
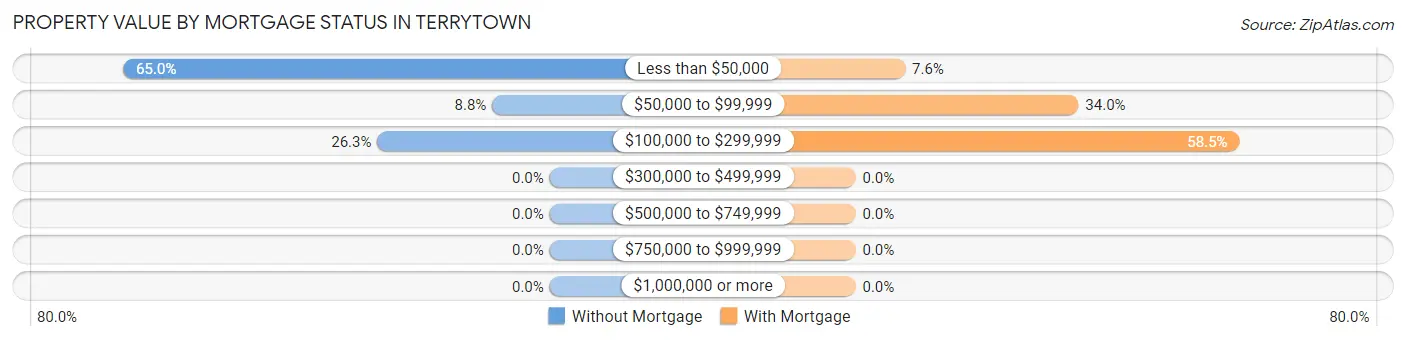
| Property Value | Without Mortgage | With Mortgage |
| Less than $50,000 | 52 (65.0%) | 8 (7.5%) |
| $50,000 to $99,999 | 7 (8.7%) | 36 (34.0%) |
| $100,000 to $299,999 | 21 (26.3%) | 62 (58.5%) |
| $300,000 to $499,999 | 0 (0.0%) | 0 (0.0%) |
| $500,000 to $749,999 | 0 (0.0%) | 0 (0.0%) |
| $750,000 to $999,999 | 0 (0.0%) | 0 (0.0%) |
| $1,000,000 or more | 0 (0.0%) | 0 (0.0%) |
| Total | 80 (100.0%) | 106 (100.0%) |
Household Income by Mortgage Status in Terrytown
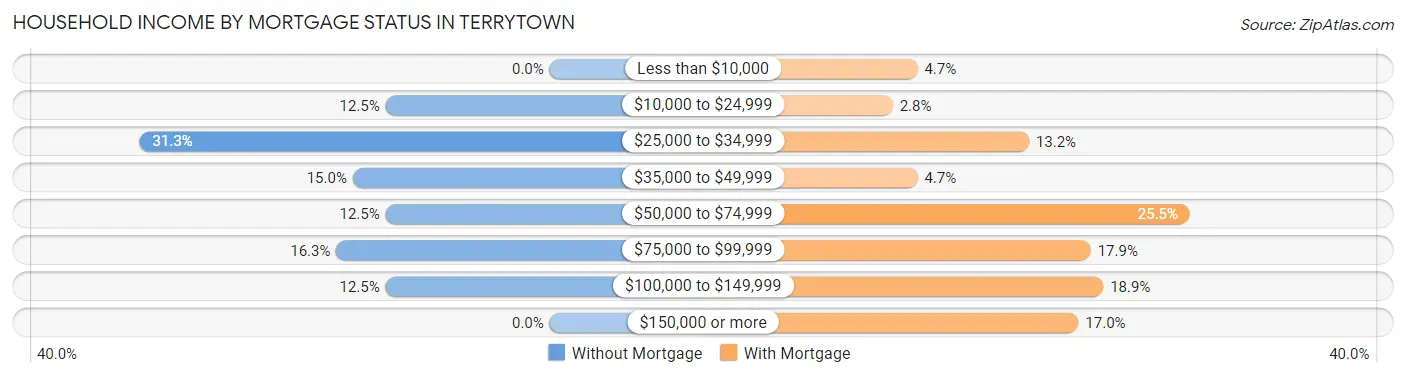
| Household Income | Without Mortgage | With Mortgage |
| Less than $10,000 | 0 (0.0%) | 5 (4.7%) |
| $10,000 to $24,999 | 10 (12.5%) | 3 (2.8%) |
| $25,000 to $34,999 | 25 (31.2%) | 14 (13.2%) |
| $35,000 to $49,999 | 12 (15.0%) | 5 (4.7%) |
| $50,000 to $74,999 | 10 (12.5%) | 27 (25.5%) |
| $75,000 to $99,999 | 13 (16.3%) | 19 (17.9%) |
| $100,000 to $149,999 | 10 (12.5%) | 20 (18.9%) |
| $150,000 or more | 0 (0.0%) | 18 (17.0%) |
| Total | 80 (100.0%) | 106 (100.0%) |
Property Value to Household Income Ratio in Terrytown
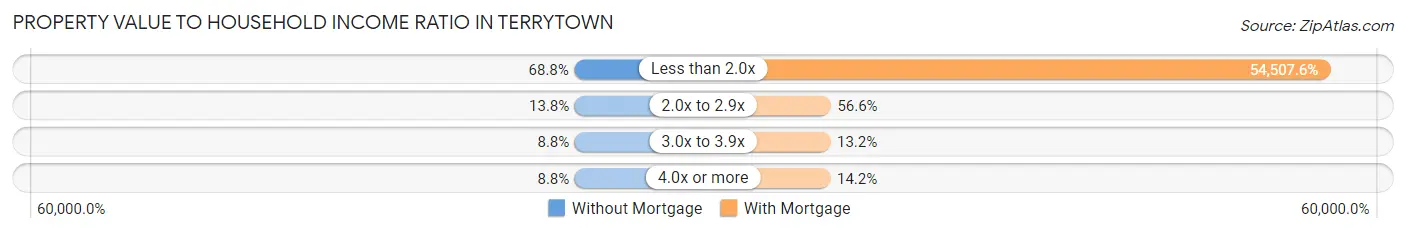
| Value-to-Income Ratio | Without Mortgage | With Mortgage |
| Less than 2.0x | 55 (68.8%) | 57,778 (54,507.6%) |
| 2.0x to 2.9x | 11 (13.8%) | 60 (56.6%) |
| 3.0x to 3.9x | 7 (8.7%) | 14 (13.2%) |
| 4.0x or more | 7 (8.7%) | 15 (14.1%) |
| Total | 80 (100.0%) | 106 (100.0%) |
Real Estate Taxes by Mortgage Status in Terrytown
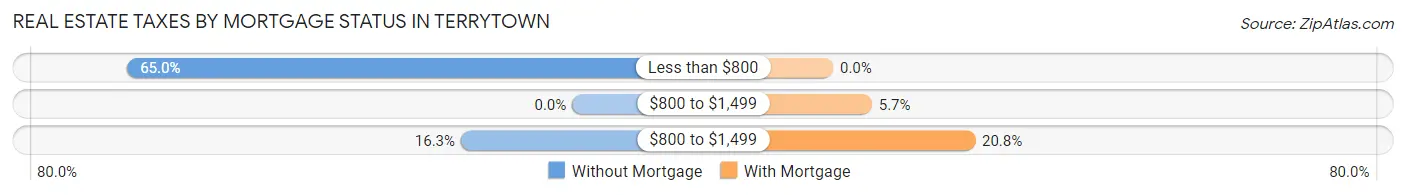
| Property Taxes | Without Mortgage | With Mortgage |
| Less than $800 | 52 (65.0%) | 0 (0.0%) |
| $800 to $1,499 | 0 (0.0%) | 6 (5.7%) |
| $800 to $1,499 | 13 (16.3%) | 22 (20.7%) |
| Total | 80 (100.0%) | 106 (100.0%) |
Health & Disability in Terrytown
Health Insurance Coverage by Age in Terrytown
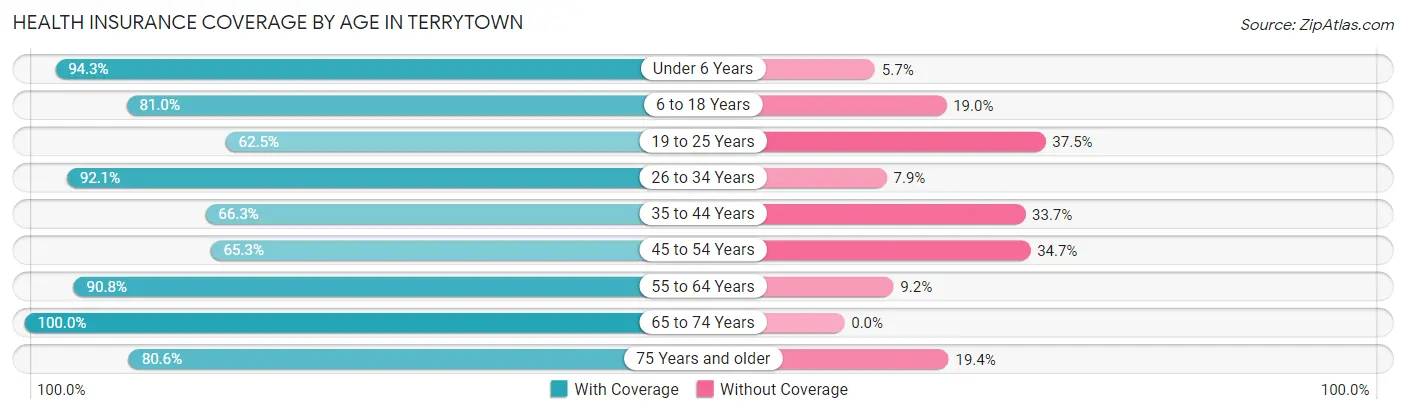
| Age Bracket | With Coverage | Without Coverage |
| Under 6 Years | 66 (94.3%) | 4 (5.7%) |
| 6 to 18 Years | 115 (81.0%) | 27 (19.0%) |
| 19 to 25 Years | 25 (62.5%) | 15 (37.5%) |
| 26 to 34 Years | 70 (92.1%) | 6 (7.9%) |
| 35 to 44 Years | 57 (66.3%) | 29 (33.7%) |
| 45 to 54 Years | 49 (65.3%) | 26 (34.7%) |
| 55 to 64 Years | 119 (90.8%) | 12 (9.2%) |
| 65 to 74 Years | 58 (100.0%) | 0 (0.0%) |
| 75 Years and older | 29 (80.6%) | 7 (19.4%) |
| Total | 588 (82.4%) | 126 (17.6%) |
Health Insurance Coverage by Citizenship Status in Terrytown
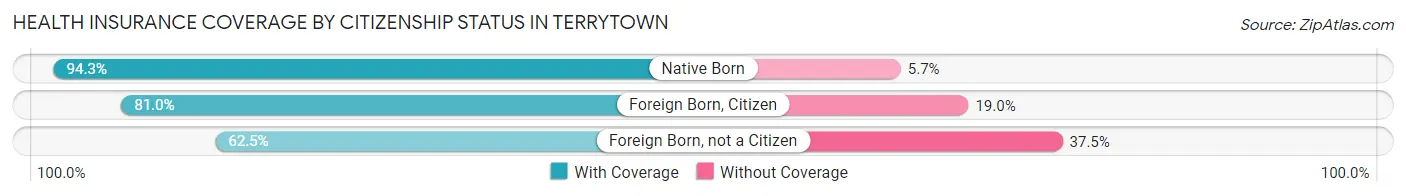
| Citizenship Status | With Coverage | Without Coverage |
| Native Born | 66 (94.3%) | 4 (5.7%) |
| Foreign Born, Citizen | 115 (81.0%) | 27 (19.0%) |
| Foreign Born, not a Citizen | 25 (62.5%) | 15 (37.5%) |
Health Insurance Coverage by Household Income in Terrytown
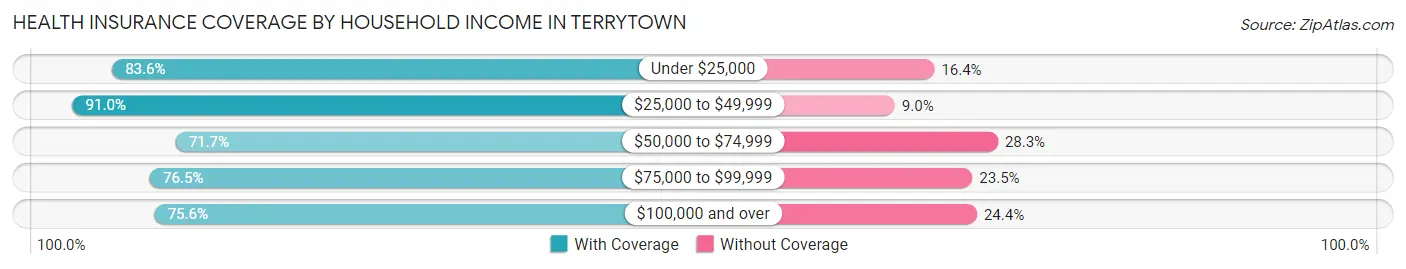
| Household Income | With Coverage | Without Coverage |
| Under $25,000 | 168 (83.6%) | 33 (16.4%) |
| $25,000 to $49,999 | 212 (91.0%) | 21 (9.0%) |
| $50,000 to $74,999 | 81 (71.7%) | 32 (28.3%) |
| $75,000 to $99,999 | 65 (76.5%) | 20 (23.5%) |
| $100,000 and over | 62 (75.6%) | 20 (24.4%) |
Public vs Private Health Insurance Coverage by Age in Terrytown
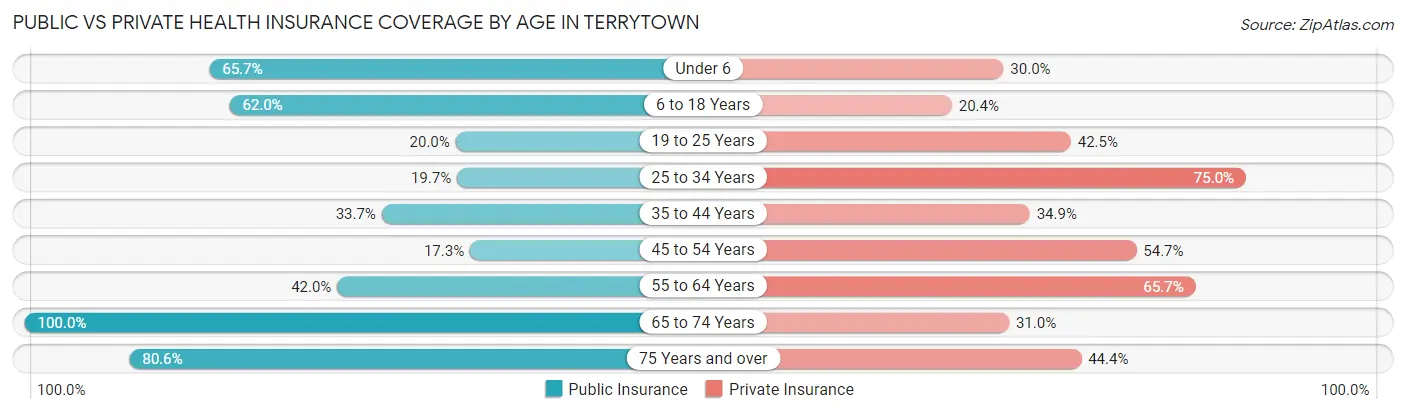
| Age Bracket | Public Insurance | Private Insurance |
| Under 6 | 46 (65.7%) | 21 (30.0%) |
| 6 to 18 Years | 88 (62.0%) | 29 (20.4%) |
| 19 to 25 Years | 8 (20.0%) | 17 (42.5%) |
| 25 to 34 Years | 15 (19.7%) | 57 (75.0%) |
| 35 to 44 Years | 29 (33.7%) | 30 (34.9%) |
| 45 to 54 Years | 13 (17.3%) | 41 (54.7%) |
| 55 to 64 Years | 55 (42.0%) | 86 (65.6%) |
| 65 to 74 Years | 58 (100.0%) | 18 (31.0%) |
| 75 Years and over | 29 (80.6%) | 16 (44.4%) |
| Total | 341 (47.8%) | 315 (44.1%) |
Disability Status by Sex by Age in Terrytown
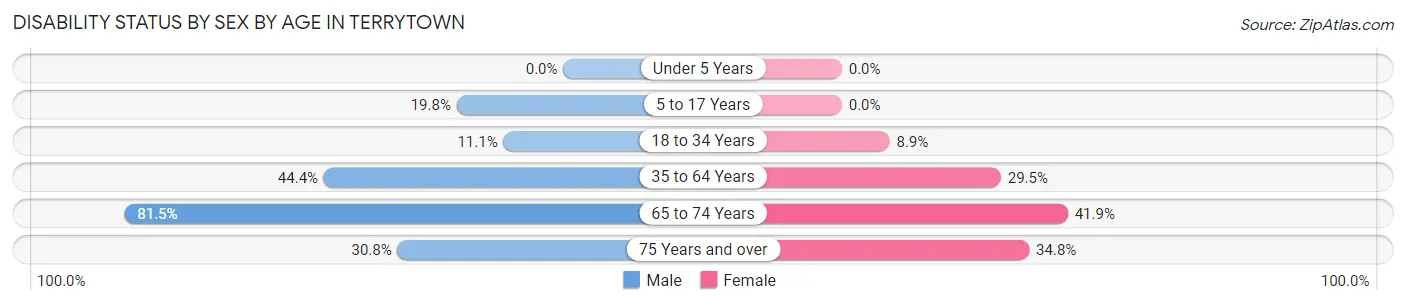
| Age Bracket | Male | Female |
| Under 5 Years | 0 (0.0%) | 0 (0.0%) |
| 5 to 17 Years | 19 (19.8%) | 0 (0.0%) |
| 18 to 34 Years | 6 (11.1%) | 7 (8.9%) |
| 35 to 64 Years | 56 (44.4%) | 49 (29.5%) |
| 65 to 74 Years | 22 (81.5%) | 13 (41.9%) |
| 75 Years and over | 4 (30.8%) | 8 (34.8%) |
Disability Class by Sex by Age in Terrytown
Disability Class: Hearing Difficulty
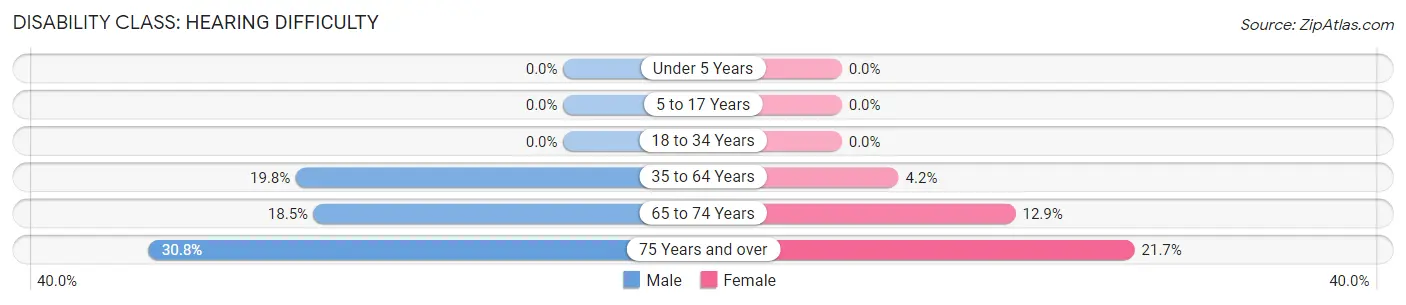
| Age Bracket | Male | Female |
| Under 5 Years | 0 (0.0%) | 0 (0.0%) |
| 5 to 17 Years | 0 (0.0%) | 0 (0.0%) |
| 18 to 34 Years | 0 (0.0%) | 0 (0.0%) |
| 35 to 64 Years | 25 (19.8%) | 7 (4.2%) |
| 65 to 74 Years | 5 (18.5%) | 4 (12.9%) |
| 75 Years and over | 4 (30.8%) | 5 (21.7%) |
Disability Class: Vision Difficulty
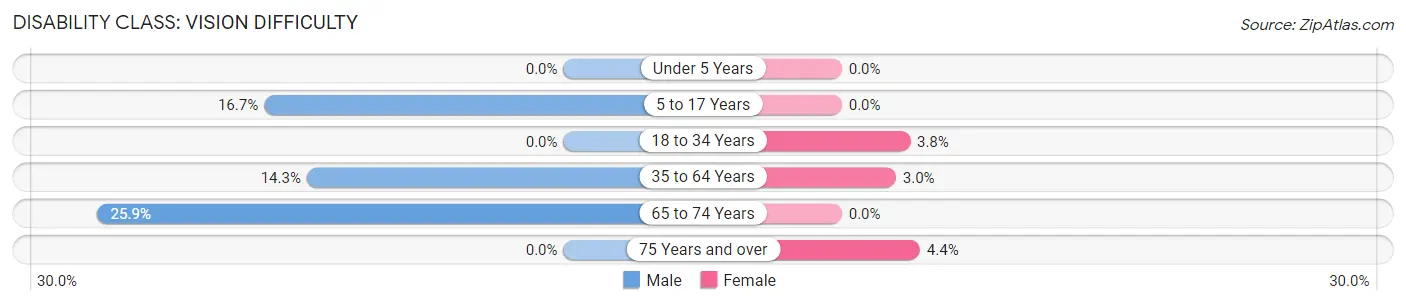
| Age Bracket | Male | Female |
| Under 5 Years | 0 (0.0%) | 0 (0.0%) |
| 5 to 17 Years | 16 (16.7%) | 0 (0.0%) |
| 18 to 34 Years | 0 (0.0%) | 3 (3.8%) |
| 35 to 64 Years | 18 (14.3%) | 5 (3.0%) |
| 65 to 74 Years | 7 (25.9%) | 0 (0.0%) |
| 75 Years and over | 0 (0.0%) | 1 (4.3%) |
Disability Class: Cognitive Difficulty
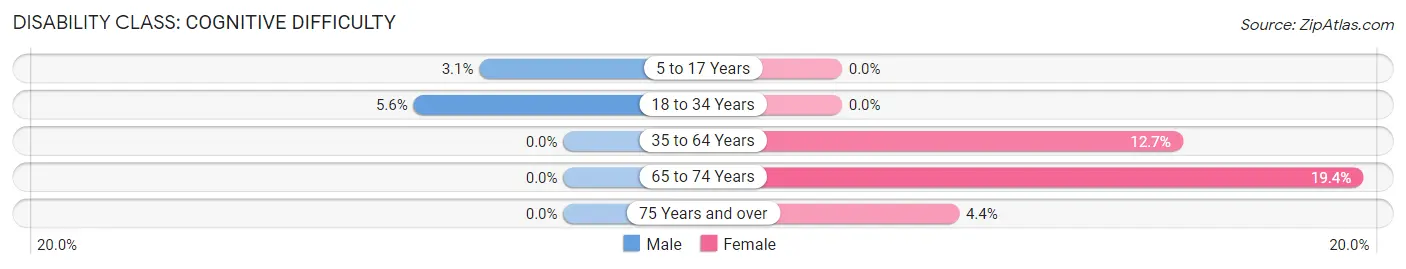
| Age Bracket | Male | Female |
| 5 to 17 Years | 3 (3.1%) | 0 (0.0%) |
| 18 to 34 Years | 3 (5.6%) | 0 (0.0%) |
| 35 to 64 Years | 0 (0.0%) | 21 (12.7%) |
| 65 to 74 Years | 0 (0.0%) | 6 (19.4%) |
| 75 Years and over | 0 (0.0%) | 1 (4.3%) |
Disability Class: Ambulatory Difficulty
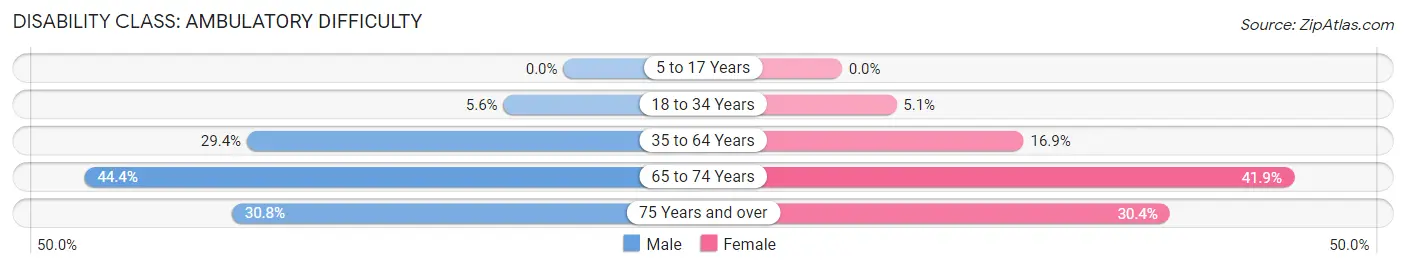
| Age Bracket | Male | Female |
| 5 to 17 Years | 0 (0.0%) | 0 (0.0%) |
| 18 to 34 Years | 3 (5.6%) | 4 (5.1%) |
| 35 to 64 Years | 37 (29.4%) | 28 (16.9%) |
| 65 to 74 Years | 12 (44.4%) | 13 (41.9%) |
| 75 Years and over | 4 (30.8%) | 7 (30.4%) |
Disability Class: Self-Care Difficulty
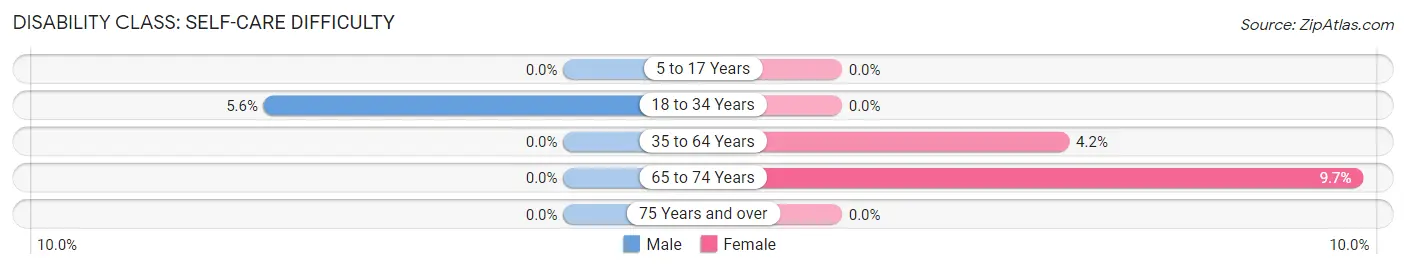
| Age Bracket | Male | Female |
| 5 to 17 Years | 0 (0.0%) | 0 (0.0%) |
| 18 to 34 Years | 3 (5.6%) | 0 (0.0%) |
| 35 to 64 Years | 0 (0.0%) | 7 (4.2%) |
| 65 to 74 Years | 0 (0.0%) | 3 (9.7%) |
| 75 Years and over | 0 (0.0%) | 0 (0.0%) |
Technology Access in Terrytown
Computing Device Access in Terrytown
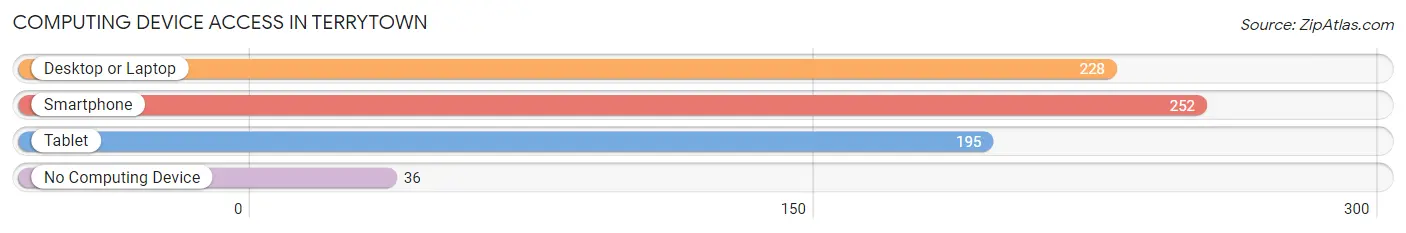
| Device Type | # Households | % Households |
| Desktop or Laptop | 228 | 68.1% |
| Smartphone | 252 | 75.2% |
| Tablet | 195 | 58.2% |
| No Computing Device | 36 | 10.7% |
| Total | 335 | 100.0% |
Internet Access in Terrytown
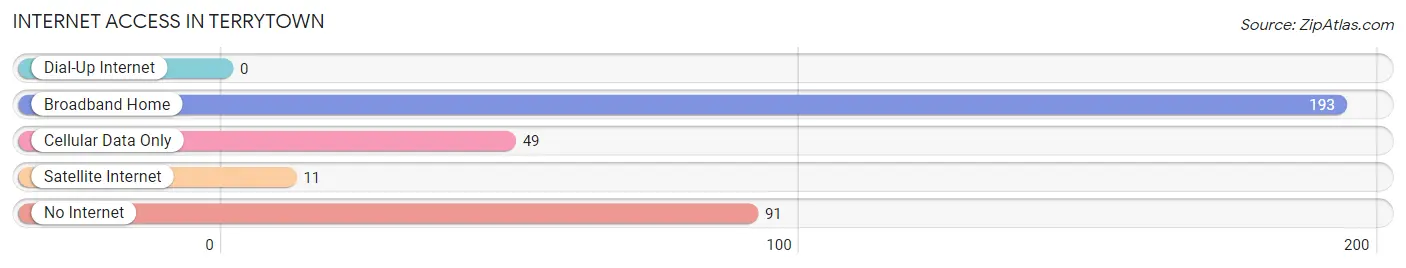
| Internet Type | # Households | % Households |
| Dial-Up Internet | 0 | 0.0% |
| Broadband Home | 193 | 57.6% |
| Cellular Data Only | 49 | 14.6% |
| Satellite Internet | 11 | 3.3% |
| No Internet | 91 | 27.2% |
| Total | 335 | 100.0% |
Terrytown Summary
Tucked away in the rolling hills of eastern Nebraska, Terrytown is a small rural community with a population of just over 500 people. The town was founded in 1887 by a group of settlers from the nearby town of Terry, and has since grown to become a vibrant and welcoming community.
Geography
Terrytown is located in the southeastern corner of Nebraska, in the rolling hills of the Loess Hills region. The town is situated on the banks of the Missouri River, and is surrounded by lush farmland and rolling hills. The town is located approximately 25 miles from the state capital of Lincoln, and is within easy driving distance of Omaha, Nebraska's largest city.
The town is served by two major highways, US Route 34 and Nebraska State Highway 2. The town is also served by a small airport, the Terrytown Municipal Airport, which offers flights to Omaha and other nearby cities.
Economy
The economy of Terrytown is largely based on agriculture. The town is home to several large farms, which produce a variety of crops, including corn, soybeans, wheat, and hay. The town also has a thriving livestock industry, with several large cattle and hog farms in the area.
In addition to agriculture, Terrytown is home to several small businesses, including a grocery store, a hardware store, a restaurant, and a few small shops. The town also has a small manufacturing sector, with several small factories producing a variety of products, including furniture, clothing, and electronics.
Demographics
As of the 2010 census, the population of Terrytown was 514 people. The town is predominantly white, with a small minority population of African Americans, Hispanics, and Native Americans. The median household income in the town is $45,000, and the median home value is $125,000.
The town is served by the Terrytown Public School District, which consists of one elementary school, one middle school, and one high school. The town also has a small library, a post office, and a few churches.
History
Terrytown was founded in 1887 by a group of settlers from the nearby town of Terry. The town was named after the founder's father, Thomas Terry, and was originally intended to be a farming community. The town quickly grew, and by the early 1900s, it had become a thriving agricultural center.
In the 1950s, the town began to diversify its economy, and several small businesses opened in the area. The town also began to attract more people, and by the 1970s, the population had grown to over 500 people.
Today, Terrytown is a vibrant and welcoming community, with a strong sense of community and a commitment to preserving its rural heritage. The town is home to several small businesses, and is a popular destination for tourists and outdoor enthusiasts.
Common Questions
What is the Total Population of Terrytown?
Total Population of Terrytown is 714.
What is the Total Male Population of Terrytown?
Total Male Population of Terrytown is 349.
What is the Total Female Population of Terrytown?
Total Female Population of Terrytown is 365.
What is the Ratio of Males per 100 Females in Terrytown?
There are 95.62 Males per 100 Females in Terrytown.
What is the Ratio of Females per 100 Males in Terrytown?
There are 104.58 Females per 100 Males in Terrytown.
What is the Median Population Age in Terrytown?
Median Population Age in Terrytown is 38.3 Years.
What is the Average Family Size in Terrytown
Average Family Size in Terrytown is 2.9 People.
What is the Average Household Size in Terrytown
Average Household Size in Terrytown is 2.1 People.
What is Per Capita Income in Terrytown?
Per Capita income in Terrytown is $20,735.
What is the Median Family Income in Terrytown?
Median Family Income in Terrytown is $48,125.
What is the Median Household income in Terrytown?
Median Household Income in Terrytown is $37,250.
What is Income or Wage Gap in Terrytown?
Income or Wage Gap in Terrytown is 46.4%.
Women in Terrytown earn 53.6 cents for every dollar earned by a man.
What is Inequality or Gini Index in Terrytown?
Inequality or Gini Index in Terrytown is 0.42.
How Large is the Labor Force in Terrytown?
There are 350 People in the Labor Forcein in Terrytown.
What is the Percentage of People in the Labor Force in Terrytown?
66.5% of People are in the Labor Force in Terrytown.
What is the Unemployment Rate in Terrytown?
Unemployment Rate in Terrytown is 4.0%.