Paradise, MT
Paradise Map
Paradise Overview
129
TOTAL POPULATION
101
MALE POPULATION
28
FEMALE POPULATION
360.71
MALES / 100 FEMALES
27.72
FEMALES / 100 MALES
65.5
MEDIAN AGE
3.7
AVG FAMILY SIZE
3.3
AVG HOUSEHOLD SIZE
$16,068
PER CAPITA INCOME
$41,806
AVG FAMILY INCOME
$42,431
AVG HOUSEHOLD INCOME
0.16
INEQUALITY / GINI INDEX
27
LABOR FORCE [ PEOPLE ]
22.1%
PERCENT IN LABOR FORCE
29.6%
UNEMPLOYMENT RATE
Paradise Zip Codes
Paradise Area Codes
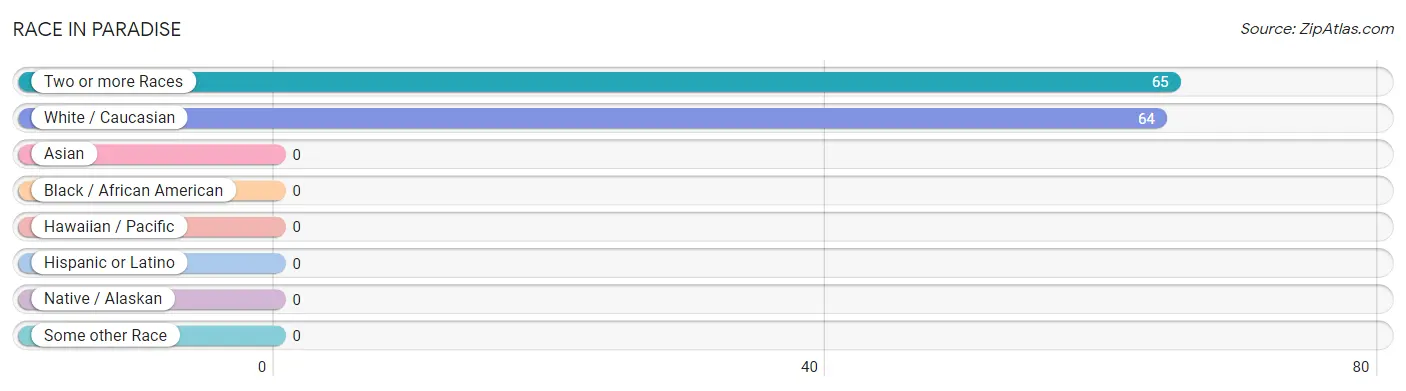
Race in Paradise
The most populous races in Paradise are Two or more Races (65 | 50.4%), and White / Caucasian (64 | 49.6%).
| Race | # Population | % Population |
| Asian | 0 | 0.0% |
| Black / African American | 0 | 0.0% |
| Hawaiian / Pacific | 0 | 0.0% |
| Hispanic or Latino | 0 | 0.0% |
| Native / Alaskan | 0 | 0.0% |
| White / Caucasian | 64 | 49.6% |
| Two or more Races | 65 | 50.4% |
| Some other Race | 0 | 0.0% |
| Total | 129 | 100.0% |
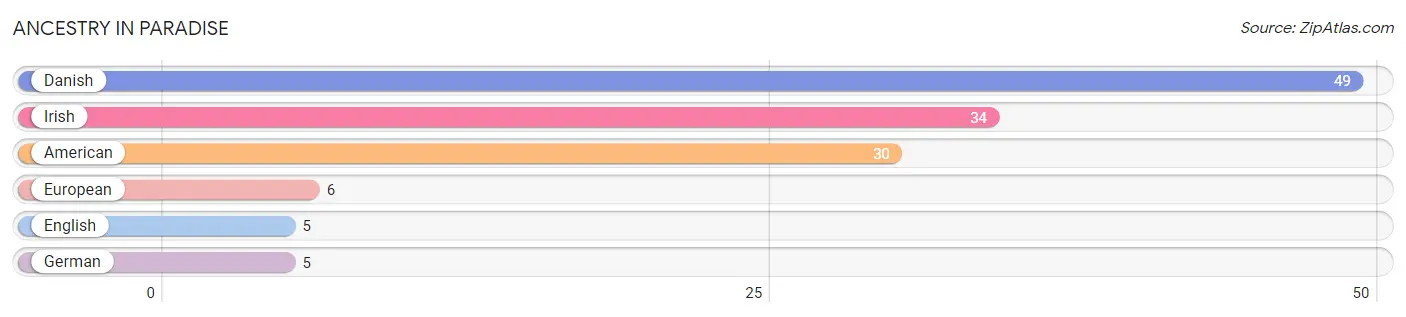
Ancestry in Paradise
The most populous ancestries reported in Paradise are Danish (49 | 38.0%), Irish (34 | 26.4%), American (30 | 23.3%), European (6 | 4.6%), and English (5 | 3.9%), together accounting for 96.1% of all Paradise residents.
| Ancestry | # Population | % Population |
| American | 30 | 23.3% |
| Danish | 49 | 38.0% |
| English | 5 | 3.9% |
| European | 6 | 4.6% |
| German | 5 | 3.9% |
| Irish | 34 | 26.4% | View All 6 Rows |
Immigrants in Paradise

| Immigration Origin | # Population | % Population | View All 0 Rows |
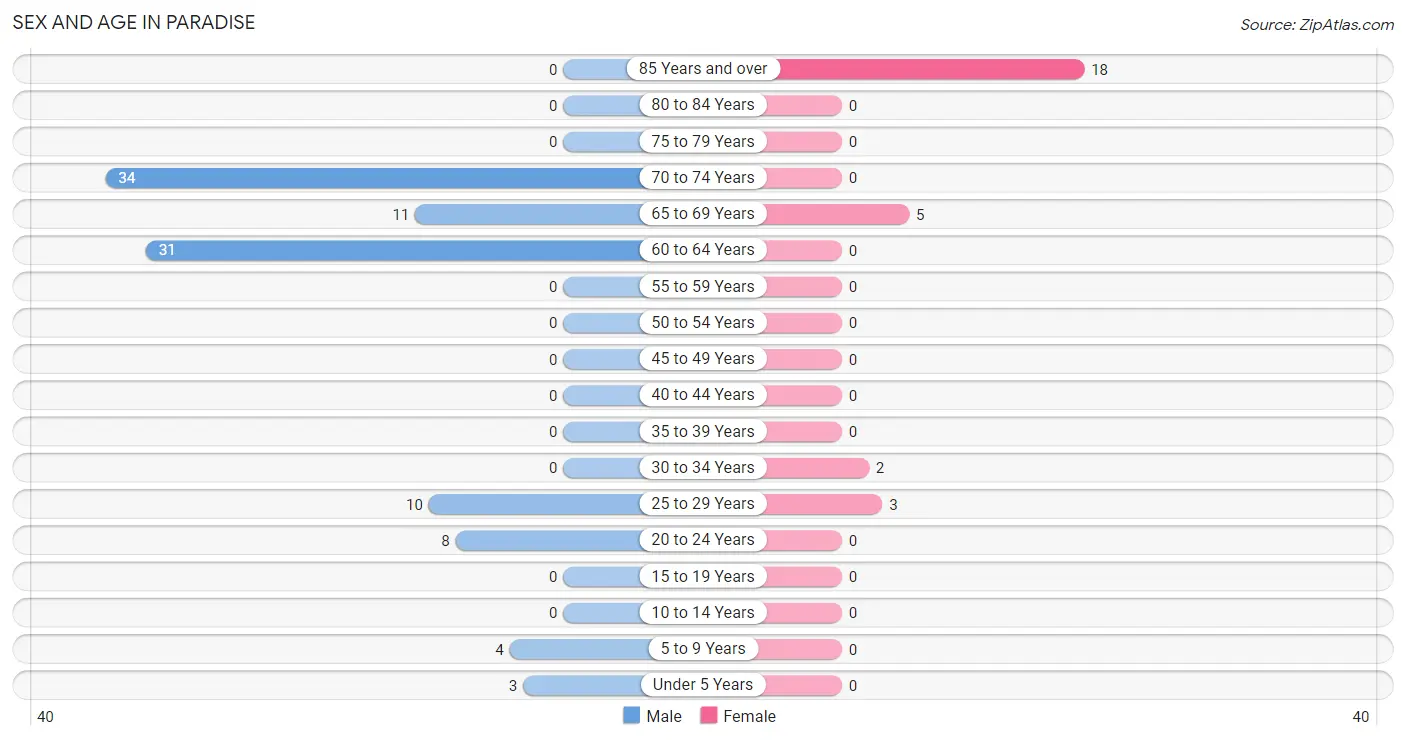
Sex and Age in Paradise
Sex and Age in Paradise
The most populous age groups in Paradise are 70 to 74 Years (34 | 33.7%) for men and 85 Years and over (18 | 64.3%) for women.
| Age Bracket | Male | Female |
| Under 5 Years | 3 (3.0%) | 0 (0.0%) |
| 5 to 9 Years | 4 (4.0%) | 0 (0.0%) |
| 10 to 14 Years | 0 (0.0%) | 0 (0.0%) |
| 15 to 19 Years | 0 (0.0%) | 0 (0.0%) |
| 20 to 24 Years | 8 (7.9%) | 0 (0.0%) |
| 25 to 29 Years | 10 (9.9%) | 3 (10.7%) |
| 30 to 34 Years | 0 (0.0%) | 2 (7.1%) |
| 35 to 39 Years | 0 (0.0%) | 0 (0.0%) |
| 40 to 44 Years | 0 (0.0%) | 0 (0.0%) |
| 45 to 49 Years | 0 (0.0%) | 0 (0.0%) |
| 50 to 54 Years | 0 (0.0%) | 0 (0.0%) |
| 55 to 59 Years | 0 (0.0%) | 0 (0.0%) |
| 60 to 64 Years | 31 (30.7%) | 0 (0.0%) |
| 65 to 69 Years | 11 (10.9%) | 5 (17.9%) |
| 70 to 74 Years | 34 (33.7%) | 0 (0.0%) |
| 75 to 79 Years | 0 (0.0%) | 0 (0.0%) |
| 80 to 84 Years | 0 (0.0%) | 0 (0.0%) |
| 85 Years and over | 0 (0.0%) | 18 (64.3%) |
| Total | 101 (100.0%) | 28 (100.0%) |
Families and Households in Paradise
Median Family Size in Paradise
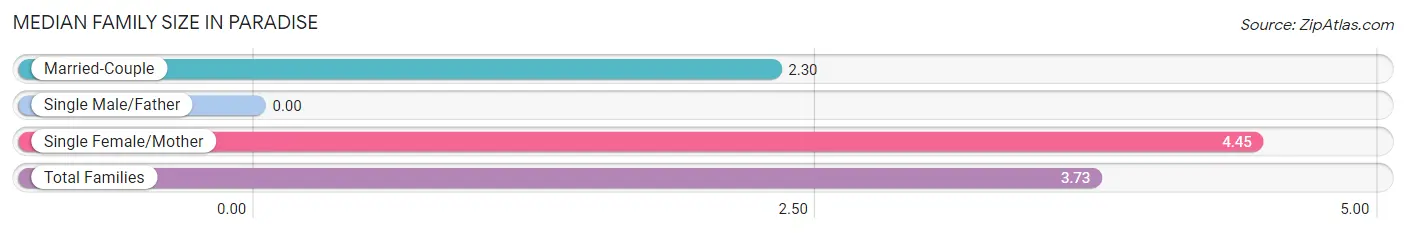
| Family Type | # Families | Family Size |
| Married-Couple | 10 (33.3%) | 2.30 |
| Single Male/Father | 0 (0.0%) | - |
| Single Female/Mother | 20 (66.7%) | 4.45 |
| Total Families | 30 (100.0%) | 3.73 |
Median Household Size in Paradise
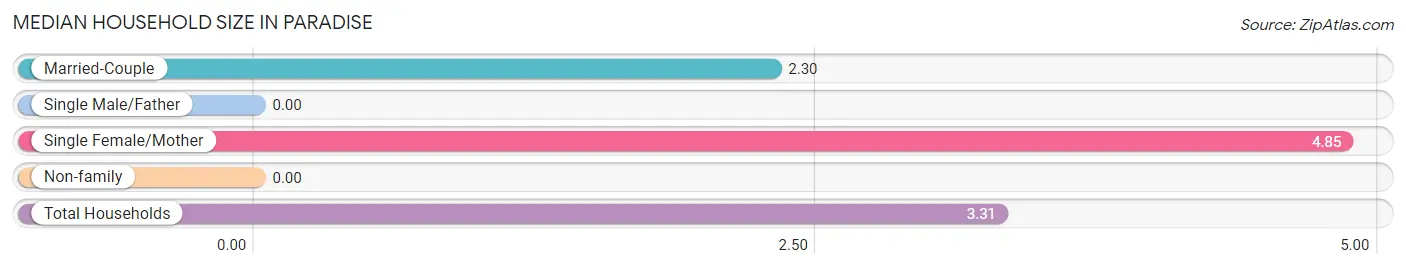
| Household Type | # Households | Household Size |
| Married-Couple | 10 (25.6%) | 2.30 |
| Single Male/Father | 0 (0.0%) | - |
| Single Female/Mother | 20 (51.3%) | 4.85 |
| Non-family | 9 (23.1%) | - |
| Total Households | 39 (100.0%) | 3.31 |
Household Size by Marriage Status in Paradise
Out of a total of 39 households in Paradise, 30 (76.9%) are family households, while 9 (23.1%) are nonfamily households. The most numerous type of family households are 3-person households, comprising 20, and the most common type of nonfamily households are 1-person households, comprising 9.

| Household Size | Family Households | Nonfamily Households |
| 1-Person Households | - | 9 (23.1%) |
| 2-Person Households | 0 (0.0%) | 0 (0.0%) |
| 3-Person Households | 20 (51.3%) | 0 (0.0%) |
| 4-Person Households | 10 (25.6%) | 0 (0.0%) |
| 5-Person Households | 0 (0.0%) | 0 (0.0%) |
| 6-Person Households | 0 (0.0%) | 0 (0.0%) |
| 7+ Person Households | 0 (0.0%) | 0 (0.0%) |
| Total | 30 (76.9%) | 9 (23.1%) |
Female Fertility in Paradise
Fertility by Age in Paradise
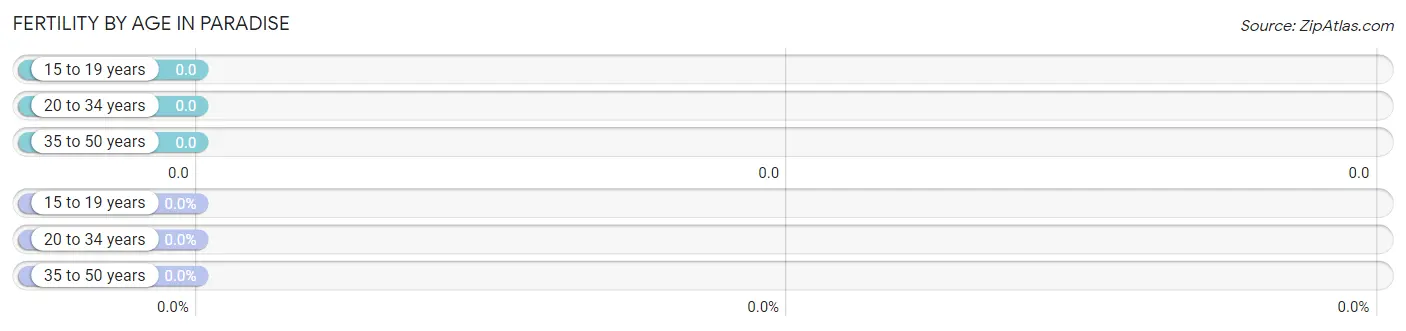
| Age Bracket | Women with Births | Births / 1,000 Women |
| 15 to 19 years | 0 (0.0%) | 0.0 |
| 20 to 34 years | 0 (0.0%) | 0.0 |
| 35 to 50 years | 0 (0.0%) | 0.0 |
| Total | 0 (0.0%) | 0.0 |
Fertility by Age by Marriage Status in Paradise
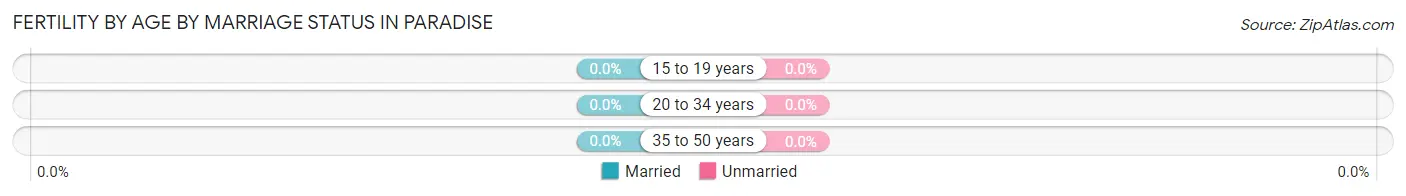
| Age Bracket | Married | Unmarried |
| 15 to 19 years | 0 (0.0%) | 0 (0.0%) |
| 20 to 34 years | 0 (0.0%) | 0 (0.0%) |
| 35 to 50 years | 0 (0.0%) | 0 (0.0%) |
| Total | 0 (0.0%) | 0 (0.0%) |
Fertility by Education in Paradise
| Educational Attainment | Women with Births | Births / 1,000 Women |
| Less than High School | 0 (0.0%) | 0.0 |
| High School Diploma | 0 (0.0%) | 0.0 |
| College or Associate's Degree | 0 (0.0%) | 0.0 |
| Bachelor's Degree | 0 (0.0%) | 0.0 |
| Graduate Degree | 0 (0.0%) | 0.0 |
| Total | 0 (0.0%) | 0.0 |
Fertility by Education by Marriage Status in Paradise
| Educational Attainment | Married | Unmarried |
| Less than High School | 0 (0.0%) | 0 (0.0%) |
| High School Diploma | 0 (0.0%) | 0 (0.0%) |
| College or Associate's Degree | 0 (0.0%) | 0 (0.0%) |
| Bachelor's Degree | 0 (0.0%) | 0 (0.0%) |
| Graduate Degree | 0 (0.0%) | 0 (0.0%) |
| Total | 0 (0.0%) | 0 (0.0%) |
Income in Paradise
Income Overview in Paradise
Per Capita Income in Paradise is $16,068, while median incomes of families and households are $41,806 and $42,431 respectively.
| Characteristic | Number | Measure |
| Per Capita Income | 129 | $16,068 |
| Median Family Income | 30 | $41,806 |
| Mean Family Income | 30 | $39,787 |
| Median Household Income | 39 | $42,431 |
| Mean Household Income | 39 | $46,159 |
| Income Deficit | 30 | $0 |
| Wage / Income Gap (%) | 129 | 0.00% |
| Wage / Income Gap ($) | 129 | 100.00¢ per $1 |
| Gini / Inequality Index | 129 | 0.16 |
Earnings by Sex in Paradise
| Sex | Number | Average Earnings |
| Male | 14 (73.7%) | $0 |
| Female | 5 (26.3%) | $0 |
| Total | 19 (100.0%) | $0 |
Earnings by Sex by Income Bracket in Paradise
The most common earnings brackets in Paradise are $22,500 to $24,999 for men (10 | 71.4%) and $20,000 to $22,499 for women (3 | 60.0%).
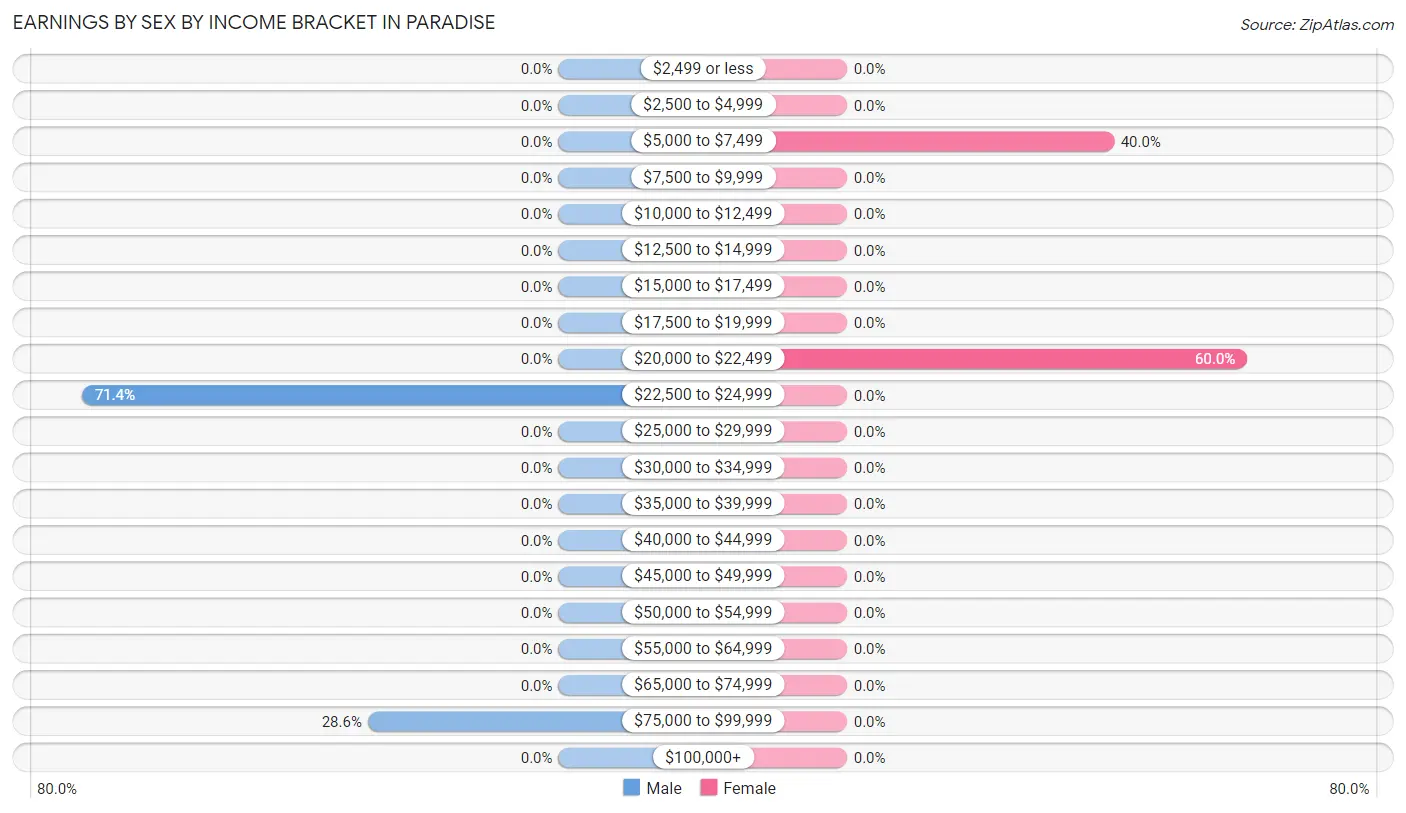
| Income | Male | Female |
| $2,499 or less | 0 (0.0%) | 0 (0.0%) |
| $2,500 to $4,999 | 0 (0.0%) | 0 (0.0%) |
| $5,000 to $7,499 | 0 (0.0%) | 2 (40.0%) |
| $7,500 to $9,999 | 0 (0.0%) | 0 (0.0%) |
| $10,000 to $12,499 | 0 (0.0%) | 0 (0.0%) |
| $12,500 to $14,999 | 0 (0.0%) | 0 (0.0%) |
| $15,000 to $17,499 | 0 (0.0%) | 0 (0.0%) |
| $17,500 to $19,999 | 0 (0.0%) | 0 (0.0%) |
| $20,000 to $22,499 | 0 (0.0%) | 3 (60.0%) |
| $22,500 to $24,999 | 10 (71.4%) | 0 (0.0%) |
| $25,000 to $29,999 | 0 (0.0%) | 0 (0.0%) |
| $30,000 to $34,999 | 0 (0.0%) | 0 (0.0%) |
| $35,000 to $39,999 | 0 (0.0%) | 0 (0.0%) |
| $40,000 to $44,999 | 0 (0.0%) | 0 (0.0%) |
| $45,000 to $49,999 | 0 (0.0%) | 0 (0.0%) |
| $50,000 to $54,999 | 0 (0.0%) | 0 (0.0%) |
| $55,000 to $64,999 | 0 (0.0%) | 0 (0.0%) |
| $65,000 to $74,999 | 0 (0.0%) | 0 (0.0%) |
| $75,000 to $99,999 | 4 (28.6%) | 0 (0.0%) |
| $100,000+ | 0 (0.0%) | 0 (0.0%) |
| Total | 14 (100.0%) | 5 (100.0%) |
Earnings by Sex by Educational Attainment in Paradise
| Educational Attainment | Male Income | Female Income |
| Less than High School | - | - |
| High School Diploma | - | - |
| College or Associate's Degree | - | - |
| Bachelor's Degree | - | - |
| Graduate Degree | - | - |
| Total | - | - |
Family Income in Paradise
Family Income Brackets in Paradise
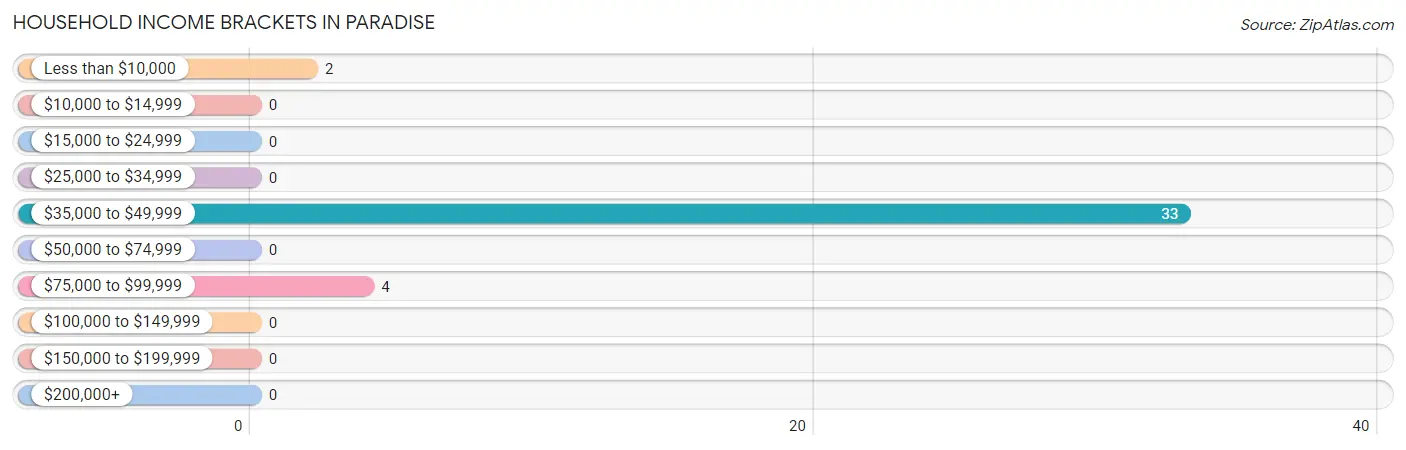
According to the Paradise family income data, there are 28 families falling into the $35,000 to $49,999 income range, which is the most common income bracket and makes up 93.3% of all families.
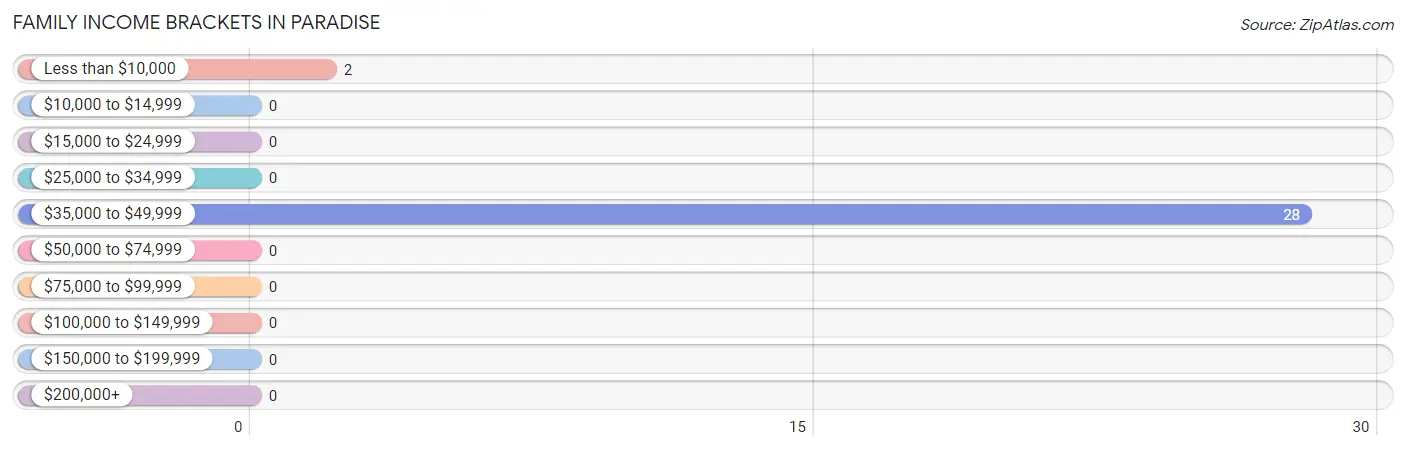
| Income Bracket | # Families | % Families |
| Less than $10,000 | 2 | 6.7% |
| $10,000 to $14,999 | 0 | 0.0% |
| $15,000 to $24,999 | 0 | 0.0% |
| $25,000 to $34,999 | 0 | 0.0% |
| $35,000 to $49,999 | 28 | 93.3% |
| $50,000 to $74,999 | 0 | 0.0% |
| $75,000 to $99,999 | 0 | 0.0% |
| $100,000 to $149,999 | 0 | 0.0% |
| $150,000 to $199,999 | 0 | 0.0% |
| $200,000+ | 0 | 0.0% |
Family Income by Famaliy Size in Paradise
| Income Bracket | # Families | Median Income |
| 2-Person Families | 2 (6.7%) | $0 |
| 3-Person Families | 18 (60.0%) | $0 |
| 4-Person Families | 10 (33.3%) | $0 |
| 5-Person Families | 0 (0.0%) | $0 |
| 6-Person Families | 0 (0.0%) | $0 |
| 7+ Person Families | 0 (0.0%) | $0 |
| Total | 30 (100.0%) | $41,806 |
Family Income by Number of Earners in Paradise
| Number of Earners | # Families | Median Income |
| No Earners | 18 (60.0%) | $0 |
| 1 Earner | 2 (6.7%) | $0 |
| 2 Earners | 10 (33.3%) | $0 |
| 3+ Earners | 0 (0.0%) | $0 |
| Total | 30 (100.0%) | $41,806 |
Household Income in Paradise
Household Income Brackets in Paradise
With 33 households falling in the category, the $35,000 to $49,999 income range is the most frequent in Paradise, accounting for 84.6% of all households.
| Income Bracket | # Households | % Households |
| Less than $10,000 | 2 | 5.1% |
| $10,000 to $14,999 | 0 | 0.0% |
| $15,000 to $24,999 | 0 | 0.0% |
| $25,000 to $34,999 | 0 | 0.0% |
| $35,000 to $49,999 | 33 | 84.6% |
| $50,000 to $74,999 | 0 | 0.0% |
| $75,000 to $99,999 | 4 | 10.3% |
| $100,000 to $149,999 | 0 | 0.0% |
| $150,000 to $199,999 | 0 | 0.0% |
| $200,000+ | 0 | 0.0% |
Household Income by Householder Age in Paradise
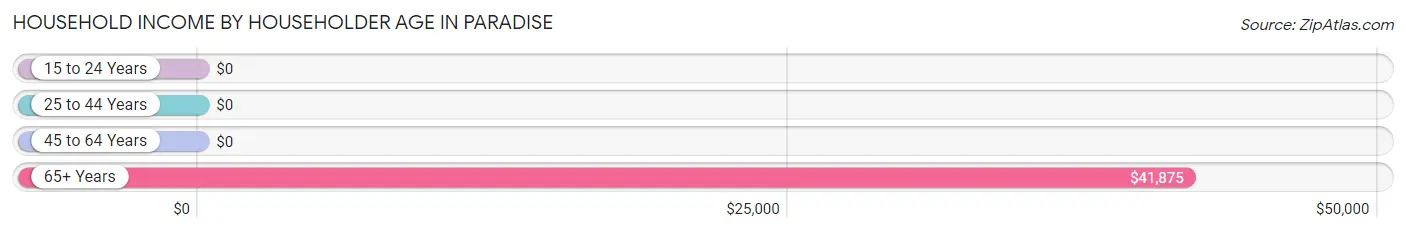
The median household income in Paradise is $42,431, with the highest median household income of $41,875 found in the 65+ years age bracket for the primary householder. A total of 27 households (69.2%) fall into this category.
| Income Bracket | # Households | Median Income |
| 15 to 24 Years | 0 (0.0%) | $0 |
| 25 to 44 Years | 12 (30.8%) | $0 |
| 45 to 64 Years | 0 (0.0%) | $0 |
| 65+ Years | 27 (69.2%) | $41,875 |
| Total | 39 (100.0%) | $42,431 |
Poverty in Paradise
Income Below Poverty by Sex and Age in Paradise
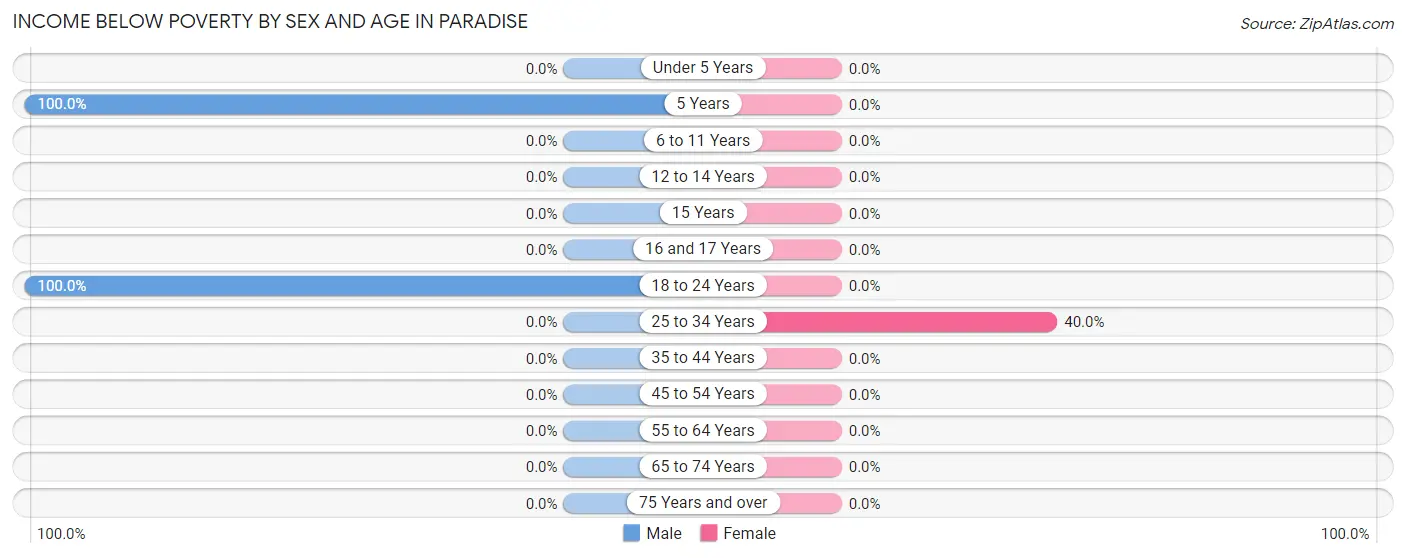
With 11.9% poverty level for males and 7.1% for females among the residents of Paradise, 5 year old males and 25 to 34 year old females are the most vulnerable to poverty, with 4 males (100.0%) and 2 females (40.0%) in their respective age groups living below the poverty level.
| Age Bracket | Male | Female |
| Under 5 Years | 0 (0.0%) | 0 (0.0%) |
| 5 Years | 4 (100.0%) | 0 (0.0%) |
| 6 to 11 Years | 0 (0.0%) | 0 (0.0%) |
| 12 to 14 Years | 0 (0.0%) | 0 (0.0%) |
| 15 Years | 0 (0.0%) | 0 (0.0%) |
| 16 and 17 Years | 0 (0.0%) | 0 (0.0%) |
| 18 to 24 Years | 8 (100.0%) | 0 (0.0%) |
| 25 to 34 Years | 0 (0.0%) | 2 (40.0%) |
| 35 to 44 Years | 0 (0.0%) | 0 (0.0%) |
| 45 to 54 Years | 0 (0.0%) | 0 (0.0%) |
| 55 to 64 Years | 0 (0.0%) | 0 (0.0%) |
| 65 to 74 Years | 0 (0.0%) | 0 (0.0%) |
| 75 Years and over | 0 (0.0%) | 0 (0.0%) |
| Total | 12 (11.9%) | 2 (7.1%) |
Income Above Poverty by Sex and Age in Paradise
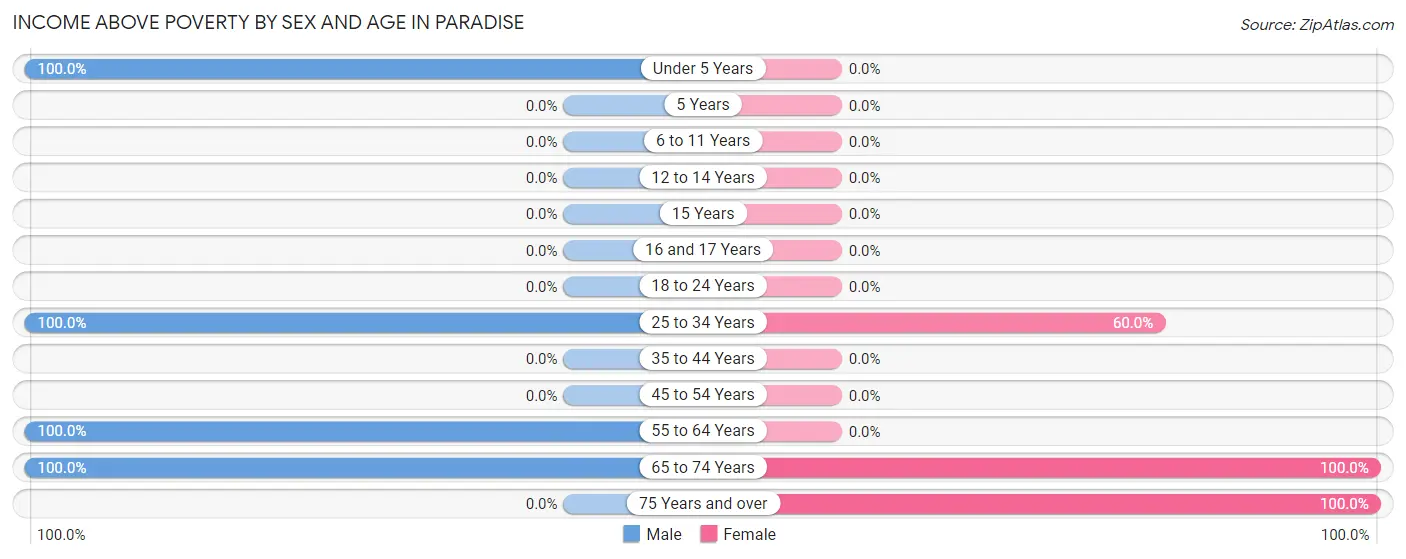
According to the poverty statistics in Paradise, males aged under 5 years and females aged 65 to 74 years are the age groups that are most secure financially, with 100.0% of males and 100.0% of females in these age groups living above the poverty line.
| Age Bracket | Male | Female |
| Under 5 Years | 3 (100.0%) | 0 (0.0%) |
| 5 Years | 0 (0.0%) | 0 (0.0%) |
| 6 to 11 Years | 0 (0.0%) | 0 (0.0%) |
| 12 to 14 Years | 0 (0.0%) | 0 (0.0%) |
| 15 Years | 0 (0.0%) | 0 (0.0%) |
| 16 and 17 Years | 0 (0.0%) | 0 (0.0%) |
| 18 to 24 Years | 0 (0.0%) | 0 (0.0%) |
| 25 to 34 Years | 10 (100.0%) | 3 (60.0%) |
| 35 to 44 Years | 0 (0.0%) | 0 (0.0%) |
| 45 to 54 Years | 0 (0.0%) | 0 (0.0%) |
| 55 to 64 Years | 31 (100.0%) | 0 (0.0%) |
| 65 to 74 Years | 45 (100.0%) | 5 (100.0%) |
| 75 Years and over | 0 (0.0%) | 18 (100.0%) |
| Total | 89 (88.1%) | 26 (92.9%) |
Income Below Poverty Among Married-Couple Families in Paradise
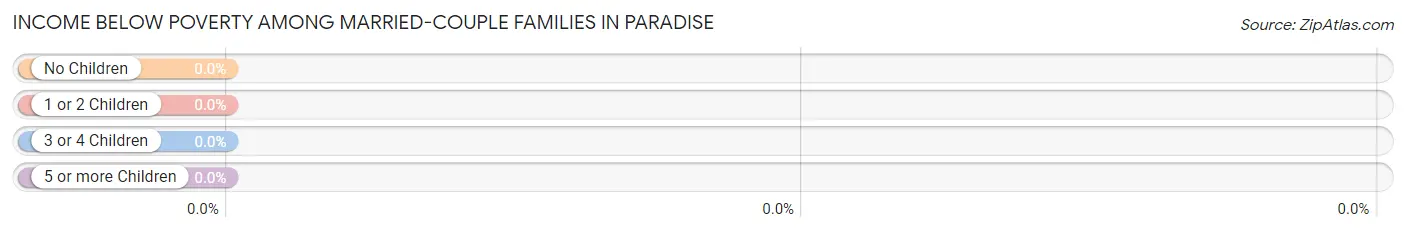
| Children | Above Poverty | Below Poverty |
| No Children | 0 (0.0%) | 0 (0.0%) |
| 1 or 2 Children | 10 (100.0%) | 0 (0.0%) |
| 3 or 4 Children | 0 (0.0%) | 0 (0.0%) |
| 5 or more Children | 0 (0.0%) | 0 (0.0%) |
| Total | 10 (100.0%) | 0 (0.0%) |
Income Below Poverty Among Single-Parent Households in Paradise
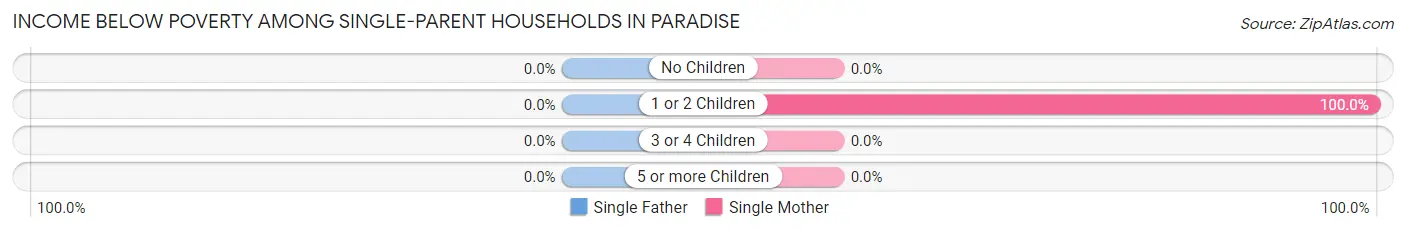
| Children | Single Father | Single Mother |
| No Children | 0 (0.0%) | 0 (0.0%) |
| 1 or 2 Children | 0 (0.0%) | 2 (100.0%) |
| 3 or 4 Children | 0 (0.0%) | 0 (0.0%) |
| 5 or more Children | 0 (0.0%) | 0 (0.0%) |
| Total | 0 (0.0%) | 2 (10.0%) |
Income Below Poverty Among Married-Couple vs Single-Parent Households in Paradise
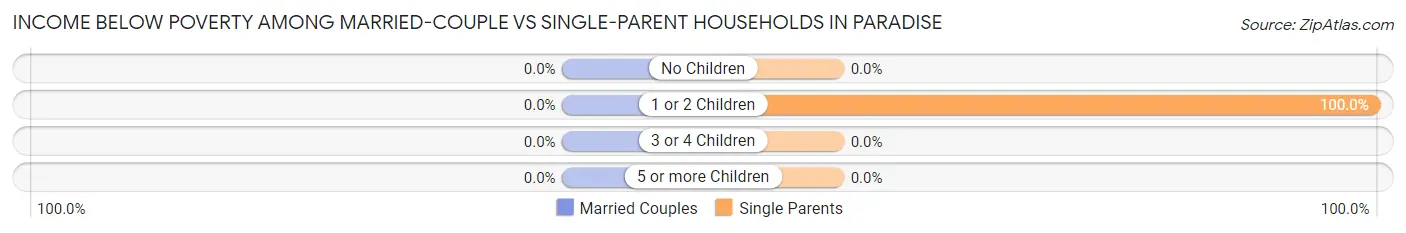
| Children | Married-Couple Families | Single-Parent Households |
| No Children | 0 (0.0%) | 0 (0.0%) |
| 1 or 2 Children | 0 (0.0%) | 2 (100.0%) |
| 3 or 4 Children | 0 (0.0%) | 0 (0.0%) |
| 5 or more Children | 0 (0.0%) | 0 (0.0%) |
| Total | 0 (0.0%) | 2 (10.0%) |
Employment Characteristics in Paradise
Employment by Class of Employer in Paradise
Among the 19 employed individuals in Paradise, , and private company employees (19 | 100.0%) make up the most common classes of employment.
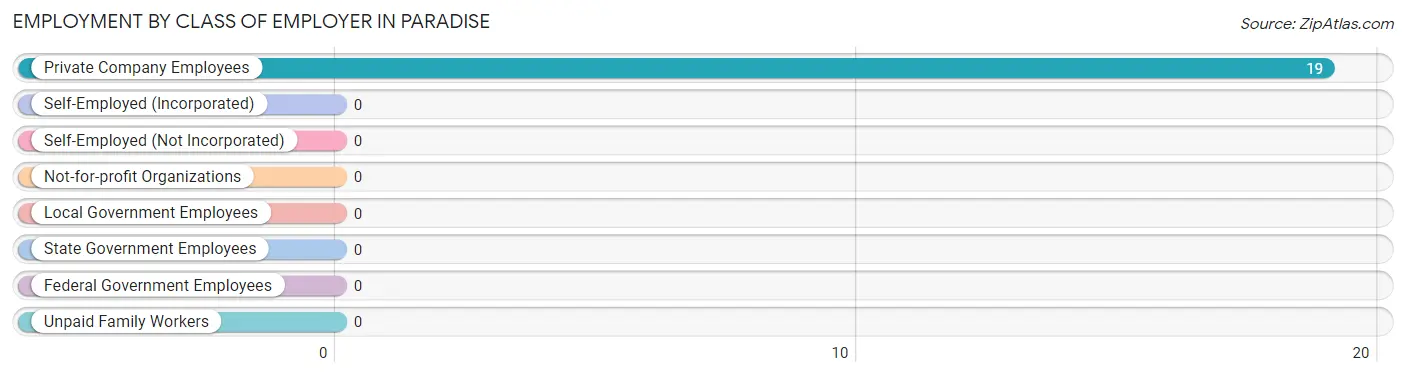
| Employer Class | # Employees | % Employees |
| Private Company Employees | 19 | 100.0% |
| Self-Employed (Incorporated) | 0 | 0.0% |
| Self-Employed (Not Incorporated) | 0 | 0.0% |
| Not-for-profit Organizations | 0 | 0.0% |
| Local Government Employees | 0 | 0.0% |
| State Government Employees | 0 | 0.0% |
| Federal Government Employees | 0 | 0.0% |
| Unpaid Family Workers | 0 | 0.0% |
| Total | 19 | 100.0% |
Employment Status by Age in Paradise
According to the labor force statistics for Paradise, out of the total population over 16 years of age (122), 22.1% or 27 individuals are in the labor force, with 29.6% or 8 of them unemployed. The age group with the highest labor force participation rate is 20 to 24 years, with 100.0% or 8 individuals in the labor force. Within the labor force, the 20 to 24 years age range has the highest percentage of unemployed individuals, with 100.0% or 8 of them being unemployed.
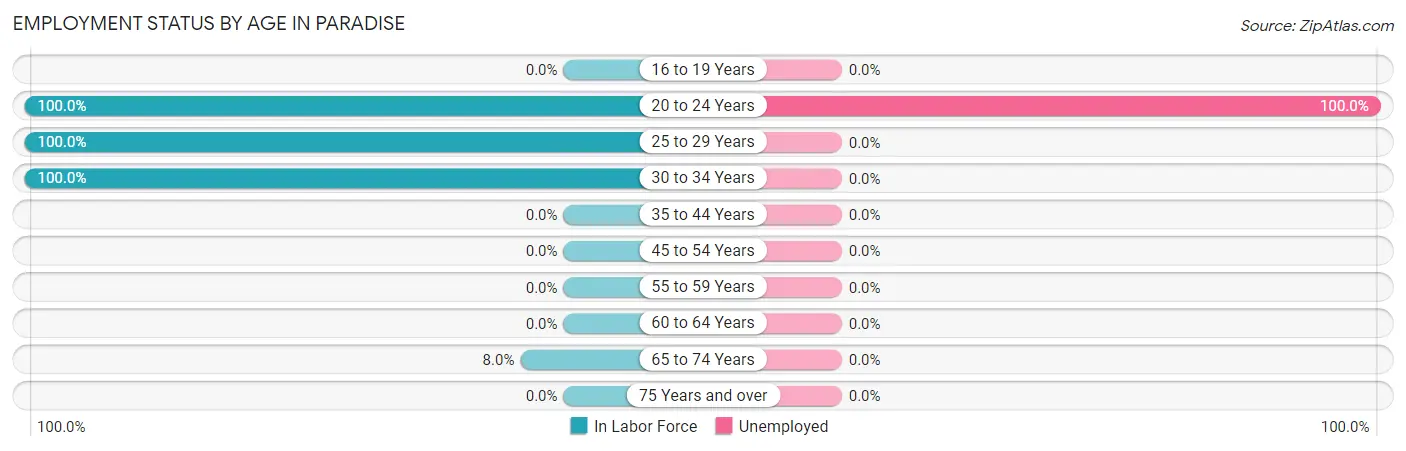
| Age Bracket | In Labor Force | Unemployed |
| 16 to 19 Years | 0 (0.0%) | 0 (0.0%) |
| 20 to 24 Years | 8 (100.0%) | 8 (100.0%) |
| 25 to 29 Years | 13 (100.0%) | 0 (0.0%) |
| 30 to 34 Years | 2 (100.0%) | 0 (0.0%) |
| 35 to 44 Years | 0 (0.0%) | 0 (0.0%) |
| 45 to 54 Years | 0 (0.0%) | 0 (0.0%) |
| 55 to 59 Years | 0 (0.0%) | 0 (0.0%) |
| 60 to 64 Years | 0 (0.0%) | 0 (0.0%) |
| 65 to 74 Years | 4 (8.0%) | 0 (0.0%) |
| 75 Years and over | 0 (0.0%) | 0 (0.0%) |
| Total | 27 (22.1%) | 8 (29.6%) |
Employment Status by Educational Attainment in Paradise
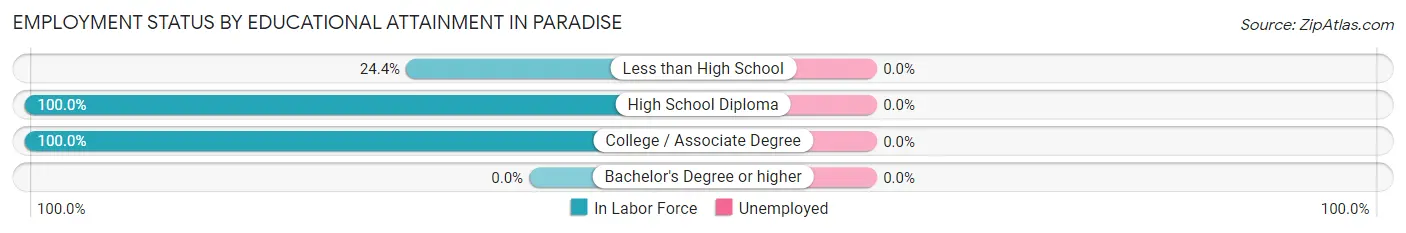
| Educational Attainment | In Labor Force | Unemployed |
| Less than High School | 10 (24.4%) | 0 (0.0%) |
| High School Diploma | 3 (100.0%) | 0 (0.0%) |
| College / Associate Degree | 2 (100.0%) | 0 (0.0%) |
| Bachelor's Degree or higher | 0 (0.0%) | 0 (0.0%) |
| Total | 15 (32.6%) | 0 (0.0%) |
Employment Occupations by Sex in Paradise
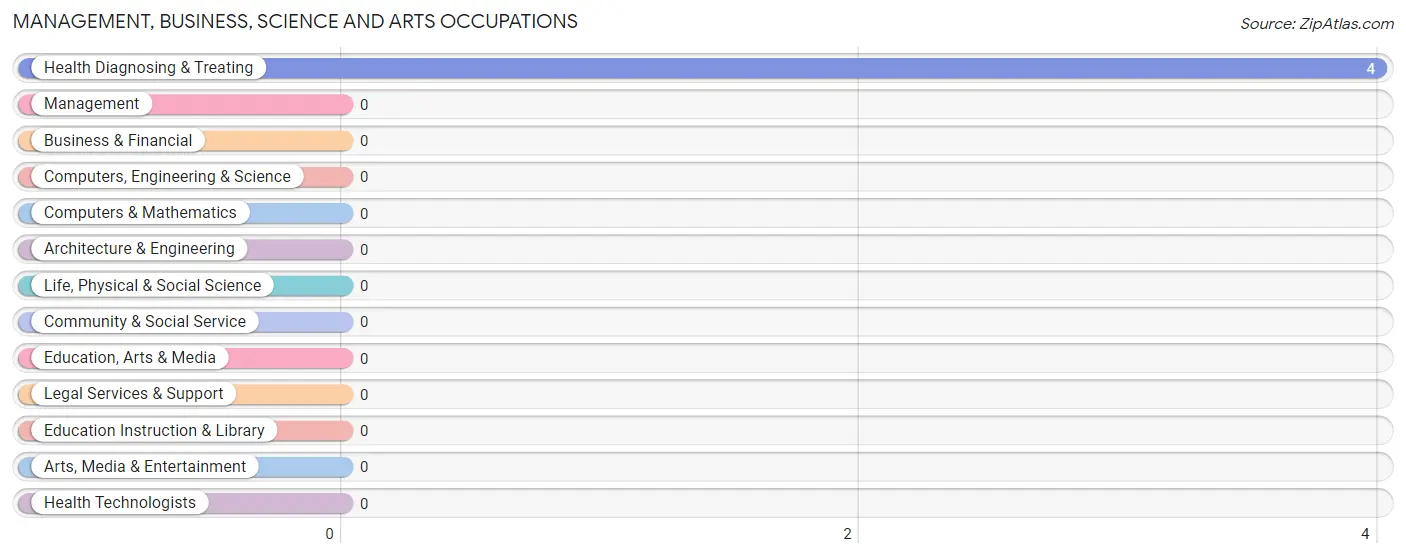
Management, Business, Science and Arts Occupations
The most common Management, Business, Science and Arts occupations in Paradise are , and Health Diagnosing & Treating (4 | 21.0%).
Management, Business, Science and Arts Occupations by Sex
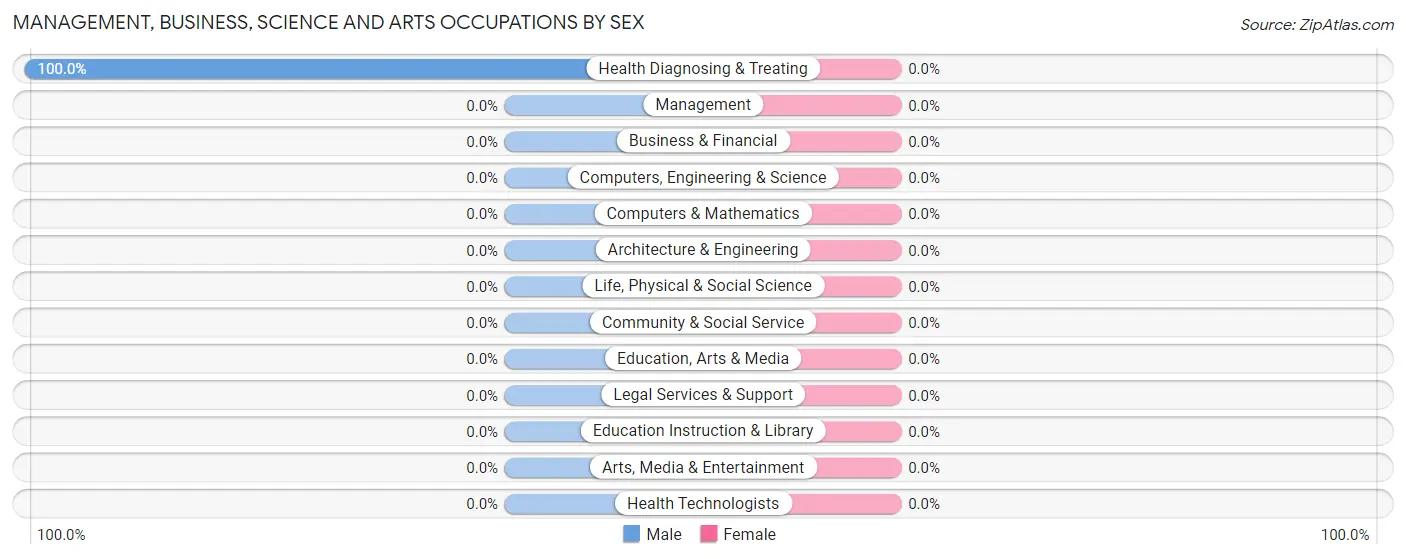
| Occupation | Male | Female |
| Management | 0 (0.0%) | 0 (0.0%) |
| Business & Financial | 0 (0.0%) | 0 (0.0%) |
| Computers, Engineering & Science | 0 (0.0%) | 0 (0.0%) |
| Computers & Mathematics | 0 (0.0%) | 0 (0.0%) |
| Architecture & Engineering | 0 (0.0%) | 0 (0.0%) |
| Life, Physical & Social Science | 0 (0.0%) | 0 (0.0%) |
| Community & Social Service | 0 (0.0%) | 0 (0.0%) |
| Education, Arts & Media | 0 (0.0%) | 0 (0.0%) |
| Legal Services & Support | 0 (0.0%) | 0 (0.0%) |
| Education Instruction & Library | 0 (0.0%) | 0 (0.0%) |
| Arts, Media & Entertainment | 0 (0.0%) | 0 (0.0%) |
| Health Diagnosing & Treating | 4 (100.0%) | 0 (0.0%) |
| Health Technologists | 0 (0.0%) | 0 (0.0%) |
| Total (Category) | 4 (100.0%) | 0 (0.0%) |
| Total (Overall) | 14 (73.7%) | 5 (26.3%) |
Services Occupations
The most common Services occupations in Paradise are Cleaning & Maintenance (13 | 68.4%), and Food Preparation & Serving (2 | 10.5%).
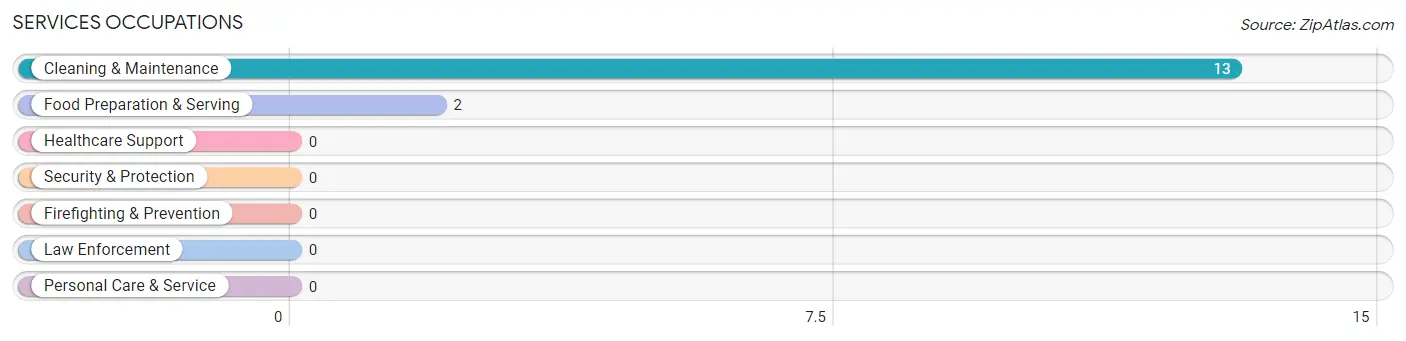
Services Occupations by Sex
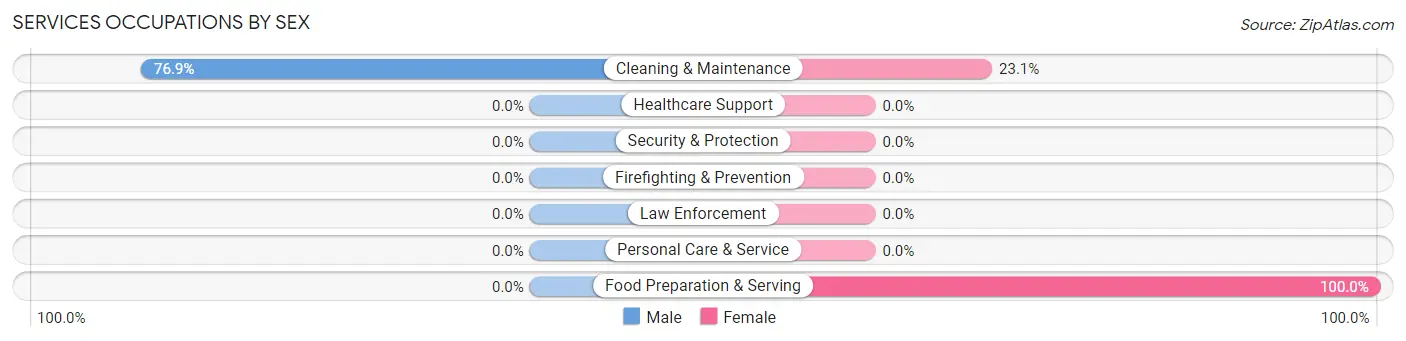
| Occupation | Male | Female |
| Healthcare Support | 0 (0.0%) | 0 (0.0%) |
| Security & Protection | 0 (0.0%) | 0 (0.0%) |
| Firefighting & Prevention | 0 (0.0%) | 0 (0.0%) |
| Law Enforcement | 0 (0.0%) | 0 (0.0%) |
| Food Preparation & Serving | 0 (0.0%) | 2 (100.0%) |
| Cleaning & Maintenance | 10 (76.9%) | 3 (23.1%) |
| Personal Care & Service | 0 (0.0%) | 0 (0.0%) |
| Total (Category) | 10 (66.7%) | 5 (33.3%) |
| Total (Overall) | 14 (73.7%) | 5 (26.3%) |
Sales and Office Occupations
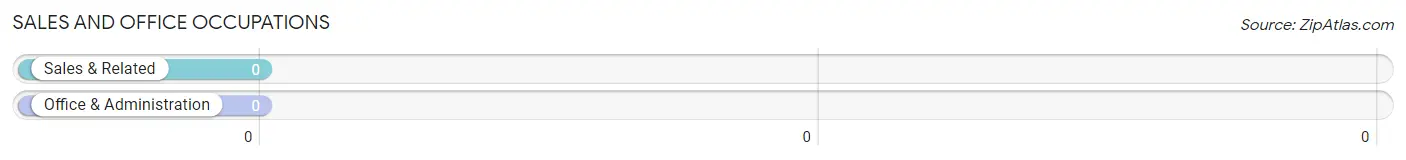
Sales and Office Occupations by Sex

| Occupation | Male | Female |
| Sales & Related | 0 (0.0%) | 0 (0.0%) |
| Office & Administration | 0 (0.0%) | 0 (0.0%) |
| Total (Category) | 0 (0.0%) | 0 (0.0%) |
| Total (Overall) | 14 (73.7%) | 5 (26.3%) |
Natural Resources, Construction and Maintenance Occupations
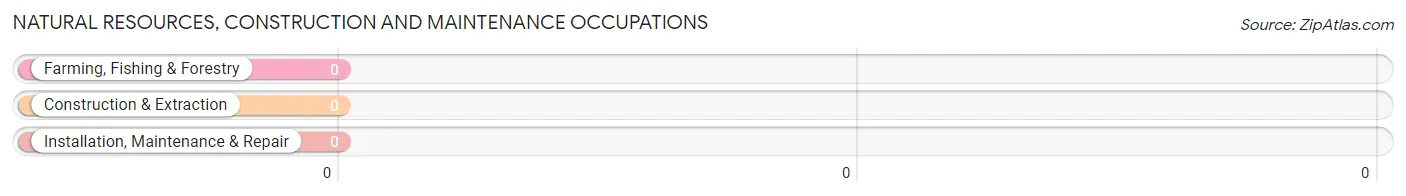
Natural Resources, Construction and Maintenance Occupations by Sex
| Occupation | Male | Female |
| Farming, Fishing & Forestry | 0 (0.0%) | 0 (0.0%) |
| Construction & Extraction | 0 (0.0%) | 0 (0.0%) |
| Installation, Maintenance & Repair | 0 (0.0%) | 0 (0.0%) |
| Total (Category) | 0 (0.0%) | 0 (0.0%) |
| Total (Overall) | 14 (73.7%) | 5 (26.3%) |
Production, Transportation and Moving Occupations
Production, Transportation and Moving Occupations by Sex
| Occupation | Male | Female |
| Production | 0 (0.0%) | 0 (0.0%) |
| Transportation | 0 (0.0%) | 0 (0.0%) |
| Material Moving | 0 (0.0%) | 0 (0.0%) |
| Total (Category) | 0 (0.0%) | 0 (0.0%) |
| Total (Overall) | 14 (73.7%) | 5 (26.3%) |
Employment Industries by Sex in Paradise
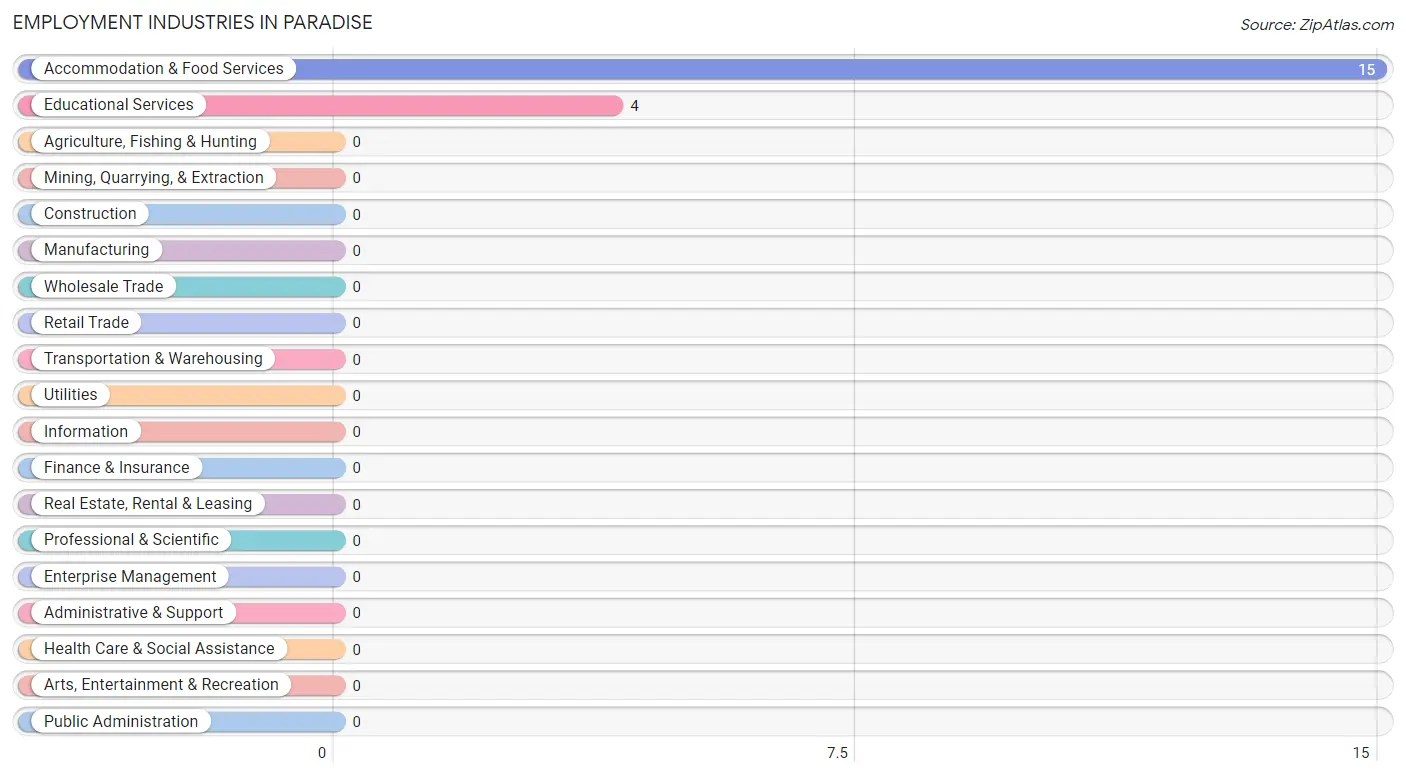
Employment Industries in Paradise
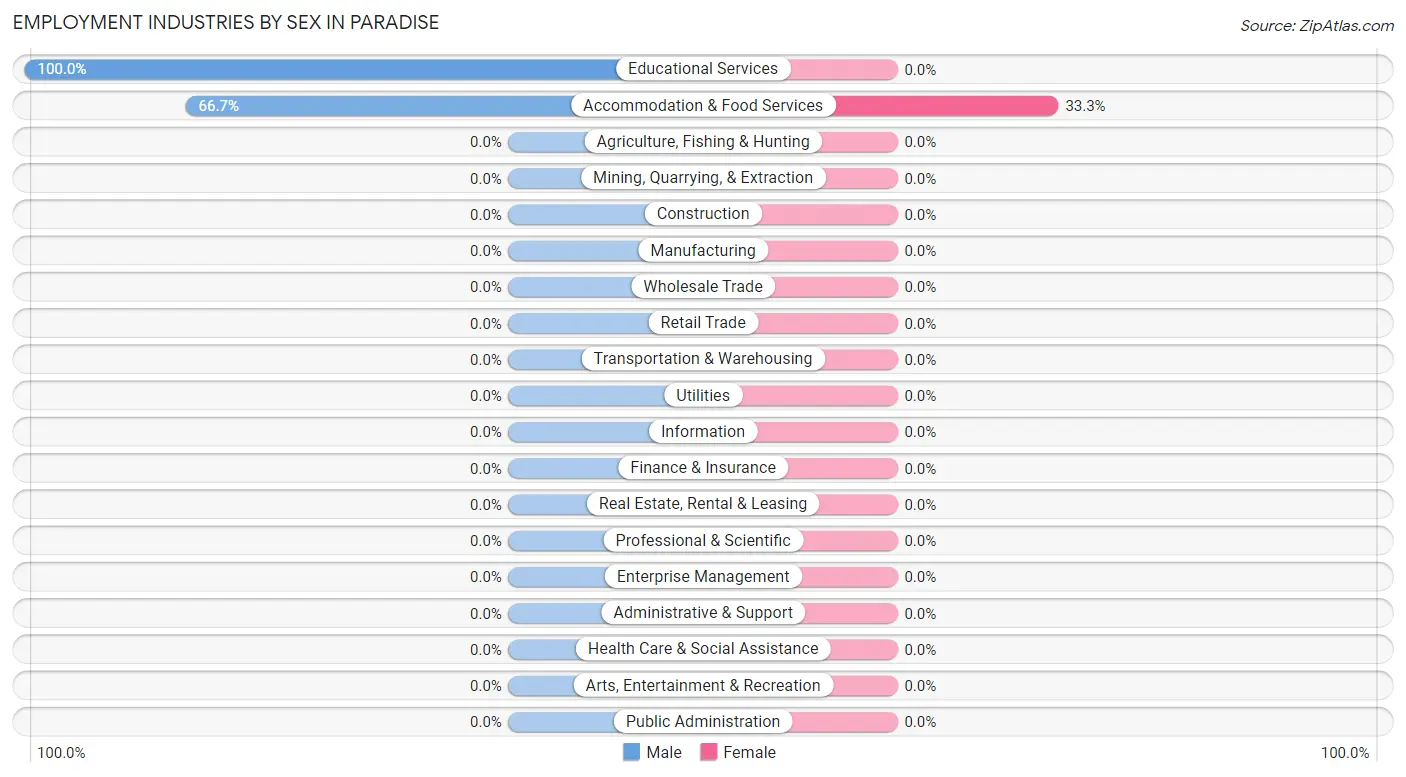
The major employment industries in Paradise include Accommodation & Food Services (15 | 78.9%), and Educational Services (4 | 21.0%).
Employment Industries by Sex in Paradise
| Industry | Male | Female |
| Agriculture, Fishing & Hunting | 0 (0.0%) | 0 (0.0%) |
| Mining, Quarrying, & Extraction | 0 (0.0%) | 0 (0.0%) |
| Construction | 0 (0.0%) | 0 (0.0%) |
| Manufacturing | 0 (0.0%) | 0 (0.0%) |
| Wholesale Trade | 0 (0.0%) | 0 (0.0%) |
| Retail Trade | 0 (0.0%) | 0 (0.0%) |
| Transportation & Warehousing | 0 (0.0%) | 0 (0.0%) |
| Utilities | 0 (0.0%) | 0 (0.0%) |
| Information | 0 (0.0%) | 0 (0.0%) |
| Finance & Insurance | 0 (0.0%) | 0 (0.0%) |
| Real Estate, Rental & Leasing | 0 (0.0%) | 0 (0.0%) |
| Professional & Scientific | 0 (0.0%) | 0 (0.0%) |
| Enterprise Management | 0 (0.0%) | 0 (0.0%) |
| Administrative & Support | 0 (0.0%) | 0 (0.0%) |
| Educational Services | 4 (100.0%) | 0 (0.0%) |
| Health Care & Social Assistance | 0 (0.0%) | 0 (0.0%) |
| Arts, Entertainment & Recreation | 0 (0.0%) | 0 (0.0%) |
| Accommodation & Food Services | 10 (66.7%) | 5 (33.3%) |
| Public Administration | 0 (0.0%) | 0 (0.0%) |
| Total | 14 (73.7%) | 5 (26.3%) |
Education in Paradise
School Enrollment in Paradise
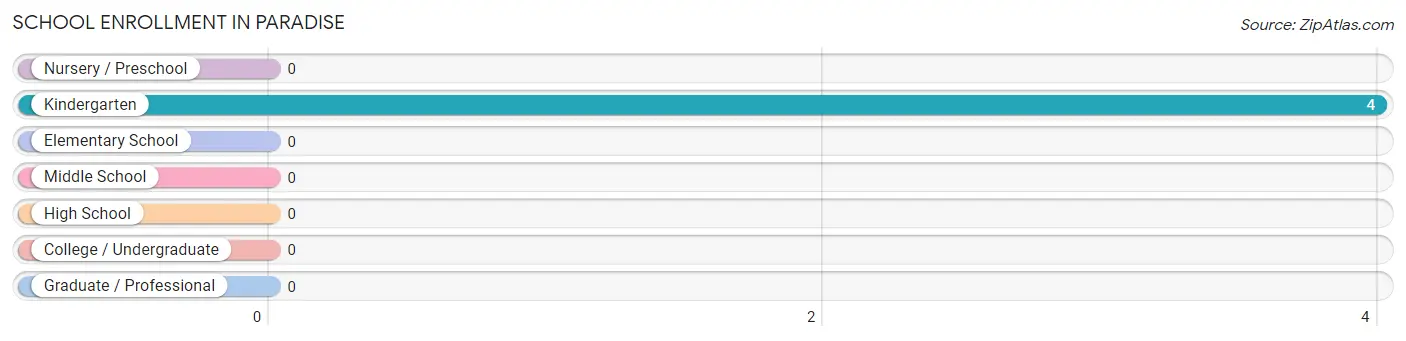
| School Level | # Students | % Students |
| Nursery / Preschool | 0 | 0.0% |
| Kindergarten | 4 | 100.0% |
| Elementary School | 0 | 0.0% |
| Middle School | 0 | 0.0% |
| High School | 0 | 0.0% |
| College / Undergraduate | 0 | 0.0% |
| Graduate / Professional | 0 | 0.0% |
| Total | 4 | 100.0% |
School Enrollment by Age by Funding Source in Paradise
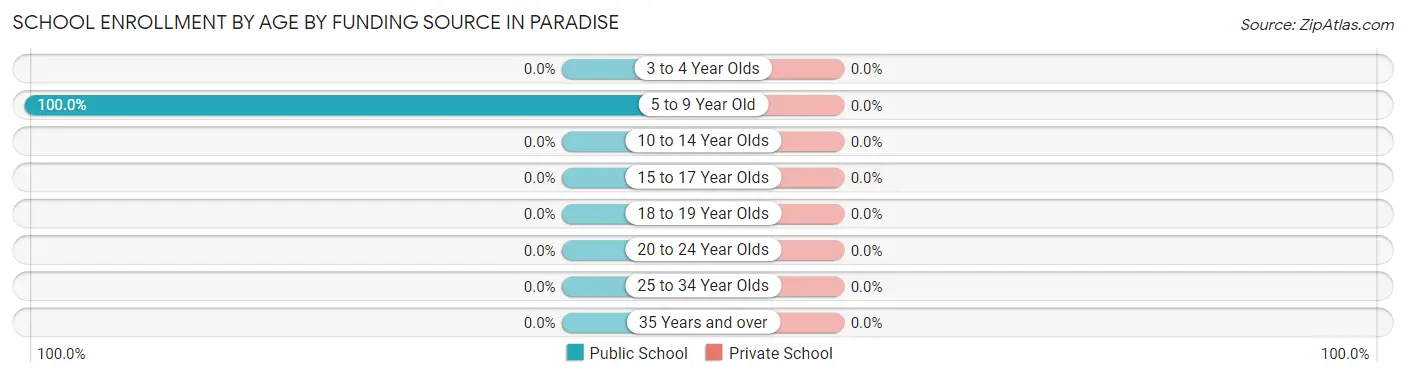
| Age Bracket | Public School | Private School |
| 3 to 4 Year Olds | 0 (0.0%) | 0 (0.0%) |
| 5 to 9 Year Old | 4 (100.0%) | 0 (0.0%) |
| 10 to 14 Year Olds | 0 (0.0%) | 0 (0.0%) |
| 15 to 17 Year Olds | 0 (0.0%) | 0 (0.0%) |
| 18 to 19 Year Olds | 0 (0.0%) | 0 (0.0%) |
| 20 to 24 Year Olds | 0 (0.0%) | 0 (0.0%) |
| 25 to 34 Year Olds | 0 (0.0%) | 0 (0.0%) |
| 35 Years and over | 0 (0.0%) | 0 (0.0%) |
| Total | 4 (100.0%) | 0 (0.0%) |
Educational Attainment by Field of Study in Paradise
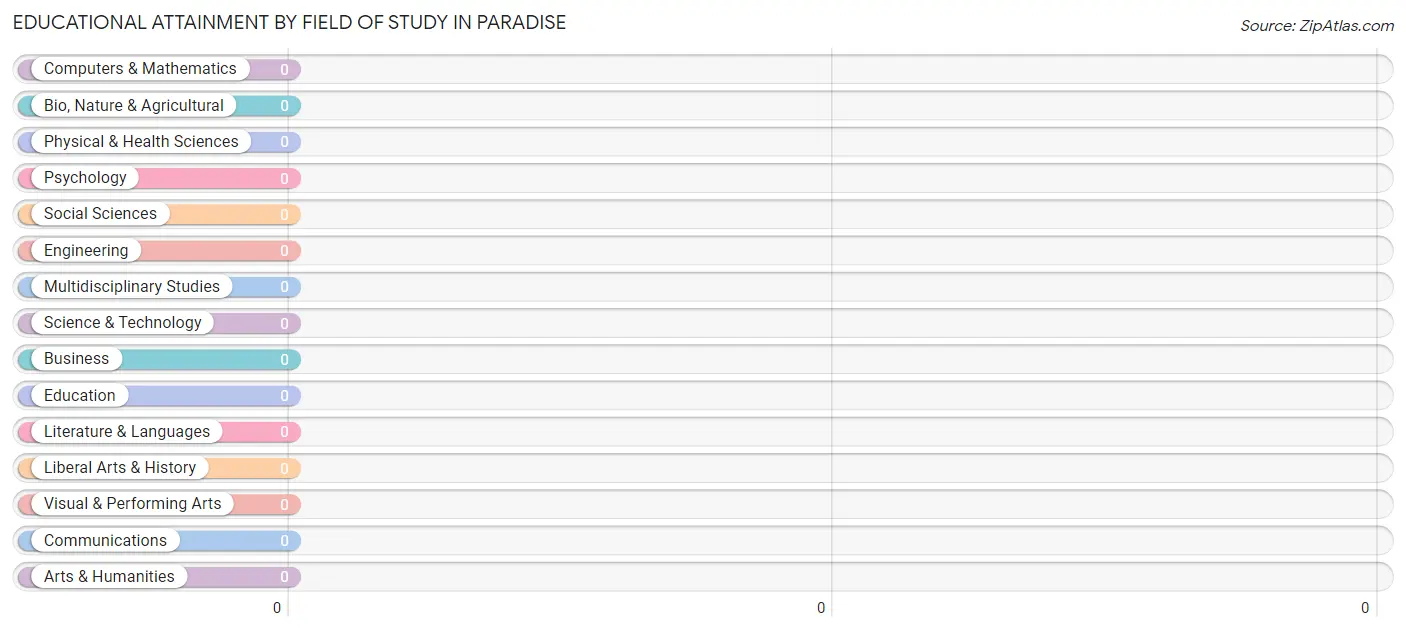
| Field of Study | # Graduates | % Graduates |
| Computers & Mathematics | 0 | 0.0% |
| Bio, Nature & Agricultural | 0 | 0.0% |
| Physical & Health Sciences | 0 | 0.0% |
| Psychology | 0 | 0.0% |
| Social Sciences | 0 | 0.0% |
| Engineering | 0 | 0.0% |
| Multidisciplinary Studies | 0 | 0.0% |
| Science & Technology | 0 | 0.0% |
| Business | 0 | 0.0% |
| Education | 0 | 0.0% |
| Literature & Languages | 0 | 0.0% |
| Liberal Arts & History | 0 | 0.0% |
| Visual & Performing Arts | 0 | 0.0% |
| Communications | 0 | 0.0% |
| Arts & Humanities | 0 | 0.0% |
| Total | 0 | 0.0% |
Transportation & Commute in Paradise
Vehicle Availability by Sex in Paradise
The most prevalent vehicle ownership categories in Paradise are males with 2 vehicles (10, accounting for 71.4%) and females with 2 vehicles (5, making up 200.0%).
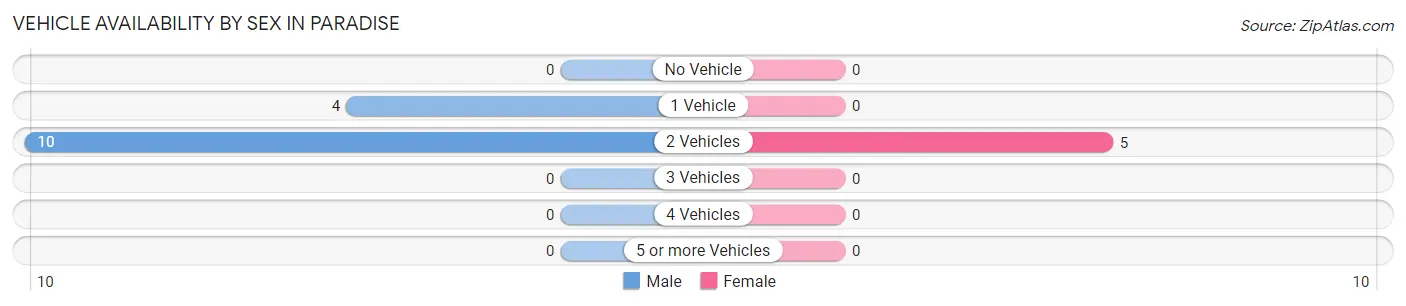
| Vehicles Available | Male | Female |
| No Vehicle | 0 (0.0%) | 0 (0.0%) |
| 1 Vehicle | 4 (28.6%) | 0 (0.0%) |
| 2 Vehicles | 10 (71.4%) | 5 (100.0%) |
| 3 Vehicles | 0 (0.0%) | 0 (0.0%) |
| 4 Vehicles | 0 (0.0%) | 0 (0.0%) |
| 5 or more Vehicles | 0 (0.0%) | 0 (0.0%) |
| Total | 14 (100.0%) | 5 (100.0%) |
Commute Time in Paradise
The most frequently occuring commute durations in Paradise are 10 to 14 minutes (19 commuters, 100.0%), less than 5 minutes (0 commuters, 0.0%), and 5 to 9 minutes (0 commuters, 0.0%).
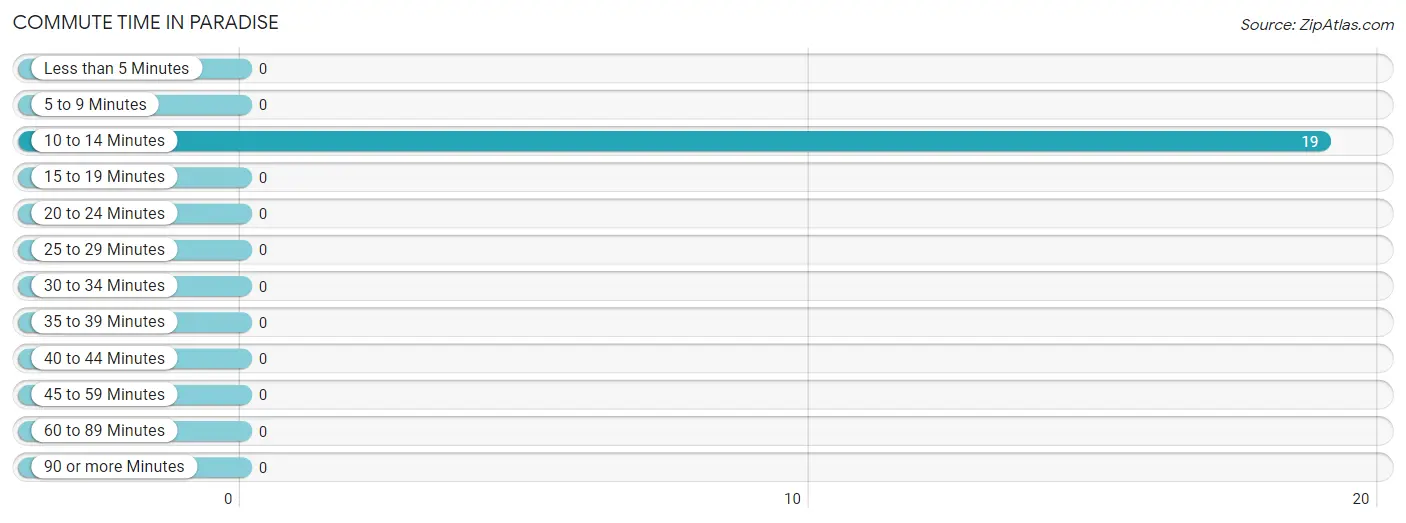
| Commute Time | # Commuters | % Commuters |
| Less than 5 Minutes | 0 | 0.0% |
| 5 to 9 Minutes | 0 | 0.0% |
| 10 to 14 Minutes | 19 | 100.0% |
| 15 to 19 Minutes | 0 | 0.0% |
| 20 to 24 Minutes | 0 | 0.0% |
| 25 to 29 Minutes | 0 | 0.0% |
| 30 to 34 Minutes | 0 | 0.0% |
| 35 to 39 Minutes | 0 | 0.0% |
| 40 to 44 Minutes | 0 | 0.0% |
| 45 to 59 Minutes | 0 | 0.0% |
| 60 to 89 Minutes | 0 | 0.0% |
| 90 or more Minutes | 0 | 0.0% |
Commute Time by Sex in Paradise
The most common commute times in Paradise are 10 to 14 minutes (14 commuters, 100.0%) for males and 10 to 14 minutes (5 commuters, 100.0%) for females.
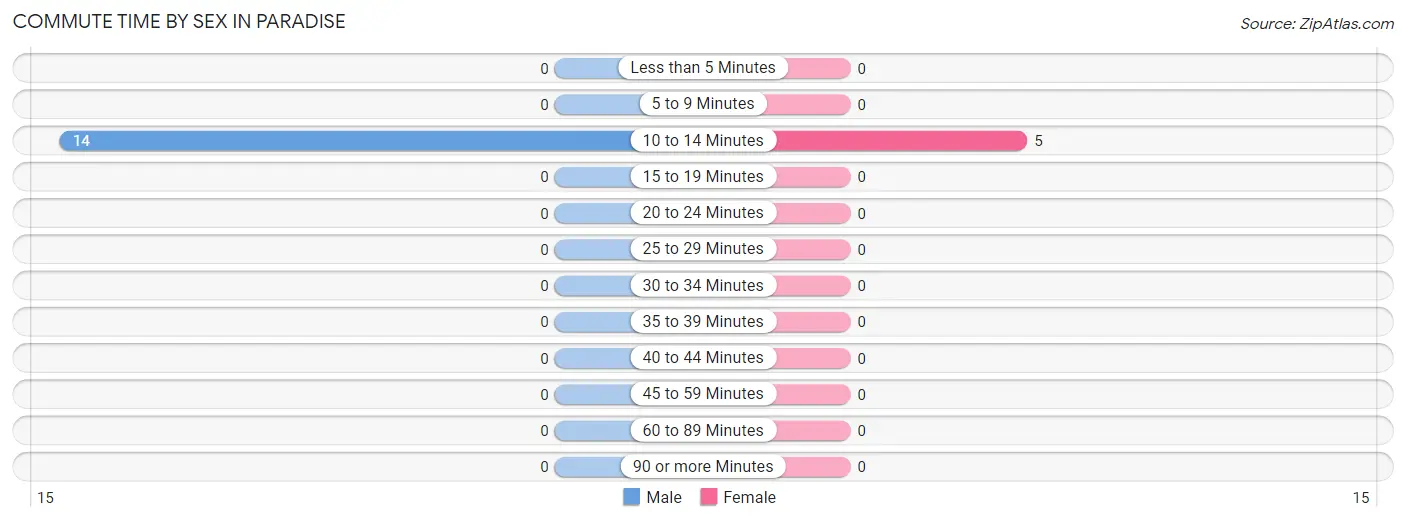
| Commute Time | Male | Female |
| Less than 5 Minutes | 0 (0.0%) | 0 (0.0%) |
| 5 to 9 Minutes | 0 (0.0%) | 0 (0.0%) |
| 10 to 14 Minutes | 14 (100.0%) | 5 (100.0%) |
| 15 to 19 Minutes | 0 (0.0%) | 0 (0.0%) |
| 20 to 24 Minutes | 0 (0.0%) | 0 (0.0%) |
| 25 to 29 Minutes | 0 (0.0%) | 0 (0.0%) |
| 30 to 34 Minutes | 0 (0.0%) | 0 (0.0%) |
| 35 to 39 Minutes | 0 (0.0%) | 0 (0.0%) |
| 40 to 44 Minutes | 0 (0.0%) | 0 (0.0%) |
| 45 to 59 Minutes | 0 (0.0%) | 0 (0.0%) |
| 60 to 89 Minutes | 0 (0.0%) | 0 (0.0%) |
| 90 or more Minutes | 0 (0.0%) | 0 (0.0%) |
Time of Departure to Work by Sex in Paradise
The most frequent times of departure to work in Paradise are 9:00 AM to 9:59 AM (14, 100.0%) for males and 9:00 AM to 9:59 AM (3, 60.0%) for females.
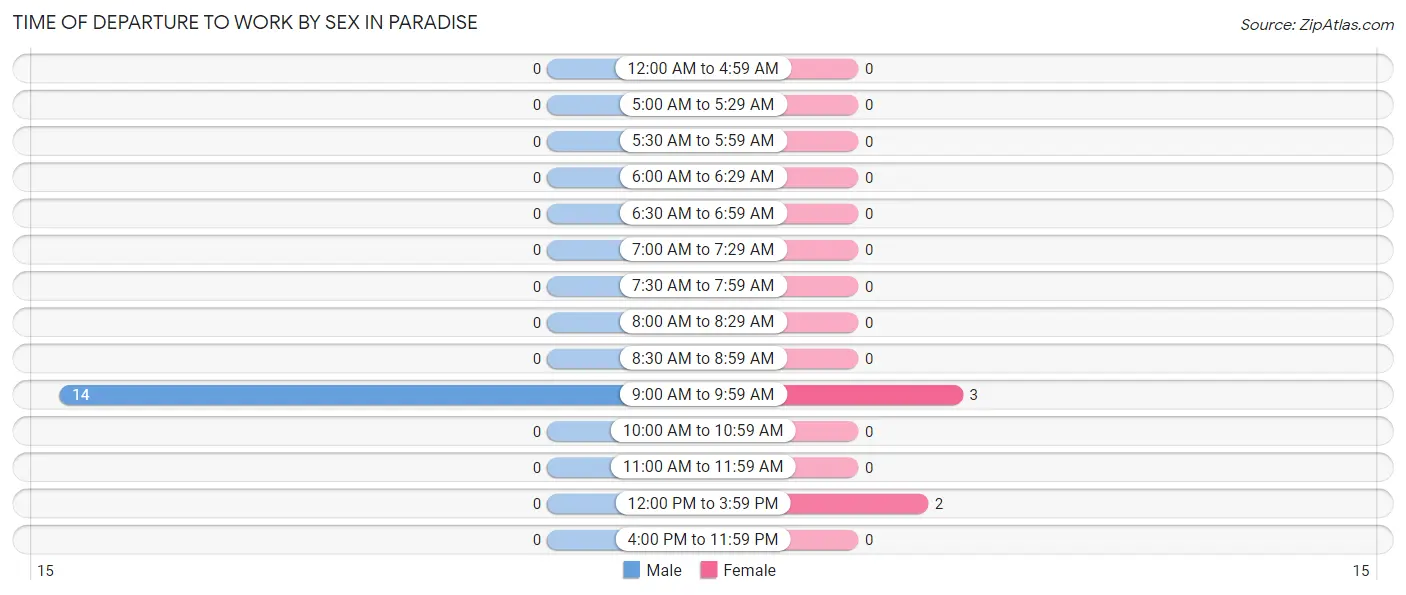
| Time of Departure | Male | Female |
| 12:00 AM to 4:59 AM | 0 (0.0%) | 0 (0.0%) |
| 5:00 AM to 5:29 AM | 0 (0.0%) | 0 (0.0%) |
| 5:30 AM to 5:59 AM | 0 (0.0%) | 0 (0.0%) |
| 6:00 AM to 6:29 AM | 0 (0.0%) | 0 (0.0%) |
| 6:30 AM to 6:59 AM | 0 (0.0%) | 0 (0.0%) |
| 7:00 AM to 7:29 AM | 0 (0.0%) | 0 (0.0%) |
| 7:30 AM to 7:59 AM | 0 (0.0%) | 0 (0.0%) |
| 8:00 AM to 8:29 AM | 0 (0.0%) | 0 (0.0%) |
| 8:30 AM to 8:59 AM | 0 (0.0%) | 0 (0.0%) |
| 9:00 AM to 9:59 AM | 14 (100.0%) | 3 (60.0%) |
| 10:00 AM to 10:59 AM | 0 (0.0%) | 0 (0.0%) |
| 11:00 AM to 11:59 AM | 0 (0.0%) | 0 (0.0%) |
| 12:00 PM to 3:59 PM | 0 (0.0%) | 2 (40.0%) |
| 4:00 PM to 11:59 PM | 0 (0.0%) | 0 (0.0%) |
| Total | 14 (100.0%) | 5 (100.0%) |
Housing Occupancy in Paradise
Occupancy by Ownership in Paradise
Of the total 39 dwellings in Paradise, owner-occupied units account for 33 (84.6%), while renter-occupied units make up 6 (15.4%).
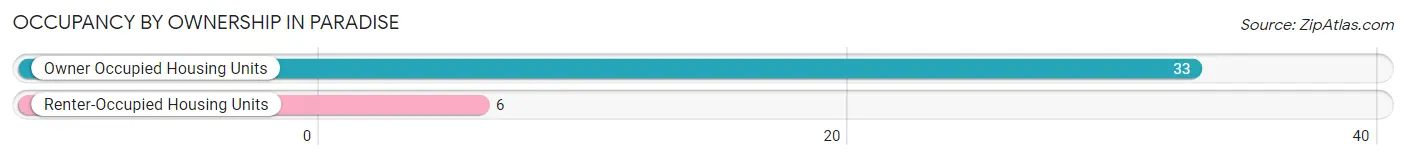
| Occupancy | # Housing Units | % Housing Units |
| Owner Occupied Housing Units | 33 | 84.6% |
| Renter-Occupied Housing Units | 6 | 15.4% |
| Total Occupied Housing Units | 39 | 100.0% |
Occupancy by Household Size in Paradise
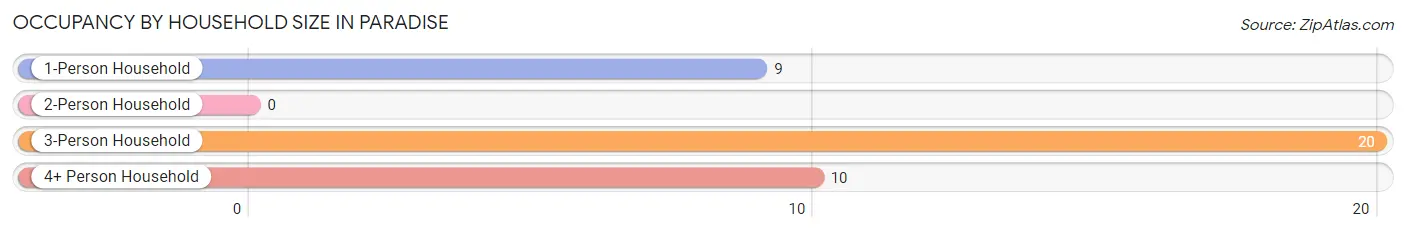
| Household Size | # Housing Units | % Housing Units |
| 1-Person Household | 9 | 23.1% |
| 2-Person Household | 0 | 0.0% |
| 3-Person Household | 20 | 51.3% |
| 4+ Person Household | 10 | 25.6% |
| Total Housing Units | 39 | 100.0% |
Occupancy by Ownership by Household Size in Paradise
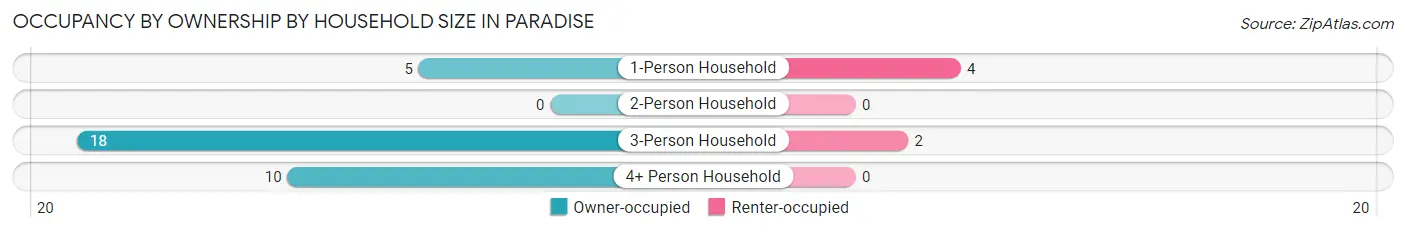
| Household Size | Owner-occupied | Renter-occupied |
| 1-Person Household | 5 (55.6%) | 4 (44.4%) |
| 2-Person Household | 0 (0.0%) | 0 (0.0%) |
| 3-Person Household | 18 (90.0%) | 2 (10.0%) |
| 4+ Person Household | 10 (100.0%) | 0 (0.0%) |
| Total Housing Units | 33 (84.6%) | 6 (15.4%) |
Occupancy by Educational Attainment in Paradise
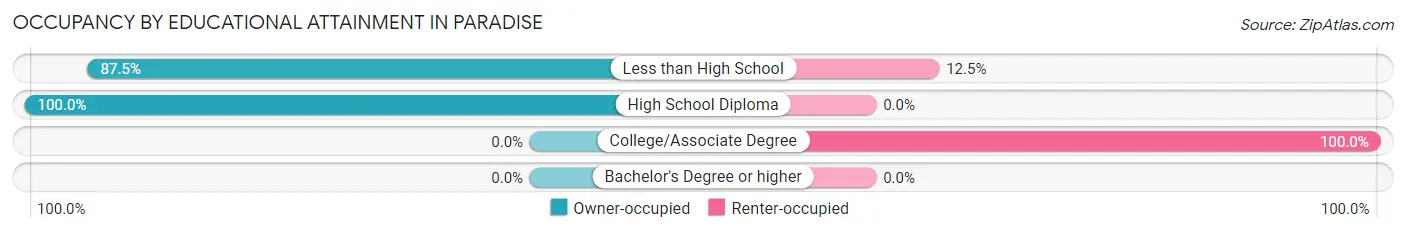
| Household Size | Owner-occupied | Renter-occupied |
| Less than High School | 28 (87.5%) | 4 (12.5%) |
| High School Diploma | 5 (100.0%) | 0 (0.0%) |
| College/Associate Degree | 0 (0.0%) | 2 (100.0%) |
| Bachelor's Degree or higher | 0 (0.0%) | 0 (0.0%) |
Occupancy by Age of Householder in Paradise
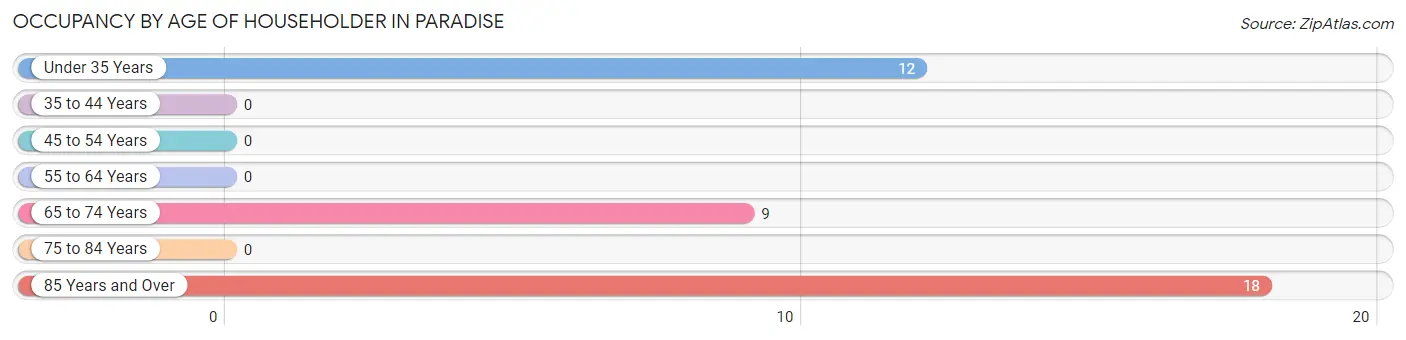
| Age Bracket | # Households | % Households |
| Under 35 Years | 12 | 30.8% |
| 35 to 44 Years | 0 | 0.0% |
| 45 to 54 Years | 0 | 0.0% |
| 55 to 64 Years | 0 | 0.0% |
| 65 to 74 Years | 9 | 23.1% |
| 75 to 84 Years | 0 | 0.0% |
| 85 Years and Over | 18 | 46.2% |
| Total | 39 | 100.0% |
Housing Finances in Paradise
Median Income by Occupancy in Paradise
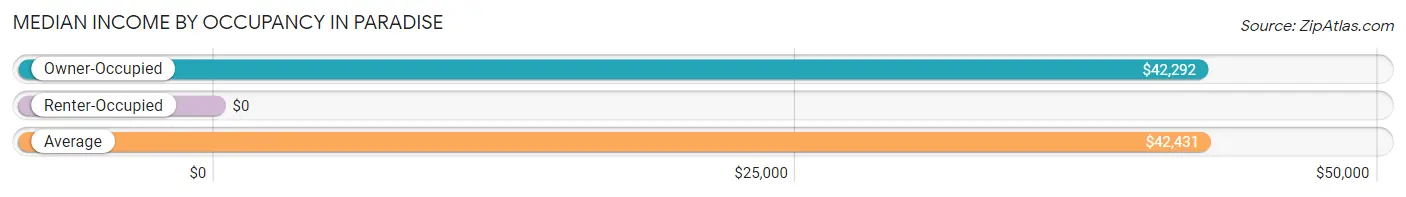
| Occupancy Type | # Households | Median Income |
| Owner-Occupied | 33 (84.6%) | $42,292 |
| Renter-Occupied | 6 (15.4%) | $0 |
| Average | 39 (100.0%) | $42,431 |
Occupancy by Householder Income Bracket in Paradise
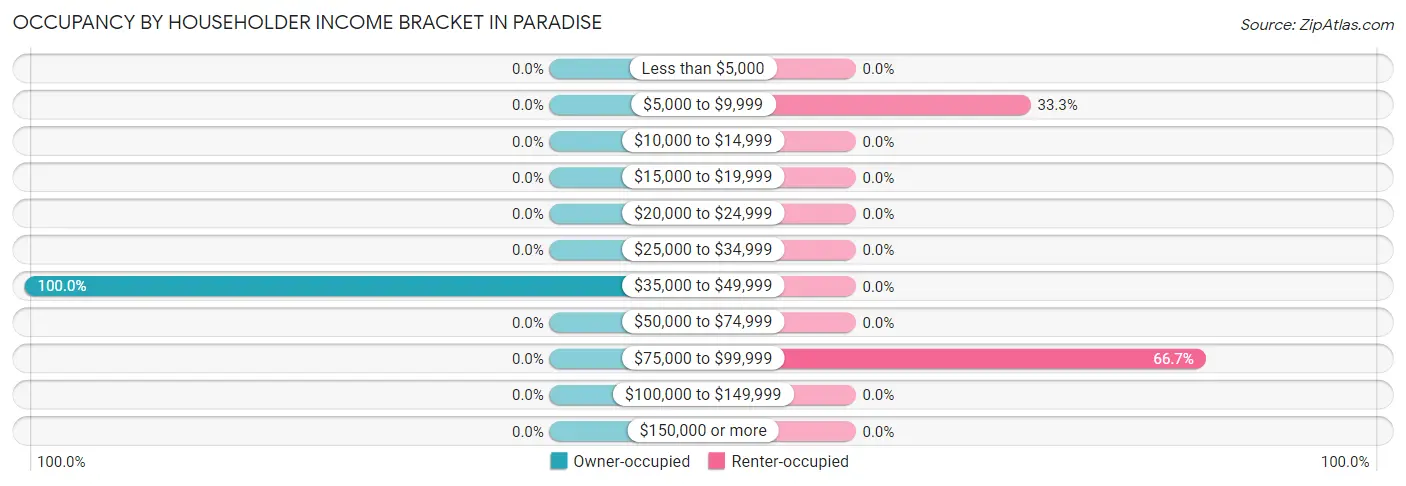
| Income Bracket | Owner-occupied | Renter-occupied |
| Less than $5,000 | 0 (0.0%) | 0 (0.0%) |
| $5,000 to $9,999 | 0 (0.0%) | 2 (33.3%) |
| $10,000 to $14,999 | 0 (0.0%) | 0 (0.0%) |
| $15,000 to $19,999 | 0 (0.0%) | 0 (0.0%) |
| $20,000 to $24,999 | 0 (0.0%) | 0 (0.0%) |
| $25,000 to $34,999 | 0 (0.0%) | 0 (0.0%) |
| $35,000 to $49,999 | 33 (100.0%) | 0 (0.0%) |
| $50,000 to $74,999 | 0 (0.0%) | 0 (0.0%) |
| $75,000 to $99,999 | 0 (0.0%) | 4 (66.7%) |
| $100,000 to $149,999 | 0 (0.0%) | 0 (0.0%) |
| $150,000 or more | 0 (0.0%) | 0 (0.0%) |
| Total | 33 (100.0%) | 6 (100.0%) |
Monthly Housing Cost Tiers in Paradise
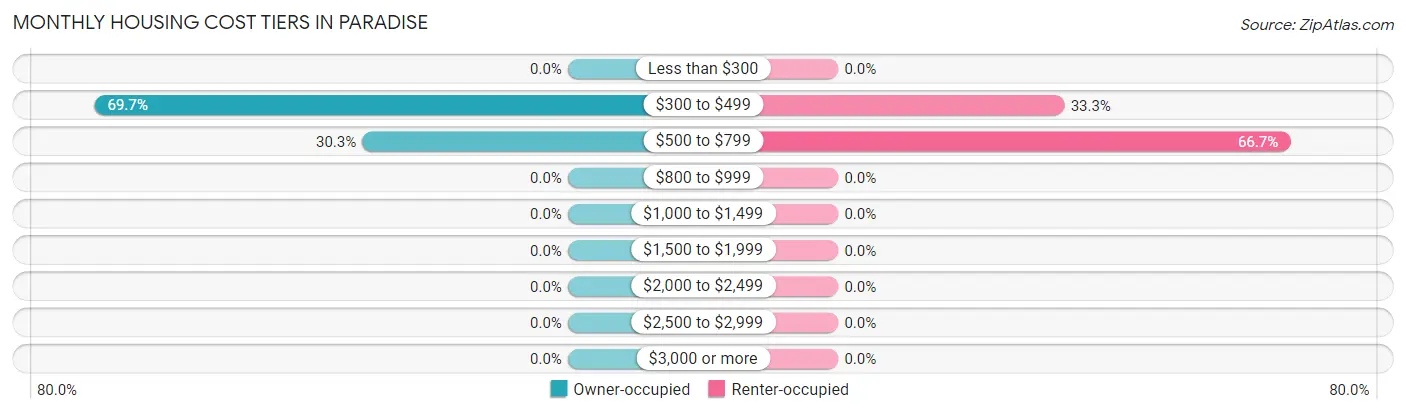
| Monthly Cost | Owner-occupied | Renter-occupied |
| Less than $300 | 0 (0.0%) | 0 (0.0%) |
| $300 to $499 | 23 (69.7%) | 2 (33.3%) |
| $500 to $799 | 10 (30.3%) | 4 (66.7%) |
| $800 to $999 | 0 (0.0%) | 0 (0.0%) |
| $1,000 to $1,499 | 0 (0.0%) | 0 (0.0%) |
| $1,500 to $1,999 | 0 (0.0%) | 0 (0.0%) |
| $2,000 to $2,499 | 0 (0.0%) | 0 (0.0%) |
| $2,500 to $2,999 | 0 (0.0%) | 0 (0.0%) |
| $3,000 or more | 0 (0.0%) | 0 (0.0%) |
| Total | 33 (100.0%) | 6 (100.0%) |
Physical Housing Characteristics in Paradise
Housing Structures in Paradise
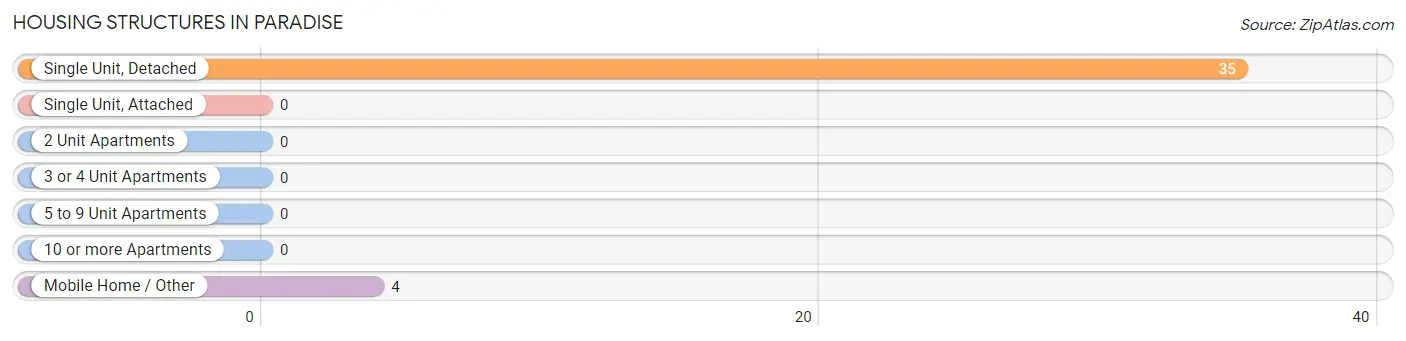
| Structure Type | # Housing Units | % Housing Units |
| Single Unit, Detached | 35 | 89.7% |
| Single Unit, Attached | 0 | 0.0% |
| 2 Unit Apartments | 0 | 0.0% |
| 3 or 4 Unit Apartments | 0 | 0.0% |
| 5 to 9 Unit Apartments | 0 | 0.0% |
| 10 or more Apartments | 0 | 0.0% |
| Mobile Home / Other | 4 | 10.3% |
| Total | 39 | 100.0% |
Housing Structures by Occupancy in Paradise
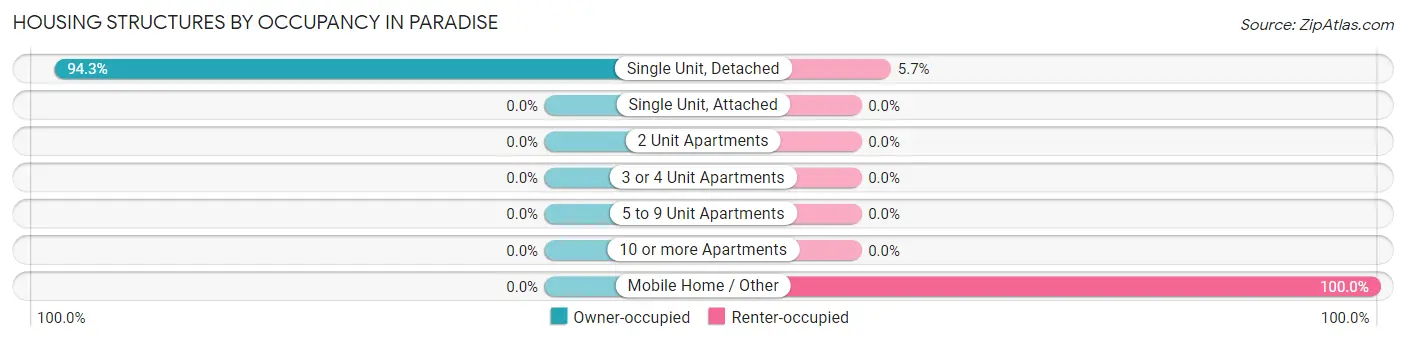
| Structure Type | Owner-occupied | Renter-occupied |
| Single Unit, Detached | 33 (94.3%) | 2 (5.7%) |
| Single Unit, Attached | 0 (0.0%) | 0 (0.0%) |
| 2 Unit Apartments | 0 (0.0%) | 0 (0.0%) |
| 3 or 4 Unit Apartments | 0 (0.0%) | 0 (0.0%) |
| 5 to 9 Unit Apartments | 0 (0.0%) | 0 (0.0%) |
| 10 or more Apartments | 0 (0.0%) | 0 (0.0%) |
| Mobile Home / Other | 0 (0.0%) | 4 (100.0%) |
| Total | 33 (84.6%) | 6 (15.4%) |
Housing Structures by Number of Rooms in Paradise
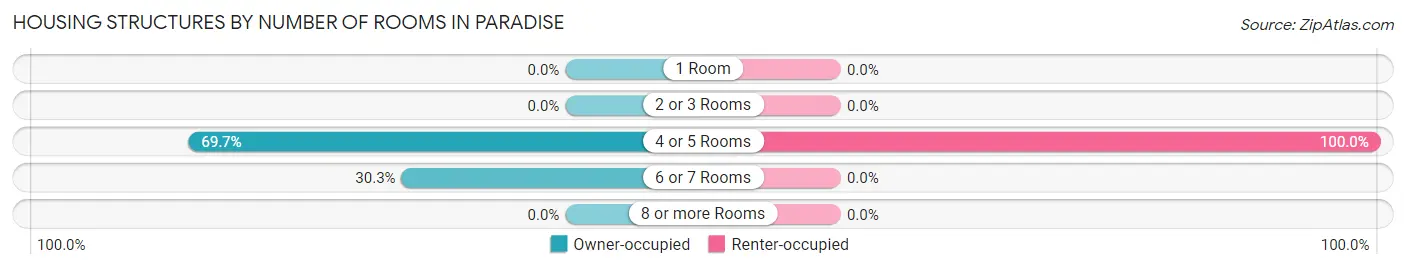
| Number of Rooms | Owner-occupied | Renter-occupied |
| 1 Room | 0 (0.0%) | 0 (0.0%) |
| 2 or 3 Rooms | 0 (0.0%) | 0 (0.0%) |
| 4 or 5 Rooms | 23 (69.7%) | 6 (100.0%) |
| 6 or 7 Rooms | 10 (30.3%) | 0 (0.0%) |
| 8 or more Rooms | 0 (0.0%) | 0 (0.0%) |
| Total | 33 (100.0%) | 6 (100.0%) |
Housing Structure by Heating Type in Paradise
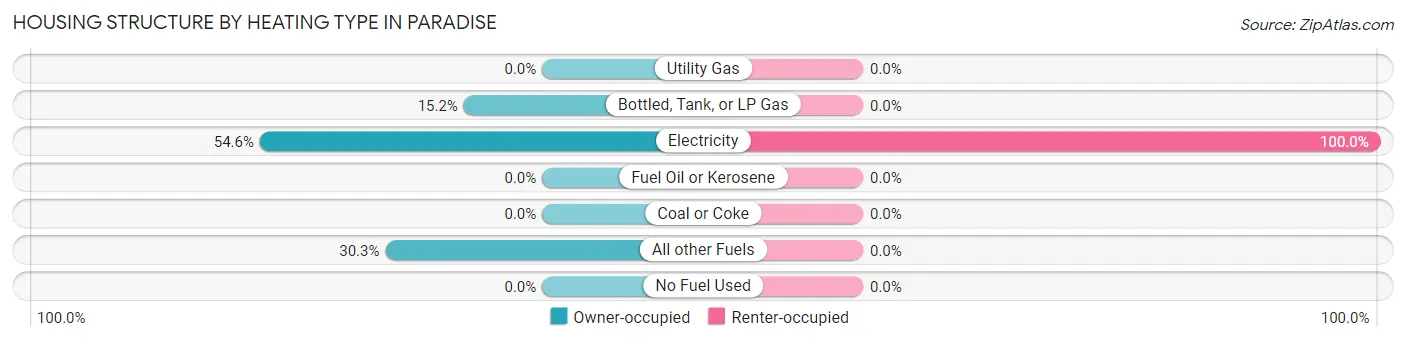
| Heating Type | Owner-occupied | Renter-occupied |
| Utility Gas | 0 (0.0%) | 0 (0.0%) |
| Bottled, Tank, or LP Gas | 5 (15.1%) | 0 (0.0%) |
| Electricity | 18 (54.5%) | 6 (100.0%) |
| Fuel Oil or Kerosene | 0 (0.0%) | 0 (0.0%) |
| Coal or Coke | 0 (0.0%) | 0 (0.0%) |
| All other Fuels | 10 (30.3%) | 0 (0.0%) |
| No Fuel Used | 0 (0.0%) | 0 (0.0%) |
| Total | 33 (100.0%) | 6 (100.0%) |
Household Vehicle Usage in Paradise
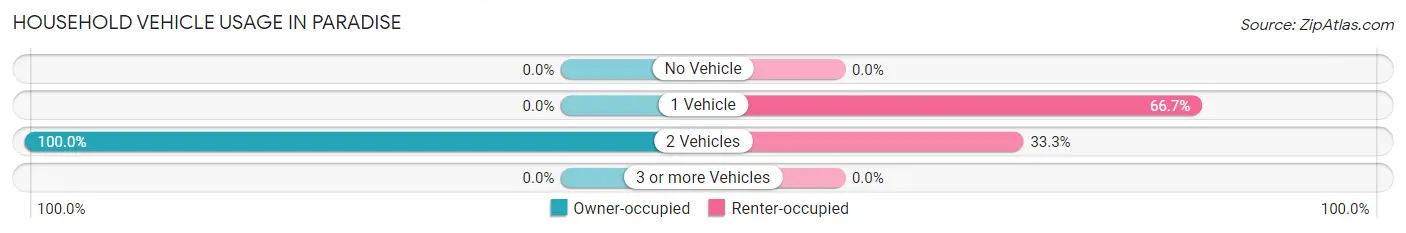
| Vehicles per Household | Owner-occupied | Renter-occupied |
| No Vehicle | 0 (0.0%) | 0 (0.0%) |
| 1 Vehicle | 0 (0.0%) | 4 (66.7%) |
| 2 Vehicles | 33 (100.0%) | 2 (33.3%) |
| 3 or more Vehicles | 0 (0.0%) | 0 (0.0%) |
| Total | 33 (100.0%) | 6 (100.0%) |
Real Estate & Mortgages in Paradise
Real Estate and Mortgage Overview in Paradise
| Characteristic | Without Mortgage | With Mortgage |
| Housing Units | 23 | 10 |
| Median Property Value | - | - |
| Median Household Income | - | - |
| Monthly Housing Costs | - | - |
| Real Estate Taxes | - | - |
Property Value by Mortgage Status in Paradise
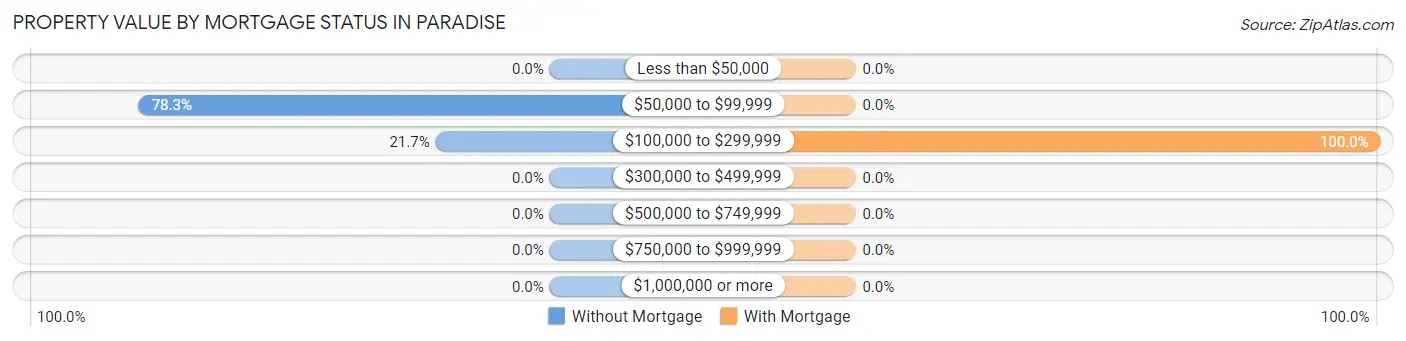
| Property Value | Without Mortgage | With Mortgage |
| Less than $50,000 | 0 (0.0%) | 0 (0.0%) |
| $50,000 to $99,999 | 18 (78.3%) | 0 (0.0%) |
| $100,000 to $299,999 | 5 (21.7%) | 10 (100.0%) |
| $300,000 to $499,999 | 0 (0.0%) | 0 (0.0%) |
| $500,000 to $749,999 | 0 (0.0%) | 0 (0.0%) |
| $750,000 to $999,999 | 0 (0.0%) | 0 (0.0%) |
| $1,000,000 or more | 0 (0.0%) | 0 (0.0%) |
| Total | 23 (100.0%) | 10 (100.0%) |
Household Income by Mortgage Status in Paradise
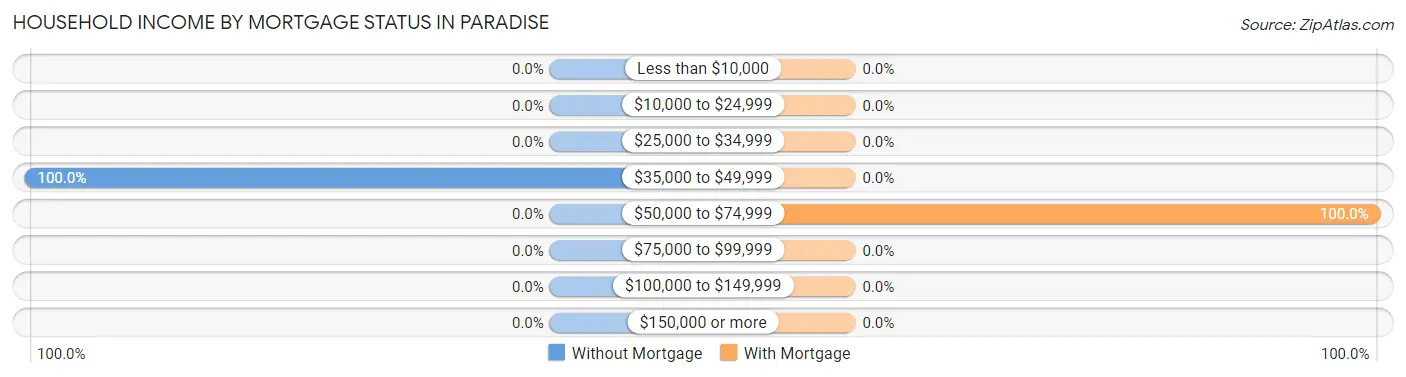
| Household Income | Without Mortgage | With Mortgage |
| Less than $10,000 | 0 (0.0%) | 0 (0.0%) |
| $10,000 to $24,999 | 0 (0.0%) | 0 (0.0%) |
| $25,000 to $34,999 | 0 (0.0%) | 0 (0.0%) |
| $35,000 to $49,999 | 23 (100.0%) | 0 (0.0%) |
| $50,000 to $74,999 | 0 (0.0%) | 10 (100.0%) |
| $75,000 to $99,999 | 0 (0.0%) | 0 (0.0%) |
| $100,000 to $149,999 | 0 (0.0%) | 0 (0.0%) |
| $150,000 or more | 0 (0.0%) | 0 (0.0%) |
| Total | 23 (100.0%) | 10 (100.0%) |
Property Value to Household Income Ratio in Paradise
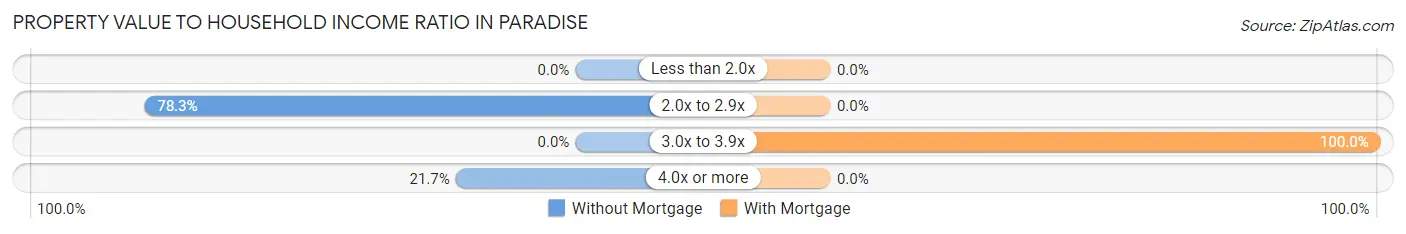
| Value-to-Income Ratio | Without Mortgage | With Mortgage |
| Less than 2.0x | 0 (0.0%) | 0 (0.0%) |
| 2.0x to 2.9x | 18 (78.3%) | 0 (0.0%) |
| 3.0x to 3.9x | 0 (0.0%) | 10 (100.0%) |
| 4.0x or more | 5 (21.7%) | 0 (0.0%) |
| Total | 23 (100.0%) | 10 (100.0%) |
Real Estate Taxes by Mortgage Status in Paradise
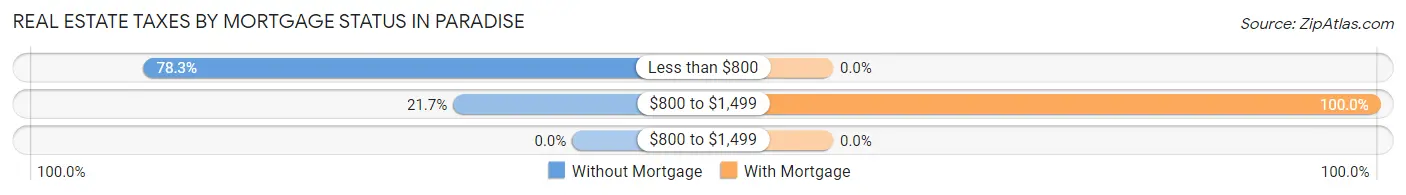
| Property Taxes | Without Mortgage | With Mortgage |
| Less than $800 | 18 (78.3%) | 0 (0.0%) |
| $800 to $1,499 | 5 (21.7%) | 10 (100.0%) |
| $800 to $1,499 | 0 (0.0%) | 0 (0.0%) |
| Total | 23 (100.0%) | 10 (100.0%) |
Health & Disability in Paradise
Health Insurance Coverage by Age in Paradise
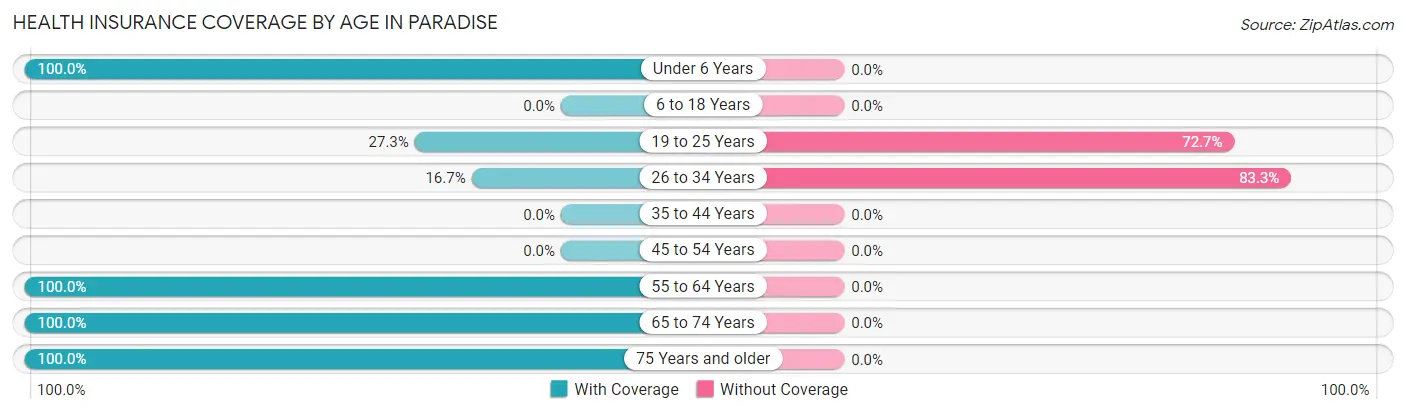
| Age Bracket | With Coverage | Without Coverage |
| Under 6 Years | 7 (100.0%) | 0 (0.0%) |
| 6 to 18 Years | 0 (0.0%) | 0 (0.0%) |
| 19 to 25 Years | 3 (27.3%) | 8 (72.7%) |
| 26 to 34 Years | 2 (16.7%) | 10 (83.3%) |
| 35 to 44 Years | 0 (0.0%) | 0 (0.0%) |
| 45 to 54 Years | 0 (0.0%) | 0 (0.0%) |
| 55 to 64 Years | 31 (100.0%) | 0 (0.0%) |
| 65 to 74 Years | 50 (100.0%) | 0 (0.0%) |
| 75 Years and older | 18 (100.0%) | 0 (0.0%) |
| Total | 111 (86.1%) | 18 (14.0%) |
Health Insurance Coverage by Citizenship Status in Paradise

| Citizenship Status | With Coverage | Without Coverage |
| Native Born | 7 (100.0%) | 0 (0.0%) |
| Foreign Born, Citizen | 0 (0.0%) | 0 (0.0%) |
| Foreign Born, not a Citizen | 3 (27.3%) | 8 (72.7%) |
Health Insurance Coverage by Household Income in Paradise
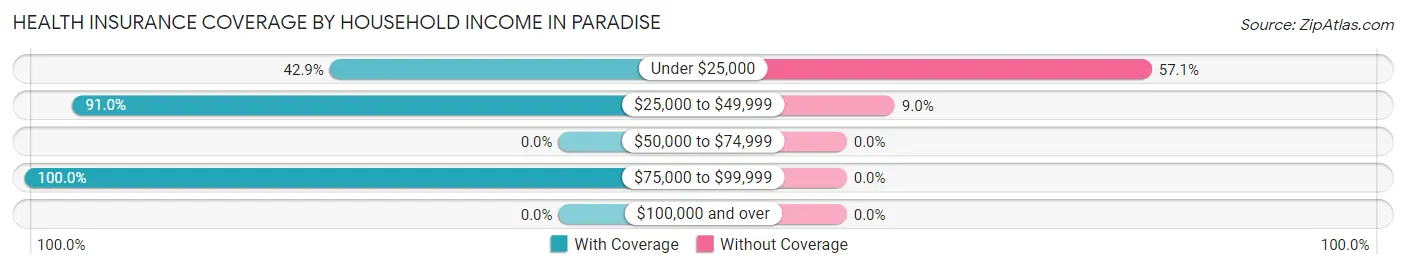
| Household Income | With Coverage | Without Coverage |
| Under $25,000 | 6 (42.9%) | 8 (57.1%) |
| $25,000 to $49,999 | 101 (91.0%) | 10 (9.0%) |
| $50,000 to $74,999 | 0 (0.0%) | 0 (0.0%) |
| $75,000 to $99,999 | 4 (100.0%) | 0 (0.0%) |
| $100,000 and over | 0 (0.0%) | 0 (0.0%) |
Public vs Private Health Insurance Coverage by Age in Paradise
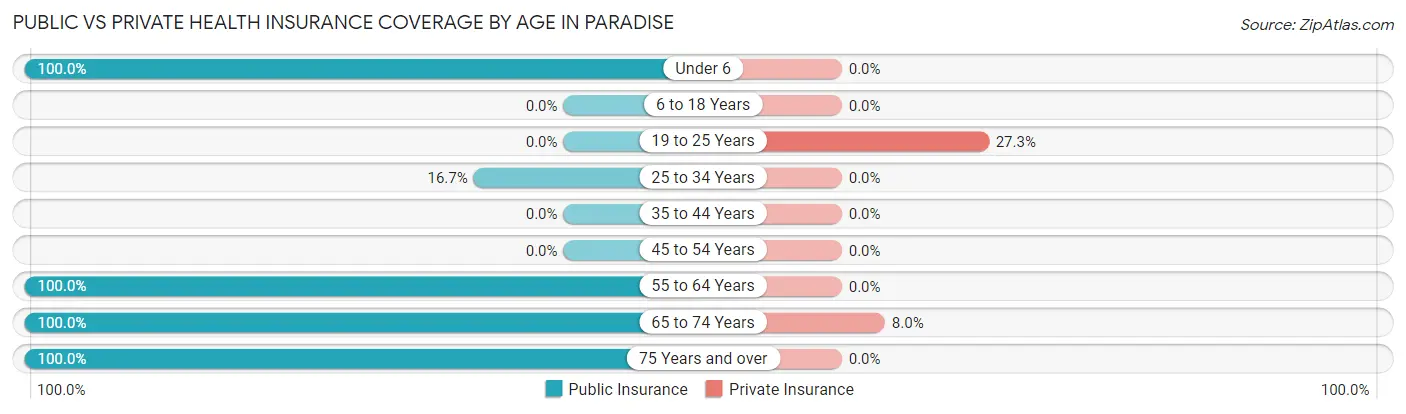
| Age Bracket | Public Insurance | Private Insurance |
| Under 6 | 7 (100.0%) | 0 (0.0%) |
| 6 to 18 Years | 0 (0.0%) | 0 (0.0%) |
| 19 to 25 Years | 0 (0.0%) | 3 (27.3%) |
| 25 to 34 Years | 2 (16.7%) | 0 (0.0%) |
| 35 to 44 Years | 0 (0.0%) | 0 (0.0%) |
| 45 to 54 Years | 0 (0.0%) | 0 (0.0%) |
| 55 to 64 Years | 31 (100.0%) | 0 (0.0%) |
| 65 to 74 Years | 50 (100.0%) | 4 (8.0%) |
| 75 Years and over | 18 (100.0%) | 0 (0.0%) |
| Total | 108 (83.7%) | 7 (5.4%) |
Disability Status by Sex by Age in Paradise
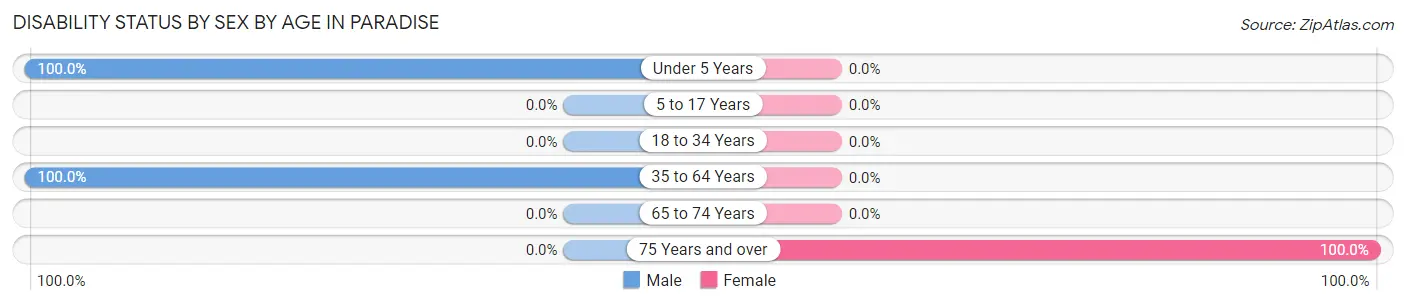
| Age Bracket | Male | Female |
| Under 5 Years | 3 (100.0%) | 0 (0.0%) |
| 5 to 17 Years | 0 (0.0%) | 0 (0.0%) |
| 18 to 34 Years | 0 (0.0%) | 0 (0.0%) |
| 35 to 64 Years | 31 (100.0%) | 0 (0.0%) |
| 65 to 74 Years | 0 (0.0%) | 0 (0.0%) |
| 75 Years and over | 0 (0.0%) | 18 (100.0%) |
Disability Class by Sex by Age in Paradise
Disability Class: Hearing Difficulty
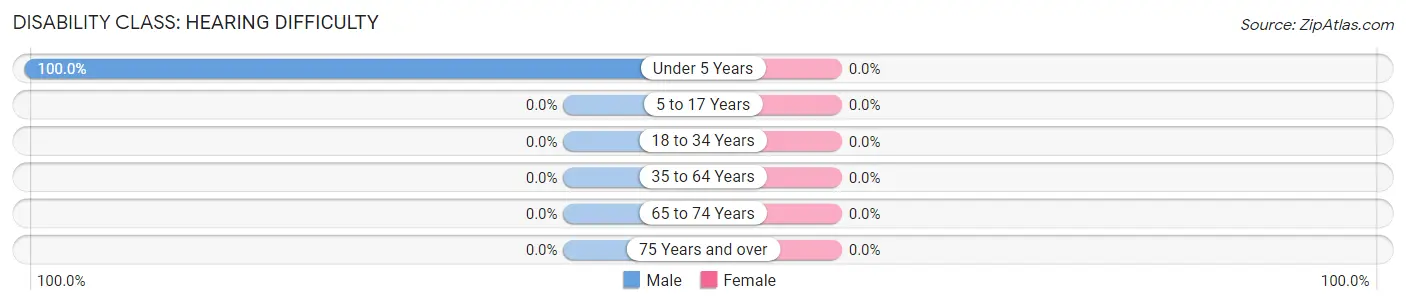
| Age Bracket | Male | Female |
| Under 5 Years | 3 (100.0%) | 0 (0.0%) |
| 5 to 17 Years | 0 (0.0%) | 0 (0.0%) |
| 18 to 34 Years | 0 (0.0%) | 0 (0.0%) |
| 35 to 64 Years | 0 (0.0%) | 0 (0.0%) |
| 65 to 74 Years | 0 (0.0%) | 0 (0.0%) |
| 75 Years and over | 0 (0.0%) | 0 (0.0%) |
Disability Class: Vision Difficulty
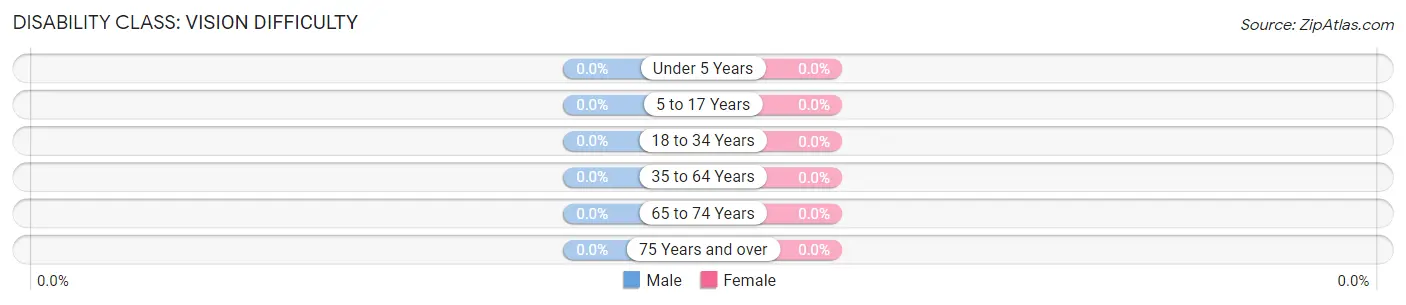
| Age Bracket | Male | Female |
| Under 5 Years | 0 (0.0%) | 0 (0.0%) |
| 5 to 17 Years | 0 (0.0%) | 0 (0.0%) |
| 18 to 34 Years | 0 (0.0%) | 0 (0.0%) |
| 35 to 64 Years | 0 (0.0%) | 0 (0.0%) |
| 65 to 74 Years | 0 (0.0%) | 0 (0.0%) |
| 75 Years and over | 0 (0.0%) | 0 (0.0%) |
Disability Class: Cognitive Difficulty
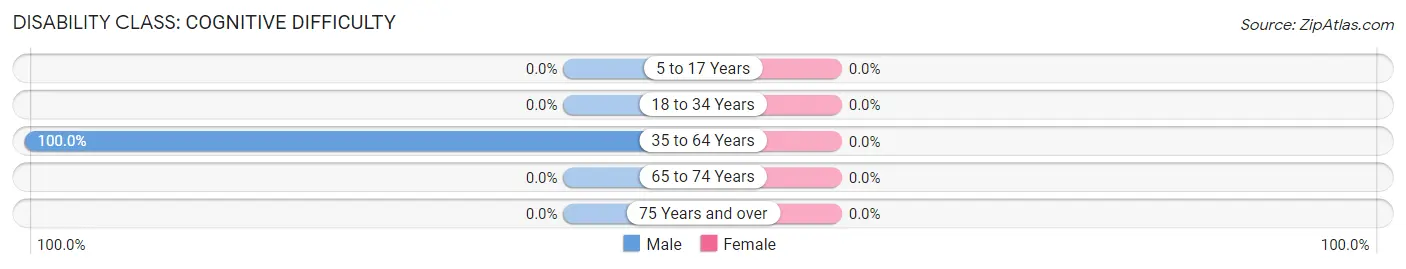
| Age Bracket | Male | Female |
| 5 to 17 Years | 0 (0.0%) | 0 (0.0%) |
| 18 to 34 Years | 0 (0.0%) | 0 (0.0%) |
| 35 to 64 Years | 31 (100.0%) | 0 (0.0%) |
| 65 to 74 Years | 0 (0.0%) | 0 (0.0%) |
| 75 Years and over | 0 (0.0%) | 0 (0.0%) |
Disability Class: Ambulatory Difficulty
| Age Bracket | Male | Female |
| 5 to 17 Years | 0 (0.0%) | 0 (0.0%) |
| 18 to 34 Years | 0 (0.0%) | 0 (0.0%) |
| 35 to 64 Years | 0 (0.0%) | 0 (0.0%) |
| 65 to 74 Years | 0 (0.0%) | 0 (0.0%) |
| 75 Years and over | 0 (0.0%) | 0 (0.0%) |
Disability Class: Self-Care Difficulty
| Age Bracket | Male | Female |
| 5 to 17 Years | 0 (0.0%) | 0 (0.0%) |
| 18 to 34 Years | 0 (0.0%) | 0 (0.0%) |
| 35 to 64 Years | 0 (0.0%) | 0 (0.0%) |
| 65 to 74 Years | 0 (0.0%) | 0 (0.0%) |
| 75 Years and over | 0 (0.0%) | 0 (0.0%) |
Technology Access in Paradise
Computing Device Access in Paradise
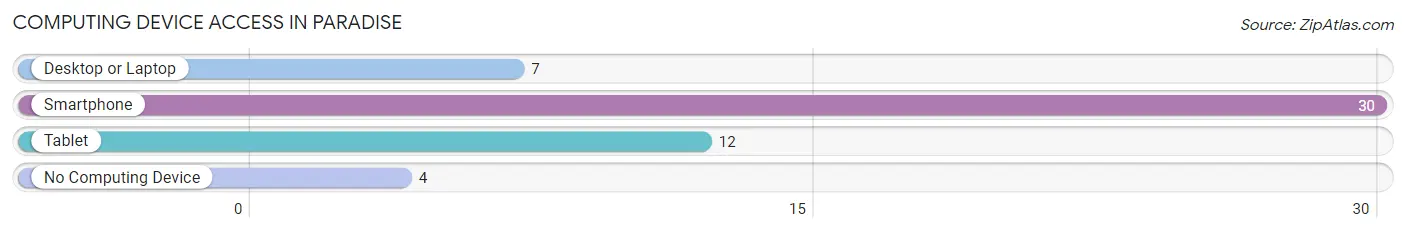
| Device Type | # Households | % Households |
| Desktop or Laptop | 7 | 17.9% |
| Smartphone | 30 | 76.9% |
| Tablet | 12 | 30.8% |
| No Computing Device | 4 | 10.3% |
| Total | 39 | 100.0% |
Internet Access in Paradise
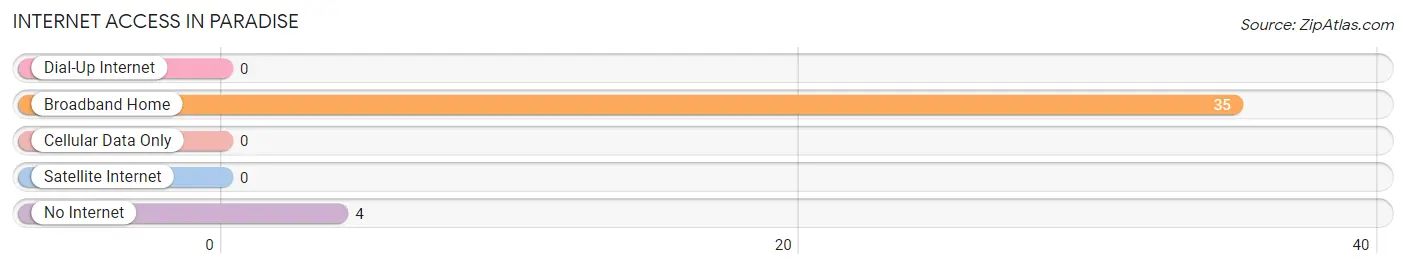
| Internet Type | # Households | % Households |
| Dial-Up Internet | 0 | 0.0% |
| Broadband Home | 35 | 89.7% |
| Cellular Data Only | 0 | 0.0% |
| Satellite Internet | 0 | 0.0% |
| No Internet | 4 | 10.3% |
| Total | 39 | 100.0% |
Paradise Summary
Paradise, Montana is a small town located in the northwest corner of the state, near the Idaho border. It is situated in the Flathead Valley, a region of the Rocky Mountains known for its stunning natural beauty. The town is home to just over 1,000 people, and is a popular destination for outdoor recreation and relaxation.
History
The area that is now Paradise was first settled in the late 1800s by homesteaders and ranchers. The town was officially founded in 1902, and was named after the nearby Paradise Creek. The town grew slowly, but steadily, and by the mid-1900s it had become a popular tourist destination.
Geography
Paradise is located in the Flathead Valley, a region of the Rocky Mountains known for its stunning natural beauty. The town is situated at an elevation of 3,400 feet, and is surrounded by mountains and forests. The Flathead River runs through the town, and is a popular spot for fishing and other outdoor activities.
Economy
The economy of Paradise is largely based on tourism and outdoor recreation. The town is home to several resorts and lodges, as well as a variety of restaurants and shops. The nearby Flathead National Forest is a popular destination for camping, hiking, and other outdoor activities. The town is also home to a number of small businesses, including a sawmill, a lumber yard, and a few small manufacturing companies.
Demographics
As of the 2010 census, the population of Paradise was 1,072. The town is predominantly white, with a small Native American population. The median household income is $41,250, and the median age is 44. The town is home to a variety of religious denominations, including Catholic, Lutheran, and Methodist.
Conclusion
Paradise, Montana is a small town located in the northwest corner of the state, near the Idaho border. It is situated in the Flathead Valley, a region of the Rocky Mountains known for its stunning natural beauty. The town is home to just over 1,000 people, and is a popular destination for outdoor recreation and relaxation. The economy of Paradise is largely based on tourism and outdoor recreation, and the town is home to a variety of small businesses. The population of Paradise is predominantly white, with a small Native American population. The town is home to a variety of religious denominations, and is a great place to live and visit.
Common Questions
What is the Total Population of Paradise?
Total Population of Paradise is 129.
What is the Total Male Population of Paradise?
Total Male Population of Paradise is 101.
What is the Total Female Population of Paradise?
Total Female Population of Paradise is 28.
What is the Ratio of Males per 100 Females in Paradise?
There are 360.71 Males per 100 Females in Paradise.
What is the Ratio of Females per 100 Males in Paradise?
There are 27.72 Females per 100 Males in Paradise.
What is the Median Population Age in Paradise?
Median Population Age in Paradise is 65.5 Years.
What is the Average Family Size in Paradise
Average Family Size in Paradise is 3.7 People.
What is the Average Household Size in Paradise
Average Household Size in Paradise is 3.3 People.
What is Per Capita Income in Paradise?
Per Capita income in Paradise is $16,068.
What is the Median Family Income in Paradise?
Median Family Income in Paradise is $41,806.
What is the Median Household income in Paradise?
Median Household Income in Paradise is $42,431.
What is Inequality or Gini Index in Paradise?
Inequality or Gini Index in Paradise is 0.16.
How Large is the Labor Force in Paradise?
There are 27 People in the Labor Forcein in Paradise.
What is the Percentage of People in the Labor Force in Paradise?
22.1% of People are in the Labor Force in Paradise.
What is the Unemployment Rate in Paradise?
Unemployment Rate in Paradise is 29.6%.