Zip Codes with the Highest Percentage of Population Employed in Health Diagnosing & Treating in Billings, MT
RELATED REPORTS & OPTIONS
Health Diagnosing & Treating
Billings
Compare Zip Codes
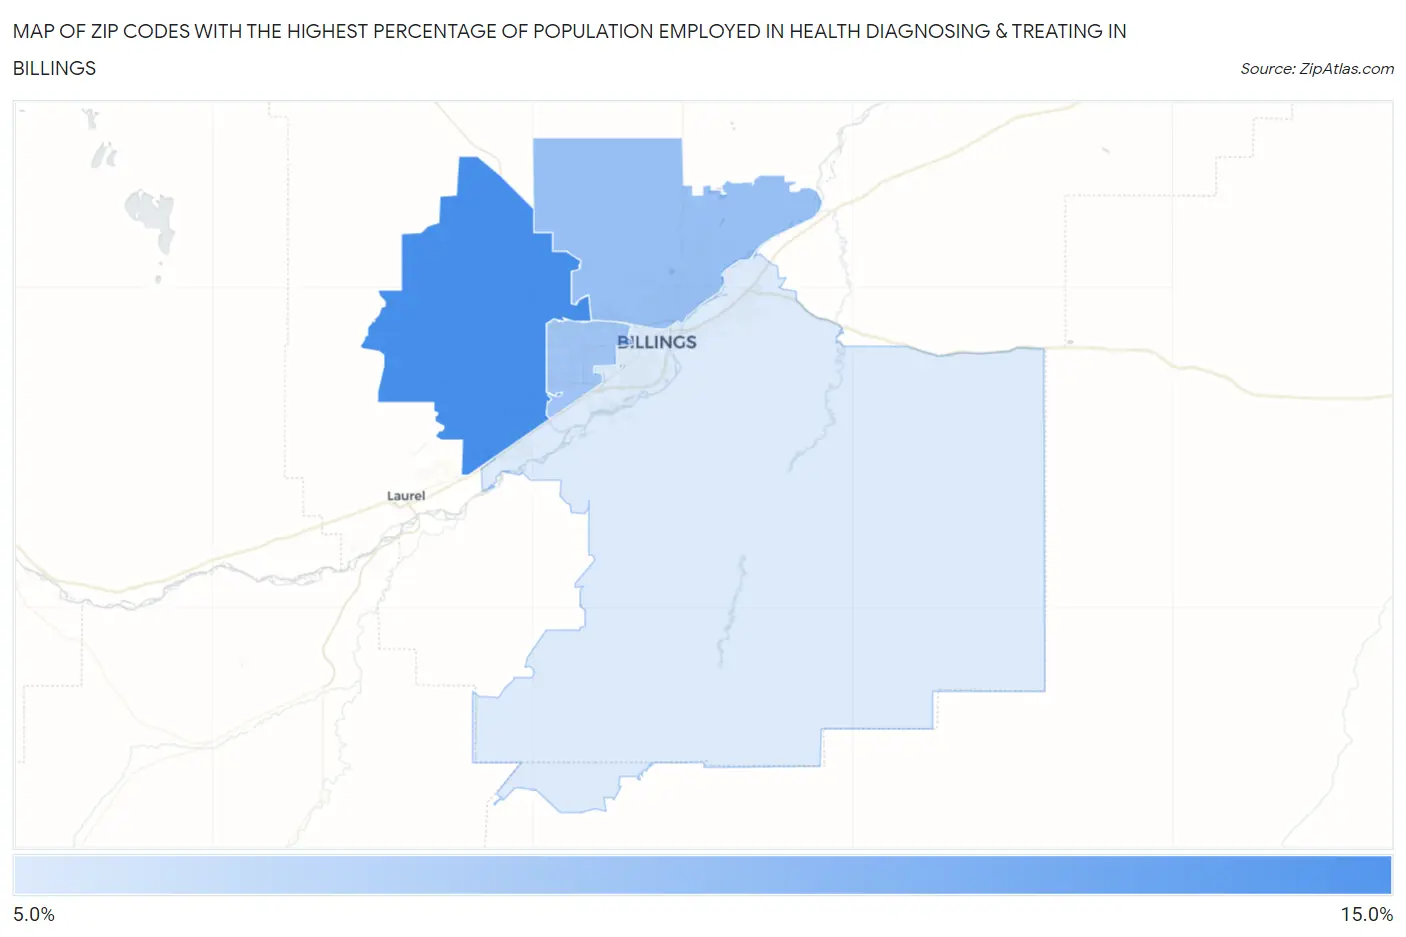
Map of Zip Codes with the Highest Percentage of Population Employed in Health Diagnosing & Treating in Billings
0.0%
15.0%
Zip Codes with the Highest Percentage of Population Employed in Health Diagnosing & Treating in Billings, MT
| Zip Code | % Employed | vs State | vs National | |
| 1. | 59106 | 12.6% | 6.6%(+6.02)#23 | 6.2%(+6.34)#1,915 |
| 2. | 59105 | 9.1% | 6.6%(+2.58)#45 | 6.2%(+2.90)#5,120 |
| 3. | 59102 | 8.8% | 6.6%(+2.26)#50 | 6.2%(+2.58)#5,683 |
| 4. | 59101 | 6.3% | 6.6%(-0.228)#103 | 6.2%(+0.088)#12,649 |
1
Common Questions
What are the Top 3 Zip Codes with the Highest Percentage of Population Employed in Health Diagnosing & Treating in Billings, MT?
Top 3 Zip Codes with the Highest Percentage of Population Employed in Health Diagnosing & Treating in Billings, MT are:
What zip code has the Highest Percentage of Population Employed in Health Diagnosing & Treating in Billings, MT?
59106 has the Highest Percentage of Population Employed in Health Diagnosing & Treating in Billings, MT with 12.6%.
What is the Percentage of Population Employed in Health Diagnosing & Treating in Billings, MT?
Percentage of Population Employed in Health Diagnosing & Treating in Billings is 9.1%.
What is the Percentage of Population Employed in Health Diagnosing & Treating in Montana?
Percentage of Population Employed in Health Diagnosing & Treating in Montana is 6.6%.
What is the Percentage of Population Employed in Health Diagnosing & Treating in the United States?
Percentage of Population Employed in Health Diagnosing & Treating in the United States is 6.2%.