Wye, MT
Wye Map
Wye Overview
1,074
TOTAL POPULATION
542
MALE POPULATION
532
FEMALE POPULATION
101.88
MALES / 100 FEMALES
98.15
FEMALES / 100 MALES
26.6
MEDIAN AGE
3.4
AVG FAMILY SIZE
3.2
AVG HOUSEHOLD SIZE
$40,504
PER CAPITA INCOME
$91,522
AVG FAMILY INCOME
$93,264
AVG HOUSEHOLD INCOME
40.6%
WAGE / INCOME GAP [ % ]
59.4¢/ $1
WAGE / INCOME GAP [ $ ]
0.28
INEQUALITY / GINI INDEX
653
LABOR FORCE [ PEOPLE ]
83.9%
PERCENT IN LABOR FORCE
5.7%
UNEMPLOYMENT RATE
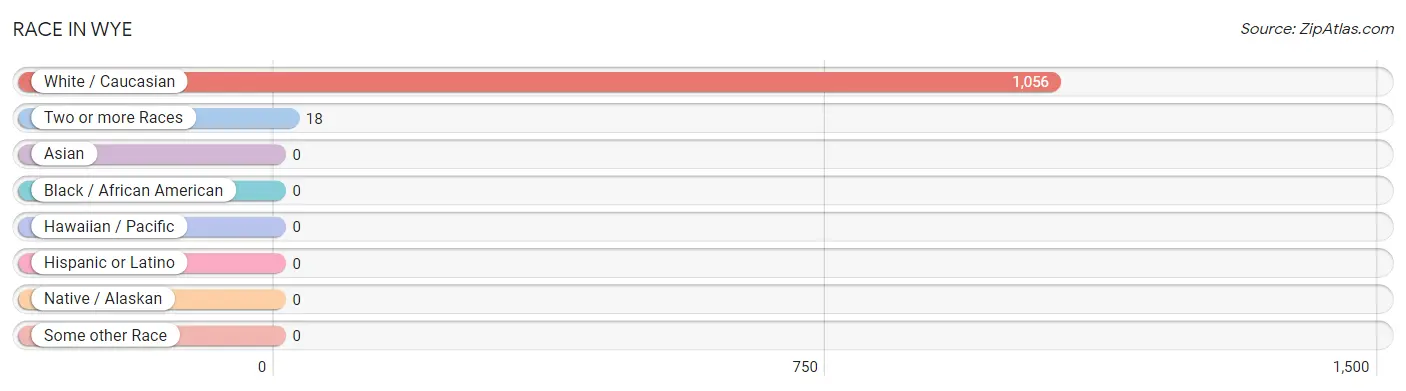
Race in Wye
The most populous races in Wye are White / Caucasian (1,056 | 98.3%), and Two or more Races (18 | 1.7%).
| Race | # Population | % Population |
| Asian | 0 | 0.0% |
| Black / African American | 0 | 0.0% |
| Hawaiian / Pacific | 0 | 0.0% |
| Hispanic or Latino | 0 | 0.0% |
| Native / Alaskan | 0 | 0.0% |
| White / Caucasian | 1,056 | 98.3% |
| Two or more Races | 18 | 1.7% |
| Some other Race | 0 | 0.0% |
| Total | 1,074 | 100.0% |
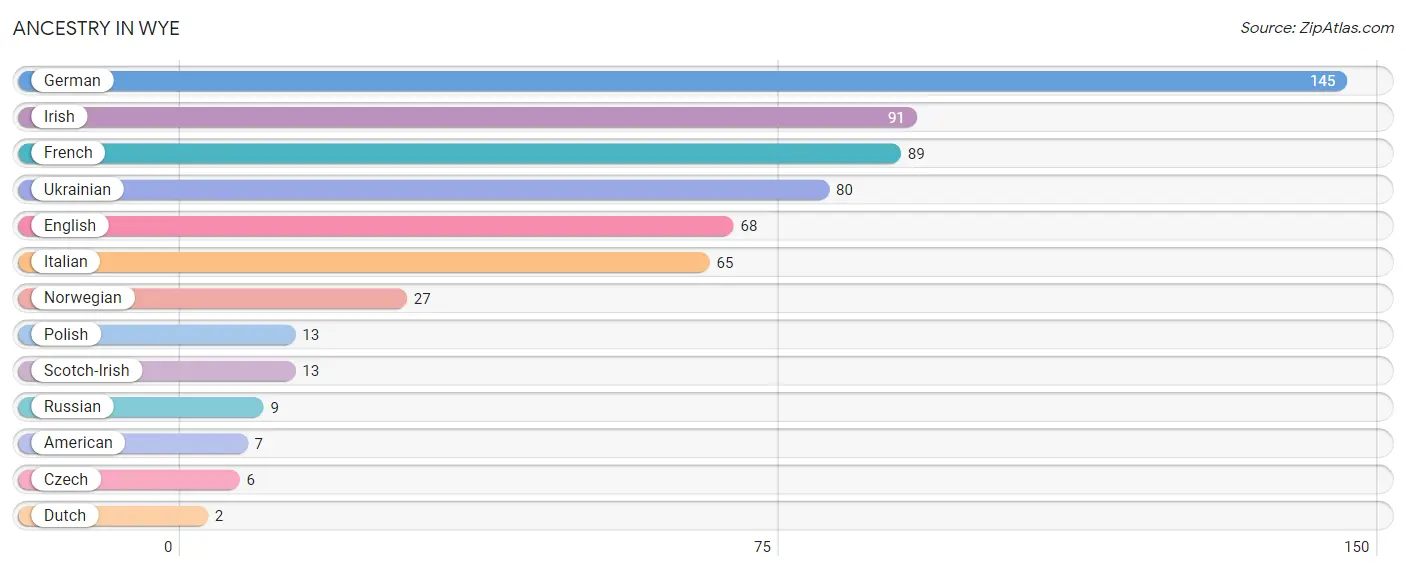
Ancestry in Wye
The most populous ancestries reported in Wye are German (145 | 13.5%), Irish (91 | 8.5%), French (89 | 8.3%), Ukrainian (80 | 7.4%), and English (68 | 6.3%), together accounting for 44.0% of all Wye residents.
| Ancestry | # Population | % Population |
| American | 7 | 0.6% |
| Czech | 6 | 0.6% |
| Dutch | 2 | 0.2% |
| English | 68 | 6.3% |
| French | 89 | 8.3% |
| German | 145 | 13.5% |
| Irish | 91 | 8.5% |
| Italian | 65 | 6.0% |
| Norwegian | 27 | 2.5% |
| Polish | 13 | 1.2% |
| Russian | 9 | 0.8% |
| Scotch-Irish | 13 | 1.2% |
| Ukrainian | 80 | 7.4% | View All 13 Rows |
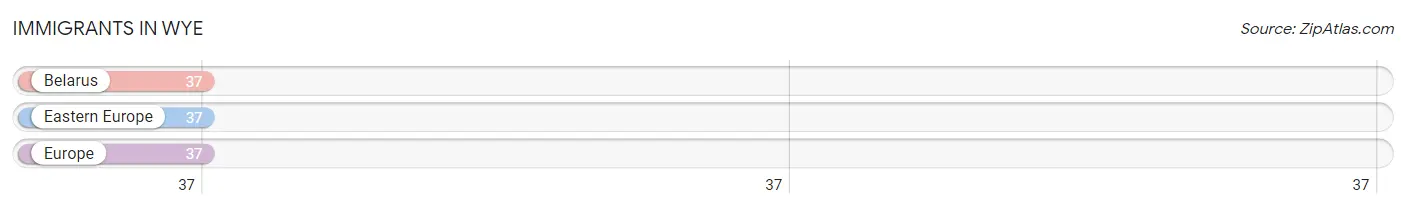
Immigrants in Wye
The most numerous immigrant groups reported in Wye came from Belarus (37 | 3.5%), Eastern Europe (37 | 3.5%), and Europe (37 | 3.5%), together accounting for 10.4% of all Wye residents.
| Immigration Origin | # Population | % Population |
| Belarus | 37 | 3.5% |
| Eastern Europe | 37 | 3.5% |
| Europe | 37 | 3.5% | View All 3 Rows |
Sex and Age in Wye
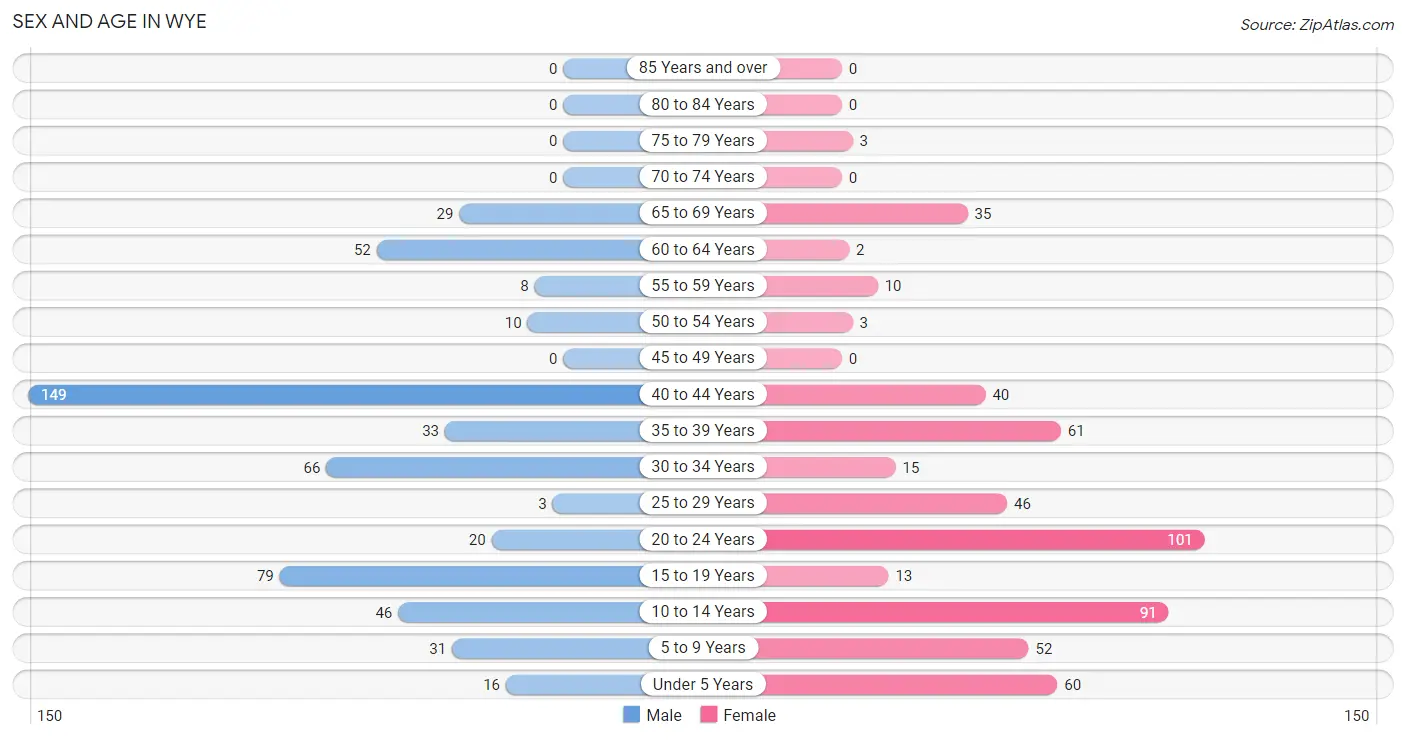
Sex and Age in Wye
The most populous age groups in Wye are 40 to 44 Years (149 | 27.5%) for men and 20 to 24 Years (101 | 19.0%) for women.
| Age Bracket | Male | Female |
| Under 5 Years | 16 (2.9%) | 60 (11.3%) |
| 5 to 9 Years | 31 (5.7%) | 52 (9.8%) |
| 10 to 14 Years | 46 (8.5%) | 91 (17.1%) |
| 15 to 19 Years | 79 (14.6%) | 13 (2.4%) |
| 20 to 24 Years | 20 (3.7%) | 101 (19.0%) |
| 25 to 29 Years | 3 (0.5%) | 46 (8.6%) |
| 30 to 34 Years | 66 (12.2%) | 15 (2.8%) |
| 35 to 39 Years | 33 (6.1%) | 61 (11.5%) |
| 40 to 44 Years | 149 (27.5%) | 40 (7.5%) |
| 45 to 49 Years | 0 (0.0%) | 0 (0.0%) |
| 50 to 54 Years | 10 (1.8%) | 3 (0.6%) |
| 55 to 59 Years | 8 (1.5%) | 10 (1.9%) |
| 60 to 64 Years | 52 (9.6%) | 2 (0.4%) |
| 65 to 69 Years | 29 (5.3%) | 35 (6.6%) |
| 70 to 74 Years | 0 (0.0%) | 0 (0.0%) |
| 75 to 79 Years | 0 (0.0%) | 3 (0.6%) |
| 80 to 84 Years | 0 (0.0%) | 0 (0.0%) |
| 85 Years and over | 0 (0.0%) | 0 (0.0%) |
| Total | 542 (100.0%) | 532 (100.0%) |
Families and Households in Wye
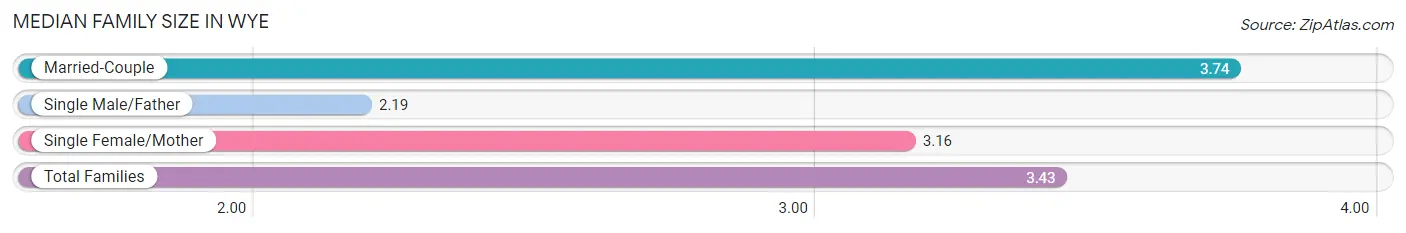
Median Family Size in Wye
The median family size in Wye is 3.43 persons per family, with married-couple families (178 | 66.4%) accounting for the largest median family size of 3.74 persons per family. On the other hand, single male/father families (32 | 11.9%) represent the smallest median family size with 2.19 persons per family.
| Family Type | # Families | Family Size |
| Married-Couple | 178 (66.4%) | 3.74 |
| Single Male/Father | 32 (11.9%) | 2.19 |
| Single Female/Mother | 58 (21.6%) | 3.16 |
| Total Families | 268 (100.0%) | 3.43 |
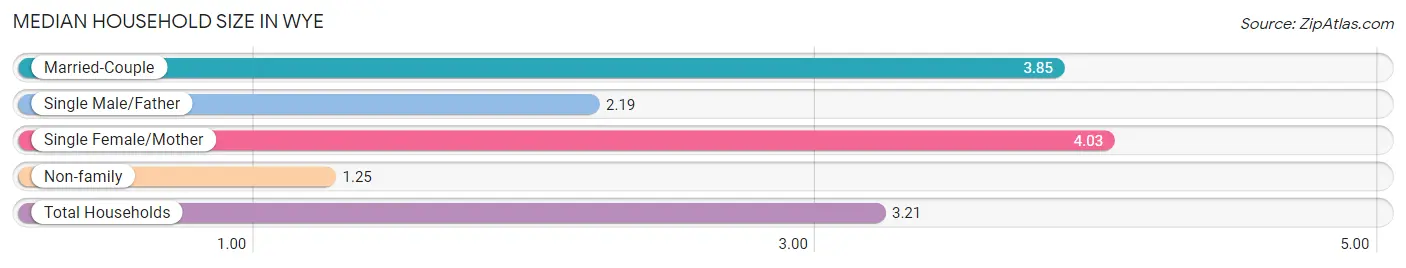
Median Household Size in Wye
The median household size in Wye is 3.21 persons per household, with single female/mother households (58 | 17.4%) accounting for the largest median household size of 4.03 persons per household. non-family households (65 | 19.5%) represent the smallest median household size with 1.25 persons per household.
| Household Type | # Households | Household Size |
| Married-Couple | 178 (53.4%) | 3.85 |
| Single Male/Father | 32 (9.6%) | 2.19 |
| Single Female/Mother | 58 (17.4%) | 4.03 |
| Non-family | 65 (19.5%) | 1.25 |
| Total Households | 333 (100.0%) | 3.21 |
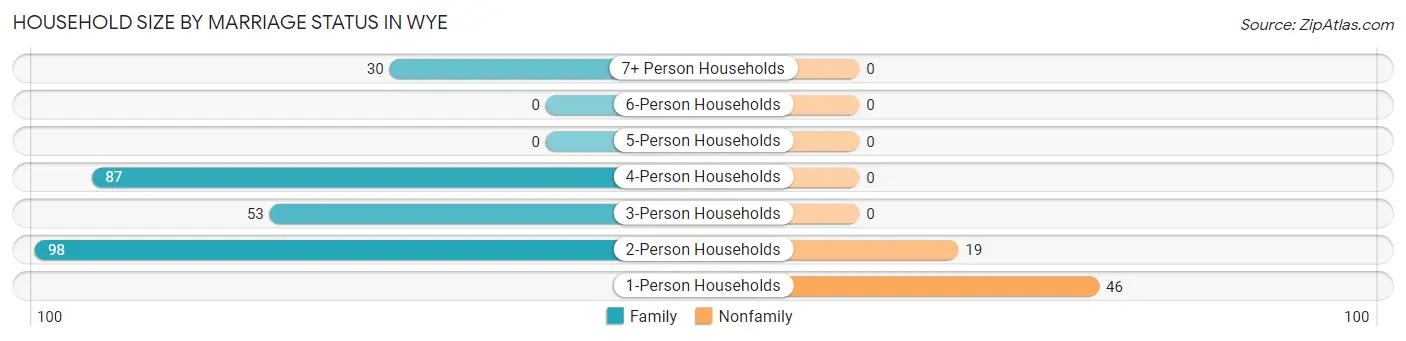
Household Size by Marriage Status in Wye
Out of a total of 333 households in Wye, 268 (80.5%) are family households, while 65 (19.5%) are nonfamily households. The most numerous type of family households are 2-person households, comprising 98, and the most common type of nonfamily households are 1-person households, comprising 46.
| Household Size | Family Households | Nonfamily Households |
| 1-Person Households | - | 46 (13.8%) |
| 2-Person Households | 98 (29.4%) | 19 (5.7%) |
| 3-Person Households | 53 (15.9%) | 0 (0.0%) |
| 4-Person Households | 87 (26.1%) | 0 (0.0%) |
| 5-Person Households | 0 (0.0%) | 0 (0.0%) |
| 6-Person Households | 0 (0.0%) | 0 (0.0%) |
| 7+ Person Households | 30 (9.0%) | 0 (0.0%) |
| Total | 268 (80.5%) | 65 (19.5%) |
Female Fertility in Wye
Fertility by Age in Wye
Average fertility rate in Wye is 50.0 births per 1,000 women. Women in the age bracket of 35 to 50 years have the highest fertility rate with 135.0 births per 1,000 women. Women in the age bracket of 35 to 50 years acount for 100.0% of all women with births.
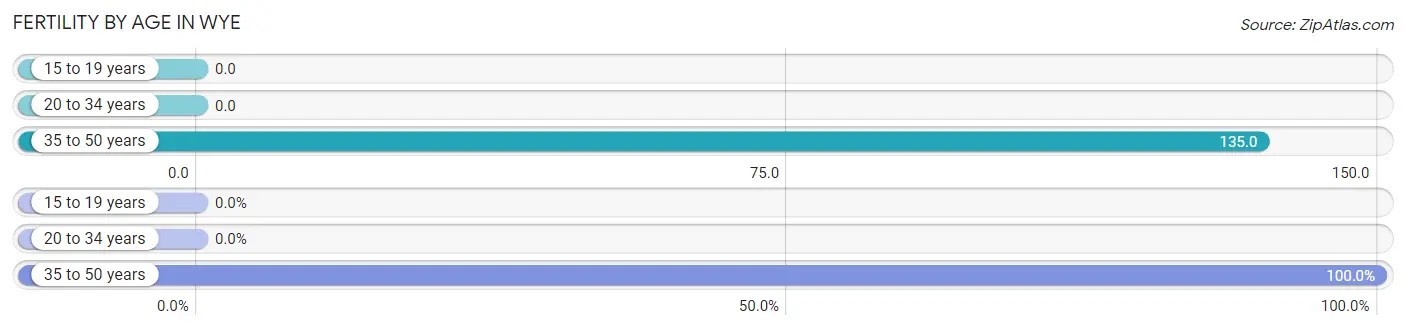
| Age Bracket | Women with Births | Births / 1,000 Women |
| 15 to 19 years | 0 (0.0%) | 0.0 |
| 20 to 34 years | 0 (0.0%) | 0.0 |
| 35 to 50 years | 14 (100.0%) | 135.0 |
| Total | 14 (100.0%) | 50.0 |
Fertility by Age by Marriage Status in Wye
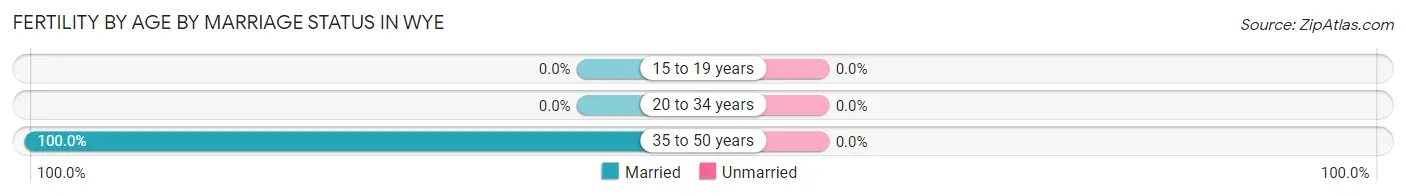
| Age Bracket | Married | Unmarried |
| 15 to 19 years | 0 (0.0%) | 0 (0.0%) |
| 20 to 34 years | 0 (0.0%) | 0 (0.0%) |
| 35 to 50 years | 14 (100.0%) | 0 (0.0%) |
| Total | 14 (100.0%) | 0 (0.0%) |
Fertility by Education in Wye
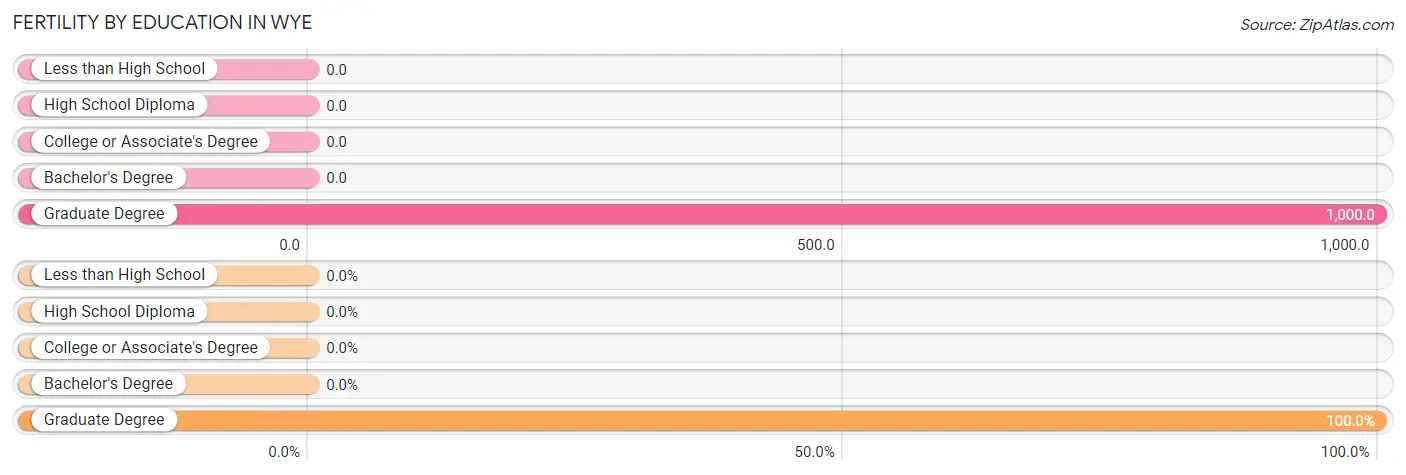
| Educational Attainment | Women with Births | Births / 1,000 Women |
| Less than High School | 0 (0.0%) | 0.0 |
| High School Diploma | 0 (0.0%) | 0.0 |
| College or Associate's Degree | 0 (0.0%) | 0.0 |
| Bachelor's Degree | 0 (0.0%) | 0.0 |
| Graduate Degree | 14 (100.0%) | 1,000.0 |
| Total | 14 (100.0%) | 50.0 |
Fertility by Education by Marriage Status in Wye
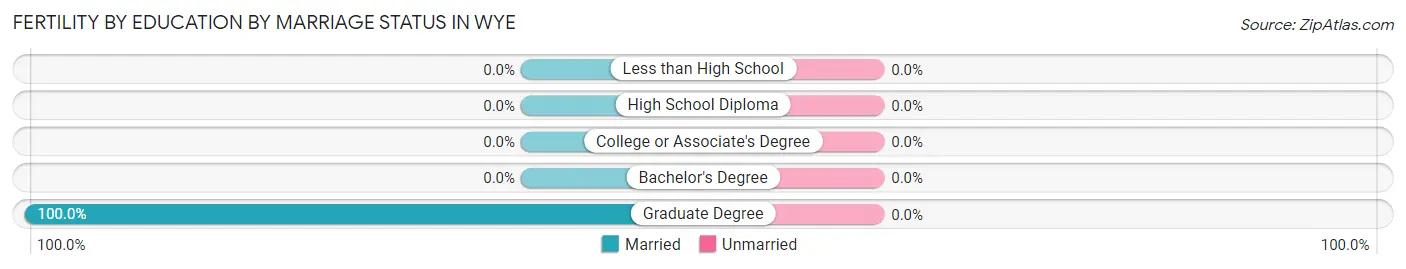
| Educational Attainment | Married | Unmarried |
| Less than High School | 0 (0.0%) | 0 (0.0%) |
| High School Diploma | 0 (0.0%) | 0 (0.0%) |
| College or Associate's Degree | 0 (0.0%) | 0 (0.0%) |
| Bachelor's Degree | 0 (0.0%) | 0 (0.0%) |
| Graduate Degree | 14 (100.0%) | 0 (0.0%) |
| Total | 14 (100.0%) | 0 (0.0%) |
Income in Wye
Income Overview in Wye
Per Capita Income in Wye is $40,504, while median incomes of families and households are $91,522 and $93,264 respectively.
| Characteristic | Number | Measure |
| Per Capita Income | 1,074 | $40,504 |
| Median Family Income | 268 | $91,522 |
| Mean Family Income | 268 | $115,513 |
| Median Household Income | 333 | $93,264 |
| Mean Household Income | 333 | $118,642 |
| Income Deficit | 268 | $0 |
| Wage / Income Gap (%) | 1,074 | 40.61% |
| Wage / Income Gap ($) | 1,074 | 59.39¢ per $1 |
| Gini / Inequality Index | 1,074 | 0.28 |
Earnings by Sex in Wye
Average Earnings in Wye are $70,843, $76,080 for men and $45,186 for women, a difference of 40.6%.
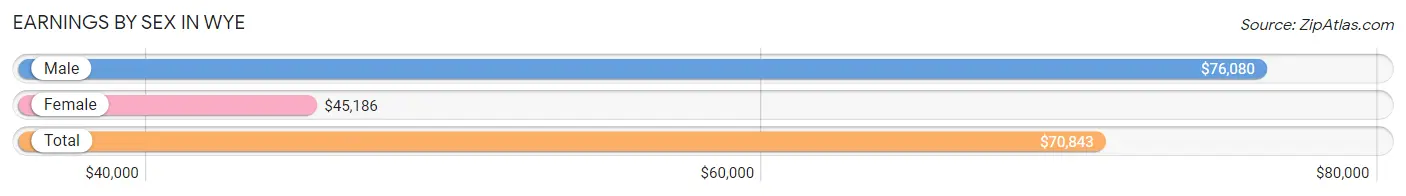
| Sex | Number | Average Earnings |
| Male | 438 (63.4%) | $76,080 |
| Female | 253 (36.6%) | $45,186 |
| Total | 691 (100.0%) | $70,843 |
Earnings by Sex by Income Bracket in Wye
The most common earnings brackets in Wye are $75,000 to $99,999 for men (153 | 34.9%) and $15,000 to $17,499 for women (68 | 26.9%).
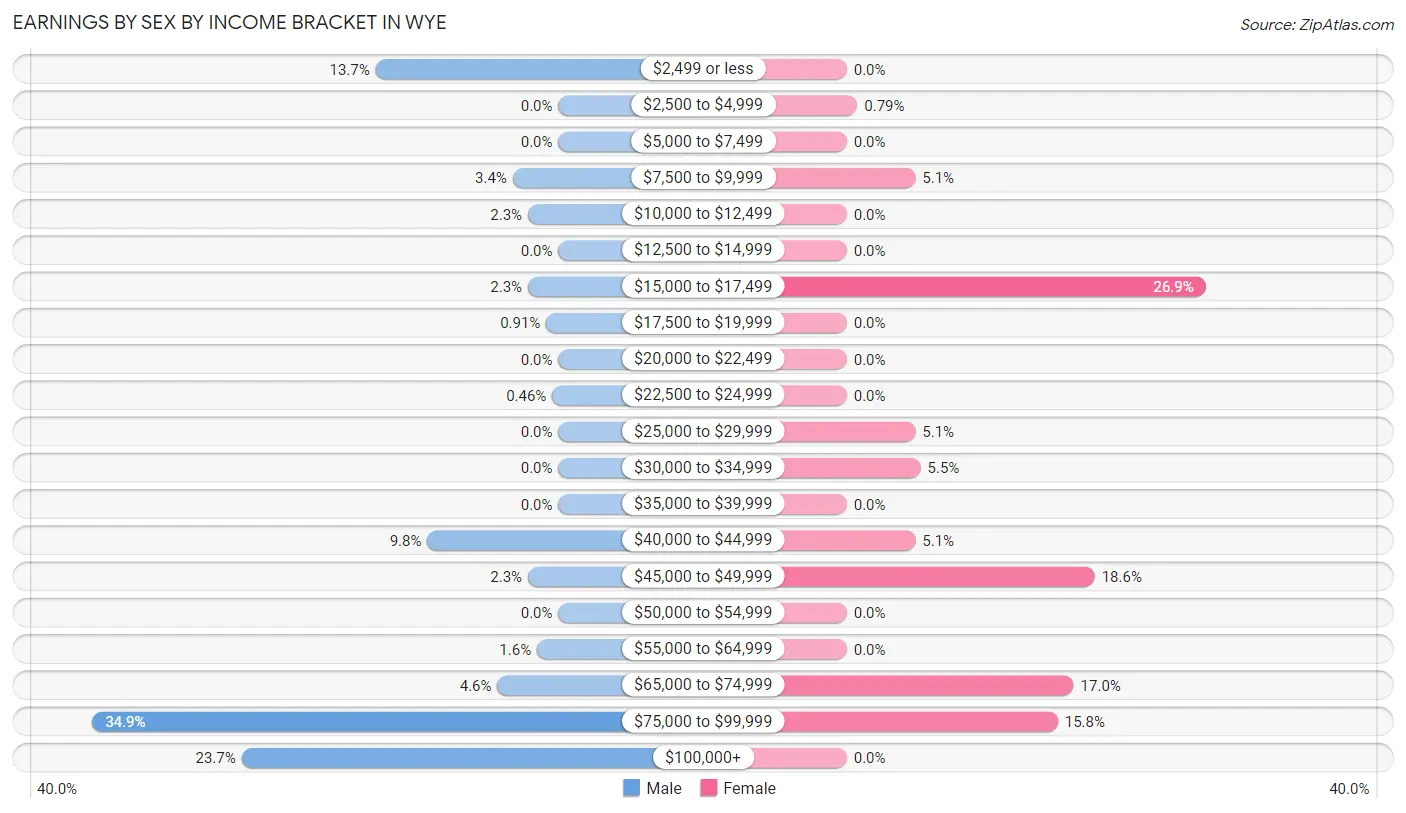
| Income | Male | Female |
| $2,499 or less | 60 (13.7%) | 0 (0.0%) |
| $2,500 to $4,999 | 0 (0.0%) | 2 (0.8%) |
| $5,000 to $7,499 | 0 (0.0%) | 0 (0.0%) |
| $7,500 to $9,999 | 15 (3.4%) | 13 (5.1%) |
| $10,000 to $12,499 | 10 (2.3%) | 0 (0.0%) |
| $12,500 to $14,999 | 0 (0.0%) | 0 (0.0%) |
| $15,000 to $17,499 | 10 (2.3%) | 68 (26.9%) |
| $17,500 to $19,999 | 4 (0.9%) | 0 (0.0%) |
| $20,000 to $22,499 | 0 (0.0%) | 0 (0.0%) |
| $22,500 to $24,999 | 2 (0.5%) | 0 (0.0%) |
| $25,000 to $29,999 | 0 (0.0%) | 13 (5.1%) |
| $30,000 to $34,999 | 0 (0.0%) | 14 (5.5%) |
| $35,000 to $39,999 | 0 (0.0%) | 0 (0.0%) |
| $40,000 to $44,999 | 43 (9.8%) | 13 (5.1%) |
| $45,000 to $49,999 | 10 (2.3%) | 47 (18.6%) |
| $50,000 to $54,999 | 0 (0.0%) | 0 (0.0%) |
| $55,000 to $64,999 | 7 (1.6%) | 0 (0.0%) |
| $65,000 to $74,999 | 20 (4.6%) | 43 (17.0%) |
| $75,000 to $99,999 | 153 (34.9%) | 40 (15.8%) |
| $100,000+ | 104 (23.7%) | 0 (0.0%) |
| Total | 438 (100.0%) | 253 (100.0%) |
Earnings by Sex by Educational Attainment in Wye
Average earnings in Wye are $77,486 for men and $70,203 for women, a difference of 9.4%. Men with an educational attainment of bachelor's degree enjoy the highest average annual earnings of $114,730, while those with college or associate's degree education earn the least with $90,039. Women with an educational attainment of college or associate's degree earn the most with the average annual earnings of $47,048, while those with college or associate's degree education have the smallest earnings of $47,048.
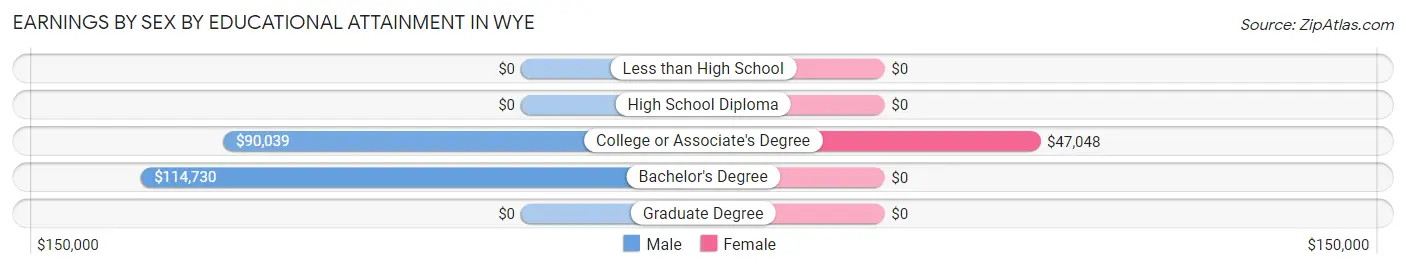
| Educational Attainment | Male Income | Female Income |
| Less than High School | - | - |
| High School Diploma | - | - |
| College or Associate's Degree | $90,039 | $47,048 |
| Bachelor's Degree | $114,730 | $0 |
| Graduate Degree | - | - |
| Total | $77,486 | $70,203 |
Family Income in Wye
Family Income Brackets in Wye
According to the Wye family income data, there are 87 families falling into the $75,000 to $99,999 income range, which is the most common income bracket and makes up 32.5% of all families.
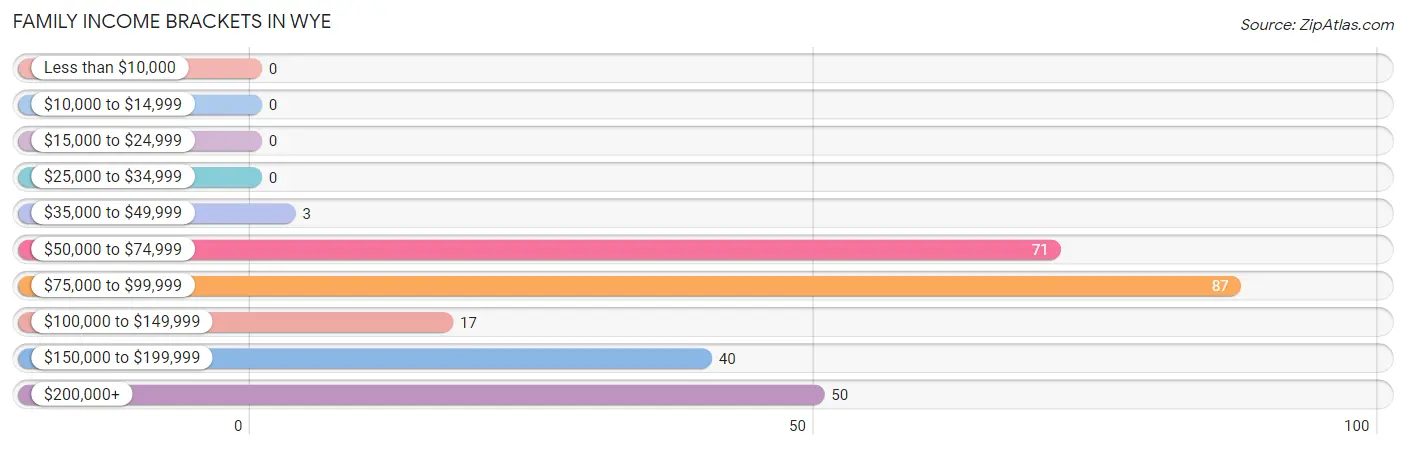
| Income Bracket | # Families | % Families |
| Less than $10,000 | 0 | 0.0% |
| $10,000 to $14,999 | 0 | 0.0% |
| $15,000 to $24,999 | 0 | 0.0% |
| $25,000 to $34,999 | 0 | 0.0% |
| $35,000 to $49,999 | 3 | 1.1% |
| $50,000 to $74,999 | 71 | 26.5% |
| $75,000 to $99,999 | 87 | 32.5% |
| $100,000 to $149,999 | 17 | 6.3% |
| $150,000 to $199,999 | 40 | 14.9% |
| $200,000+ | 50 | 18.7% |
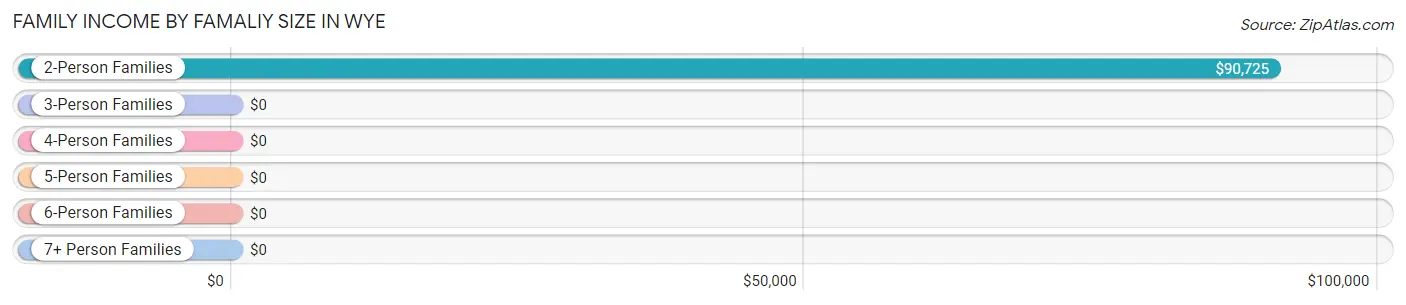
Family Income by Famaliy Size in Wye
2-person families (98 | 36.6%) account for the highest median family income in Wye with $90,725 per family, while 2-person families (98 | 36.6%) have the highest median income of $45,362 per family member.
| Income Bracket | # Families | Median Income |
| 2-Person Families | 98 (36.6%) | $90,725 |
| 3-Person Families | 100 (37.3%) | $0 |
| 4-Person Families | 40 (14.9%) | $0 |
| 5-Person Families | 0 (0.0%) | $0 |
| 6-Person Families | 14 (5.2%) | $0 |
| 7+ Person Families | 16 (6.0%) | $0 |
| Total | 268 (100.0%) | $91,522 |
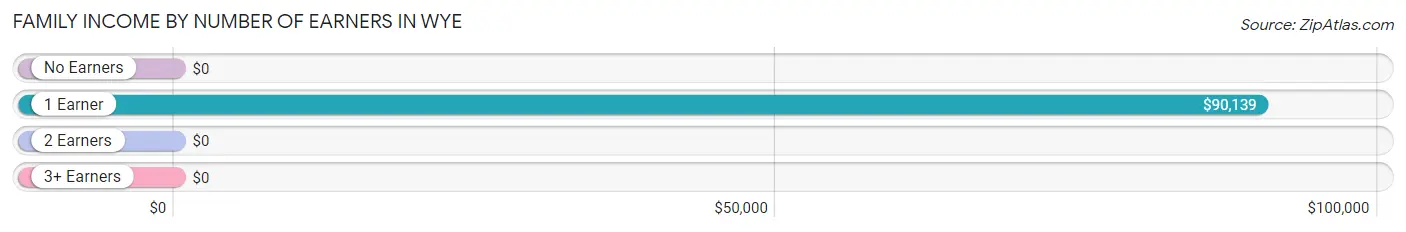
Family Income by Number of Earners in Wye
| Number of Earners | # Families | Median Income |
| No Earners | 0 (0.0%) | $0 |
| 1 Earner | 57 (21.3%) | $90,139 |
| 2 Earners | 197 (73.5%) | $0 |
| 3+ Earners | 14 (5.2%) | $0 |
| Total | 268 (100.0%) | $91,522 |
Household Income in Wye
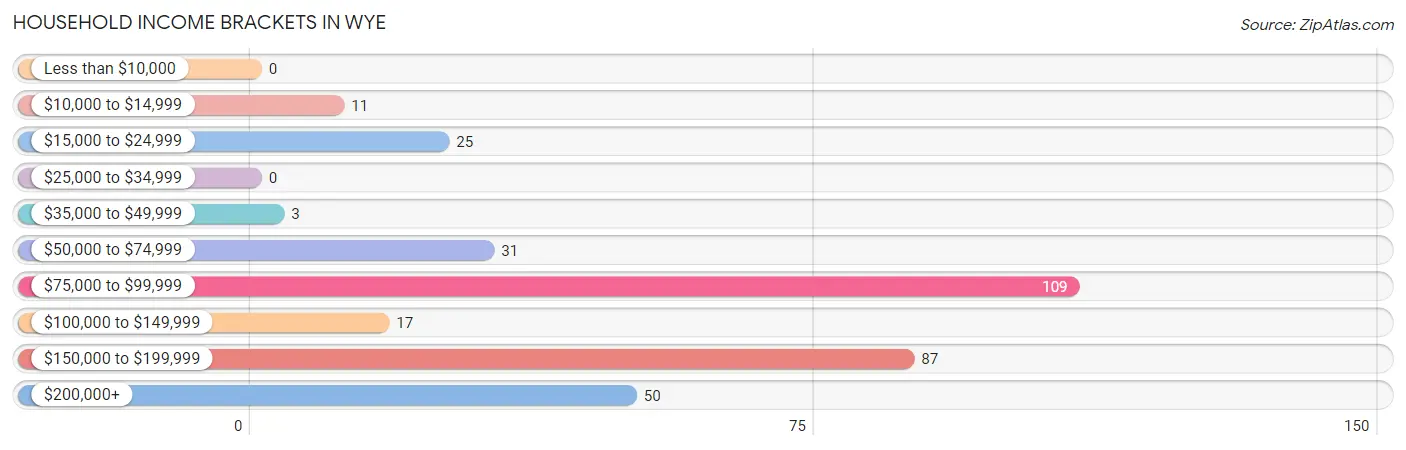
Household Income Brackets in Wye
With 109 households falling in the category, the $75,000 to $99,999 income range is the most frequent in Wye, accounting for 32.7% of all households.
| Income Bracket | # Households | % Households |
| Less than $10,000 | 0 | 0.0% |
| $10,000 to $14,999 | 11 | 3.3% |
| $15,000 to $24,999 | 25 | 7.5% |
| $25,000 to $34,999 | 0 | 0.0% |
| $35,000 to $49,999 | 3 | 0.9% |
| $50,000 to $74,999 | 31 | 9.3% |
| $75,000 to $99,999 | 109 | 32.7% |
| $100,000 to $149,999 | 17 | 5.1% |
| $150,000 to $199,999 | 87 | 26.1% |
| $200,000+ | 50 | 15.0% |
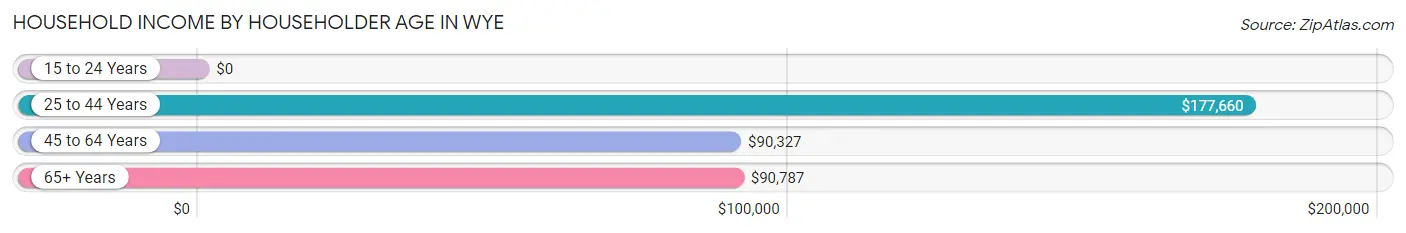
Household Income by Householder Age in Wye
The median household income in Wye is $93,264, with the highest median household income of $177,660 found in the 25 to 44 years age bracket for the primary householder. A total of 188 households (56.5%) fall into this category. Meanwhile, the 15 to 24 years age bracket for the primary householder has the lowest median household income of $0, with 35 households (10.5%) in this group.
| Income Bracket | # Households | Median Income |
| 15 to 24 Years | 35 (10.5%) | $0 |
| 25 to 44 Years | 188 (56.5%) | $177,660 |
| 45 to 64 Years | 73 (21.9%) | $90,327 |
| 65+ Years | 37 (11.1%) | $90,787 |
| Total | 333 (100.0%) | $93,264 |
Poverty in Wye
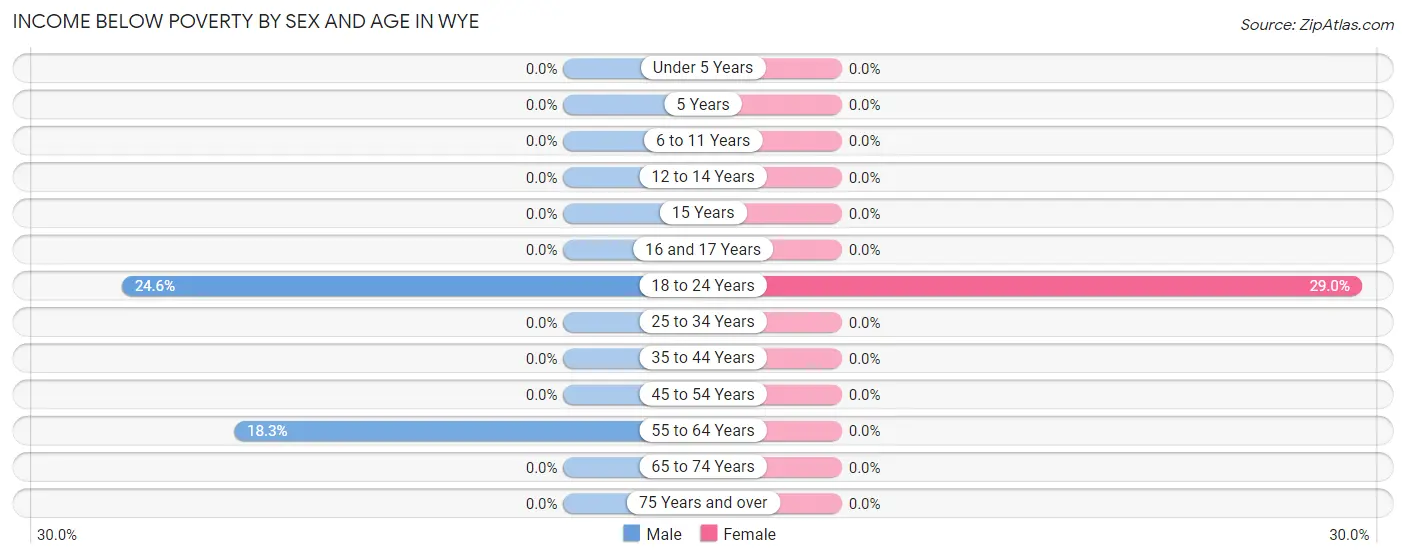
Income Below Poverty by Sex and Age in Wye
With 4.8% poverty level for males and 6.2% for females among the residents of Wye, 18 to 24 year old males and 18 to 24 year old females are the most vulnerable to poverty, with 15 males (24.6%) and 33 females (28.9%) in their respective age groups living below the poverty level.
| Age Bracket | Male | Female |
| Under 5 Years | 0 (0.0%) | 0 (0.0%) |
| 5 Years | 0 (0.0%) | 0 (0.0%) |
| 6 to 11 Years | 0 (0.0%) | 0 (0.0%) |
| 12 to 14 Years | 0 (0.0%) | 0 (0.0%) |
| 15 Years | 0 (0.0%) | 0 (0.0%) |
| 16 and 17 Years | 0 (0.0%) | 0 (0.0%) |
| 18 to 24 Years | 15 (24.6%) | 33 (28.9%) |
| 25 to 34 Years | 0 (0.0%) | 0 (0.0%) |
| 35 to 44 Years | 0 (0.0%) | 0 (0.0%) |
| 45 to 54 Years | 0 (0.0%) | 0 (0.0%) |
| 55 to 64 Years | 11 (18.3%) | 0 (0.0%) |
| 65 to 74 Years | 0 (0.0%) | 0 (0.0%) |
| 75 Years and over | 0 (0.0%) | 0 (0.0%) |
| Total | 26 (4.8%) | 33 (6.2%) |
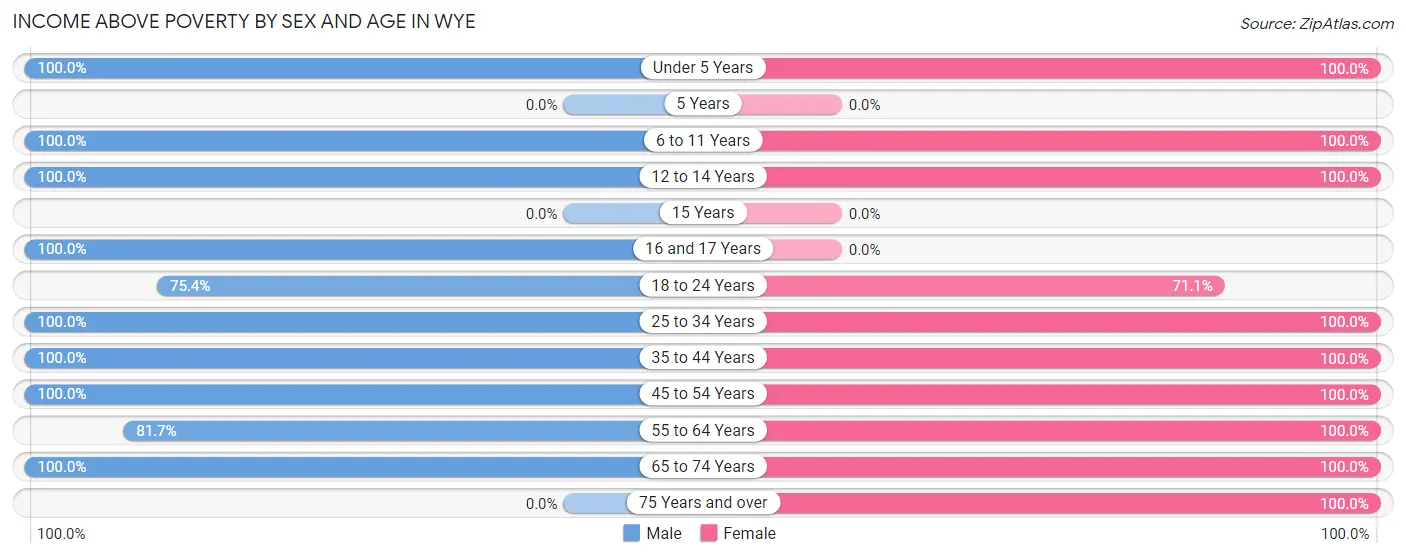
Income Above Poverty by Sex and Age in Wye
According to the poverty statistics in Wye, males aged under 5 years and females aged under 5 years are the age groups that are most secure financially, with 100.0% of males and 100.0% of females in these age groups living above the poverty line.
| Age Bracket | Male | Female |
| Under 5 Years | 16 (100.0%) | 60 (100.0%) |
| 5 Years | 0 (0.0%) | 0 (0.0%) |
| 6 to 11 Years | 62 (100.0%) | 52 (100.0%) |
| 12 to 14 Years | 15 (100.0%) | 91 (100.0%) |
| 15 Years | 0 (0.0%) | 0 (0.0%) |
| 16 and 17 Years | 38 (100.0%) | 0 (0.0%) |
| 18 to 24 Years | 46 (75.4%) | 81 (71.1%) |
| 25 to 34 Years | 69 (100.0%) | 61 (100.0%) |
| 35 to 44 Years | 182 (100.0%) | 101 (100.0%) |
| 45 to 54 Years | 10 (100.0%) | 3 (100.0%) |
| 55 to 64 Years | 49 (81.7%) | 12 (100.0%) |
| 65 to 74 Years | 29 (100.0%) | 35 (100.0%) |
| 75 Years and over | 0 (0.0%) | 3 (100.0%) |
| Total | 516 (95.2%) | 499 (93.8%) |
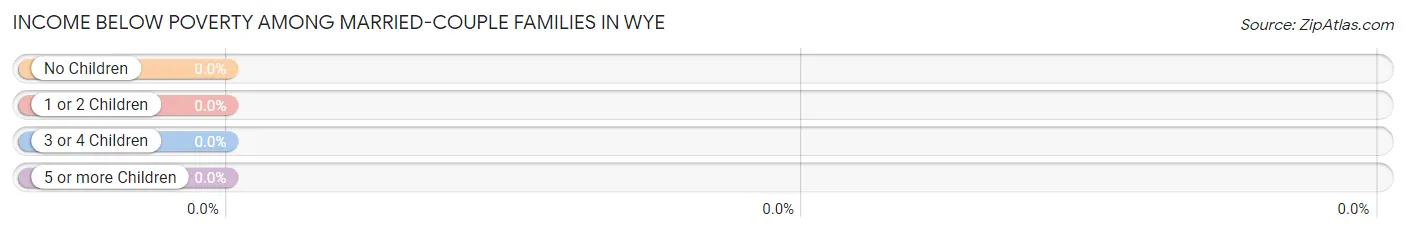
Income Below Poverty Among Married-Couple Families in Wye
| Children | Above Poverty | Below Poverty |
| No Children | 55 (100.0%) | 0 (0.0%) |
| 1 or 2 Children | 93 (100.0%) | 0 (0.0%) |
| 3 or 4 Children | 14 (100.0%) | 0 (0.0%) |
| 5 or more Children | 16 (100.0%) | 0 (0.0%) |
| Total | 178 (100.0%) | 0 (0.0%) |
Income Below Poverty Among Single-Parent Households in Wye
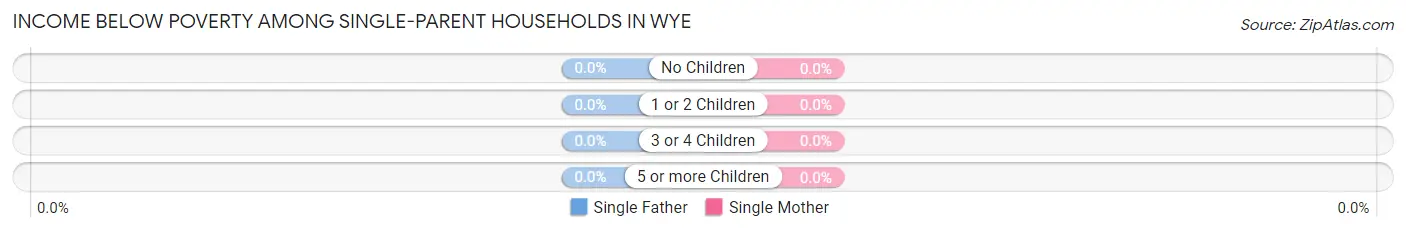
| Children | Single Father | Single Mother |
| No Children | 0 (0.0%) | 0 (0.0%) |
| 1 or 2 Children | 0 (0.0%) | 0 (0.0%) |
| 3 or 4 Children | 0 (0.0%) | 0 (0.0%) |
| 5 or more Children | 0 (0.0%) | 0 (0.0%) |
| Total | 0 (0.0%) | 0 (0.0%) |
Income Below Poverty Among Married-Couple vs Single-Parent Households in Wye
| Children | Married-Couple Families | Single-Parent Households |
| No Children | 0 (0.0%) | 0 (0.0%) |
| 1 or 2 Children | 0 (0.0%) | 0 (0.0%) |
| 3 or 4 Children | 0 (0.0%) | 0 (0.0%) |
| 5 or more Children | 0 (0.0%) | 0 (0.0%) |
| Total | 0 (0.0%) | 0 (0.0%) |
Employment Characteristics in Wye
Employment by Class of Employer in Wye
Among the 598 employed individuals in Wye, private company employees (265 | 44.3%), not-for-profit organizations (173 | 28.9%), and federal government employees (81 | 13.6%) make up the most common classes of employment.
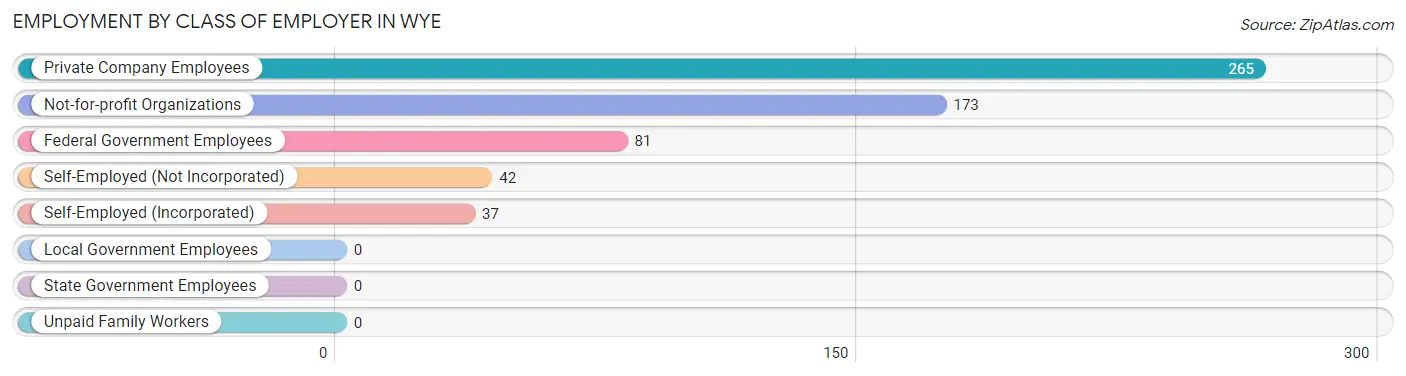
| Employer Class | # Employees | % Employees |
| Private Company Employees | 265 | 44.3% |
| Self-Employed (Incorporated) | 37 | 6.2% |
| Self-Employed (Not Incorporated) | 42 | 7.0% |
| Not-for-profit Organizations | 173 | 28.9% |
| Local Government Employees | 0 | 0.0% |
| State Government Employees | 0 | 0.0% |
| Federal Government Employees | 81 | 13.6% |
| Unpaid Family Workers | 0 | 0.0% |
| Total | 598 | 100.0% |
Employment Status by Age in Wye
According to the labor force statistics for Wye, out of the total population over 16 years of age (778), 83.9% or 653 individuals are in the labor force, with 5.7% or 37 of them unemployed. The age group with the highest labor force participation rate is 35 to 44 years, with 100.0% or 283 individuals in the labor force. Within the labor force, the 16 to 19 years age range has the highest percentage of unemployed individuals, with 68.5% or 37 of them being unemployed.
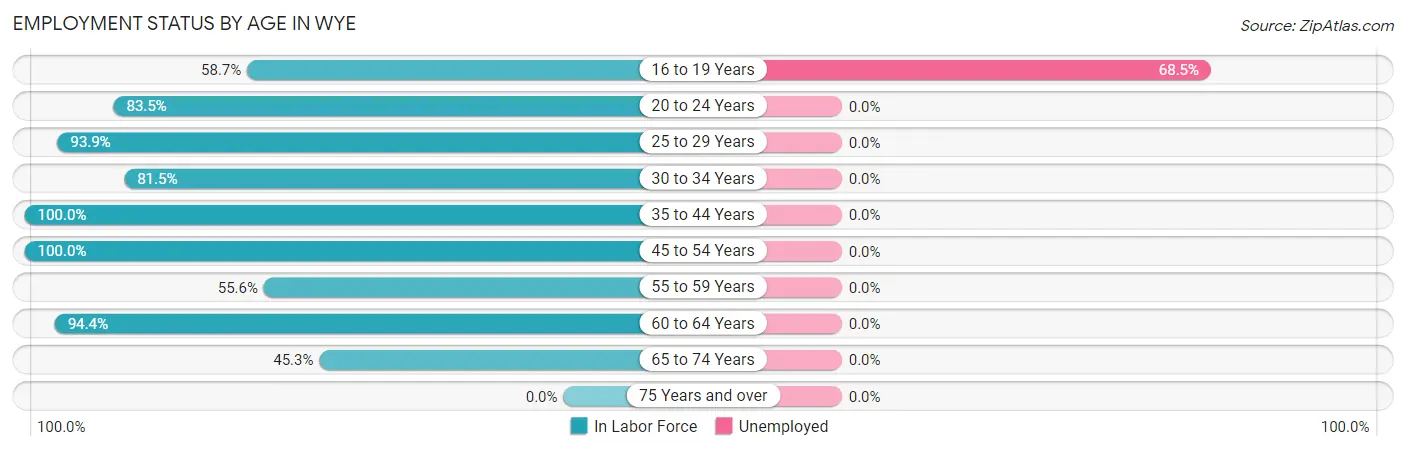
| Age Bracket | In Labor Force | Unemployed |
| 16 to 19 Years | 54 (58.7%) | 37 (68.5%) |
| 20 to 24 Years | 101 (83.5%) | 0 (0.0%) |
| 25 to 29 Years | 46 (93.9%) | 0 (0.0%) |
| 30 to 34 Years | 66 (81.5%) | 0 (0.0%) |
| 35 to 44 Years | 283 (100.0%) | 0 (0.0%) |
| 45 to 54 Years | 13 (100.0%) | 0 (0.0%) |
| 55 to 59 Years | 10 (55.6%) | 0 (0.0%) |
| 60 to 64 Years | 51 (94.4%) | 0 (0.0%) |
| 65 to 74 Years | 29 (45.3%) | 0 (0.0%) |
| 75 Years and over | 0 (0.0%) | 0 (0.0%) |
| Total | 653 (83.9%) | 37 (5.7%) |
Employment Status by Educational Attainment in Wye
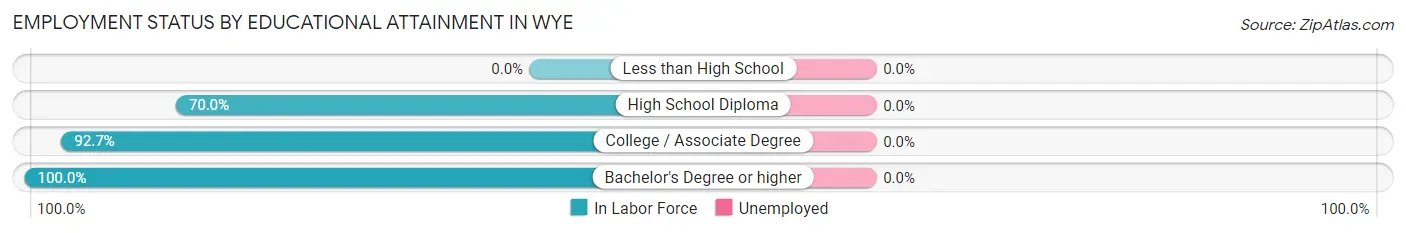
| Educational Attainment | In Labor Force | Unemployed |
| Less than High School | 0 (0.0%) | 0 (0.0%) |
| High School Diploma | 35 (70.0%) | 0 (0.0%) |
| College / Associate Degree | 179 (92.7%) | 0 (0.0%) |
| Bachelor's Degree or higher | 255 (100.0%) | 0 (0.0%) |
| Total | 469 (94.2%) | 0 (0.0%) |
Employment Occupations by Sex in Wye
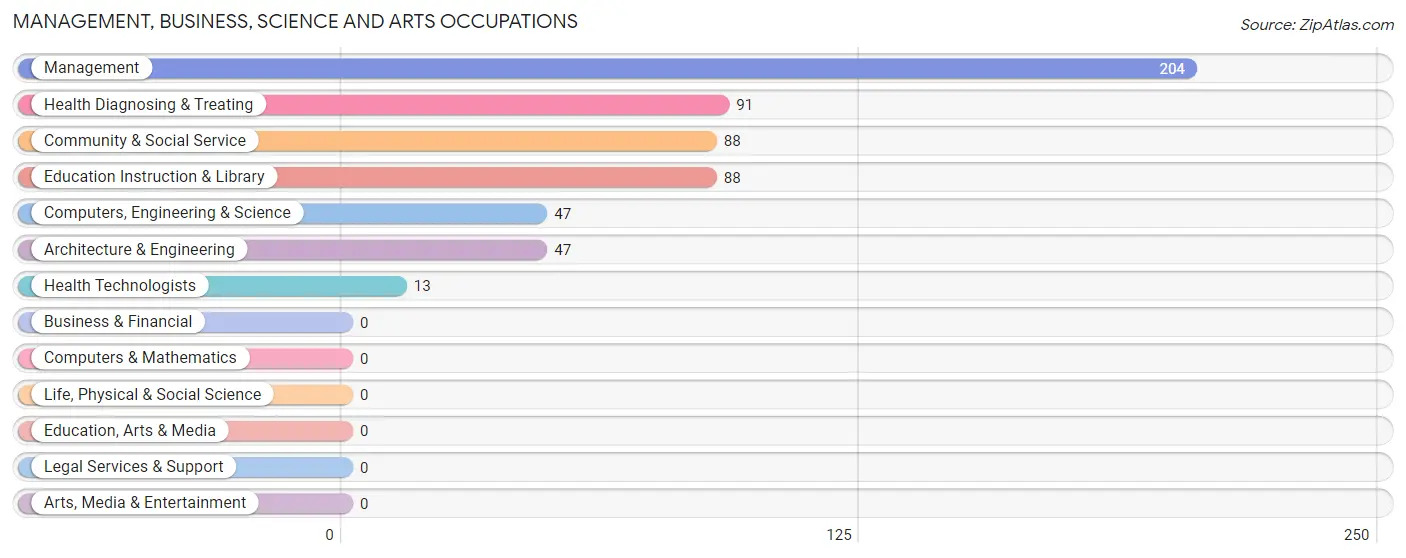
Management, Business, Science and Arts Occupations
The most common Management, Business, Science and Arts occupations in Wye are Management (204 | 33.1%), Health Diagnosing & Treating (91 | 14.8%), Community & Social Service (88 | 14.3%), Education Instruction & Library (88 | 14.3%), and Computers, Engineering & Science (47 | 7.6%).
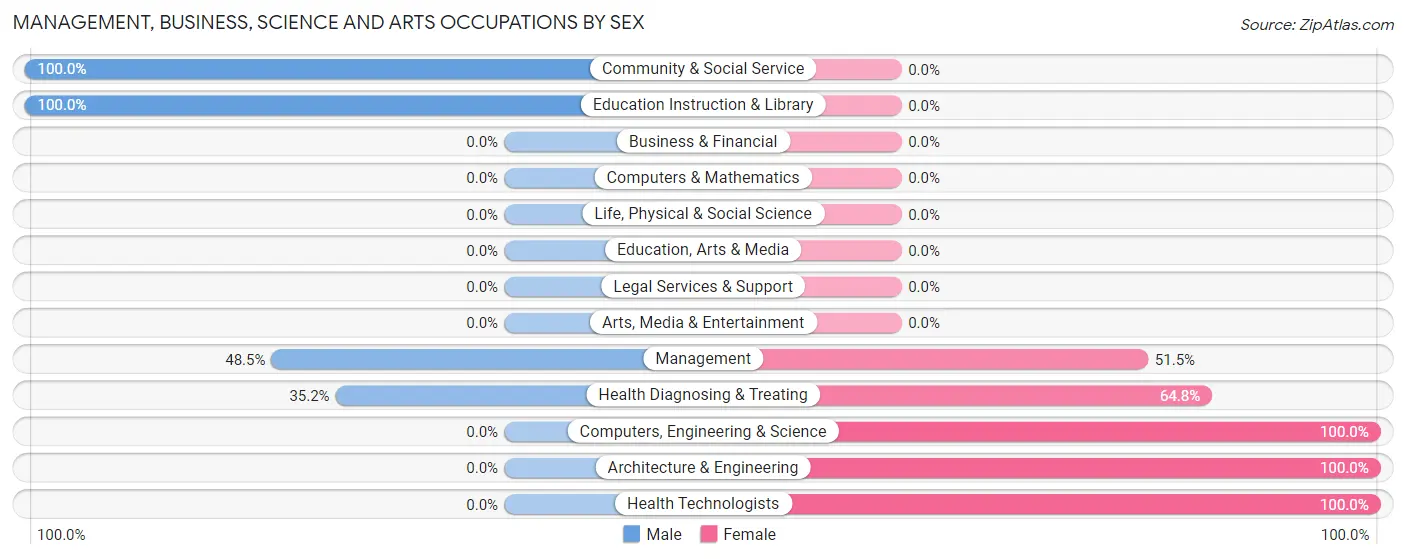
Management, Business, Science and Arts Occupations by Sex
Within the Management, Business, Science and Arts occupations in Wye, the most male-oriented occupations are Community & Social Service (100.0%), Education Instruction & Library (100.0%), and Management (48.5%), while the most female-oriented occupations are Computers, Engineering & Science (100.0%), Architecture & Engineering (100.0%), and Health Technologists (100.0%).
| Occupation | Male | Female |
| Management | 99 (48.5%) | 105 (51.5%) |
| Business & Financial | 0 (0.0%) | 0 (0.0%) |
| Computers, Engineering & Science | 0 (0.0%) | 47 (100.0%) |
| Computers & Mathematics | 0 (0.0%) | 0 (0.0%) |
| Architecture & Engineering | 0 (0.0%) | 47 (100.0%) |
| Life, Physical & Social Science | 0 (0.0%) | 0 (0.0%) |
| Community & Social Service | 88 (100.0%) | 0 (0.0%) |
| Education, Arts & Media | 0 (0.0%) | 0 (0.0%) |
| Legal Services & Support | 0 (0.0%) | 0 (0.0%) |
| Education Instruction & Library | 88 (100.0%) | 0 (0.0%) |
| Arts, Media & Entertainment | 0 (0.0%) | 0 (0.0%) |
| Health Diagnosing & Treating | 32 (35.2%) | 59 (64.8%) |
| Health Technologists | 0 (0.0%) | 13 (100.0%) |
| Total (Category) | 219 (50.9%) | 211 (49.1%) |
| Total (Overall) | 363 (58.9%) | 253 (41.1%) |
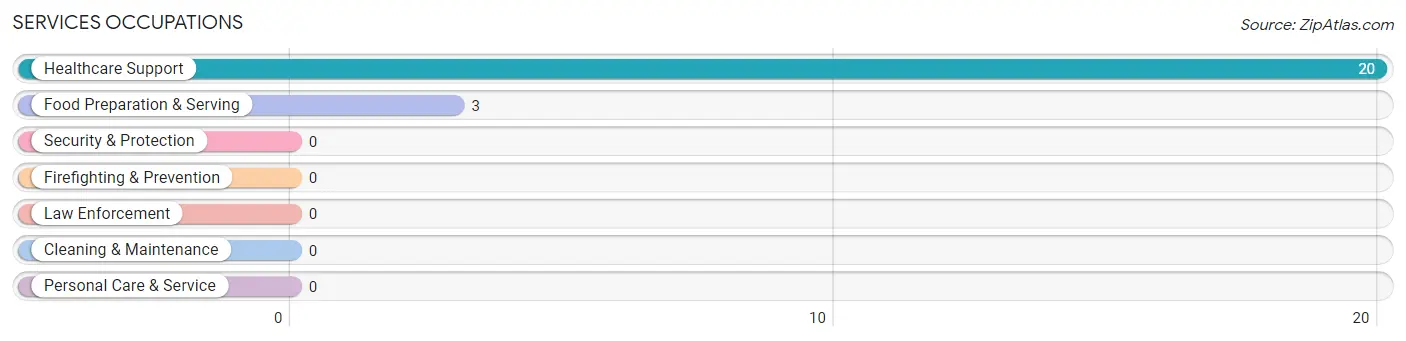
Services Occupations
The most common Services occupations in Wye are Healthcare Support (20 | 3.3%), and Food Preparation & Serving (3 | 0.5%).
Services Occupations by Sex
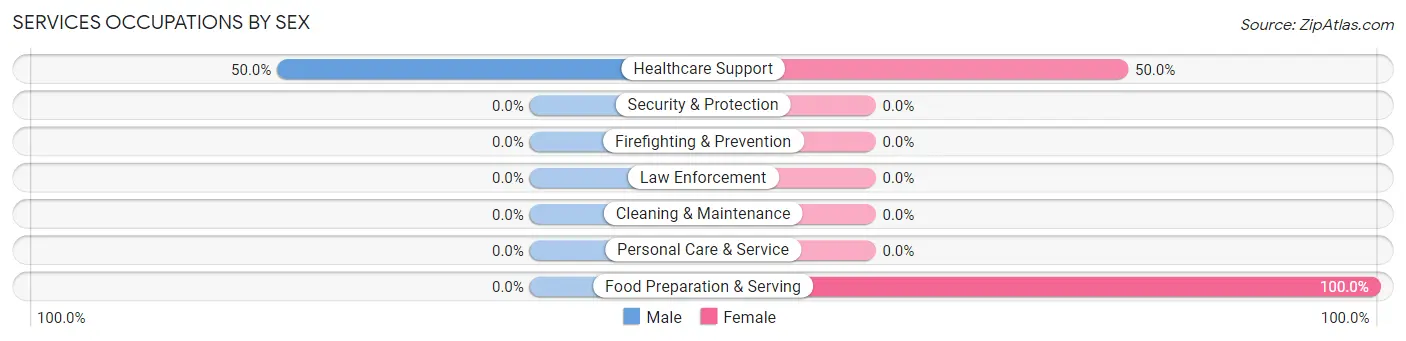
| Occupation | Male | Female |
| Healthcare Support | 10 (50.0%) | 10 (50.0%) |
| Security & Protection | 0 (0.0%) | 0 (0.0%) |
| Firefighting & Prevention | 0 (0.0%) | 0 (0.0%) |
| Law Enforcement | 0 (0.0%) | 0 (0.0%) |
| Food Preparation & Serving | 0 (0.0%) | 3 (100.0%) |
| Cleaning & Maintenance | 0 (0.0%) | 0 (0.0%) |
| Personal Care & Service | 0 (0.0%) | 0 (0.0%) |
| Total (Category) | 10 (43.5%) | 13 (56.5%) |
| Total (Overall) | 363 (58.9%) | 253 (41.1%) |
Sales and Office Occupations
The most common Sales and Office occupations in Wye are Sales & Related (78 | 12.7%), and Office & Administration (14 | 2.3%).

Sales and Office Occupations by Sex

| Occupation | Male | Female |
| Sales & Related | 65 (83.3%) | 13 (16.7%) |
| Office & Administration | 0 (0.0%) | 14 (100.0%) |
| Total (Category) | 65 (70.7%) | 27 (29.3%) |
| Total (Overall) | 363 (58.9%) | 253 (41.1%) |
Natural Resources, Construction and Maintenance Occupations
The most common Natural Resources, Construction and Maintenance occupations in Wye are Construction & Extraction (27 | 4.4%), and Farming, Fishing & Forestry (4 | 0.6%).
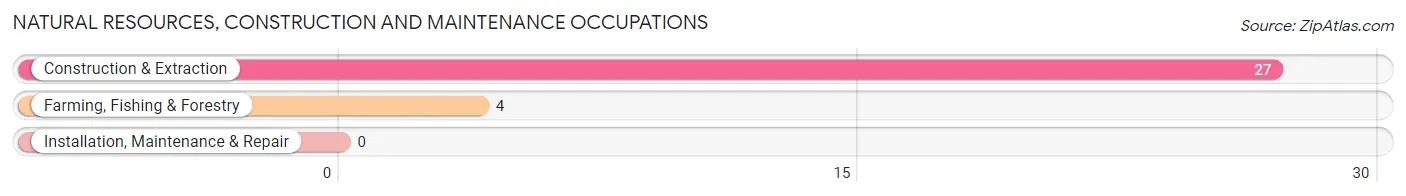
Natural Resources, Construction and Maintenance Occupations by Sex
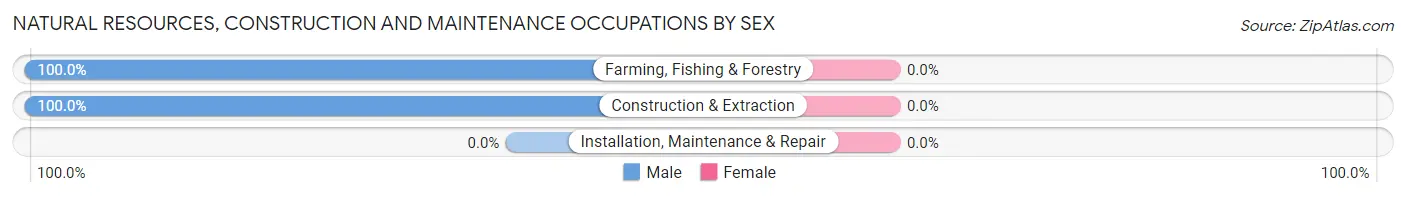
| Occupation | Male | Female |
| Farming, Fishing & Forestry | 4 (100.0%) | 0 (0.0%) |
| Construction & Extraction | 27 (100.0%) | 0 (0.0%) |
| Installation, Maintenance & Repair | 0 (0.0%) | 0 (0.0%) |
| Total (Category) | 31 (100.0%) | 0 (0.0%) |
| Total (Overall) | 363 (58.9%) | 253 (41.1%) |
Production, Transportation and Moving Occupations
The most common Production, Transportation and Moving occupations in Wye are Production (16 | 2.6%), Transportation (14 | 2.3%), and Material Moving (10 | 1.6%).
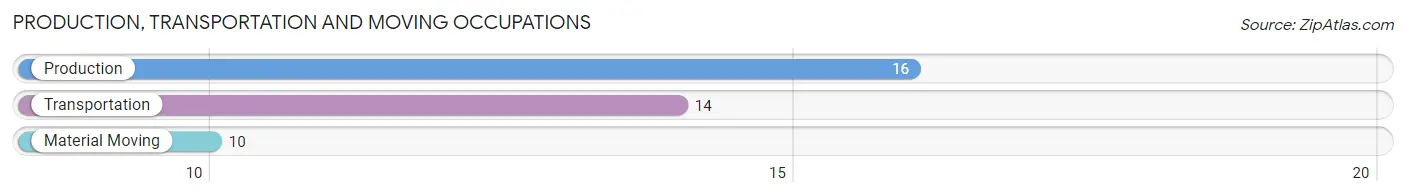
Production, Transportation and Moving Occupations by Sex
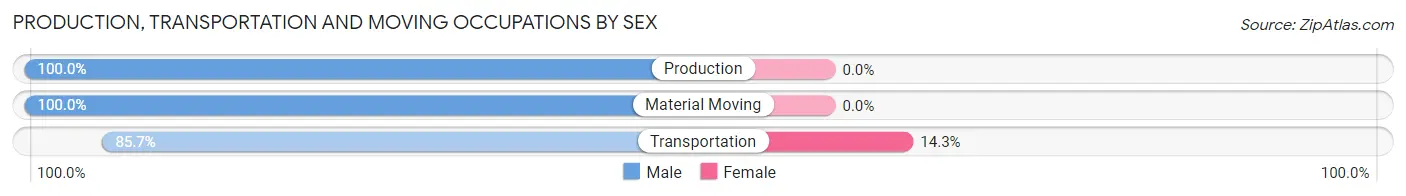
| Occupation | Male | Female |
| Production | 16 (100.0%) | 0 (0.0%) |
| Transportation | 12 (85.7%) | 2 (14.3%) |
| Material Moving | 10 (100.0%) | 0 (0.0%) |
| Total (Category) | 38 (95.0%) | 2 (5.0%) |
| Total (Overall) | 363 (58.9%) | 253 (41.1%) |
Employment Industries by Sex in Wye
Employment Industries in Wye
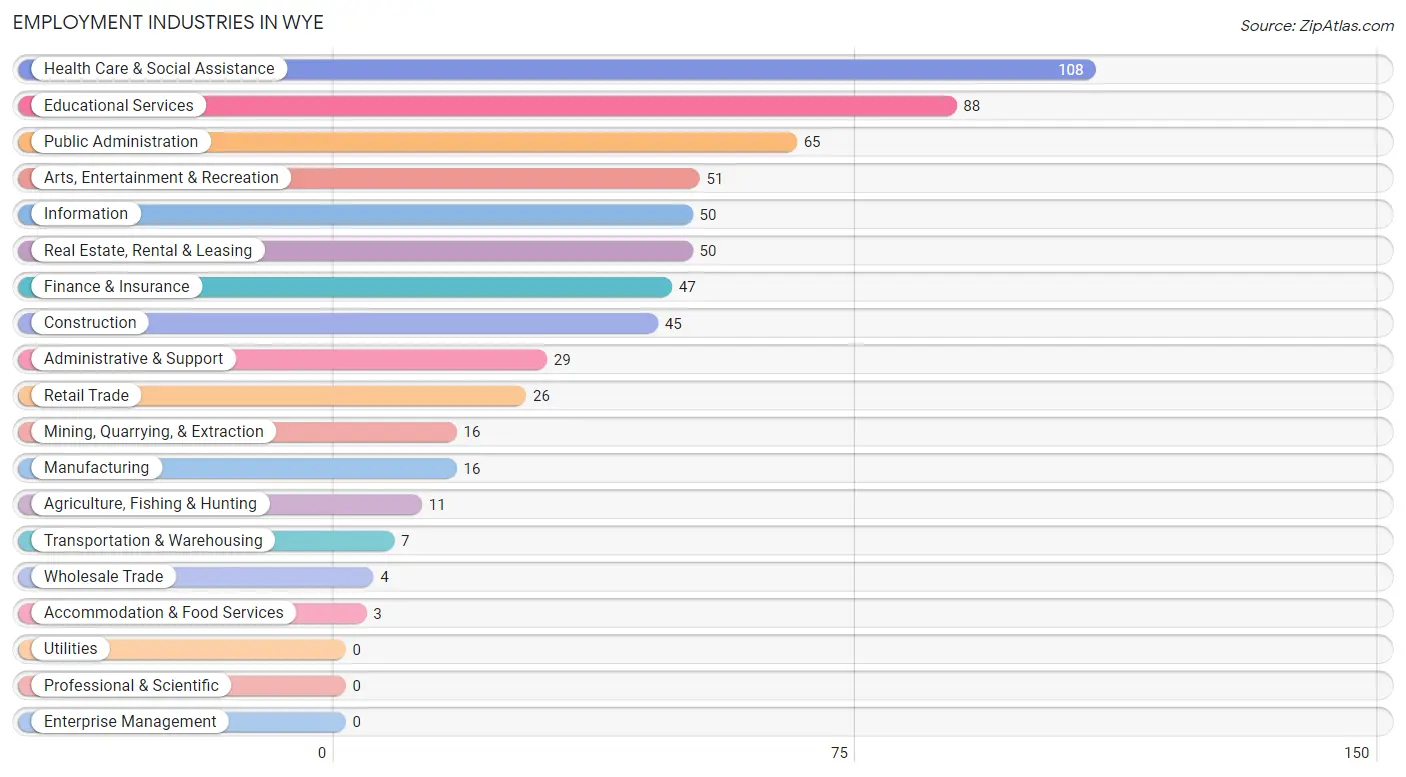
The major employment industries in Wye include Health Care & Social Assistance (108 | 17.5%), Educational Services (88 | 14.3%), Public Administration (65 | 10.5%), Arts, Entertainment & Recreation (51 | 8.3%), and Information (50 | 8.1%).
Employment Industries by Sex in Wye
The Wye industries that see more men than women are Agriculture, Fishing & Hunting (100.0%), Mining, Quarrying, & Extraction (100.0%), and Construction (100.0%), whereas the industries that tend to have a higher number of women are Finance & Insurance (100.0%), Accommodation & Food Services (100.0%), and Public Administration (100.0%).
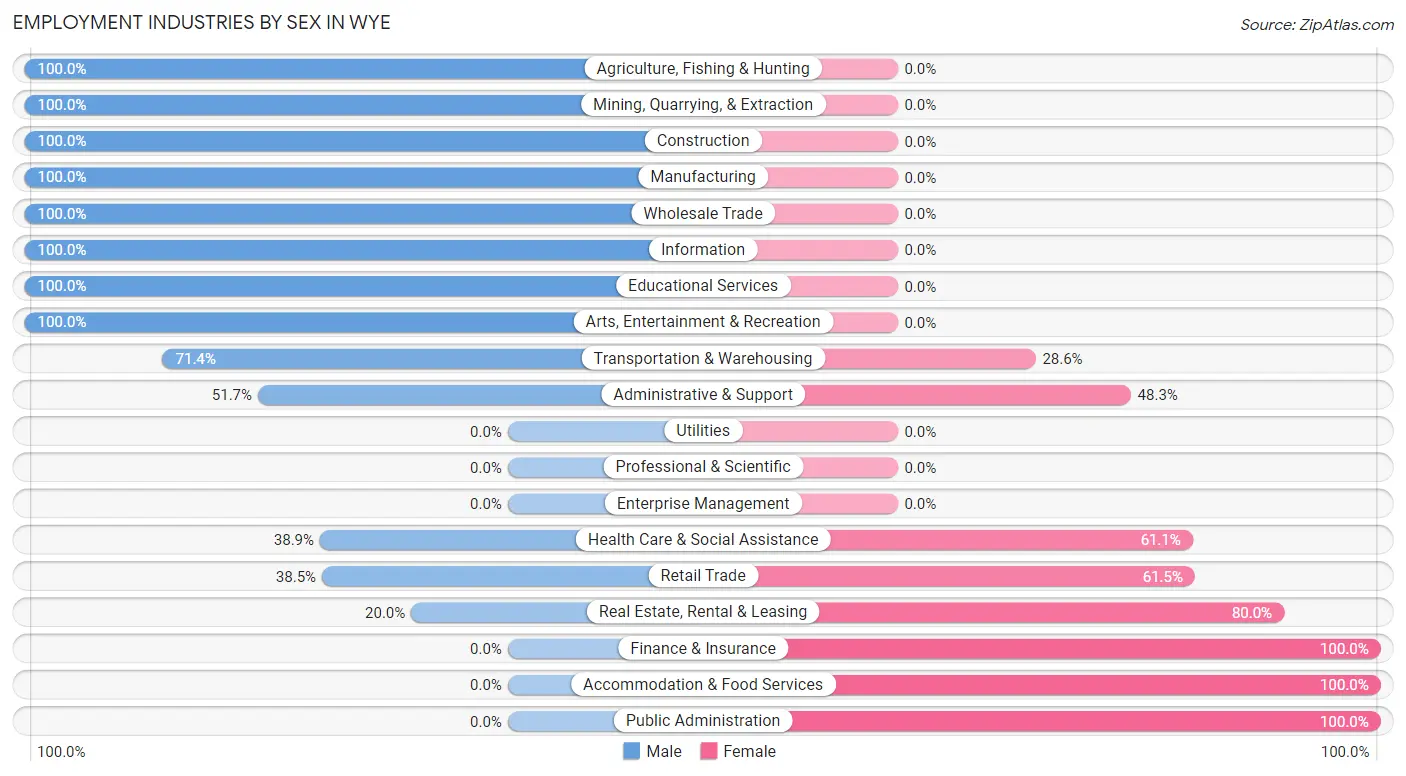
| Industry | Male | Female |
| Agriculture, Fishing & Hunting | 11 (100.0%) | 0 (0.0%) |
| Mining, Quarrying, & Extraction | 16 (100.0%) | 0 (0.0%) |
| Construction | 45 (100.0%) | 0 (0.0%) |
| Manufacturing | 16 (100.0%) | 0 (0.0%) |
| Wholesale Trade | 4 (100.0%) | 0 (0.0%) |
| Retail Trade | 10 (38.5%) | 16 (61.5%) |
| Transportation & Warehousing | 5 (71.4%) | 2 (28.6%) |
| Utilities | 0 (0.0%) | 0 (0.0%) |
| Information | 50 (100.0%) | 0 (0.0%) |
| Finance & Insurance | 0 (0.0%) | 47 (100.0%) |
| Real Estate, Rental & Leasing | 10 (20.0%) | 40 (80.0%) |
| Professional & Scientific | 0 (0.0%) | 0 (0.0%) |
| Enterprise Management | 0 (0.0%) | 0 (0.0%) |
| Administrative & Support | 15 (51.7%) | 14 (48.3%) |
| Educational Services | 88 (100.0%) | 0 (0.0%) |
| Health Care & Social Assistance | 42 (38.9%) | 66 (61.1%) |
| Arts, Entertainment & Recreation | 51 (100.0%) | 0 (0.0%) |
| Accommodation & Food Services | 0 (0.0%) | 3 (100.0%) |
| Public Administration | 0 (0.0%) | 65 (100.0%) |
| Total | 363 (58.9%) | 253 (41.1%) |
Education in Wye
School Enrollment in Wye
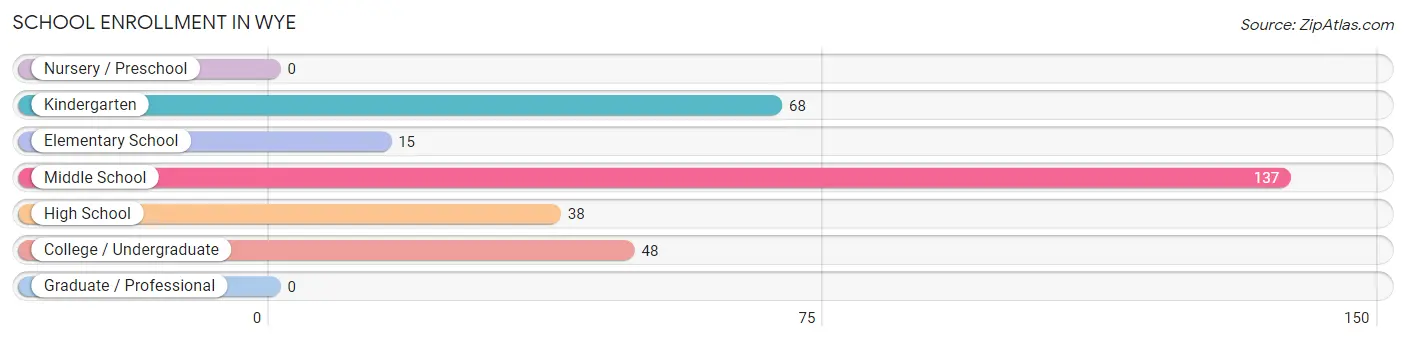
The most common levels of schooling among the 306 students in Wye are middle school (137 | 44.8%), kindergarten (68 | 22.2%), and college / undergraduate (48 | 15.7%).
| School Level | # Students | % Students |
| Nursery / Preschool | 0 | 0.0% |
| Kindergarten | 68 | 22.2% |
| Elementary School | 15 | 4.9% |
| Middle School | 137 | 44.8% |
| High School | 38 | 12.4% |
| College / Undergraduate | 48 | 15.7% |
| Graduate / Professional | 0 | 0.0% |
| Total | 306 | 100.0% |
School Enrollment by Age by Funding Source in Wye
Out of a total of 306 students who are enrolled in schools in Wye, 96 (31.4%) attend a private institution, while the remaining 210 (68.6%) are enrolled in public schools. The age group of 5 to 9 year old has the highest likelihood of being enrolled in private schools, with 52 (62.6% in the age bracket) enrolled. Conversely, the age group of 15 to 17 year olds has the lowest likelihood of being enrolled in a private school, with 38 (100.0% in the age bracket) attending a public institution.
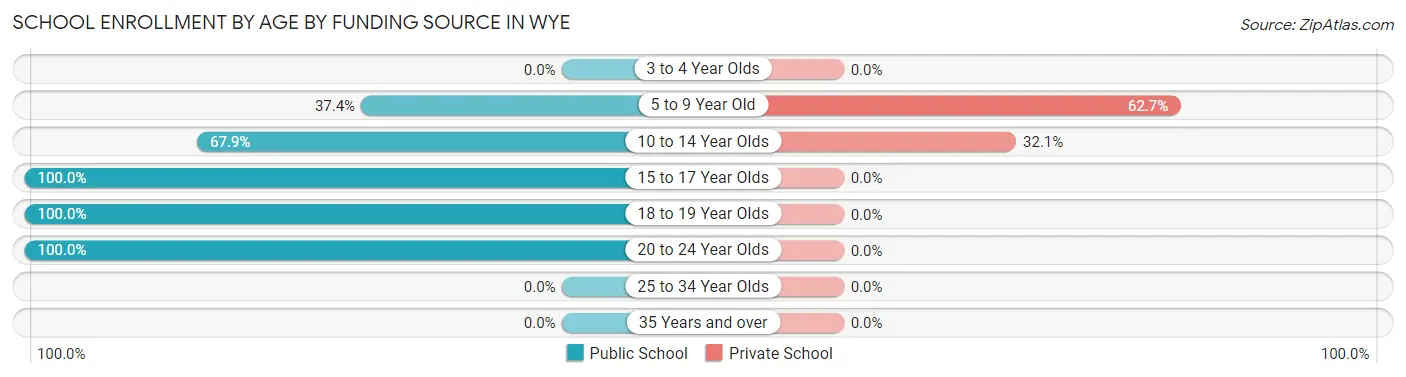
| Age Bracket | Public School | Private School |
| 3 to 4 Year Olds | 0 (0.0%) | 0 (0.0%) |
| 5 to 9 Year Old | 31 (37.3%) | 52 (62.6%) |
| 10 to 14 Year Olds | 93 (67.9%) | 44 (32.1%) |
| 15 to 17 Year Olds | 38 (100.0%) | 0 (0.0%) |
| 18 to 19 Year Olds | 28 (100.0%) | 0 (0.0%) |
| 20 to 24 Year Olds | 20 (100.0%) | 0 (0.0%) |
| 25 to 34 Year Olds | 0 (0.0%) | 0 (0.0%) |
| 35 Years and over | 0 (0.0%) | 0 (0.0%) |
| Total | 210 (68.6%) | 96 (31.4%) |
Educational Attainment by Field of Study in Wye
Business (102 | 40.0%), education (88 | 34.5%), and psychology (65 | 25.5%) are the most common fields of study among 255 individuals in Wye who have obtained a bachelor's degree or higher.
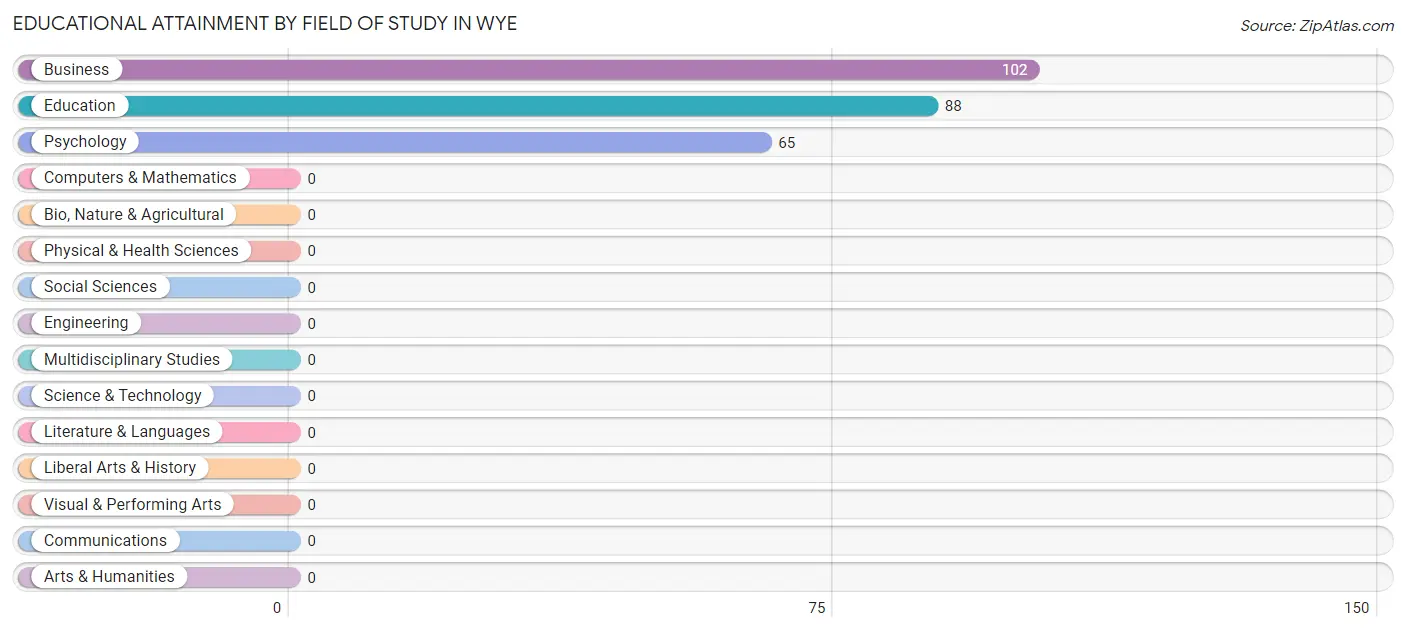
| Field of Study | # Graduates | % Graduates |
| Computers & Mathematics | 0 | 0.0% |
| Bio, Nature & Agricultural | 0 | 0.0% |
| Physical & Health Sciences | 0 | 0.0% |
| Psychology | 65 | 25.5% |
| Social Sciences | 0 | 0.0% |
| Engineering | 0 | 0.0% |
| Multidisciplinary Studies | 0 | 0.0% |
| Science & Technology | 0 | 0.0% |
| Business | 102 | 40.0% |
| Education | 88 | 34.5% |
| Literature & Languages | 0 | 0.0% |
| Liberal Arts & History | 0 | 0.0% |
| Visual & Performing Arts | 0 | 0.0% |
| Communications | 0 | 0.0% |
| Arts & Humanities | 0 | 0.0% |
| Total | 255 | 100.0% |
Transportation & Commute in Wye
Vehicle Availability by Sex in Wye
The most prevalent vehicle ownership categories in Wye are males with 3 vehicles (266, accounting for 78.0%) and females with 3 vehicles (209, making up 105.1%).
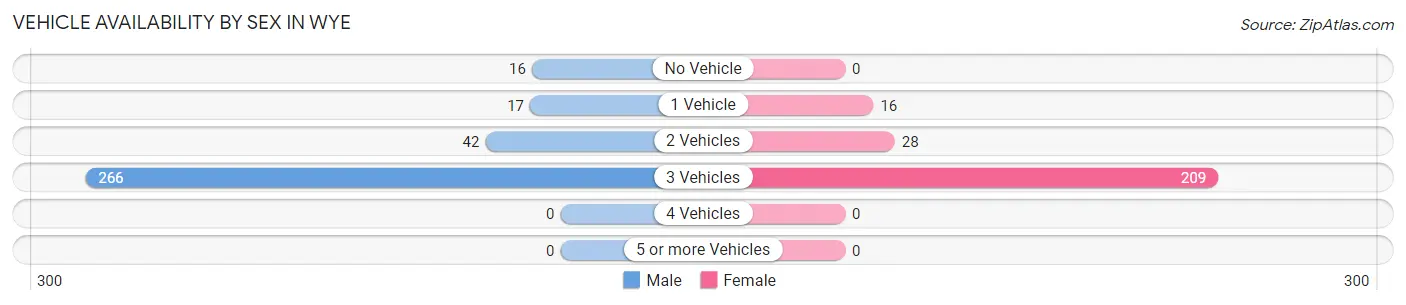
| Vehicles Available | Male | Female |
| No Vehicle | 16 (4.7%) | 0 (0.0%) |
| 1 Vehicle | 17 (5.0%) | 16 (6.3%) |
| 2 Vehicles | 42 (12.3%) | 28 (11.1%) |
| 3 Vehicles | 266 (78.0%) | 209 (82.6%) |
| 4 Vehicles | 0 (0.0%) | 0 (0.0%) |
| 5 or more Vehicles | 0 (0.0%) | 0 (0.0%) |
| Total | 341 (100.0%) | 253 (100.0%) |
Commute Time in Wye
The most frequently occuring commute durations in Wye are 15 to 19 minutes (193 commuters, 33.4%), 10 to 14 minutes (134 commuters, 23.2%), and 30 to 34 minutes (81 commuters, 14.0%).
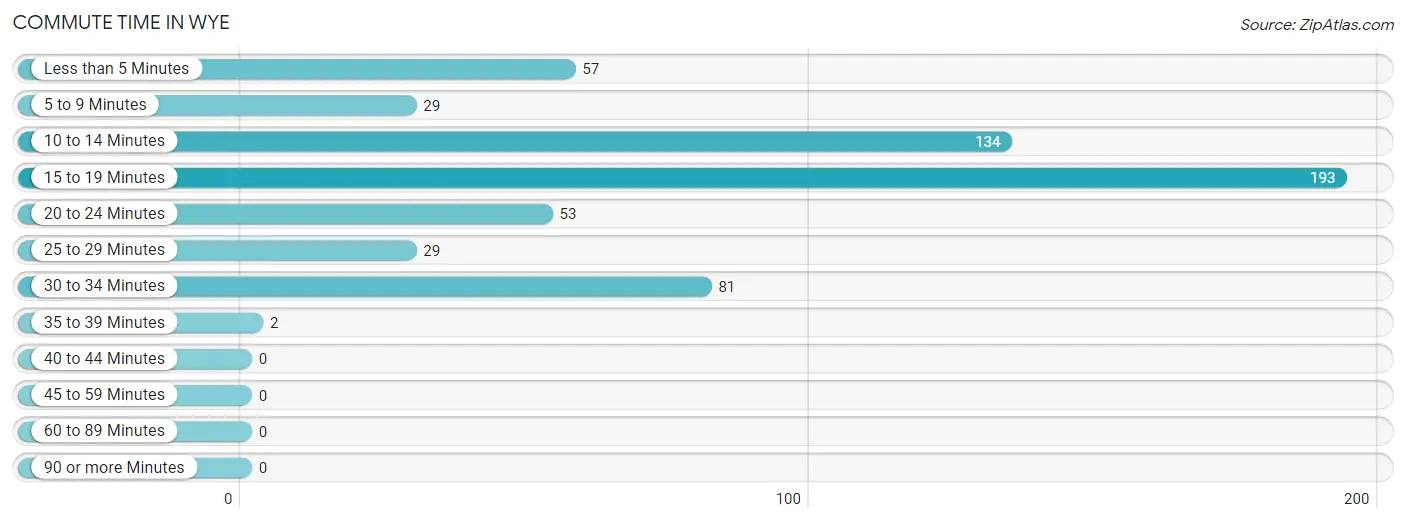
| Commute Time | # Commuters | % Commuters |
| Less than 5 Minutes | 57 | 9.9% |
| 5 to 9 Minutes | 29 | 5.0% |
| 10 to 14 Minutes | 134 | 23.2% |
| 15 to 19 Minutes | 193 | 33.4% |
| 20 to 24 Minutes | 53 | 9.2% |
| 25 to 29 Minutes | 29 | 5.0% |
| 30 to 34 Minutes | 81 | 14.0% |
| 35 to 39 Minutes | 2 | 0.4% |
| 40 to 44 Minutes | 0 | 0.0% |
| 45 to 59 Minutes | 0 | 0.0% |
| 60 to 89 Minutes | 0 | 0.0% |
| 90 or more Minutes | 0 | 0.0% |
Commute Time by Sex in Wye
The most common commute times in Wye are 15 to 19 minutes (137 commuters, 40.9%) for males and 30 to 34 minutes (78 commuters, 32.1%) for females.
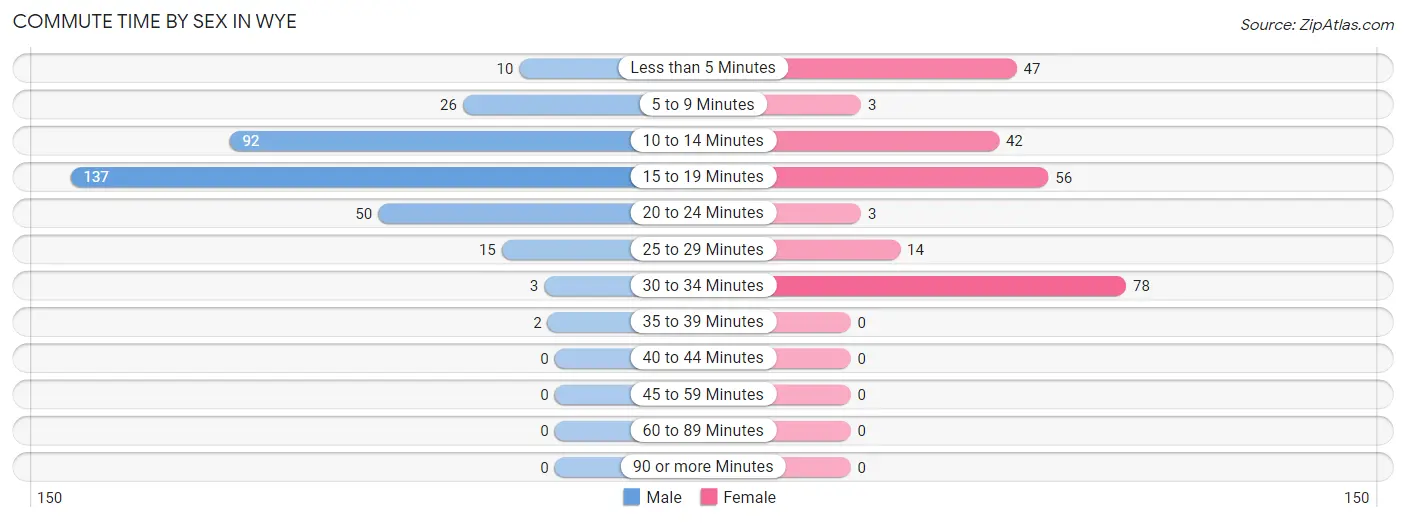
| Commute Time | Male | Female |
| Less than 5 Minutes | 10 (3.0%) | 47 (19.3%) |
| 5 to 9 Minutes | 26 (7.8%) | 3 (1.2%) |
| 10 to 14 Minutes | 92 (27.5%) | 42 (17.3%) |
| 15 to 19 Minutes | 137 (40.9%) | 56 (23.1%) |
| 20 to 24 Minutes | 50 (14.9%) | 3 (1.2%) |
| 25 to 29 Minutes | 15 (4.5%) | 14 (5.8%) |
| 30 to 34 Minutes | 3 (0.9%) | 78 (32.1%) |
| 35 to 39 Minutes | 2 (0.6%) | 0 (0.0%) |
| 40 to 44 Minutes | 0 (0.0%) | 0 (0.0%) |
| 45 to 59 Minutes | 0 (0.0%) | 0 (0.0%) |
| 60 to 89 Minutes | 0 (0.0%) | 0 (0.0%) |
| 90 or more Minutes | 0 (0.0%) | 0 (0.0%) |
Time of Departure to Work by Sex in Wye
The most frequent times of departure to work in Wye are 7:30 AM to 7:59 AM (105, 31.3%) for males and 7:30 AM to 7:59 AM (90, 37.0%) for females.
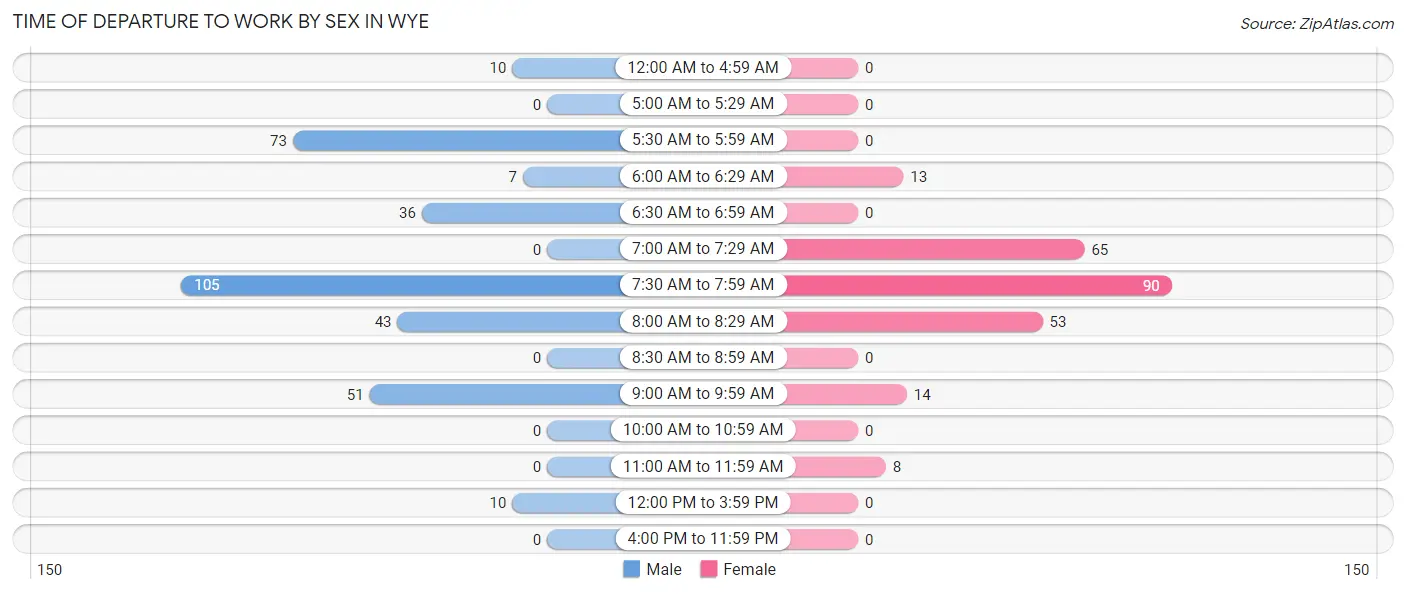
| Time of Departure | Male | Female |
| 12:00 AM to 4:59 AM | 10 (3.0%) | 0 (0.0%) |
| 5:00 AM to 5:29 AM | 0 (0.0%) | 0 (0.0%) |
| 5:30 AM to 5:59 AM | 73 (21.8%) | 0 (0.0%) |
| 6:00 AM to 6:29 AM | 7 (2.1%) | 13 (5.3%) |
| 6:30 AM to 6:59 AM | 36 (10.7%) | 0 (0.0%) |
| 7:00 AM to 7:29 AM | 0 (0.0%) | 65 (26.8%) |
| 7:30 AM to 7:59 AM | 105 (31.3%) | 90 (37.0%) |
| 8:00 AM to 8:29 AM | 43 (12.8%) | 53 (21.8%) |
| 8:30 AM to 8:59 AM | 0 (0.0%) | 0 (0.0%) |
| 9:00 AM to 9:59 AM | 51 (15.2%) | 14 (5.8%) |
| 10:00 AM to 10:59 AM | 0 (0.0%) | 0 (0.0%) |
| 11:00 AM to 11:59 AM | 0 (0.0%) | 8 (3.3%) |
| 12:00 PM to 3:59 PM | 10 (3.0%) | 0 (0.0%) |
| 4:00 PM to 11:59 PM | 0 (0.0%) | 0 (0.0%) |
| Total | 335 (100.0%) | 243 (100.0%) |
Housing Occupancy in Wye
Occupancy by Ownership in Wye
Of the total 333 dwellings in Wye, owner-occupied units account for 188 (56.5%), while renter-occupied units make up 145 (43.5%).
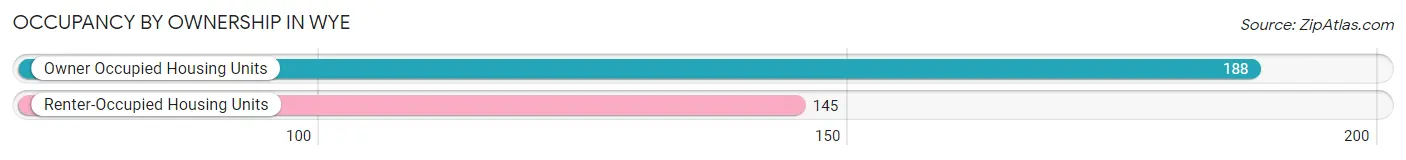
| Occupancy | # Housing Units | % Housing Units |
| Owner Occupied Housing Units | 188 | 56.5% |
| Renter-Occupied Housing Units | 145 | 43.5% |
| Total Occupied Housing Units | 333 | 100.0% |
Occupancy by Household Size in Wye
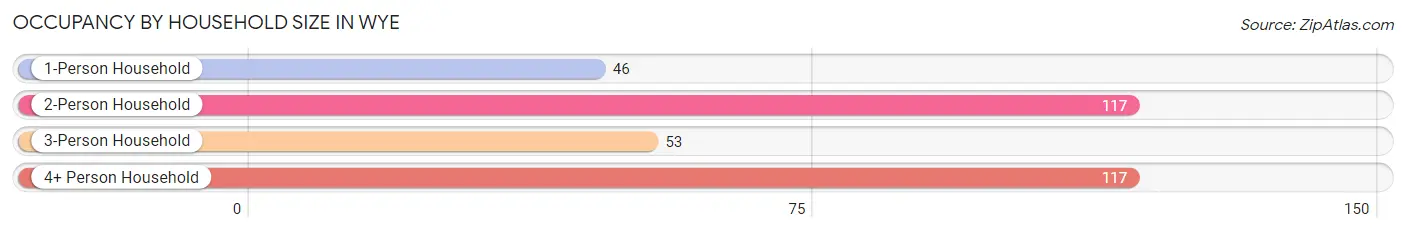
| Household Size | # Housing Units | % Housing Units |
| 1-Person Household | 46 | 13.8% |
| 2-Person Household | 117 | 35.1% |
| 3-Person Household | 53 | 15.9% |
| 4+ Person Household | 117 | 35.1% |
| Total Housing Units | 333 | 100.0% |
Occupancy by Ownership by Household Size in Wye
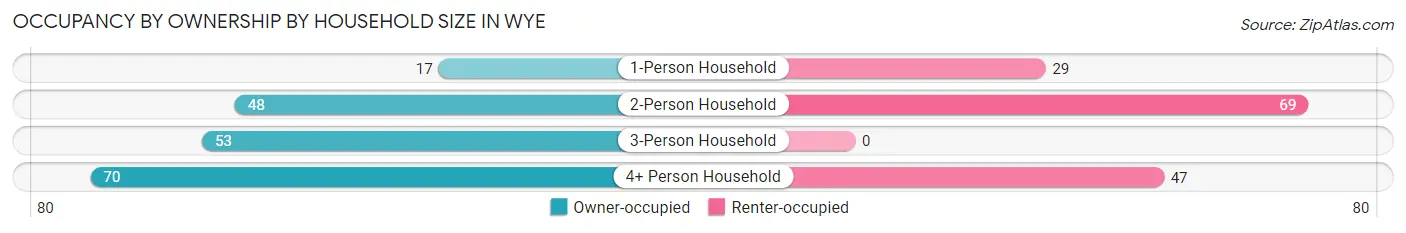
| Household Size | Owner-occupied | Renter-occupied |
| 1-Person Household | 17 (37.0%) | 29 (63.0%) |
| 2-Person Household | 48 (41.0%) | 69 (59.0%) |
| 3-Person Household | 53 (100.0%) | 0 (0.0%) |
| 4+ Person Household | 70 (59.8%) | 47 (40.2%) |
| Total Housing Units | 188 (56.5%) | 145 (43.5%) |
Occupancy by Educational Attainment in Wye
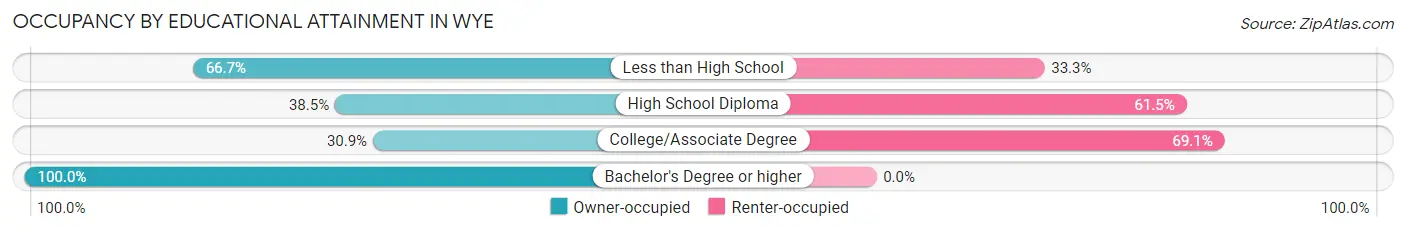
| Household Size | Owner-occupied | Renter-occupied |
| Less than High School | 8 (66.7%) | 4 (33.3%) |
| High School Diploma | 10 (38.5%) | 16 (61.5%) |
| College/Associate Degree | 56 (30.9%) | 125 (69.1%) |
| Bachelor's Degree or higher | 114 (100.0%) | 0 (0.0%) |
Occupancy by Age of Householder in Wye
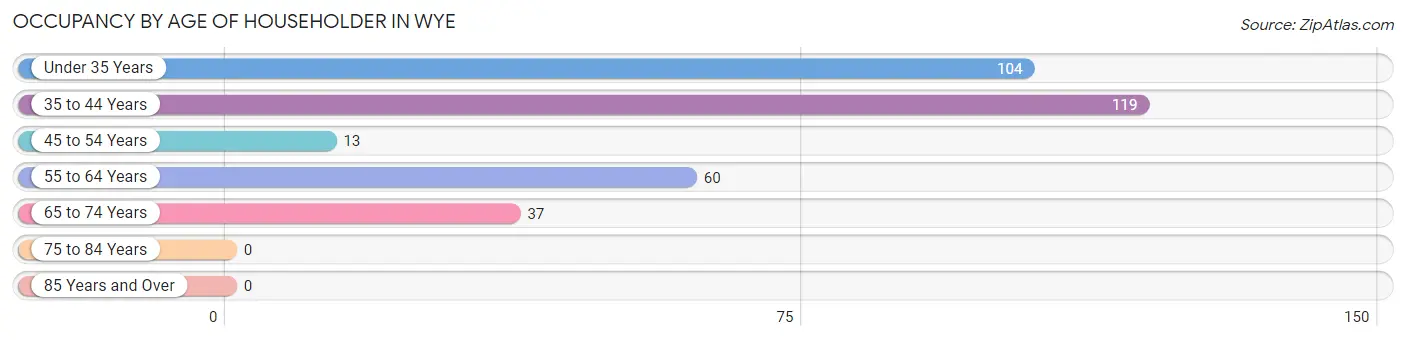
| Age Bracket | # Households | % Households |
| Under 35 Years | 104 | 31.2% |
| 35 to 44 Years | 119 | 35.7% |
| 45 to 54 Years | 13 | 3.9% |
| 55 to 64 Years | 60 | 18.0% |
| 65 to 74 Years | 37 | 11.1% |
| 75 to 84 Years | 0 | 0.0% |
| 85 Years and Over | 0 | 0.0% |
| Total | 333 | 100.0% |
Housing Finances in Wye
Median Income by Occupancy in Wye
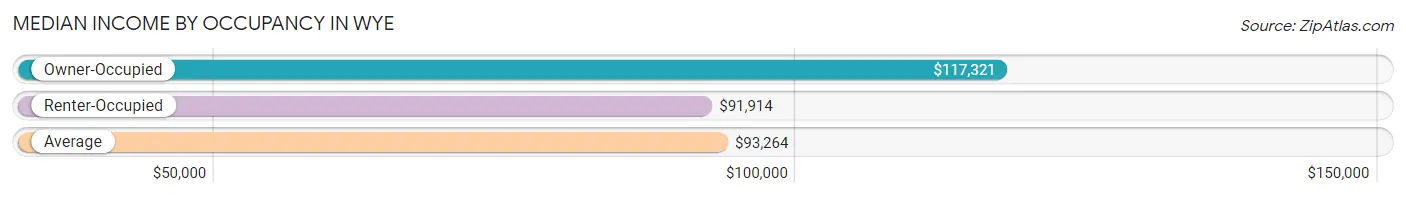
| Occupancy Type | # Households | Median Income |
| Owner-Occupied | 188 (56.5%) | $117,321 |
| Renter-Occupied | 145 (43.5%) | $91,914 |
| Average | 333 (100.0%) | $93,264 |
Occupancy by Householder Income Bracket in Wye
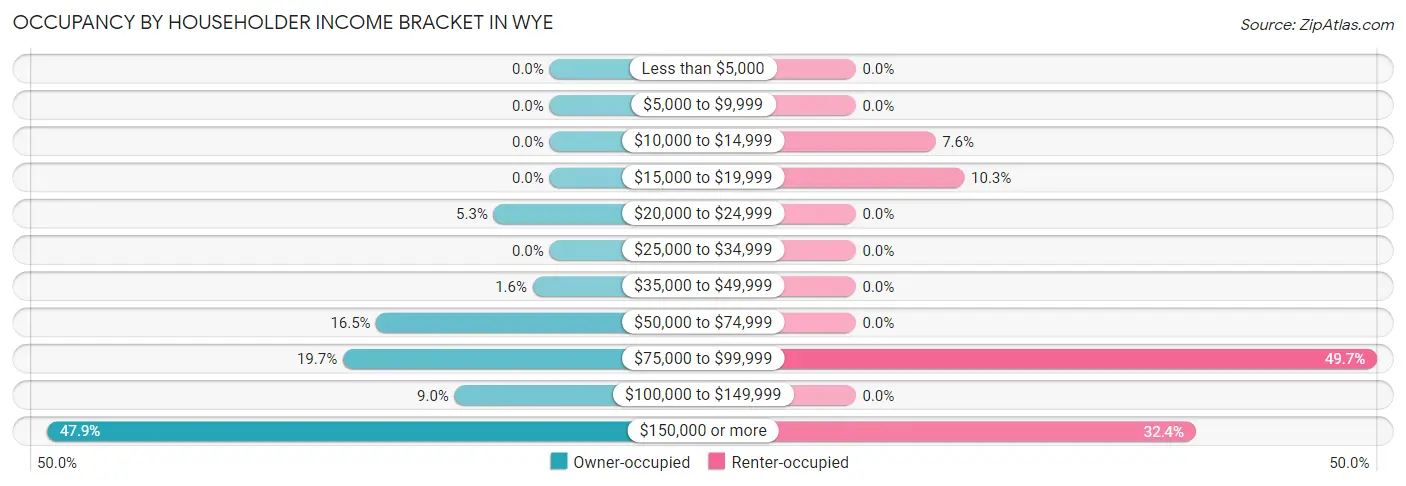
| Income Bracket | Owner-occupied | Renter-occupied |
| Less than $5,000 | 0 (0.0%) | 0 (0.0%) |
| $5,000 to $9,999 | 0 (0.0%) | 0 (0.0%) |
| $10,000 to $14,999 | 0 (0.0%) | 11 (7.6%) |
| $15,000 to $19,999 | 0 (0.0%) | 15 (10.3%) |
| $20,000 to $24,999 | 10 (5.3%) | 0 (0.0%) |
| $25,000 to $34,999 | 0 (0.0%) | 0 (0.0%) |
| $35,000 to $49,999 | 3 (1.6%) | 0 (0.0%) |
| $50,000 to $74,999 | 31 (16.5%) | 0 (0.0%) |
| $75,000 to $99,999 | 37 (19.7%) | 72 (49.7%) |
| $100,000 to $149,999 | 17 (9.0%) | 0 (0.0%) |
| $150,000 or more | 90 (47.9%) | 47 (32.4%) |
| Total | 188 (100.0%) | 145 (100.0%) |
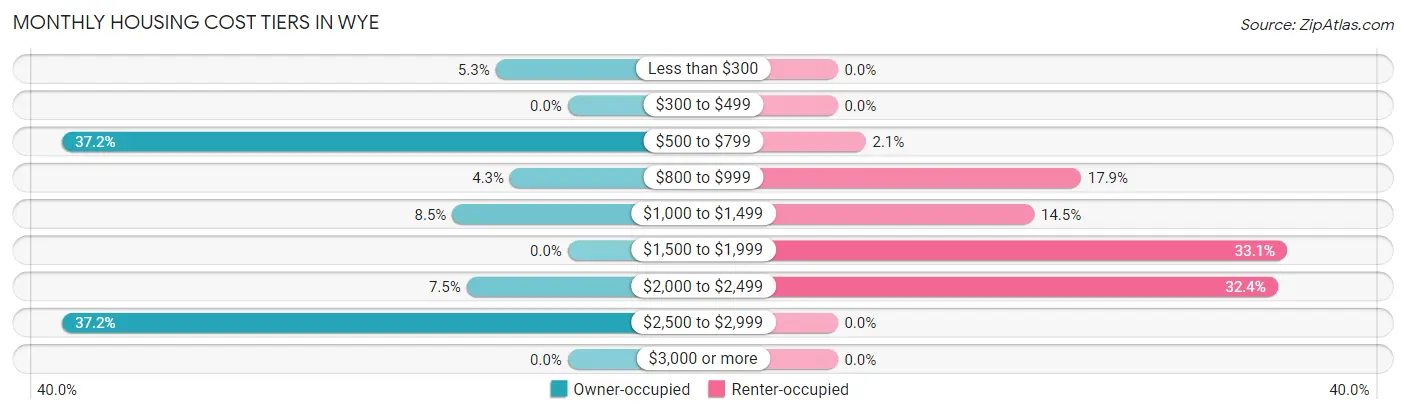
Monthly Housing Cost Tiers in Wye
| Monthly Cost | Owner-occupied | Renter-occupied |
| Less than $300 | 10 (5.3%) | 0 (0.0%) |
| $300 to $499 | 0 (0.0%) | 0 (0.0%) |
| $500 to $799 | 70 (37.2%) | 3 (2.1%) |
| $800 to $999 | 8 (4.3%) | 26 (17.9%) |
| $1,000 to $1,499 | 16 (8.5%) | 21 (14.5%) |
| $1,500 to $1,999 | 0 (0.0%) | 48 (33.1%) |
| $2,000 to $2,499 | 14 (7.4%) | 47 (32.4%) |
| $2,500 to $2,999 | 70 (37.2%) | 0 (0.0%) |
| $3,000 or more | 0 (0.0%) | 0 (0.0%) |
| Total | 188 (100.0%) | 145 (100.0%) |
Physical Housing Characteristics in Wye
Housing Structures in Wye
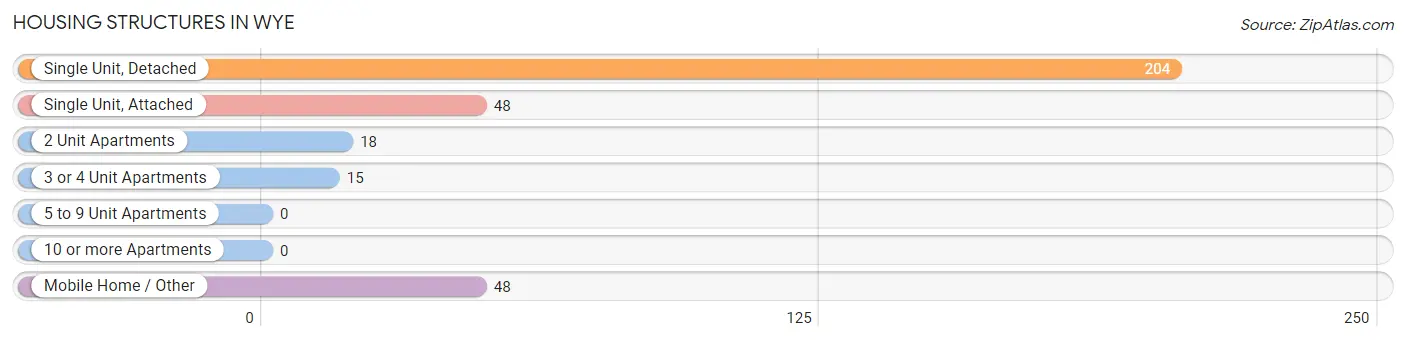
| Structure Type | # Housing Units | % Housing Units |
| Single Unit, Detached | 204 | 61.3% |
| Single Unit, Attached | 48 | 14.4% |
| 2 Unit Apartments | 18 | 5.4% |
| 3 or 4 Unit Apartments | 15 | 4.5% |
| 5 to 9 Unit Apartments | 0 | 0.0% |
| 10 or more Apartments | 0 | 0.0% |
| Mobile Home / Other | 48 | 14.4% |
| Total | 333 | 100.0% |
Housing Structures by Occupancy in Wye
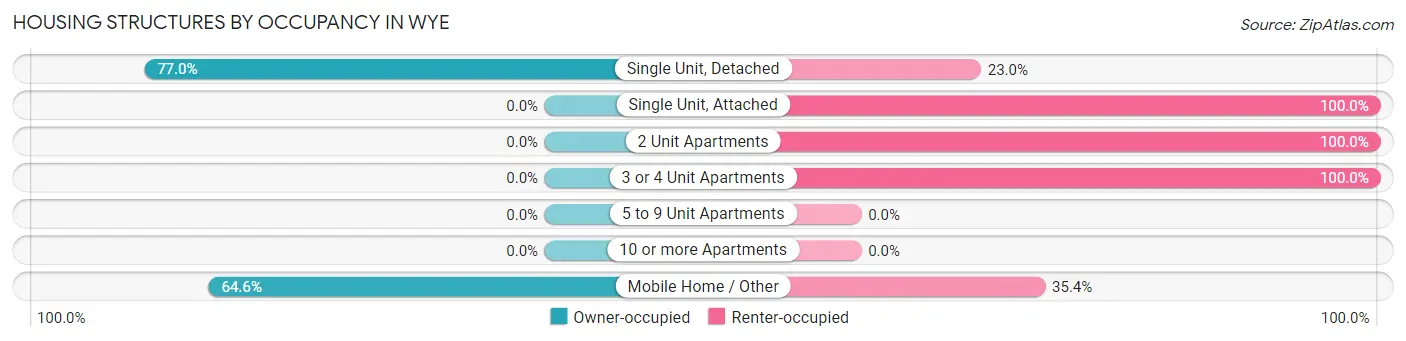
| Structure Type | Owner-occupied | Renter-occupied |
| Single Unit, Detached | 157 (77.0%) | 47 (23.0%) |
| Single Unit, Attached | 0 (0.0%) | 48 (100.0%) |
| 2 Unit Apartments | 0 (0.0%) | 18 (100.0%) |
| 3 or 4 Unit Apartments | 0 (0.0%) | 15 (100.0%) |
| 5 to 9 Unit Apartments | 0 (0.0%) | 0 (0.0%) |
| 10 or more Apartments | 0 (0.0%) | 0 (0.0%) |
| Mobile Home / Other | 31 (64.6%) | 17 (35.4%) |
| Total | 188 (56.5%) | 145 (43.5%) |
Housing Structures by Number of Rooms in Wye
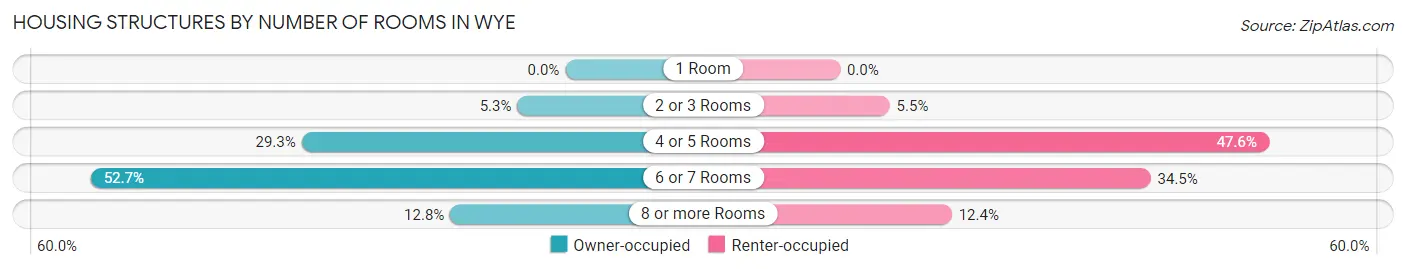
| Number of Rooms | Owner-occupied | Renter-occupied |
| 1 Room | 0 (0.0%) | 0 (0.0%) |
| 2 or 3 Rooms | 10 (5.3%) | 8 (5.5%) |
| 4 or 5 Rooms | 55 (29.3%) | 69 (47.6%) |
| 6 or 7 Rooms | 99 (52.7%) | 50 (34.5%) |
| 8 or more Rooms | 24 (12.8%) | 18 (12.4%) |
| Total | 188 (100.0%) | 145 (100.0%) |
Housing Structure by Heating Type in Wye
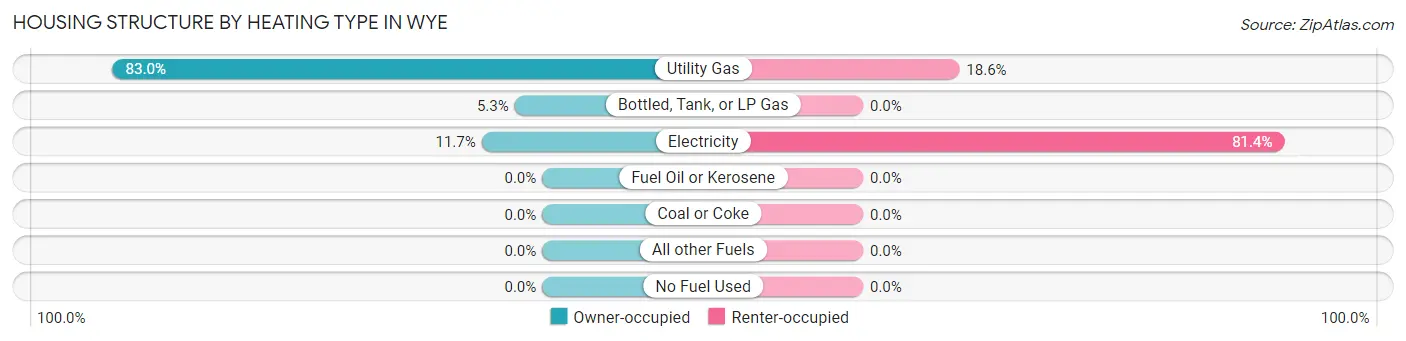
| Heating Type | Owner-occupied | Renter-occupied |
| Utility Gas | 156 (83.0%) | 27 (18.6%) |
| Bottled, Tank, or LP Gas | 10 (5.3%) | 0 (0.0%) |
| Electricity | 22 (11.7%) | 118 (81.4%) |
| Fuel Oil or Kerosene | 0 (0.0%) | 0 (0.0%) |
| Coal or Coke | 0 (0.0%) | 0 (0.0%) |
| All other Fuels | 0 (0.0%) | 0 (0.0%) |
| No Fuel Used | 0 (0.0%) | 0 (0.0%) |
| Total | 188 (100.0%) | 145 (100.0%) |
Household Vehicle Usage in Wye
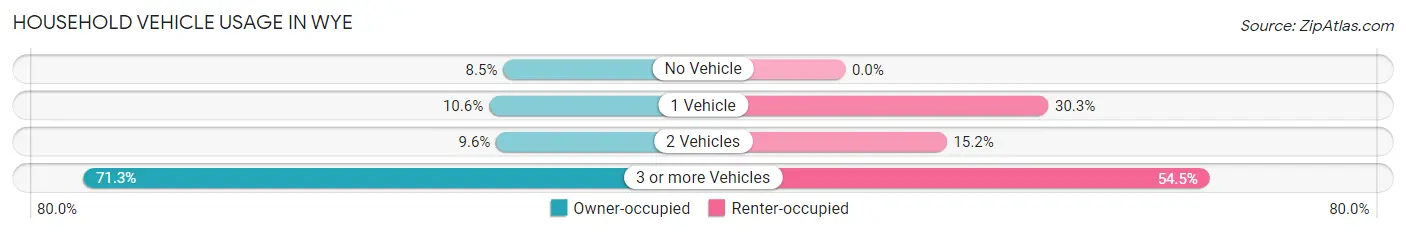
| Vehicles per Household | Owner-occupied | Renter-occupied |
| No Vehicle | 16 (8.5%) | 0 (0.0%) |
| 1 Vehicle | 20 (10.6%) | 44 (30.3%) |
| 2 Vehicles | 18 (9.6%) | 22 (15.2%) |
| 3 or more Vehicles | 134 (71.3%) | 79 (54.5%) |
| Total | 188 (100.0%) | 145 (100.0%) |
Real Estate & Mortgages in Wye
Real Estate and Mortgage Overview in Wye
| Characteristic | Without Mortgage | With Mortgage |
| Housing Units | 70 | 118 |
| Median Property Value | $450,000 | $489,500 |
| Median Household Income | $200,750 | $40 |
| Monthly Housing Costs | $730 | $0 |
| Real Estate Taxes | $5,750 | $0 |
Property Value by Mortgage Status in Wye
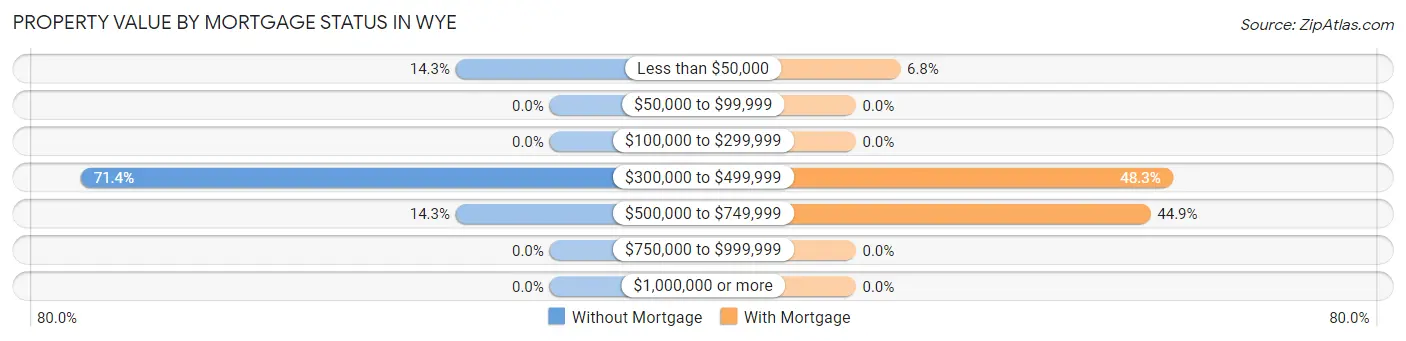
| Property Value | Without Mortgage | With Mortgage |
| Less than $50,000 | 10 (14.3%) | 8 (6.8%) |
| $50,000 to $99,999 | 0 (0.0%) | 0 (0.0%) |
| $100,000 to $299,999 | 0 (0.0%) | 0 (0.0%) |
| $300,000 to $499,999 | 50 (71.4%) | 57 (48.3%) |
| $500,000 to $749,999 | 10 (14.3%) | 53 (44.9%) |
| $750,000 to $999,999 | 0 (0.0%) | 0 (0.0%) |
| $1,000,000 or more | 0 (0.0%) | 0 (0.0%) |
| Total | 70 (100.0%) | 118 (100.0%) |
Household Income by Mortgage Status in Wye
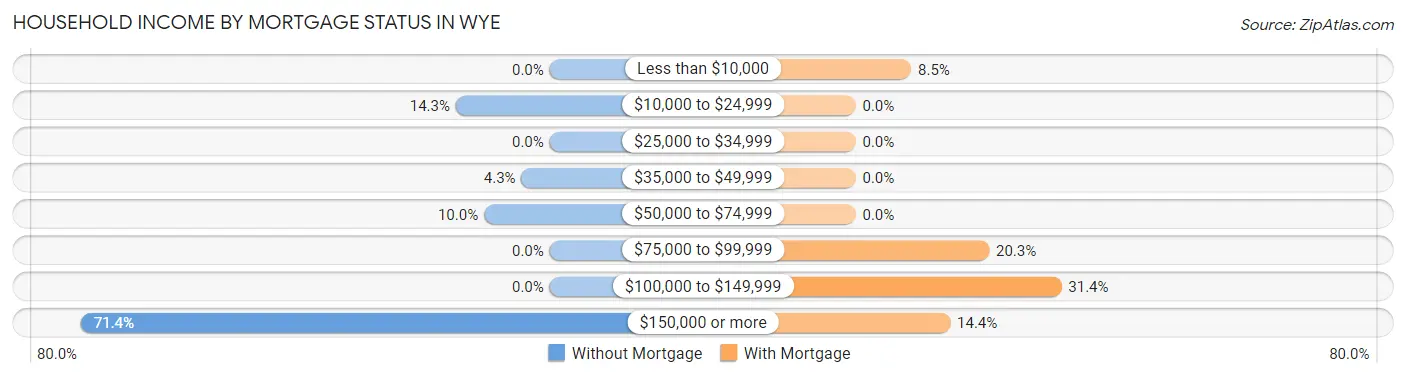
| Household Income | Without Mortgage | With Mortgage |
| Less than $10,000 | 0 (0.0%) | 10 (8.5%) |
| $10,000 to $24,999 | 10 (14.3%) | 0 (0.0%) |
| $25,000 to $34,999 | 0 (0.0%) | 0 (0.0%) |
| $35,000 to $49,999 | 3 (4.3%) | 0 (0.0%) |
| $50,000 to $74,999 | 7 (10.0%) | 0 (0.0%) |
| $75,000 to $99,999 | 0 (0.0%) | 24 (20.3%) |
| $100,000 to $149,999 | 0 (0.0%) | 37 (31.4%) |
| $150,000 or more | 50 (71.4%) | 17 (14.4%) |
| Total | 70 (100.0%) | 118 (100.0%) |
Property Value to Household Income Ratio in Wye
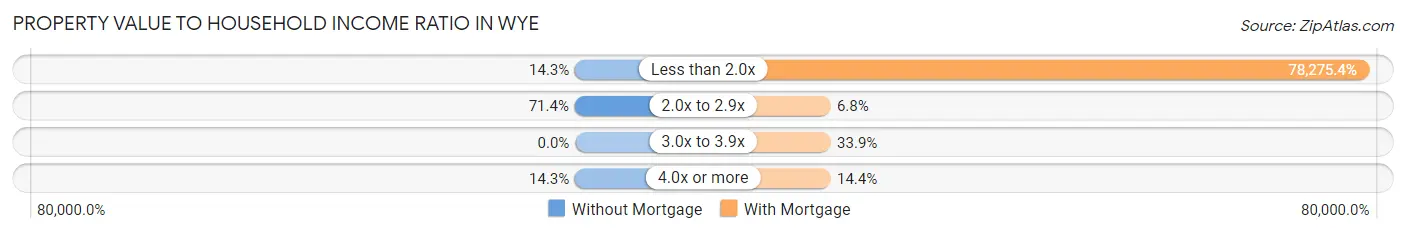
| Value-to-Income Ratio | Without Mortgage | With Mortgage |
| Less than 2.0x | 10 (14.3%) | 92,365 (78,275.4%) |
| 2.0x to 2.9x | 50 (71.4%) | 8 (6.8%) |
| 3.0x to 3.9x | 0 (0.0%) | 40 (33.9%) |
| 4.0x or more | 10 (14.3%) | 17 (14.4%) |
| Total | 70 (100.0%) | 118 (100.0%) |
Real Estate Taxes by Mortgage Status in Wye
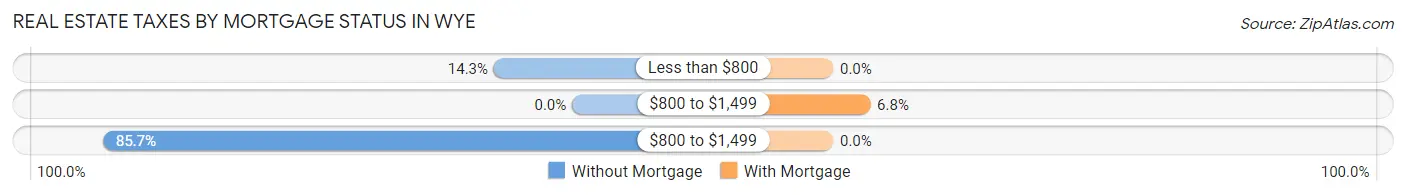
| Property Taxes | Without Mortgage | With Mortgage |
| Less than $800 | 10 (14.3%) | 0 (0.0%) |
| $800 to $1,499 | 0 (0.0%) | 8 (6.8%) |
| $800 to $1,499 | 60 (85.7%) | 0 (0.0%) |
| Total | 70 (100.0%) | 118 (100.0%) |
Health & Disability in Wye
Health Insurance Coverage by Age in Wye
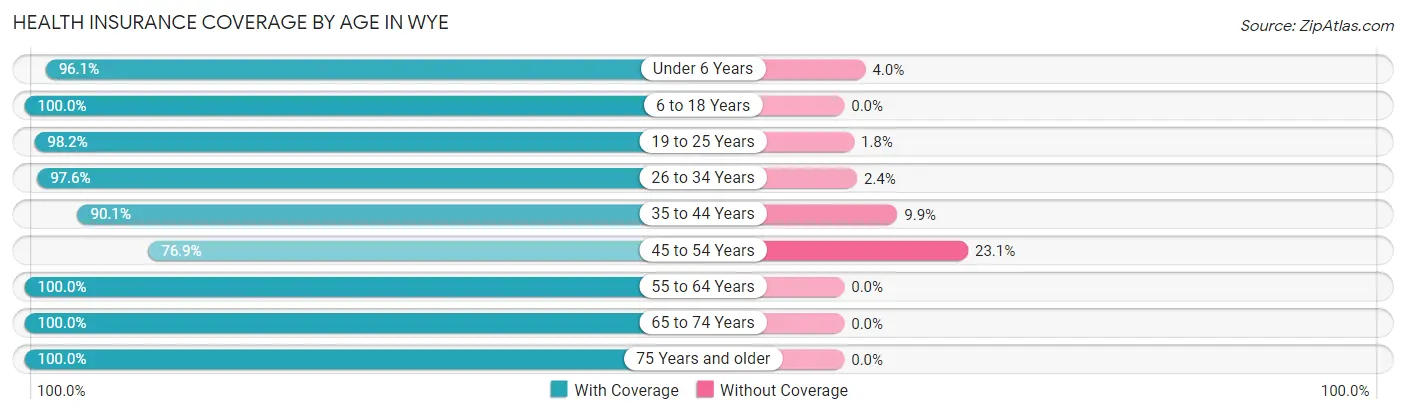
| Age Bracket | With Coverage | Without Coverage |
| Under 6 Years | 73 (96.1%) | 3 (4.0%) |
| 6 to 18 Years | 271 (100.0%) | 0 (0.0%) |
| 19 to 25 Years | 162 (98.2%) | 3 (1.8%) |
| 26 to 34 Years | 124 (97.6%) | 3 (2.4%) |
| 35 to 44 Years | 255 (90.1%) | 28 (9.9%) |
| 45 to 54 Years | 10 (76.9%) | 3 (23.1%) |
| 55 to 64 Years | 72 (100.0%) | 0 (0.0%) |
| 65 to 74 Years | 64 (100.0%) | 0 (0.0%) |
| 75 Years and older | 3 (100.0%) | 0 (0.0%) |
| Total | 1,034 (96.3%) | 40 (3.7%) |
Health Insurance Coverage by Citizenship Status in Wye
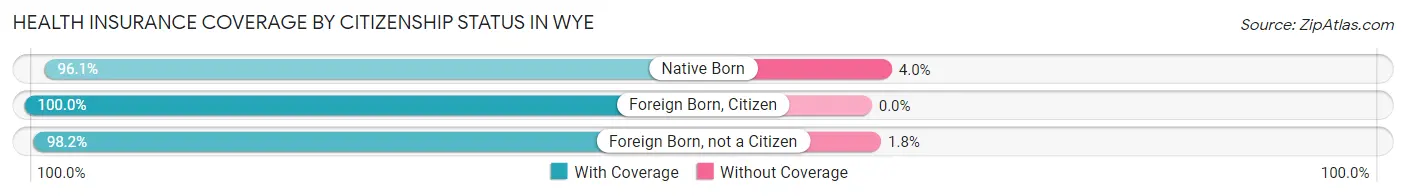
| Citizenship Status | With Coverage | Without Coverage |
| Native Born | 73 (96.1%) | 3 (4.0%) |
| Foreign Born, Citizen | 271 (100.0%) | 0 (0.0%) |
| Foreign Born, not a Citizen | 162 (98.2%) | 3 (1.8%) |
Health Insurance Coverage by Household Income in Wye
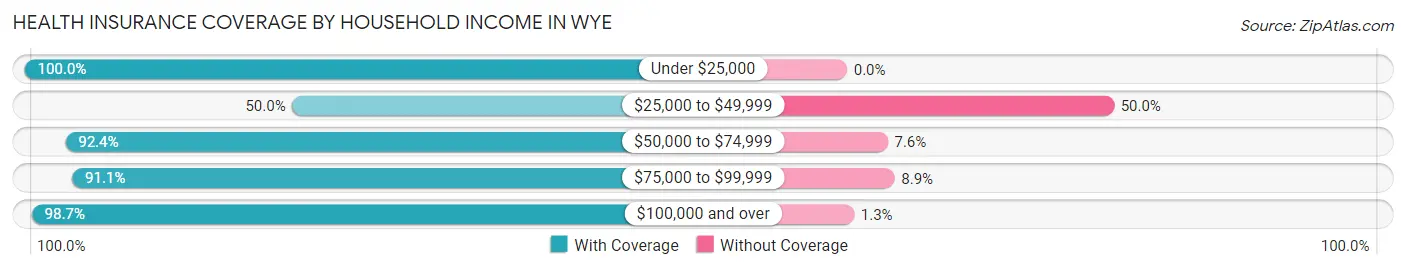
| Household Income | With Coverage | Without Coverage |
| Under $25,000 | 49 (100.0%) | 0 (0.0%) |
| $25,000 to $49,999 | 3 (50.0%) | 3 (50.0%) |
| $50,000 to $74,999 | 121 (92.4%) | 10 (7.6%) |
| $75,000 to $99,999 | 184 (91.1%) | 18 (8.9%) |
| $100,000 and over | 673 (98.7%) | 9 (1.3%) |
Public vs Private Health Insurance Coverage by Age in Wye
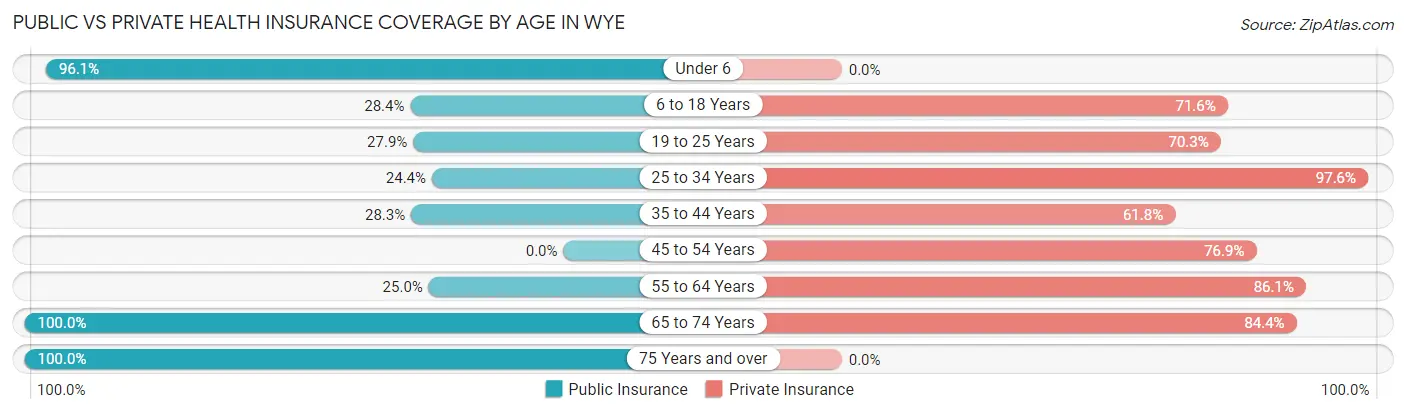
| Age Bracket | Public Insurance | Private Insurance |
| Under 6 | 73 (96.1%) | 0 (0.0%) |
| 6 to 18 Years | 77 (28.4%) | 194 (71.6%) |
| 19 to 25 Years | 46 (27.9%) | 116 (70.3%) |
| 25 to 34 Years | 31 (24.4%) | 124 (97.6%) |
| 35 to 44 Years | 80 (28.3%) | 175 (61.8%) |
| 45 to 54 Years | 0 (0.0%) | 10 (76.9%) |
| 55 to 64 Years | 18 (25.0%) | 62 (86.1%) |
| 65 to 74 Years | 64 (100.0%) | 54 (84.4%) |
| 75 Years and over | 3 (100.0%) | 0 (0.0%) |
| Total | 392 (36.5%) | 735 (68.4%) |
Disability Status by Sex by Age in Wye
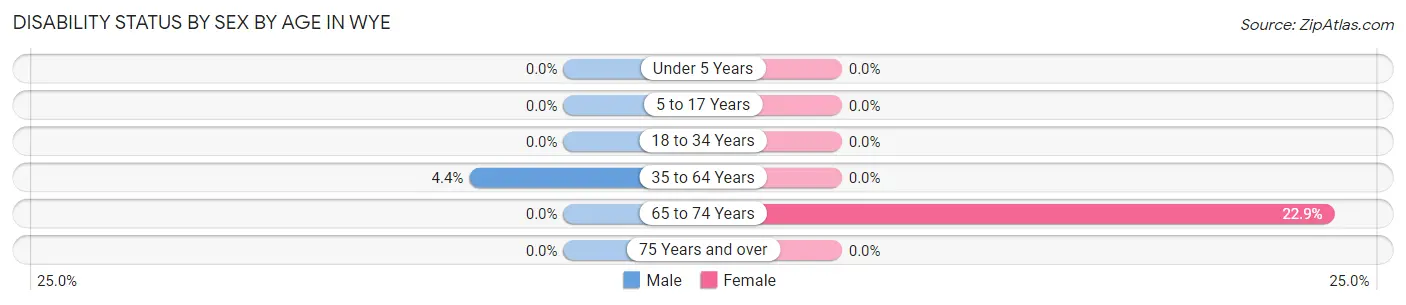
| Age Bracket | Male | Female |
| Under 5 Years | 0 (0.0%) | 0 (0.0%) |
| 5 to 17 Years | 0 (0.0%) | 0 (0.0%) |
| 18 to 34 Years | 0 (0.0%) | 0 (0.0%) |
| 35 to 64 Years | 11 (4.4%) | 0 (0.0%) |
| 65 to 74 Years | 0 (0.0%) | 8 (22.9%) |
| 75 Years and over | 0 (0.0%) | 0 (0.0%) |
Disability Class by Sex by Age in Wye
Disability Class: Hearing Difficulty
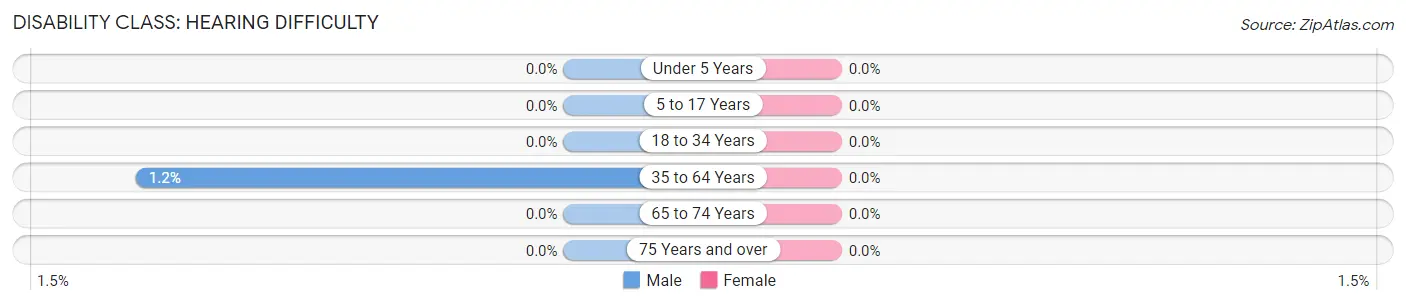
| Age Bracket | Male | Female |
| Under 5 Years | 0 (0.0%) | 0 (0.0%) |
| 5 to 17 Years | 0 (0.0%) | 0 (0.0%) |
| 18 to 34 Years | 0 (0.0%) | 0 (0.0%) |
| 35 to 64 Years | 3 (1.2%) | 0 (0.0%) |
| 65 to 74 Years | 0 (0.0%) | 0 (0.0%) |
| 75 Years and over | 0 (0.0%) | 0 (0.0%) |
Disability Class: Vision Difficulty

| Age Bracket | Male | Female |
| Under 5 Years | 0 (0.0%) | 0 (0.0%) |
| 5 to 17 Years | 0 (0.0%) | 0 (0.0%) |
| 18 to 34 Years | 0 (0.0%) | 0 (0.0%) |
| 35 to 64 Years | 8 (3.2%) | 0 (0.0%) |
| 65 to 74 Years | 0 (0.0%) | 0 (0.0%) |
| 75 Years and over | 0 (0.0%) | 0 (0.0%) |
Disability Class: Cognitive Difficulty
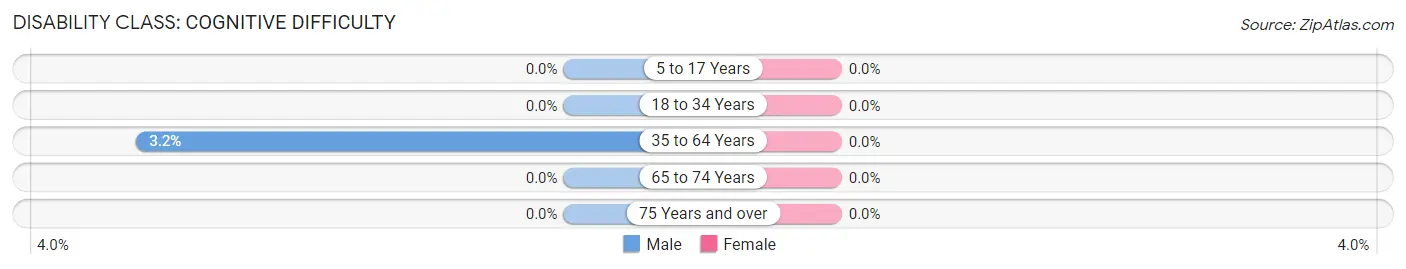
| Age Bracket | Male | Female |
| 5 to 17 Years | 0 (0.0%) | 0 (0.0%) |
| 18 to 34 Years | 0 (0.0%) | 0 (0.0%) |
| 35 to 64 Years | 8 (3.2%) | 0 (0.0%) |
| 65 to 74 Years | 0 (0.0%) | 0 (0.0%) |
| 75 Years and over | 0 (0.0%) | 0 (0.0%) |
Disability Class: Ambulatory Difficulty
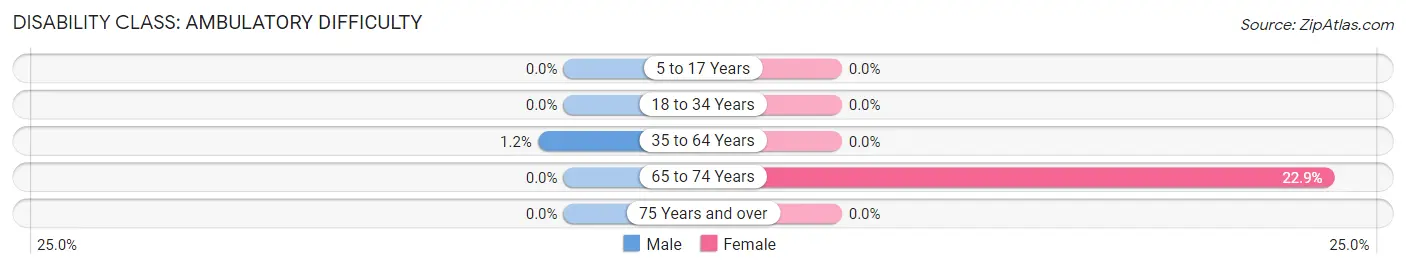
| Age Bracket | Male | Female |
| 5 to 17 Years | 0 (0.0%) | 0 (0.0%) |
| 18 to 34 Years | 0 (0.0%) | 0 (0.0%) |
| 35 to 64 Years | 3 (1.2%) | 0 (0.0%) |
| 65 to 74 Years | 0 (0.0%) | 8 (22.9%) |
| 75 Years and over | 0 (0.0%) | 0 (0.0%) |
Disability Class: Self-Care Difficulty
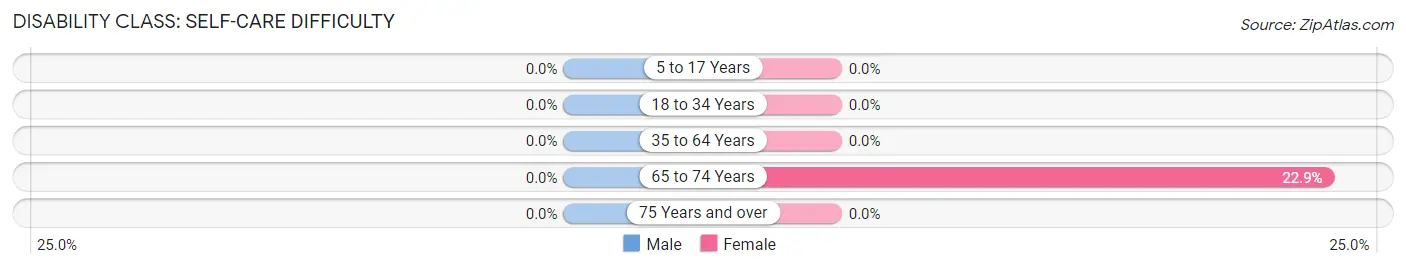
| Age Bracket | Male | Female |
| 5 to 17 Years | 0 (0.0%) | 0 (0.0%) |
| 18 to 34 Years | 0 (0.0%) | 0 (0.0%) |
| 35 to 64 Years | 0 (0.0%) | 0 (0.0%) |
| 65 to 74 Years | 0 (0.0%) | 8 (22.9%) |
| 75 Years and over | 0 (0.0%) | 0 (0.0%) |
Technology Access in Wye
Computing Device Access in Wye
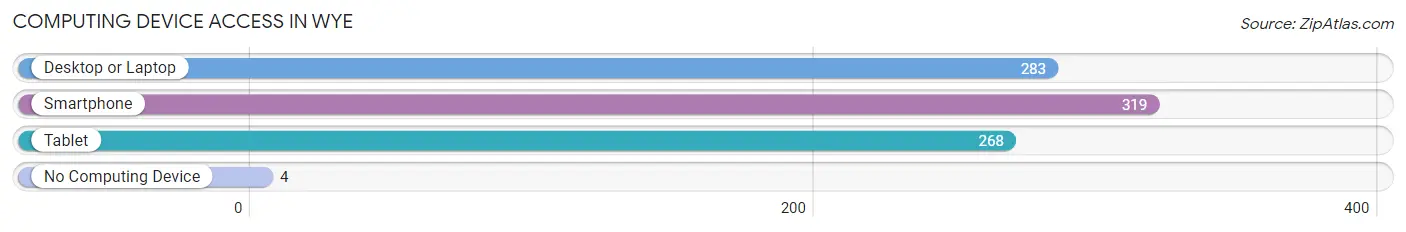
| Device Type | # Households | % Households |
| Desktop or Laptop | 283 | 85.0% |
| Smartphone | 319 | 95.8% |
| Tablet | 268 | 80.5% |
| No Computing Device | 4 | 1.2% |
| Total | 333 | 100.0% |
Internet Access in Wye
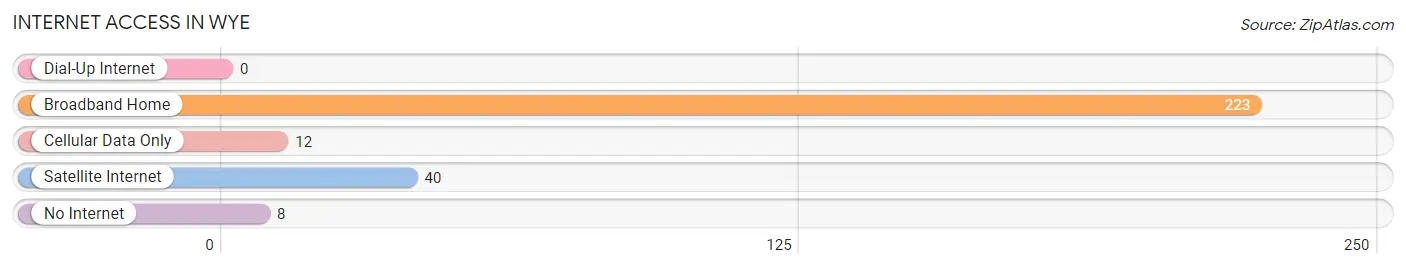
| Internet Type | # Households | % Households |
| Dial-Up Internet | 0 | 0.0% |
| Broadband Home | 223 | 67.0% |
| Cellular Data Only | 12 | 3.6% |
| Satellite Internet | 40 | 12.0% |
| No Internet | 8 | 2.4% |
| Total | 333 | 100.0% |
Wye Summary
Wye, Montana is a small town located in the western part of the state, near the Idaho border. It is situated in the foothills of the Rocky Mountains, and is surrounded by beautiful scenery. The town has a population of just over 500 people, and is a popular destination for outdoor enthusiasts.
History
The area around Wye was first settled in the late 1800s by homesteaders and ranchers. The town was officially founded in 1891, and was named after the nearby Wye River. The town was originally a mining town, and the area was home to several gold and silver mines. The town grew quickly, and by the early 1900s, it had a population of over 1,000 people.
The town experienced a decline in the early 20th century, as the mining industry began to decline. The population dropped to just over 500 people by the 1950s. In the late 20th century, the town experienced a resurgence, as it became a popular destination for outdoor recreation.
Geography
Wye is located in the western part of Montana, near the Idaho border. It is situated in the foothills of the Rocky Mountains, and is surrounded by beautiful scenery. The town is located at an elevation of 4,500 feet, and is surrounded by mountains and forests. The nearby Wye River is a popular destination for fishing and rafting.
Economy
The economy of Wye is largely based on tourism and outdoor recreation. The town is a popular destination for hikers, campers, and other outdoor enthusiasts. The nearby Wye River is a popular destination for fishing and rafting. The town also has several small businesses, including restaurants, shops, and lodging.
Demographics
As of the 2010 census, the population of Wye was 514 people. The racial makeup of the town was 97.3% White, 0.4% Native American, 0.2% Asian, 0.2% from other races, and 1.9% from two or more races. The median household income was $37,500, and the median family income was $45,000. The per capita income was $19,000.
Conclusion
Wye, Montana is a small town located in the western part of the state, near the Idaho border. It is situated in the foothills of the Rocky Mountains, and is surrounded by beautiful scenery. The town has a population of just over 500 people, and is a popular destination for outdoor enthusiasts. The economy of Wye is largely based on tourism and outdoor recreation, and the town is a popular destination for hikers, campers, and other outdoor enthusiasts. The town has a diverse population, with a median household income of $37,500 and a median family income of $45,000.
Common Questions
What is the Total Population of Wye?
Total Population of Wye is 1,074.
What is the Total Male Population of Wye?
Total Male Population of Wye is 542.
What is the Total Female Population of Wye?
Total Female Population of Wye is 532.
What is the Ratio of Males per 100 Females in Wye?
There are 101.88 Males per 100 Females in Wye.
What is the Ratio of Females per 100 Males in Wye?
There are 98.15 Females per 100 Males in Wye.
What is the Median Population Age in Wye?
Median Population Age in Wye is 26.6 Years.
What is the Average Family Size in Wye
Average Family Size in Wye is 3.4 People.
What is the Average Household Size in Wye
Average Household Size in Wye is 3.2 People.
What is Per Capita Income in Wye?
Per Capita income in Wye is $40,504.
What is the Median Family Income in Wye?
Median Family Income in Wye is $91,522.
What is the Median Household income in Wye?
Median Household Income in Wye is $93,264.
What is Income or Wage Gap in Wye?
Income or Wage Gap in Wye is 40.6%.
Women in Wye earn 59.4 cents for every dollar earned by a man.
What is Inequality or Gini Index in Wye?
Inequality or Gini Index in Wye is 0.28.
How Large is the Labor Force in Wye?
There are 653 People in the Labor Forcein in Wye.
What is the Percentage of People in the Labor Force in Wye?
83.9% of People are in the Labor Force in Wye.
What is the Unemployment Rate in Wye?
Unemployment Rate in Wye is 5.7%.