Zip Codes with the Highest Percentage of Population Employed in Health Diagnosing & Treating in Bozeman, MT
RELATED REPORTS & OPTIONS
Health Diagnosing & Treating
Bozeman
Compare Zip Codes
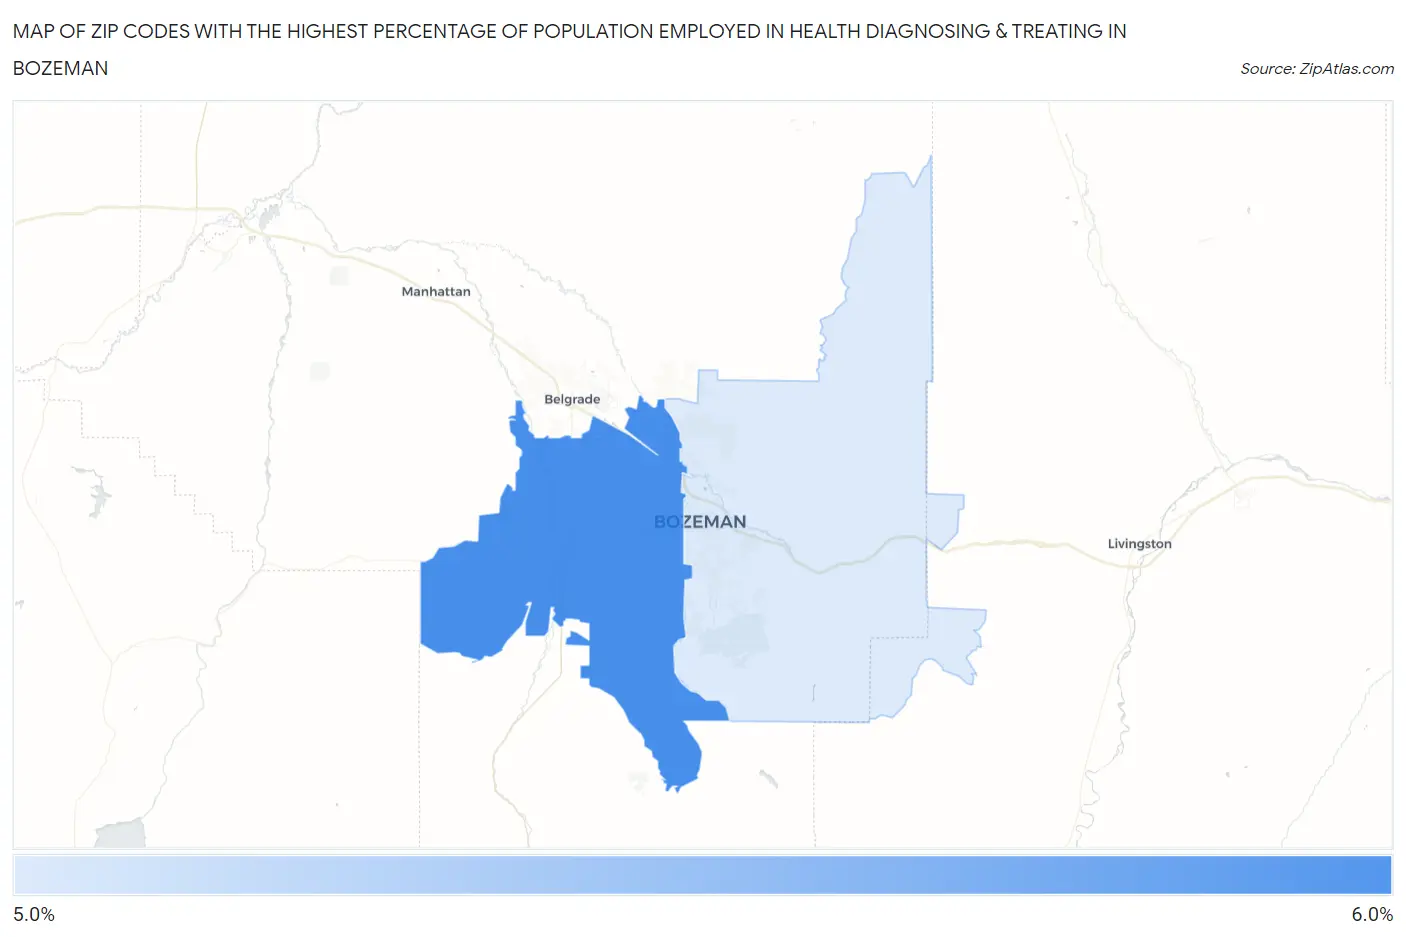
Map of Zip Codes with the Highest Percentage of Population Employed in Health Diagnosing & Treating in Bozeman
0.0%
6.0%
Zip Codes with the Highest Percentage of Population Employed in Health Diagnosing & Treating in Bozeman, MT
| Zip Code | % Employed | vs State | vs National | |
| 1. | 59718 | 5.4% | 6.6%(-1.14)#129 | 6.2%(-0.825)#16,098 |
| 2. | 59715 | 5.1% | 6.6%(-1.49)#134 | 6.2%(-1.17)#17,408 |
1
Common Questions
What are the Top Zip Codes with the Highest Percentage of Population Employed in Health Diagnosing & Treating in Bozeman, MT?
Top Zip Codes with the Highest Percentage of Population Employed in Health Diagnosing & Treating in Bozeman, MT are:
What zip code has the Highest Percentage of Population Employed in Health Diagnosing & Treating in Bozeman, MT?
59718 has the Highest Percentage of Population Employed in Health Diagnosing & Treating in Bozeman, MT with 5.4%.
What is the Percentage of Population Employed in Health Diagnosing & Treating in Bozeman, MT?
Percentage of Population Employed in Health Diagnosing & Treating in Bozeman is 5.3%.
What is the Percentage of Population Employed in Health Diagnosing & Treating in Montana?
Percentage of Population Employed in Health Diagnosing & Treating in Montana is 6.6%.
What is the Percentage of Population Employed in Health Diagnosing & Treating in the United States?
Percentage of Population Employed in Health Diagnosing & Treating in the United States is 6.2%.