Guamanian/Chamorro vs Immigrants from Honduras Per Capita Income
COMPARE
Guamanian/Chamorro
Immigrants from Honduras
Per Capita Income
Per Capita Income Comparison
Guamanians/Chamorros
Immigrants from Honduras
$41,678
PER CAPITA INCOME
9.7/ 100
METRIC RATING
217th/ 347
METRIC RANK
$36,665
PER CAPITA INCOME
0.0/ 100
METRIC RATING
309th/ 347
METRIC RANK
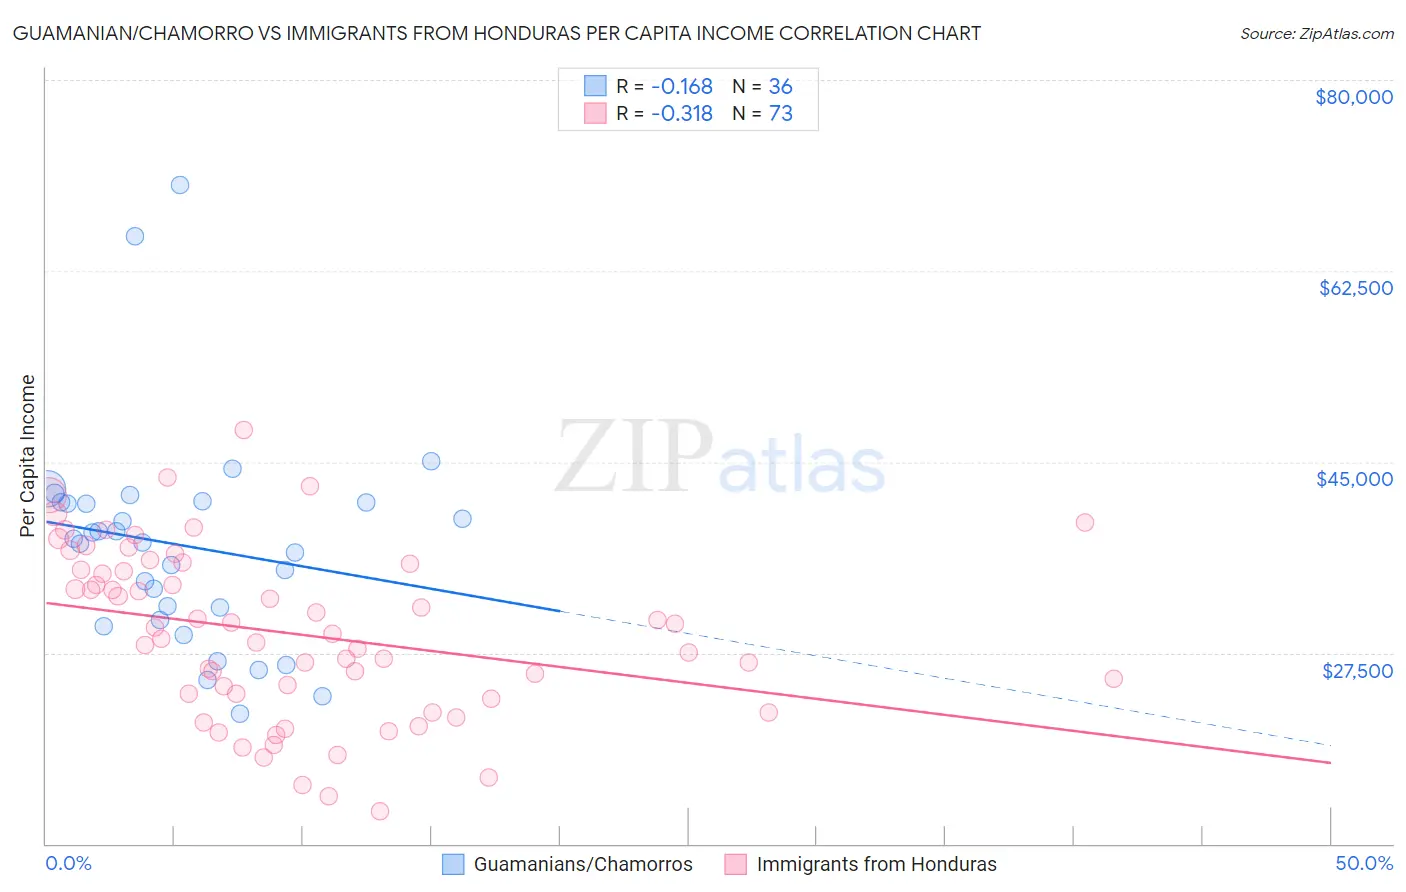
Guamanian/Chamorro vs Immigrants from Honduras Per Capita Income Correlation Chart
The statistical analysis conducted on geographies consisting of 221,916,418 people shows a poor negative correlation between the proportion of Guamanians/Chamorros and per capita income in the United States with a correlation coefficient (R) of -0.168 and weighted average of $41,678. Similarly, the statistical analysis conducted on geographies consisting of 322,641,994 people shows a mild negative correlation between the proportion of Immigrants from Honduras and per capita income in the United States with a correlation coefficient (R) of -0.318 and weighted average of $36,665, a difference of 13.7%.
Per Capita Income Correlation Summary
| Measurement | Guamanian/Chamorro | Immigrants from Honduras |
| Minimum | $21,937 | $13,018 |
| Maximum | $70,391 | $47,908 |
| Range | $48,454 | $34,890 |
| Mean | $37,325 | $29,255 |
| Median | $37,776 | $29,272 |
| Interquartile 25% (IQ1) | $31,068 | $23,483 |
| Interquartile 75% (IQ3) | $41,275 | $35,344 |
| Interquartile Range (IQR) | $10,207 | $11,861 |
| Standard Deviation (Sample) | $9,827 | $7,769 |
| Standard Deviation (Population) | $9,689 | $7,715 |
Similar Demographics by Per Capita Income
Demographics Similar to Guamanians/Chamorros by Per Capita Income
In terms of per capita income, the demographic groups most similar to Guamanians/Chamorros are Tongan ($41,693, a difference of 0.030%), Sudanese ($41,695, a difference of 0.040%), Trinidadian and Tobagonian ($41,655, a difference of 0.060%), Immigrants from Bangladesh ($41,709, a difference of 0.070%), and Immigrants from Venezuela ($41,727, a difference of 0.12%).
| Demographics | Rating | Rank | Per Capita Income |
| Ecuadorians | 12.9 /100 | #210 | Poor $41,958 |
| Immigrants | Panama | 11.6 /100 | #211 | Poor $41,853 |
| Immigrants | Senegal | 11.3 /100 | #212 | Poor $41,830 |
| Immigrants | Venezuela | 10.2 /100 | #213 | Poor $41,727 |
| Immigrants | Bangladesh | 10.1 /100 | #214 | Poor $41,709 |
| Sudanese | 9.9 /100 | #215 | Tragic $41,695 |
| Tongans | 9.9 /100 | #216 | Tragic $41,693 |
| Guamanians/Chamorros | 9.7 /100 | #217 | Tragic $41,678 |
| Trinidadians and Tobagonians | 9.5 /100 | #218 | Tragic $41,655 |
| Puget Sound Salish | 8.1 /100 | #219 | Tragic $41,495 |
| Immigrants | Barbados | 7.9 /100 | #220 | Tragic $41,478 |
| Immigrants | Trinidad and Tobago | 7.9 /100 | #221 | Tragic $41,476 |
| Immigrants | Iraq | 7.1 /100 | #222 | Tragic $41,365 |
| Immigrants | Cameroon | 6.8 /100 | #223 | Tragic $41,334 |
| Immigrants | St. Vincent and the Grenadines | 6.4 /100 | #224 | Tragic $41,270 |
Demographics Similar to Immigrants from Honduras by Per Capita Income
In terms of per capita income, the demographic groups most similar to Immigrants from Honduras are Ute ($36,651, a difference of 0.040%), Fijian ($36,690, a difference of 0.070%), Chippewa ($36,631, a difference of 0.090%), Immigrants from Latin America ($36,823, a difference of 0.43%), and Immigrants from Haiti ($36,849, a difference of 0.50%).
| Demographics | Rating | Rank | Per Capita Income |
| Shoshone | 0.1 /100 | #302 | Tragic $37,072 |
| Paiute | 0.1 /100 | #303 | Tragic $37,066 |
| Hondurans | 0.1 /100 | #304 | Tragic $37,031 |
| Inupiat | 0.1 /100 | #305 | Tragic $36,999 |
| Immigrants | Haiti | 0.0 /100 | #306 | Tragic $36,849 |
| Immigrants | Latin America | 0.0 /100 | #307 | Tragic $36,823 |
| Fijians | 0.0 /100 | #308 | Tragic $36,690 |
| Immigrants | Honduras | 0.0 /100 | #309 | Tragic $36,665 |
| Ute | 0.0 /100 | #310 | Tragic $36,651 |
| Chippewa | 0.0 /100 | #311 | Tragic $36,631 |
| Chickasaw | 0.0 /100 | #312 | Tragic $36,475 |
| Bahamians | 0.0 /100 | #313 | Tragic $36,427 |
| Seminole | 0.0 /100 | #314 | Tragic $36,180 |
| Yaqui | 0.0 /100 | #315 | Tragic $36,112 |
| Choctaw | 0.0 /100 | #316 | Tragic $35,999 |