Asian vs Ghanaian Wage/Income Gap

COMPARE

Asian
Race
Ancestry
AfghanAfricanAlaska NativeAlaskan AthabascanAlbanianAleutAlsatianAmericanApacheArabArapahoArgentineanArmenianAssyrian/Chaldean/SyriacAustralianAustrianBahamianBangladeshiBarbadianBasqueBelgianBelizeanBermudanBhutaneseBlackfeetBolivianBrazilianBritishBritish West IndianBulgarianBurmeseCajunCambodianCanadianCape VerdeanCarpatho RusynCelticCentral AmericanCentral American IndianCherokeeCheyenneChickasawChileanChineseChippewaChoctawColombianColvilleComancheCosta RicanCreeCreekCroatianCrowCubanCypriotCzechCzechoslovakianDanishDelawareDominicanDutchDutch West IndianEastern EuropeanEcuadorianEgyptianEnglishEstonianEthiopianEuropeanFijianFilipinoFinnishFrenchFrench American IndianFrench CanadianGermanGerman RussianGreekGuamanian/ChamorroGuatemalanGuyaneseHaitianHmongHonduranHopiHoumaHungarianIcelanderIndian (Asian)IndonesianInupiatIranianIraqiIrishIroquoisIsraeliItalianJamaicanJapaneseJordanianKenyanKiowaKoreanLaotianLatvianLebaneseLiberianLithuanianLumbeeLuxembourgerMacedonianMalaysianMalteseMarshalleseMenomineeMexicanMexican American IndianMongolianMoroccanNative HawaiianNavajoNepaleseNew ZealanderNicaraguanNigerianNorthern EuropeanNorwegianOkinawanOsageOttawaPaiutePakistaniPalestinianPanamanianParaguayanPennsylvania GermanPeruvianPimaPolishPortuguesePotawatomiPuebloPuerto RicanPuget Sound SalishRomanianRussianSalvadoranSamoanScandinavianScotch-IrishScottishSeminoleSenegaleseSerbianShoshoneSierra LeoneanSiouxSlavicSlovakSloveneSomaliSouth AfricanSouth AmericanSouth American IndianSoviet UnionSpaniardSpanishSpanish AmericanSpanish American IndianSri LankanSubsaharan AfricanSudaneseSwedishSwissSyrianTaiwaneseThaiTlingit-HaidaTohono O'OdhamTonganTrinidadian and TobagonianTsimshianTurkishU.S. Virgin IslanderUgandanUkrainianUruguayanUteVenezuelanVietnameseWelshWest IndianYakamaYaquiYugoslavianYumanYup'ikZimbabwean
Immigration
NonimmigrantsImmigrantsAfghanistanAfricaAlbaniaArgentinaArmeniaAsiaAustraliaAustriaBahamasBangladeshBarbadosBelarusBelgiumBelizeBoliviaBosnia and HerzegovinaBrazilBulgariaBurma/MyanmarCabo VerdeCambodiaCameroonCanadaCaribbeanCentral AmericaChileChinaColombiaCongoCosta RicaCroatiaCubaCzechoslovakiaDenmarkDominicaDominican RepublicEastern AfricaEastern AsiaEastern EuropeEcuadorEgyptEl SalvadorEnglandEritreaEthiopiaEuropeFijiFranceGermanyGhanaGreeceGrenadaGuatemalaGuyanaHaitiHondurasHong KongHungaryIndiaIndonesiaIranIraqIrelandIsraelItalyJamaicaJapanJordanKazakhstanKenyaKoreaKuwaitLaosLatin AmericaLatviaLebanonLiberiaLithuaniaMalaysiaMexicoMicronesiaMiddle AfricaMoldovaMoroccoNepalNetherlandsNicaraguaNigeriaNorth AmericaNorth MacedoniaNorthern AfricaNorthern EuropeNorwayOceaniaPakistanPanamaPeruPhilippinesPolandPortugalRomaniaRussiaSaudi ArabiaScotlandSenegalSerbiaSierra LeoneSingaporeSomaliaSouth AfricaSouth AmericaSouth Central AsiaSouth Eastern AsiaSouthern EuropeSpainSri LankaSt. Vincent and the GrenadinesSudanSwedenSwitzerlandSyriaTaiwanThailandTrinidad and TobagoTurkeyUgandaUkraineUruguayUzbekistanVenezuelaVietnamWest IndiesWestern AfricaWestern AsiaWestern EuropeYemenZaireZimbabweAzores
Ghanaian
Race
Ancestry
AfghanAfricanAlaska NativeAlaskan AthabascanAlbanianAleutAlsatianAmericanApacheArabArapahoArgentineanArmenianAssyrian/Chaldean/SyriacAustralianAustrianBahamianBangladeshiBarbadianBasqueBelgianBelizeanBermudanBhutaneseBlackfeetBolivianBrazilianBritishBritish West IndianBulgarianBurmeseCajunCambodianCanadianCape VerdeanCarpatho RusynCelticCentral AmericanCentral American IndianCherokeeCheyenneChickasawChileanChineseChippewaChoctawColombianColvilleComancheCosta RicanCreeCreekCroatianCrowCubanCypriotCzechCzechoslovakianDanishDelawareDominicanDutchDutch West IndianEastern EuropeanEcuadorianEgyptianEnglishEstonianEthiopianEuropeanFijianFilipinoFinnishFrenchFrench American IndianFrench CanadianGermanGerman RussianGhanaianGreekGuamanian/ChamorroGuatemalanGuyaneseHaitianHmongHonduranHopiHoumaHungarianIcelanderIndian (Asian)IndonesianInupiatIranianIraqiIrishIroquoisIsraeliItalianJamaicanJapaneseJordanianKenyanKiowaKoreanLaotianLatvianLebaneseLiberianLithuanianLumbeeLuxembourgerMacedonianMalaysianMalteseMarshalleseMenomineeMexicanMexican American IndianMongolianMoroccanNative HawaiianNavajoNepaleseNew ZealanderNicaraguanNigerianNorthern EuropeanNorwegianOkinawanOsageOttawaPaiutePakistaniPalestinianPanamanianParaguayanPennsylvania GermanPeruvianPimaPolishPortuguesePotawatomiPuebloPuerto RicanPuget Sound SalishRomanianRussianSalvadoranSamoanScandinavianScotch-IrishScottishSeminoleSenegaleseSerbianShoshoneSierra LeoneanSiouxSlavicSlovakSloveneSomaliSouth AfricanSouth AmericanSouth American IndianSoviet UnionSpaniardSpanishSpanish AmericanSpanish American IndianSri LankanSubsaharan AfricanSudaneseSwedishSwissSyrianTaiwaneseThaiTlingit-HaidaTohono O'OdhamTonganTrinidadian and TobagonianTsimshianTurkishU.S. Virgin IslanderUgandanUkrainianUruguayanUteVenezuelanVietnameseWelshWest IndianYakamaYaquiYugoslavianYumanYup'ikZimbabwean
Immigration
NonimmigrantsImmigrantsAfghanistanAfricaAlbaniaArgentinaArmeniaAsiaAustraliaAustriaBahamasBangladeshBarbadosBelarusBelgiumBelizeBoliviaBosnia and HerzegovinaBrazilBulgariaBurma/MyanmarCabo VerdeCambodiaCameroonCanadaCaribbeanCentral AmericaChileChinaColombiaCongoCosta RicaCroatiaCubaCzechoslovakiaDenmarkDominicaDominican RepublicEastern AfricaEastern AsiaEastern EuropeEcuadorEgyptEl SalvadorEnglandEritreaEthiopiaEuropeFijiFranceGermanyGhanaGreeceGrenadaGuatemalaGuyanaHaitiHondurasHong KongHungaryIndiaIndonesiaIranIraqIrelandIsraelItalyJamaicaJapanJordanKazakhstanKenyaKoreaKuwaitLaosLatin AmericaLatviaLebanonLiberiaLithuaniaMalaysiaMexicoMicronesiaMiddle AfricaMoldovaMoroccoNepalNetherlandsNicaraguaNigeriaNorth AmericaNorth MacedoniaNorthern AfricaNorthern EuropeNorwayOceaniaPakistanPanamaPeruPhilippinesPolandPortugalRomaniaRussiaSaudi ArabiaScotlandSenegalSerbiaSierra LeoneSingaporeSomaliaSouth AfricaSouth AmericaSouth Central AsiaSouth Eastern AsiaSouthern EuropeSpainSri LankaSt. Vincent and the GrenadinesSudanSwedenSwitzerlandSyriaTaiwanThailandTrinidad and TobagoTurkeyUgandaUkraineUruguayUzbekistanVenezuelaVietnamWest IndiesWestern AfricaWestern AsiaWestern EuropeYemenZaireZimbabweAzores
Wage/Income Gap
Income
Poverty
Unemployment
Labor Participation
Family Structure
Vehicle Availability
Education Level
Disability

Wage/Income Gap Comparison

Asians

Ghanaians

Tragic
Exceptional
26.9%
WAGE/INCOME GAP
5.9/ 100
METRIC RATING
226th/ 347
METRIC RANK
22.3%
WAGE/INCOME GAP
100.0/ 100
METRIC RATING
57th/ 347
METRIC RANK

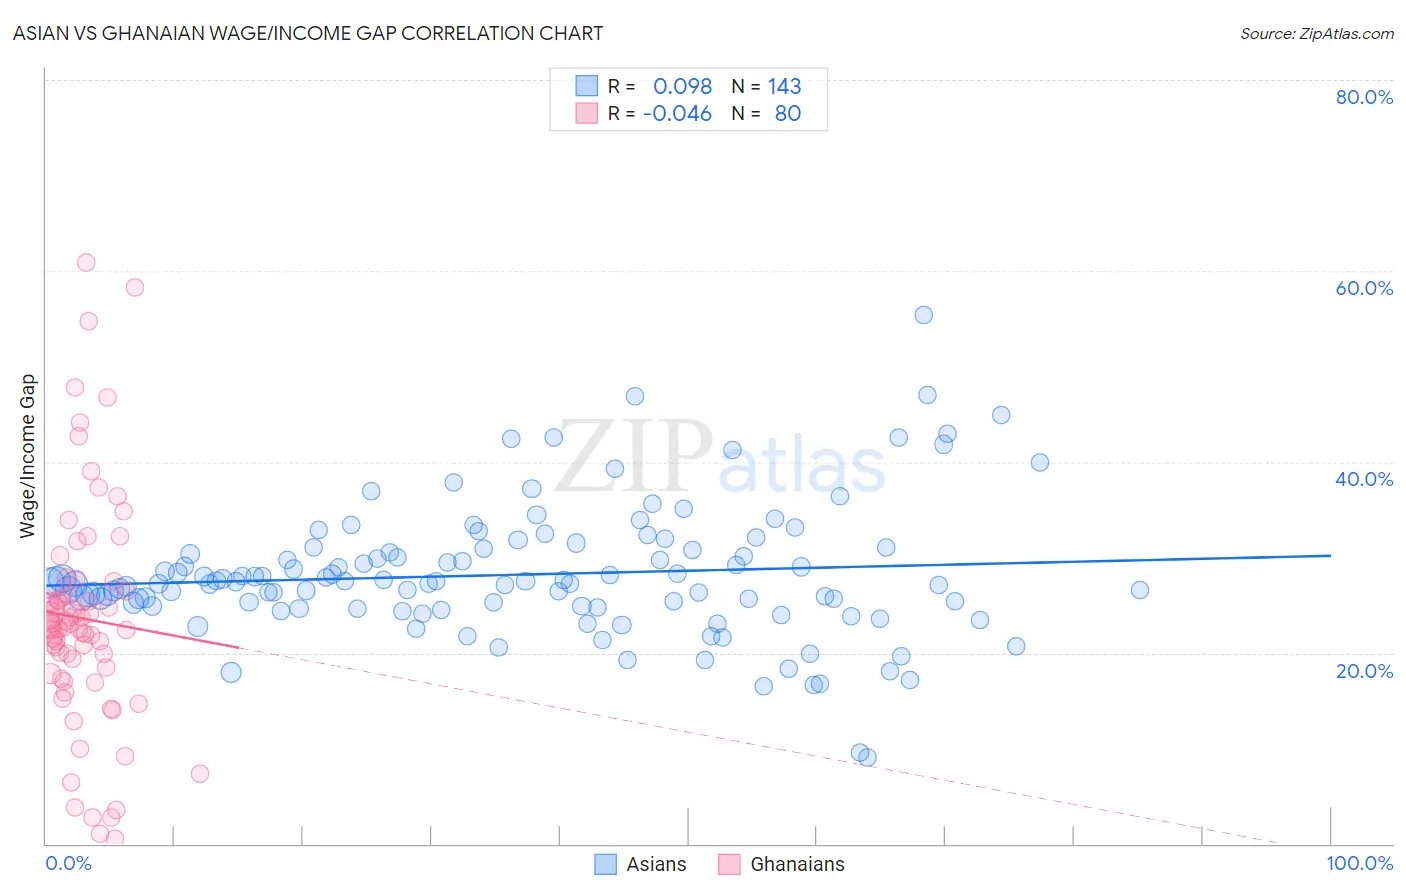
Asian vs Ghanaian Wage/Income Gap Correlation Chart

The statistical analysis conducted on geographies consisting of 549,374,424 people shows a slight positive correlation between the proportion of Asians and wage/income gap percentage in the United States with a correlation coefficient (R) of 0.098 and weighted average of 26.9%. Similarly, the statistical analysis conducted on geographies consisting of 190,692,121 people shows no correlation between the proportion of Ghanaians and wage/income gap percentage in the United States with a correlation coefficient (R) of -0.046 and weighted average of 22.3%, a difference of 20.6%.
Asian vs Ghanaian Wage/Income Gap

Wage/Income Gap Correlation Summary

MeasurementAsianGhanaian
Minimum9.1%0.52%
Maximum55.3%60.8%
Range46.3%60.3%
Mean28.2%23.6%
Median27.4%22.8%
Interquartile 25% (IQ1)24.9%18.1%
Interquartile 75% (IQ3)30.8%26.2%
Interquartile Range (IQR)5.9%8.0%
Standard Deviation (Sample)6.8%11.9%
Standard Deviation (Population)6.8%11.8%

Similar Demographics by Wage/Income Gap

Demographics Similar to Asians by Wage/Income Gap

In terms of wage/income gap, the demographic groups most similar to Asians are Spaniard (27.0%, a difference of 0.080%), Immigrants from Turkey (27.0%, a difference of 0.080%), Immigrants from Asia (27.0%, a difference of 0.11%), Ottawa (27.0%, a difference of 0.16%), and Immigrants from Ireland (26.9%, a difference of 0.17%).
DemographicsRating | RankWage/Income Gap
Immigrants | Poland
8.9
/100
|
#219
Tragic
26.7%
Immigrants | Latvia
8.9
/100
|
#220
Tragic
26.7%
Immigrants | Spain
8.5
/100
|
#221
Tragic
26.8%
Bolivians
8.3
/100
|
#222
Tragic
26.8%
Jordanians
8.0
/100
|
#223
Tragic
26.8%
Immigrants | Argentina
7.2
/100
|
#224
Tragic
26.8%
Immigrants | Ireland
6.5
/100
|
#225
Tragic
26.9%
Asians
5.9
/100
|
#226
Tragic
26.9%
Spaniards
5.6
/100
|
#227
Tragic
27.0%
Immigrants | Turkey
5.6
/100
|
#228
Tragic
27.0%
Immigrants | Asia
5.5
/100
|
#229
Tragic
27.0%
Ottawa
5.3
/100
|
#230
Tragic
27.0%
Bhutanese
5.3
/100
|
#231
Tragic
27.0%
Argentineans
5.2
/100
|
#232
Tragic
27.0%
Immigrants | Brazil
5.0
/100
|
#233
Tragic
27.0%

Demographics Similar to Ghanaians by Wage/Income Gap

In terms of wage/income gap, the demographic groups most similar to Ghanaians are Immigrants from Cuba (22.4%, a difference of 0.080%), Immigrants from Ghana (22.3%, a difference of 0.10%), Navajo (22.4%, a difference of 0.12%), Immigrants from Zaire (22.3%, a difference of 0.13%), and Immigrants from Middle Africa (22.4%, a difference of 0.14%).
DemographicsRating | RankWage/Income Gap
Immigrants | Western Africa
100.0
/100
|
#50
Exceptional
22.0%
Tohono O'odham
100.0
/100
|
#51
Exceptional
22.1%
Immigrants | Cameroon
100.0
/100
|
#52
Exceptional
22.2%
Bangladeshis
100.0
/100
|
#53
Exceptional
22.2%
Nepalese
100.0
/100
|
#54
Exceptional
22.2%
Immigrants | Zaire
100.0
/100
|
#55
Exceptional
22.3%
Immigrants | Ghana
100.0
/100
|
#56
Exceptional
22.3%
Ghanaians
100.0
/100
|
#57
Exceptional
22.3%
Immigrants | Cuba
100.0
/100
|
#58
Exceptional
22.4%
Navajo
100.0
/100
|
#59
Exceptional
22.4%
Immigrants | Middle Africa
100.0
/100
|
#60
Exceptional
22.4%
Immigrants | Fiji
100.0
/100
|
#61
Exceptional
22.4%
Immigrants | Guatemala
100.0
/100
|
#62
Exceptional
22.5%
Immigrants | Ecuador
100.0
/100
|
#63
Exceptional
22.5%
Spanish American Indians
100.0
/100
|
#64
Exceptional
22.5%