Navajo vs Immigrants from Singapore Married-couple Households
COMPARE
Navajo
Immigrants from Singapore
Married-couple Households
Married-couple Households Comparison
Navajo
Immigrants from Singapore
40.1%
MARRIED-COUPLE HOUSEHOLDS
0.0/ 100
METRIC RATING
324th/ 347
METRIC RANK
48.3%
MARRIED-COUPLE HOUSEHOLDS
98.6/ 100
METRIC RATING
73rd/ 347
METRIC RANK
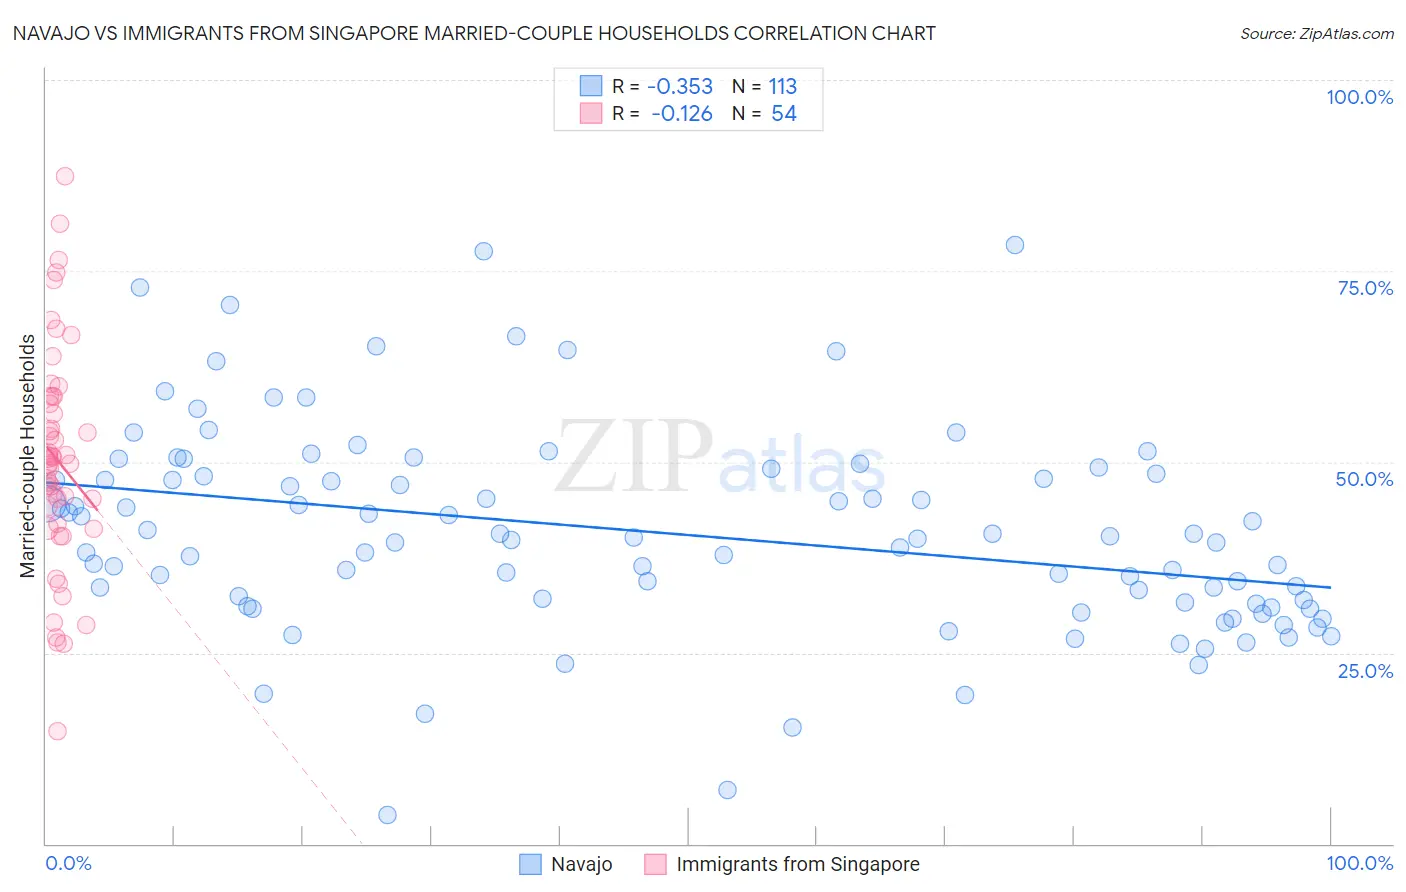
Navajo vs Immigrants from Singapore Married-couple Households Correlation Chart
The statistical analysis conducted on geographies consisting of 224,747,945 people shows a mild negative correlation between the proportion of Navajo and percentage of married-couple family households in the United States with a correlation coefficient (R) of -0.353 and weighted average of 40.1%. Similarly, the statistical analysis conducted on geographies consisting of 137,440,387 people shows a poor negative correlation between the proportion of Immigrants from Singapore and percentage of married-couple family households in the United States with a correlation coefficient (R) of -0.126 and weighted average of 48.3%, a difference of 20.5%.
Married-couple Households Correlation Summary
| Measurement | Navajo | Immigrants from Singapore |
| Minimum | 3.8% | 14.8% |
| Maximum | 78.4% | 87.3% |
| Range | 74.6% | 72.5% |
| Mean | 40.7% | 50.2% |
| Median | 39.9% | 50.1% |
| Interquartile 25% (IQ1) | 31.5% | 41.8% |
| Interquartile 75% (IQ3) | 48.3% | 58.6% |
| Interquartile Range (IQR) | 16.8% | 16.7% |
| Standard Deviation (Sample) | 13.4% | 14.5% |
| Standard Deviation (Population) | 13.3% | 14.3% |
Similar Demographics by Married-couple Households
Demographics Similar to Navajo by Married-couple Households
In terms of married-couple households, the demographic groups most similar to Navajo are Immigrants from Zaire (40.1%, a difference of 0.010%), Puerto Rican (40.1%, a difference of 0.010%), Pueblo (40.0%, a difference of 0.23%), Immigrants from Liberia (40.3%, a difference of 0.67%), and U.S. Virgin Islander (39.8%, a difference of 0.69%).
| Demographics | Rating | Rank | Married-couple Households |
| Immigrants | Jamaica | 0.0 /100 | #317 | Tragic 40.7% |
| Liberians | 0.0 /100 | #318 | Tragic 40.7% |
| Bahamians | 0.0 /100 | #319 | Tragic 40.5% |
| West Indians | 0.0 /100 | #320 | Tragic 40.3% |
| Immigrants | Liberia | 0.0 /100 | #321 | Tragic 40.3% |
| Immigrants | Zaire | 0.0 /100 | #322 | Tragic 40.1% |
| Puerto Ricans | 0.0 /100 | #323 | Tragic 40.1% |
| Navajo | 0.0 /100 | #324 | Tragic 40.1% |
| Pueblo | 0.0 /100 | #325 | Tragic 40.0% |
| U.S. Virgin Islanders | 0.0 /100 | #326 | Tragic 39.8% |
| Lumbee | 0.0 /100 | #327 | Tragic 39.6% |
| Barbadians | 0.0 /100 | #328 | Tragic 39.4% |
| Immigrants | Dominica | 0.0 /100 | #329 | Tragic 39.4% |
| Immigrants | Barbados | 0.0 /100 | #330 | Tragic 39.2% |
| Immigrants | Congo | 0.0 /100 | #331 | Tragic 39.0% |
Demographics Similar to Immigrants from Singapore by Married-couple Households
In terms of married-couple households, the demographic groups most similar to Immigrants from Singapore are Immigrants from Romania (48.3%, a difference of 0.010%), Scotch-Irish (48.3%, a difference of 0.020%), Immigrants from England (48.2%, a difference of 0.10%), Immigrants from Fiji (48.2%, a difference of 0.10%), and Laotian (48.4%, a difference of 0.19%).
| Demographics | Rating | Rank | Married-couple Households |
| Jordanians | 98.9 /100 | #66 | Exceptional 48.4% |
| Romanians | 98.9 /100 | #67 | Exceptional 48.4% |
| Immigrants | South Eastern Asia | 98.9 /100 | #68 | Exceptional 48.4% |
| Immigrants | China | 98.9 /100 | #69 | Exceptional 48.4% |
| Immigrants | North America | 98.9 /100 | #70 | Exceptional 48.4% |
| Laotians | 98.8 /100 | #71 | Exceptional 48.4% |
| Scotch-Irish | 98.6 /100 | #72 | Exceptional 48.3% |
| Immigrants | Singapore | 98.6 /100 | #73 | Exceptional 48.3% |
| Immigrants | Romania | 98.6 /100 | #74 | Exceptional 48.3% |
| Immigrants | England | 98.4 /100 | #75 | Exceptional 48.2% |
| Immigrants | Fiji | 98.4 /100 | #76 | Exceptional 48.2% |
| Canadians | 98.2 /100 | #77 | Exceptional 48.2% |
| Egyptians | 98.2 /100 | #78 | Exceptional 48.2% |
| Immigrants | Netherlands | 98.2 /100 | #79 | Exceptional 48.2% |
| Russians | 98.1 /100 | #80 | Exceptional 48.2% |