Immigrants from Cuba vs Alaskan Athabascan Self-Care Disability

COMPARE

Immigrants from Cuba
Race
Ancestry
AfghanAfricanAlaska NativeAlbanianAleutAlsatianAmericanApacheArabArapahoArgentineanArmenianAssyrian/Chaldean/SyriacAustralianAustrianBahamianBangladeshiBarbadianBasqueBelgianBelizeanBermudanBhutaneseBlackfeetBolivianBrazilianBritishBritish West IndianBulgarianBurmeseCajunCambodianCanadianCape VerdeanCarpatho RusynCelticCentral AmericanCentral American IndianCherokeeCheyenneChickasawChileanChineseChippewaChoctawColombianColvilleComancheCosta RicanCreeCreekCroatianCrowCubanCypriotCzechCzechoslovakianDanishDelawareDominicanDutchDutch West IndianEastern EuropeanEcuadorianEgyptianEnglishEstonianEthiopianEuropeanFijianFilipinoFinnishFrenchFrench American IndianFrench CanadianGermanGerman RussianGhanaianGreekGuamanian/ChamorroGuatemalanGuyaneseHaitianHmongHonduranHopiHoumaHungarianIcelanderIndian (Asian)IndonesianInupiatIranianIraqiIrishIroquoisIsraeliItalianJamaicanJapaneseJordanianKenyanKiowaKoreanLaotianLatvianLebaneseLiberianLithuanianLumbeeLuxembourgerMacedonianMalaysianMalteseMarshalleseMenomineeMexicanMexican American IndianMongolianMoroccanNative HawaiianNavajoNepaleseNew ZealanderNicaraguanNigerianNorthern EuropeanNorwegianOkinawanOsageOttawaPaiutePakistaniPalestinianPanamanianParaguayanPennsylvania GermanPeruvianPimaPolishPortuguesePotawatomiPuebloPuerto RicanPuget Sound SalishRomanianRussianSalvadoranSamoanScandinavianScotch-IrishScottishSeminoleSenegaleseSerbianShoshoneSierra LeoneanSiouxSlavicSlovakSloveneSomaliSouth AfricanSouth AmericanSouth American IndianSoviet UnionSpaniardSpanishSpanish AmericanSpanish American IndianSri LankanSubsaharan AfricanSudaneseSwedishSwissSyrianTaiwaneseThaiTlingit-HaidaTohono O'OdhamTonganTrinidadian and TobagonianTsimshianTurkishU.S. Virgin IslanderUgandanUkrainianUruguayanUteVenezuelanVietnameseWelshWest IndianYakamaYaquiYugoslavianYumanYup'ikZimbabwean
Immigration
NonimmigrantsImmigrantsAfghanistanAfricaAlbaniaArgentinaArmeniaAsiaAustraliaAustriaBahamasBangladeshBarbadosBelarusBelgiumBelizeBoliviaBosnia and HerzegovinaBrazilBulgariaBurma/MyanmarCabo VerdeCambodiaCameroonCanadaCaribbeanCentral AmericaChileChinaColombiaCongoCosta RicaCroatiaCubaCzechoslovakiaDenmarkDominicaDominican RepublicEastern AfricaEastern AsiaEastern EuropeEcuadorEgyptEl SalvadorEnglandEritreaEthiopiaEuropeFijiFranceGermanyGhanaGreeceGrenadaGuatemalaGuyanaHaitiHondurasHong KongHungaryIndiaIndonesiaIranIraqIrelandIsraelItalyJamaicaJapanJordanKazakhstanKenyaKoreaKuwaitLaosLatin AmericaLatviaLebanonLiberiaLithuaniaMalaysiaMexicoMicronesiaMiddle AfricaMoldovaMoroccoNepalNetherlandsNicaraguaNigeriaNorth AmericaNorth MacedoniaNorthern AfricaNorthern EuropeNorwayOceaniaPakistanPanamaPeruPhilippinesPolandPortugalRomaniaRussiaSaudi ArabiaScotlandSenegalSerbiaSierra LeoneSingaporeSomaliaSouth AfricaSouth AmericaSouth Central AsiaSouth Eastern AsiaSouthern EuropeSpainSri LankaSt. Vincent and the GrenadinesSudanSwedenSwitzerlandSyriaTaiwanThailandTrinidad and TobagoTurkeyUgandaUkraineUruguayUzbekistanVenezuelaVietnamWest IndiesWestern AfricaWestern AsiaWestern EuropeYemenZaireZimbabweAzores
Alaskan Athabascan
Race
Ancestry
AfghanAfricanAlaska NativeAlaskan AthabascanAlbanianAleutAlsatianAmericanApacheArabArapahoArgentineanArmenianAssyrian/Chaldean/SyriacAustralianAustrianBahamianBangladeshiBarbadianBasqueBelgianBelizeanBermudanBhutaneseBlackfeetBolivianBrazilianBritishBritish West IndianBulgarianBurmeseCajunCambodianCanadianCape VerdeanCarpatho RusynCelticCentral AmericanCentral American IndianCherokeeCheyenneChickasawChileanChineseChippewaChoctawColombianColvilleComancheCosta RicanCreeCreekCroatianCrowCubanCypriotCzechCzechoslovakianDanishDelawareDominicanDutchDutch West IndianEastern EuropeanEcuadorianEgyptianEnglishEstonianEthiopianEuropeanFijianFilipinoFinnishFrenchFrench American IndianFrench CanadianGermanGerman RussianGhanaianGreekGuamanian/ChamorroGuatemalanGuyaneseHaitianHmongHonduranHopiHoumaHungarianIcelanderIndian (Asian)IndonesianInupiatIranianIraqiIrishIroquoisIsraeliItalianJamaicanJapaneseJordanianKenyanKiowaKoreanLaotianLatvianLebaneseLiberianLithuanianLumbeeLuxembourgerMacedonianMalaysianMalteseMarshalleseMenomineeMexicanMexican American IndianMongolianMoroccanNative HawaiianNavajoNepaleseNew ZealanderNicaraguanNigerianNorthern EuropeanNorwegianOkinawanOsageOttawaPaiutePakistaniPalestinianPanamanianParaguayanPennsylvania GermanPeruvianPimaPolishPortuguesePotawatomiPuebloPuerto RicanPuget Sound SalishRomanianRussianSalvadoranSamoanScandinavianScotch-IrishScottishSeminoleSenegaleseSerbianShoshoneSierra LeoneanSiouxSlavicSlovakSloveneSomaliSouth AfricanSouth AmericanSouth American IndianSoviet UnionSpaniardSpanishSpanish AmericanSpanish American IndianSri LankanSubsaharan AfricanSudaneseSwedishSwissSyrianTaiwaneseThaiTlingit-HaidaTohono O'OdhamTonganTrinidadian and TobagonianTsimshianTurkishU.S. Virgin IslanderUgandanUkrainianUruguayanUteVenezuelanVietnameseWelshWest IndianYakamaYaquiYugoslavianYumanYup'ikZimbabwean
Immigration
NonimmigrantsImmigrantsAfghanistanAfricaAlbaniaArgentinaArmeniaAsiaAustraliaAustriaBahamasBangladeshBarbadosBelarusBelgiumBelizeBoliviaBosnia and HerzegovinaBrazilBulgariaBurma/MyanmarCabo VerdeCambodiaCameroonCanadaCaribbeanCentral AmericaChileChinaColombiaCongoCosta RicaCroatiaCzechoslovakiaDenmarkDominicaDominican RepublicEastern AfricaEastern AsiaEastern EuropeEcuadorEgyptEl SalvadorEnglandEritreaEthiopiaEuropeFijiFranceGermanyGhanaGreeceGrenadaGuatemalaGuyanaHaitiHondurasHong KongHungaryIndiaIndonesiaIranIraqIrelandIsraelItalyJamaicaJapanJordanKazakhstanKenyaKoreaKuwaitLaosLatin AmericaLatviaLebanonLiberiaLithuaniaMalaysiaMexicoMicronesiaMiddle AfricaMoldovaMoroccoNepalNetherlandsNicaraguaNigeriaNorth AmericaNorth MacedoniaNorthern AfricaNorthern EuropeNorwayOceaniaPakistanPanamaPeruPhilippinesPolandPortugalRomaniaRussiaSaudi ArabiaScotlandSenegalSerbiaSierra LeoneSingaporeSomaliaSouth AfricaSouth AmericaSouth Central AsiaSouth Eastern AsiaSouthern EuropeSpainSri LankaSt. Vincent and the GrenadinesSudanSwedenSwitzerlandSyriaTaiwanThailandTrinidad and TobagoTurkeyUgandaUkraineUruguayUzbekistanVenezuelaVietnamWest IndiesWestern AfricaWestern AsiaWestern EuropeYemenZaireZimbabweAzores
Self-Care Disability
Income
Poverty
Unemployment
Labor Participation
Family Structure
Vehicle Availability
Education Level
Disability

Self-Care Disability Comparison

Immigrants from Cuba

Alaskan Athabascans

Tragic
Poor
2.8%
SELF-CARE DISABILITY
0.0/ 100
METRIC RATING
315th/ 347
METRIC RANK
2.5%
SELF-CARE DISABILITY
10.4/ 100
METRIC RATING
206th/ 347
METRIC RANK

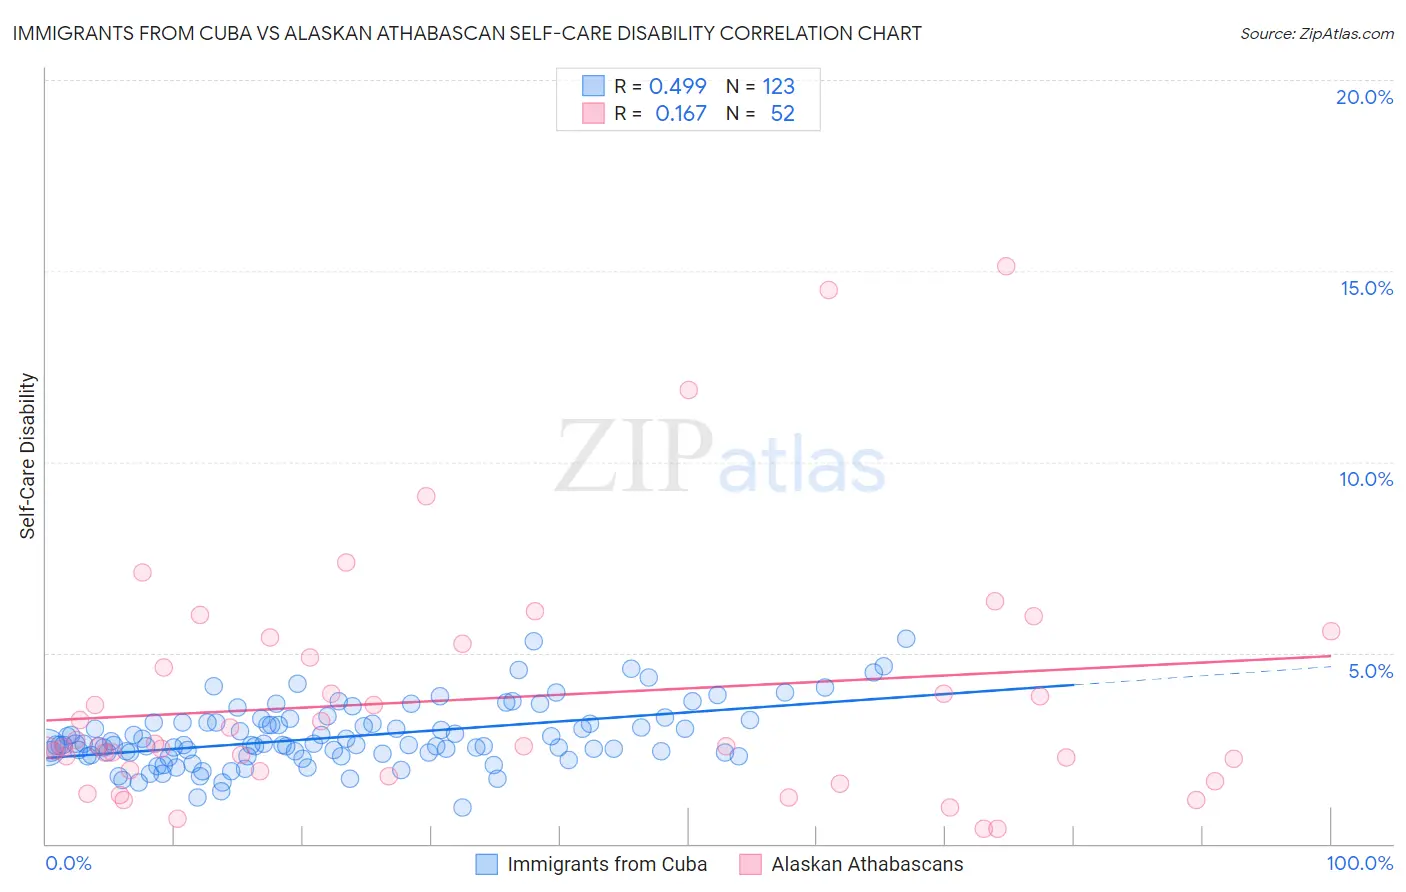
Immigrants from Cuba vs Alaskan Athabascan Self-Care Disability Correlation Chart

The statistical analysis conducted on geographies consisting of 325,827,675 people shows a moderate positive correlation between the proportion of Immigrants from Cuba and percentage of population with self-care disability in the United States with a correlation coefficient (R) of 0.499 and weighted average of 2.8%. Similarly, the statistical analysis conducted on geographies consisting of 45,796,895 people shows a poor positive correlation between the proportion of Alaskan Athabascans and percentage of population with self-care disability in the United States with a correlation coefficient (R) of 0.167 and weighted average of 2.5%, a difference of 12.3%.
Immigrants from Cuba vs Alaskan Athabascan Self-Care Disability

Self-Care Disability Correlation Summary

MeasurementImmigrants from CubaAlaskan Athabascan
Minimum0.96%0.38%
Maximum5.4%15.1%
Range4.4%14.7%
Mean2.8%3.8%
Median2.6%2.6%
Interquartile 25% (IQ1)2.4%1.9%
Interquartile 75% (IQ3)3.2%5.0%
Interquartile Range (IQR)0.79%3.1%
Standard Deviation (Sample)0.80%3.2%
Standard Deviation (Population)0.80%3.1%

Similar Demographics by Self-Care Disability

Demographics Similar to Immigrants from Cuba by Self-Care Disability

In terms of self-care disability, the demographic groups most similar to Immigrants from Cuba are Menominee (2.8%, a difference of 0.10%), Creek (2.8%, a difference of 0.21%), Immigrants from Dominica (2.8%, a difference of 0.23%), Assyrian/Chaldean/Syriac (2.8%, a difference of 0.24%), and Spanish American Indian (2.9%, a difference of 0.40%).
DemographicsRating | RankSelf-Care Disability
Immigrants | Grenada
0.0
/100
|
#308
Tragic
2.8%
Bangladeshis
0.0
/100
|
#309
Tragic
2.8%
British West Indians
0.0
/100
|
#310
Tragic
2.8%
Puget Sound Salish
0.0
/100
|
#311
Tragic
2.8%
Immigrants | Caribbean
0.0
/100
|
#312
Tragic
2.8%
Spanish Americans
0.0
/100
|
#313
Tragic
2.8%
Creek
0.0
/100
|
#314
Tragic
2.8%
Immigrants | Cuba
0.0
/100
|
#315
Tragic
2.8%
Menominee
0.0
/100
|
#316
Tragic
2.8%
Immigrants | Dominica
0.0
/100
|
#317
Tragic
2.8%
Assyrians/Chaldeans/Syriacs
0.0
/100
|
#318
Tragic
2.8%
Spanish American Indians
0.0
/100
|
#319
Tragic
2.9%
Chickasaw
0.0
/100
|
#320
Tragic
2.9%
Navajo
0.0
/100
|
#321
Tragic
2.9%
Comanche
0.0
/100
|
#322
Tragic
2.9%

Demographics Similar to Alaskan Athabascans by Self-Care Disability

In terms of self-care disability, the demographic groups most similar to Alaskan Athabascans are French (2.5%, a difference of 0.060%), Immigrants from Russia (2.5%, a difference of 0.080%), Immigrants from Bahamas (2.5%, a difference of 0.18%), Central American (2.5%, a difference of 0.23%), and Immigrants from Lebanon (2.5%, a difference of 0.24%).
DemographicsRating | RankSelf-Care Disability
Immigrants | Ghana
14.7
/100
|
#199
Poor
2.5%
Immigrants | Western Africa
13.3
/100
|
#200
Poor
2.5%
Immigrants | South Eastern Asia
12.9
/100
|
#201
Poor
2.5%
Slovaks
12.6
/100
|
#202
Poor
2.5%
Immigrants | Lebanon
12.4
/100
|
#203
Poor
2.5%
Immigrants | Bahamas
11.9
/100
|
#204
Poor
2.5%
Immigrants | Russia
11.0
/100
|
#205
Poor
2.5%
Alaskan Athabascans
10.4
/100
|
#206
Poor
2.5%
French
9.9
/100
|
#207
Tragic
2.5%
Central Americans
8.7
/100
|
#208
Tragic
2.5%
Malaysians
7.7
/100
|
#209
Tragic
2.5%
Panamanians
6.4
/100
|
#210
Tragic
2.5%
Native Hawaiians
5.1
/100
|
#211
Tragic
2.6%
Samoans
5.1
/100
|
#212
Tragic
2.6%
Ecuadorians
4.7
/100
|
#213
Tragic
2.6%