Immigrants from Cabo Verde vs Immigrants from Chile Disability Age 5 to 17

COMPARE

Immigrants from Cabo Verde
Race
Ancestry
AfghanAfricanAlaska NativeAlaskan AthabascanAlbanianAleutAlsatianAmericanApacheArabArapahoArgentineanArmenianAssyrian/Chaldean/SyriacAustralianAustrianBahamianBangladeshiBarbadianBasqueBelgianBelizeanBermudanBhutaneseBlackfeetBolivianBrazilianBritishBritish West IndianBulgarianBurmeseCajunCambodianCanadianCape VerdeanCarpatho RusynCelticCentral AmericanCentral American IndianCherokeeCheyenneChickasawChileanChineseChippewaChoctawColombianColvilleComancheCosta RicanCreeCreekCroatianCrowCubanCypriotCzechCzechoslovakianDanishDelawareDominicanDutchDutch West IndianEastern EuropeanEcuadorianEgyptianEnglishEstonianEthiopianEuropeanFijianFilipinoFinnishFrenchFrench American IndianFrench CanadianGermanGerman RussianGhanaianGreekGuamanian/ChamorroGuatemalanGuyaneseHaitianHmongHonduranHopiHoumaHungarianIcelanderIndian (Asian)IndonesianInupiatIranianIraqiIrishIroquoisIsraeliItalianJamaicanJapaneseJordanianKenyanKiowaKoreanLaotianLatvianLebaneseLiberianLithuanianLumbeeLuxembourgerMacedonianMalaysianMalteseMarshalleseMenomineeMexicanMexican American IndianMongolianMoroccanNative HawaiianNavajoNepaleseNew ZealanderNicaraguanNigerianNorthern EuropeanNorwegianOkinawanOsageOttawaPaiutePakistaniPalestinianPanamanianParaguayanPennsylvania GermanPeruvianPimaPolishPortuguesePotawatomiPuebloPuerto RicanPuget Sound SalishRomanianRussianSalvadoranSamoanScandinavianScotch-IrishScottishSeminoleSenegaleseSerbianShoshoneSierra LeoneanSiouxSlavicSlovakSloveneSomaliSouth AfricanSouth AmericanSouth American IndianSoviet UnionSpaniardSpanishSpanish AmericanSpanish American IndianSri LankanSubsaharan AfricanSudaneseSwedishSwissSyrianTaiwaneseThaiTlingit-HaidaTohono O'OdhamTonganTrinidadian and TobagonianTsimshianTurkishU.S. Virgin IslanderUgandanUkrainianUruguayanUteVenezuelanVietnameseWelshWest IndianYakamaYaquiYugoslavianYumanYup'ikZimbabwean
Immigration
NonimmigrantsImmigrantsAfghanistanAfricaAlbaniaArgentinaArmeniaAsiaAustraliaAustriaBahamasBangladeshBarbadosBelarusBelgiumBelizeBoliviaBosnia and HerzegovinaBrazilBulgariaBurma/MyanmarCabo VerdeCambodiaCameroonCanadaCaribbeanCentral AmericaChinaColombiaCongoCosta RicaCroatiaCubaCzechoslovakiaDenmarkDominicaDominican RepublicEastern AfricaEastern AsiaEastern EuropeEcuadorEgyptEl SalvadorEnglandEritreaEthiopiaEuropeFijiFranceGermanyGhanaGreeceGrenadaGuatemalaGuyanaHaitiHondurasHong KongHungaryIndiaIndonesiaIranIraqIrelandIsraelItalyJamaicaJapanJordanKazakhstanKenyaKoreaKuwaitLaosLatin AmericaLatviaLebanonLiberiaLithuaniaMalaysiaMexicoMicronesiaMiddle AfricaMoldovaMoroccoNepalNetherlandsNicaraguaNigeriaNorth AmericaNorth MacedoniaNorthern AfricaNorthern EuropeNorwayOceaniaPakistanPanamaPeruPhilippinesPolandPortugalRomaniaRussiaSaudi ArabiaScotlandSenegalSerbiaSierra LeoneSingaporeSomaliaSouth AfricaSouth AmericaSouth Central AsiaSouth Eastern AsiaSouthern EuropeSpainSri LankaSt. Vincent and the GrenadinesSudanSwedenSwitzerlandSyriaTaiwanThailandTrinidad and TobagoTurkeyUgandaUkraineUruguayUzbekistanVenezuelaVietnamWest IndiesWestern AfricaWestern AsiaWestern EuropeYemenZaireZimbabweAzores
Immigrants from Chile
Race
Ancestry
AfghanAfricanAlaska NativeAlaskan AthabascanAlbanianAleutAlsatianAmericanApacheArabArapahoArgentineanArmenianAssyrian/Chaldean/SyriacAustralianAustrianBahamianBangladeshiBarbadianBasqueBelgianBelizeanBermudanBhutaneseBlackfeetBolivianBrazilianBritishBritish West IndianBulgarianBurmeseCajunCambodianCanadianCape VerdeanCarpatho RusynCelticCentral AmericanCentral American IndianCherokeeCheyenneChickasawChileanChineseChippewaChoctawColombianColvilleComancheCosta RicanCreeCreekCroatianCrowCubanCypriotCzechCzechoslovakianDanishDelawareDominicanDutchDutch West IndianEastern EuropeanEcuadorianEgyptianEnglishEstonianEthiopianEuropeanFijianFilipinoFinnishFrenchFrench American IndianFrench CanadianGermanGerman RussianGhanaianGreekGuamanian/ChamorroGuatemalanGuyaneseHaitianHmongHonduranHopiHoumaHungarianIcelanderIndian (Asian)IndonesianInupiatIranianIraqiIrishIroquoisIsraeliItalianJamaicanJapaneseJordanianKenyanKiowaKoreanLaotianLatvianLebaneseLiberianLithuanianLumbeeLuxembourgerMacedonianMalaysianMalteseMarshalleseMenomineeMexicanMexican American IndianMongolianMoroccanNative HawaiianNavajoNepaleseNew ZealanderNicaraguanNigerianNorthern EuropeanNorwegianOkinawanOsageOttawaPaiutePakistaniPalestinianPanamanianParaguayanPennsylvania GermanPeruvianPimaPolishPortuguesePotawatomiPuebloPuerto RicanPuget Sound SalishRomanianRussianSalvadoranSamoanScandinavianScotch-IrishScottishSeminoleSenegaleseSerbianShoshoneSierra LeoneanSiouxSlavicSlovakSloveneSomaliSouth AfricanSouth AmericanSouth American IndianSoviet UnionSpaniardSpanishSpanish AmericanSpanish American IndianSri LankanSubsaharan AfricanSudaneseSwedishSwissSyrianTaiwaneseThaiTlingit-HaidaTohono O'OdhamTonganTrinidadian and TobagonianTsimshianTurkishU.S. Virgin IslanderUgandanUkrainianUruguayanUteVenezuelanVietnameseWelshWest IndianYakamaYaquiYugoslavianYumanYup'ikZimbabwean
Immigration
NonimmigrantsImmigrantsAfghanistanAfricaAlbaniaArgentinaArmeniaAsiaAustraliaAustriaBahamasBangladeshBarbadosBelarusBelgiumBelizeBoliviaBosnia and HerzegovinaBrazilBulgariaBurma/MyanmarCambodiaCameroonCanadaCaribbeanCentral AmericaChileChinaColombiaCongoCosta RicaCroatiaCubaCzechoslovakiaDenmarkDominicaDominican RepublicEastern AfricaEastern AsiaEastern EuropeEcuadorEgyptEl SalvadorEnglandEritreaEthiopiaEuropeFijiFranceGermanyGhanaGreeceGrenadaGuatemalaGuyanaHaitiHondurasHong KongHungaryIndiaIndonesiaIranIraqIrelandIsraelItalyJamaicaJapanJordanKazakhstanKenyaKoreaKuwaitLaosLatin AmericaLatviaLebanonLiberiaLithuaniaMalaysiaMexicoMicronesiaMiddle AfricaMoldovaMoroccoNepalNetherlandsNicaraguaNigeriaNorth AmericaNorth MacedoniaNorthern AfricaNorthern EuropeNorwayOceaniaPakistanPanamaPeruPhilippinesPolandPortugalRomaniaRussiaSaudi ArabiaScotlandSenegalSerbiaSierra LeoneSingaporeSomaliaSouth AfricaSouth AmericaSouth Central AsiaSouth Eastern AsiaSouthern EuropeSpainSri LankaSt. Vincent and the GrenadinesSudanSwedenSwitzerlandSyriaTaiwanThailandTrinidad and TobagoTurkeyUgandaUkraineUruguayUzbekistanVenezuelaVietnamWest IndiesWestern AfricaWestern AsiaWestern EuropeYemenZaireZimbabweAzores
Disability Age 5 to 17
Income
Poverty
Unemployment
Labor Participation
Family Structure
Vehicle Availability
Education Level
Disability

Disability Age 5 to 17 Comparison

Immigrants from Cabo Verde

Immigrants from Chile

Tragic
Exceptional
7.1%
DISABILITY AGE 5 TO 17
0.0/ 100
METRIC RATING
343rd/ 347
METRIC RANK
5.4%
DISABILITY AGE 5 TO 17
95.0/ 100
METRIC RATING
125th/ 347
METRIC RANK

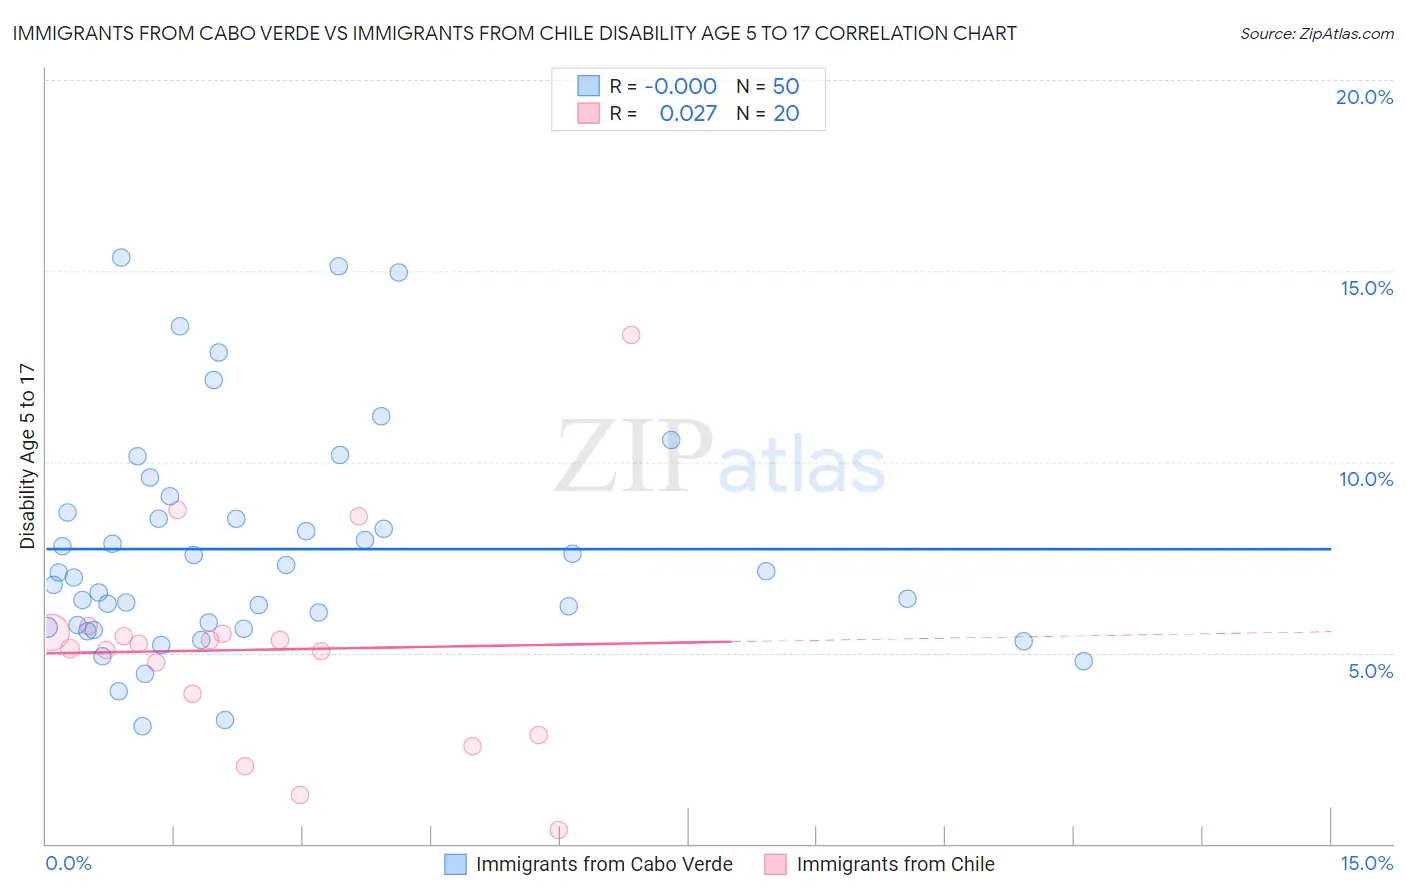
Immigrants from Cabo Verde vs Immigrants from Chile Disability Age 5 to 17 Correlation Chart

The statistical analysis conducted on geographies consisting of 38,075,511 people shows no correlation between the proportion of Immigrants from Cabo Verde and percentage of population with a disability between the ages 5 and 17 in the United States with a correlation coefficient (R) of -0.000 and weighted average of 7.1%. Similarly, the statistical analysis conducted on geographies consisting of 217,781,559 people shows no correlation between the proportion of Immigrants from Chile and percentage of population with a disability between the ages 5 and 17 in the United States with a correlation coefficient (R) of 0.027 and weighted average of 5.4%, a difference of 32.2%.
Immigrants from Cabo Verde vs Immigrants from Chile Disability Age 5 to 17

Disability Age 5 to 17 Correlation Summary

MeasurementImmigrants from Cabo VerdeImmigrants from Chile
Minimum3.1%0.37%
Maximum15.3%13.3%
Range12.3%13.0%
Mean7.7%5.1%
Median7.0%5.2%
Interquartile 25% (IQ1)5.7%3.4%
Interquartile 75% (IQ3)8.7%5.5%
Interquartile Range (IQR)3.0%2.1%
Standard Deviation (Sample)3.0%2.8%
Standard Deviation (Population)2.9%2.8%

Similar Demographics by Disability Age 5 to 17

Demographics Similar to Immigrants from Cabo Verde by Disability Age 5 to 17

In terms of disability age 5 to 17, the demographic groups most similar to Immigrants from Cabo Verde are Chippewa (7.1%, a difference of 0.26%), Cajun (7.2%, a difference of 0.70%), Cape Verdean (7.0%, a difference of 2.4%), Cherokee (6.9%, a difference of 3.0%), and Choctaw (6.9%, a difference of 3.3%).
DemographicsRating | RankDisability Age 5 to 17
Blacks/African Americans
0.0
/100
|
#333
Tragic
6.8%
Seminole
0.0
/100
|
#334
Tragic
6.8%
Ottawa
0.0
/100
|
#335
Tragic
6.8%
Chickasaw
0.0
/100
|
#336
Tragic
6.8%
Creek
0.0
/100
|
#337
Tragic
6.9%
Iroquois
0.0
/100
|
#338
Tragic
6.9%
Choctaw
0.0
/100
|
#339
Tragic
6.9%
Cherokee
0.0
/100
|
#340
Tragic
6.9%
Cape Verdeans
0.0
/100
|
#341
Tragic
7.0%
Chippewa
0.0
/100
|
#342
Tragic
7.1%
Immigrants | Cabo Verde
0.0
/100
|
#343
Tragic
7.1%
Cajuns
0.0
/100
|
#344
Tragic
7.2%
Tsimshian
0.0
/100
|
#345
Tragic
7.9%
Puerto Ricans
0.0
/100
|
#346
Tragic
8.3%
Houma
0.0
/100
|
#347
Tragic
9.1%

Demographics Similar to Immigrants from Chile by Disability Age 5 to 17

In terms of disability age 5 to 17, the demographic groups most similar to Immigrants from Chile are Crow (5.4%, a difference of 0.010%), New Zealander (5.4%, a difference of 0.010%), Latvian (5.4%, a difference of 0.010%), Immigrants from Venezuela (5.4%, a difference of 0.13%), and Immigrants from Ethiopia (5.4%, a difference of 0.15%).
DemographicsRating | RankDisability Age 5 to 17
South Americans
97.1
/100
|
#118
Exceptional
5.4%
Immigrants | South America
97.1
/100
|
#119
Exceptional
5.4%
Immigrants | Immigrants
97.0
/100
|
#120
Exceptional
5.4%
Maltese
96.0
/100
|
#121
Exceptional
5.4%
Chileans
95.8
/100
|
#122
Exceptional
5.4%
Immigrants | Ethiopia
95.5
/100
|
#123
Exceptional
5.4%
Crow
95.0
/100
|
#124
Exceptional
5.4%
Immigrants | Chile
95.0
/100
|
#125
Exceptional
5.4%
New Zealanders
95.0
/100
|
#126
Exceptional
5.4%
Latvians
95.0
/100
|
#127
Exceptional
5.4%
Immigrants | Venezuela
94.5
/100
|
#128
Exceptional
5.4%
Romanians
94.1
/100
|
#129
Exceptional
5.4%
Immigrants | Bulgaria
94.0
/100
|
#130
Exceptional
5.4%
Arabs
92.9
/100
|
#131
Exceptional
5.4%
Immigrants | Colombia
92.9
/100
|
#132
Exceptional
5.4%