Cities with the Highest Percentage of Population Employed in Transportation & Warehousing in Delaware
RELATED REPORTS & OPTIONS
Transportation & Warehousing
Delaware
Compare Cities
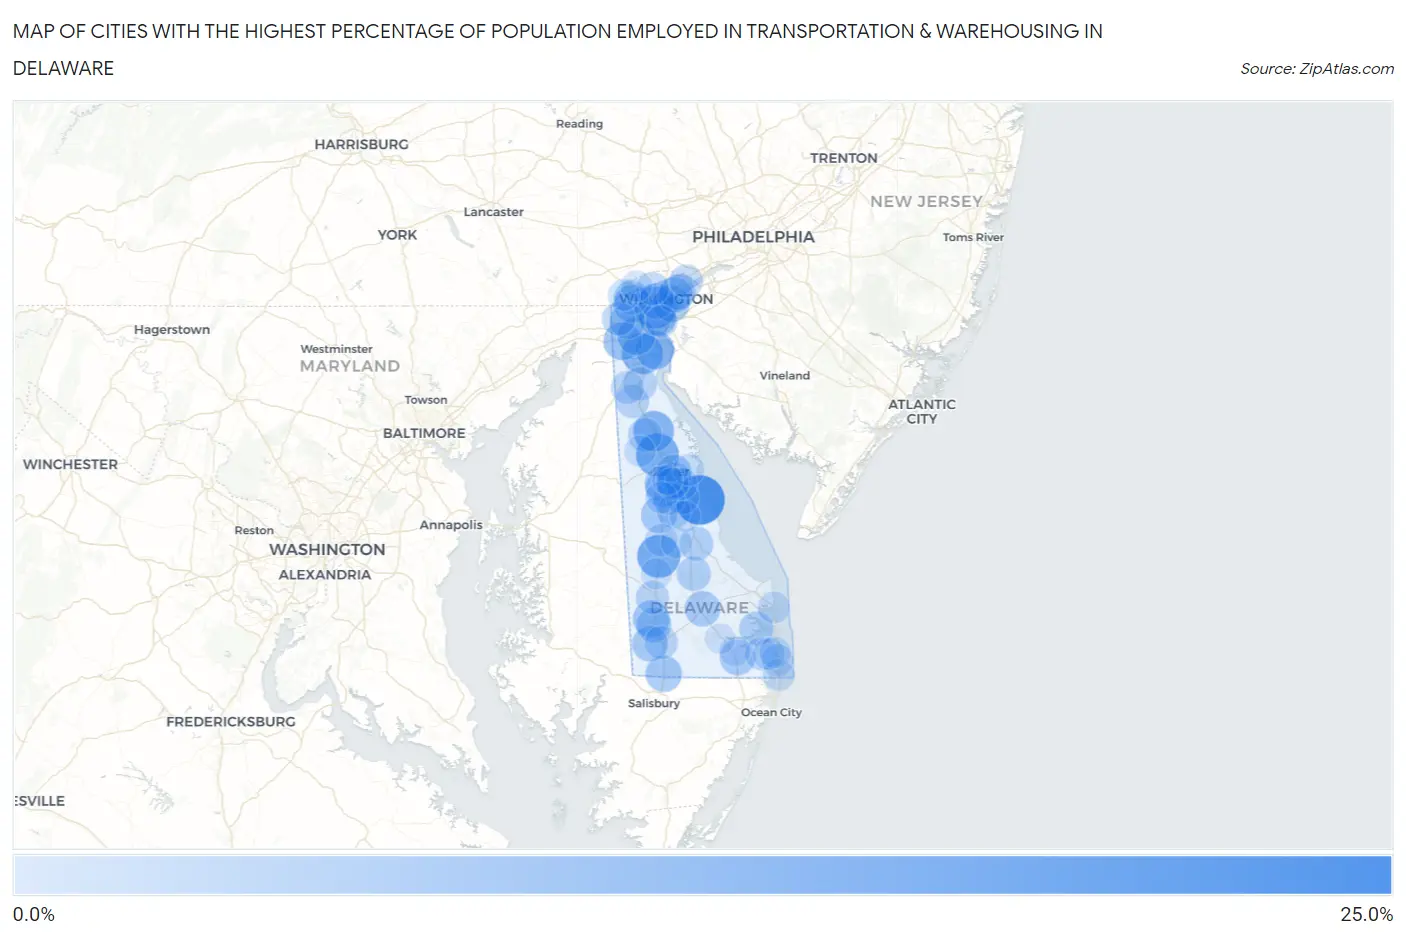
Map of Cities with the Highest Percentage of Population Employed in Transportation & Warehousing in Delaware
0.0%
25.0%
Cities with the Highest Percentage of Population Employed in Transportation & Warehousing in Delaware
| City | % Employed | vs State | vs National | |
| 1. | Bowers | 20.6% | 5.2%(+15.4)#1 | 4.9%(+15.6)#786 |
| 2. | Farmington | 13.6% | 5.2%(+8.48)#2 | 4.9%(+8.69)#1,892 |
| 3. | Cheswold | 13.6% | 5.2%(+8.40)#3 | 4.9%(+8.61)#1,918 |
| 4. | Newport | 12.4% | 5.2%(+7.23)#4 | 4.9%(+7.44)#2,311 |
| 5. | St Georges | 11.4% | 5.2%(+6.24)#5 | 4.9%(+6.45)#2,745 |
| 6. | Smyrna | 11.1% | 5.2%(+5.91)#6 | 4.9%(+6.12)#2,925 |
| 7. | Delaware City | 8.9% | 5.2%(+3.74)#7 | 4.9%(+3.95)#4,402 |
| 8. | Glasgow | 8.0% | 5.2%(+2.89)#8 | 4.9%(+3.10)#5,305 |
| 9. | Bear | 7.9% | 5.2%(+2.76)#9 | 4.9%(+2.97)#5,457 |
| 10. | Pike Creek Valley | 7.7% | 5.2%(+2.51)#10 | 4.9%(+2.72)#5,791 |
| 11. | Wilmington Manor | 7.5% | 5.2%(+2.36)#11 | 4.9%(+2.57)#6,005 |
| 12. | Wilmington | 7.0% | 5.2%(+1.84)#12 | 4.9%(+2.05)#6,803 |
| 13. | Seaford | 6.9% | 5.2%(+1.79)#13 | 4.9%(+1.99)#6,907 |
| 14. | Delmar | 6.7% | 5.2%(+1.51)#14 | 4.9%(+1.72)#7,365 |
| 15. | Camden | 6.5% | 5.2%(+1.35)#15 | 4.9%(+1.56)#7,682 |
| 16. | Felton | 6.2% | 5.2%(+1.04)#16 | 4.9%(+1.25)#8,278 |
| 17. | Elsmere | 6.0% | 5.2%(+0.829)#17 | 4.9%(+1.04)#8,705 |
| 18. | Bethel | 5.9% | 5.2%(+0.728)#18 | 4.9%(+0.936)#8,916 |
| 19. | Wyoming | 5.8% | 5.2%(+0.694)#19 | 4.9%(+0.902)#8,995 |
| 20. | Frankford | 5.7% | 5.2%(+0.554)#20 | 4.9%(+0.762)#9,289 |
| 21. | Brookside | 5.7% | 5.2%(+0.537)#21 | 4.9%(+0.745)#9,325 |
| 22. | Georgetown | 5.6% | 5.2%(+0.483)#22 | 4.9%(+0.692)#9,452 |
| 23. | Bellefonte | 5.6% | 5.2%(+0.421)#23 | 4.9%(+0.629)#9,620 |
| 24. | Kent Acres | 5.5% | 5.2%(+0.314)#24 | 4.9%(+0.522)#9,876 |
| 25. | Dover | 5.4% | 5.2%(+0.290)#25 | 4.9%(+0.499)#9,941 |
| 26. | Edgemoor | 5.4% | 5.2%(+0.285)#26 | 4.9%(+0.493)#9,957 |
| 27. | Blades | 5.3% | 5.2%(+0.109)#27 | 4.9%(+0.317)#10,343 |
| 28. | Pike Creek | 4.5% | 5.2%(-0.641)#28 | 4.9%(-0.433)#12,412 |
| 29. | Long Neck | 4.3% | 5.2%(-0.849)#29 | 4.9%(-0.641)#13,046 |
| 30. | Ellendale | 4.3% | 5.2%(-0.899)#30 | 4.9%(-0.691)#13,209 |
| 31. | Milford | 4.1% | 5.2%(-1.01)#31 | 4.9%(-0.798)#13,536 |
| 32. | Riverview | 4.0% | 5.2%(-1.13)#32 | 4.9%(-0.922)#13,892 |
| 33. | Clayton | 4.0% | 5.2%(-1.19)#33 | 4.9%(-0.980)#14,068 |
| 34. | Lincoln | 3.7% | 5.2%(-1.46)#34 | 4.9%(-1.26)#14,956 |
| 35. | Newark | 3.6% | 5.2%(-1.53)#35 | 4.9%(-1.32)#15,178 |
| 36. | Odessa | 3.6% | 5.2%(-1.54)#36 | 4.9%(-1.33)#15,224 |
| 37. | Townsend | 3.5% | 5.2%(-1.70)#37 | 4.9%(-1.49)#15,770 |
| 38. | Magnolia | 3.4% | 5.2%(-1.71)#38 | 4.9%(-1.50)#15,802 |
| 39. | Claymont | 3.3% | 5.2%(-1.85)#39 | 4.9%(-1.64)#16,295 |
| 40. | Laurel | 3.3% | 5.2%(-1.89)#40 | 4.9%(-1.68)#16,436 |
| 41. | Bridgeville | 3.2% | 5.2%(-1.93)#41 | 4.9%(-1.72)#16,565 |
| 42. | Middletown | 3.0% | 5.2%(-2.12)#42 | 4.9%(-1.91)#17,183 |
| 43. | Greenville | 2.9% | 5.2%(-2.23)#43 | 4.9%(-2.03)#17,577 |
| 44. | Millville | 2.9% | 5.2%(-2.30)#44 | 4.9%(-2.09)#17,774 |
| 45. | Dover Base Housing | 2.5% | 5.2%(-2.61)#45 | 4.9%(-2.40)#18,792 |
| 46. | Woodside East | 2.5% | 5.2%(-2.66)#46 | 4.9%(-2.45)#18,981 |
| 47. | Harrington | 2.3% | 5.2%(-2.86)#47 | 4.9%(-2.66)#19,646 |
| 48. | New Castle | 2.2% | 5.2%(-2.92)#48 | 4.9%(-2.71)#19,800 |
| 49. | Highland Acres | 2.2% | 5.2%(-2.93)#49 | 4.9%(-2.72)#19,843 |
| 50. | South Bethany | 2.1% | 5.2%(-3.07)#50 | 4.9%(-2.86)#20,319 |
| 51. | Fenwick Island | 1.9% | 5.2%(-3.29)#51 | 4.9%(-3.08)#20,997 |
| 52. | Woodside | 1.8% | 5.2%(-3.37)#52 | 4.9%(-3.16)#21,233 |
| 53. | Dewey Beach | 1.7% | 5.2%(-3.42)#53 | 4.9%(-3.21)#21,373 |
| 54. | Ocean View | 1.7% | 5.2%(-3.50)#54 | 4.9%(-3.30)#21,590 |
| 55. | North Star | 1.6% | 5.2%(-3.58)#55 | 4.9%(-3.37)#21,811 |
| 56. | Bethany Beach | 1.5% | 5.2%(-3.62)#56 | 4.9%(-3.41)#21,905 |
| 57. | Little Creek | 1.5% | 5.2%(-3.68)#57 | 4.9%(-3.48)#22,098 |
| 58. | Hockessin | 1.2% | 5.2%(-3.91)#58 | 4.9%(-3.70)#22,682 |
| 59. | Kenton | 1.2% | 5.2%(-3.95)#59 | 4.9%(-3.74)#22,794 |
| 60. | Houston | 1.2% | 5.2%(-3.96)#60 | 4.9%(-3.76)#22,837 |
| 61. | Greenwood | 1.0% | 5.2%(-4.13)#61 | 4.9%(-3.92)#23,250 |
| 62. | Frederica | 0.83% | 5.2%(-4.33)#62 | 4.9%(-4.12)#23,610 |
| 63. | Dagsboro | 0.48% | 5.2%(-4.68)#63 | 4.9%(-4.47)#24,207 |
| 64. | Millsboro | 0.41% | 5.2%(-4.74)#64 | 4.9%(-4.54)#24,297 |
| 65. | Rodney Village | 0.18% | 5.2%(-4.97)#65 | 4.9%(-4.76)#24,430 |
1
Common Questions
What are the Top 10 Cities with the Highest Percentage of Population Employed in Transportation & Warehousing in Delaware?
Top 10 Cities with the Highest Percentage of Population Employed in Transportation & Warehousing in Delaware are:
#1
20.6%
#2
13.6%
#3
13.6%
#4
12.4%
#5
11.4%
#6
11.1%
#7
8.9%
#8
8.0%
#9
7.9%
#10
7.7%
What city has the Highest Percentage of Population Employed in Transportation & Warehousing in Delaware?
Bowers has the Highest Percentage of Population Employed in Transportation & Warehousing in Delaware with 20.6%.
What is the Percentage of Population Employed in Transportation & Warehousing in the State of Delaware?
Percentage of Population Employed in Transportation & Warehousing in Delaware is 5.2%.
What is the Percentage of Population Employed in Transportation & Warehousing in the United States?
Percentage of Population Employed in Transportation & Warehousing in the United States is 4.9%.