Zip Codes with the Highest Percentage of Population Employed in Agriculture, Fishing & Hunting in Rialto, CA
RELATED REPORTS & OPTIONS
Agriculture, Fishing & Hunting
Rialto
Compare Zip Codes
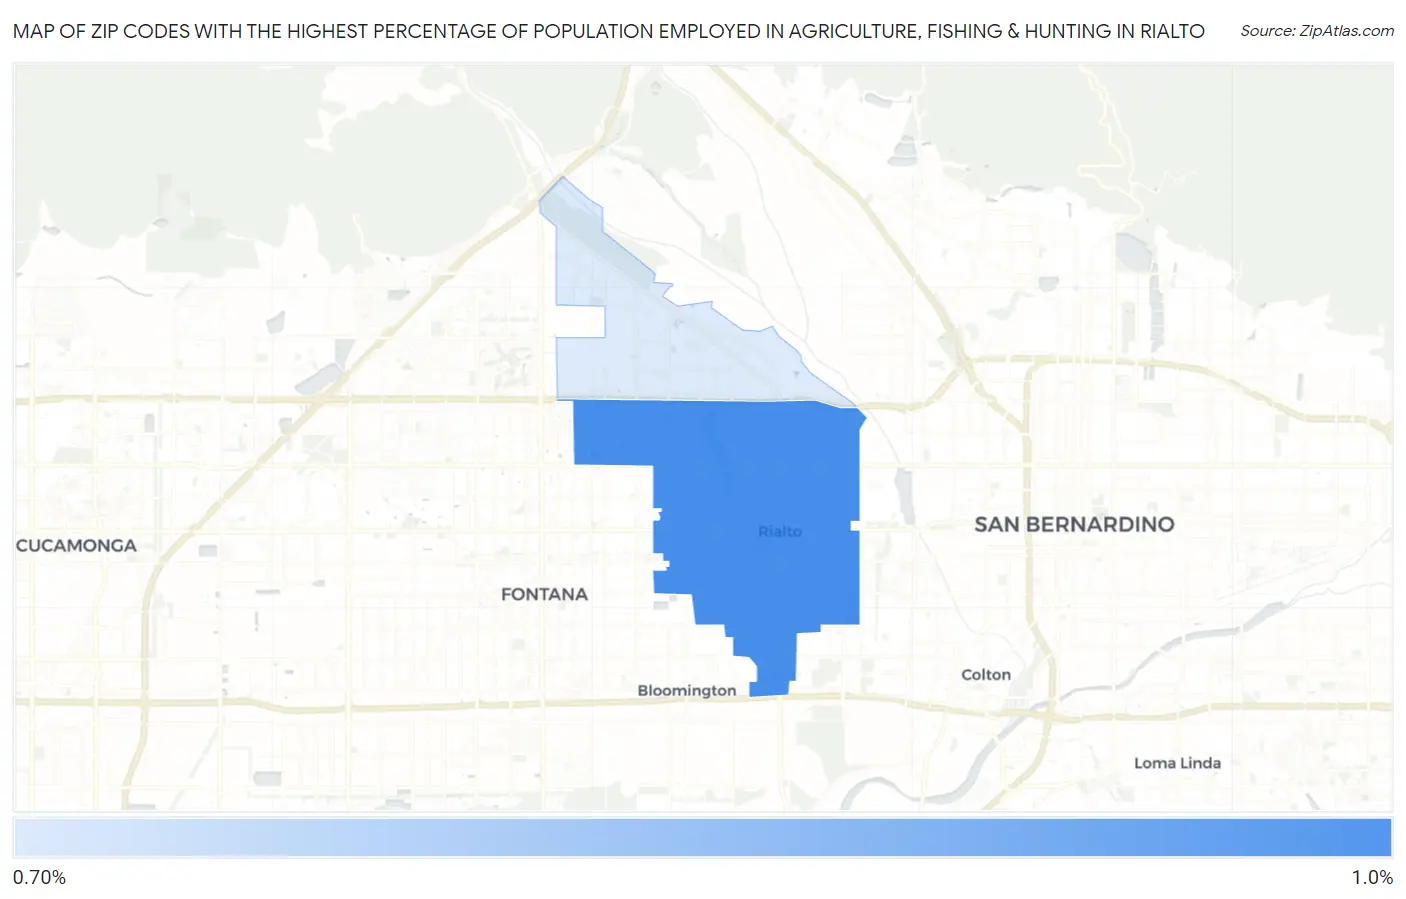
Map of Zip Codes with the Highest Percentage of Population Employed in Agriculture, Fishing & Hunting in Rialto
0.0%
1.0%
Zip Codes with the Highest Percentage of Population Employed in Agriculture, Fishing & Hunting in Rialto, CA
| Zip Code | % Employed | vs State | vs National | |
| 1. | 92376 | 0.82% | 2.0%(-1.16)#780 | 1.2%(-0.378)#17,131 |
| 2. | 92377 | 0.76% | 2.0%(-1.23)#811 | 1.2%(-0.439)#17,470 |
1
Common Questions
What are the Top Zip Codes with the Highest Percentage of Population Employed in Agriculture, Fishing & Hunting in Rialto, CA?
Top Zip Codes with the Highest Percentage of Population Employed in Agriculture, Fishing & Hunting in Rialto, CA are:
What zip code has the Highest Percentage of Population Employed in Agriculture, Fishing & Hunting in Rialto, CA?
92376 has the Highest Percentage of Population Employed in Agriculture, Fishing & Hunting in Rialto, CA with 0.82%.
What is the Percentage of Population Employed in Agriculture, Fishing & Hunting in Rialto, CA?
Percentage of Population Employed in Agriculture, Fishing & Hunting in Rialto is 0.78%.
What is the Percentage of Population Employed in Agriculture, Fishing & Hunting in California?
Percentage of Population Employed in Agriculture, Fishing & Hunting in California is 2.0%.
What is the Percentage of Population Employed in Agriculture, Fishing & Hunting in the United States?
Percentage of Population Employed in Agriculture, Fishing & Hunting in the United States is 1.2%.