Zip Codes with the Highest Percentage of Population Employed in Agriculture, Fishing & Hunting in Irvine, CA
RELATED REPORTS & OPTIONS
Agriculture, Fishing & Hunting
Irvine
Compare Zip Codes
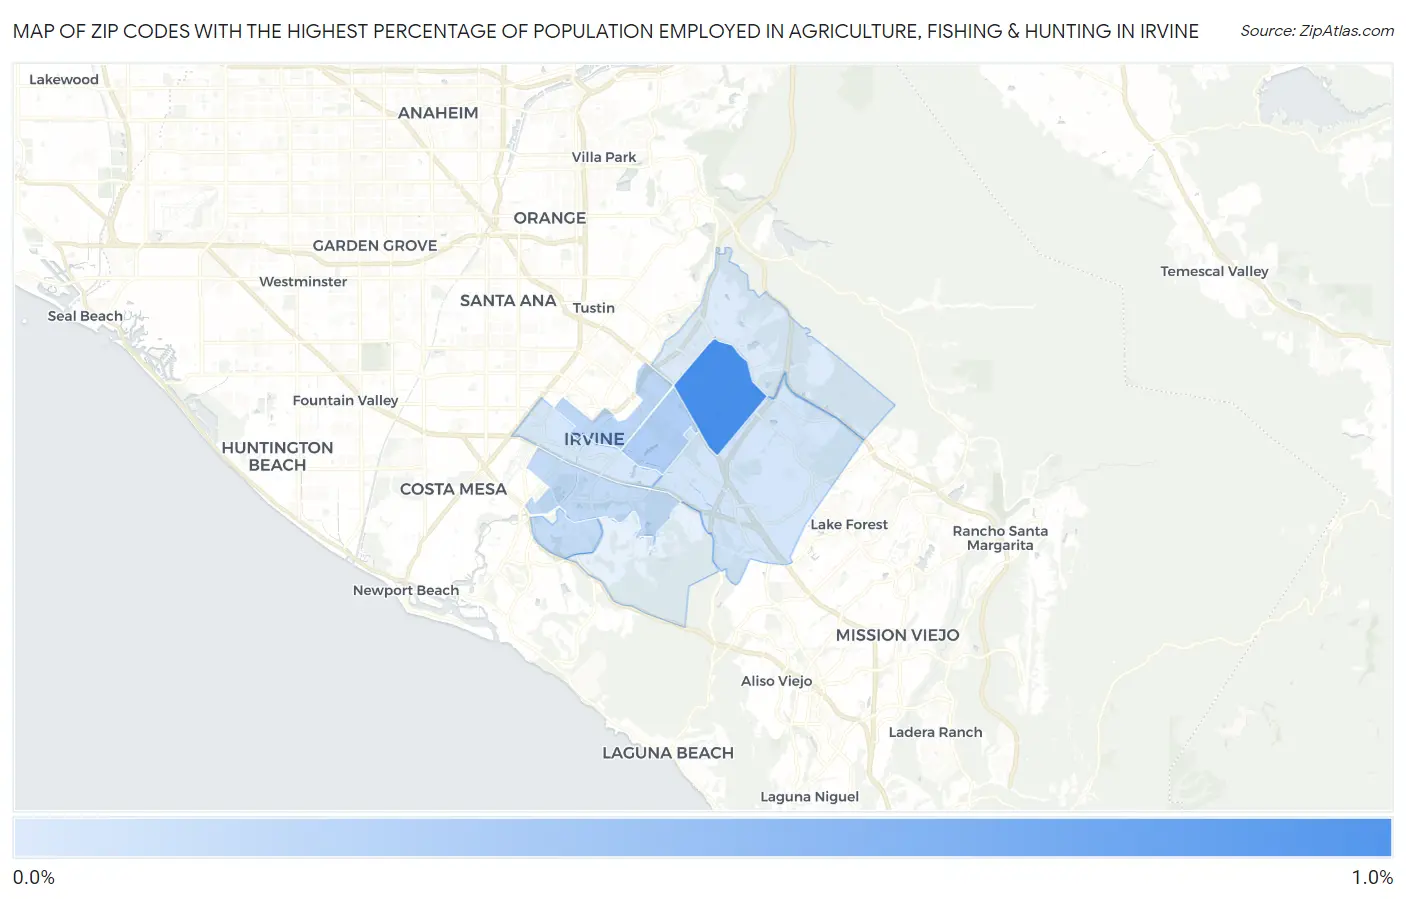
Map of Zip Codes with the Highest Percentage of Population Employed in Agriculture, Fishing & Hunting in Irvine
0.0%
1.0%
Zip Codes with the Highest Percentage of Population Employed in Agriculture, Fishing & Hunting in Irvine, CA
| Zip Code | % Employed | vs State | vs National | |
| 1. | 92620 | 0.99% | 2.0%(-0.997)#732 | 1.2%(-0.211)#16,286 |
| 2. | 92604 | 0.33% | 2.0%(-1.66)#1,101 | 1.2%(-0.871)#20,860 |
| 3. | 92606 | 0.26% | 2.0%(-1.73)#1,167 | 1.2%(-0.944)#21,707 |
| 4. | 92612 | 0.21% | 2.0%(-1.78)#1,212 | 1.2%(-0.989)#22,239 |
| 5. | 92617 | 0.20% | 2.0%(-1.78)#1,220 | 1.2%(-0.995)#22,311 |
| 6. | 92618 | 0.11% | 2.0%(-1.87)#1,311 | 1.2%(-1.08)#23,484 |
| 7. | 92614 | 0.096% | 2.0%(-1.89)#1,342 | 1.2%(-1.10)#23,721 |
| 8. | 92602 | 0.057% | 2.0%(-1.93)#1,381 | 1.2%(-1.14)#24,267 |
1
Common Questions
What are the Top 5 Zip Codes with the Highest Percentage of Population Employed in Agriculture, Fishing & Hunting in Irvine, CA?
Top 5 Zip Codes with the Highest Percentage of Population Employed in Agriculture, Fishing & Hunting in Irvine, CA are:
What zip code has the Highest Percentage of Population Employed in Agriculture, Fishing & Hunting in Irvine, CA?
92620 has the Highest Percentage of Population Employed in Agriculture, Fishing & Hunting in Irvine, CA with 0.99%.
What is the Percentage of Population Employed in Agriculture, Fishing & Hunting in Irvine, CA?
Percentage of Population Employed in Agriculture, Fishing & Hunting in Irvine is 0.31%.
What is the Percentage of Population Employed in Agriculture, Fishing & Hunting in California?
Percentage of Population Employed in Agriculture, Fishing & Hunting in California is 2.0%.
What is the Percentage of Population Employed in Agriculture, Fishing & Hunting in the United States?
Percentage of Population Employed in Agriculture, Fishing & Hunting in the United States is 1.2%.