Zip Codes with the Highest Percentage of Population Employed in Agriculture, Fishing & Hunting in Antioch, CA
RELATED REPORTS & OPTIONS
Agriculture, Fishing & Hunting
Antioch
Compare Zip Codes
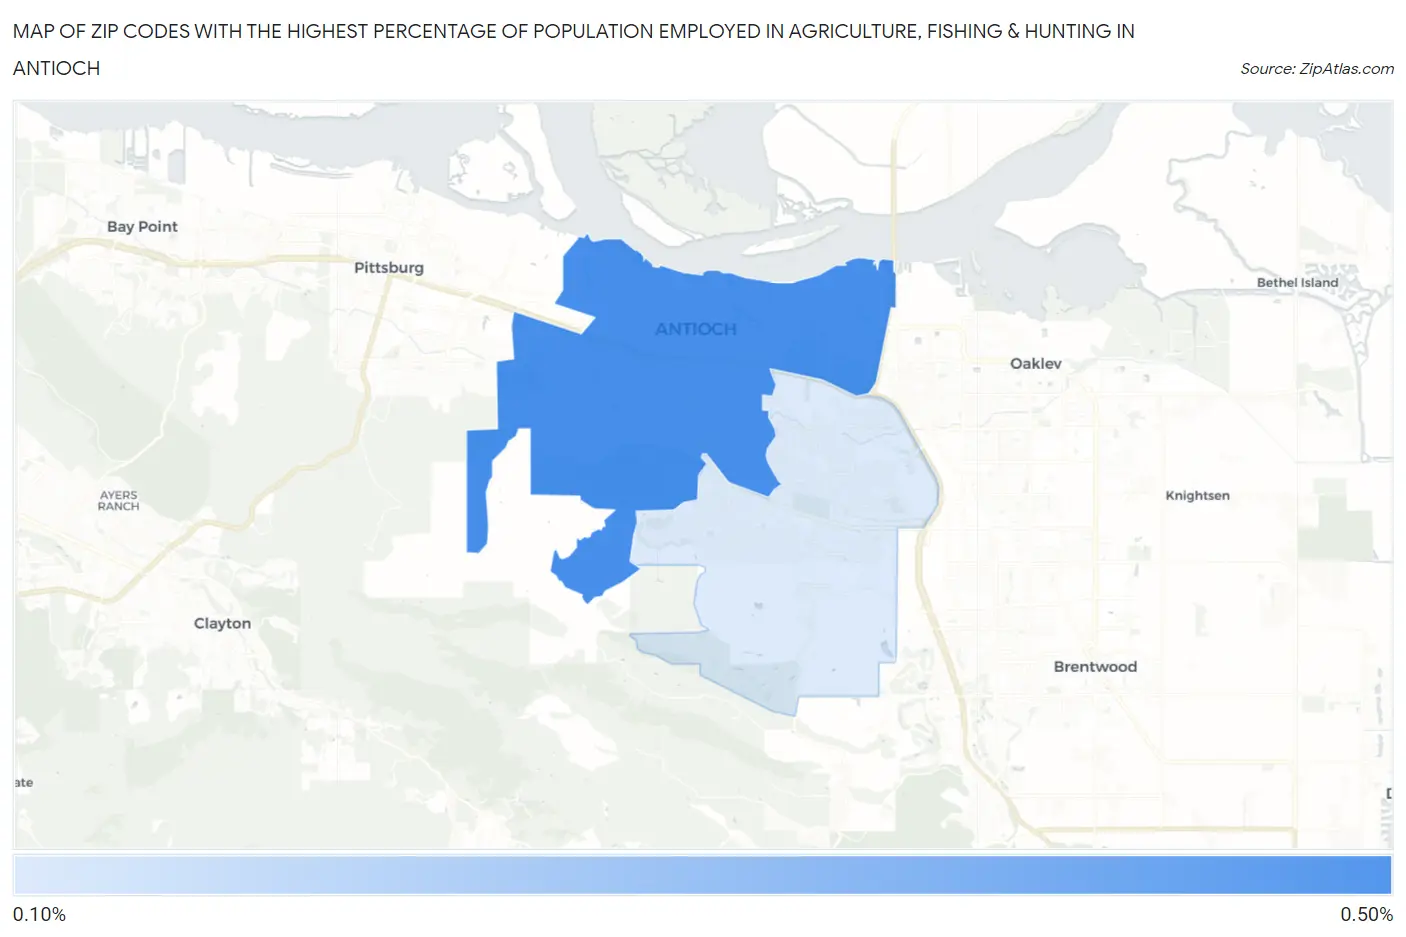
Map of Zip Codes with the Highest Percentage of Population Employed in Agriculture, Fishing & Hunting in Antioch
0.0%
0.50%
Zip Codes with the Highest Percentage of Population Employed in Agriculture, Fishing & Hunting in Antioch, CA
| Zip Code | % Employed | vs State | vs National | |
| 1. | 94509 | 0.45% | 2.0%(-1.53)#1,003 | 1.2%(-0.748)#19,693 |
| 2. | 94531 | 0.19% | 2.0%(-1.80)#1,234 | 1.2%(-1.01)#22,477 |
1
Common Questions
What are the Top Zip Codes with the Highest Percentage of Population Employed in Agriculture, Fishing & Hunting in Antioch, CA?
Top Zip Codes with the Highest Percentage of Population Employed in Agriculture, Fishing & Hunting in Antioch, CA are:
What zip code has the Highest Percentage of Population Employed in Agriculture, Fishing & Hunting in Antioch, CA?
94509 has the Highest Percentage of Population Employed in Agriculture, Fishing & Hunting in Antioch, CA with 0.45%.
What is the Percentage of Population Employed in Agriculture, Fishing & Hunting in Antioch, CA?
Percentage of Population Employed in Agriculture, Fishing & Hunting in Antioch is 0.35%.
What is the Percentage of Population Employed in Agriculture, Fishing & Hunting in California?
Percentage of Population Employed in Agriculture, Fishing & Hunting in California is 2.0%.
What is the Percentage of Population Employed in Agriculture, Fishing & Hunting in the United States?
Percentage of Population Employed in Agriculture, Fishing & Hunting in the United States is 1.2%.