Samak, UT
Samak Map
Samak Overview
122
TOTAL POPULATION
57
MALE POPULATION
65
FEMALE POPULATION
87.69
MALES / 100 FEMALES
114.04
FEMALES / 100 MALES
25.5
MEDIAN AGE
4.0
AVG FAMILY SIZE
3.7
AVG HOUSEHOLD SIZE
$36,211
PER CAPITA INCOME
0.37
INEQUALITY / GINI INDEX
52
LABOR FORCE [ PEOPLE ]
50.0%
PERCENT IN LABOR FORCE
17.3%
UNEMPLOYMENT RATE
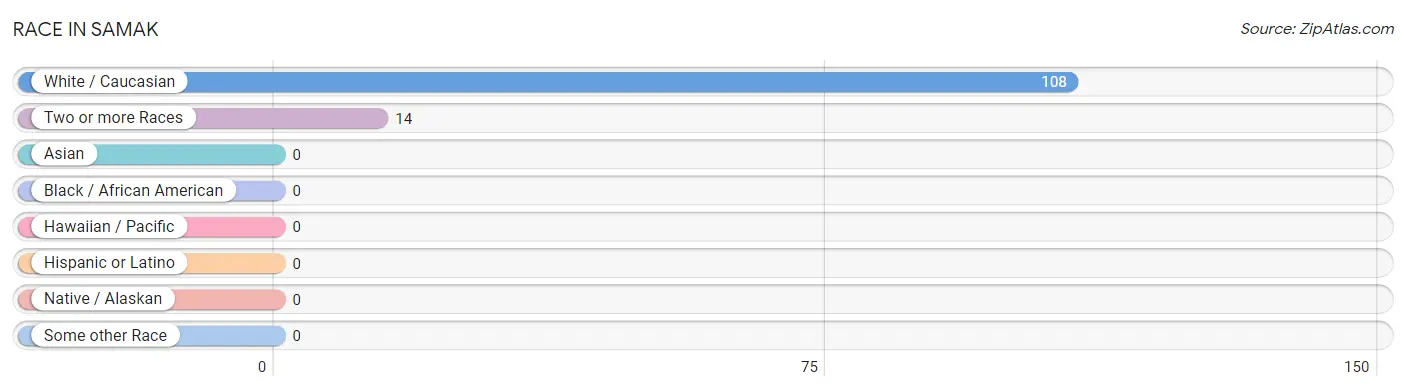
Race in Samak
The most populous races in Samak are White / Caucasian (108 | 88.5%), and Two or more Races (14 | 11.5%).
| Race | # Population | % Population |
| Asian | 0 | 0.0% |
| Black / African American | 0 | 0.0% |
| Hawaiian / Pacific | 0 | 0.0% |
| Hispanic or Latino | 0 | 0.0% |
| Native / Alaskan | 0 | 0.0% |
| White / Caucasian | 108 | 88.5% |
| Two or more Races | 14 | 11.5% |
| Some other Race | 0 | 0.0% |
| Total | 122 | 100.0% |
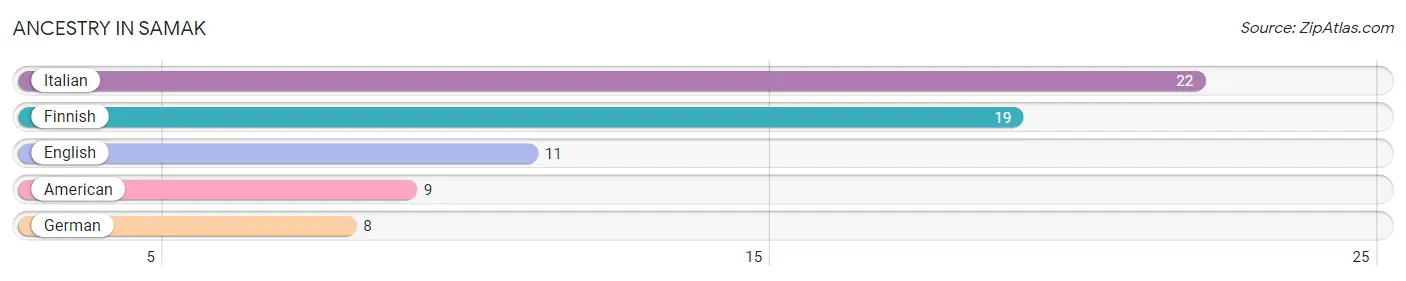
Ancestry in Samak
The most populous ancestries reported in Samak are Italian (22 | 18.0%), Finnish (19 | 15.6%), English (11 | 9.0%), American (9 | 7.4%), and German (8 | 6.6%), together accounting for 56.6% of all Samak residents.
| Ancestry | # Population | % Population |
| American | 9 | 7.4% |
| English | 11 | 9.0% |
| Finnish | 19 | 15.6% |
| German | 8 | 6.6% |
| Italian | 22 | 18.0% | View All 5 Rows |
Immigrants in Samak

| Immigration Origin | # Population | % Population | View All 0 Rows |
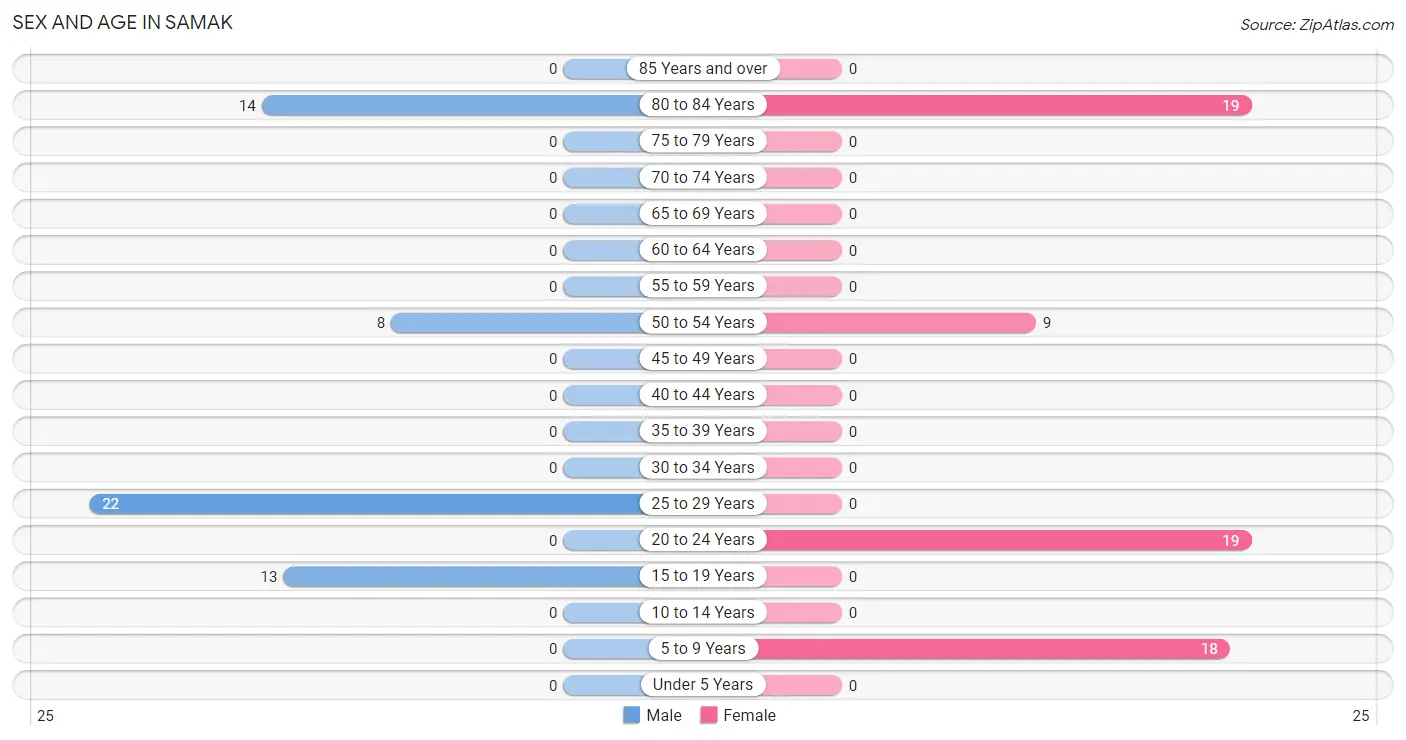
Sex and Age in Samak
Sex and Age in Samak
The most populous age groups in Samak are 25 to 29 Years (22 | 38.6%) for men and 20 to 24 Years (19 | 29.2%) for women.
| Age Bracket | Male | Female |
| Under 5 Years | 0 (0.0%) | 0 (0.0%) |
| 5 to 9 Years | 0 (0.0%) | 18 (27.7%) |
| 10 to 14 Years | 0 (0.0%) | 0 (0.0%) |
| 15 to 19 Years | 13 (22.8%) | 0 (0.0%) |
| 20 to 24 Years | 0 (0.0%) | 19 (29.2%) |
| 25 to 29 Years | 22 (38.6%) | 0 (0.0%) |
| 30 to 34 Years | 0 (0.0%) | 0 (0.0%) |
| 35 to 39 Years | 0 (0.0%) | 0 (0.0%) |
| 40 to 44 Years | 0 (0.0%) | 0 (0.0%) |
| 45 to 49 Years | 0 (0.0%) | 0 (0.0%) |
| 50 to 54 Years | 8 (14.0%) | 9 (13.9%) |
| 55 to 59 Years | 0 (0.0%) | 0 (0.0%) |
| 60 to 64 Years | 0 (0.0%) | 0 (0.0%) |
| 65 to 69 Years | 0 (0.0%) | 0 (0.0%) |
| 70 to 74 Years | 0 (0.0%) | 0 (0.0%) |
| 75 to 79 Years | 0 (0.0%) | 0 (0.0%) |
| 80 to 84 Years | 14 (24.6%) | 19 (29.2%) |
| 85 Years and over | 0 (0.0%) | 0 (0.0%) |
| Total | 57 (100.0%) | 65 (100.0%) |
Families and Households in Samak
Median Family Size in Samak
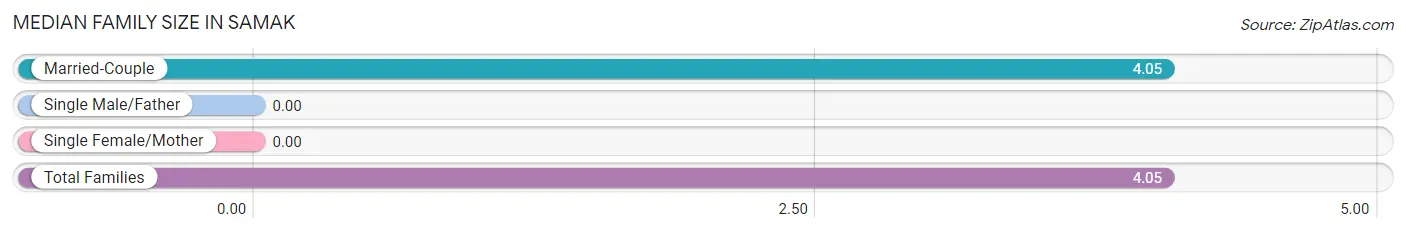
| Family Type | # Families | Family Size |
| Married-Couple | 22 (100.0%) | 4.05 |
| Single Male/Father | 0 (0.0%) | - |
| Single Female/Mother | 0 (0.0%) | - |
| Total Families | 22 (100.0%) | 4.05 |
Median Household Size in Samak
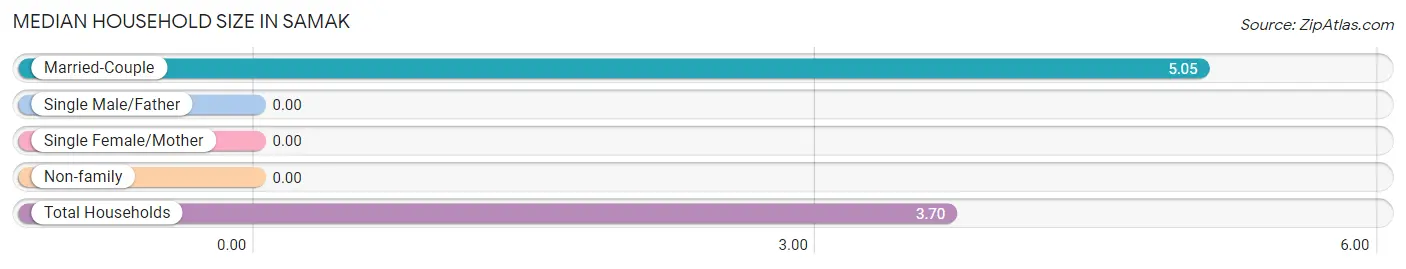
| Household Type | # Households | Household Size |
| Married-Couple | 22 (66.7%) | 5.05 |
| Single Male/Father | 0 (0.0%) | - |
| Single Female/Mother | 0 (0.0%) | - |
| Non-family | 11 (33.3%) | - |
| Total Households | 33 (100.0%) | 3.70 |
Household Size by Marriage Status in Samak
Out of a total of 33 households in Samak, 22 (66.7%) are family households, while 11 (33.3%) are nonfamily households. The most numerous type of family households are 6-person households, comprising 14, and the most common type of nonfamily households are 1-person households, comprising 11.
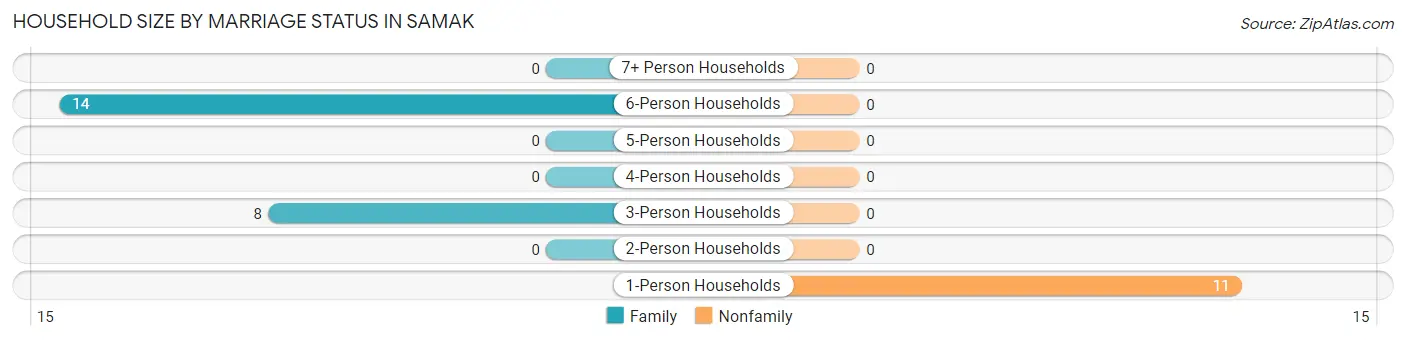
| Household Size | Family Households | Nonfamily Households |
| 1-Person Households | - | 11 (33.3%) |
| 2-Person Households | 0 (0.0%) | 0 (0.0%) |
| 3-Person Households | 8 (24.2%) | 0 (0.0%) |
| 4-Person Households | 0 (0.0%) | 0 (0.0%) |
| 5-Person Households | 0 (0.0%) | 0 (0.0%) |
| 6-Person Households | 14 (42.4%) | 0 (0.0%) |
| 7+ Person Households | 0 (0.0%) | 0 (0.0%) |
| Total | 22 (66.7%) | 11 (33.3%) |
Female Fertility in Samak
Fertility by Age in Samak
| Age Bracket | Women with Births | Births / 1,000 Women |
| 15 to 19 years | 0 (0.0%) | 0.0 |
| 20 to 34 years | 0 (0.0%) | 0.0 |
| 35 to 50 years | 0 (0.0%) | 0.0 |
| Total | 0 (0.0%) | 0.0 |
Fertility by Age by Marriage Status in Samak
| Age Bracket | Married | Unmarried |
| 15 to 19 years | 0 (0.0%) | 0 (0.0%) |
| 20 to 34 years | 0 (0.0%) | 0 (0.0%) |
| 35 to 50 years | 0 (0.0%) | 0 (0.0%) |
| Total | 0 (0.0%) | 0 (0.0%) |
Fertility by Education in Samak
| Educational Attainment | Women with Births | Births / 1,000 Women |
| Less than High School | 0 (0.0%) | 0.0 |
| High School Diploma | 0 (0.0%) | 0.0 |
| College or Associate's Degree | 0 (0.0%) | 0.0 |
| Bachelor's Degree | 0 (0.0%) | 0.0 |
| Graduate Degree | 0 (0.0%) | 0.0 |
| Total | 0 (0.0%) | 0.0 |
Fertility by Education by Marriage Status in Samak
| Educational Attainment | Married | Unmarried |
| Less than High School | 0 (0.0%) | 0 (0.0%) |
| High School Diploma | 0 (0.0%) | 0 (0.0%) |
| College or Associate's Degree | 0 (0.0%) | 0 (0.0%) |
| Bachelor's Degree | 0 (0.0%) | 0 (0.0%) |
| Graduate Degree | 0 (0.0%) | 0 (0.0%) |
| Total | 0 (0.0%) | 0 (0.0%) |
Income in Samak
Income Overview in Samak
| Characteristic | Number | Measure |
| Per Capita Income | 122 | $36,211 |
| Median Family Income | 22 | $0 |
| Mean Family Income | 22 | $0 |
| Median Household Income | 33 | $0 |
| Mean Household Income | 33 | $104,815 |
| Income Deficit | 22 | $0 |
| Wage / Income Gap (%) | 122 | 0.00% |
| Wage / Income Gap ($) | 122 | 100.00¢ per $1 |
| Gini / Inequality Index | 122 | 0.37 |
Earnings by Sex in Samak
| Sex | Number | Average Earnings |
| Male | 43 (100.0%) | $0 |
| Female | 0 (0.0%) | $0 |
| Total | 43 (100.0%) | $0 |
Earnings by Sex by Income Bracket in Samak
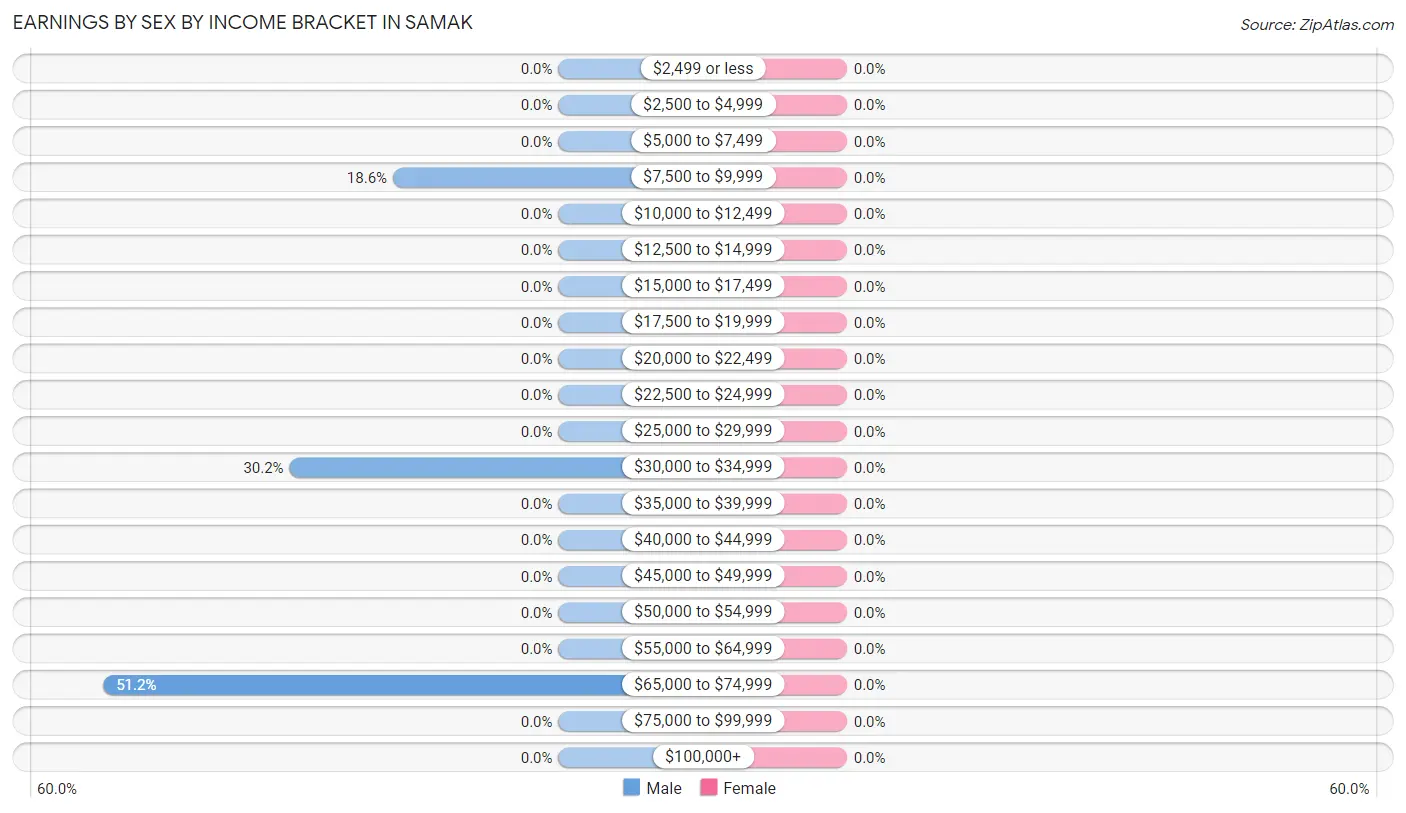
| Income | Male | Female |
| $2,499 or less | 0 (0.0%) | 0 (0.0%) |
| $2,500 to $4,999 | 0 (0.0%) | 0 (0.0%) |
| $5,000 to $7,499 | 0 (0.0%) | 0 (0.0%) |
| $7,500 to $9,999 | 8 (18.6%) | 0 (0.0%) |
| $10,000 to $12,499 | 0 (0.0%) | 0 (0.0%) |
| $12,500 to $14,999 | 0 (0.0%) | 0 (0.0%) |
| $15,000 to $17,499 | 0 (0.0%) | 0 (0.0%) |
| $17,500 to $19,999 | 0 (0.0%) | 0 (0.0%) |
| $20,000 to $22,499 | 0 (0.0%) | 0 (0.0%) |
| $22,500 to $24,999 | 0 (0.0%) | 0 (0.0%) |
| $25,000 to $29,999 | 0 (0.0%) | 0 (0.0%) |
| $30,000 to $34,999 | 13 (30.2%) | 0 (0.0%) |
| $35,000 to $39,999 | 0 (0.0%) | 0 (0.0%) |
| $40,000 to $44,999 | 0 (0.0%) | 0 (0.0%) |
| $45,000 to $49,999 | 0 (0.0%) | 0 (0.0%) |
| $50,000 to $54,999 | 0 (0.0%) | 0 (0.0%) |
| $55,000 to $64,999 | 0 (0.0%) | 0 (0.0%) |
| $65,000 to $74,999 | 22 (51.2%) | 0 (0.0%) |
| $75,000 to $99,999 | 0 (0.0%) | 0 (0.0%) |
| $100,000+ | 0 (0.0%) | 0 (0.0%) |
| Total | 43 (100.0%) | 0 (0.0%) |
Earnings by Sex by Educational Attainment in Samak
| Educational Attainment | Male Income | Female Income |
| Less than High School | - | - |
| High School Diploma | - | - |
| College or Associate's Degree | - | - |
| Bachelor's Degree | - | - |
| Graduate Degree | - | - |
| Total | - | - |
Family Income in Samak
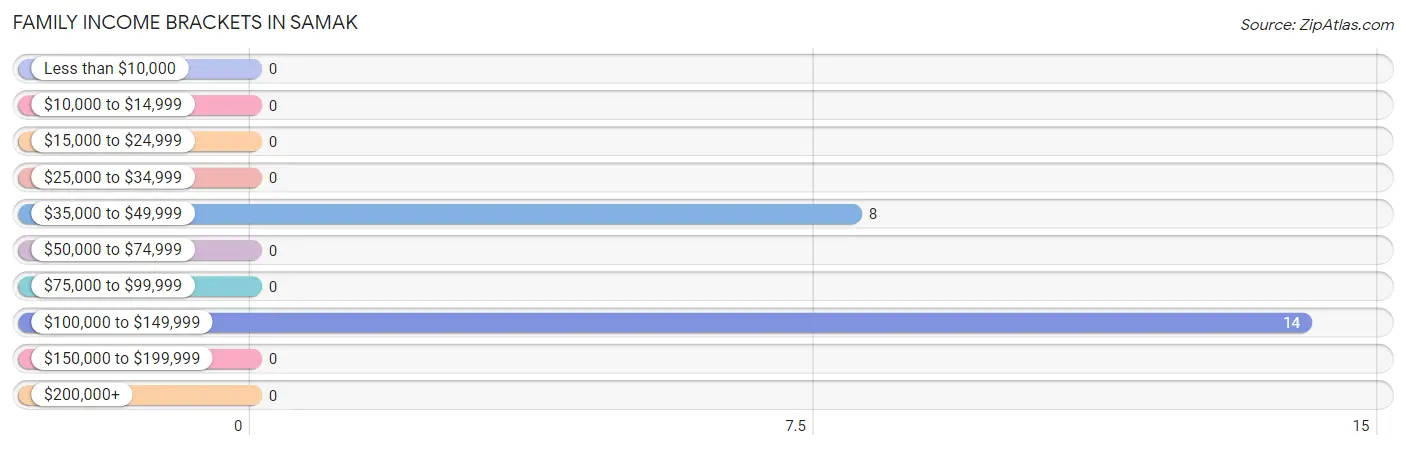
Family Income Brackets in Samak
According to the Samak family income data, there are 14 families falling into the $100,000 to $149,999 income range, which is the most common income bracket and makes up 63.6% of all families.
| Income Bracket | # Families | % Families |
| Less than $10,000 | 0 | 0.0% |
| $10,000 to $14,999 | 0 | 0.0% |
| $15,000 to $24,999 | 0 | 0.0% |
| $25,000 to $34,999 | 0 | 0.0% |
| $35,000 to $49,999 | 8 | 36.4% |
| $50,000 to $74,999 | 0 | 0.0% |
| $75,000 to $99,999 | 0 | 0.0% |
| $100,000 to $149,999 | 14 | 63.6% |
| $150,000 to $199,999 | 0 | 0.0% |
| $200,000+ | 0 | 0.0% |
Family Income by Famaliy Size in Samak
| Income Bracket | # Families | Median Income |
| 2-Person Families | 0 (0.0%) | $0 |
| 3-Person Families | 8 (36.4%) | $0 |
| 4-Person Families | 0 (0.0%) | $0 |
| 5-Person Families | 14 (63.6%) | $0 |
| 6-Person Families | 0 (0.0%) | $0 |
| 7+ Person Families | 0 (0.0%) | $0 |
| Total | 22 (100.0%) | $0 |
Family Income by Number of Earners in Samak
| Number of Earners | # Families | Median Income |
| No Earners | 14 (63.6%) | $0 |
| 1 Earner | 0 (0.0%) | $0 |
| 2 Earners | 8 (36.4%) | $0 |
| 3+ Earners | 0 (0.0%) | $0 |
| Total | 22 (100.0%) | $0 |
Household Income in Samak
Household Income Brackets in Samak
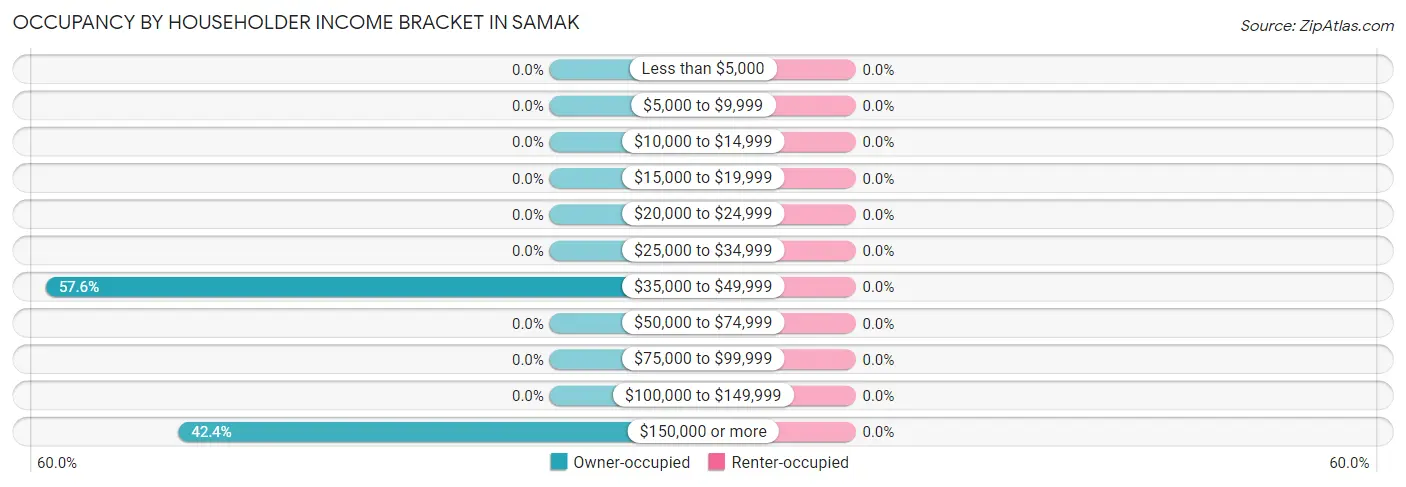
With 19 households falling in the category, the $35,000 to $49,999 income range is the most frequent in Samak, accounting for 57.6% of all households.
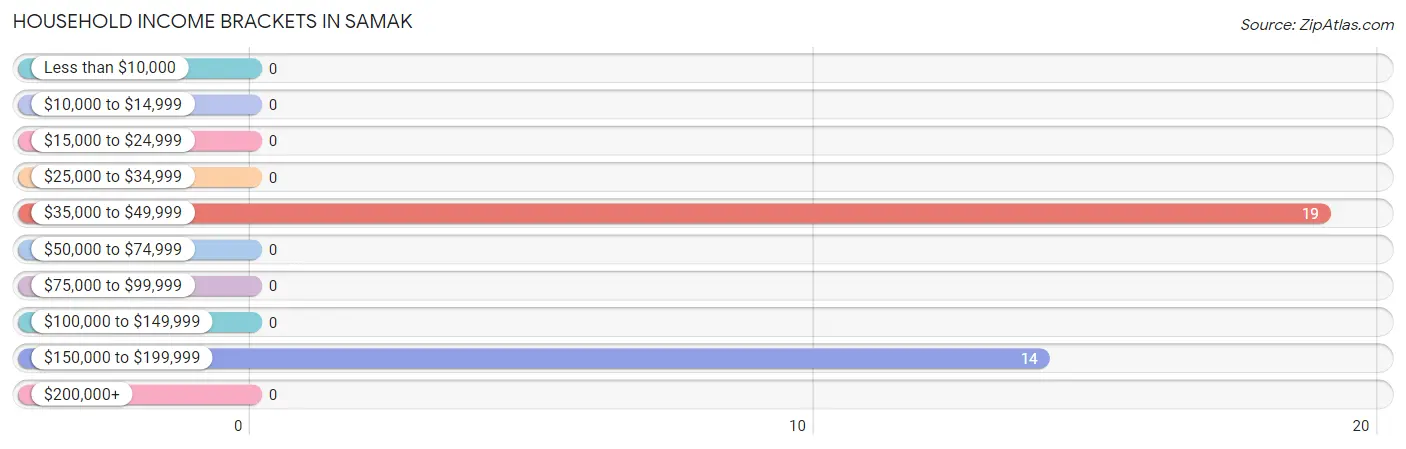
| Income Bracket | # Households | % Households |
| Less than $10,000 | 0 | 0.0% |
| $10,000 to $14,999 | 0 | 0.0% |
| $15,000 to $24,999 | 0 | 0.0% |
| $25,000 to $34,999 | 0 | 0.0% |
| $35,000 to $49,999 | 19 | 57.6% |
| $50,000 to $74,999 | 0 | 0.0% |
| $75,000 to $99,999 | 0 | 0.0% |
| $100,000 to $149,999 | 0 | 0.0% |
| $150,000 to $199,999 | 14 | 42.4% |
| $200,000+ | 0 | 0.0% |
Household Income by Householder Age in Samak
| Income Bracket | # Households | Median Income |
| 15 to 24 Years | 0 (0.0%) | $0 |
| 25 to 44 Years | 0 (0.0%) | $0 |
| 45 to 64 Years | 8 (24.2%) | $0 |
| 65+ Years | 25 (75.8%) | $0 |
| Total | 33 (100.0%) | $0 |
Poverty in Samak
Income Below Poverty by Sex and Age in Samak
| Age Bracket | Male | Female |
| Under 5 Years | 0 (0.0%) | 0 (0.0%) |
| 5 Years | 0 (0.0%) | 0 (0.0%) |
| 6 to 11 Years | 0 (0.0%) | 0 (0.0%) |
| 12 to 14 Years | 0 (0.0%) | 0 (0.0%) |
| 15 Years | 0 (0.0%) | 0 (0.0%) |
| 16 and 17 Years | 0 (0.0%) | 0 (0.0%) |
| 18 to 24 Years | 0 (0.0%) | 0 (0.0%) |
| 25 to 34 Years | 0 (0.0%) | 0 (0.0%) |
| 35 to 44 Years | 0 (0.0%) | 0 (0.0%) |
| 45 to 54 Years | 0 (0.0%) | 0 (0.0%) |
| 55 to 64 Years | 0 (0.0%) | 0 (0.0%) |
| 65 to 74 Years | 0 (0.0%) | 0 (0.0%) |
| 75 Years and over | 0 (0.0%) | 0 (0.0%) |
| Total | 0 (0.0%) | 0 (0.0%) |
Income Above Poverty by Sex and Age in Samak
According to the poverty statistics in Samak, males aged 18 to 24 years and females aged 5 years are the age groups that are most secure financially, with 100.0% of males and 100.0% of females in these age groups living above the poverty line.
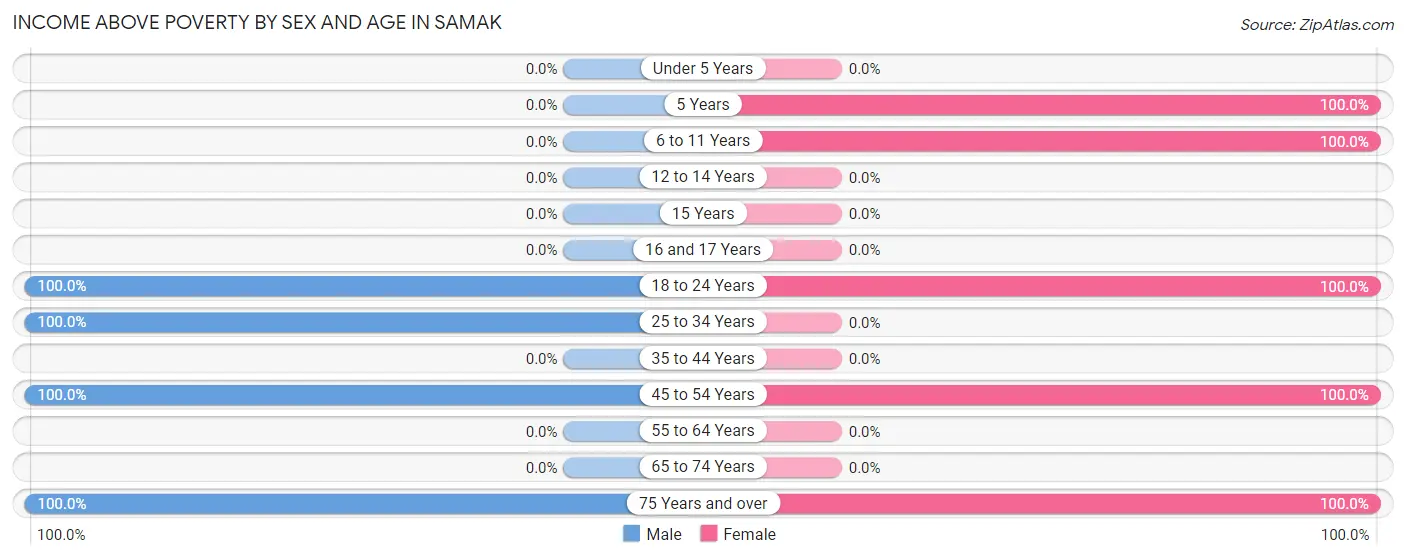
| Age Bracket | Male | Female |
| Under 5 Years | 0 (0.0%) | 0 (0.0%) |
| 5 Years | 0 (0.0%) | 9 (100.0%) |
| 6 to 11 Years | 0 (0.0%) | 9 (100.0%) |
| 12 to 14 Years | 0 (0.0%) | 0 (0.0%) |
| 15 Years | 0 (0.0%) | 0 (0.0%) |
| 16 and 17 Years | 0 (0.0%) | 0 (0.0%) |
| 18 to 24 Years | 13 (100.0%) | 19 (100.0%) |
| 25 to 34 Years | 22 (100.0%) | 0 (0.0%) |
| 35 to 44 Years | 0 (0.0%) | 0 (0.0%) |
| 45 to 54 Years | 8 (100.0%) | 9 (100.0%) |
| 55 to 64 Years | 0 (0.0%) | 0 (0.0%) |
| 65 to 74 Years | 0 (0.0%) | 0 (0.0%) |
| 75 Years and over | 14 (100.0%) | 19 (100.0%) |
| Total | 57 (100.0%) | 65 (100.0%) |
Income Below Poverty Among Married-Couple Families in Samak
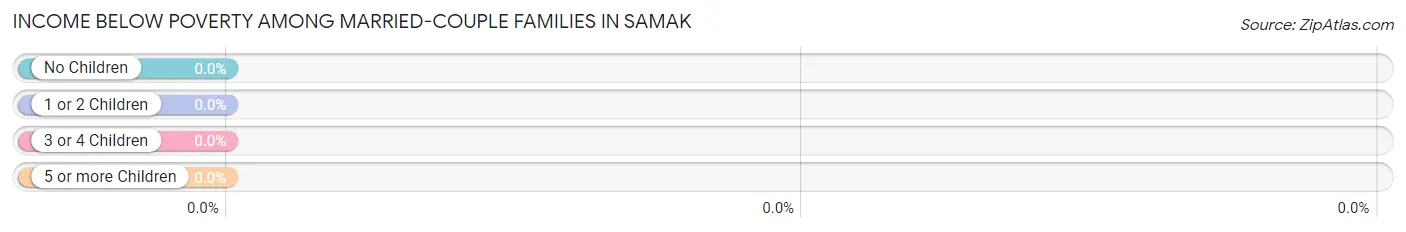
| Children | Above Poverty | Below Poverty |
| No Children | 8 (100.0%) | 0 (0.0%) |
| 1 or 2 Children | 14 (100.0%) | 0 (0.0%) |
| 3 or 4 Children | 0 (0.0%) | 0 (0.0%) |
| 5 or more Children | 0 (0.0%) | 0 (0.0%) |
| Total | 22 (100.0%) | 0 (0.0%) |
Income Below Poverty Among Single-Parent Households in Samak
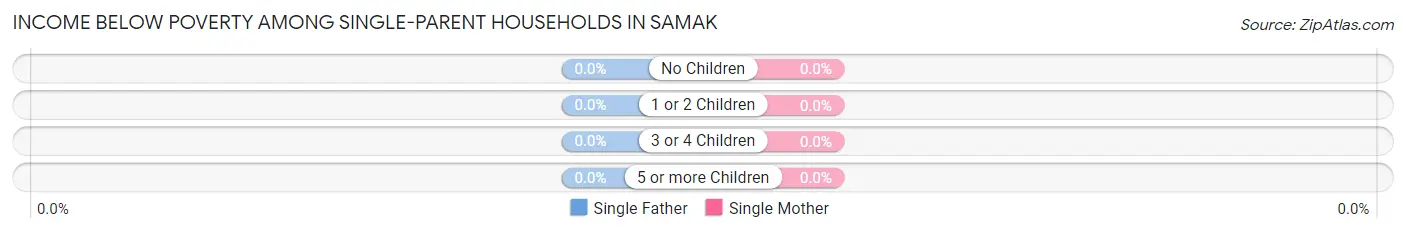
| Children | Single Father | Single Mother |
| No Children | 0 (0.0%) | 0 (0.0%) |
| 1 or 2 Children | 0 (0.0%) | 0 (0.0%) |
| 3 or 4 Children | 0 (0.0%) | 0 (0.0%) |
| 5 or more Children | 0 (0.0%) | 0 (0.0%) |
| Total | 0 (0.0%) | 0 (0.0%) |
Income Below Poverty Among Married-Couple vs Single-Parent Households in Samak
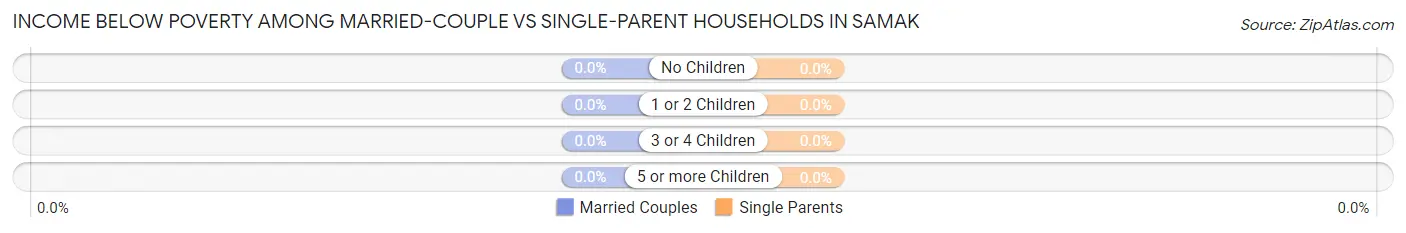
| Children | Married-Couple Families | Single-Parent Households |
| No Children | 0 (0.0%) | 0 (0.0%) |
| 1 or 2 Children | 0 (0.0%) | 0 (0.0%) |
| 3 or 4 Children | 0 (0.0%) | 0 (0.0%) |
| 5 or more Children | 0 (0.0%) | 0 (0.0%) |
| Total | 0 (0.0%) | 0 (0.0%) |
Employment Characteristics in Samak
Employment by Class of Employer in Samak
Among the 43 employed individuals in Samak, private company employees (35 | 81.4%), and local government employees (8 | 18.6%) make up the most common classes of employment.
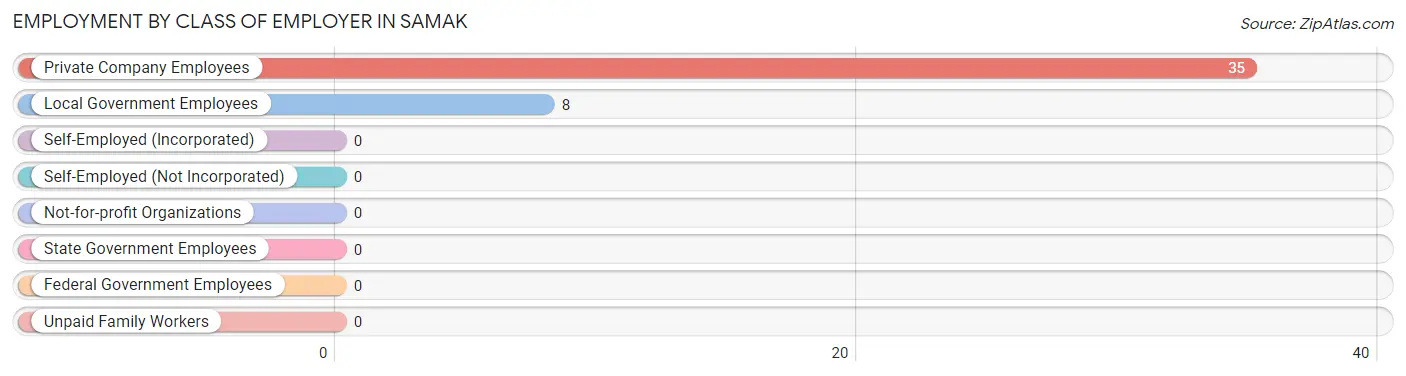
| Employer Class | # Employees | % Employees |
| Private Company Employees | 35 | 81.4% |
| Self-Employed (Incorporated) | 0 | 0.0% |
| Self-Employed (Not Incorporated) | 0 | 0.0% |
| Not-for-profit Organizations | 0 | 0.0% |
| Local Government Employees | 8 | 18.6% |
| State Government Employees | 0 | 0.0% |
| Federal Government Employees | 0 | 0.0% |
| Unpaid Family Workers | 0 | 0.0% |
| Total | 43 | 100.0% |
Employment Status by Age in Samak
According to the labor force statistics for Samak, out of the total population over 16 years of age (104), 50.0% or 52 individuals are in the labor force, with 17.3% or 9 of them unemployed. The age group with the highest labor force participation rate is 16 to 19 years, with 100.0% or 13 individuals in the labor force. Within the labor force, the 45 to 54 years age range has the highest percentage of unemployed individuals, with 52.9% or 9 of them being unemployed.
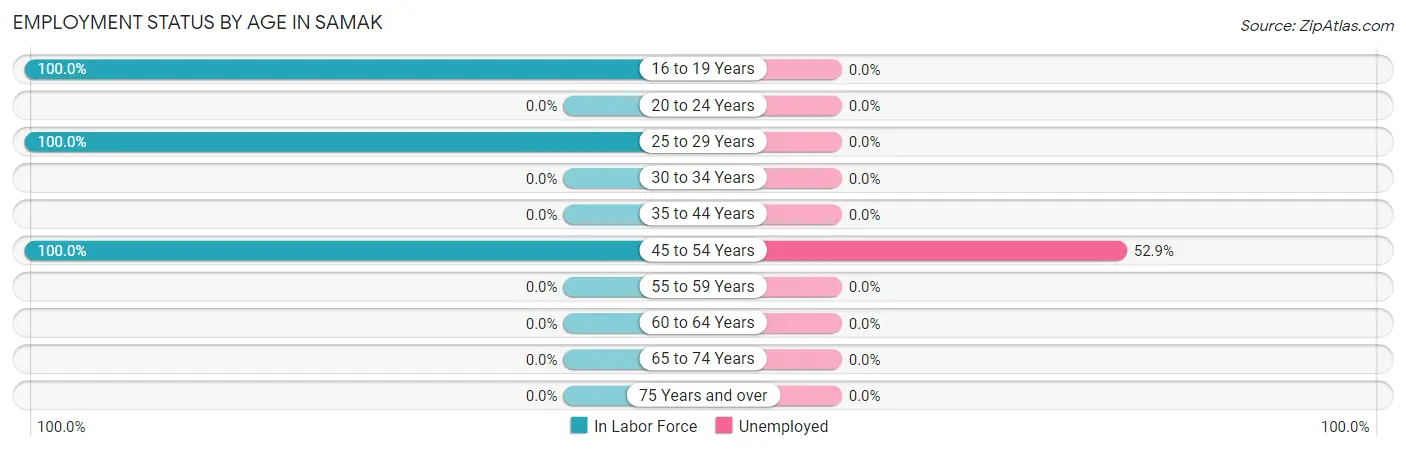
| Age Bracket | In Labor Force | Unemployed |
| 16 to 19 Years | 13 (100.0%) | 0 (0.0%) |
| 20 to 24 Years | 0 (0.0%) | 0 (0.0%) |
| 25 to 29 Years | 22 (100.0%) | 0 (0.0%) |
| 30 to 34 Years | 0 (0.0%) | 0 (0.0%) |
| 35 to 44 Years | 0 (0.0%) | 0 (0.0%) |
| 45 to 54 Years | 17 (100.0%) | 9 (52.9%) |
| 55 to 59 Years | 0 (0.0%) | 0 (0.0%) |
| 60 to 64 Years | 0 (0.0%) | 0 (0.0%) |
| 65 to 74 Years | 0 (0.0%) | 0 (0.0%) |
| 75 Years and over | 0 (0.0%) | 0 (0.0%) |
| Total | 52 (50.0%) | 9 (17.3%) |
Employment Status by Educational Attainment in Samak
According to labor force statistics for Samak, 100.0% of individuals (39) out of the total population between 25 and 64 years of age (39) are in the labor force, with 23.1% or 9 of them being unemployed. The group with the highest labor force participation rate are those with the educational attainment of high school diploma, with 100.0% or 39 individuals in the labor force. Within the labor force, individuals with high school diploma education have the highest percentage of unemployment, with 23.1% or 9 of them being unemployed.
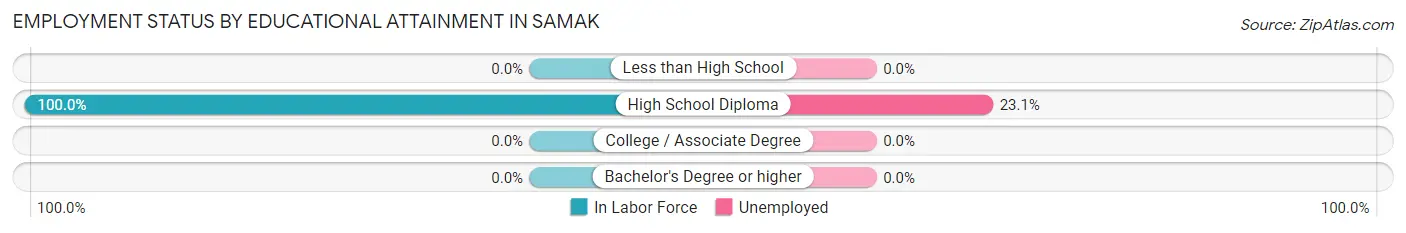
| Educational Attainment | In Labor Force | Unemployed |
| Less than High School | 0 (0.0%) | 0 (0.0%) |
| High School Diploma | 39 (100.0%) | 9 (23.1%) |
| College / Associate Degree | 0 (0.0%) | 0 (0.0%) |
| Bachelor's Degree or higher | 0 (0.0%) | 0 (0.0%) |
| Total | 39 (100.0%) | 9 (23.1%) |
Employment Occupations by Sex in Samak
Management, Business, Science and Arts Occupations
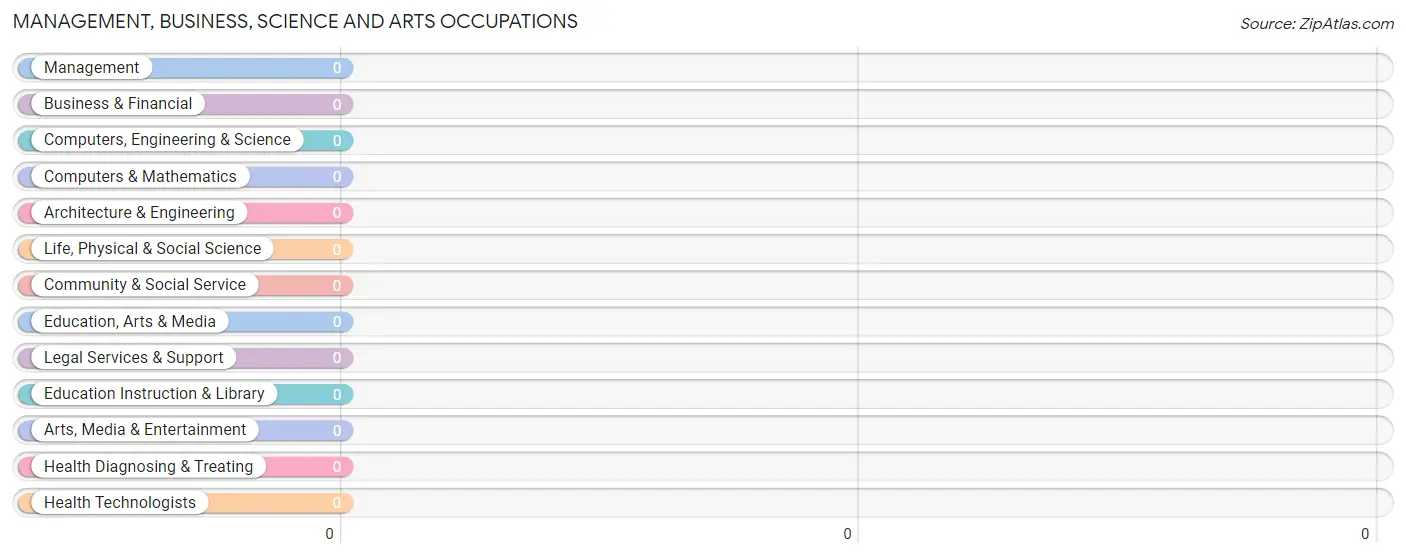
Management, Business, Science and Arts Occupations by Sex
| Occupation | Male | Female |
| Management | 0 (0.0%) | 0 (0.0%) |
| Business & Financial | 0 (0.0%) | 0 (0.0%) |
| Computers, Engineering & Science | 0 (0.0%) | 0 (0.0%) |
| Computers & Mathematics | 0 (0.0%) | 0 (0.0%) |
| Architecture & Engineering | 0 (0.0%) | 0 (0.0%) |
| Life, Physical & Social Science | 0 (0.0%) | 0 (0.0%) |
| Community & Social Service | 0 (0.0%) | 0 (0.0%) |
| Education, Arts & Media | 0 (0.0%) | 0 (0.0%) |
| Legal Services & Support | 0 (0.0%) | 0 (0.0%) |
| Education Instruction & Library | 0 (0.0%) | 0 (0.0%) |
| Arts, Media & Entertainment | 0 (0.0%) | 0 (0.0%) |
| Health Diagnosing & Treating | 0 (0.0%) | 0 (0.0%) |
| Health Technologists | 0 (0.0%) | 0 (0.0%) |
| Total (Category) | 0 (0.0%) | 0 (0.0%) |
| Total (Overall) | 43 (100.0%) | 0 (0.0%) |
Services Occupations
Services Occupations by Sex
| Occupation | Male | Female |
| Healthcare Support | 0 (0.0%) | 0 (0.0%) |
| Security & Protection | 0 (0.0%) | 0 (0.0%) |
| Firefighting & Prevention | 0 (0.0%) | 0 (0.0%) |
| Law Enforcement | 0 (0.0%) | 0 (0.0%) |
| Food Preparation & Serving | 0 (0.0%) | 0 (0.0%) |
| Cleaning & Maintenance | 0 (0.0%) | 0 (0.0%) |
| Personal Care & Service | 0 (0.0%) | 0 (0.0%) |
| Total (Category) | 0 (0.0%) | 0 (0.0%) |
| Total (Overall) | 43 (100.0%) | 0 (0.0%) |
Sales and Office Occupations
Sales and Office Occupations by Sex
| Occupation | Male | Female |
| Sales & Related | 0 (0.0%) | 0 (0.0%) |
| Office & Administration | 0 (0.0%) | 0 (0.0%) |
| Total (Category) | 0 (0.0%) | 0 (0.0%) |
| Total (Overall) | 43 (100.0%) | 0 (0.0%) |
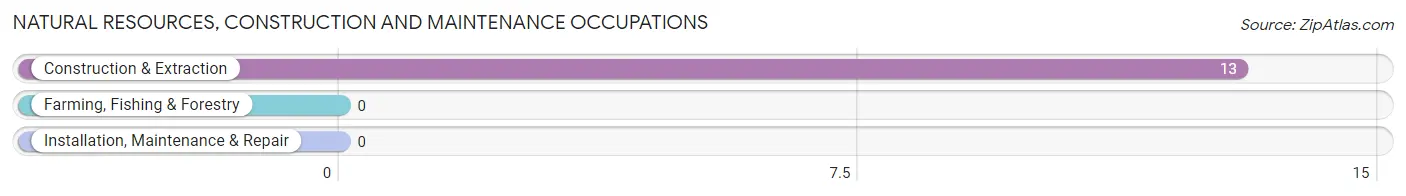
Natural Resources, Construction and Maintenance Occupations
The most common Natural Resources, Construction and Maintenance occupations in Samak are , and Construction & Extraction (13 | 30.2%).
Natural Resources, Construction and Maintenance Occupations by Sex
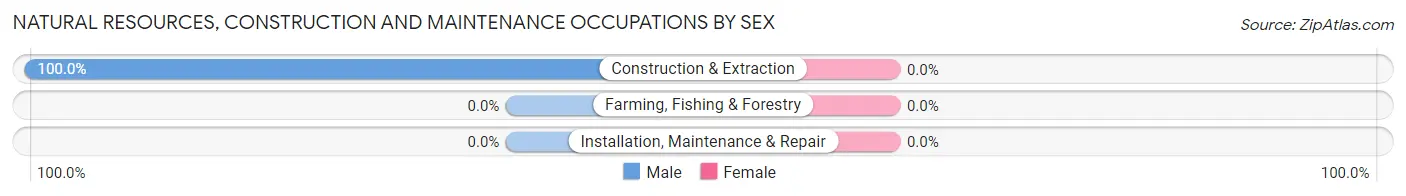
| Occupation | Male | Female |
| Farming, Fishing & Forestry | 0 (0.0%) | 0 (0.0%) |
| Construction & Extraction | 13 (100.0%) | 0 (0.0%) |
| Installation, Maintenance & Repair | 0 (0.0%) | 0 (0.0%) |
| Total (Category) | 13 (100.0%) | 0 (0.0%) |
| Total (Overall) | 43 (100.0%) | 0 (0.0%) |
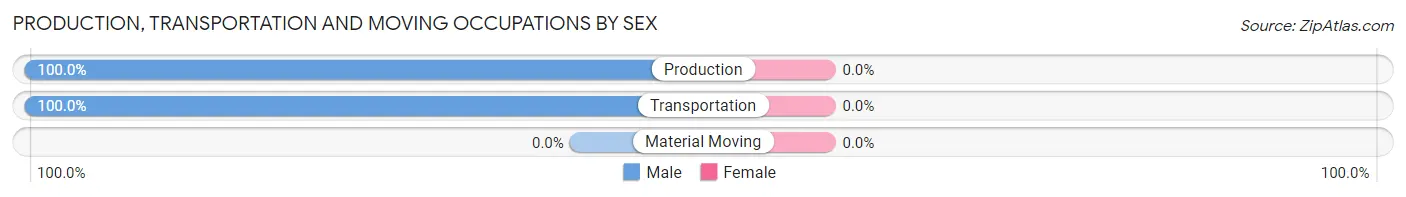
Production, Transportation and Moving Occupations
The most common Production, Transportation and Moving occupations in Samak are Transportation (22 | 51.2%), and Production (8 | 18.6%).
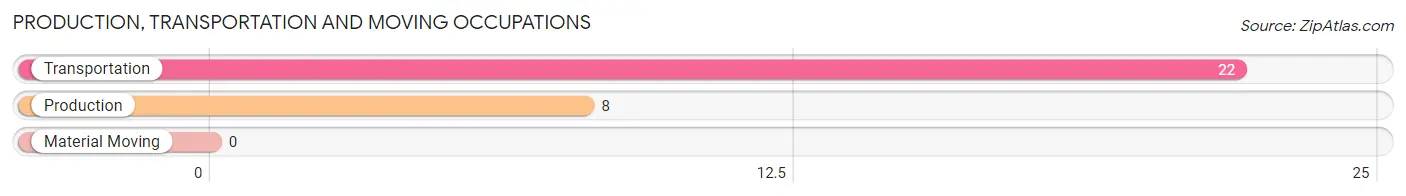
Production, Transportation and Moving Occupations by Sex
| Occupation | Male | Female |
| Production | 8 (100.0%) | 0 (0.0%) |
| Transportation | 22 (100.0%) | 0 (0.0%) |
| Material Moving | 0 (0.0%) | 0 (0.0%) |
| Total (Category) | 30 (100.0%) | 0 (0.0%) |
| Total (Overall) | 43 (100.0%) | 0 (0.0%) |
Employment Industries by Sex in Samak
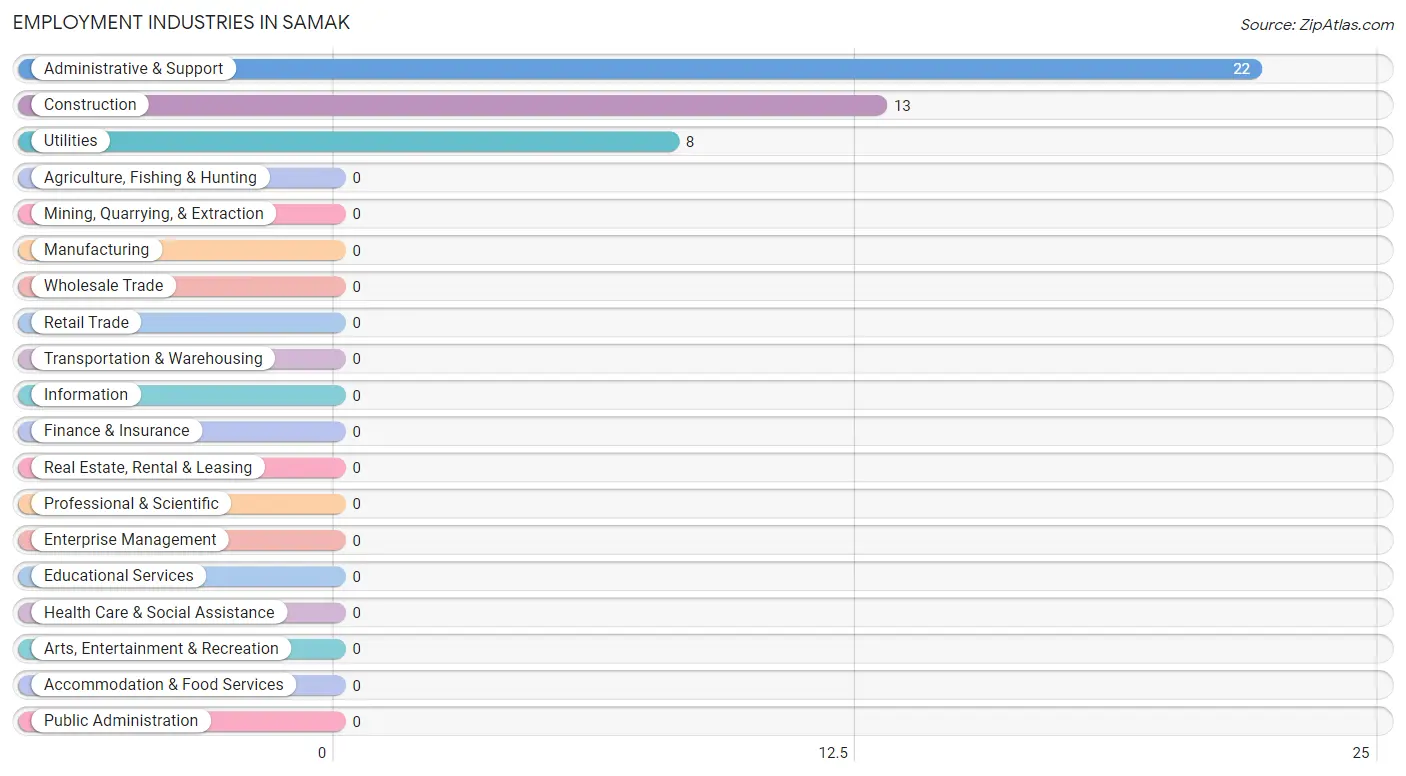
Employment Industries in Samak
The major employment industries in Samak include Administrative & Support (22 | 51.2%), Construction (13 | 30.2%), and Utilities (8 | 18.6%).
Employment Industries by Sex in Samak
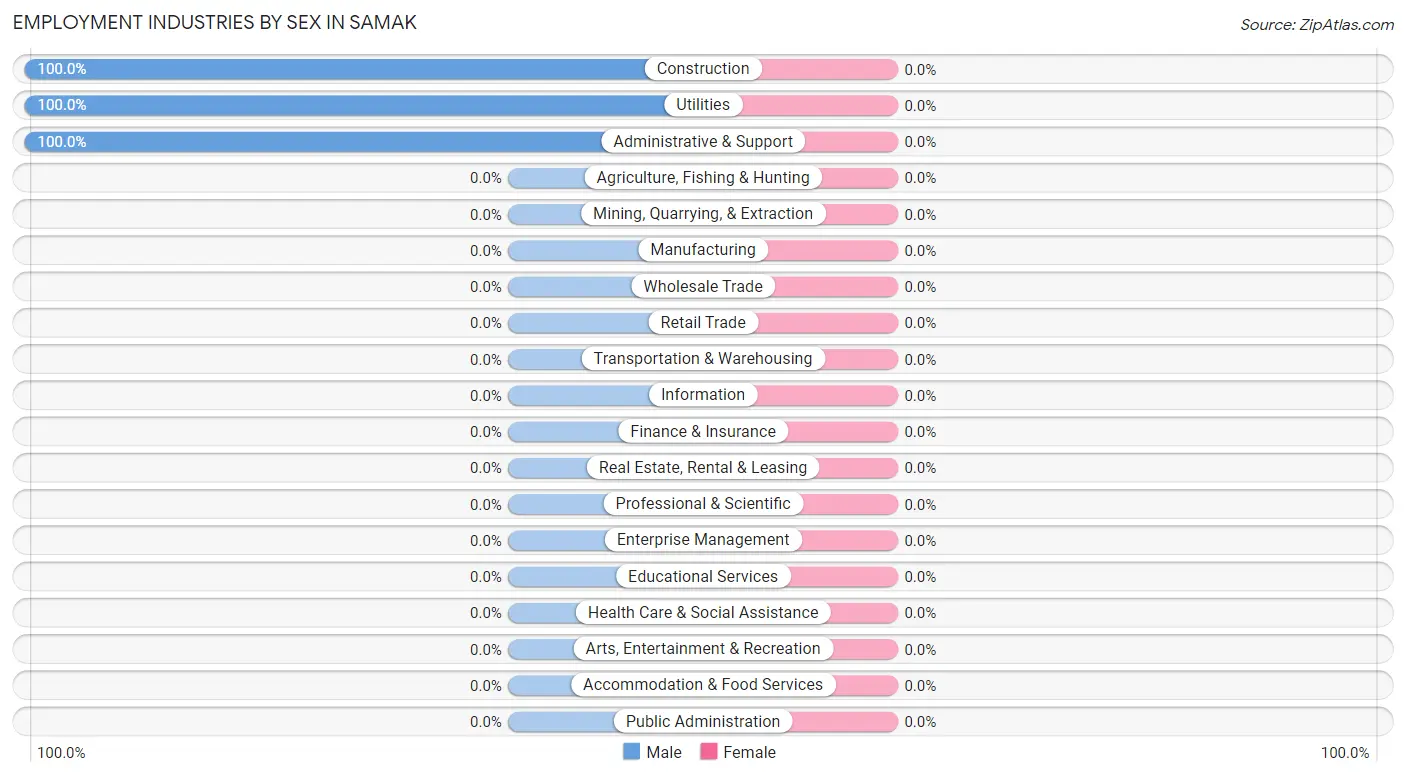
| Industry | Male | Female |
| Agriculture, Fishing & Hunting | 0 (0.0%) | 0 (0.0%) |
| Mining, Quarrying, & Extraction | 0 (0.0%) | 0 (0.0%) |
| Construction | 13 (100.0%) | 0 (0.0%) |
| Manufacturing | 0 (0.0%) | 0 (0.0%) |
| Wholesale Trade | 0 (0.0%) | 0 (0.0%) |
| Retail Trade | 0 (0.0%) | 0 (0.0%) |
| Transportation & Warehousing | 0 (0.0%) | 0 (0.0%) |
| Utilities | 8 (100.0%) | 0 (0.0%) |
| Information | 0 (0.0%) | 0 (0.0%) |
| Finance & Insurance | 0 (0.0%) | 0 (0.0%) |
| Real Estate, Rental & Leasing | 0 (0.0%) | 0 (0.0%) |
| Professional & Scientific | 0 (0.0%) | 0 (0.0%) |
| Enterprise Management | 0 (0.0%) | 0 (0.0%) |
| Administrative & Support | 22 (100.0%) | 0 (0.0%) |
| Educational Services | 0 (0.0%) | 0 (0.0%) |
| Health Care & Social Assistance | 0 (0.0%) | 0 (0.0%) |
| Arts, Entertainment & Recreation | 0 (0.0%) | 0 (0.0%) |
| Accommodation & Food Services | 0 (0.0%) | 0 (0.0%) |
| Public Administration | 0 (0.0%) | 0 (0.0%) |
| Total | 43 (100.0%) | 0 (0.0%) |
Education in Samak
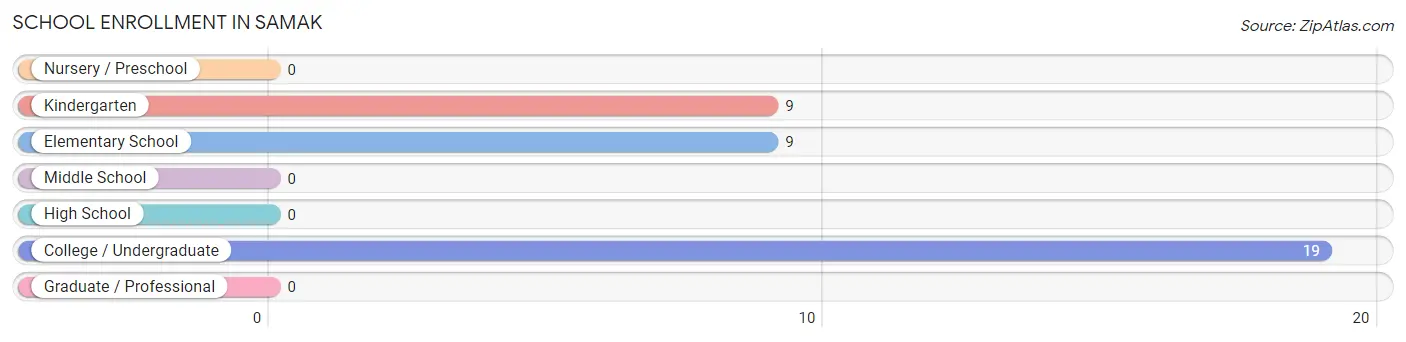
School Enrollment in Samak
The most common levels of schooling among the 37 students in Samak are college / undergraduate (19 | 51.3%), kindergarten (9 | 24.3%), and elementary school (9 | 24.3%).
| School Level | # Students | % Students |
| Nursery / Preschool | 0 | 0.0% |
| Kindergarten | 9 | 24.3% |
| Elementary School | 9 | 24.3% |
| Middle School | 0 | 0.0% |
| High School | 0 | 0.0% |
| College / Undergraduate | 19 | 51.3% |
| Graduate / Professional | 0 | 0.0% |
| Total | 37 | 100.0% |
School Enrollment by Age by Funding Source in Samak
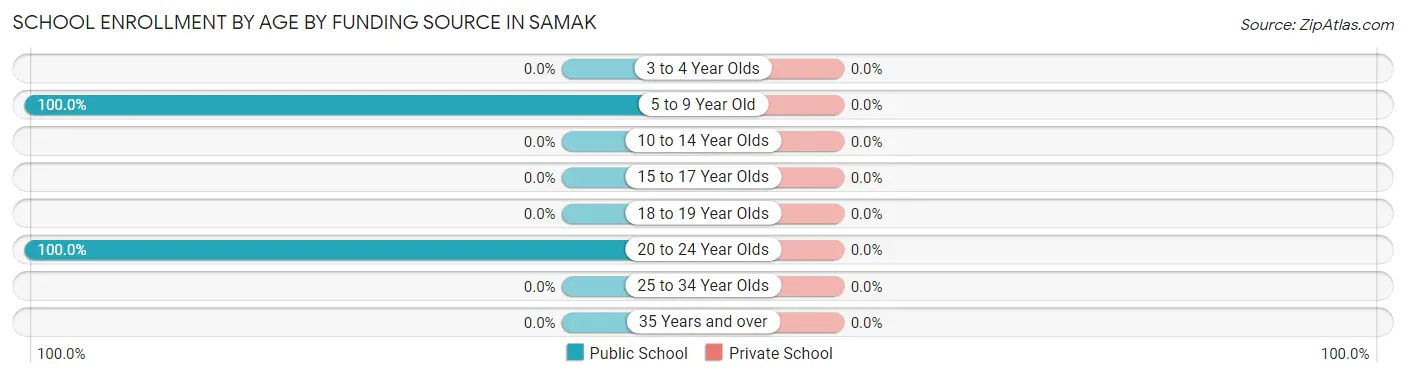
| Age Bracket | Public School | Private School |
| 3 to 4 Year Olds | 0 (0.0%) | 0 (0.0%) |
| 5 to 9 Year Old | 18 (100.0%) | 0 (0.0%) |
| 10 to 14 Year Olds | 0 (0.0%) | 0 (0.0%) |
| 15 to 17 Year Olds | 0 (0.0%) | 0 (0.0%) |
| 18 to 19 Year Olds | 0 (0.0%) | 0 (0.0%) |
| 20 to 24 Year Olds | 19 (100.0%) | 0 (0.0%) |
| 25 to 34 Year Olds | 0 (0.0%) | 0 (0.0%) |
| 35 Years and over | 0 (0.0%) | 0 (0.0%) |
| Total | 37 (100.0%) | 0 (0.0%) |
Educational Attainment by Field of Study in Samak
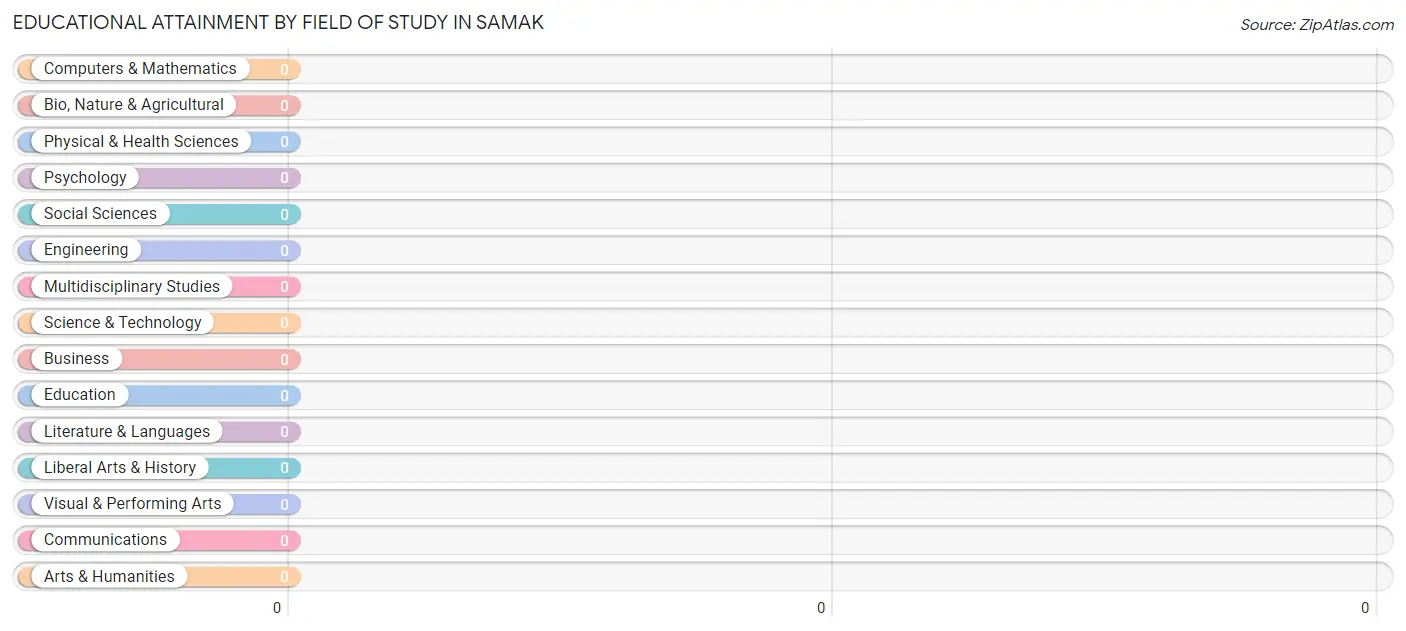
| Field of Study | # Graduates | % Graduates |
| Computers & Mathematics | 0 | 0.0% |
| Bio, Nature & Agricultural | 0 | 0.0% |
| Physical & Health Sciences | 0 | 0.0% |
| Psychology | 0 | 0.0% |
| Social Sciences | 0 | 0.0% |
| Engineering | 0 | 0.0% |
| Multidisciplinary Studies | 0 | 0.0% |
| Science & Technology | 0 | 0.0% |
| Business | 0 | 0.0% |
| Education | 0 | 0.0% |
| Literature & Languages | 0 | 0.0% |
| Liberal Arts & History | 0 | 0.0% |
| Visual & Performing Arts | 0 | 0.0% |
| Communications | 0 | 0.0% |
| Arts & Humanities | 0 | 0.0% |
| Total | 0 | 0.0% |
Transportation & Commute in Samak
Vehicle Availability by Sex in Samak
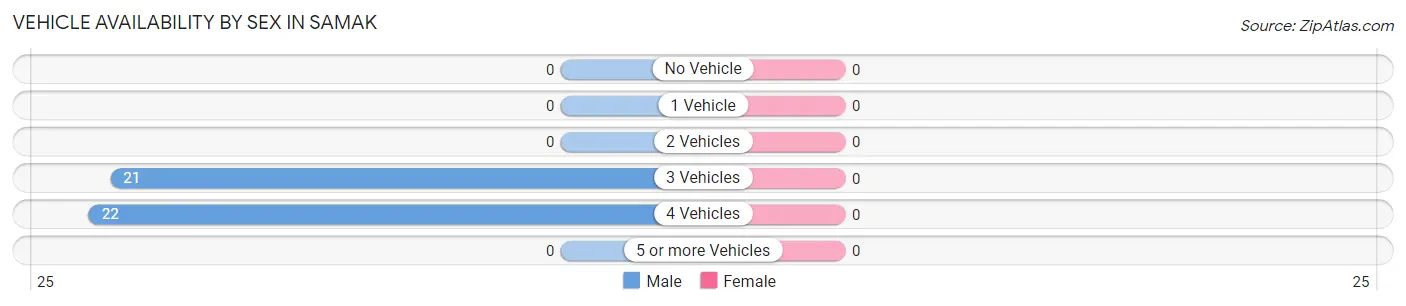
| Vehicles Available | Male | Female |
| No Vehicle | 0 (0.0%) | 0 (0.0%) |
| 1 Vehicle | 0 (0.0%) | 0 (0.0%) |
| 2 Vehicles | 0 (0.0%) | 0 (0.0%) |
| 3 Vehicles | 21 (48.8%) | 0 (0.0%) |
| 4 Vehicles | 22 (51.2%) | 0 (0.0%) |
| 5 or more Vehicles | 0 (0.0%) | 0 (0.0%) |
| Total | 43 (100.0%) | 0 (0.0%) |
Commute Time in Samak
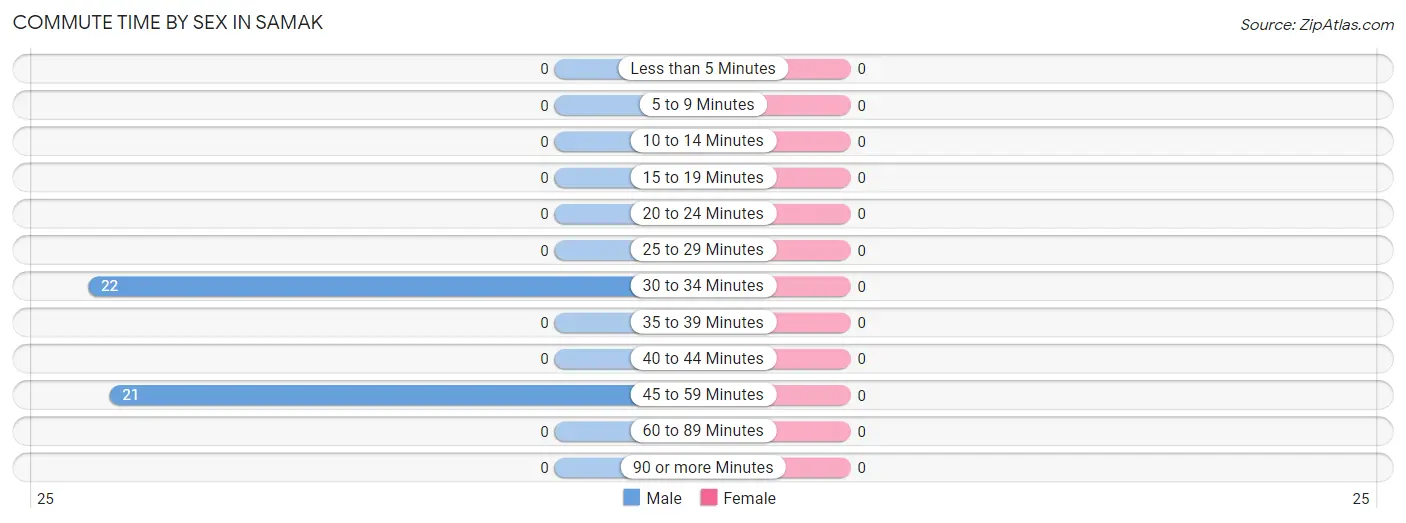
The most frequently occuring commute durations in Samak are 30 to 34 minutes (22 commuters, 51.2%), 45 to 59 minutes (21 commuters, 48.8%), and less than 5 minutes (0 commuters, 0.0%).
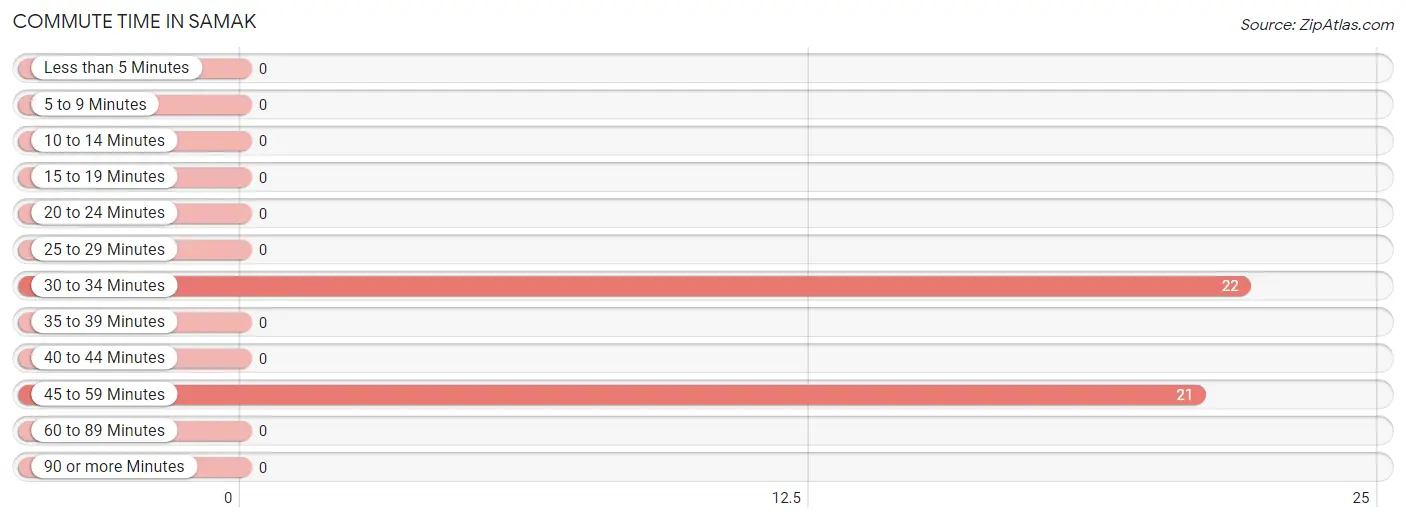
| Commute Time | # Commuters | % Commuters |
| Less than 5 Minutes | 0 | 0.0% |
| 5 to 9 Minutes | 0 | 0.0% |
| 10 to 14 Minutes | 0 | 0.0% |
| 15 to 19 Minutes | 0 | 0.0% |
| 20 to 24 Minutes | 0 | 0.0% |
| 25 to 29 Minutes | 0 | 0.0% |
| 30 to 34 Minutes | 22 | 51.2% |
| 35 to 39 Minutes | 0 | 0.0% |
| 40 to 44 Minutes | 0 | 0.0% |
| 45 to 59 Minutes | 21 | 48.8% |
| 60 to 89 Minutes | 0 | 0.0% |
| 90 or more Minutes | 0 | 0.0% |
Commute Time by Sex in Samak
| Commute Time | Male | Female |
| Less than 5 Minutes | 0 (0.0%) | 0 (0.0%) |
| 5 to 9 Minutes | 0 (0.0%) | 0 (0.0%) |
| 10 to 14 Minutes | 0 (0.0%) | 0 (0.0%) |
| 15 to 19 Minutes | 0 (0.0%) | 0 (0.0%) |
| 20 to 24 Minutes | 0 (0.0%) | 0 (0.0%) |
| 25 to 29 Minutes | 0 (0.0%) | 0 (0.0%) |
| 30 to 34 Minutes | 22 (51.2%) | 0 (0.0%) |
| 35 to 39 Minutes | 0 (0.0%) | 0 (0.0%) |
| 40 to 44 Minutes | 0 (0.0%) | 0 (0.0%) |
| 45 to 59 Minutes | 21 (48.8%) | 0 (0.0%) |
| 60 to 89 Minutes | 0 (0.0%) | 0 (0.0%) |
| 90 or more Minutes | 0 (0.0%) | 0 (0.0%) |
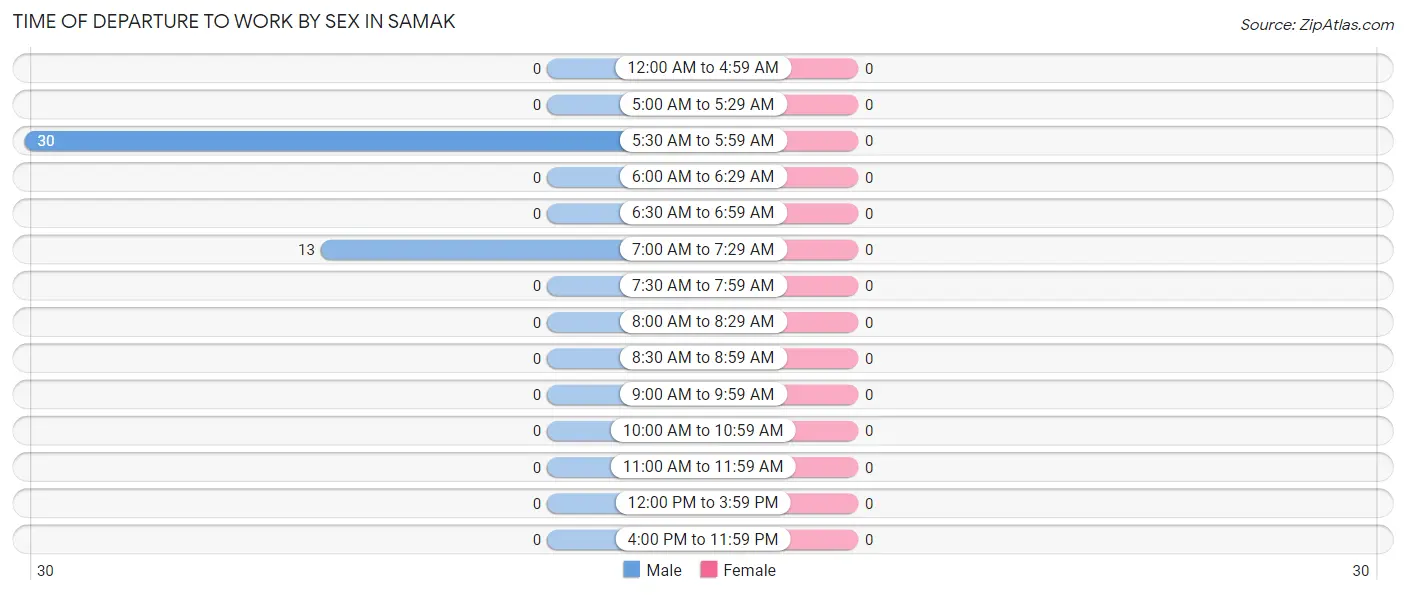
Time of Departure to Work by Sex in Samak
| Time of Departure | Male | Female |
| 12:00 AM to 4:59 AM | 0 (0.0%) | 0 (0.0%) |
| 5:00 AM to 5:29 AM | 0 (0.0%) | 0 (0.0%) |
| 5:30 AM to 5:59 AM | 30 (69.8%) | 0 (0.0%) |
| 6:00 AM to 6:29 AM | 0 (0.0%) | 0 (0.0%) |
| 6:30 AM to 6:59 AM | 0 (0.0%) | 0 (0.0%) |
| 7:00 AM to 7:29 AM | 13 (30.2%) | 0 (0.0%) |
| 7:30 AM to 7:59 AM | 0 (0.0%) | 0 (0.0%) |
| 8:00 AM to 8:29 AM | 0 (0.0%) | 0 (0.0%) |
| 8:30 AM to 8:59 AM | 0 (0.0%) | 0 (0.0%) |
| 9:00 AM to 9:59 AM | 0 (0.0%) | 0 (0.0%) |
| 10:00 AM to 10:59 AM | 0 (0.0%) | 0 (0.0%) |
| 11:00 AM to 11:59 AM | 0 (0.0%) | 0 (0.0%) |
| 12:00 PM to 3:59 PM | 0 (0.0%) | 0 (0.0%) |
| 4:00 PM to 11:59 PM | 0 (0.0%) | 0 (0.0%) |
| Total | 43 (100.0%) | 0 (0.0%) |
Housing Occupancy in Samak
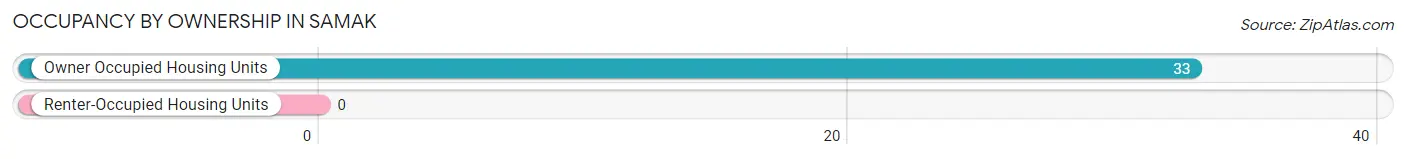
Occupancy by Ownership in Samak
Of the total 33 dwellings in Samak, owner-occupied units account for 33 (100.0%), while renter-occupied units make up 0 (0.0%).
| Occupancy | # Housing Units | % Housing Units |
| Owner Occupied Housing Units | 33 | 100.0% |
| Renter-Occupied Housing Units | 0 | 0.0% |
| Total Occupied Housing Units | 33 | 100.0% |
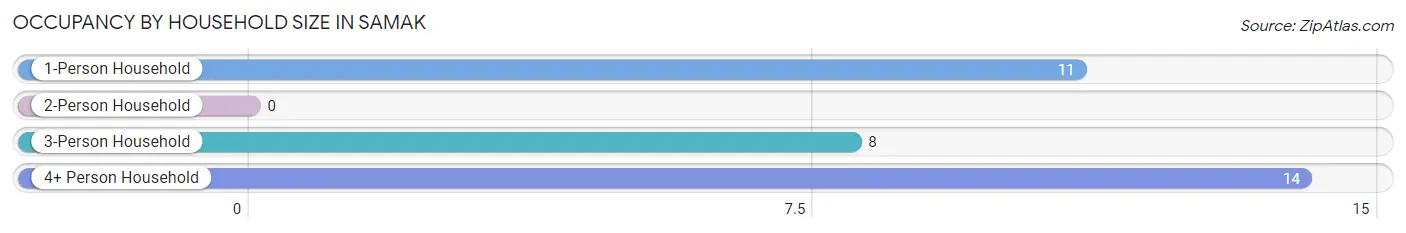
Occupancy by Household Size in Samak
| Household Size | # Housing Units | % Housing Units |
| 1-Person Household | 11 | 33.3% |
| 2-Person Household | 0 | 0.0% |
| 3-Person Household | 8 | 24.2% |
| 4+ Person Household | 14 | 42.4% |
| Total Housing Units | 33 | 100.0% |
Occupancy by Ownership by Household Size in Samak
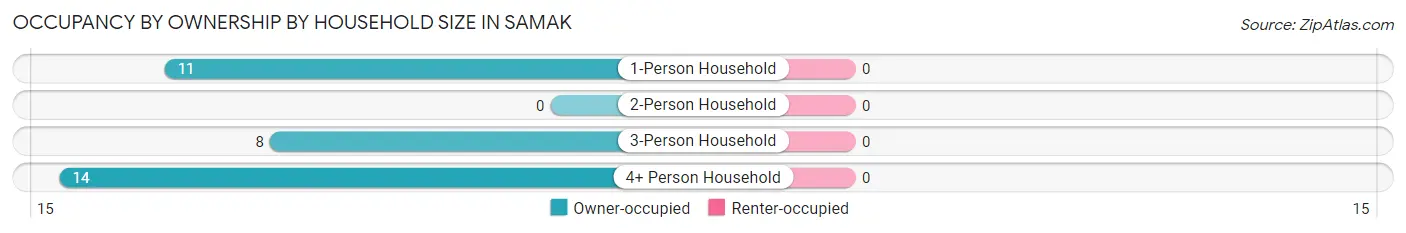
| Household Size | Owner-occupied | Renter-occupied |
| 1-Person Household | 11 (100.0%) | 0 (0.0%) |
| 2-Person Household | 0 (0.0%) | 0 (0.0%) |
| 3-Person Household | 8 (100.0%) | 0 (0.0%) |
| 4+ Person Household | 14 (100.0%) | 0 (0.0%) |
| Total Housing Units | 33 (100.0%) | 0 (0.0%) |
Occupancy by Educational Attainment in Samak
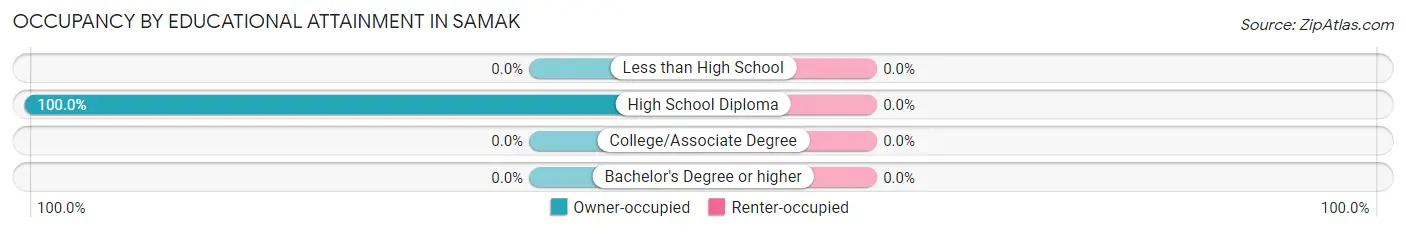
| Household Size | Owner-occupied | Renter-occupied |
| Less than High School | 0 (0.0%) | 0 (0.0%) |
| High School Diploma | 33 (100.0%) | 0 (0.0%) |
| College/Associate Degree | 0 (0.0%) | 0 (0.0%) |
| Bachelor's Degree or higher | 0 (0.0%) | 0 (0.0%) |
Occupancy by Age of Householder in Samak
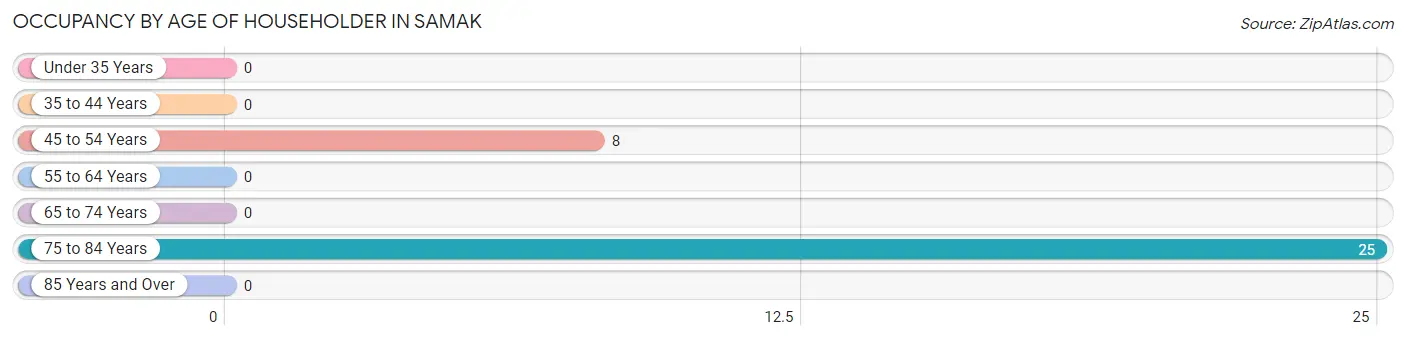
| Age Bracket | # Households | % Households |
| Under 35 Years | 0 | 0.0% |
| 35 to 44 Years | 0 | 0.0% |
| 45 to 54 Years | 8 | 24.2% |
| 55 to 64 Years | 0 | 0.0% |
| 65 to 74 Years | 0 | 0.0% |
| 75 to 84 Years | 25 | 75.8% |
| 85 Years and Over | 0 | 0.0% |
| Total | 33 | 100.0% |
Housing Finances in Samak
Median Income by Occupancy in Samak
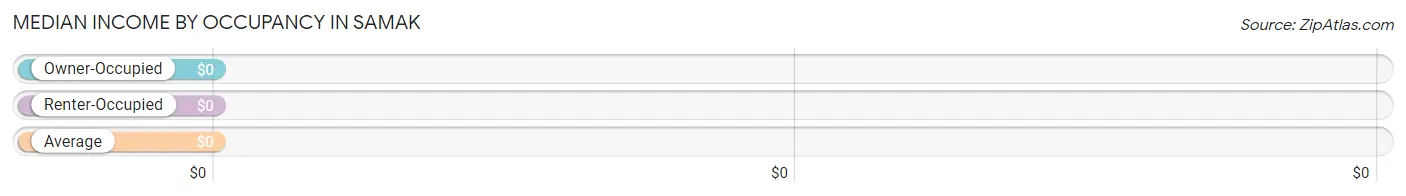
| Occupancy Type | # Households | Median Income |
| Owner-Occupied | 33 (100.0%) | $0 |
| Renter-Occupied | 0 (0.0%) | $0 |
| Average | 33 (100.0%) | $0 |
Occupancy by Householder Income Bracket in Samak
| Income Bracket | Owner-occupied | Renter-occupied |
| Less than $5,000 | 0 (0.0%) | 0 (0.0%) |
| $5,000 to $9,999 | 0 (0.0%) | 0 (0.0%) |
| $10,000 to $14,999 | 0 (0.0%) | 0 (0.0%) |
| $15,000 to $19,999 | 0 (0.0%) | 0 (0.0%) |
| $20,000 to $24,999 | 0 (0.0%) | 0 (0.0%) |
| $25,000 to $34,999 | 0 (0.0%) | 0 (0.0%) |
| $35,000 to $49,999 | 19 (57.6%) | 0 (0.0%) |
| $50,000 to $74,999 | 0 (0.0%) | 0 (0.0%) |
| $75,000 to $99,999 | 0 (0.0%) | 0 (0.0%) |
| $100,000 to $149,999 | 0 (0.0%) | 0 (0.0%) |
| $150,000 or more | 14 (42.4%) | 0 (0.0%) |
| Total | 33 (100.0%) | 0 (0.0%) |
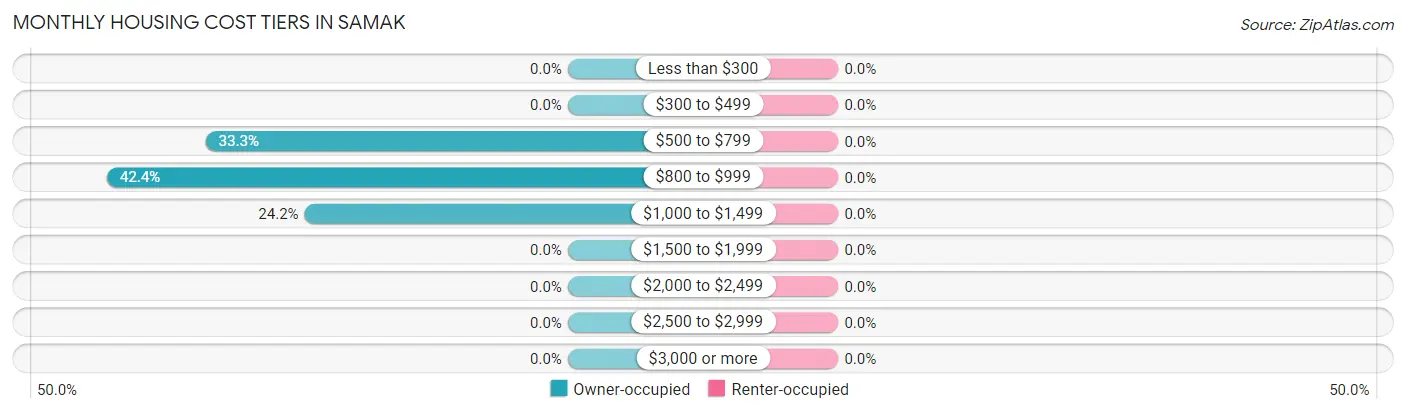
Monthly Housing Cost Tiers in Samak
| Monthly Cost | Owner-occupied | Renter-occupied |
| Less than $300 | 0 (0.0%) | 0 (0.0%) |
| $300 to $499 | 0 (0.0%) | 0 (0.0%) |
| $500 to $799 | 11 (33.3%) | 0 (0.0%) |
| $800 to $999 | 14 (42.4%) | 0 (0.0%) |
| $1,000 to $1,499 | 8 (24.2%) | 0 (0.0%) |
| $1,500 to $1,999 | 0 (0.0%) | 0 (0.0%) |
| $2,000 to $2,499 | 0 (0.0%) | 0 (0.0%) |
| $2,500 to $2,999 | 0 (0.0%) | 0 (0.0%) |
| $3,000 or more | 0 (0.0%) | 0 (0.0%) |
| Total | 33 (100.0%) | 0 (0.0%) |
Physical Housing Characteristics in Samak
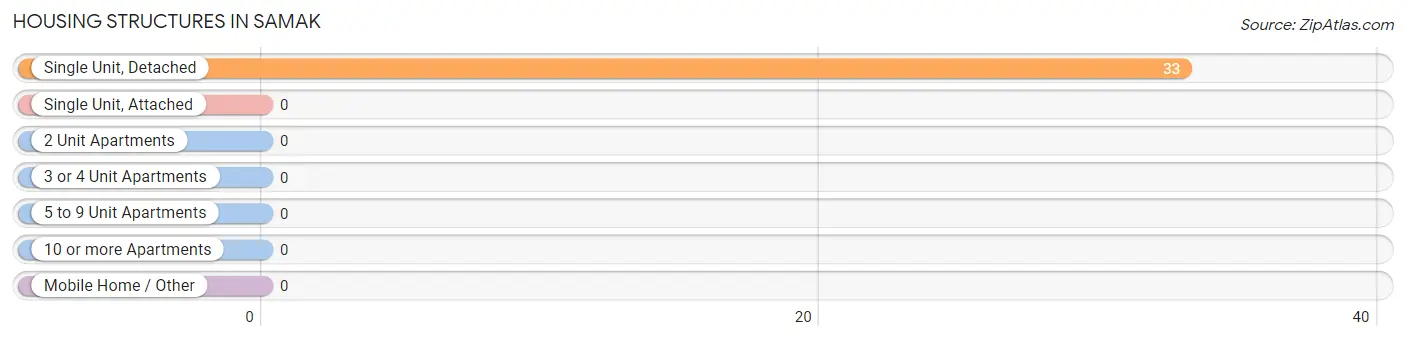
Housing Structures in Samak
| Structure Type | # Housing Units | % Housing Units |
| Single Unit, Detached | 33 | 100.0% |
| Single Unit, Attached | 0 | 0.0% |
| 2 Unit Apartments | 0 | 0.0% |
| 3 or 4 Unit Apartments | 0 | 0.0% |
| 5 to 9 Unit Apartments | 0 | 0.0% |
| 10 or more Apartments | 0 | 0.0% |
| Mobile Home / Other | 0 | 0.0% |
| Total | 33 | 100.0% |
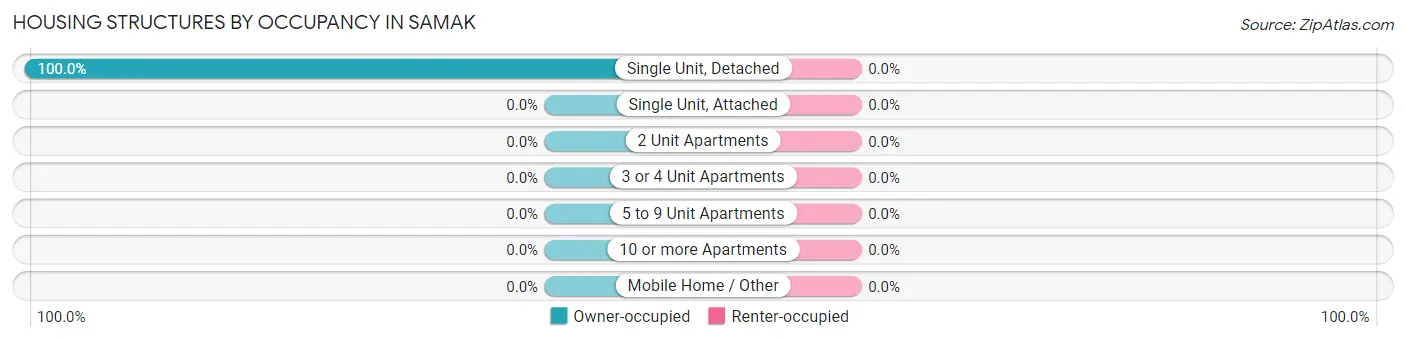
Housing Structures by Occupancy in Samak
| Structure Type | Owner-occupied | Renter-occupied |
| Single Unit, Detached | 33 (100.0%) | 0 (0.0%) |
| Single Unit, Attached | 0 (0.0%) | 0 (0.0%) |
| 2 Unit Apartments | 0 (0.0%) | 0 (0.0%) |
| 3 or 4 Unit Apartments | 0 (0.0%) | 0 (0.0%) |
| 5 to 9 Unit Apartments | 0 (0.0%) | 0 (0.0%) |
| 10 or more Apartments | 0 (0.0%) | 0 (0.0%) |
| Mobile Home / Other | 0 (0.0%) | 0 (0.0%) |
| Total | 33 (100.0%) | 0 (0.0%) |
Housing Structures by Number of Rooms in Samak
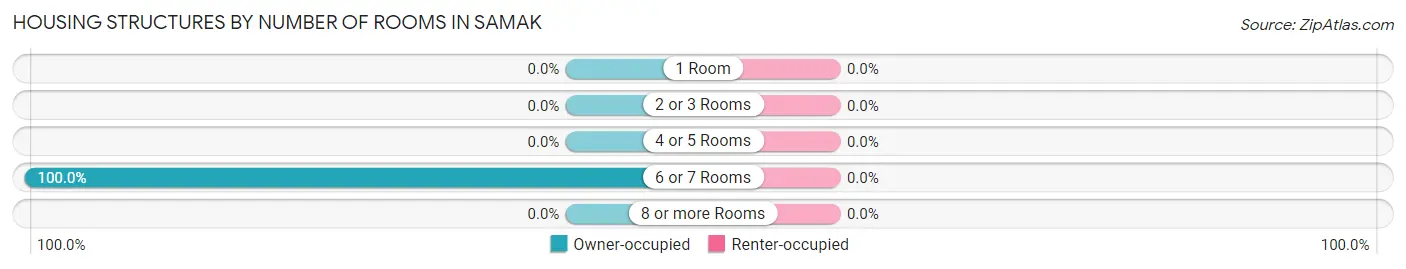
| Number of Rooms | Owner-occupied | Renter-occupied |
| 1 Room | 0 (0.0%) | 0 (0.0%) |
| 2 or 3 Rooms | 0 (0.0%) | 0 (0.0%) |
| 4 or 5 Rooms | 0 (0.0%) | 0 (0.0%) |
| 6 or 7 Rooms | 33 (100.0%) | 0 (0.0%) |
| 8 or more Rooms | 0 (0.0%) | 0 (0.0%) |
| Total | 33 (100.0%) | 0 (0.0%) |
Housing Structure by Heating Type in Samak
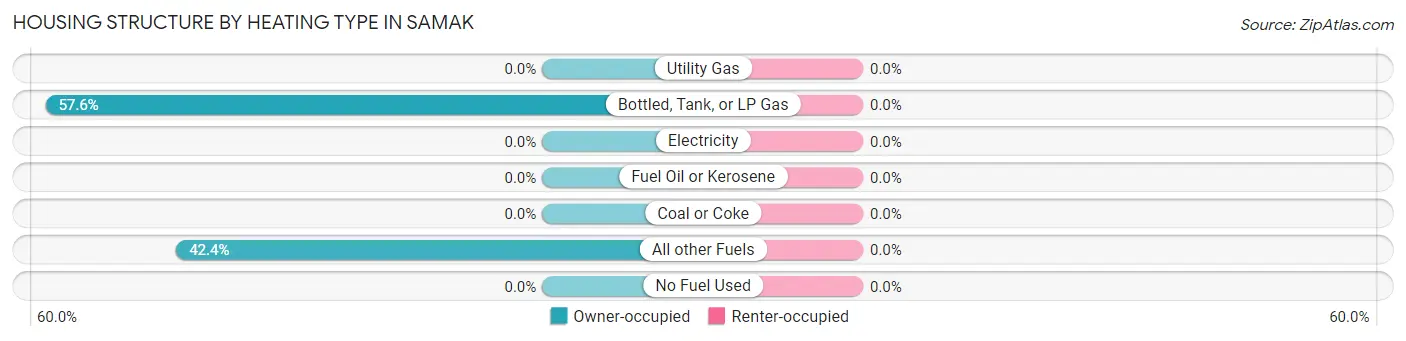
| Heating Type | Owner-occupied | Renter-occupied |
| Utility Gas | 0 (0.0%) | 0 (0.0%) |
| Bottled, Tank, or LP Gas | 19 (57.6%) | 0 (0.0%) |
| Electricity | 0 (0.0%) | 0 (0.0%) |
| Fuel Oil or Kerosene | 0 (0.0%) | 0 (0.0%) |
| Coal or Coke | 0 (0.0%) | 0 (0.0%) |
| All other Fuels | 14 (42.4%) | 0 (0.0%) |
| No Fuel Used | 0 (0.0%) | 0 (0.0%) |
| Total | 33 (100.0%) | 0 (0.0%) |
Household Vehicle Usage in Samak
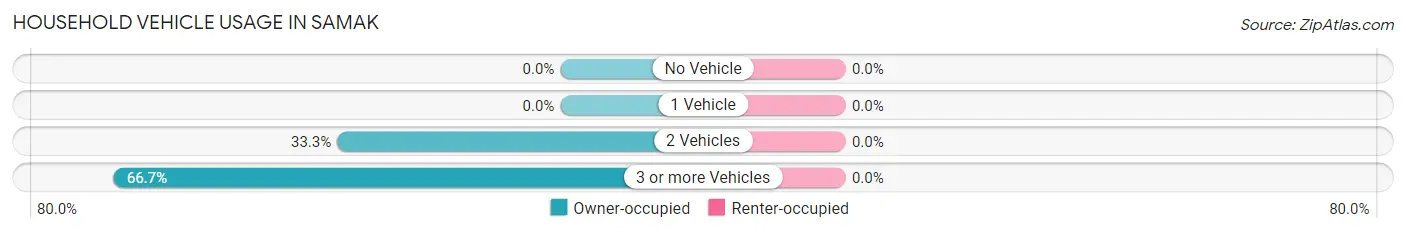
| Vehicles per Household | Owner-occupied | Renter-occupied |
| No Vehicle | 0 (0.0%) | 0 (0.0%) |
| 1 Vehicle | 0 (0.0%) | 0 (0.0%) |
| 2 Vehicles | 11 (33.3%) | 0 (0.0%) |
| 3 or more Vehicles | 22 (66.7%) | 0 (0.0%) |
| Total | 33 (100.0%) | 0 (0.0%) |
Real Estate & Mortgages in Samak
Real Estate and Mortgage Overview in Samak
| Characteristic | Without Mortgage | With Mortgage |
| Housing Units | 25 | 8 |
| Median Property Value | - | - |
| Median Household Income | - | - |
| Monthly Housing Costs | - | - |
| Real Estate Taxes | - | - |
Property Value by Mortgage Status in Samak
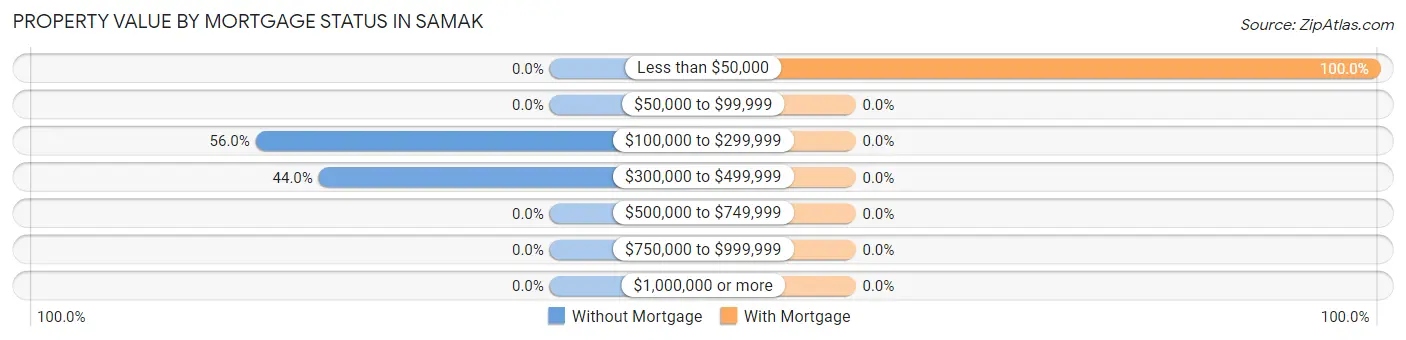
| Property Value | Without Mortgage | With Mortgage |
| Less than $50,000 | 0 (0.0%) | 8 (100.0%) |
| $50,000 to $99,999 | 0 (0.0%) | 0 (0.0%) |
| $100,000 to $299,999 | 14 (56.0%) | 0 (0.0%) |
| $300,000 to $499,999 | 11 (44.0%) | 0 (0.0%) |
| $500,000 to $749,999 | 0 (0.0%) | 0 (0.0%) |
| $750,000 to $999,999 | 0 (0.0%) | 0 (0.0%) |
| $1,000,000 or more | 0 (0.0%) | 0 (0.0%) |
| Total | 25 (100.0%) | 8 (100.0%) |
Household Income by Mortgage Status in Samak
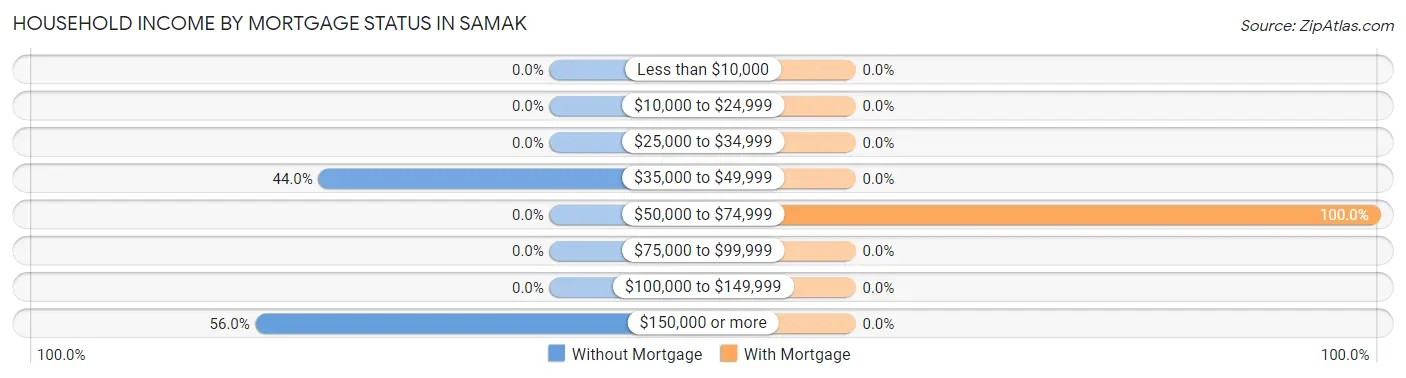
| Household Income | Without Mortgage | With Mortgage |
| Less than $10,000 | 0 (0.0%) | 0 (0.0%) |
| $10,000 to $24,999 | 0 (0.0%) | 0 (0.0%) |
| $25,000 to $34,999 | 0 (0.0%) | 0 (0.0%) |
| $35,000 to $49,999 | 11 (44.0%) | 0 (0.0%) |
| $50,000 to $74,999 | 0 (0.0%) | 8 (100.0%) |
| $75,000 to $99,999 | 0 (0.0%) | 0 (0.0%) |
| $100,000 to $149,999 | 0 (0.0%) | 0 (0.0%) |
| $150,000 or more | 14 (56.0%) | 0 (0.0%) |
| Total | 25 (100.0%) | 8 (100.0%) |
Property Value to Household Income Ratio in Samak
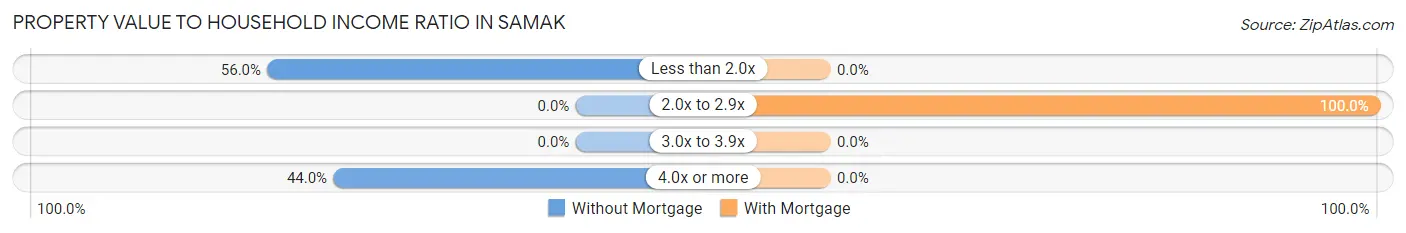
| Value-to-Income Ratio | Without Mortgage | With Mortgage |
| Less than 2.0x | 14 (56.0%) | 0 (0.0%) |
| 2.0x to 2.9x | 0 (0.0%) | 8 (100.0%) |
| 3.0x to 3.9x | 0 (0.0%) | 0 (0.0%) |
| 4.0x or more | 11 (44.0%) | 0 (0.0%) |
| Total | 25 (100.0%) | 8 (100.0%) |
Real Estate Taxes by Mortgage Status in Samak
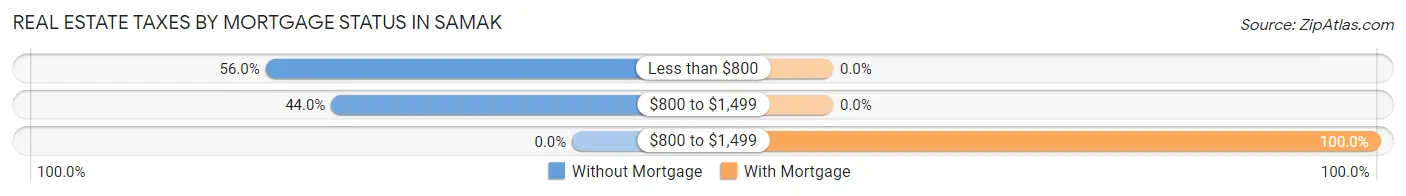
| Property Taxes | Without Mortgage | With Mortgage |
| Less than $800 | 14 (56.0%) | 0 (0.0%) |
| $800 to $1,499 | 11 (44.0%) | 0 (0.0%) |
| $800 to $1,499 | 0 (0.0%) | 8 (100.0%) |
| Total | 25 (100.0%) | 8 (100.0%) |
Health & Disability in Samak
Health Insurance Coverage by Age in Samak
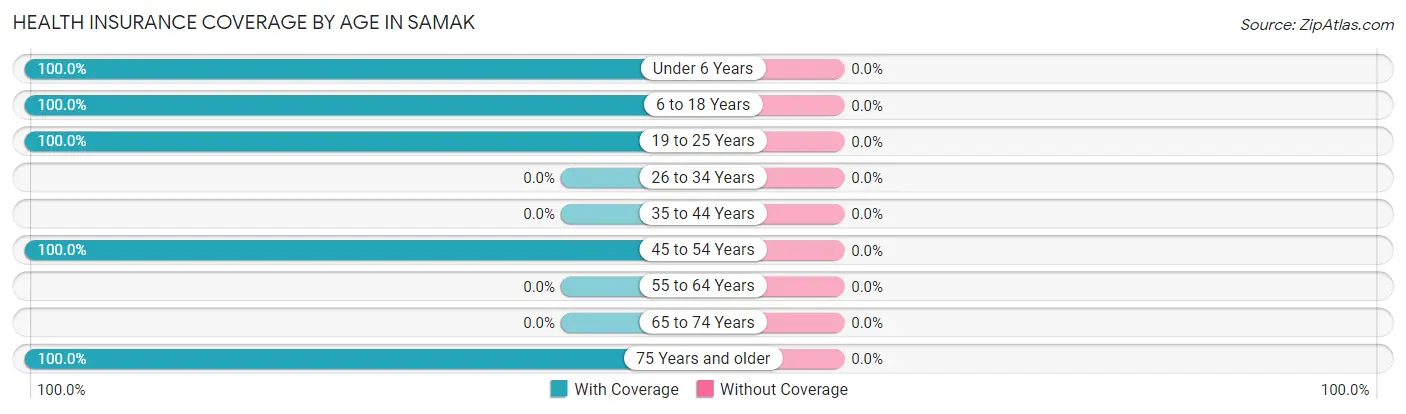
| Age Bracket | With Coverage | Without Coverage |
| Under 6 Years | 9 (100.0%) | 0 (0.0%) |
| 6 to 18 Years | 9 (100.0%) | 0 (0.0%) |
| 19 to 25 Years | 54 (100.0%) | 0 (0.0%) |
| 26 to 34 Years | 0 (0.0%) | 0 (0.0%) |
| 35 to 44 Years | 0 (0.0%) | 0 (0.0%) |
| 45 to 54 Years | 17 (100.0%) | 0 (0.0%) |
| 55 to 64 Years | 0 (0.0%) | 0 (0.0%) |
| 65 to 74 Years | 0 (0.0%) | 0 (0.0%) |
| 75 Years and older | 33 (100.0%) | 0 (0.0%) |
| Total | 122 (100.0%) | 0 (0.0%) |
Health Insurance Coverage by Citizenship Status in Samak
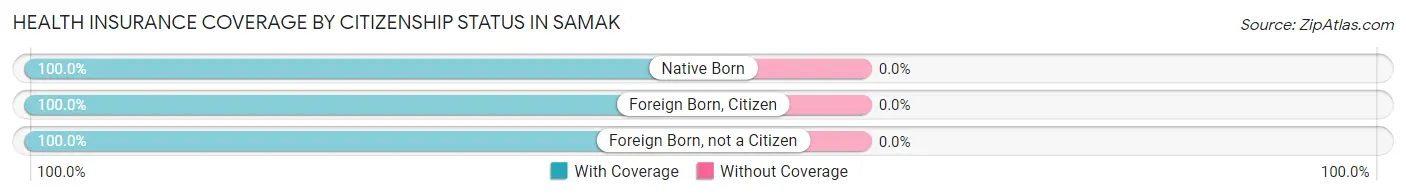
| Citizenship Status | With Coverage | Without Coverage |
| Native Born | 9 (100.0%) | 0 (0.0%) |
| Foreign Born, Citizen | 9 (100.0%) | 0 (0.0%) |
| Foreign Born, not a Citizen | 54 (100.0%) | 0 (0.0%) |
Health Insurance Coverage by Household Income in Samak
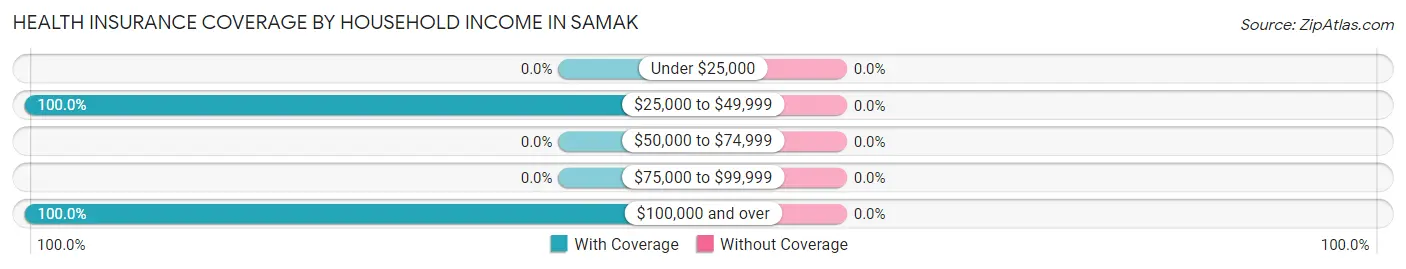
| Household Income | With Coverage | Without Coverage |
| Under $25,000 | 0 (0.0%) | 0 (0.0%) |
| $25,000 to $49,999 | 41 (100.0%) | 0 (0.0%) |
| $50,000 to $74,999 | 0 (0.0%) | 0 (0.0%) |
| $75,000 to $99,999 | 0 (0.0%) | 0 (0.0%) |
| $100,000 and over | 81 (100.0%) | 0 (0.0%) |
Public vs Private Health Insurance Coverage by Age in Samak
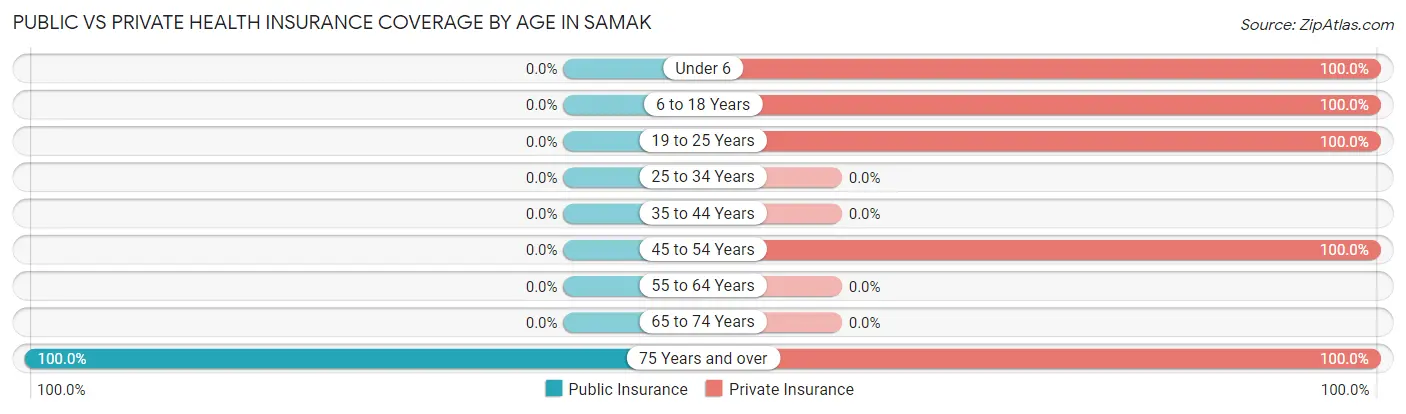
| Age Bracket | Public Insurance | Private Insurance |
| Under 6 | 0 (0.0%) | 9 (100.0%) |
| 6 to 18 Years | 0 (0.0%) | 9 (100.0%) |
| 19 to 25 Years | 0 (0.0%) | 54 (100.0%) |
| 25 to 34 Years | 0 (0.0%) | 0 (0.0%) |
| 35 to 44 Years | 0 (0.0%) | 0 (0.0%) |
| 45 to 54 Years | 0 (0.0%) | 17 (100.0%) |
| 55 to 64 Years | 0 (0.0%) | 0 (0.0%) |
| 65 to 74 Years | 0 (0.0%) | 0 (0.0%) |
| 75 Years and over | 33 (100.0%) | 33 (100.0%) |
| Total | 33 (27.1%) | 122 (100.0%) |
Disability Status by Sex by Age in Samak
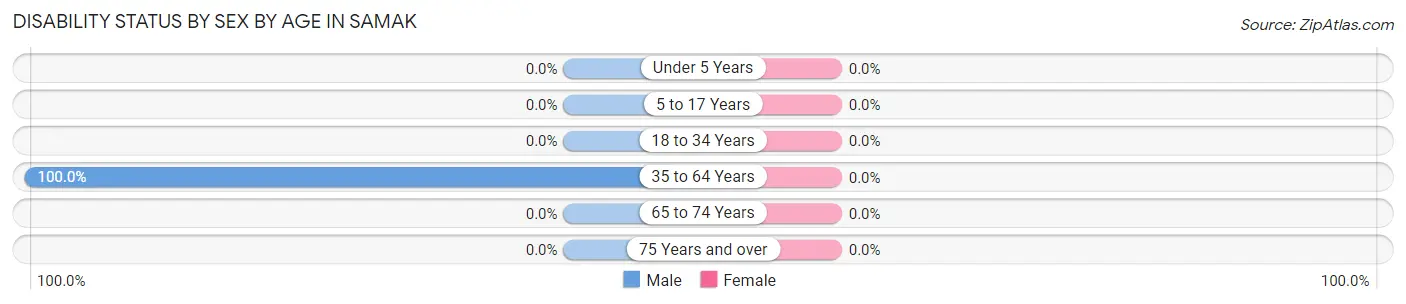
| Age Bracket | Male | Female |
| Under 5 Years | 0 (0.0%) | 0 (0.0%) |
| 5 to 17 Years | 0 (0.0%) | 0 (0.0%) |
| 18 to 34 Years | 0 (0.0%) | 0 (0.0%) |
| 35 to 64 Years | 8 (100.0%) | 0 (0.0%) |
| 65 to 74 Years | 0 (0.0%) | 0 (0.0%) |
| 75 Years and over | 0 (0.0%) | 0 (0.0%) |
Disability Class by Sex by Age in Samak
Disability Class: Hearing Difficulty
| Age Bracket | Male | Female |
| Under 5 Years | 0 (0.0%) | 0 (0.0%) |
| 5 to 17 Years | 0 (0.0%) | 0 (0.0%) |
| 18 to 34 Years | 0 (0.0%) | 0 (0.0%) |
| 35 to 64 Years | 8 (100.0%) | 0 (0.0%) |
| 65 to 74 Years | 0 (0.0%) | 0 (0.0%) |
| 75 Years and over | 0 (0.0%) | 0 (0.0%) |
Disability Class: Vision Difficulty
| Age Bracket | Male | Female |
| Under 5 Years | 0 (0.0%) | 0 (0.0%) |
| 5 to 17 Years | 0 (0.0%) | 0 (0.0%) |
| 18 to 34 Years | 0 (0.0%) | 0 (0.0%) |
| 35 to 64 Years | 0 (0.0%) | 0 (0.0%) |
| 65 to 74 Years | 0 (0.0%) | 0 (0.0%) |
| 75 Years and over | 0 (0.0%) | 0 (0.0%) |
Disability Class: Cognitive Difficulty
| Age Bracket | Male | Female |
| 5 to 17 Years | 0 (0.0%) | 0 (0.0%) |
| 18 to 34 Years | 0 (0.0%) | 0 (0.0%) |
| 35 to 64 Years | 0 (0.0%) | 0 (0.0%) |
| 65 to 74 Years | 0 (0.0%) | 0 (0.0%) |
| 75 Years and over | 0 (0.0%) | 0 (0.0%) |
Disability Class: Ambulatory Difficulty
| Age Bracket | Male | Female |
| 5 to 17 Years | 0 (0.0%) | 0 (0.0%) |
| 18 to 34 Years | 0 (0.0%) | 0 (0.0%) |
| 35 to 64 Years | 0 (0.0%) | 0 (0.0%) |
| 65 to 74 Years | 0 (0.0%) | 0 (0.0%) |
| 75 Years and over | 0 (0.0%) | 0 (0.0%) |
Disability Class: Self-Care Difficulty
| Age Bracket | Male | Female |
| 5 to 17 Years | 0 (0.0%) | 0 (0.0%) |
| 18 to 34 Years | 0 (0.0%) | 0 (0.0%) |
| 35 to 64 Years | 0 (0.0%) | 0 (0.0%) |
| 65 to 74 Years | 0 (0.0%) | 0 (0.0%) |
| 75 Years and over | 0 (0.0%) | 0 (0.0%) |
Technology Access in Samak
Computing Device Access in Samak
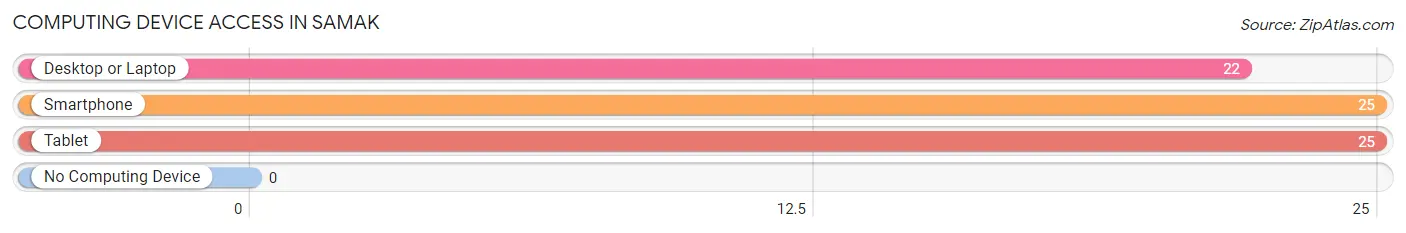
| Device Type | # Households | % Households |
| Desktop or Laptop | 22 | 66.7% |
| Smartphone | 25 | 75.8% |
| Tablet | 25 | 75.8% |
| No Computing Device | 0 | 0.0% |
| Total | 33 | 100.0% |
Internet Access in Samak
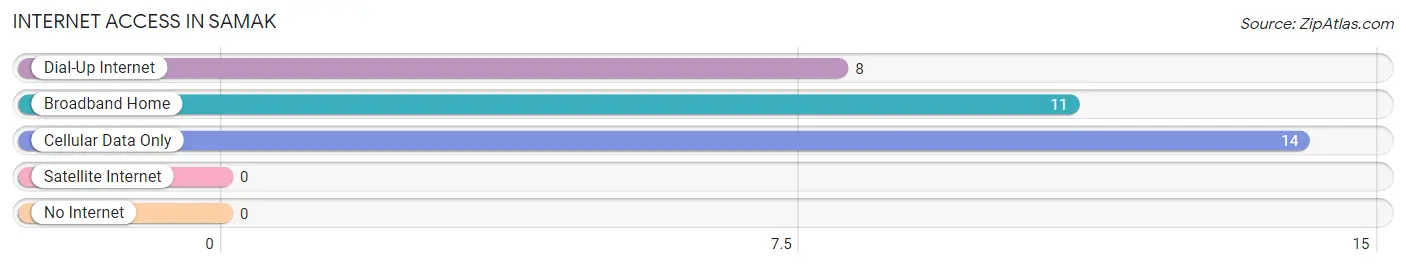
| Internet Type | # Households | % Households |
| Dial-Up Internet | 8 | 24.2% |
| Broadband Home | 11 | 33.3% |
| Cellular Data Only | 14 | 42.4% |
| Satellite Internet | 0 | 0.0% |
| No Internet | 0 | 0.0% |
| Total | 33 | 100.0% |
Samak Summary
Samak is a small unincorporated community located in the state of Utah in the United States. It is situated in the southeastern part of the state, in the Wasatch Mountains, and is part of the Salt Lake City metropolitan area. The population of Samak was estimated to be around 1,000 in 2020.
History
Samak was first settled in the late 1800s by Mormon pioneers. The town was named after a Native American chief who lived in the area. The town was originally a farming community, but it eventually grew to include a post office, a school, and a few stores.
In the early 1900s, Samak was a popular destination for tourists, who came to enjoy the area's natural beauty and outdoor activities. The town was also known for its mineral springs, which were believed to have healing properties.
Geography
Samak is located in the Wasatch Mountains, in the southeastern part of Utah. The town is situated at an elevation of 5,400 feet, and is surrounded by mountains and forests. The nearest major city is Salt Lake City, which is about 40 miles away.
The climate in Samak is semi-arid, with hot summers and cold winters. The average annual temperature is around 50 degrees Fahrenheit, and the average annual precipitation is around 12 inches.
Economy
The economy of Samak is largely based on tourism and outdoor recreation. The town is home to several ski resorts, as well as numerous hiking trails and camping sites. The town also has a few restaurants and stores, which cater to tourists and locals alike.
Demographics
The population of Samak was estimated to be around 1,000 in 2020. The town is predominantly white, with a small Hispanic population. The median household income is around $50,000, and the median home value is around $200,000.
Conclusion
Samak is a small unincorporated community located in the southeastern part of Utah. It was first settled in the late 1800s by Mormon pioneers, and is now a popular destination for tourists and outdoor enthusiasts. The town has a semi-arid climate, and its economy is largely based on tourism and outdoor recreation. The population of Samak was estimated to be around 1,000 in 2020, and the town is predominantly white, with a small Hispanic population.
Common Questions
What is the Total Population of Samak?
Total Population of Samak is 122.
What is the Total Male Population of Samak?
Total Male Population of Samak is 57.
What is the Total Female Population of Samak?
Total Female Population of Samak is 65.
What is the Ratio of Males per 100 Females in Samak?
There are 87.69 Males per 100 Females in Samak.
What is the Ratio of Females per 100 Males in Samak?
There are 114.04 Females per 100 Males in Samak.
What is the Median Population Age in Samak?
Median Population Age in Samak is 25.5 Years.
What is the Average Family Size in Samak
Average Family Size in Samak is 4.0 People.
What is the Average Household Size in Samak
Average Household Size in Samak is 3.7 People.
What is Per Capita Income in Samak?
Per Capita income in Samak is $36,211.
What is Inequality or Gini Index in Samak?
Inequality or Gini Index in Samak is 0.37.
How Large is the Labor Force in Samak?
There are 52 People in the Labor Forcein in Samak.
What is the Percentage of People in the Labor Force in Samak?
50.0% of People are in the Labor Force in Samak.
What is the Unemployment Rate in Samak?
Unemployment Rate in Samak is 17.3%.