Monticello, UT
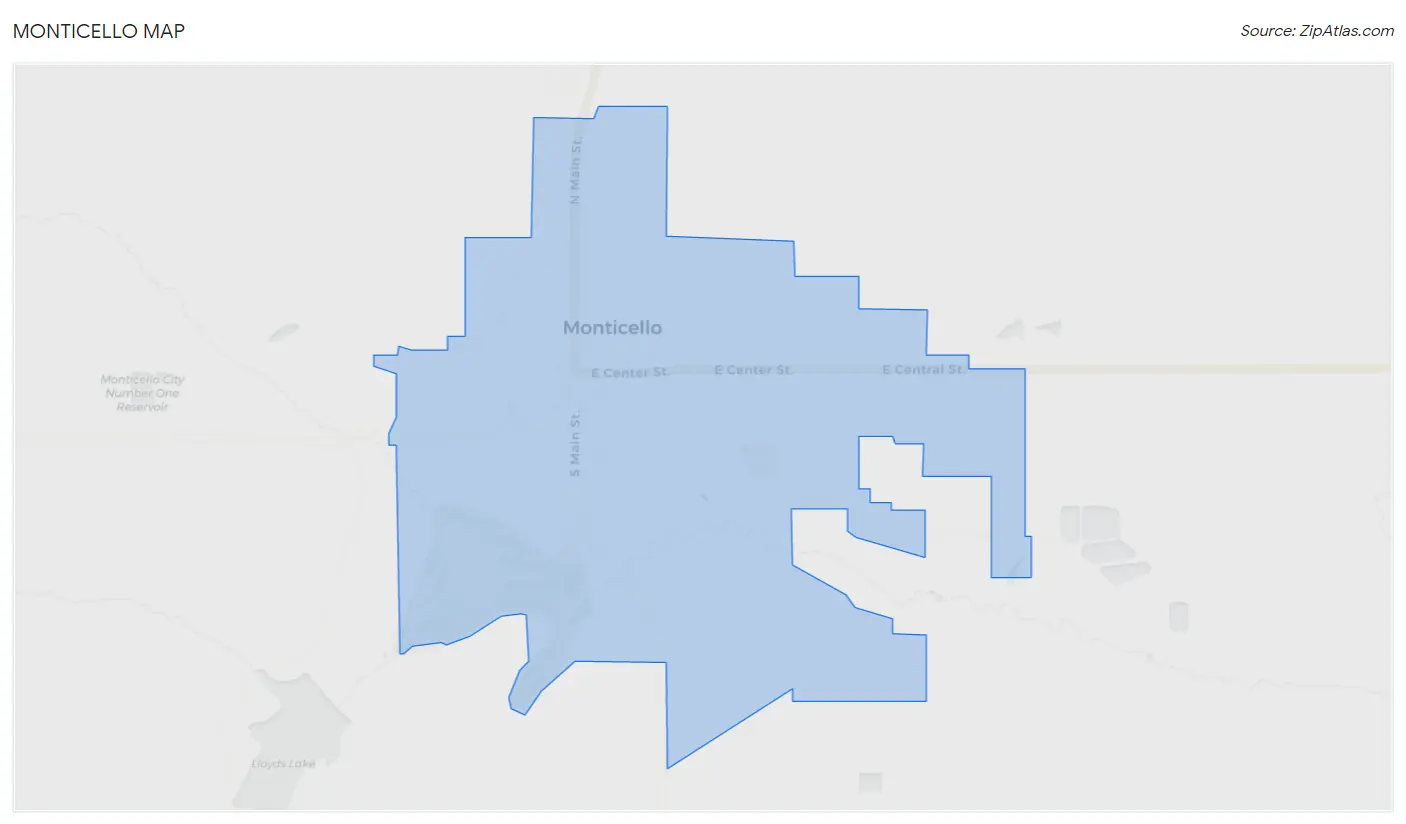
Monticello Map
Monticello Overview
2,393
TOTAL POPULATION
1,222
MALE POPULATION
1,171
FEMALE POPULATION
104.36
MALES / 100 FEMALES
95.83
FEMALES / 100 MALES
29.9
MEDIAN AGE
3.6
AVG FAMILY SIZE
3.1
AVG HOUSEHOLD SIZE
$26,860
PER CAPITA INCOME
$83,043
AVG FAMILY INCOME
$71,833
AVG HOUSEHOLD INCOME
74.2%
WAGE / INCOME GAP [ % ]
25.8¢/ $1
WAGE / INCOME GAP [ $ ]
0.32
INEQUALITY / GINI INDEX
808
LABOR FORCE [ PEOPLE ]
47.0%
PERCENT IN LABOR FORCE
Monticello Zip Codes
Monticello Area Codes
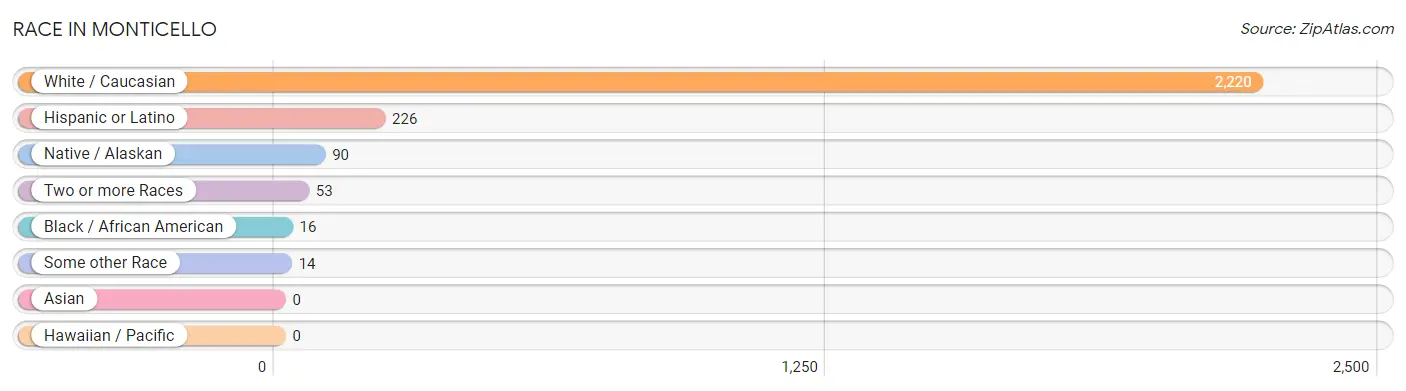
Race in Monticello
The most populous races in Monticello are White / Caucasian (2,220 | 92.8%), Hispanic or Latino (226 | 9.4%), and Native / Alaskan (90 | 3.8%).
| Race | # Population | % Population |
| Asian | 0 | 0.0% |
| Black / African American | 16 | 0.7% |
| Hawaiian / Pacific | 0 | 0.0% |
| Hispanic or Latino | 226 | 9.4% |
| Native / Alaskan | 90 | 3.8% |
| White / Caucasian | 2,220 | 92.8% |
| Two or more Races | 53 | 2.2% |
| Some other Race | 14 | 0.6% |
| Total | 2,393 | 100.0% |
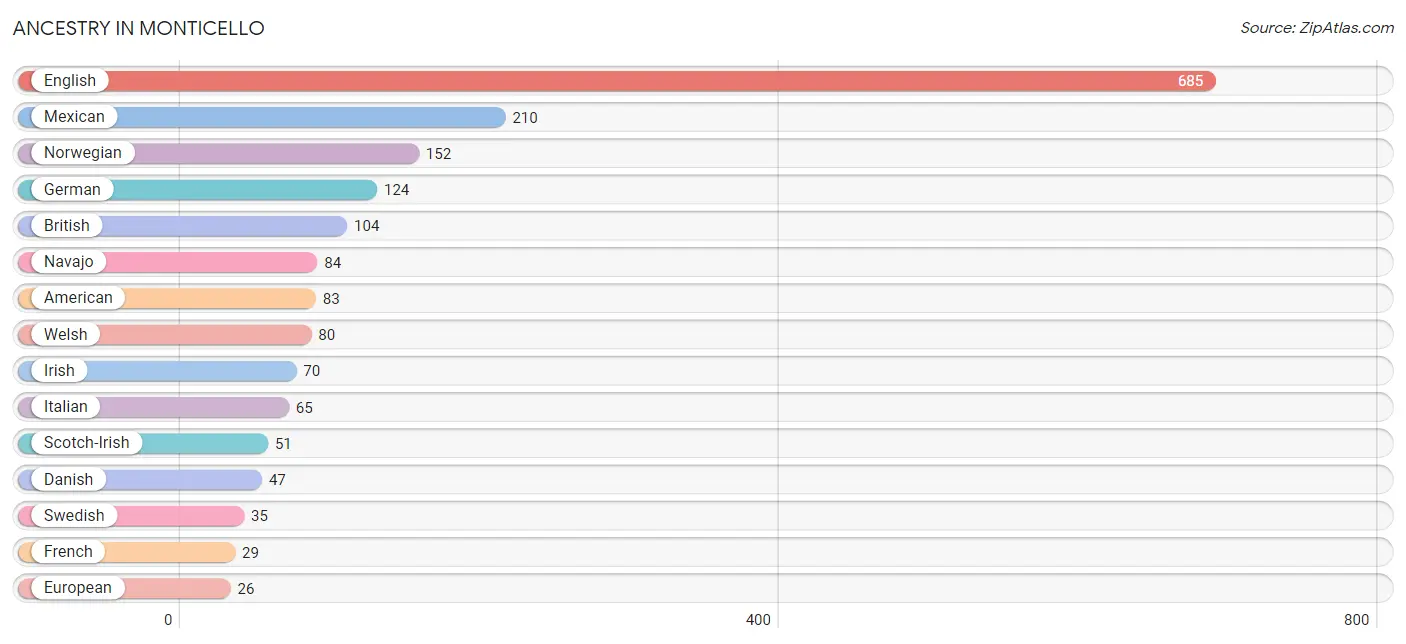
Ancestry in Monticello
The most populous ancestries reported in Monticello are English (685 | 28.6%), Mexican (210 | 8.8%), Norwegian (152 | 6.4%), German (124 | 5.2%), and British (104 | 4.3%), together accounting for 53.3% of all Monticello residents.
| Ancestry | # Population | % Population |
| American | 83 | 3.5% |
| British | 104 | 4.3% |
| Central American | 6 | 0.3% |
| Danish | 47 | 2.0% |
| Dutch | 20 | 0.8% |
| English | 685 | 28.6% |
| European | 26 | 1.1% |
| French | 29 | 1.2% |
| German | 124 | 5.2% |
| Irish | 70 | 2.9% |
| Italian | 65 | 2.7% |
| Mexican | 210 | 8.8% |
| Navajo | 84 | 3.5% |
| Norwegian | 152 | 6.4% |
| Paiute | 6 | 0.3% |
| Polish | 4 | 0.2% |
| Salvadoran | 6 | 0.3% |
| Scotch-Irish | 51 | 2.1% |
| Scottish | 23 | 1.0% |
| Spaniard | 9 | 0.4% |
| Swedish | 35 | 1.5% |
| Ute | 16 | 0.7% |
| Welsh | 80 | 3.3% | View All 23 Rows |
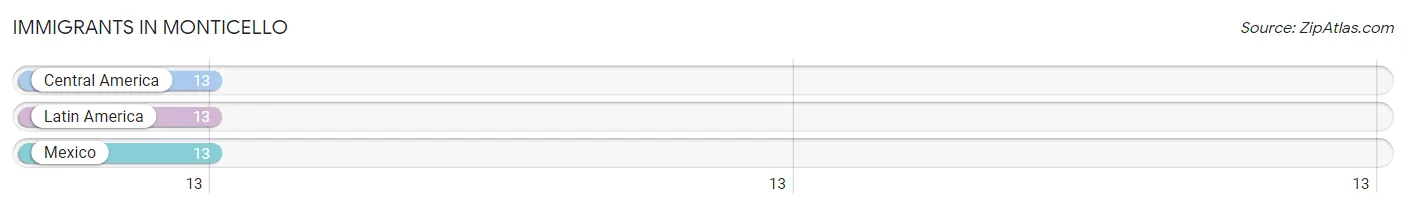
Immigrants in Monticello
The most numerous immigrant groups reported in Monticello came from Central America (13 | 0.5%), Latin America (13 | 0.5%), and Mexico (13 | 0.5%), together accounting for 1.6% of all Monticello residents.
| Immigration Origin | # Population | % Population |
| Central America | 13 | 0.5% |
| Latin America | 13 | 0.5% |
| Mexico | 13 | 0.5% | View All 3 Rows |
Sex and Age in Monticello
Sex and Age in Monticello
The most populous age groups in Monticello are 25 to 29 Years (174 | 14.2%) for men and 5 to 9 Years (175 | 14.9%) for women.
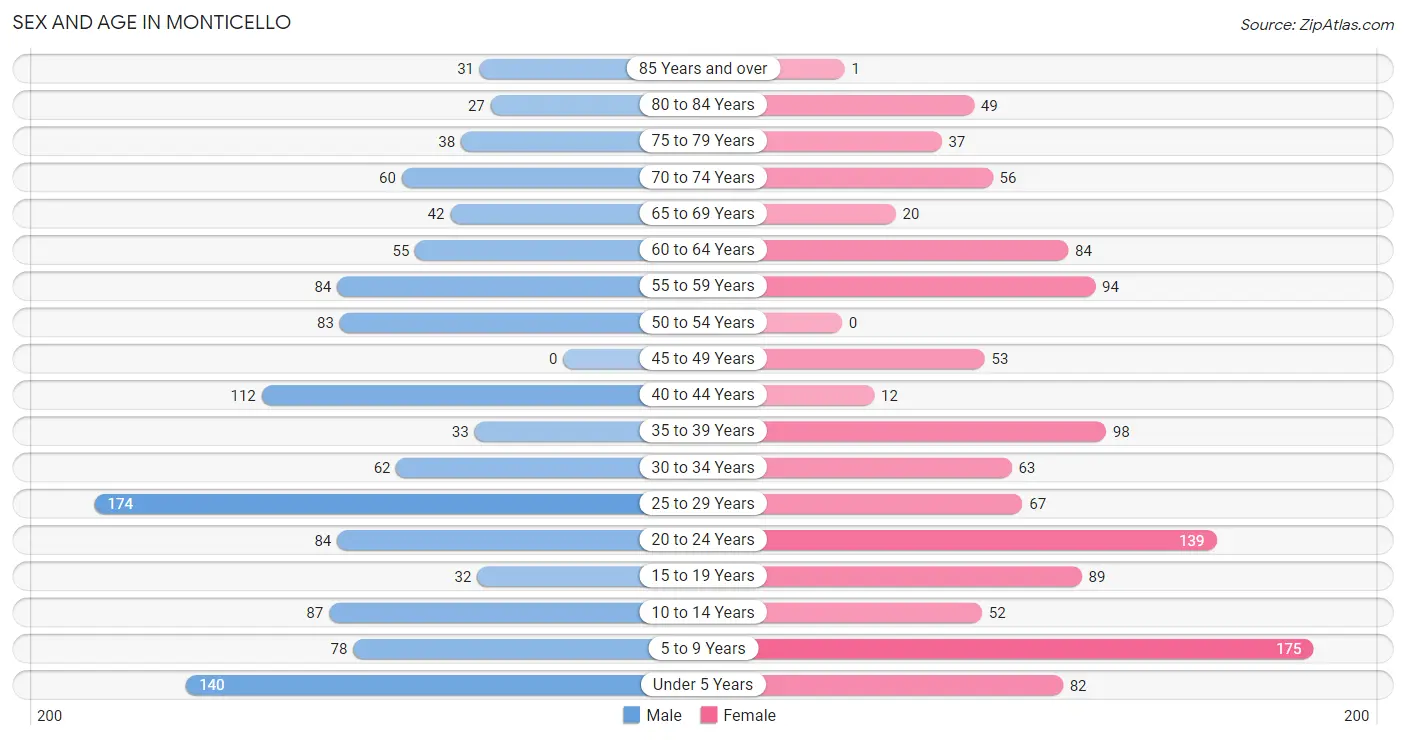
| Age Bracket | Male | Female |
| Under 5 Years | 140 (11.5%) | 82 (7.0%) |
| 5 to 9 Years | 78 (6.4%) | 175 (14.9%) |
| 10 to 14 Years | 87 (7.1%) | 52 (4.4%) |
| 15 to 19 Years | 32 (2.6%) | 89 (7.6%) |
| 20 to 24 Years | 84 (6.9%) | 139 (11.9%) |
| 25 to 29 Years | 174 (14.2%) | 67 (5.7%) |
| 30 to 34 Years | 62 (5.1%) | 63 (5.4%) |
| 35 to 39 Years | 33 (2.7%) | 98 (8.4%) |
| 40 to 44 Years | 112 (9.2%) | 12 (1.0%) |
| 45 to 49 Years | 0 (0.0%) | 53 (4.5%) |
| 50 to 54 Years | 83 (6.8%) | 0 (0.0%) |
| 55 to 59 Years | 84 (6.9%) | 94 (8.0%) |
| 60 to 64 Years | 55 (4.5%) | 84 (7.2%) |
| 65 to 69 Years | 42 (3.4%) | 20 (1.7%) |
| 70 to 74 Years | 60 (4.9%) | 56 (4.8%) |
| 75 to 79 Years | 38 (3.1%) | 37 (3.2%) |
| 80 to 84 Years | 27 (2.2%) | 49 (4.2%) |
| 85 Years and over | 31 (2.5%) | 1 (0.1%) |
| Total | 1,222 (100.0%) | 1,171 (100.0%) |
Families and Households in Monticello
Median Family Size in Monticello
The median family size in Monticello is 3.56 persons per family, with single female/mother families (34 | 5.7%) accounting for the largest median family size of 4.12 persons per family. On the other hand, single male/father families (21 | 3.5%) represent the smallest median family size with 1.76 persons per family.
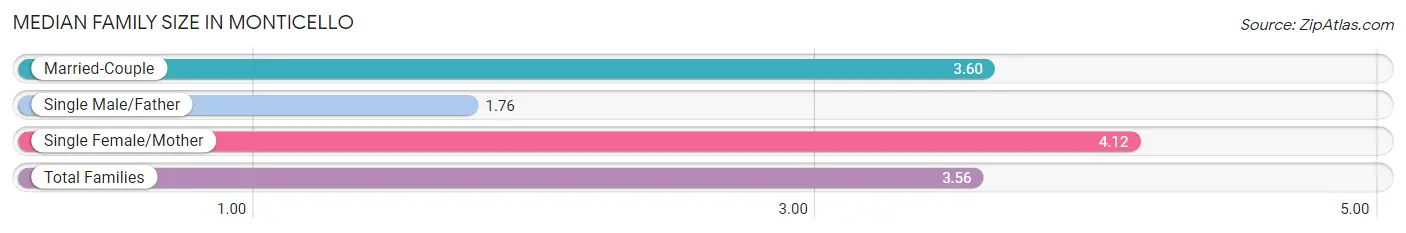
| Family Type | # Families | Family Size |
| Married-Couple | 537 (90.7%) | 3.60 |
| Single Male/Father | 21 (3.5%) | 1.76 |
| Single Female/Mother | 34 (5.7%) | 4.12 |
| Total Families | 592 (100.0%) | 3.56 |
Median Household Size in Monticello
The median household size in Monticello is 3.13 persons per household, with single female/mother households (34 | 4.7%) accounting for the largest median household size of 4.12 persons per household. non-family households (126 | 17.5%) represent the smallest median household size with 1.09 persons per household.
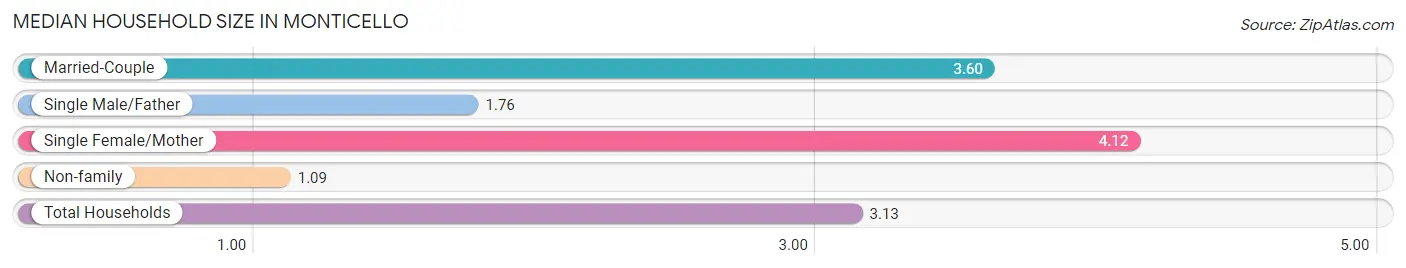
| Household Type | # Households | Household Size |
| Married-Couple | 537 (74.8%) | 3.60 |
| Single Male/Father | 21 (2.9%) | 1.76 |
| Single Female/Mother | 34 (4.7%) | 4.12 |
| Non-family | 126 (17.5%) | 1.09 |
| Total Households | 718 (100.0%) | 3.13 |
Household Size by Marriage Status in Monticello
Out of a total of 718 households in Monticello, 592 (82.5%) are family households, while 126 (17.5%) are nonfamily households. The most numerous type of family households are 2-person households, comprising 264, and the most common type of nonfamily households are 1-person households, comprising 114.

| Household Size | Family Households | Nonfamily Households |
| 1-Person Households | - | 114 (15.9%) |
| 2-Person Households | 264 (36.8%) | 12 (1.7%) |
| 3-Person Households | 41 (5.7%) | 0 (0.0%) |
| 4-Person Households | 154 (21.4%) | 0 (0.0%) |
| 5-Person Households | 73 (10.2%) | 0 (0.0%) |
| 6-Person Households | 54 (7.5%) | 0 (0.0%) |
| 7+ Person Households | 6 (0.8%) | 0 (0.0%) |
| Total | 592 (82.5%) | 126 (17.5%) |
Female Fertility in Monticello
Fertility by Age in Monticello
Average fertility rate in Monticello is 119.0 births per 1,000 women. Women in the age bracket of 35 to 50 years have the highest fertility rate with 202.0 births per 1,000 women. Women in the age bracket of 35 to 50 years acount for 53.2% of all women with births.
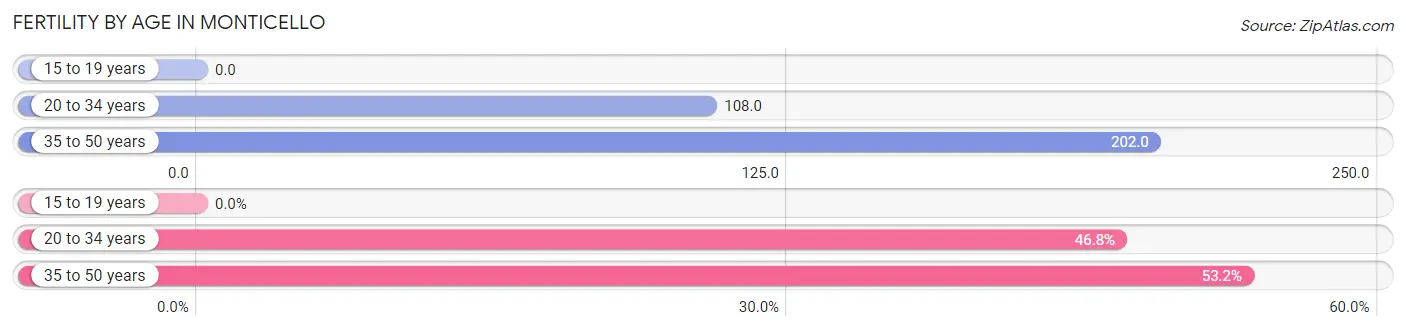
| Age Bracket | Women with Births | Births / 1,000 Women |
| 15 to 19 years | 0 (0.0%) | 0.0 |
| 20 to 34 years | 29 (46.8%) | 108.0 |
| 35 to 50 years | 33 (53.2%) | 202.0 |
| Total | 62 (100.0%) | 119.0 |
Fertility by Age by Marriage Status in Monticello
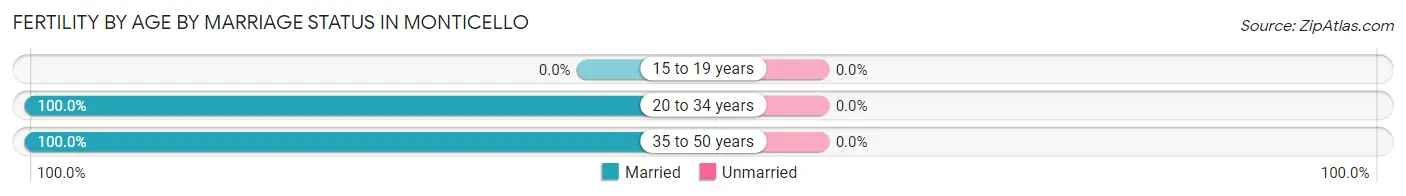
| Age Bracket | Married | Unmarried |
| 15 to 19 years | 0 (0.0%) | 0 (0.0%) |
| 20 to 34 years | 29 (100.0%) | 0 (0.0%) |
| 35 to 50 years | 33 (100.0%) | 0 (0.0%) |
| Total | 62 (100.0%) | 0 (0.0%) |
Fertility by Education in Monticello
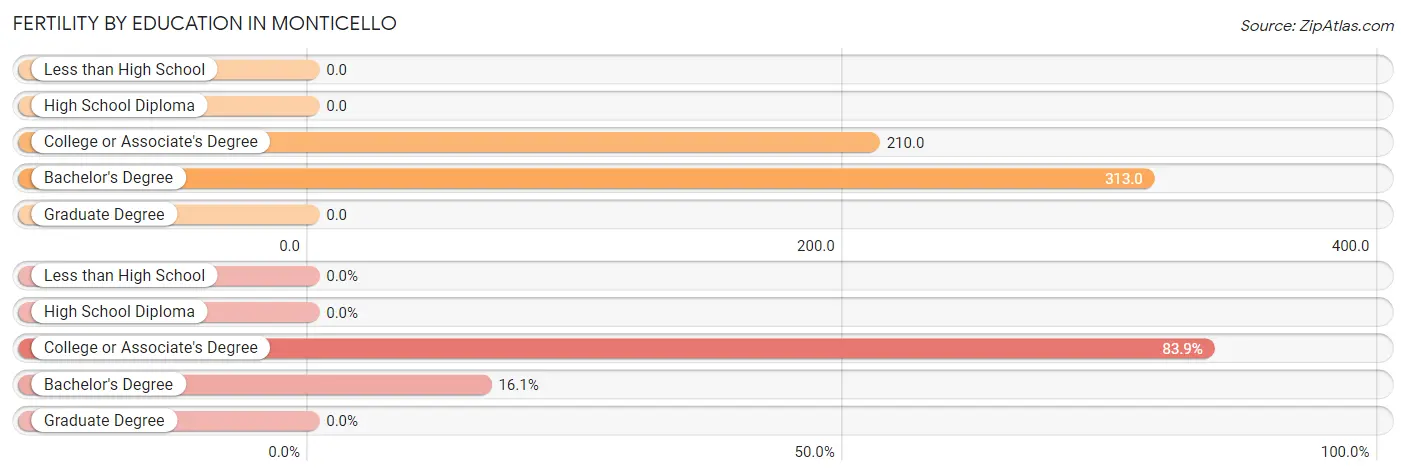
| Educational Attainment | Women with Births | Births / 1,000 Women |
| Less than High School | 0 (0.0%) | 0.0 |
| High School Diploma | 0 (0.0%) | 0.0 |
| College or Associate's Degree | 52 (83.9%) | 210.0 |
| Bachelor's Degree | 10 (16.1%) | 313.0 |
| Graduate Degree | 0 (0.0%) | 0.0 |
| Total | 62 (100.0%) | 119.0 |
Fertility by Education by Marriage Status in Monticello
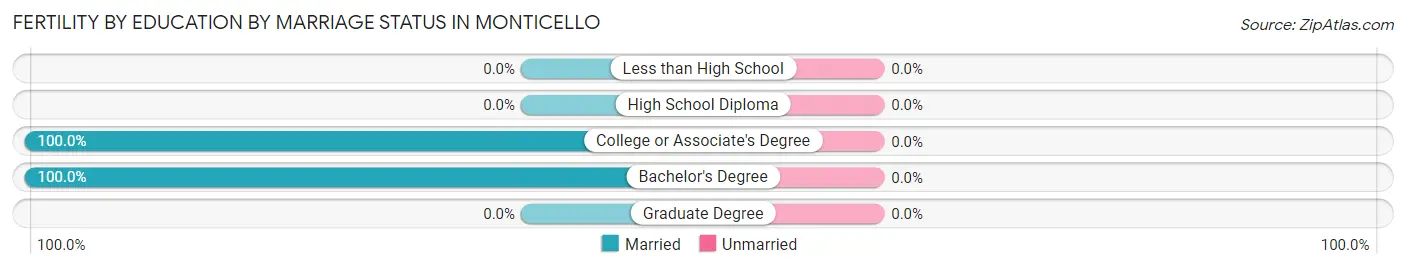
| Educational Attainment | Married | Unmarried |
| Less than High School | 0 (0.0%) | 0 (0.0%) |
| High School Diploma | 0 (0.0%) | 0 (0.0%) |
| College or Associate's Degree | 52 (100.0%) | 0 (0.0%) |
| Bachelor's Degree | 10 (100.0%) | 0 (0.0%) |
| Graduate Degree | 0 (0.0%) | 0 (0.0%) |
| Total | 62 (100.0%) | 0 (0.0%) |
Income in Monticello
Income Overview in Monticello
Per Capita Income in Monticello is $26,860, while median incomes of families and households are $83,043 and $71,833 respectively.
| Characteristic | Number | Measure |
| Per Capita Income | 2,393 | $26,860 |
| Median Family Income | 592 | $83,043 |
| Mean Family Income | 592 | $88,187 |
| Median Household Income | 718 | $71,833 |
| Mean Household Income | 718 | $77,576 |
| Income Deficit | 592 | $0 |
| Wage / Income Gap (%) | 2,393 | 74.21% |
| Wage / Income Gap ($) | 2,393 | 25.79¢ per $1 |
| Gini / Inequality Index | 2,393 | 0.32 |
Earnings by Sex in Monticello
Average Earnings in Monticello are $32,902, $56,316 for men and $14,525 for women, a difference of 74.2%.
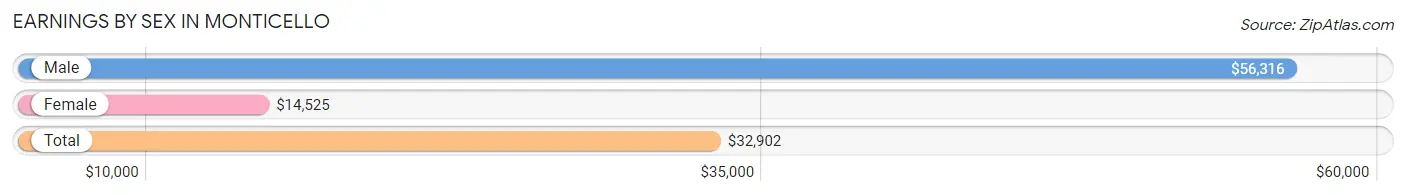
| Sex | Number | Average Earnings |
| Male | 560 (53.4%) | $56,316 |
| Female | 489 (46.6%) | $14,525 |
| Total | 1,049 (100.0%) | $32,902 |
Earnings by Sex by Income Bracket in Monticello
The most common earnings brackets in Monticello are $100,000+ for men (91 | 16.3%) and $5,000 to $7,499 for women (101 | 20.6%).
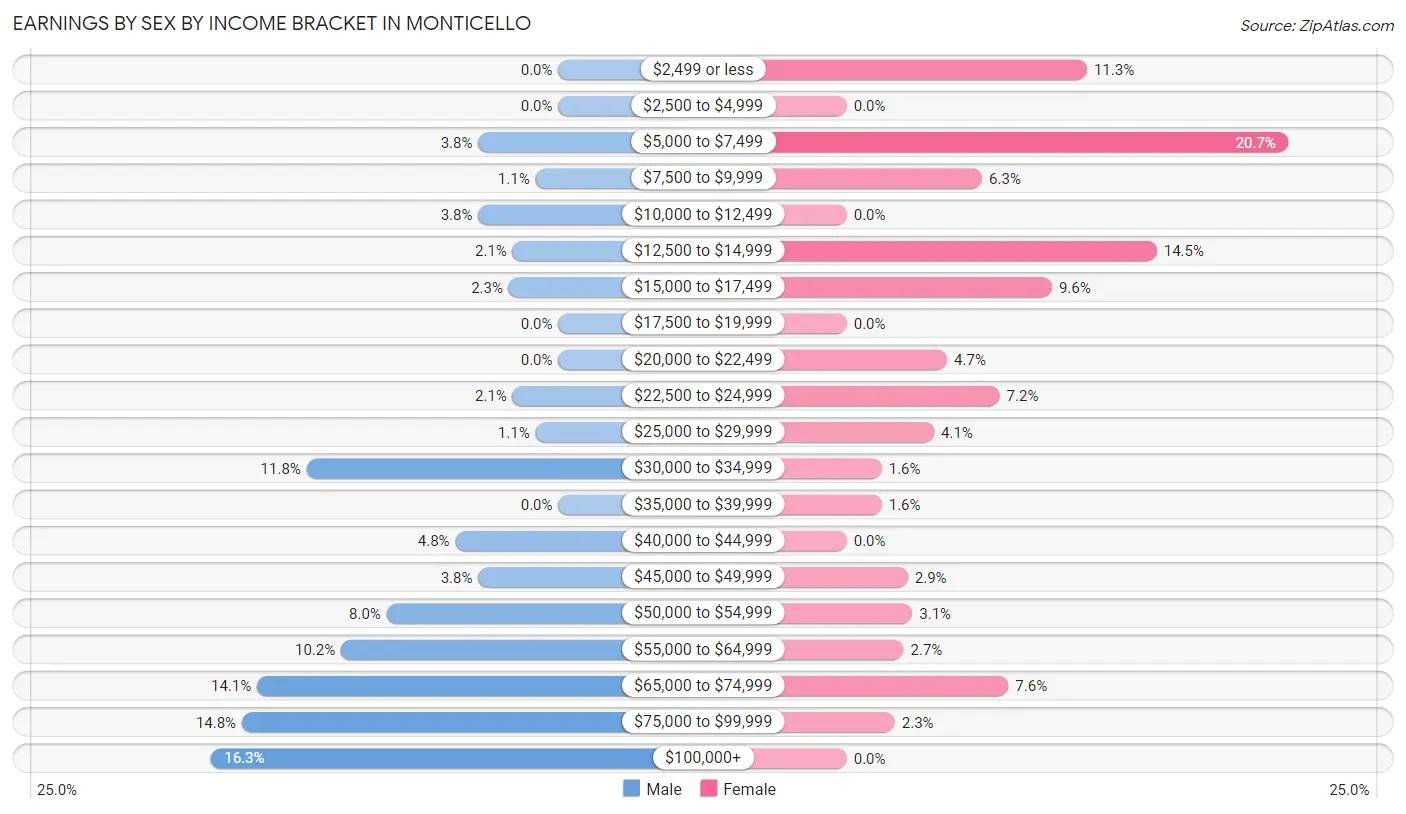
| Income | Male | Female |
| $2,499 or less | 0 (0.0%) | 55 (11.3%) |
| $2,500 to $4,999 | 0 (0.0%) | 0 (0.0%) |
| $5,000 to $7,499 | 21 (3.7%) | 101 (20.6%) |
| $7,500 to $9,999 | 6 (1.1%) | 31 (6.3%) |
| $10,000 to $12,499 | 21 (3.7%) | 0 (0.0%) |
| $12,500 to $14,999 | 12 (2.1%) | 71 (14.5%) |
| $15,000 to $17,499 | 13 (2.3%) | 47 (9.6%) |
| $17,500 to $19,999 | 0 (0.0%) | 0 (0.0%) |
| $20,000 to $22,499 | 0 (0.0%) | 23 (4.7%) |
| $22,500 to $24,999 | 12 (2.1%) | 35 (7.2%) |
| $25,000 to $29,999 | 6 (1.1%) | 20 (4.1%) |
| $30,000 to $34,999 | 66 (11.8%) | 8 (1.6%) |
| $35,000 to $39,999 | 0 (0.0%) | 8 (1.6%) |
| $40,000 to $44,999 | 27 (4.8%) | 0 (0.0%) |
| $45,000 to $49,999 | 21 (3.7%) | 14 (2.9%) |
| $50,000 to $54,999 | 45 (8.0%) | 15 (3.1%) |
| $55,000 to $64,999 | 57 (10.2%) | 13 (2.7%) |
| $65,000 to $74,999 | 79 (14.1%) | 37 (7.6%) |
| $75,000 to $99,999 | 83 (14.8%) | 11 (2.2%) |
| $100,000+ | 91 (16.3%) | 0 (0.0%) |
| Total | 560 (100.0%) | 489 (100.0%) |
Earnings by Sex by Educational Attainment in Monticello
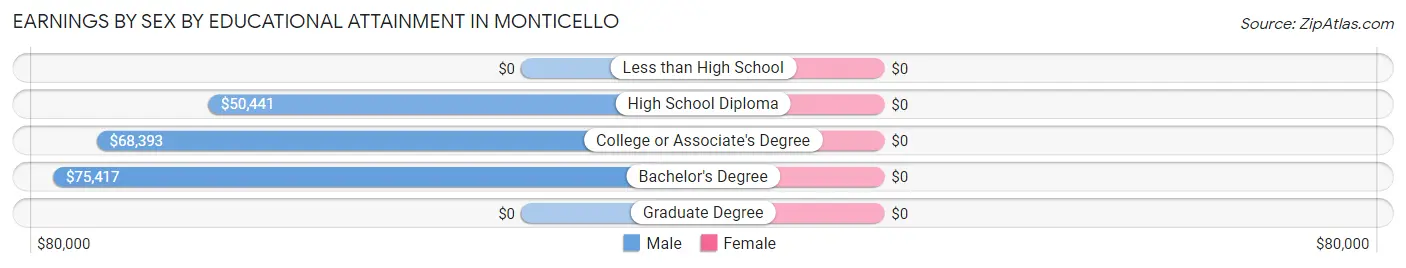
| Educational Attainment | Male Income | Female Income |
| Less than High School | - | - |
| High School Diploma | $50,441 | $0 |
| College or Associate's Degree | $68,393 | $0 |
| Bachelor's Degree | $75,417 | $0 |
| Graduate Degree | - | - |
| Total | $57,193 | $21,848 |
Family Income in Monticello
Family Income Brackets in Monticello
According to the Monticello family income data, there are 187 families falling into the $50,000 to $74,999 income range, which is the most common income bracket and makes up 31.6% of all families.

| Income Bracket | # Families | % Families |
| Less than $10,000 | 0 | 0.0% |
| $10,000 to $14,999 | 0 | 0.0% |
| $15,000 to $24,999 | 12 | 2.0% |
| $25,000 to $34,999 | 34 | 5.7% |
| $35,000 to $49,999 | 31 | 5.2% |
| $50,000 to $74,999 | 187 | 31.6% |
| $75,000 to $99,999 | 162 | 27.4% |
| $100,000 to $149,999 | 99 | 16.7% |
| $150,000 to $199,999 | 67 | 11.3% |
| $200,000+ | 0 | 0.0% |
Family Income by Famaliy Size in Monticello
5-person families (73 | 12.3%) account for the highest median family income in Monticello with $95,813 per family, while 2-person families (264 | 44.6%) have the highest median income of $37,268 per family member.
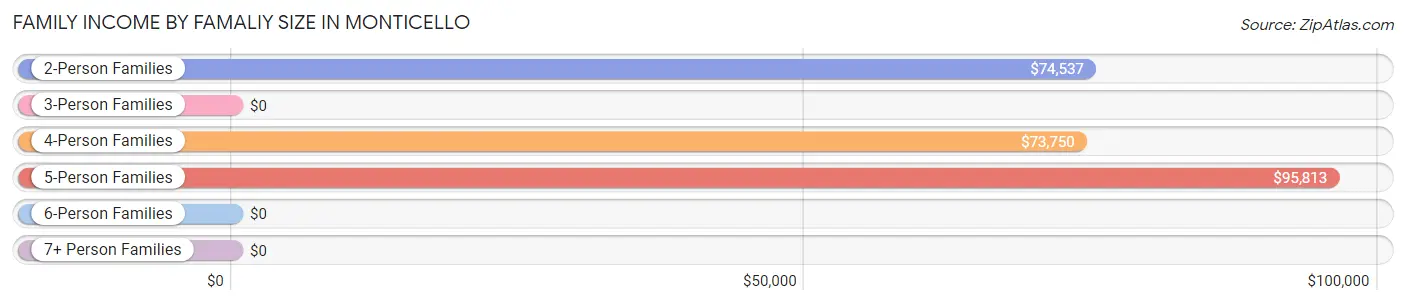
| Income Bracket | # Families | Median Income |
| 2-Person Families | 264 (44.6%) | $74,537 |
| 3-Person Families | 41 (6.9%) | $0 |
| 4-Person Families | 154 (26.0%) | $73,750 |
| 5-Person Families | 73 (12.3%) | $95,813 |
| 6-Person Families | 54 (9.1%) | $0 |
| 7+ Person Families | 6 (1.0%) | $0 |
| Total | 592 (100.0%) | $83,043 |
Family Income by Number of Earners in Monticello
The median family income in Monticello is $83,043, with families comprising 3+ earners (44) having the highest median family income of $189,239, while families with 1 earner (220) have the lowest median family income of $62,031, accounting for 7.4% and 37.2% of families, respectively.
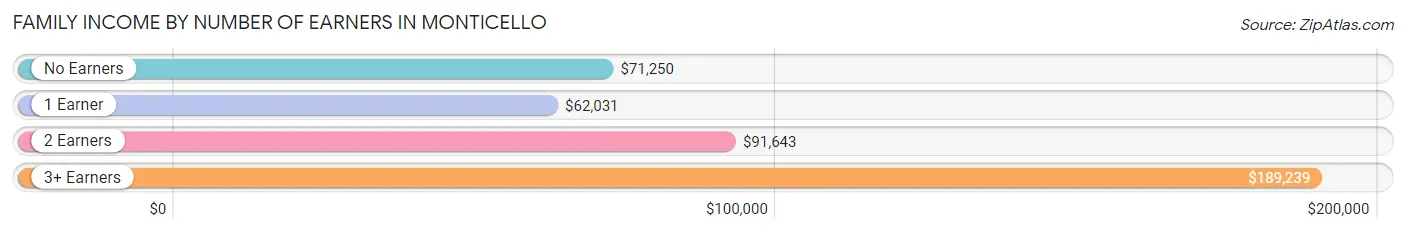
| Number of Earners | # Families | Median Income |
| No Earners | 106 (17.9%) | $71,250 |
| 1 Earner | 220 (37.2%) | $62,031 |
| 2 Earners | 222 (37.5%) | $91,643 |
| 3+ Earners | 44 (7.4%) | $189,239 |
| Total | 592 (100.0%) | $83,043 |
Household Income in Monticello
Household Income Brackets in Monticello
With 230 households falling in the category, the $50,000 to $74,999 income range is the most frequent in Monticello, accounting for 32.0% of all households.
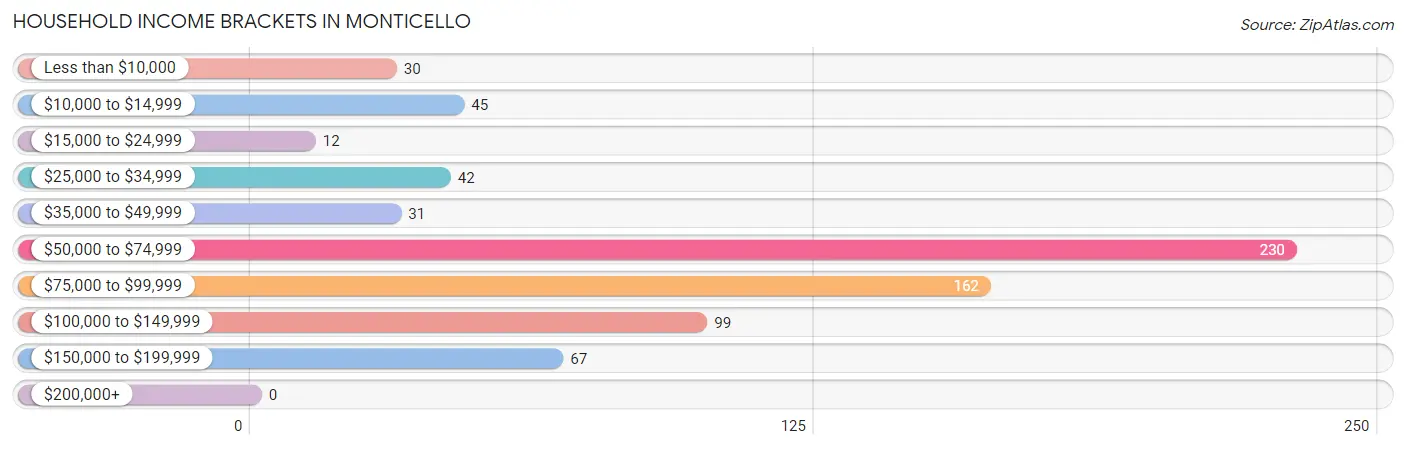
| Income Bracket | # Households | % Households |
| Less than $10,000 | 30 | 4.2% |
| $10,000 to $14,999 | 45 | 6.3% |
| $15,000 to $24,999 | 12 | 1.7% |
| $25,000 to $34,999 | 42 | 5.8% |
| $35,000 to $49,999 | 31 | 4.3% |
| $50,000 to $74,999 | 230 | 32.0% |
| $75,000 to $99,999 | 162 | 22.6% |
| $100,000 to $149,999 | 99 | 13.8% |
| $150,000 to $199,999 | 67 | 9.3% |
| $200,000+ | 0 | 0.0% |
Household Income by Householder Age in Monticello
The median household income in Monticello is $71,833, with the highest median household income of $99,196 found in the 45 to 64 years age bracket for the primary householder. A total of 207 households (28.8%) fall into this category. Meanwhile, the 15 to 24 years age bracket for the primary householder has the lowest median household income of $0, with 42 households (5.9%) in this group.
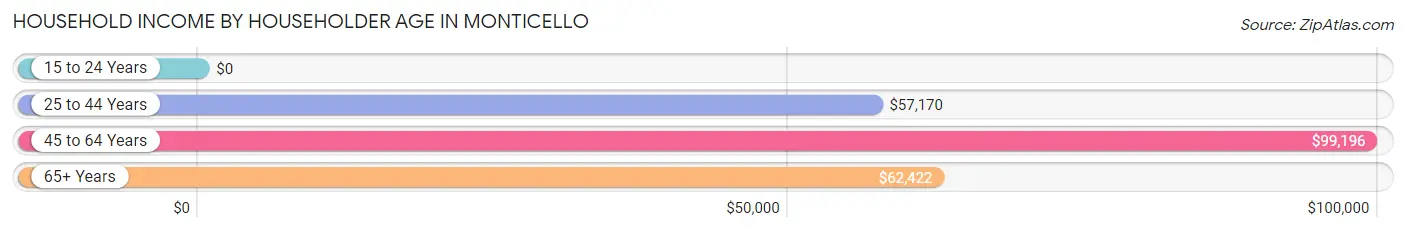
| Income Bracket | # Households | Median Income |
| 15 to 24 Years | 42 (5.9%) | $0 |
| 25 to 44 Years | 270 (37.6%) | $57,170 |
| 45 to 64 Years | 207 (28.8%) | $99,196 |
| 65+ Years | 199 (27.7%) | $62,422 |
| Total | 718 (100.0%) | $71,833 |
Poverty in Monticello
Income Below Poverty by Sex and Age in Monticello
With 8.0% poverty level for males and 2.0% for females among the residents of Monticello, 75 year old and over males and 65 to 74 year old females are the most vulnerable to poverty, with 30 males (31.2%) and 11 females (14.5%) in their respective age groups living below the poverty level.
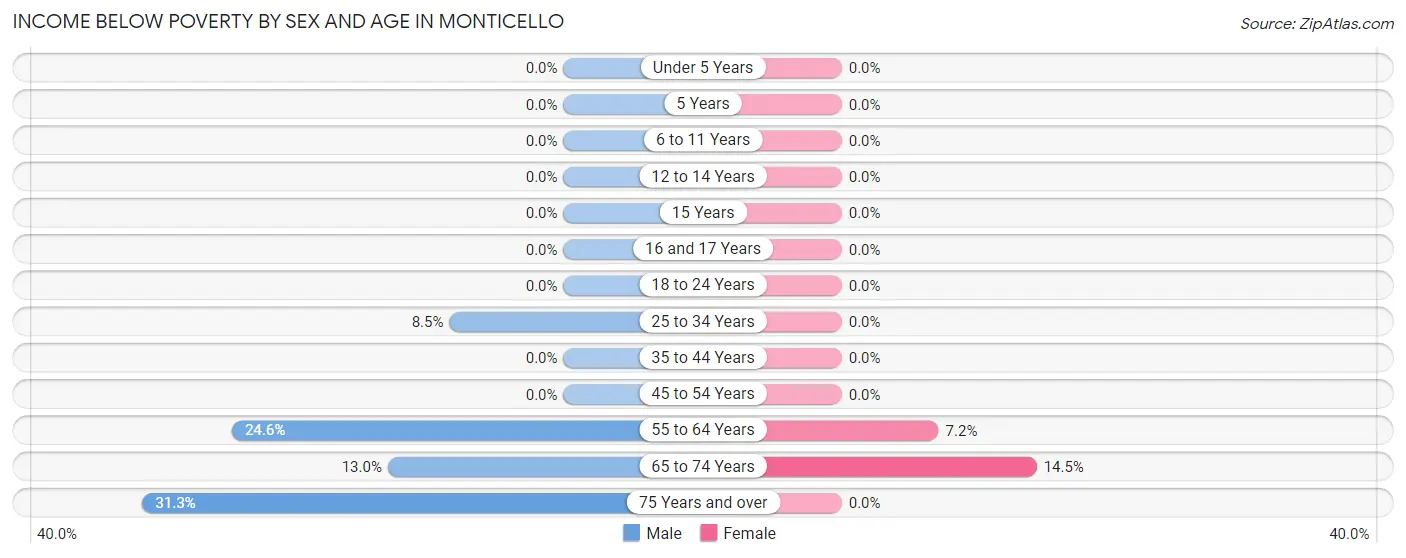
| Age Bracket | Male | Female |
| Under 5 Years | 0 (0.0%) | 0 (0.0%) |
| 5 Years | 0 (0.0%) | 0 (0.0%) |
| 6 to 11 Years | 0 (0.0%) | 0 (0.0%) |
| 12 to 14 Years | 0 (0.0%) | 0 (0.0%) |
| 15 Years | 0 (0.0%) | 0 (0.0%) |
| 16 and 17 Years | 0 (0.0%) | 0 (0.0%) |
| 18 to 24 Years | 0 (0.0%) | 0 (0.0%) |
| 25 to 34 Years | 15 (8.5%) | 0 (0.0%) |
| 35 to 44 Years | 0 (0.0%) | 0 (0.0%) |
| 45 to 54 Years | 0 (0.0%) | 0 (0.0%) |
| 55 to 64 Years | 31 (24.6%) | 12 (7.2%) |
| 65 to 74 Years | 12 (13.0%) | 11 (14.5%) |
| 75 Years and over | 30 (31.2%) | 0 (0.0%) |
| Total | 88 (8.0%) | 23 (2.0%) |
Income Above Poverty by Sex and Age in Monticello
According to the poverty statistics in Monticello, males aged under 5 years and females aged under 5 years are the age groups that are most secure financially, with 100.0% of males and 100.0% of females in these age groups living above the poverty line.
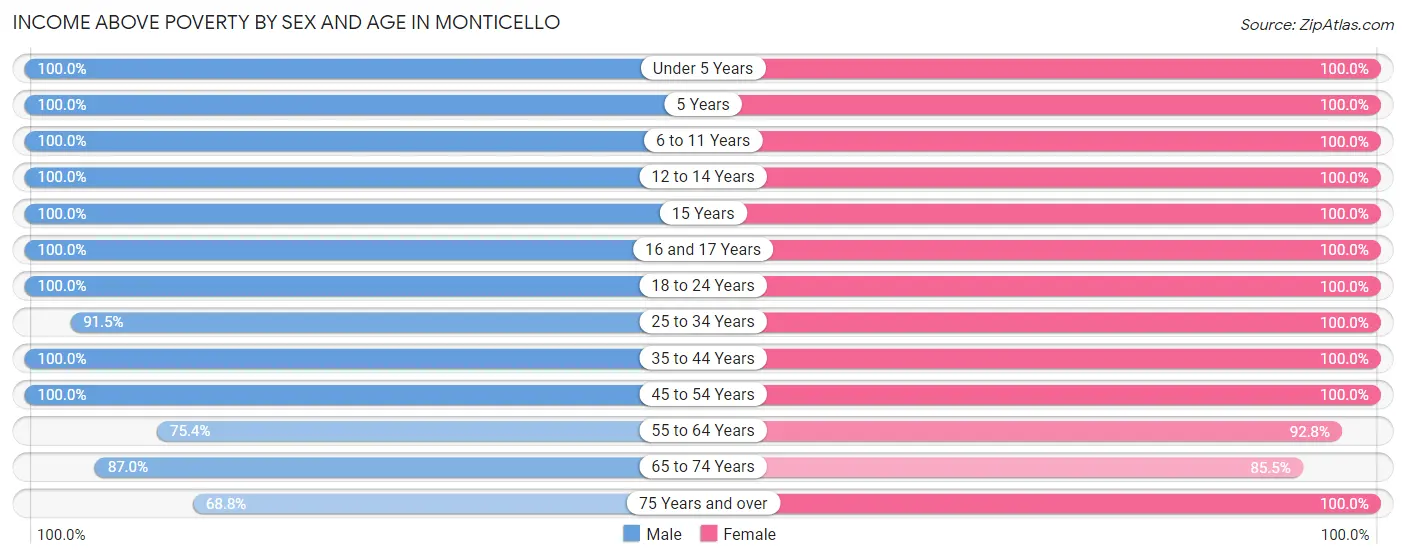
| Age Bracket | Male | Female |
| Under 5 Years | 140 (100.0%) | 82 (100.0%) |
| 5 Years | 29 (100.0%) | 30 (100.0%) |
| 6 to 11 Years | 68 (100.0%) | 179 (100.0%) |
| 12 to 14 Years | 68 (100.0%) | 18 (100.0%) |
| 15 Years | 27 (100.0%) | 29 (100.0%) |
| 16 and 17 Years | 3 (100.0%) | 22 (100.0%) |
| 18 to 24 Years | 73 (100.0%) | 173 (100.0%) |
| 25 to 34 Years | 162 (91.5%) | 130 (100.0%) |
| 35 to 44 Years | 116 (100.0%) | 110 (100.0%) |
| 45 to 54 Years | 83 (100.0%) | 53 (100.0%) |
| 55 to 64 Years | 95 (75.4%) | 155 (92.8%) |
| 65 to 74 Years | 80 (87.0%) | 65 (85.5%) |
| 75 Years and over | 66 (68.8%) | 80 (100.0%) |
| Total | 1,010 (92.0%) | 1,126 (98.0%) |
Income Below Poverty Among Married-Couple Families in Monticello
The poverty statistics for married-couple families in Monticello show that 2.2% or 12 of the total 537 families live below the poverty line. Families with no children have the highest poverty rate of 3.7%, comprising of 12 families. On the other hand, families with 1 or 2 children have the lowest poverty rate of 0.0%, which includes 0 families.
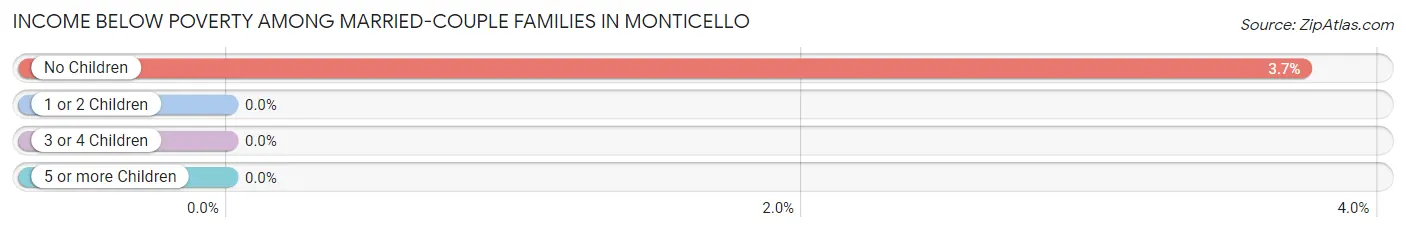
| Children | Above Poverty | Below Poverty |
| No Children | 309 (96.3%) | 12 (3.7%) |
| 1 or 2 Children | 127 (100.0%) | 0 (0.0%) |
| 3 or 4 Children | 89 (100.0%) | 0 (0.0%) |
| 5 or more Children | 0 (0.0%) | 0 (0.0%) |
| Total | 525 (97.8%) | 12 (2.2%) |
Income Below Poverty Among Single-Parent Households in Monticello
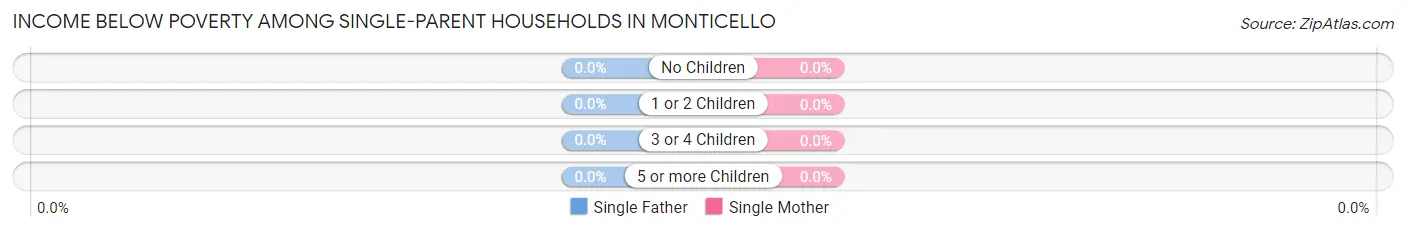
| Children | Single Father | Single Mother |
| No Children | 0 (0.0%) | 0 (0.0%) |
| 1 or 2 Children | 0 (0.0%) | 0 (0.0%) |
| 3 or 4 Children | 0 (0.0%) | 0 (0.0%) |
| 5 or more Children | 0 (0.0%) | 0 (0.0%) |
| Total | 0 (0.0%) | 0 (0.0%) |
Income Below Poverty Among Married-Couple vs Single-Parent Households in Monticello
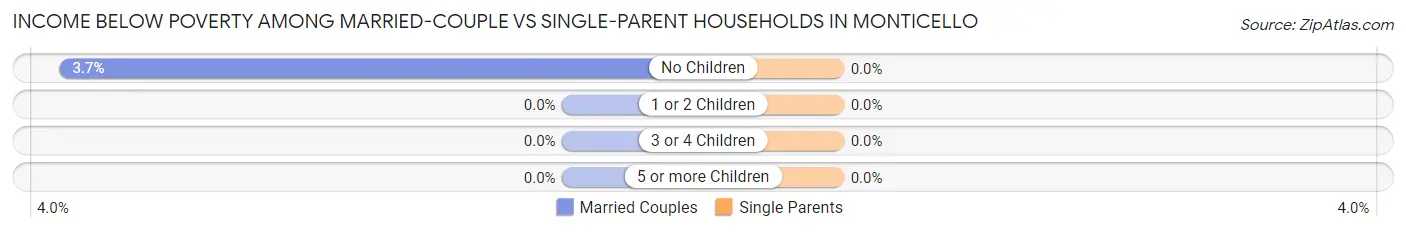
| Children | Married-Couple Families | Single-Parent Households |
| No Children | 12 (3.7%) | 0 (0.0%) |
| 1 or 2 Children | 0 (0.0%) | 0 (0.0%) |
| 3 or 4 Children | 0 (0.0%) | 0 (0.0%) |
| 5 or more Children | 0 (0.0%) | 0 (0.0%) |
| Total | 12 (2.2%) | 0 (0.0%) |
Employment Characteristics in Monticello
Employment by Class of Employer in Monticello
Among the 809 employed individuals in Monticello, private company employees (428 | 52.9%), local government employees (191 | 23.6%), and self-employed (not incorporated) (128 | 15.8%) make up the most common classes of employment.
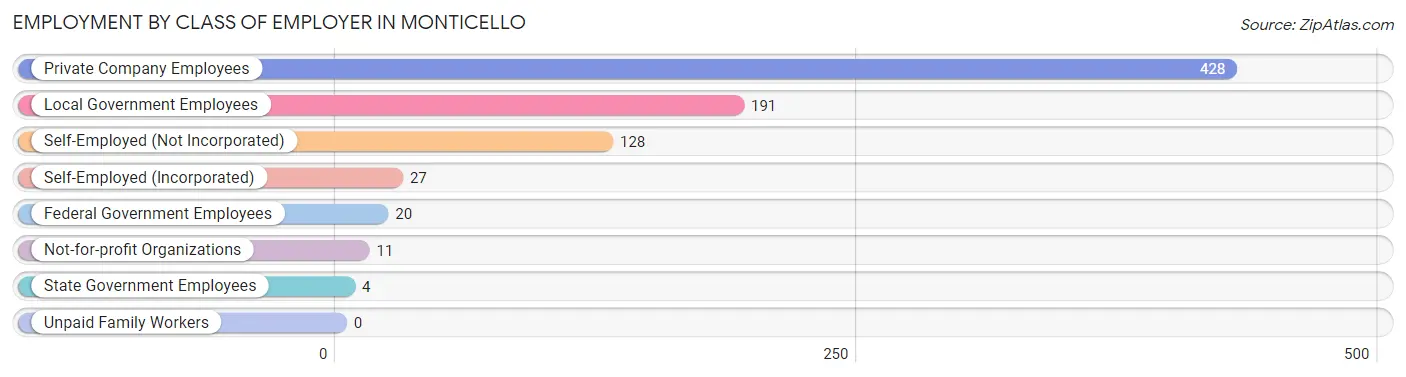
| Employer Class | # Employees | % Employees |
| Private Company Employees | 428 | 52.9% |
| Self-Employed (Incorporated) | 27 | 3.3% |
| Self-Employed (Not Incorporated) | 128 | 15.8% |
| Not-for-profit Organizations | 11 | 1.4% |
| Local Government Employees | 191 | 23.6% |
| State Government Employees | 4 | 0.5% |
| Federal Government Employees | 20 | 2.5% |
| Unpaid Family Workers | 0 | 0.0% |
| Total | 809 | 100.0% |
Employment Status by Age in Monticello
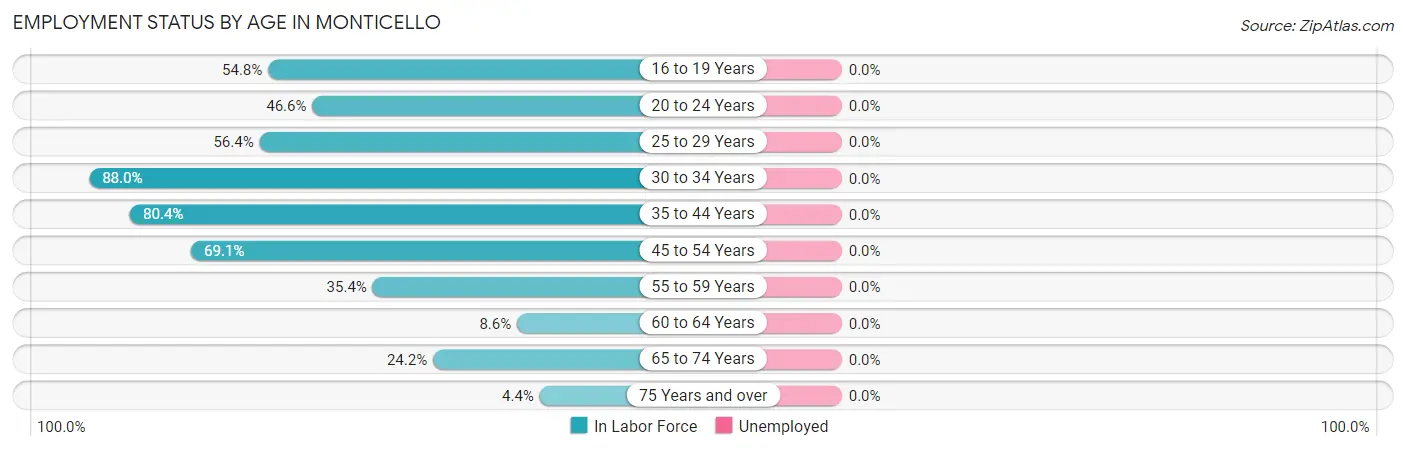
| Age Bracket | In Labor Force | Unemployed |
| 16 to 19 Years | 34 (54.8%) | 0 (0.0%) |
| 20 to 24 Years | 104 (46.6%) | 0 (0.0%) |
| 25 to 29 Years | 136 (56.4%) | 0 (0.0%) |
| 30 to 34 Years | 110 (88.0%) | 0 (0.0%) |
| 35 to 44 Years | 205 (80.4%) | 0 (0.0%) |
| 45 to 54 Years | 94 (69.1%) | 0 (0.0%) |
| 55 to 59 Years | 63 (35.4%) | 0 (0.0%) |
| 60 to 64 Years | 12 (8.6%) | 0 (0.0%) |
| 65 to 74 Years | 43 (24.2%) | 0 (0.0%) |
| 75 Years and over | 8 (4.4%) | 0 (0.0%) |
| Total | 808 (47.0%) | 0 (0.0%) |
Employment Status by Educational Attainment in Monticello
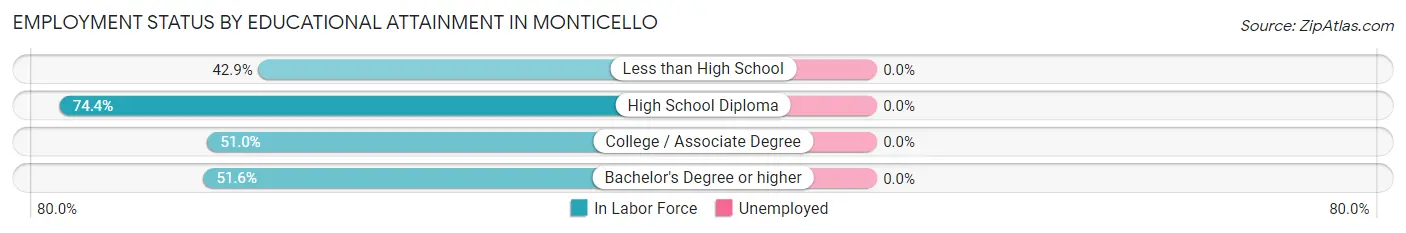
| Educational Attainment | In Labor Force | Unemployed |
| Less than High School | 15 (42.9%) | 0 (0.0%) |
| High School Diploma | 235 (74.4%) | 0 (0.0%) |
| College / Associate Degree | 274 (51.0%) | 0 (0.0%) |
| Bachelor's Degree or higher | 96 (51.6%) | 0 (0.0%) |
| Total | 620 (57.7%) | 0 (0.0%) |
Employment Occupations by Sex in Monticello
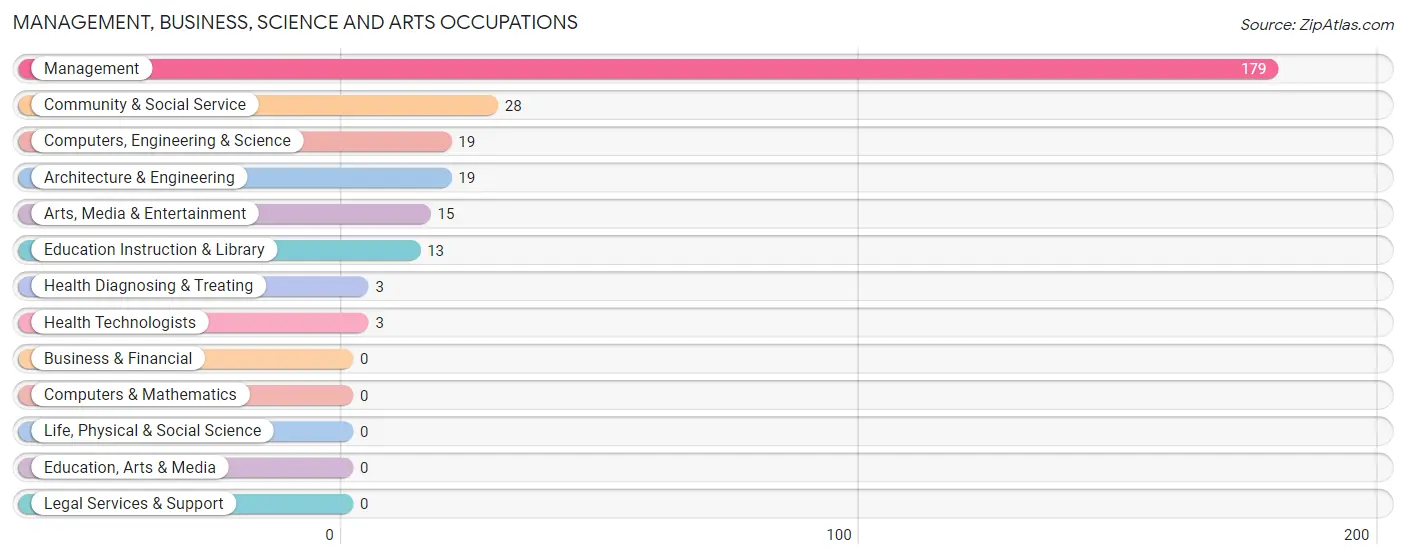
Management, Business, Science and Arts Occupations
The most common Management, Business, Science and Arts occupations in Monticello are Management (179 | 22.1%), Community & Social Service (28 | 3.5%), Computers, Engineering & Science (19 | 2.4%), Architecture & Engineering (19 | 2.4%), and Arts, Media & Entertainment (15 | 1.8%).
Management, Business, Science and Arts Occupations by Sex
Within the Management, Business, Science and Arts occupations in Monticello, the most male-oriented occupations are Computers, Engineering & Science (100.0%), Architecture & Engineering (100.0%), and Arts, Media & Entertainment (100.0%), while the most female-oriented occupations are Education Instruction & Library (100.0%), Health Diagnosing & Treating (100.0%), and Health Technologists (100.0%).
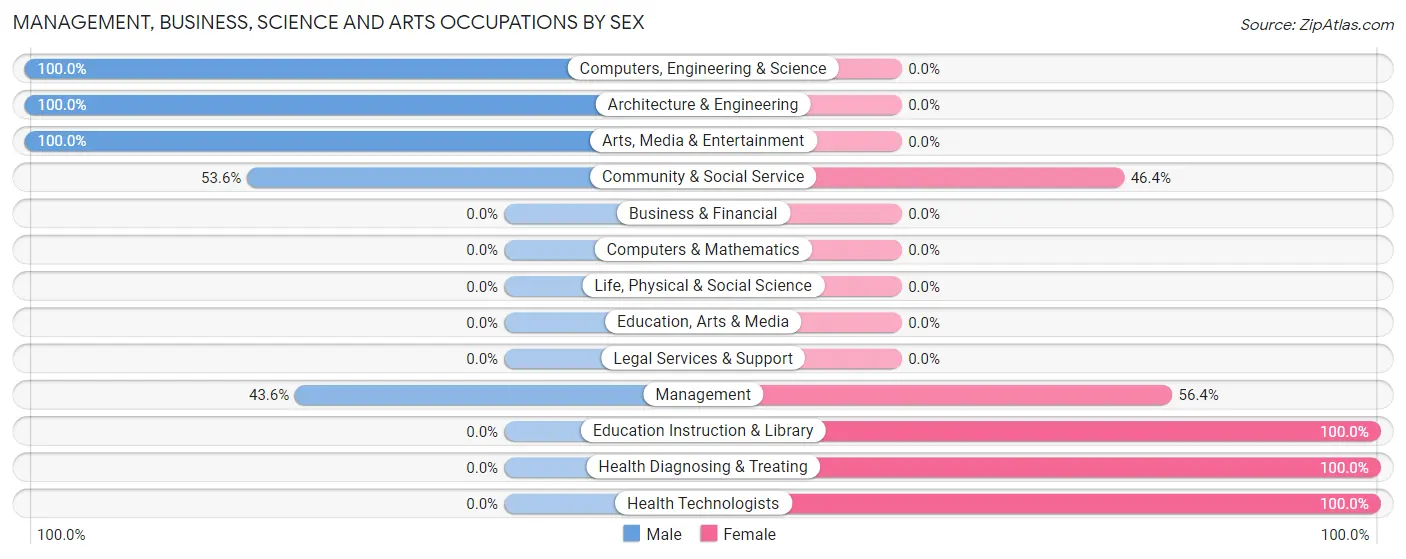
| Occupation | Male | Female |
| Management | 78 (43.6%) | 101 (56.4%) |
| Business & Financial | 0 (0.0%) | 0 (0.0%) |
| Computers, Engineering & Science | 19 (100.0%) | 0 (0.0%) |
| Computers & Mathematics | 0 (0.0%) | 0 (0.0%) |
| Architecture & Engineering | 19 (100.0%) | 0 (0.0%) |
| Life, Physical & Social Science | 0 (0.0%) | 0 (0.0%) |
| Community & Social Service | 15 (53.6%) | 13 (46.4%) |
| Education, Arts & Media | 0 (0.0%) | 0 (0.0%) |
| Legal Services & Support | 0 (0.0%) | 0 (0.0%) |
| Education Instruction & Library | 0 (0.0%) | 13 (100.0%) |
| Arts, Media & Entertainment | 15 (100.0%) | 0 (0.0%) |
| Health Diagnosing & Treating | 0 (0.0%) | 3 (100.0%) |
| Health Technologists | 0 (0.0%) | 3 (100.0%) |
| Total (Category) | 112 (48.9%) | 117 (51.1%) |
| Total (Overall) | 467 (57.7%) | 342 (42.3%) |
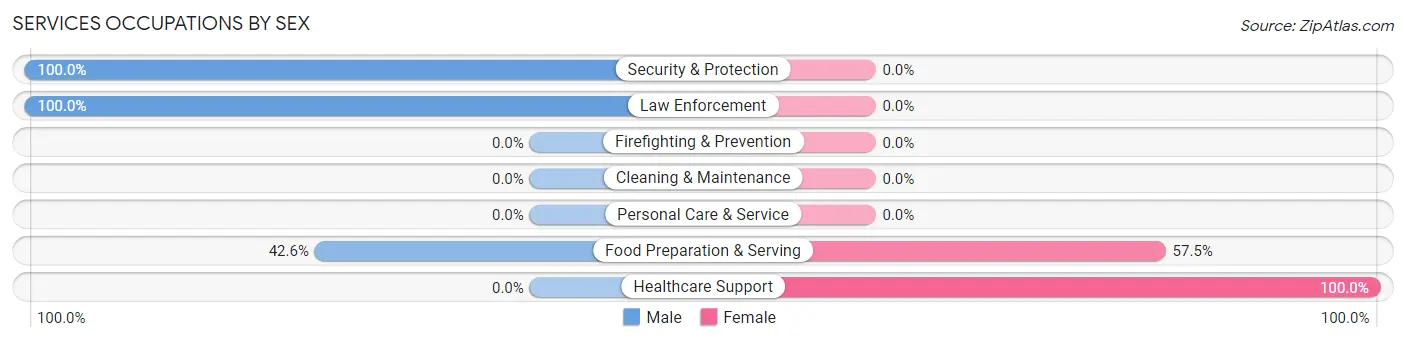
Services Occupations
The most common Services occupations in Monticello are Security & Protection (69 | 8.5%), Law Enforcement (69 | 8.5%), Food Preparation & Serving (47 | 5.8%), and Healthcare Support (20 | 2.5%).

Services Occupations by Sex
Within the Services occupations in Monticello, the most male-oriented occupations are Security & Protection (100.0%), Law Enforcement (100.0%), and Food Preparation & Serving (42.5%), while the most female-oriented occupations are Healthcare Support (100.0%), and Food Preparation & Serving (57.5%).
| Occupation | Male | Female |
| Healthcare Support | 0 (0.0%) | 20 (100.0%) |
| Security & Protection | 69 (100.0%) | 0 (0.0%) |
| Firefighting & Prevention | 0 (0.0%) | 0 (0.0%) |
| Law Enforcement | 69 (100.0%) | 0 (0.0%) |
| Food Preparation & Serving | 20 (42.5%) | 27 (57.5%) |
| Cleaning & Maintenance | 0 (0.0%) | 0 (0.0%) |
| Personal Care & Service | 0 (0.0%) | 0 (0.0%) |
| Total (Category) | 89 (65.4%) | 47 (34.6%) |
| Total (Overall) | 467 (57.7%) | 342 (42.3%) |
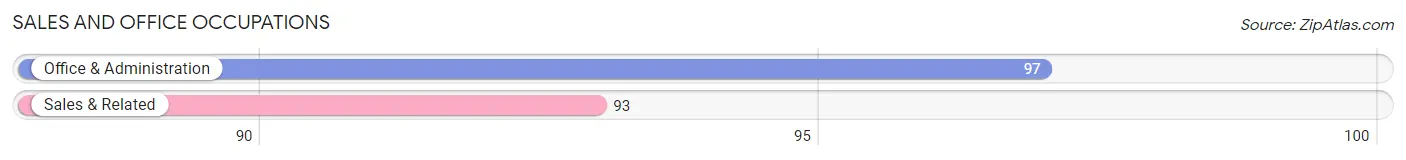
Sales and Office Occupations
The most common Sales and Office occupations in Monticello are Office & Administration (97 | 12.0%), and Sales & Related (93 | 11.5%).
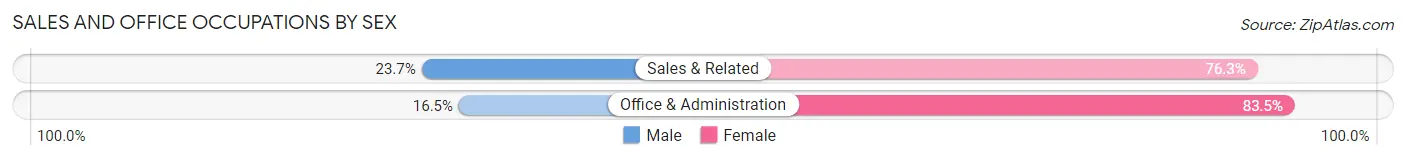
Sales and Office Occupations by Sex
| Occupation | Male | Female |
| Sales & Related | 22 (23.7%) | 71 (76.3%) |
| Office & Administration | 16 (16.5%) | 81 (83.5%) |
| Total (Category) | 38 (20.0%) | 152 (80.0%) |
| Total (Overall) | 467 (57.7%) | 342 (42.3%) |
Natural Resources, Construction and Maintenance Occupations
The most common Natural Resources, Construction and Maintenance occupations in Monticello are Construction & Extraction (68 | 8.4%), and Installation, Maintenance & Repair (59 | 7.3%).
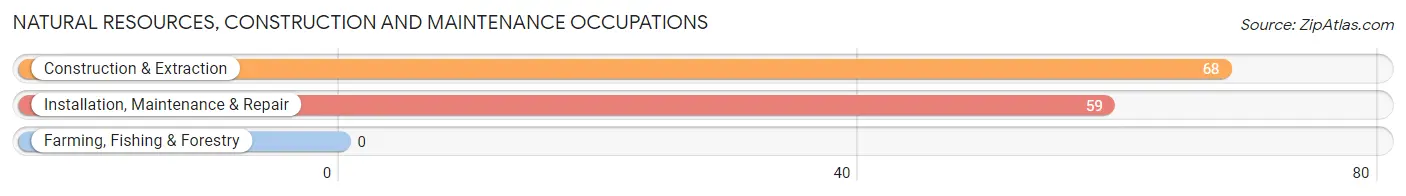
Natural Resources, Construction and Maintenance Occupations by Sex
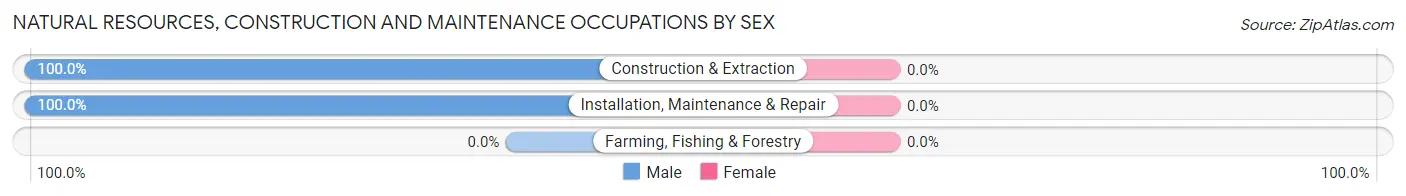
| Occupation | Male | Female |
| Farming, Fishing & Forestry | 0 (0.0%) | 0 (0.0%) |
| Construction & Extraction | 68 (100.0%) | 0 (0.0%) |
| Installation, Maintenance & Repair | 59 (100.0%) | 0 (0.0%) |
| Total (Category) | 127 (100.0%) | 0 (0.0%) |
| Total (Overall) | 467 (57.7%) | 342 (42.3%) |
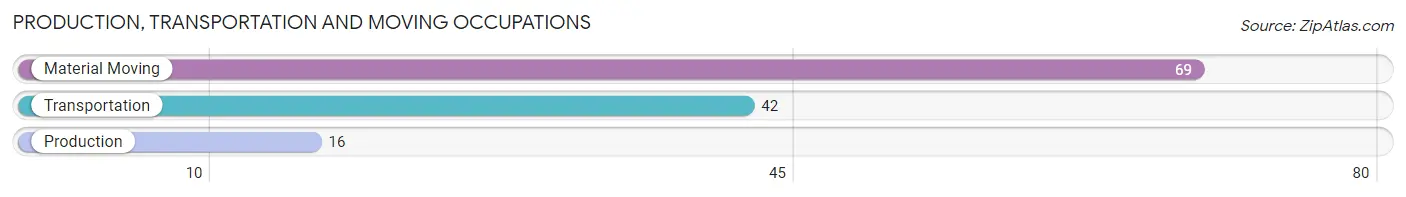
Production, Transportation and Moving Occupations
The most common Production, Transportation and Moving occupations in Monticello are Material Moving (69 | 8.5%), Transportation (42 | 5.2%), and Production (16 | 2.0%).
Production, Transportation and Moving Occupations by Sex
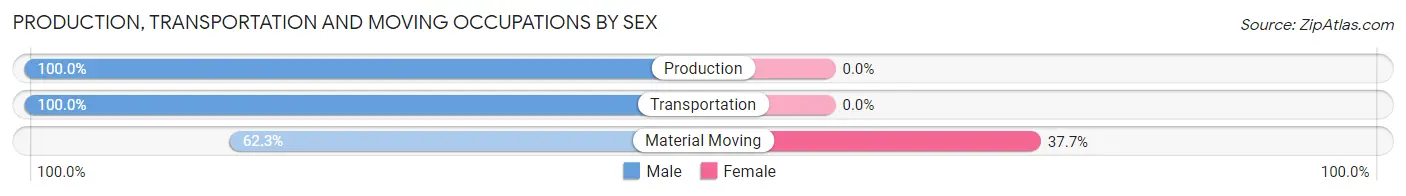
| Occupation | Male | Female |
| Production | 16 (100.0%) | 0 (0.0%) |
| Transportation | 42 (100.0%) | 0 (0.0%) |
| Material Moving | 43 (62.3%) | 26 (37.7%) |
| Total (Category) | 101 (79.5%) | 26 (20.5%) |
| Total (Overall) | 467 (57.7%) | 342 (42.3%) |
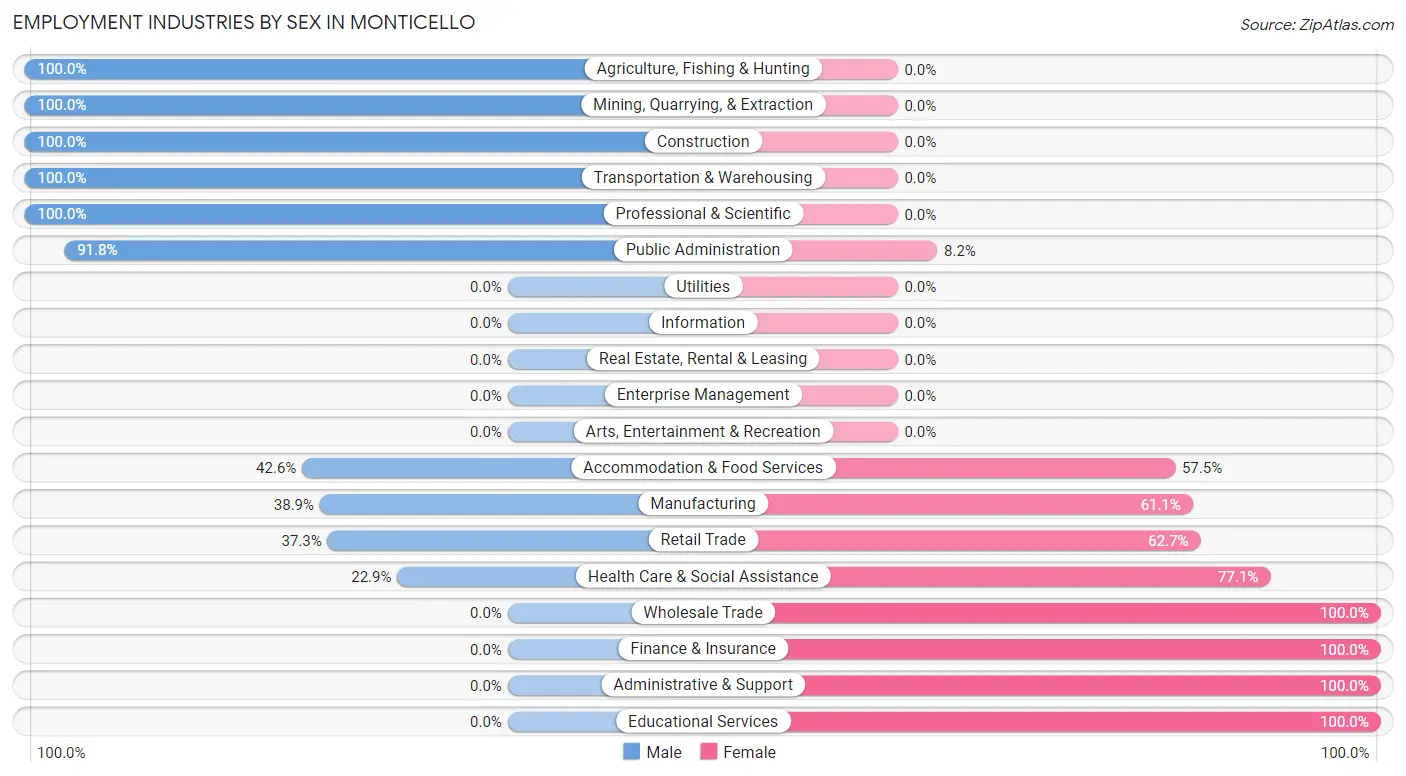
Employment Industries by Sex in Monticello
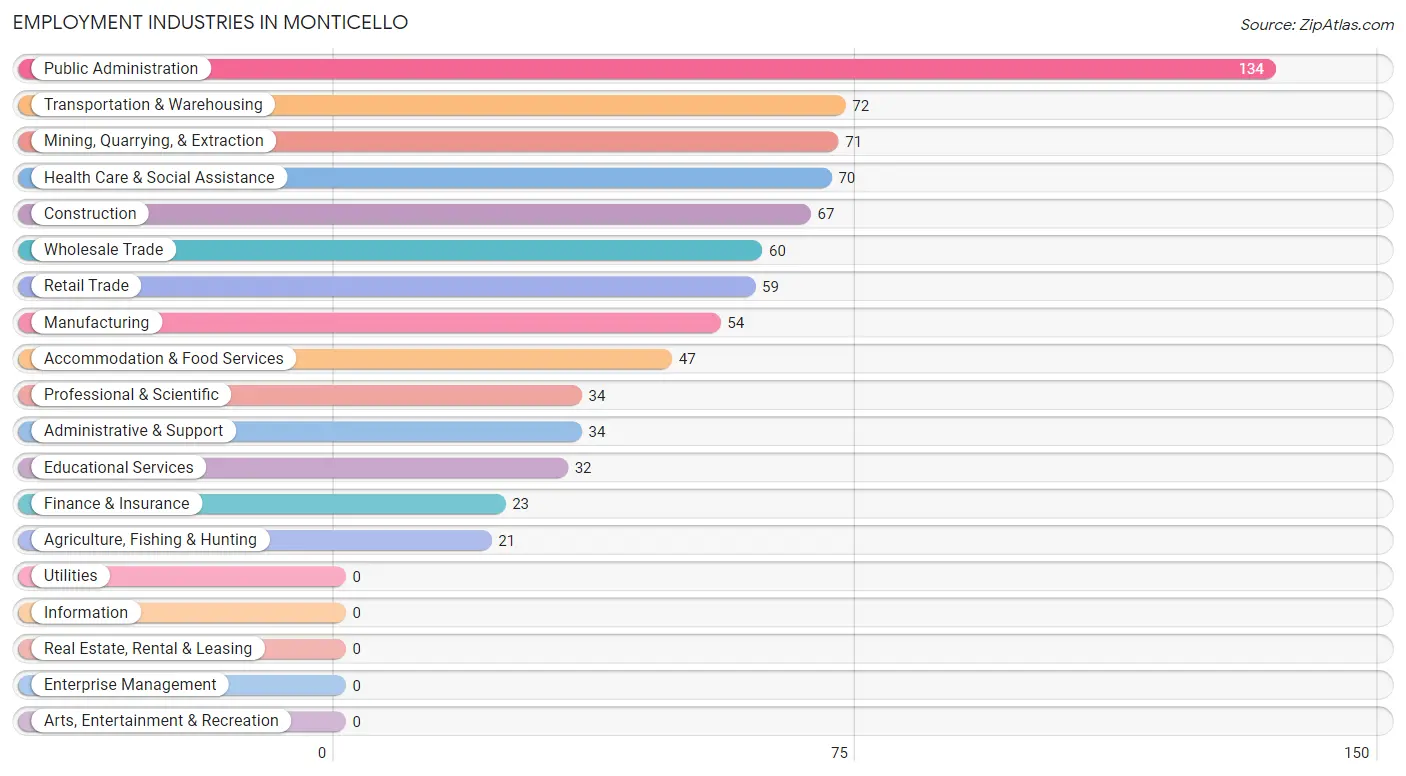
Employment Industries in Monticello
The major employment industries in Monticello include Public Administration (134 | 16.6%), Transportation & Warehousing (72 | 8.9%), Mining, Quarrying, & Extraction (71 | 8.8%), Health Care & Social Assistance (70 | 8.6%), and Construction (67 | 8.3%).
Employment Industries by Sex in Monticello
The Monticello industries that see more men than women are Agriculture, Fishing & Hunting (100.0%), Mining, Quarrying, & Extraction (100.0%), and Construction (100.0%), whereas the industries that tend to have a higher number of women are Wholesale Trade (100.0%), Finance & Insurance (100.0%), and Administrative & Support (100.0%).
| Industry | Male | Female |
| Agriculture, Fishing & Hunting | 21 (100.0%) | 0 (0.0%) |
| Mining, Quarrying, & Extraction | 71 (100.0%) | 0 (0.0%) |
| Construction | 67 (100.0%) | 0 (0.0%) |
| Manufacturing | 21 (38.9%) | 33 (61.1%) |
| Wholesale Trade | 0 (0.0%) | 60 (100.0%) |
| Retail Trade | 22 (37.3%) | 37 (62.7%) |
| Transportation & Warehousing | 72 (100.0%) | 0 (0.0%) |
| Utilities | 0 (0.0%) | 0 (0.0%) |
| Information | 0 (0.0%) | 0 (0.0%) |
| Finance & Insurance | 0 (0.0%) | 23 (100.0%) |
| Real Estate, Rental & Leasing | 0 (0.0%) | 0 (0.0%) |
| Professional & Scientific | 34 (100.0%) | 0 (0.0%) |
| Enterprise Management | 0 (0.0%) | 0 (0.0%) |
| Administrative & Support | 0 (0.0%) | 34 (100.0%) |
| Educational Services | 0 (0.0%) | 32 (100.0%) |
| Health Care & Social Assistance | 16 (22.9%) | 54 (77.1%) |
| Arts, Entertainment & Recreation | 0 (0.0%) | 0 (0.0%) |
| Accommodation & Food Services | 20 (42.5%) | 27 (57.5%) |
| Public Administration | 123 (91.8%) | 11 (8.2%) |
| Total | 467 (57.7%) | 342 (42.3%) |
Education in Monticello
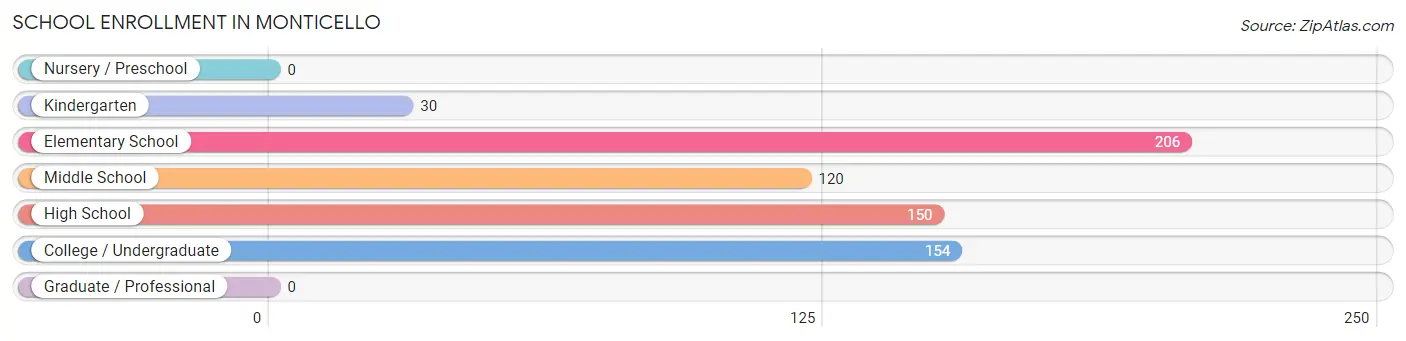
School Enrollment in Monticello
The most common levels of schooling among the 660 students in Monticello are elementary school (206 | 31.2%), college / undergraduate (154 | 23.3%), and high school (150 | 22.7%).
| School Level | # Students | % Students |
| Nursery / Preschool | 0 | 0.0% |
| Kindergarten | 30 | 4.5% |
| Elementary School | 206 | 31.2% |
| Middle School | 120 | 18.2% |
| High School | 150 | 22.7% |
| College / Undergraduate | 154 | 23.3% |
| Graduate / Professional | 0 | 0.0% |
| Total | 660 | 100.0% |
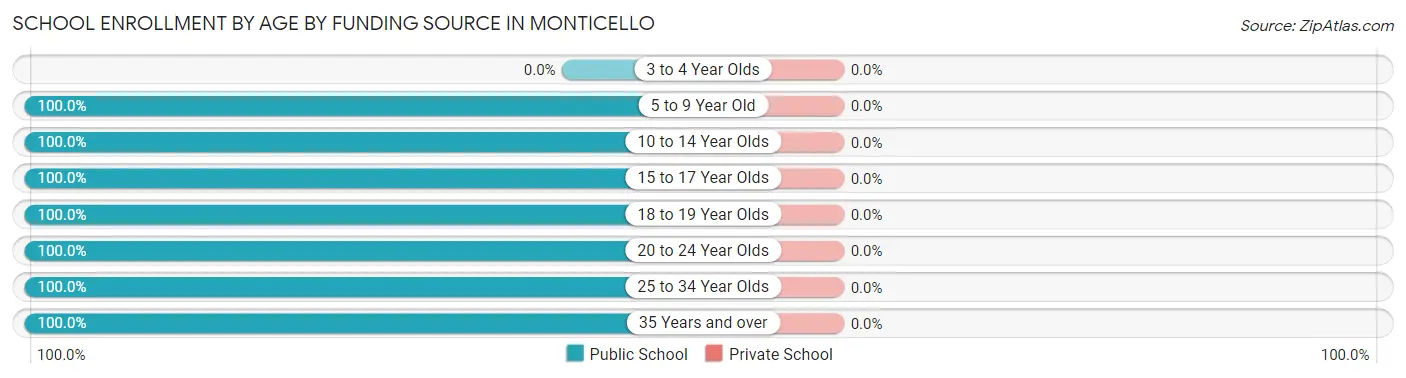
School Enrollment by Age by Funding Source in Monticello
| Age Bracket | Public School | Private School |
| 3 to 4 Year Olds | 0 (0.0%) | 0 (0.0%) |
| 5 to 9 Year Old | 236 (100.0%) | 0 (0.0%) |
| 10 to 14 Year Olds | 139 (100.0%) | 0 (0.0%) |
| 15 to 17 Year Olds | 84 (100.0%) | 0 (0.0%) |
| 18 to 19 Year Olds | 35 (100.0%) | 0 (0.0%) |
| 20 to 24 Year Olds | 148 (100.0%) | 0 (0.0%) |
| 25 to 34 Year Olds | 12 (100.0%) | 0 (0.0%) |
| 35 Years and over | 6 (100.0%) | 0 (0.0%) |
| Total | 660 (100.0%) | 0 (0.0%) |
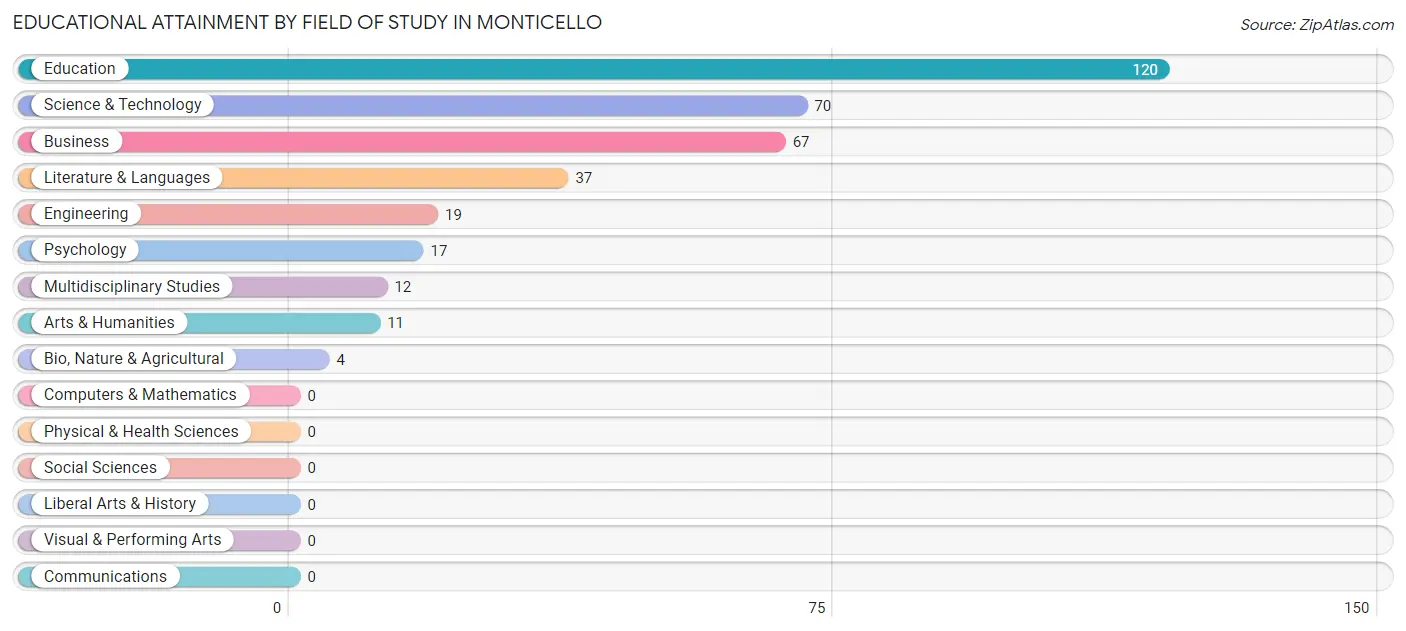
Educational Attainment by Field of Study in Monticello
Education (120 | 33.6%), science & technology (70 | 19.6%), business (67 | 18.8%), literature & languages (37 | 10.4%), and engineering (19 | 5.3%) are the most common fields of study among 357 individuals in Monticello who have obtained a bachelor's degree or higher.
| Field of Study | # Graduates | % Graduates |
| Computers & Mathematics | 0 | 0.0% |
| Bio, Nature & Agricultural | 4 | 1.1% |
| Physical & Health Sciences | 0 | 0.0% |
| Psychology | 17 | 4.8% |
| Social Sciences | 0 | 0.0% |
| Engineering | 19 | 5.3% |
| Multidisciplinary Studies | 12 | 3.4% |
| Science & Technology | 70 | 19.6% |
| Business | 67 | 18.8% |
| Education | 120 | 33.6% |
| Literature & Languages | 37 | 10.4% |
| Liberal Arts & History | 0 | 0.0% |
| Visual & Performing Arts | 0 | 0.0% |
| Communications | 0 | 0.0% |
| Arts & Humanities | 11 | 3.1% |
| Total | 357 | 100.0% |
Transportation & Commute in Monticello
Vehicle Availability by Sex in Monticello
The most prevalent vehicle ownership categories in Monticello are males with 2 vehicles (328, accounting for 70.2%) and females with 2 vehicles (113, making up 95.9%).
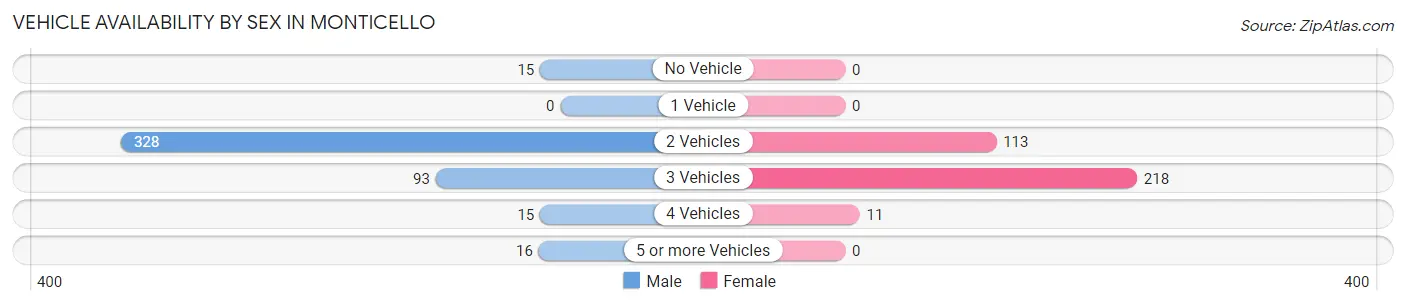
| Vehicles Available | Male | Female |
| No Vehicle | 15 (3.2%) | 0 (0.0%) |
| 1 Vehicle | 0 (0.0%) | 0 (0.0%) |
| 2 Vehicles | 328 (70.2%) | 113 (33.0%) |
| 3 Vehicles | 93 (19.9%) | 218 (63.7%) |
| 4 Vehicles | 15 (3.2%) | 11 (3.2%) |
| 5 or more Vehicles | 16 (3.4%) | 0 (0.0%) |
| Total | 467 (100.0%) | 342 (100.0%) |
Commute Time in Monticello
The most frequently occuring commute durations in Monticello are 5 to 9 minutes (303 commuters, 42.2%), 20 to 24 minutes (123 commuters, 17.1%), and less than 5 minutes (81 commuters, 11.3%).
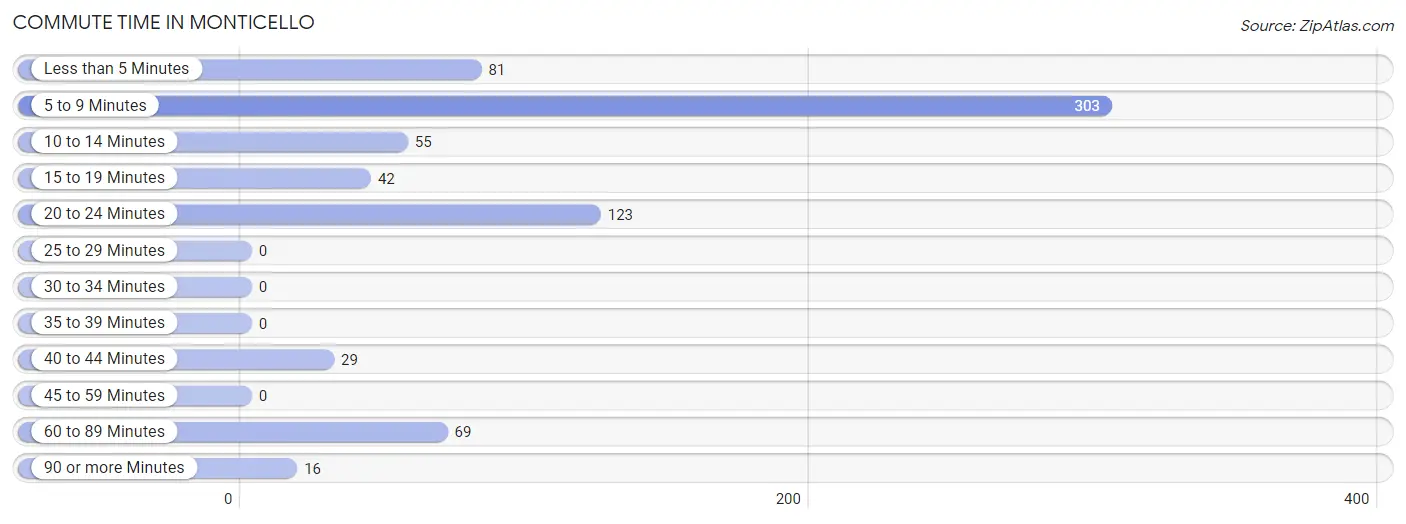
| Commute Time | # Commuters | % Commuters |
| Less than 5 Minutes | 81 | 11.3% |
| 5 to 9 Minutes | 303 | 42.2% |
| 10 to 14 Minutes | 55 | 7.7% |
| 15 to 19 Minutes | 42 | 5.9% |
| 20 to 24 Minutes | 123 | 17.1% |
| 25 to 29 Minutes | 0 | 0.0% |
| 30 to 34 Minutes | 0 | 0.0% |
| 35 to 39 Minutes | 0 | 0.0% |
| 40 to 44 Minutes | 29 | 4.0% |
| 45 to 59 Minutes | 0 | 0.0% |
| 60 to 89 Minutes | 69 | 9.6% |
| 90 or more Minutes | 16 | 2.2% |
Commute Time by Sex in Monticello
The most common commute times in Monticello are 5 to 9 minutes (88 commuters, 20.3%) for males and 5 to 9 minutes (215 commuters, 75.4%) for females.
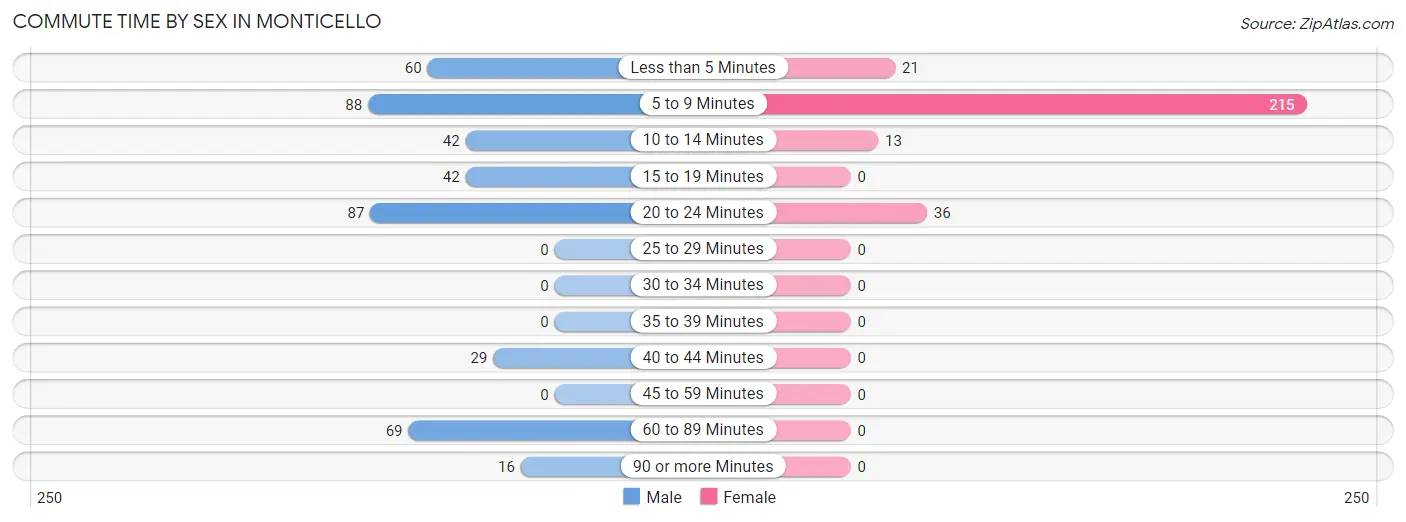
| Commute Time | Male | Female |
| Less than 5 Minutes | 60 (13.9%) | 21 (7.4%) |
| 5 to 9 Minutes | 88 (20.3%) | 215 (75.4%) |
| 10 to 14 Minutes | 42 (9.7%) | 13 (4.6%) |
| 15 to 19 Minutes | 42 (9.7%) | 0 (0.0%) |
| 20 to 24 Minutes | 87 (20.1%) | 36 (12.6%) |
| 25 to 29 Minutes | 0 (0.0%) | 0 (0.0%) |
| 30 to 34 Minutes | 0 (0.0%) | 0 (0.0%) |
| 35 to 39 Minutes | 0 (0.0%) | 0 (0.0%) |
| 40 to 44 Minutes | 29 (6.7%) | 0 (0.0%) |
| 45 to 59 Minutes | 0 (0.0%) | 0 (0.0%) |
| 60 to 89 Minutes | 69 (15.9%) | 0 (0.0%) |
| 90 or more Minutes | 16 (3.7%) | 0 (0.0%) |
Time of Departure to Work by Sex in Monticello
The most frequent times of departure to work in Monticello are 7:30 AM to 7:59 AM (105, 24.2%) for males and 12:00 PM to 3:59 PM (87, 30.5%) for females.
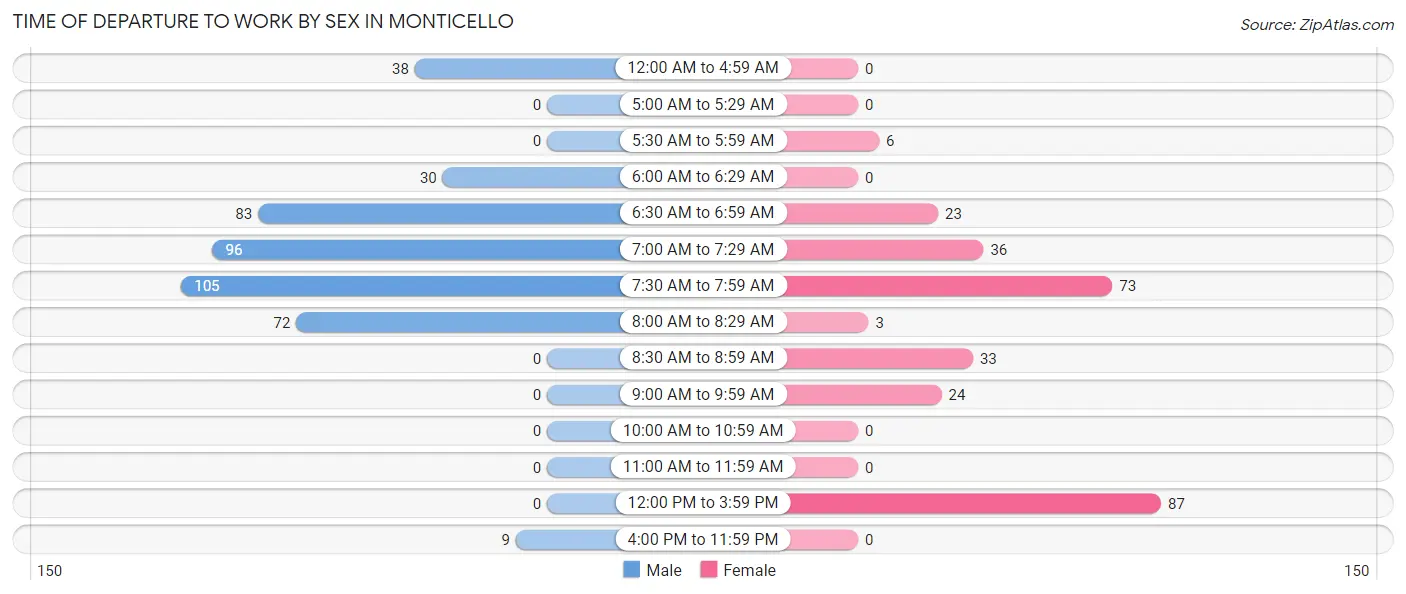
| Time of Departure | Male | Female |
| 12:00 AM to 4:59 AM | 38 (8.8%) | 0 (0.0%) |
| 5:00 AM to 5:29 AM | 0 (0.0%) | 0 (0.0%) |
| 5:30 AM to 5:59 AM | 0 (0.0%) | 6 (2.1%) |
| 6:00 AM to 6:29 AM | 30 (6.9%) | 0 (0.0%) |
| 6:30 AM to 6:59 AM | 83 (19.2%) | 23 (8.1%) |
| 7:00 AM to 7:29 AM | 96 (22.2%) | 36 (12.6%) |
| 7:30 AM to 7:59 AM | 105 (24.2%) | 73 (25.6%) |
| 8:00 AM to 8:29 AM | 72 (16.6%) | 3 (1.1%) |
| 8:30 AM to 8:59 AM | 0 (0.0%) | 33 (11.6%) |
| 9:00 AM to 9:59 AM | 0 (0.0%) | 24 (8.4%) |
| 10:00 AM to 10:59 AM | 0 (0.0%) | 0 (0.0%) |
| 11:00 AM to 11:59 AM | 0 (0.0%) | 0 (0.0%) |
| 12:00 PM to 3:59 PM | 0 (0.0%) | 87 (30.5%) |
| 4:00 PM to 11:59 PM | 9 (2.1%) | 0 (0.0%) |
| Total | 433 (100.0%) | 285 (100.0%) |
Housing Occupancy in Monticello
Occupancy by Ownership in Monticello
Of the total 718 dwellings in Monticello, owner-occupied units account for 539 (75.1%), while renter-occupied units make up 179 (24.9%).
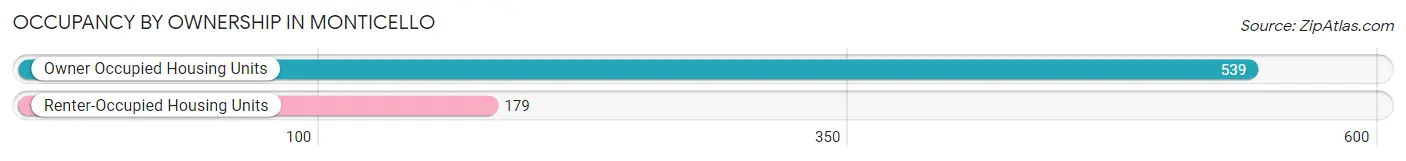
| Occupancy | # Housing Units | % Housing Units |
| Owner Occupied Housing Units | 539 | 75.1% |
| Renter-Occupied Housing Units | 179 | 24.9% |
| Total Occupied Housing Units | 718 | 100.0% |
Occupancy by Household Size in Monticello
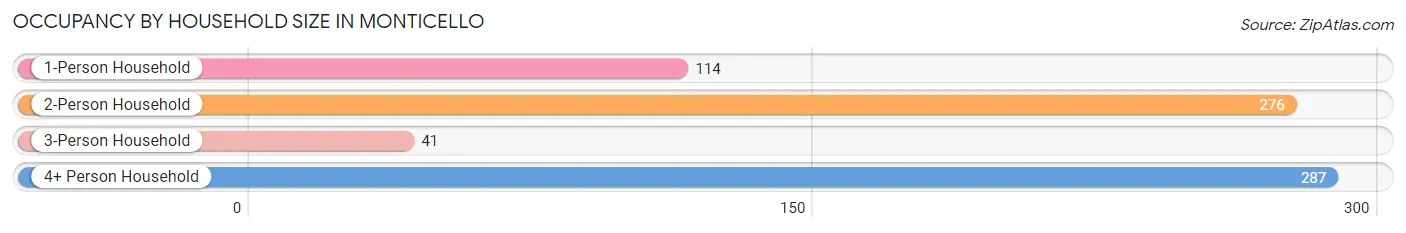
| Household Size | # Housing Units | % Housing Units |
| 1-Person Household | 114 | 15.9% |
| 2-Person Household | 276 | 38.4% |
| 3-Person Household | 41 | 5.7% |
| 4+ Person Household | 287 | 40.0% |
| Total Housing Units | 718 | 100.0% |
Occupancy by Ownership by Household Size in Monticello
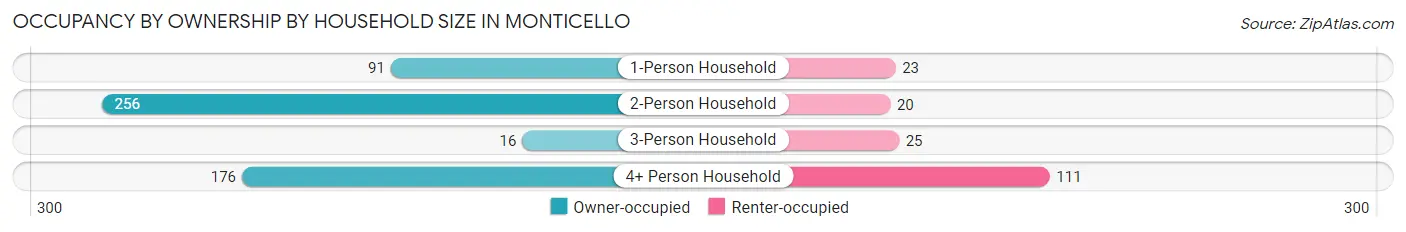
| Household Size | Owner-occupied | Renter-occupied |
| 1-Person Household | 91 (79.8%) | 23 (20.2%) |
| 2-Person Household | 256 (92.7%) | 20 (7.2%) |
| 3-Person Household | 16 (39.0%) | 25 (61.0%) |
| 4+ Person Household | 176 (61.3%) | 111 (38.7%) |
| Total Housing Units | 539 (75.1%) | 179 (24.9%) |
Occupancy by Educational Attainment in Monticello
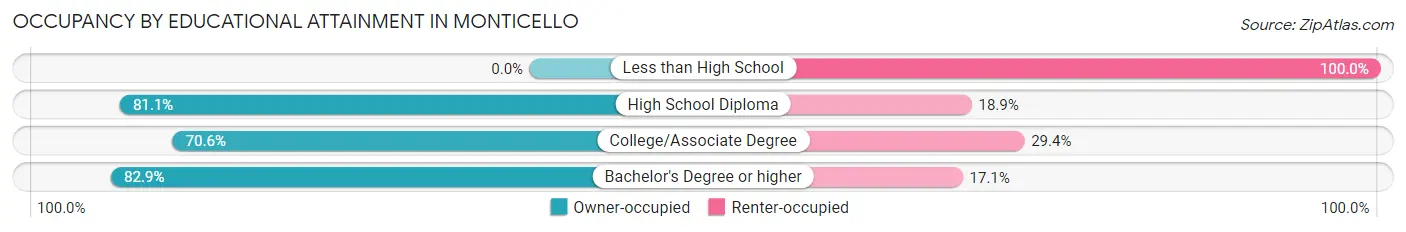
| Household Size | Owner-occupied | Renter-occupied |
| Less than High School | 0 (0.0%) | 15 (100.0%) |
| High School Diploma | 163 (81.1%) | 38 (18.9%) |
| College/Associate Degree | 231 (70.6%) | 96 (29.4%) |
| Bachelor's Degree or higher | 145 (82.9%) | 30 (17.1%) |
Occupancy by Age of Householder in Monticello
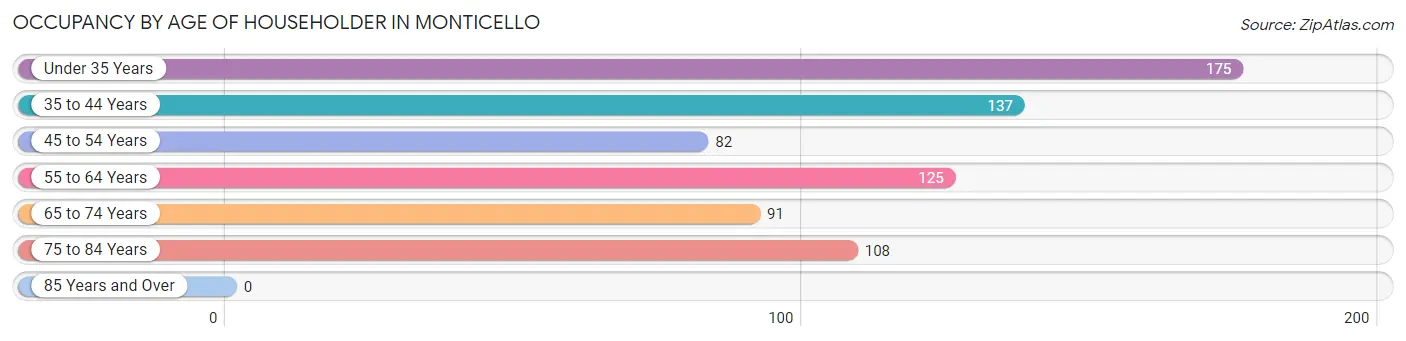
| Age Bracket | # Households | % Households |
| Under 35 Years | 175 | 24.4% |
| 35 to 44 Years | 137 | 19.1% |
| 45 to 54 Years | 82 | 11.4% |
| 55 to 64 Years | 125 | 17.4% |
| 65 to 74 Years | 91 | 12.7% |
| 75 to 84 Years | 108 | 15.0% |
| 85 Years and Over | 0 | 0.0% |
| Total | 718 | 100.0% |
Housing Finances in Monticello
Median Income by Occupancy in Monticello
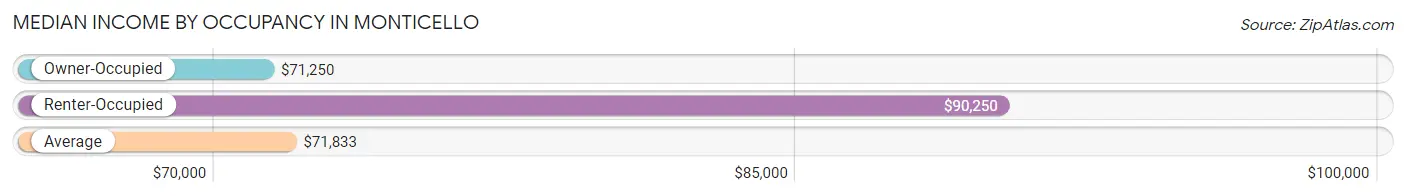
| Occupancy Type | # Households | Median Income |
| Owner-Occupied | 539 (75.1%) | $71,250 |
| Renter-Occupied | 179 (24.9%) | $90,250 |
| Average | 718 (100.0%) | $71,833 |
Occupancy by Householder Income Bracket in Monticello
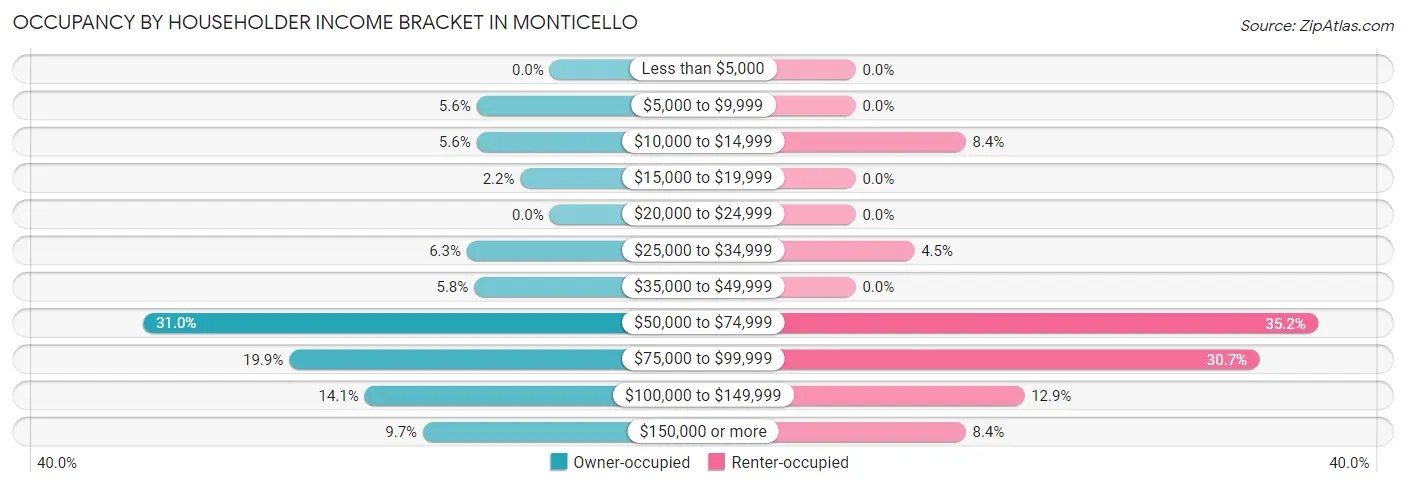
| Income Bracket | Owner-occupied | Renter-occupied |
| Less than $5,000 | 0 (0.0%) | 0 (0.0%) |
| $5,000 to $9,999 | 30 (5.6%) | 0 (0.0%) |
| $10,000 to $14,999 | 30 (5.6%) | 15 (8.4%) |
| $15,000 to $19,999 | 12 (2.2%) | 0 (0.0%) |
| $20,000 to $24,999 | 0 (0.0%) | 0 (0.0%) |
| $25,000 to $34,999 | 34 (6.3%) | 8 (4.5%) |
| $35,000 to $49,999 | 31 (5.8%) | 0 (0.0%) |
| $50,000 to $74,999 | 167 (31.0%) | 63 (35.2%) |
| $75,000 to $99,999 | 107 (19.9%) | 55 (30.7%) |
| $100,000 to $149,999 | 76 (14.1%) | 23 (12.9%) |
| $150,000 or more | 52 (9.7%) | 15 (8.4%) |
| Total | 539 (100.0%) | 179 (100.0%) |
Monthly Housing Cost Tiers in Monticello
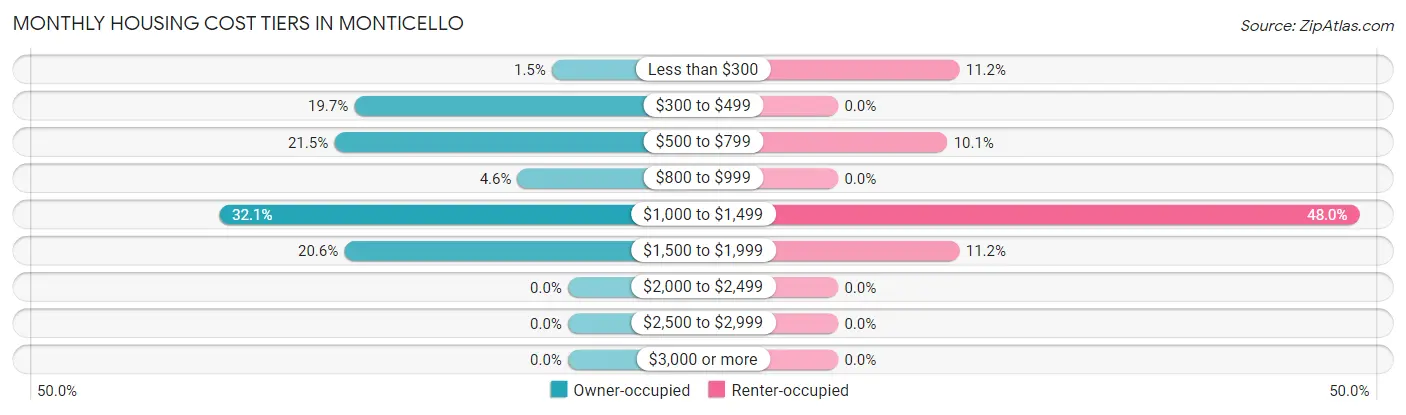
| Monthly Cost | Owner-occupied | Renter-occupied |
| Less than $300 | 8 (1.5%) | 20 (11.2%) |
| $300 to $499 | 106 (19.7%) | 0 (0.0%) |
| $500 to $799 | 116 (21.5%) | 18 (10.1%) |
| $800 to $999 | 25 (4.6%) | 0 (0.0%) |
| $1,000 to $1,499 | 173 (32.1%) | 86 (48.0%) |
| $1,500 to $1,999 | 111 (20.6%) | 20 (11.2%) |
| $2,000 to $2,499 | 0 (0.0%) | 0 (0.0%) |
| $2,500 to $2,999 | 0 (0.0%) | 0 (0.0%) |
| $3,000 or more | 0 (0.0%) | 0 (0.0%) |
| Total | 539 (100.0%) | 179 (100.0%) |
Physical Housing Characteristics in Monticello
Housing Structures in Monticello
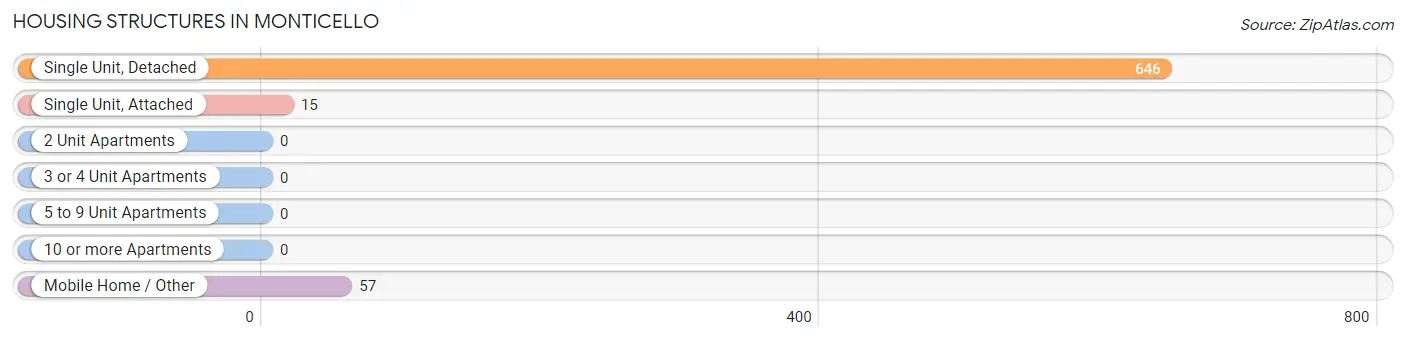
| Structure Type | # Housing Units | % Housing Units |
| Single Unit, Detached | 646 | 90.0% |
| Single Unit, Attached | 15 | 2.1% |
| 2 Unit Apartments | 0 | 0.0% |
| 3 or 4 Unit Apartments | 0 | 0.0% |
| 5 to 9 Unit Apartments | 0 | 0.0% |
| 10 or more Apartments | 0 | 0.0% |
| Mobile Home / Other | 57 | 7.9% |
| Total | 718 | 100.0% |
Housing Structures by Occupancy in Monticello
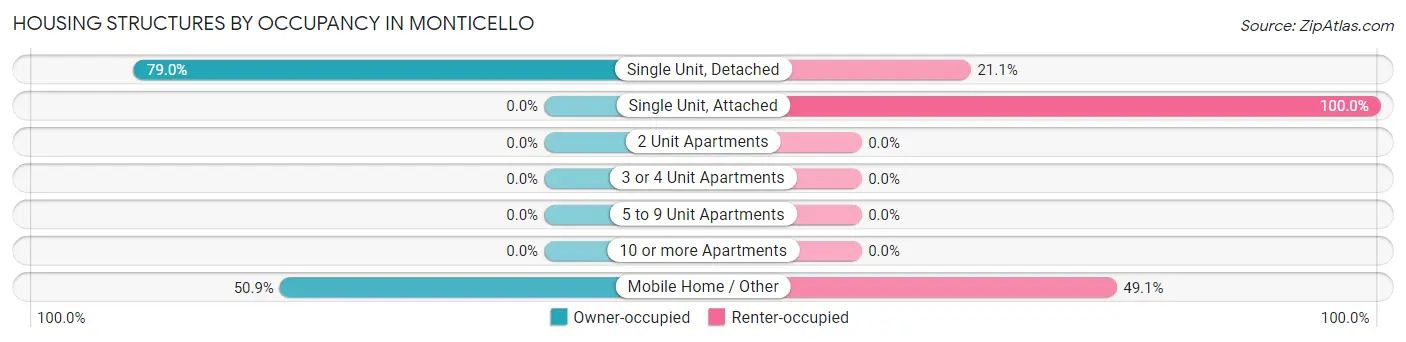
| Structure Type | Owner-occupied | Renter-occupied |
| Single Unit, Detached | 510 (78.9%) | 136 (21.0%) |
| Single Unit, Attached | 0 (0.0%) | 15 (100.0%) |
| 2 Unit Apartments | 0 (0.0%) | 0 (0.0%) |
| 3 or 4 Unit Apartments | 0 (0.0%) | 0 (0.0%) |
| 5 to 9 Unit Apartments | 0 (0.0%) | 0 (0.0%) |
| 10 or more Apartments | 0 (0.0%) | 0 (0.0%) |
| Mobile Home / Other | 29 (50.9%) | 28 (49.1%) |
| Total | 539 (75.1%) | 179 (24.9%) |
Housing Structures by Number of Rooms in Monticello
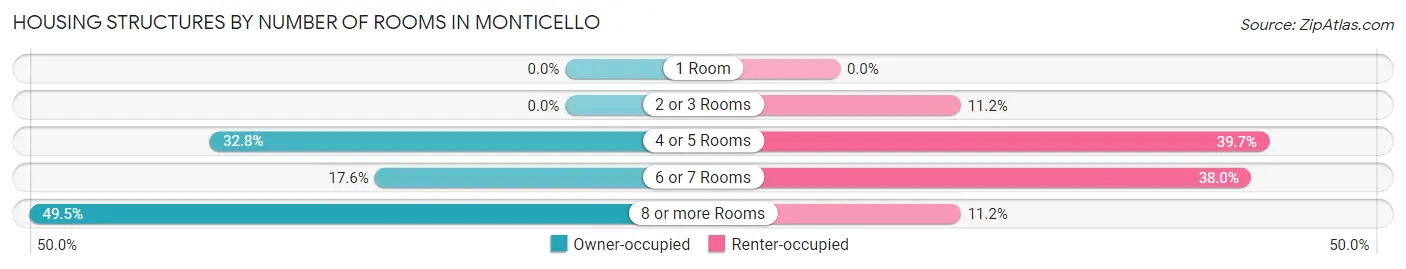
| Number of Rooms | Owner-occupied | Renter-occupied |
| 1 Room | 0 (0.0%) | 0 (0.0%) |
| 2 or 3 Rooms | 0 (0.0%) | 20 (11.2%) |
| 4 or 5 Rooms | 177 (32.8%) | 71 (39.7%) |
| 6 or 7 Rooms | 95 (17.6%) | 68 (38.0%) |
| 8 or more Rooms | 267 (49.5%) | 20 (11.2%) |
| Total | 539 (100.0%) | 179 (100.0%) |
Housing Structure by Heating Type in Monticello
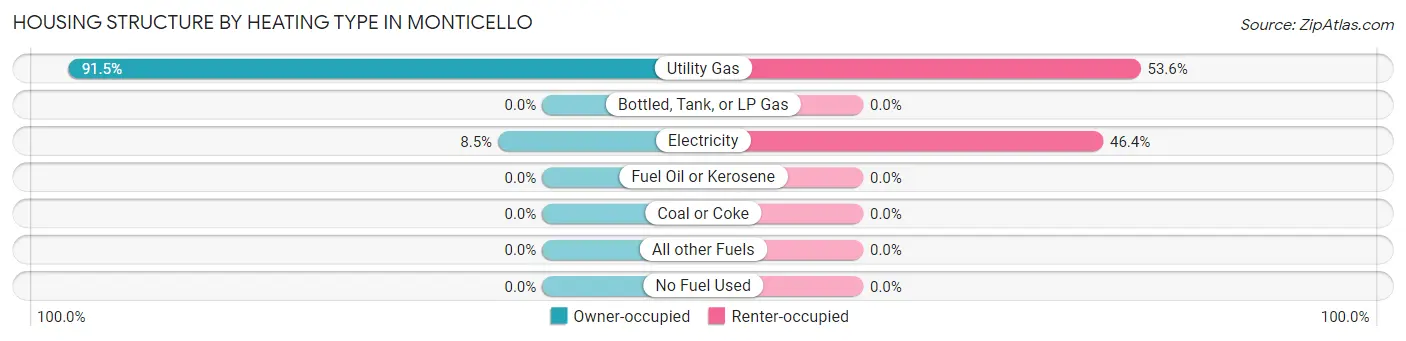
| Heating Type | Owner-occupied | Renter-occupied |
| Utility Gas | 493 (91.5%) | 96 (53.6%) |
| Bottled, Tank, or LP Gas | 0 (0.0%) | 0 (0.0%) |
| Electricity | 46 (8.5%) | 83 (46.4%) |
| Fuel Oil or Kerosene | 0 (0.0%) | 0 (0.0%) |
| Coal or Coke | 0 (0.0%) | 0 (0.0%) |
| All other Fuels | 0 (0.0%) | 0 (0.0%) |
| No Fuel Used | 0 (0.0%) | 0 (0.0%) |
| Total | 539 (100.0%) | 179 (100.0%) |
Household Vehicle Usage in Monticello
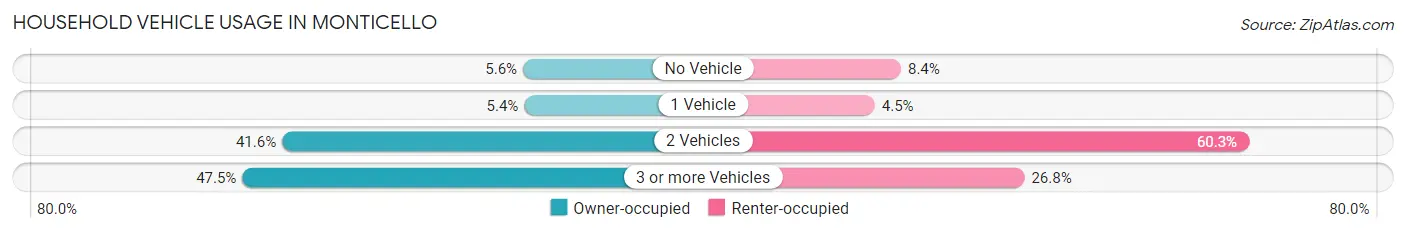
| Vehicles per Household | Owner-occupied | Renter-occupied |
| No Vehicle | 30 (5.6%) | 15 (8.4%) |
| 1 Vehicle | 29 (5.4%) | 8 (4.5%) |
| 2 Vehicles | 224 (41.6%) | 108 (60.3%) |
| 3 or more Vehicles | 256 (47.5%) | 48 (26.8%) |
| Total | 539 (100.0%) | 179 (100.0%) |
Real Estate & Mortgages in Monticello
Real Estate and Mortgage Overview in Monticello
| Characteristic | Without Mortgage | With Mortgage |
| Housing Units | 218 | 321 |
| Median Property Value | $283,900 | $249,700 |
| Median Household Income | $68,372 | $52 |
| Monthly Housing Costs | $493 | $0 |
| Real Estate Taxes | $2,086 | $0 |
Property Value by Mortgage Status in Monticello
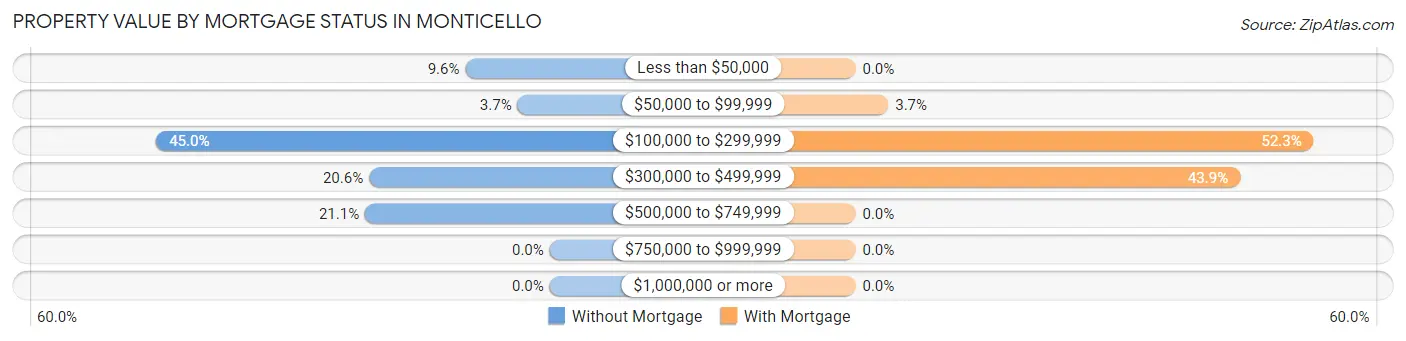
| Property Value | Without Mortgage | With Mortgage |
| Less than $50,000 | 21 (9.6%) | 0 (0.0%) |
| $50,000 to $99,999 | 8 (3.7%) | 12 (3.7%) |
| $100,000 to $299,999 | 98 (45.0%) | 168 (52.3%) |
| $300,000 to $499,999 | 45 (20.6%) | 141 (43.9%) |
| $500,000 to $749,999 | 46 (21.1%) | 0 (0.0%) |
| $750,000 to $999,999 | 0 (0.0%) | 0 (0.0%) |
| $1,000,000 or more | 0 (0.0%) | 0 (0.0%) |
| Total | 218 (100.0%) | 321 (100.0%) |
Household Income by Mortgage Status in Monticello
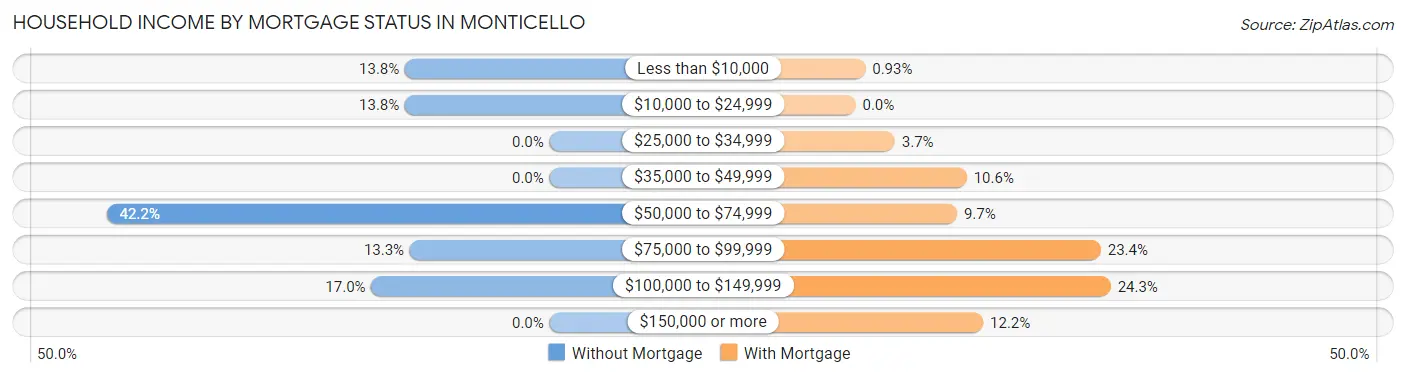
| Household Income | Without Mortgage | With Mortgage |
| Less than $10,000 | 30 (13.8%) | 3 (0.9%) |
| $10,000 to $24,999 | 30 (13.8%) | 0 (0.0%) |
| $25,000 to $34,999 | 0 (0.0%) | 12 (3.7%) |
| $35,000 to $49,999 | 0 (0.0%) | 34 (10.6%) |
| $50,000 to $74,999 | 92 (42.2%) | 31 (9.7%) |
| $75,000 to $99,999 | 29 (13.3%) | 75 (23.4%) |
| $100,000 to $149,999 | 37 (17.0%) | 78 (24.3%) |
| $150,000 or more | 0 (0.0%) | 39 (12.1%) |
| Total | 218 (100.0%) | 321 (100.0%) |
Property Value to Household Income Ratio in Monticello
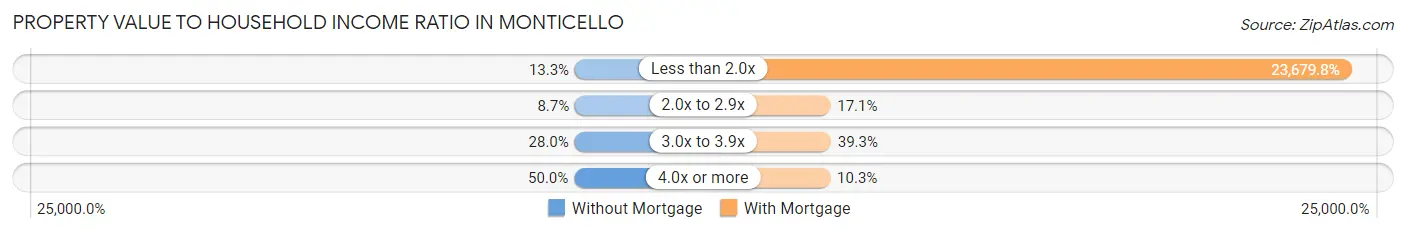
| Value-to-Income Ratio | Without Mortgage | With Mortgage |
| Less than 2.0x | 29 (13.3%) | 76,012 (23,679.8%) |
| 2.0x to 2.9x | 19 (8.7%) | 55 (17.1%) |
| 3.0x to 3.9x | 61 (28.0%) | 126 (39.3%) |
| 4.0x or more | 109 (50.0%) | 33 (10.3%) |
| Total | 218 (100.0%) | 321 (100.0%) |
Real Estate Taxes by Mortgage Status in Monticello

| Property Taxes | Without Mortgage | With Mortgage |
| Less than $800 | 5 (2.3%) | 0 (0.0%) |
| $800 to $1,499 | 30 (13.8%) | 12 (3.7%) |
| $800 to $1,499 | 159 (72.9%) | 145 (45.2%) |
| Total | 218 (100.0%) | 321 (100.0%) |
Health & Disability in Monticello
Health Insurance Coverage by Age in Monticello
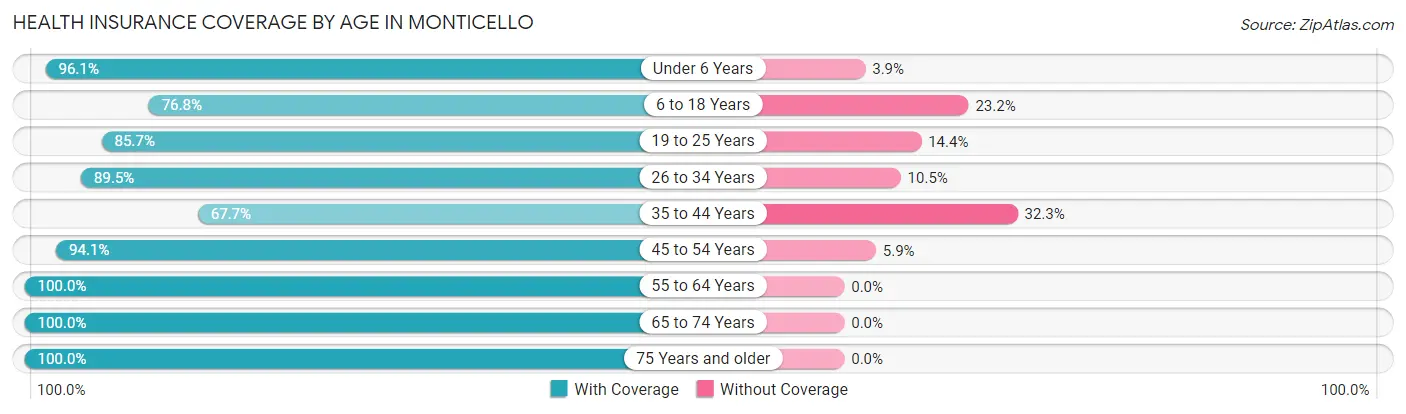
| Age Bracket | With Coverage | Without Coverage |
| Under 6 Years | 270 (96.1%) | 11 (3.9%) |
| 6 to 18 Years | 345 (76.8%) | 104 (23.2%) |
| 19 to 25 Years | 191 (85.7%) | 32 (14.3%) |
| 26 to 34 Years | 264 (89.5%) | 31 (10.5%) |
| 35 to 44 Years | 153 (67.7%) | 73 (32.3%) |
| 45 to 54 Years | 128 (94.1%) | 8 (5.9%) |
| 55 to 64 Years | 293 (100.0%) | 0 (0.0%) |
| 65 to 74 Years | 168 (100.0%) | 0 (0.0%) |
| 75 Years and older | 176 (100.0%) | 0 (0.0%) |
| Total | 1,988 (88.5%) | 259 (11.5%) |
Health Insurance Coverage by Citizenship Status in Monticello
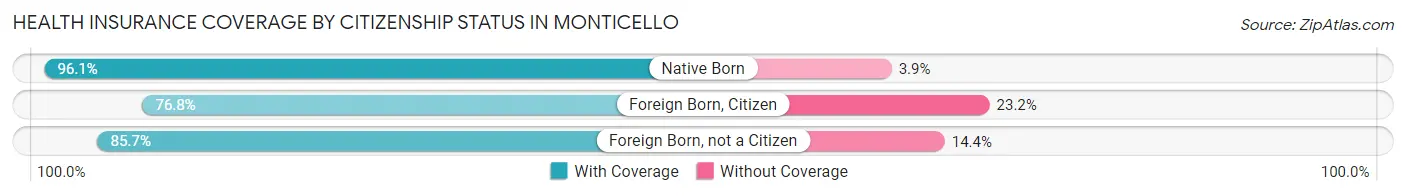
| Citizenship Status | With Coverage | Without Coverage |
| Native Born | 270 (96.1%) | 11 (3.9%) |
| Foreign Born, Citizen | 345 (76.8%) | 104 (23.2%) |
| Foreign Born, not a Citizen | 191 (85.7%) | 32 (14.3%) |
Health Insurance Coverage by Household Income in Monticello
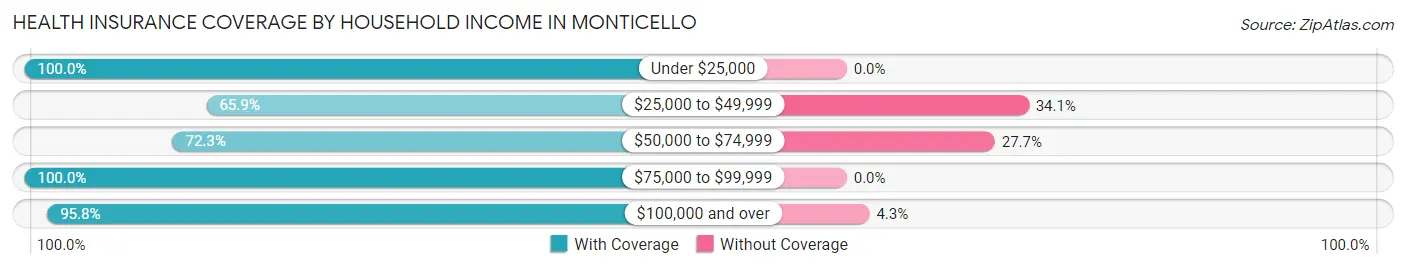
| Household Income | With Coverage | Without Coverage |
| Under $25,000 | 111 (100.0%) | 0 (0.0%) |
| $25,000 to $49,999 | 176 (65.9%) | 91 (34.1%) |
| $50,000 to $74,999 | 370 (72.3%) | 142 (27.7%) |
| $75,000 to $99,999 | 745 (100.0%) | 0 (0.0%) |
| $100,000 and over | 586 (95.8%) | 26 (4.3%) |
Public vs Private Health Insurance Coverage by Age in Monticello
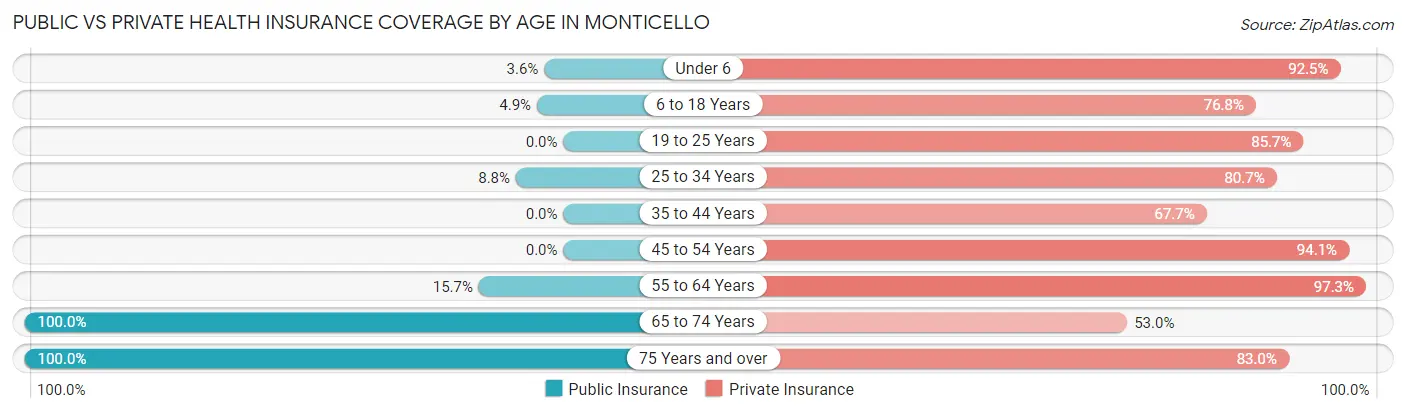
| Age Bracket | Public Insurance | Private Insurance |
| Under 6 | 10 (3.6%) | 260 (92.5%) |
| 6 to 18 Years | 22 (4.9%) | 345 (76.8%) |
| 19 to 25 Years | 0 (0.0%) | 191 (85.7%) |
| 25 to 34 Years | 26 (8.8%) | 238 (80.7%) |
| 35 to 44 Years | 0 (0.0%) | 153 (67.7%) |
| 45 to 54 Years | 0 (0.0%) | 128 (94.1%) |
| 55 to 64 Years | 46 (15.7%) | 285 (97.3%) |
| 65 to 74 Years | 168 (100.0%) | 89 (53.0%) |
| 75 Years and over | 176 (100.0%) | 146 (83.0%) |
| Total | 448 (19.9%) | 1,835 (81.7%) |
Disability Status by Sex by Age in Monticello
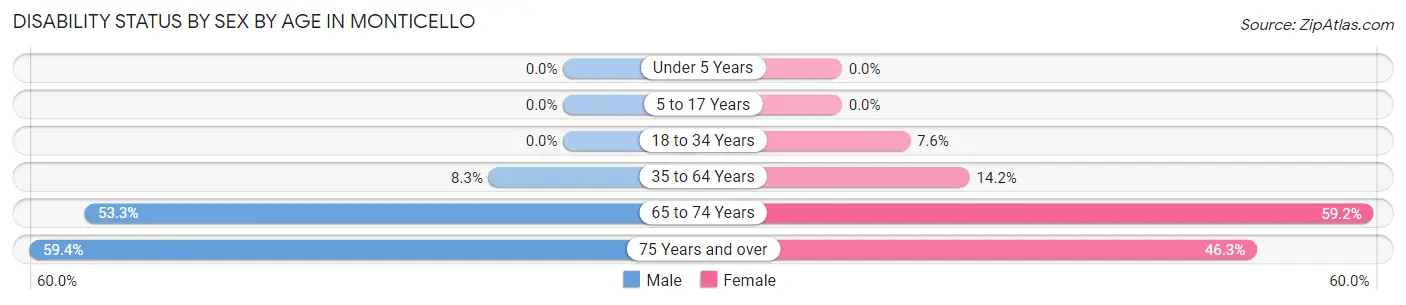
| Age Bracket | Male | Female |
| Under 5 Years | 0 (0.0%) | 0 (0.0%) |
| 5 to 17 Years | 0 (0.0%) | 0 (0.0%) |
| 18 to 34 Years | 0 (0.0%) | 23 (7.6%) |
| 35 to 64 Years | 27 (8.3%) | 47 (14.2%) |
| 65 to 74 Years | 49 (53.3%) | 45 (59.2%) |
| 75 Years and over | 57 (59.4%) | 37 (46.3%) |
Disability Class by Sex by Age in Monticello
Disability Class: Hearing Difficulty
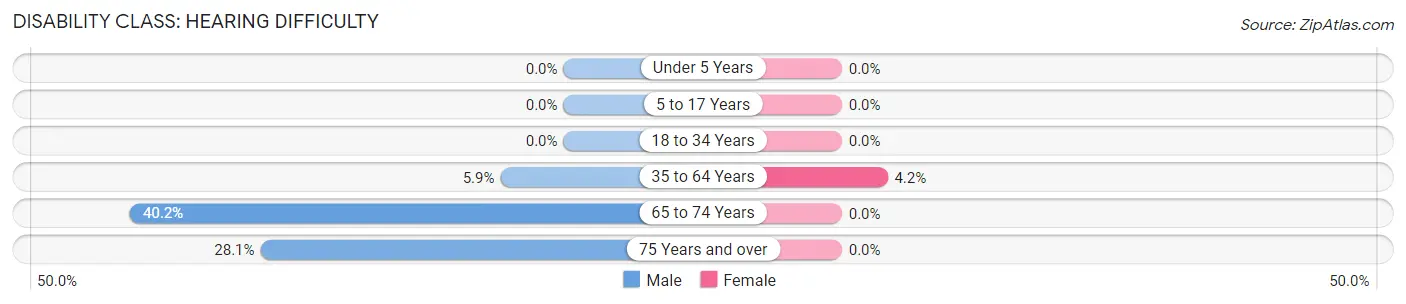
| Age Bracket | Male | Female |
| Under 5 Years | 0 (0.0%) | 0 (0.0%) |
| 5 to 17 Years | 0 (0.0%) | 0 (0.0%) |
| 18 to 34 Years | 0 (0.0%) | 0 (0.0%) |
| 35 to 64 Years | 19 (5.9%) | 14 (4.2%) |
| 65 to 74 Years | 37 (40.2%) | 0 (0.0%) |
| 75 Years and over | 27 (28.1%) | 0 (0.0%) |
Disability Class: Vision Difficulty
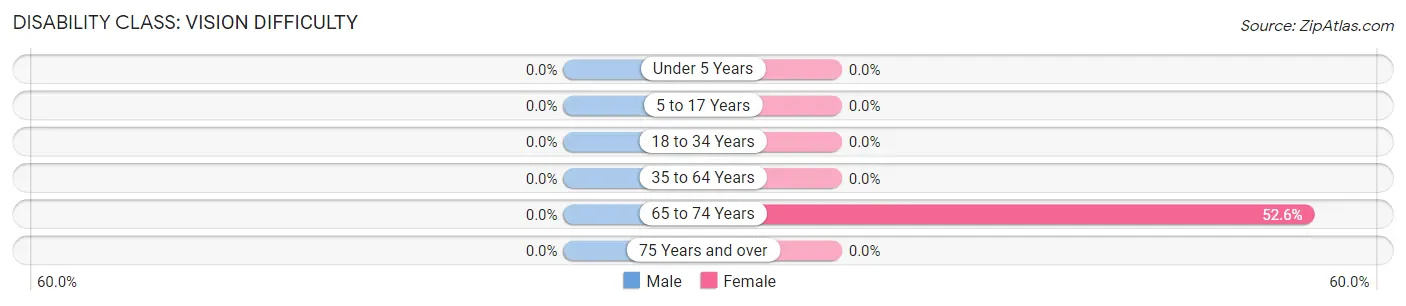
| Age Bracket | Male | Female |
| Under 5 Years | 0 (0.0%) | 0 (0.0%) |
| 5 to 17 Years | 0 (0.0%) | 0 (0.0%) |
| 18 to 34 Years | 0 (0.0%) | 0 (0.0%) |
| 35 to 64 Years | 0 (0.0%) | 0 (0.0%) |
| 65 to 74 Years | 0 (0.0%) | 40 (52.6%) |
| 75 Years and over | 0 (0.0%) | 0 (0.0%) |
Disability Class: Cognitive Difficulty
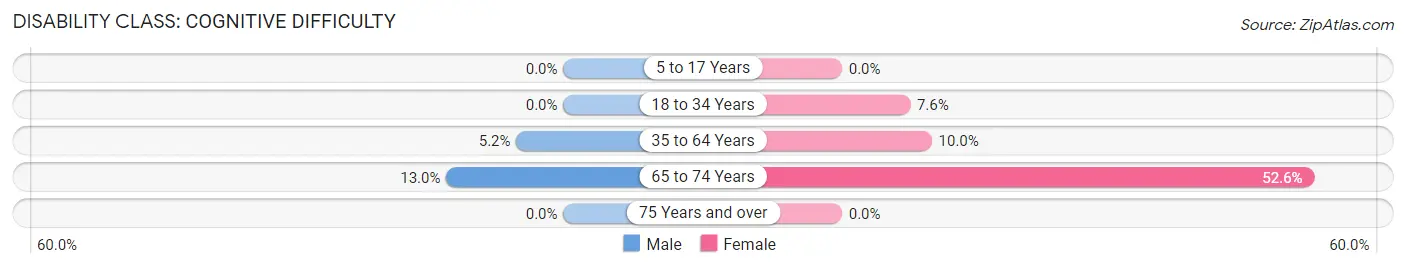
| Age Bracket | Male | Female |
| 5 to 17 Years | 0 (0.0%) | 0 (0.0%) |
| 18 to 34 Years | 0 (0.0%) | 23 (7.6%) |
| 35 to 64 Years | 17 (5.2%) | 33 (10.0%) |
| 65 to 74 Years | 12 (13.0%) | 40 (52.6%) |
| 75 Years and over | 0 (0.0%) | 0 (0.0%) |
Disability Class: Ambulatory Difficulty
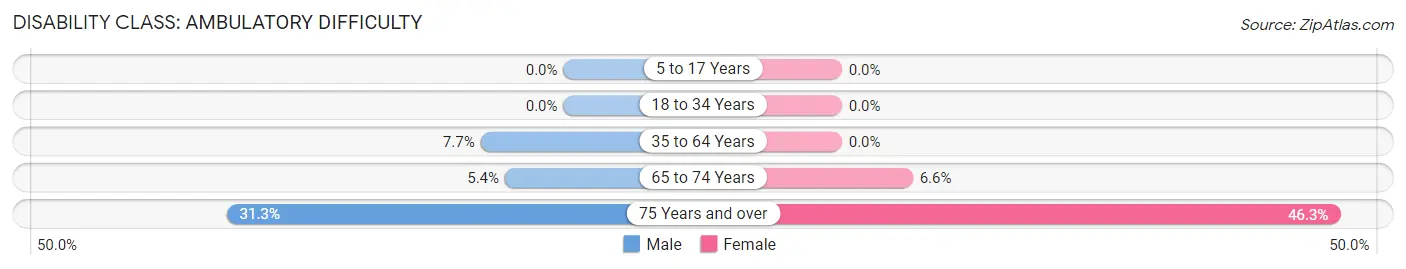
| Age Bracket | Male | Female |
| 5 to 17 Years | 0 (0.0%) | 0 (0.0%) |
| 18 to 34 Years | 0 (0.0%) | 0 (0.0%) |
| 35 to 64 Years | 25 (7.7%) | 0 (0.0%) |
| 65 to 74 Years | 5 (5.4%) | 5 (6.6%) |
| 75 Years and over | 30 (31.2%) | 37 (46.3%) |
Disability Class: Self-Care Difficulty
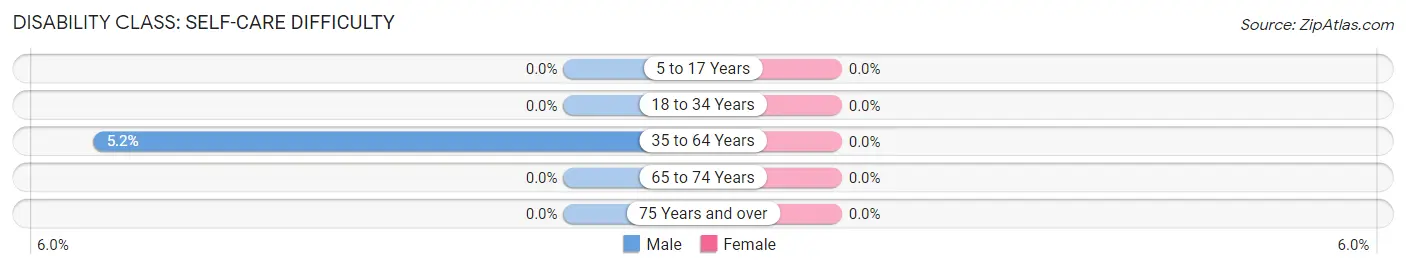
| Age Bracket | Male | Female |
| 5 to 17 Years | 0 (0.0%) | 0 (0.0%) |
| 18 to 34 Years | 0 (0.0%) | 0 (0.0%) |
| 35 to 64 Years | 17 (5.2%) | 0 (0.0%) |
| 65 to 74 Years | 0 (0.0%) | 0 (0.0%) |
| 75 Years and over | 0 (0.0%) | 0 (0.0%) |
Technology Access in Monticello
Computing Device Access in Monticello
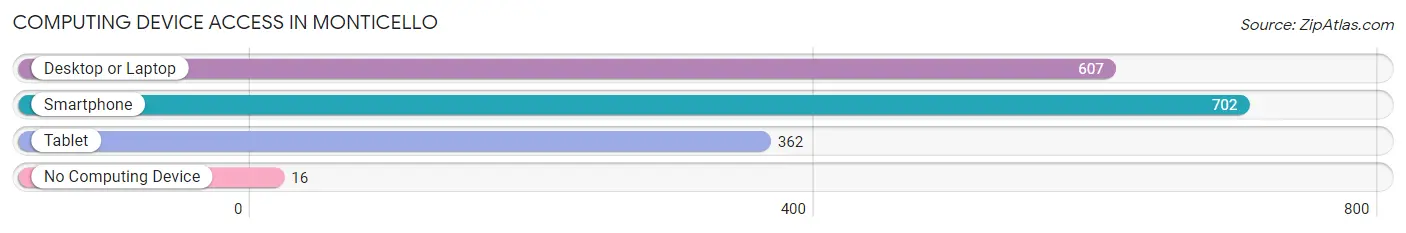
| Device Type | # Households | % Households |
| Desktop or Laptop | 607 | 84.5% |
| Smartphone | 702 | 97.8% |
| Tablet | 362 | 50.4% |
| No Computing Device | 16 | 2.2% |
| Total | 718 | 100.0% |
Internet Access in Monticello
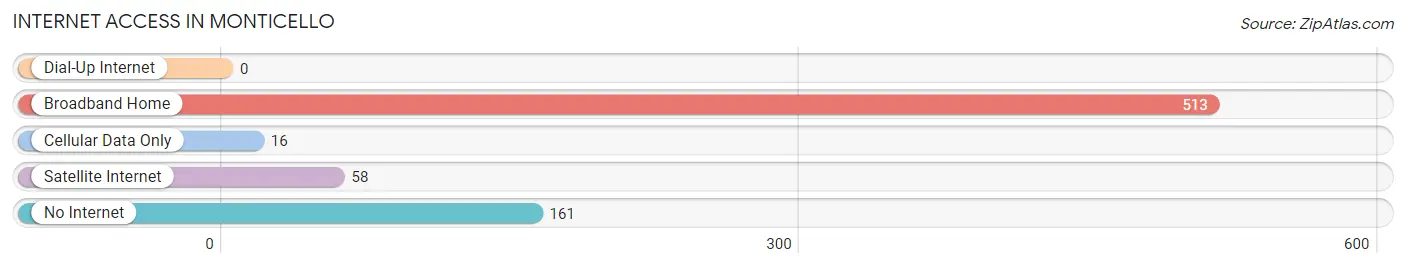
| Internet Type | # Households | % Households |
| Dial-Up Internet | 0 | 0.0% |
| Broadband Home | 513 | 71.5% |
| Cellular Data Only | 16 | 2.2% |
| Satellite Internet | 58 | 8.1% |
| No Internet | 161 | 22.4% |
| Total | 718 | 100.0% |
Monticello Summary
Monticello, Utah is a small city located in San Juan County in the southeastern corner of the state. It is the county seat and the largest city in the county. The city is situated in a valley surrounded by the Abajo Mountains to the east and the La Sal Mountains to the west. The population of Monticello was 2,097 at the 2010 census, making it the smallest city in the state with a population over 2,000.
History
Monticello was founded in 1887 by Mormon settlers who were sent to the area by the Church of Jesus Christ of Latter-day Saints. The settlers were sent to the area to establish a new settlement and to help develop the area’s resources. The city was named after the Italian city of Monticello, which was the home of Thomas Jefferson.
The city was incorporated in 1891 and has since grown to become the largest city in San Juan County. The city has a rich history and has been home to many notable people, including Butch Cassidy, who was born in Monticello in 1866.
Geography
Monticello is located in the southeastern corner of Utah, in San Juan County. The city is situated in a valley surrounded by the Abajo Mountains to the east and the La Sal Mountains to the west. The city is located at an elevation of 6,000 feet and has a total area of 4.2 square miles.
The climate in Monticello is semi-arid, with hot summers and cold winters. The average high temperature in the summer is 90 degrees Fahrenheit, and the average low temperature in the winter is 20 degrees Fahrenheit.
Economy
The economy of Monticello is largely based on tourism and agriculture. The city is home to several tourist attractions, including the Monticello Utah Temple, the Monticello Utah State Park, and the Monticello Utah Museum.
Agriculture is also an important part of the economy, with the city being home to several farms and ranches. The city is also home to several businesses, including restaurants, retail stores, and service providers.
Demographics
As of the 2010 census, the population of Monticello was 2,097. The racial makeup of the city was 94.3% White, 0.7% African American, 0.7% Native American, 0.3% Asian, 0.1% Pacific Islander, 2.2% from other races, and 1.9% from two or more races. Hispanic or Latino of any race were 5.2% of the population.
The median income for a household in the city was $37,917, and the median income for a family was $45,000. The per capita income for the city was $18,945. About 11.2% of families and 14.2% of the population were below the poverty line, including 17.2% of those under age 18 and 8.3% of those age 65 or over.
Common Questions
What is the Total Population of Monticello?
Total Population of Monticello is 2,393.
What is the Total Male Population of Monticello?
Total Male Population of Monticello is 1,222.
What is the Total Female Population of Monticello?
Total Female Population of Monticello is 1,171.
What is the Ratio of Males per 100 Females in Monticello?
There are 104.36 Males per 100 Females in Monticello.
What is the Ratio of Females per 100 Males in Monticello?
There are 95.83 Females per 100 Males in Monticello.
What is the Median Population Age in Monticello?
Median Population Age in Monticello is 29.9 Years.
What is the Average Family Size in Monticello
Average Family Size in Monticello is 3.6 People.
What is the Average Household Size in Monticello
Average Household Size in Monticello is 3.1 People.
What is Per Capita Income in Monticello?
Per Capita income in Monticello is $26,860.
What is the Median Family Income in Monticello?
Median Family Income in Monticello is $83,043.
What is the Median Household income in Monticello?
Median Household Income in Monticello is $71,833.
What is Income or Wage Gap in Monticello?
Income or Wage Gap in Monticello is 74.2%.
Women in Monticello earn 25.8 cents for every dollar earned by a man.
What is Inequality or Gini Index in Monticello?
Inequality or Gini Index in Monticello is 0.32.
How Large is the Labor Force in Monticello?
There are 808 People in the Labor Forcein in Monticello.
What is the Percentage of People in the Labor Force in Monticello?
47.0% of People are in the Labor Force in Monticello.