Mayfield, UT
Mayfield Map
Mayfield Overview
416
TOTAL POPULATION
203
MALE POPULATION
213
FEMALE POPULATION
95.31
MALES / 100 FEMALES
104.93
FEMALES / 100 MALES
38.9
MEDIAN AGE
3.5
AVG FAMILY SIZE
3.3
AVG HOUSEHOLD SIZE
$29,687
PER CAPITA INCOME
$95,500
AVG FAMILY INCOME
$85,000
AVG HOUSEHOLD INCOME
74.9%
WAGE / INCOME GAP [ % ]
25.1¢/ $1
WAGE / INCOME GAP [ $ ]
0.33
INEQUALITY / GINI INDEX
179
LABOR FORCE [ PEOPLE ]
59.7%
PERCENT IN LABOR FORCE
2.2%
UNEMPLOYMENT RATE
Mayfield Zip Codes
Mayfield Area Codes
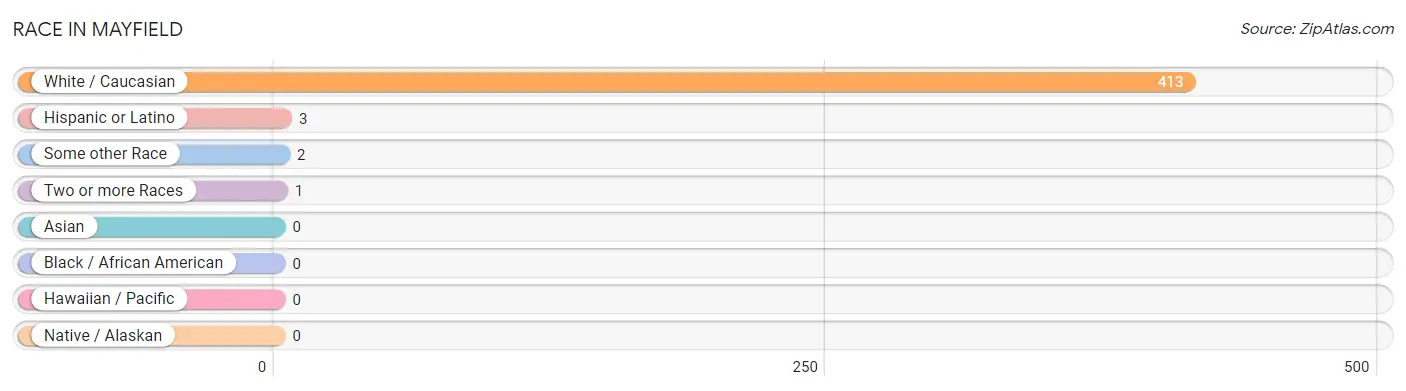
Race in Mayfield
The most populous races in Mayfield are White / Caucasian (413 | 99.3%), Hispanic or Latino (3 | 0.7%), and Some other Race (2 | 0.5%).
| Race | # Population | % Population |
| Asian | 0 | 0.0% |
| Black / African American | 0 | 0.0% |
| Hawaiian / Pacific | 0 | 0.0% |
| Hispanic or Latino | 3 | 0.7% |
| Native / Alaskan | 0 | 0.0% |
| White / Caucasian | 413 | 99.3% |
| Two or more Races | 1 | 0.2% |
| Some other Race | 2 | 0.5% |
| Total | 416 | 100.0% |
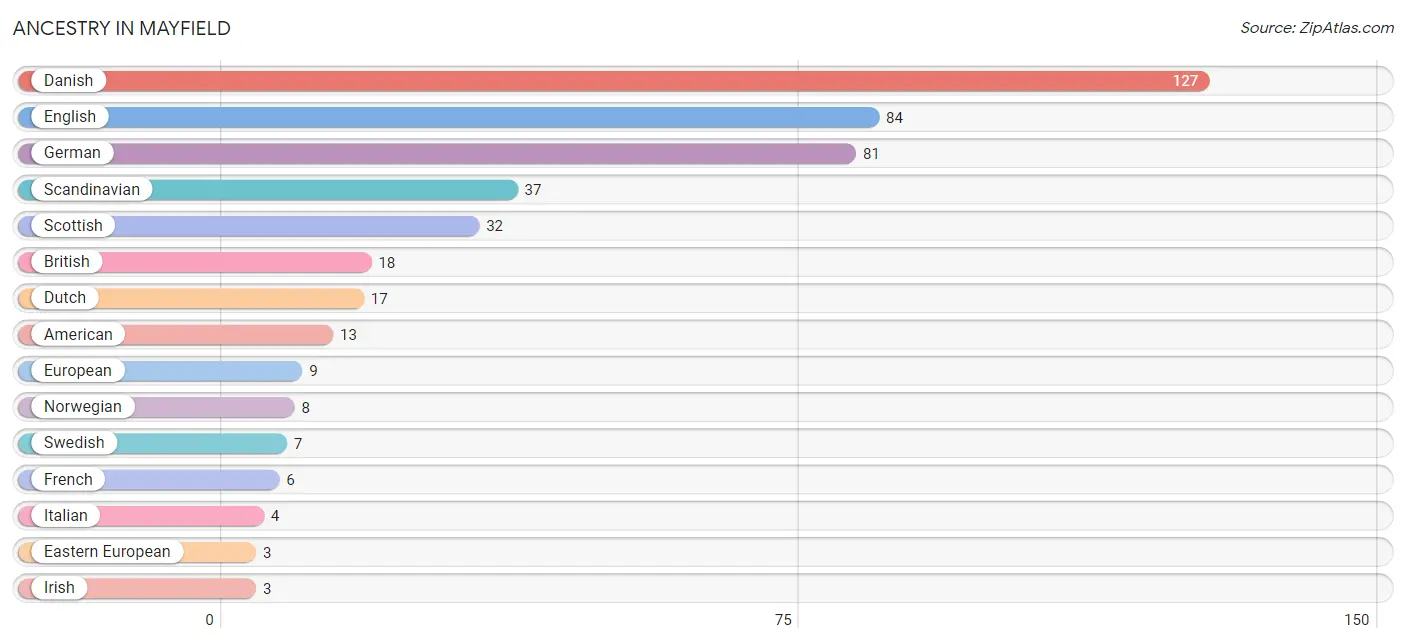
Ancestry in Mayfield
The most populous ancestries reported in Mayfield are Danish (127 | 30.5%), English (84 | 20.2%), German (81 | 19.5%), Scandinavian (37 | 8.9%), and Scottish (32 | 7.7%), together accounting for 86.8% of all Mayfield residents.
| Ancestry | # Population | % Population |
| American | 13 | 3.1% |
| Armenian | 1 | 0.2% |
| British | 18 | 4.3% |
| Central American | 1 | 0.2% |
| Danish | 127 | 30.5% |
| Dutch | 17 | 4.1% |
| Eastern European | 3 | 0.7% |
| English | 84 | 20.2% |
| European | 9 | 2.2% |
| French | 6 | 1.4% |
| German | 81 | 19.5% |
| Honduran | 1 | 0.2% |
| Irish | 3 | 0.7% |
| Italian | 4 | 1.0% |
| Mexican | 2 | 0.5% |
| Norwegian | 8 | 1.9% |
| Scandinavian | 37 | 8.9% |
| Scottish | 32 | 7.7% |
| Swedish | 7 | 1.7% |
| Swiss | 2 | 0.5% | View All 20 Rows |
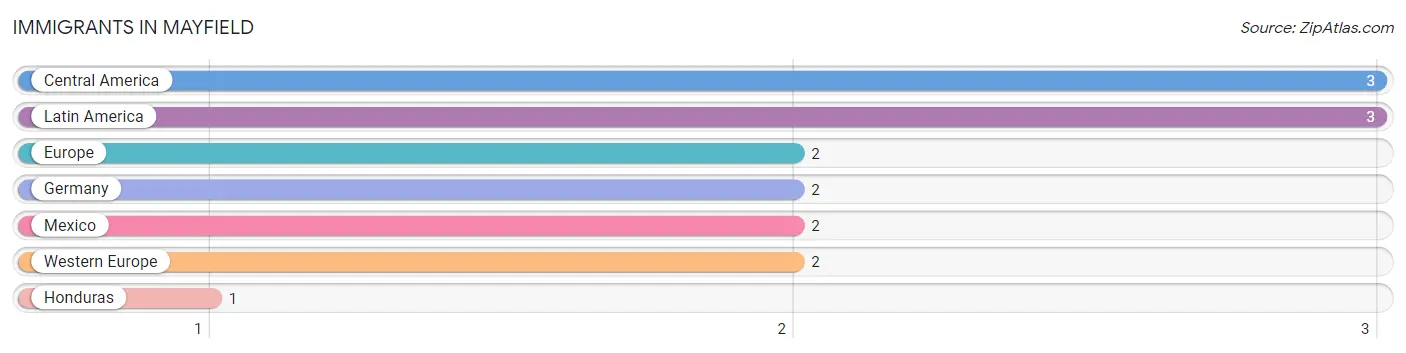
Immigrants in Mayfield
The most numerous immigrant groups reported in Mayfield came from Central America (3 | 0.7%), Latin America (3 | 0.7%), Europe (2 | 0.5%), Germany (2 | 0.5%), and Mexico (2 | 0.5%), together accounting for 2.9% of all Mayfield residents.
| Immigration Origin | # Population | % Population |
| Central America | 3 | 0.7% |
| Europe | 2 | 0.5% |
| Germany | 2 | 0.5% |
| Honduras | 1 | 0.2% |
| Latin America | 3 | 0.7% |
| Mexico | 2 | 0.5% |
| Western Europe | 2 | 0.5% | View All 7 Rows |
Sex and Age in Mayfield
Sex and Age in Mayfield
The most populous age groups in Mayfield are 5 to 9 Years (30 | 14.8%) for men and 15 to 19 Years (26 | 12.2%) for women.
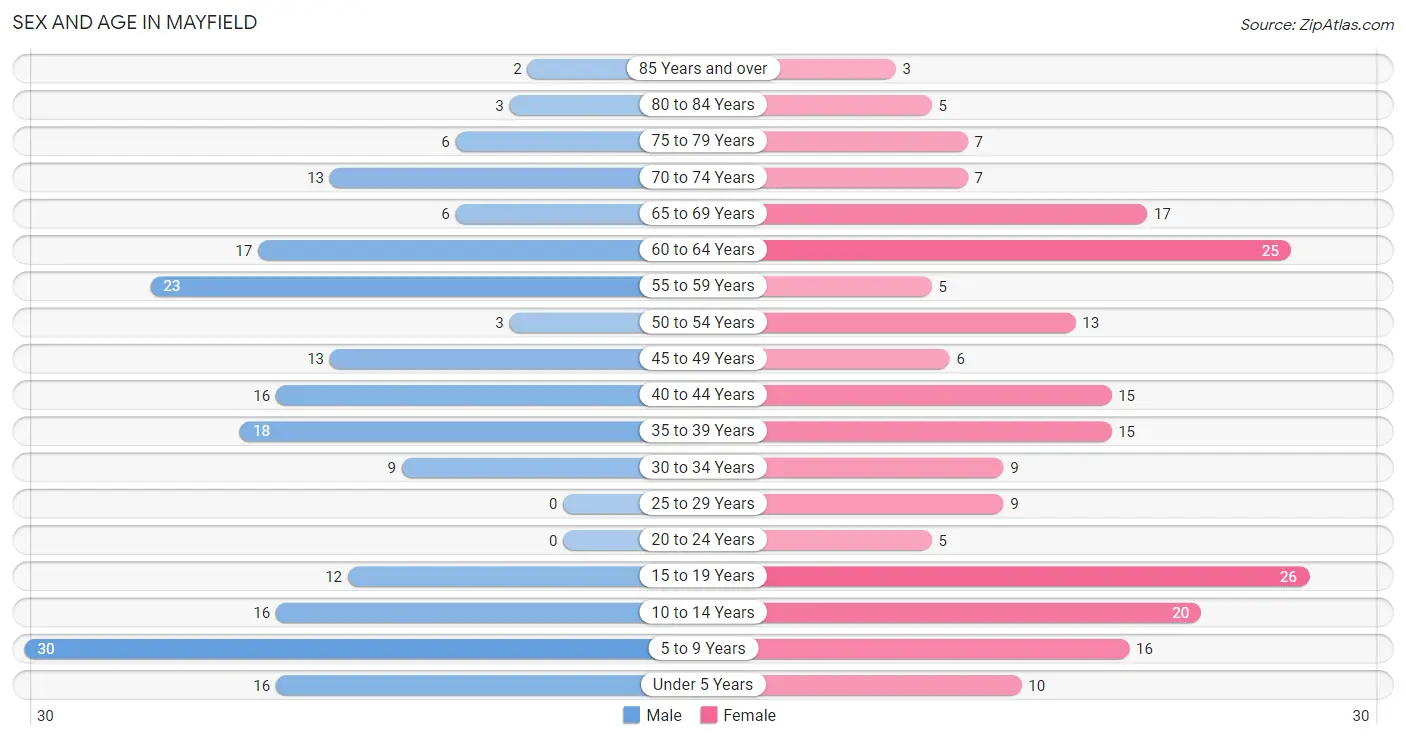
| Age Bracket | Male | Female |
| Under 5 Years | 16 (7.9%) | 10 (4.7%) |
| 5 to 9 Years | 30 (14.8%) | 16 (7.5%) |
| 10 to 14 Years | 16 (7.9%) | 20 (9.4%) |
| 15 to 19 Years | 12 (5.9%) | 26 (12.2%) |
| 20 to 24 Years | 0 (0.0%) | 5 (2.4%) |
| 25 to 29 Years | 0 (0.0%) | 9 (4.2%) |
| 30 to 34 Years | 9 (4.4%) | 9 (4.2%) |
| 35 to 39 Years | 18 (8.9%) | 15 (7.0%) |
| 40 to 44 Years | 16 (7.9%) | 15 (7.0%) |
| 45 to 49 Years | 13 (6.4%) | 6 (2.8%) |
| 50 to 54 Years | 3 (1.5%) | 13 (6.1%) |
| 55 to 59 Years | 23 (11.3%) | 5 (2.4%) |
| 60 to 64 Years | 17 (8.4%) | 25 (11.7%) |
| 65 to 69 Years | 6 (3.0%) | 17 (8.0%) |
| 70 to 74 Years | 13 (6.4%) | 7 (3.3%) |
| 75 to 79 Years | 6 (3.0%) | 7 (3.3%) |
| 80 to 84 Years | 3 (1.5%) | 5 (2.4%) |
| 85 Years and over | 2 (1.0%) | 3 (1.4%) |
| Total | 203 (100.0%) | 213 (100.0%) |
Families and Households in Mayfield
Median Family Size in Mayfield
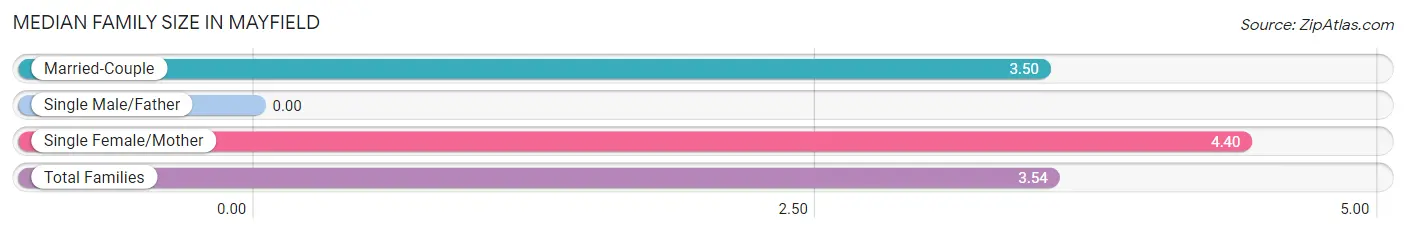
| Family Type | # Families | Family Size |
| Married-Couple | 107 (95.5%) | 3.50 |
| Single Male/Father | 0 (0.0%) | - |
| Single Female/Mother | 5 (4.5%) | 4.40 |
| Total Families | 112 (100.0%) | 3.54 |
Median Household Size in Mayfield
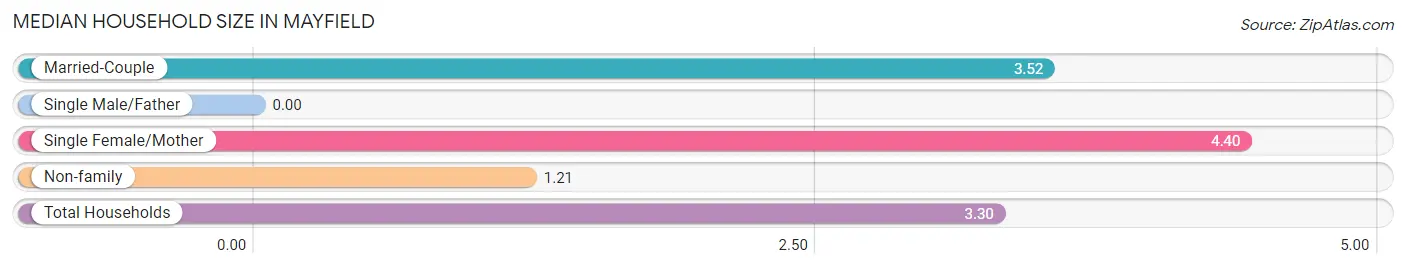
| Household Type | # Households | Household Size |
| Married-Couple | 107 (84.9%) | 3.52 |
| Single Male/Father | 0 (0.0%) | - |
| Single Female/Mother | 5 (4.0%) | 4.40 |
| Non-family | 14 (11.1%) | 1.21 |
| Total Households | 126 (100.0%) | 3.30 |
Household Size by Marriage Status in Mayfield
Out of a total of 126 households in Mayfield, 112 (88.9%) are family households, while 14 (11.1%) are nonfamily households. The most numerous type of family households are 2-person households, comprising 51, and the most common type of nonfamily households are 1-person households, comprising 11.
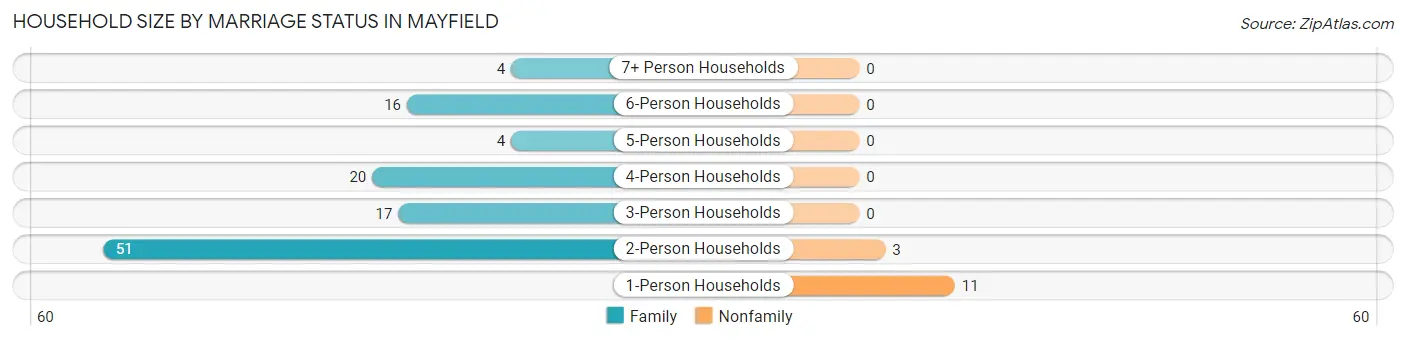
| Household Size | Family Households | Nonfamily Households |
| 1-Person Households | - | 11 (8.7%) |
| 2-Person Households | 51 (40.5%) | 3 (2.4%) |
| 3-Person Households | 17 (13.5%) | 0 (0.0%) |
| 4-Person Households | 20 (15.9%) | 0 (0.0%) |
| 5-Person Households | 4 (3.2%) | 0 (0.0%) |
| 6-Person Households | 16 (12.7%) | 0 (0.0%) |
| 7+ Person Households | 4 (3.2%) | 0 (0.0%) |
| Total | 112 (88.9%) | 14 (11.1%) |
Female Fertility in Mayfield
Fertility by Age in Mayfield
| Age Bracket | Women with Births | Births / 1,000 Women |
| 15 to 19 years | 0 (0.0%) | 0.0 |
| 20 to 34 years | 0 (0.0%) | 0.0 |
| 35 to 50 years | 0 (0.0%) | 0.0 |
| Total | 0 (0.0%) | 0.0 |
Fertility by Age by Marriage Status in Mayfield
| Age Bracket | Married | Unmarried |
| 15 to 19 years | 0 (0.0%) | 0 (0.0%) |
| 20 to 34 years | 0 (0.0%) | 0 (0.0%) |
| 35 to 50 years | 0 (0.0%) | 0 (0.0%) |
| Total | 0 (0.0%) | 0 (0.0%) |
Fertility by Education in Mayfield
| Educational Attainment | Women with Births | Births / 1,000 Women |
| Less than High School | 0 (0.0%) | 0.0 |
| High School Diploma | 0 (0.0%) | 0.0 |
| College or Associate's Degree | 0 (0.0%) | 0.0 |
| Bachelor's Degree | 0 (0.0%) | 0.0 |
| Graduate Degree | 0 (0.0%) | 0.0 |
| Total | 0 (0.0%) | 0.0 |
Fertility by Education by Marriage Status in Mayfield
| Educational Attainment | Married | Unmarried |
| Less than High School | 0 (0.0%) | 0 (0.0%) |
| High School Diploma | 0 (0.0%) | 0 (0.0%) |
| College or Associate's Degree | 0 (0.0%) | 0 (0.0%) |
| Bachelor's Degree | 0 (0.0%) | 0 (0.0%) |
| Graduate Degree | 0 (0.0%) | 0 (0.0%) |
| Total | 0 (0.0%) | 0 (0.0%) |
Income in Mayfield
Income Overview in Mayfield
Per Capita Income in Mayfield is $29,687, while median incomes of families and households are $95,500 and $85,000 respectively.
| Characteristic | Number | Measure |
| Per Capita Income | 416 | $29,687 |
| Median Family Income | 112 | $95,500 |
| Mean Family Income | 112 | $100,128 |
| Median Household Income | 126 | $85,000 |
| Mean Household Income | 126 | $94,475 |
| Income Deficit | 112 | $0 |
| Wage / Income Gap (%) | 416 | 74.92% |
| Wage / Income Gap ($) | 416 | 25.08¢ per $1 |
| Gini / Inequality Index | 416 | 0.33 |
Earnings by Sex in Mayfield
Average Earnings in Mayfield are $40,469, $58,571 for men and $14,688 for women, a difference of 74.9%.
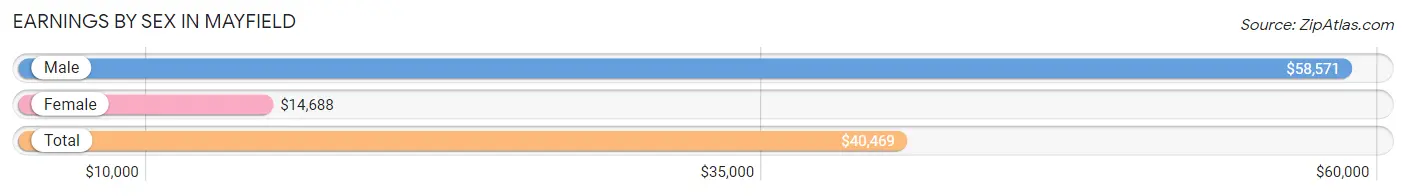
| Sex | Number | Average Earnings |
| Male | 96 (49.2%) | $58,571 |
| Female | 99 (50.8%) | $14,688 |
| Total | 195 (100.0%) | $40,469 |
Earnings by Sex by Income Bracket in Mayfield
The most common earnings brackets in Mayfield are $55,000 to $64,999 for men (20 | 20.8%) and $2,500 to $4,999 for women (17 | 17.2%).
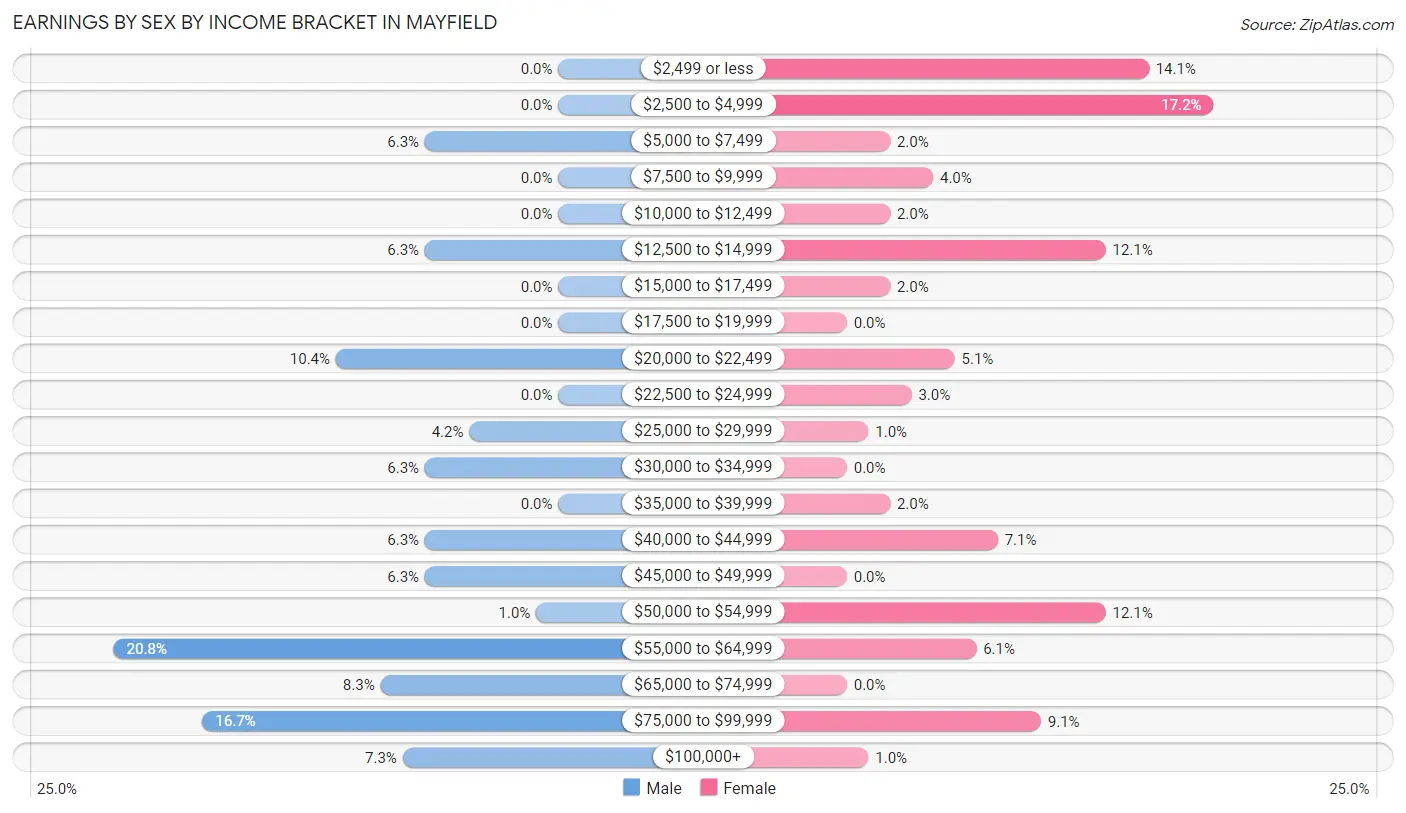
| Income | Male | Female |
| $2,499 or less | 0 (0.0%) | 14 (14.1%) |
| $2,500 to $4,999 | 0 (0.0%) | 17 (17.2%) |
| $5,000 to $7,499 | 6 (6.2%) | 2 (2.0%) |
| $7,500 to $9,999 | 0 (0.0%) | 4 (4.0%) |
| $10,000 to $12,499 | 0 (0.0%) | 2 (2.0%) |
| $12,500 to $14,999 | 6 (6.2%) | 12 (12.1%) |
| $15,000 to $17,499 | 0 (0.0%) | 2 (2.0%) |
| $17,500 to $19,999 | 0 (0.0%) | 0 (0.0%) |
| $20,000 to $22,499 | 10 (10.4%) | 5 (5.1%) |
| $22,500 to $24,999 | 0 (0.0%) | 3 (3.0%) |
| $25,000 to $29,999 | 4 (4.2%) | 1 (1.0%) |
| $30,000 to $34,999 | 6 (6.2%) | 0 (0.0%) |
| $35,000 to $39,999 | 0 (0.0%) | 2 (2.0%) |
| $40,000 to $44,999 | 6 (6.2%) | 7 (7.1%) |
| $45,000 to $49,999 | 6 (6.2%) | 0 (0.0%) |
| $50,000 to $54,999 | 1 (1.0%) | 12 (12.1%) |
| $55,000 to $64,999 | 20 (20.8%) | 6 (6.1%) |
| $65,000 to $74,999 | 8 (8.3%) | 0 (0.0%) |
| $75,000 to $99,999 | 16 (16.7%) | 9 (9.1%) |
| $100,000+ | 7 (7.3%) | 1 (1.0%) |
| Total | 96 (100.0%) | 99 (100.0%) |
Earnings by Sex by Educational Attainment in Mayfield
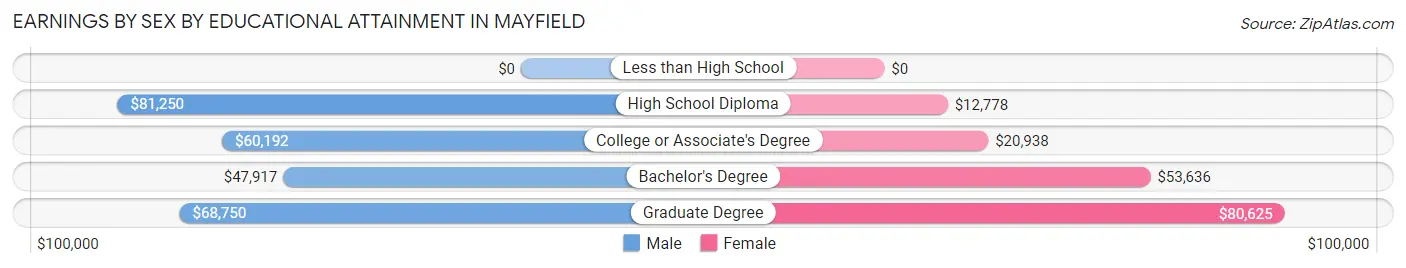
| Educational Attainment | Male Income | Female Income |
| Less than High School | - | - |
| High School Diploma | $81,250 | $12,778 |
| College or Associate's Degree | $60,192 | $20,938 |
| Bachelor's Degree | $47,917 | $53,636 |
| Graduate Degree | $68,750 | $80,625 |
| Total | $60,288 | $0 |
Family Income in Mayfield
Family Income Brackets in Mayfield
According to the Mayfield family income data, there are 30 families falling into the $100,000 to $149,999 income range, which is the most common income bracket and makes up 26.8% of all families.
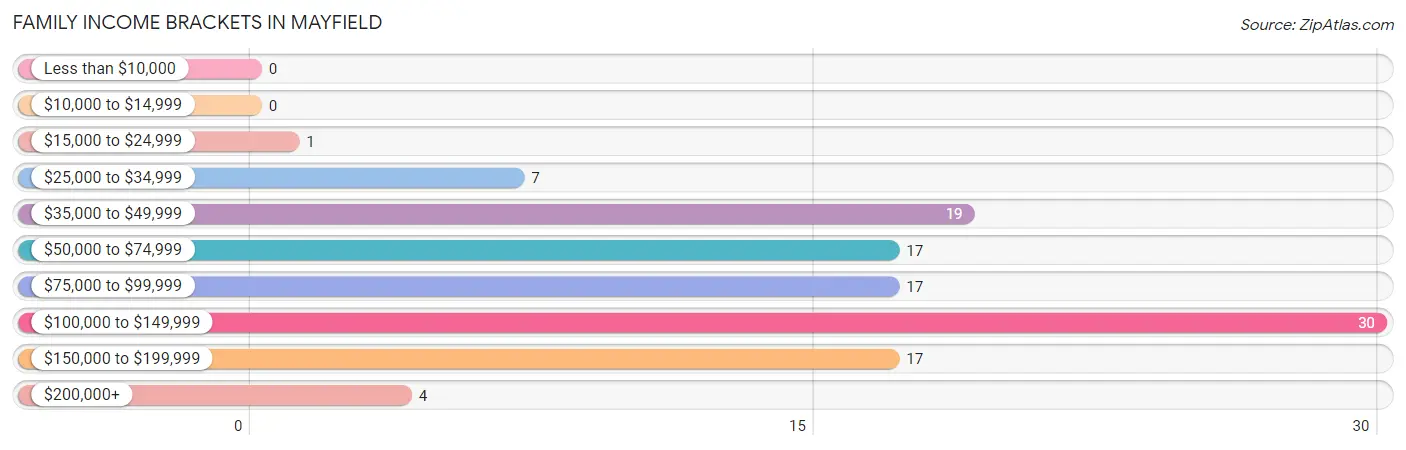
| Income Bracket | # Families | % Families |
| Less than $10,000 | 0 | 0.0% |
| $10,000 to $14,999 | 0 | 0.0% |
| $15,000 to $24,999 | 1 | 0.9% |
| $25,000 to $34,999 | 7 | 6.3% |
| $35,000 to $49,999 | 19 | 17.0% |
| $50,000 to $74,999 | 17 | 15.2% |
| $75,000 to $99,999 | 17 | 15.2% |
| $100,000 to $149,999 | 30 | 26.8% |
| $150,000 to $199,999 | 17 | 15.2% |
| $200,000+ | 4 | 3.6% |
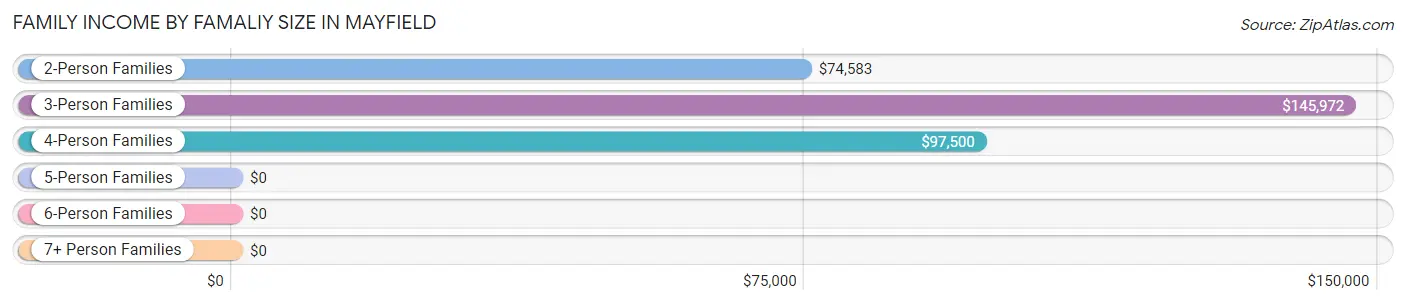
Family Income by Famaliy Size in Mayfield
3-person families (17 | 15.2%) account for the highest median family income in Mayfield with $145,972 per family, while 3-person families (17 | 15.2%) have the highest median income of $48,657 per family member.
| Income Bracket | # Families | Median Income |
| 2-Person Families | 51 (45.5%) | $74,583 |
| 3-Person Families | 17 (15.2%) | $145,972 |
| 4-Person Families | 20 (17.9%) | $97,500 |
| 5-Person Families | 6 (5.4%) | $0 |
| 6-Person Families | 14 (12.5%) | $0 |
| 7+ Person Families | 4 (3.6%) | $0 |
| Total | 112 (100.0%) | $95,500 |
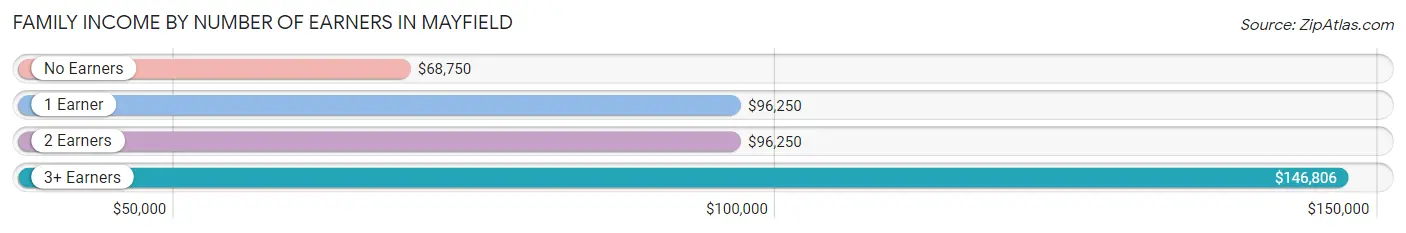
Family Income by Number of Earners in Mayfield
The median family income in Mayfield is $95,500, with families comprising 3+ earners (19) having the highest median family income of $146,806, while families with no earners (24) have the lowest median family income of $68,750, accounting for 17.0% and 21.4% of families, respectively.
| Number of Earners | # Families | Median Income |
| No Earners | 24 (21.4%) | $68,750 |
| 1 Earner | 30 (26.8%) | $96,250 |
| 2 Earners | 39 (34.8%) | $96,250 |
| 3+ Earners | 19 (17.0%) | $146,806 |
| Total | 112 (100.0%) | $95,500 |
Household Income in Mayfield
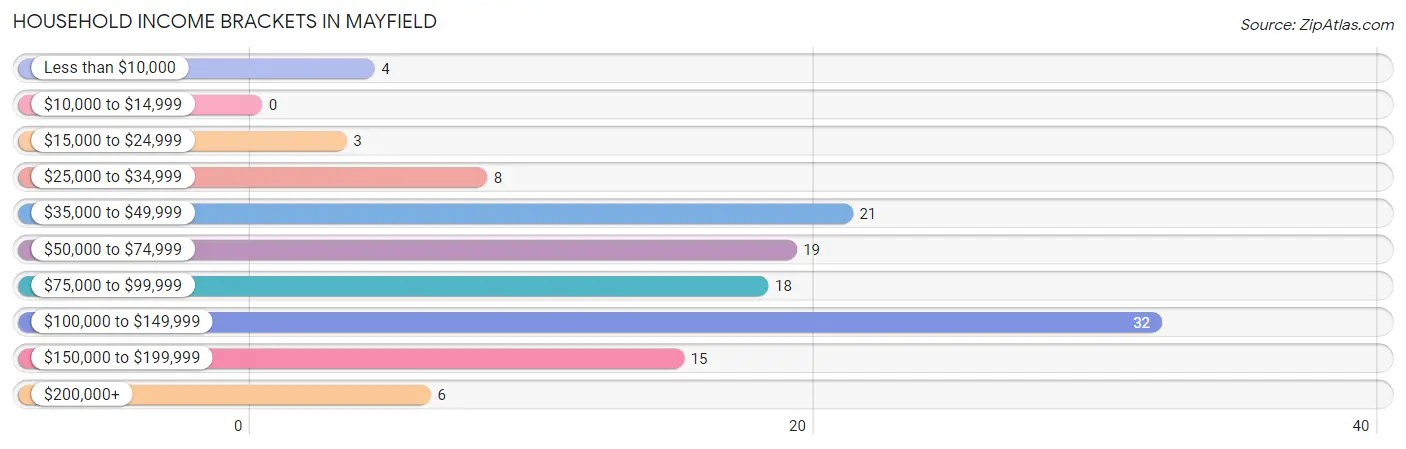
Household Income Brackets in Mayfield
With 32 households falling in the category, the $100,000 to $149,999 income range is the most frequent in Mayfield, accounting for 25.4% of all households.
| Income Bracket | # Households | % Households |
| Less than $10,000 | 4 | 3.2% |
| $10,000 to $14,999 | 0 | 0.0% |
| $15,000 to $24,999 | 3 | 2.4% |
| $25,000 to $34,999 | 8 | 6.3% |
| $35,000 to $49,999 | 21 | 16.7% |
| $50,000 to $74,999 | 19 | 15.1% |
| $75,000 to $99,999 | 18 | 14.3% |
| $100,000 to $149,999 | 32 | 25.4% |
| $150,000 to $199,999 | 15 | 11.9% |
| $200,000+ | 6 | 4.8% |
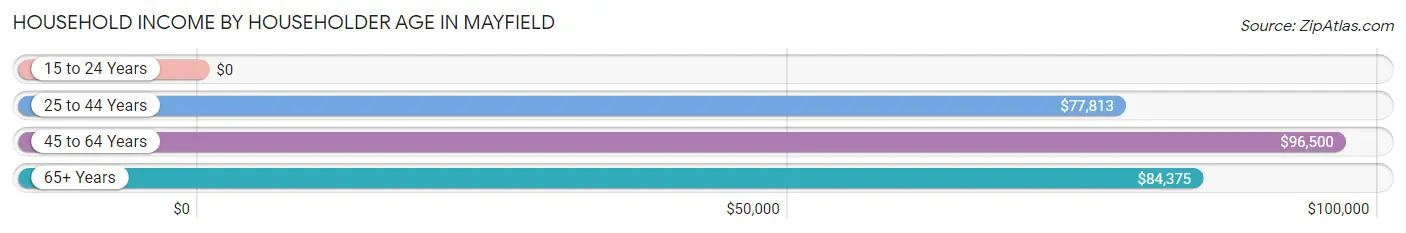
Household Income by Householder Age in Mayfield
The median household income in Mayfield is $85,000, with the highest median household income of $96,500 found in the 45 to 64 years age bracket for the primary householder. A total of 50 households (39.7%) fall into this category.
| Income Bracket | # Households | Median Income |
| 15 to 24 Years | 0 (0.0%) | $0 |
| 25 to 44 Years | 39 (30.9%) | $77,813 |
| 45 to 64 Years | 50 (39.7%) | $96,500 |
| 65+ Years | 37 (29.4%) | $84,375 |
| Total | 126 (100.0%) | $85,000 |
Poverty in Mayfield
Income Below Poverty by Sex and Age in Mayfield
With 19.2% poverty level for males and 17.8% for females among the residents of Mayfield, under 5 year old males and under 5 year old females are the most vulnerable to poverty, with 9 males (56.2%) and 10 females (100.0%) in their respective age groups living below the poverty level.
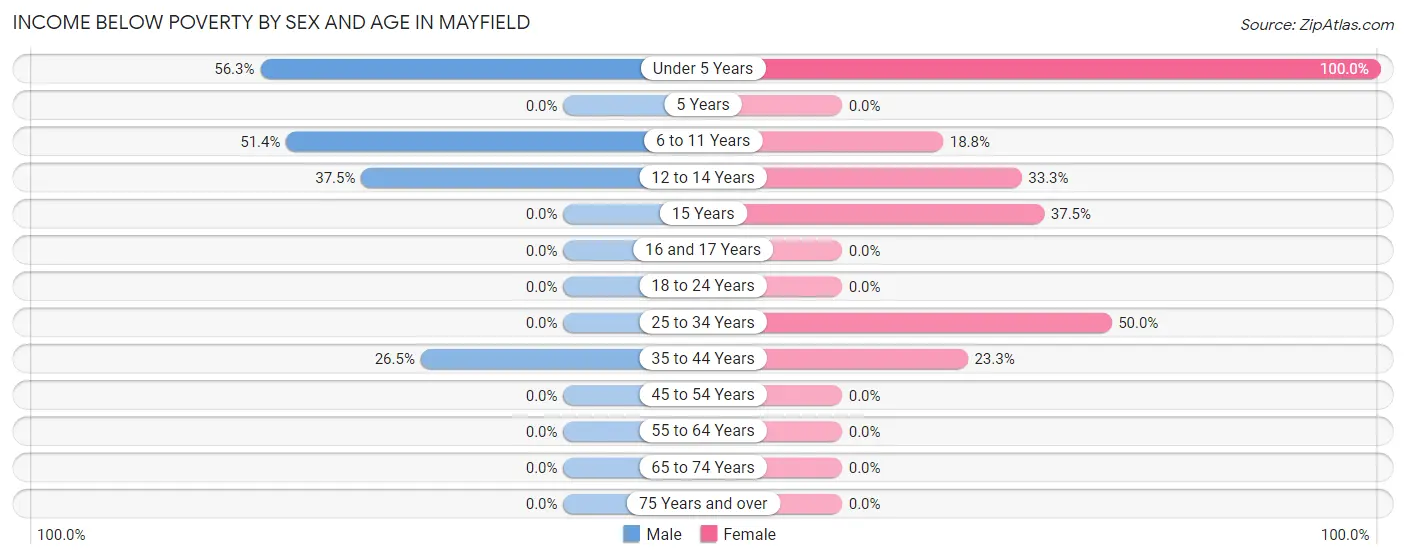
| Age Bracket | Male | Female |
| Under 5 Years | 9 (56.2%) | 10 (100.0%) |
| 5 Years | 0 (0.0%) | 0 (0.0%) |
| 6 to 11 Years | 18 (51.4%) | 3 (18.8%) |
| 12 to 14 Years | 3 (37.5%) | 6 (33.3%) |
| 15 Years | 0 (0.0%) | 3 (37.5%) |
| 16 and 17 Years | 0 (0.0%) | 0 (0.0%) |
| 18 to 24 Years | 0 (0.0%) | 0 (0.0%) |
| 25 to 34 Years | 0 (0.0%) | 9 (50.0%) |
| 35 to 44 Years | 9 (26.5%) | 7 (23.3%) |
| 45 to 54 Years | 0 (0.0%) | 0 (0.0%) |
| 55 to 64 Years | 0 (0.0%) | 0 (0.0%) |
| 65 to 74 Years | 0 (0.0%) | 0 (0.0%) |
| 75 Years and over | 0 (0.0%) | 0 (0.0%) |
| Total | 39 (19.2%) | 38 (17.8%) |
Income Above Poverty by Sex and Age in Mayfield
According to the poverty statistics in Mayfield, males aged 5 years and females aged 5 years are the age groups that are most secure financially, with 100.0% of males and 100.0% of females in these age groups living above the poverty line.
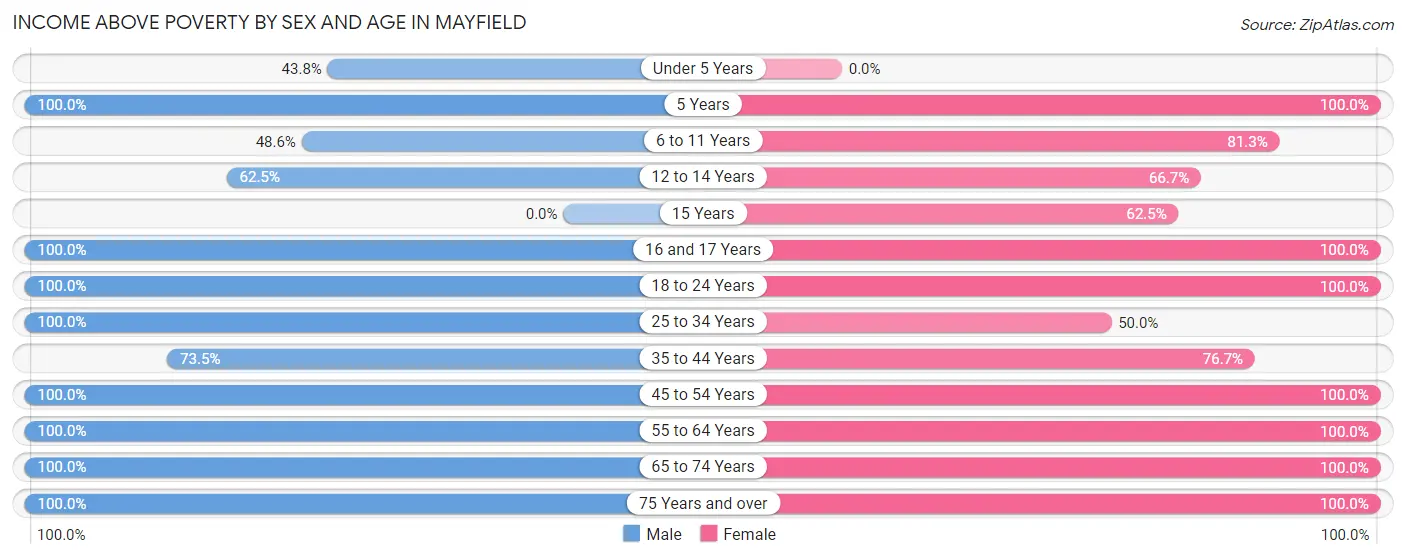
| Age Bracket | Male | Female |
| Under 5 Years | 7 (43.8%) | 0 (0.0%) |
| 5 Years | 3 (100.0%) | 2 (100.0%) |
| 6 to 11 Years | 17 (48.6%) | 13 (81.2%) |
| 12 to 14 Years | 5 (62.5%) | 12 (66.7%) |
| 15 Years | 0 (0.0%) | 5 (62.5%) |
| 16 and 17 Years | 2 (100.0%) | 17 (100.0%) |
| 18 to 24 Years | 10 (100.0%) | 6 (100.0%) |
| 25 to 34 Years | 9 (100.0%) | 9 (50.0%) |
| 35 to 44 Years | 25 (73.5%) | 23 (76.7%) |
| 45 to 54 Years | 16 (100.0%) | 19 (100.0%) |
| 55 to 64 Years | 40 (100.0%) | 30 (100.0%) |
| 65 to 74 Years | 19 (100.0%) | 24 (100.0%) |
| 75 Years and over | 11 (100.0%) | 15 (100.0%) |
| Total | 164 (80.8%) | 175 (82.2%) |
Income Below Poverty Among Married-Couple Families in Mayfield
The poverty statistics for married-couple families in Mayfield show that 8.4% or 9 of the total 107 families live below the poverty line. Families with 5 or more children have the highest poverty rate of 100.0%, comprising of 3 families. On the other hand, families with no children have the lowest poverty rate of 0.0%, which includes 0 families.
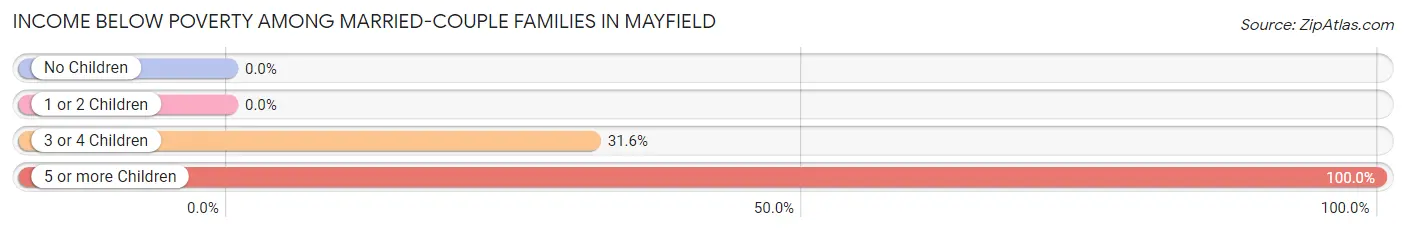
| Children | Above Poverty | Below Poverty |
| No Children | 56 (100.0%) | 0 (0.0%) |
| 1 or 2 Children | 29 (100.0%) | 0 (0.0%) |
| 3 or 4 Children | 13 (68.4%) | 6 (31.6%) |
| 5 or more Children | 0 (0.0%) | 3 (100.0%) |
| Total | 98 (91.6%) | 9 (8.4%) |
Income Below Poverty Among Single-Parent Households in Mayfield
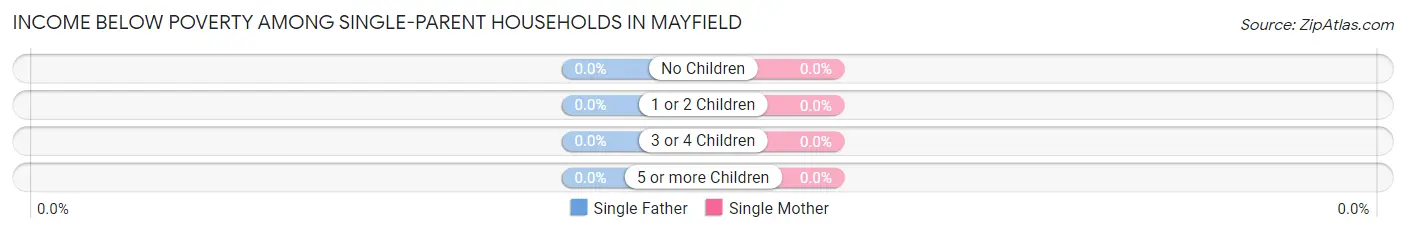
| Children | Single Father | Single Mother |
| No Children | 0 (0.0%) | 0 (0.0%) |
| 1 or 2 Children | 0 (0.0%) | 0 (0.0%) |
| 3 or 4 Children | 0 (0.0%) | 0 (0.0%) |
| 5 or more Children | 0 (0.0%) | 0 (0.0%) |
| Total | 0 (0.0%) | 0 (0.0%) |
Income Below Poverty Among Married-Couple vs Single-Parent Households in Mayfield
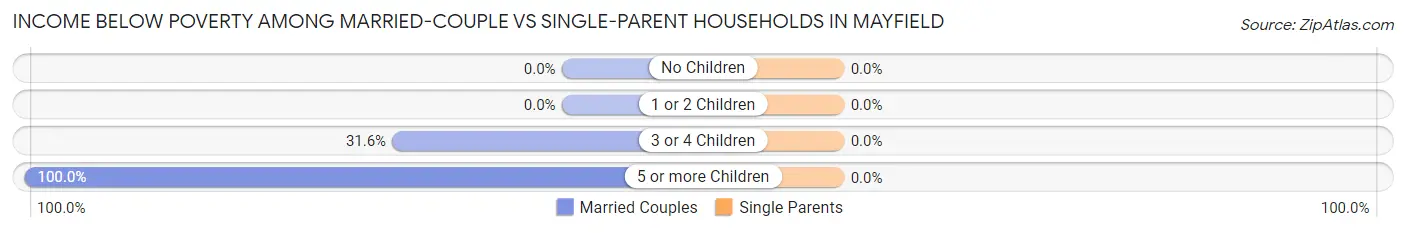
| Children | Married-Couple Families | Single-Parent Households |
| No Children | 0 (0.0%) | 0 (0.0%) |
| 1 or 2 Children | 0 (0.0%) | 0 (0.0%) |
| 3 or 4 Children | 6 (31.6%) | 0 (0.0%) |
| 5 or more Children | 3 (100.0%) | 0 (0.0%) |
| Total | 9 (8.4%) | 0 (0.0%) |
Employment Characteristics in Mayfield
Employment by Class of Employer in Mayfield
Among the 175 employed individuals in Mayfield, private company employees (82 | 46.9%), state government employees (36 | 20.6%), and local government employees (21 | 12.0%) make up the most common classes of employment.
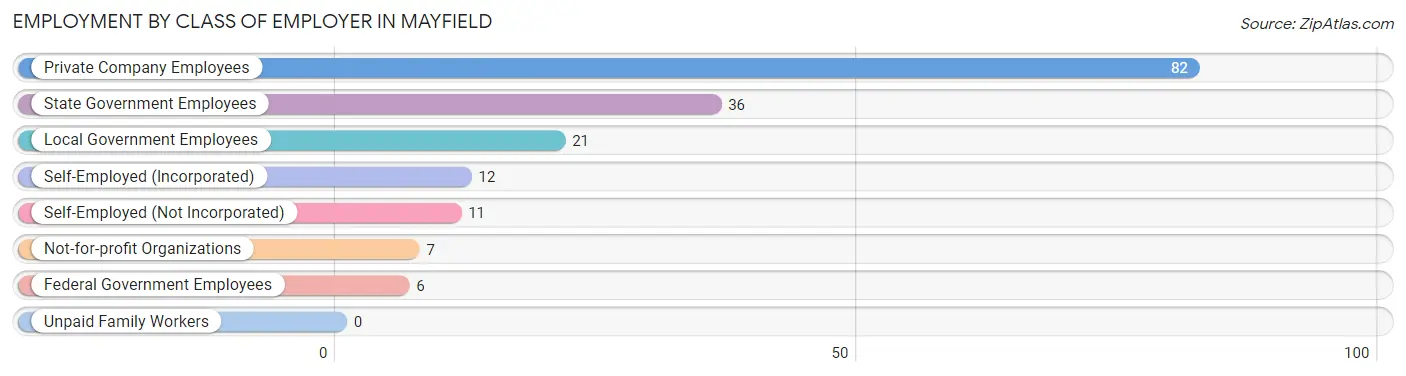
| Employer Class | # Employees | % Employees |
| Private Company Employees | 82 | 46.9% |
| Self-Employed (Incorporated) | 12 | 6.9% |
| Self-Employed (Not Incorporated) | 11 | 6.3% |
| Not-for-profit Organizations | 7 | 4.0% |
| Local Government Employees | 21 | 12.0% |
| State Government Employees | 36 | 20.6% |
| Federal Government Employees | 6 | 3.4% |
| Unpaid Family Workers | 0 | 0.0% |
| Total | 175 | 100.0% |
Employment Status by Age in Mayfield
According to the labor force statistics for Mayfield, out of the total population over 16 years of age (300), 59.7% or 179 individuals are in the labor force, with 2.2% or 4 of them unemployed. The age group with the highest labor force participation rate is 20 to 24 years, with 100.0% or 5 individuals in the labor force. Within the labor force, the 35 to 44 years age range has the highest percentage of unemployed individuals, with 9.1% or 4 of them being unemployed.
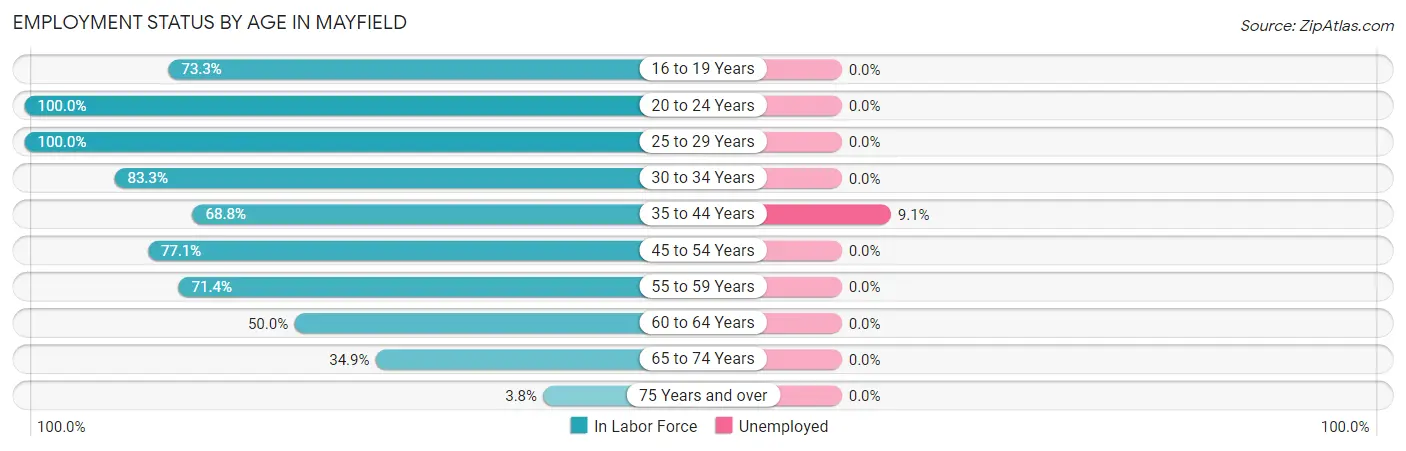
| Age Bracket | In Labor Force | Unemployed |
| 16 to 19 Years | 22 (73.3%) | 0 (0.0%) |
| 20 to 24 Years | 5 (100.0%) | 0 (0.0%) |
| 25 to 29 Years | 9 (100.0%) | 0 (0.0%) |
| 30 to 34 Years | 15 (83.3%) | 0 (0.0%) |
| 35 to 44 Years | 44 (68.8%) | 4 (9.1%) |
| 45 to 54 Years | 27 (77.1%) | 0 (0.0%) |
| 55 to 59 Years | 20 (71.4%) | 0 (0.0%) |
| 60 to 64 Years | 21 (50.0%) | 0 (0.0%) |
| 65 to 74 Years | 15 (34.9%) | 0 (0.0%) |
| 75 Years and over | 1 (3.8%) | 0 (0.0%) |
| Total | 179 (59.7%) | 4 (2.2%) |
Employment Status by Educational Attainment in Mayfield
According to labor force statistics for Mayfield, 69.4% of individuals (136) out of the total population between 25 and 64 years of age (196) are in the labor force, with 2.9% or 4 of them being unemployed. The group with the highest labor force participation rate are those with the educational attainment of bachelor's degree or higher, with 87.5% or 42 individuals in the labor force. Within the labor force, individuals with high school diploma education have the highest percentage of unemployment, with 9.3% or 4 of them being unemployed.
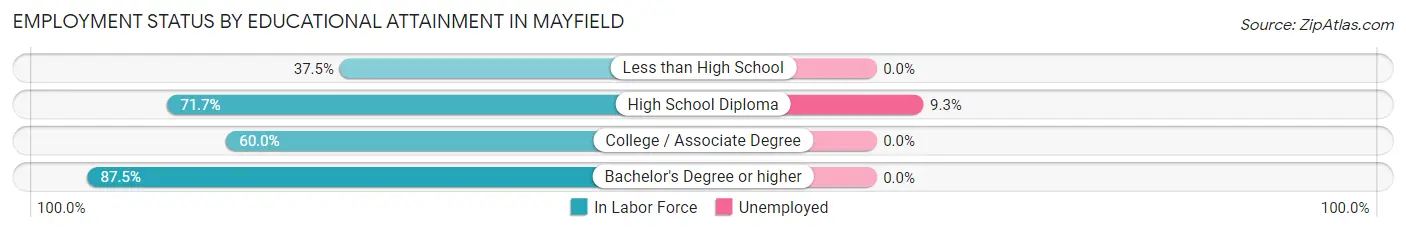
| Educational Attainment | In Labor Force | Unemployed |
| Less than High School | 3 (37.5%) | 0 (0.0%) |
| High School Diploma | 43 (71.7%) | 6 (9.3%) |
| College / Associate Degree | 48 (60.0%) | 0 (0.0%) |
| Bachelor's Degree or higher | 42 (87.5%) | 0 (0.0%) |
| Total | 136 (69.4%) | 6 (2.9%) |
Employment Occupations by Sex in Mayfield
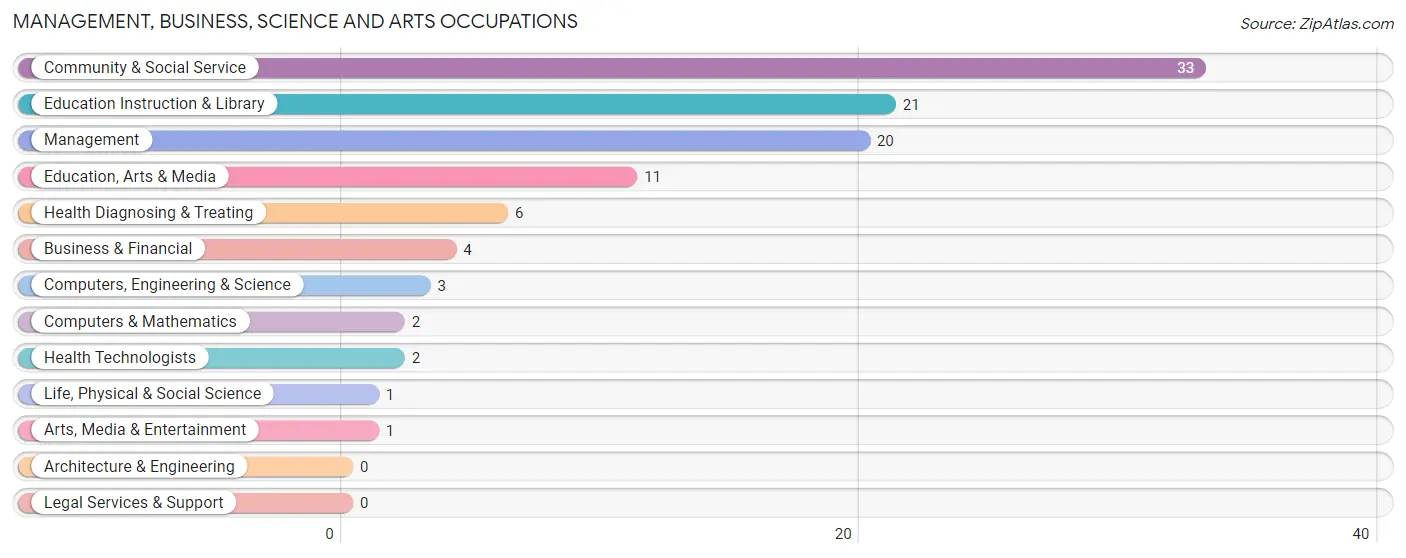
Management, Business, Science and Arts Occupations
The most common Management, Business, Science and Arts occupations in Mayfield are Community & Social Service (33 | 18.9%), Education Instruction & Library (21 | 12.0%), Management (20 | 11.4%), Education, Arts & Media (11 | 6.3%), and Health Diagnosing & Treating (6 | 3.4%).
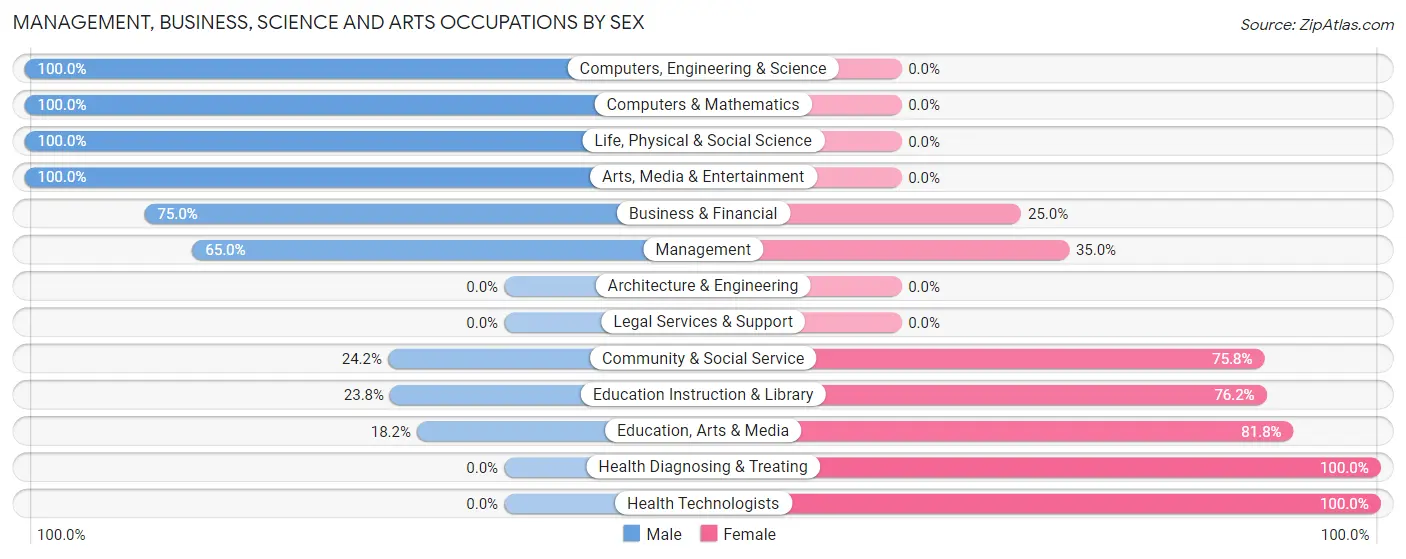
Management, Business, Science and Arts Occupations by Sex
Within the Management, Business, Science and Arts occupations in Mayfield, the most male-oriented occupations are Computers, Engineering & Science (100.0%), Computers & Mathematics (100.0%), and Life, Physical & Social Science (100.0%), while the most female-oriented occupations are Health Diagnosing & Treating (100.0%), Health Technologists (100.0%), and Education, Arts & Media (81.8%).
| Occupation | Male | Female |
| Management | 13 (65.0%) | 7 (35.0%) |
| Business & Financial | 3 (75.0%) | 1 (25.0%) |
| Computers, Engineering & Science | 3 (100.0%) | 0 (0.0%) |
| Computers & Mathematics | 2 (100.0%) | 0 (0.0%) |
| Architecture & Engineering | 0 (0.0%) | 0 (0.0%) |
| Life, Physical & Social Science | 1 (100.0%) | 0 (0.0%) |
| Community & Social Service | 8 (24.2%) | 25 (75.8%) |
| Education, Arts & Media | 2 (18.2%) | 9 (81.8%) |
| Legal Services & Support | 0 (0.0%) | 0 (0.0%) |
| Education Instruction & Library | 5 (23.8%) | 16 (76.2%) |
| Arts, Media & Entertainment | 1 (100.0%) | 0 (0.0%) |
| Health Diagnosing & Treating | 0 (0.0%) | 6 (100.0%) |
| Health Technologists | 0 (0.0%) | 2 (100.0%) |
| Total (Category) | 27 (40.9%) | 39 (59.1%) |
| Total (Overall) | 93 (53.1%) | 82 (46.9%) |
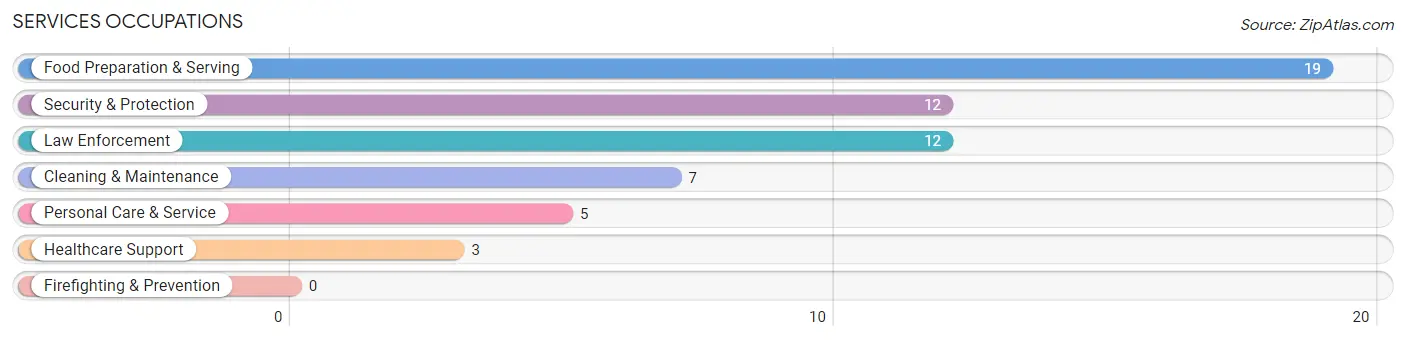
Services Occupations
The most common Services occupations in Mayfield are Food Preparation & Serving (19 | 10.9%), Security & Protection (12 | 6.9%), Law Enforcement (12 | 6.9%), Cleaning & Maintenance (7 | 4.0%), and Personal Care & Service (5 | 2.9%).
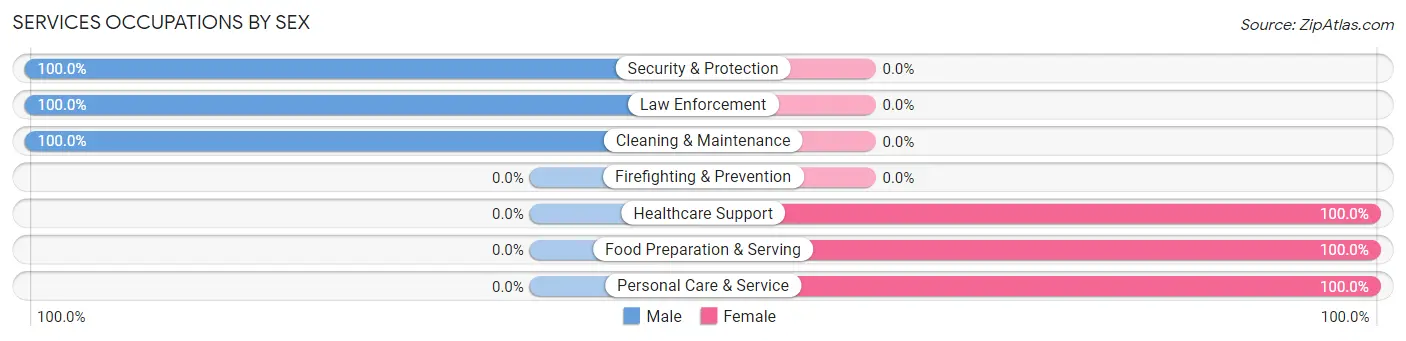
Services Occupations by Sex
Within the Services occupations in Mayfield, the most male-oriented occupations are Security & Protection (100.0%), Law Enforcement (100.0%), and Cleaning & Maintenance (100.0%), while the most female-oriented occupations are Healthcare Support (100.0%), Food Preparation & Serving (100.0%), and Personal Care & Service (100.0%).
| Occupation | Male | Female |
| Healthcare Support | 0 (0.0%) | 3 (100.0%) |
| Security & Protection | 12 (100.0%) | 0 (0.0%) |
| Firefighting & Prevention | 0 (0.0%) | 0 (0.0%) |
| Law Enforcement | 12 (100.0%) | 0 (0.0%) |
| Food Preparation & Serving | 0 (0.0%) | 19 (100.0%) |
| Cleaning & Maintenance | 7 (100.0%) | 0 (0.0%) |
| Personal Care & Service | 0 (0.0%) | 5 (100.0%) |
| Total (Category) | 19 (41.3%) | 27 (58.7%) |
| Total (Overall) | 93 (53.1%) | 82 (46.9%) |
Sales and Office Occupations
The most common Sales and Office occupations in Mayfield are Office & Administration (15 | 8.6%), and Sales & Related (9 | 5.1%).
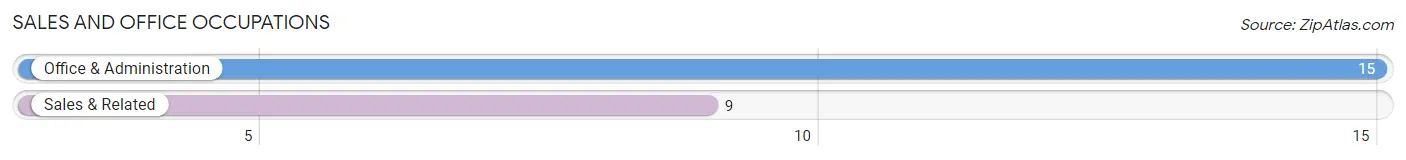
Sales and Office Occupations by Sex

| Occupation | Male | Female |
| Sales & Related | 9 (100.0%) | 0 (0.0%) |
| Office & Administration | 6 (40.0%) | 9 (60.0%) |
| Total (Category) | 15 (62.5%) | 9 (37.5%) |
| Total (Overall) | 93 (53.1%) | 82 (46.9%) |
Natural Resources, Construction and Maintenance Occupations
The most common Natural Resources, Construction and Maintenance occupations in Mayfield are Construction & Extraction (14 | 8.0%), and Farming, Fishing & Forestry (3 | 1.7%).
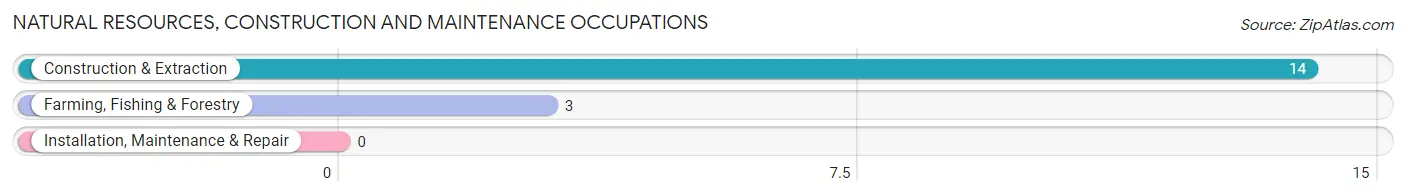
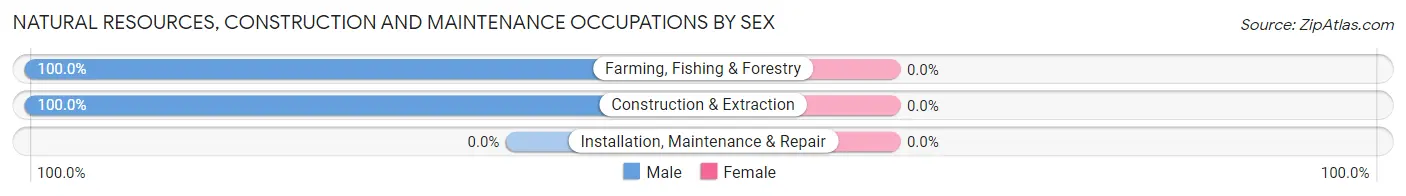
Natural Resources, Construction and Maintenance Occupations by Sex
| Occupation | Male | Female |
| Farming, Fishing & Forestry | 3 (100.0%) | 0 (0.0%) |
| Construction & Extraction | 14 (100.0%) | 0 (0.0%) |
| Installation, Maintenance & Repair | 0 (0.0%) | 0 (0.0%) |
| Total (Category) | 17 (100.0%) | 0 (0.0%) |
| Total (Overall) | 93 (53.1%) | 82 (46.9%) |
Production, Transportation and Moving Occupations
The most common Production, Transportation and Moving occupations in Mayfield are Production (13 | 7.4%), Transportation (6 | 3.4%), and Material Moving (3 | 1.7%).
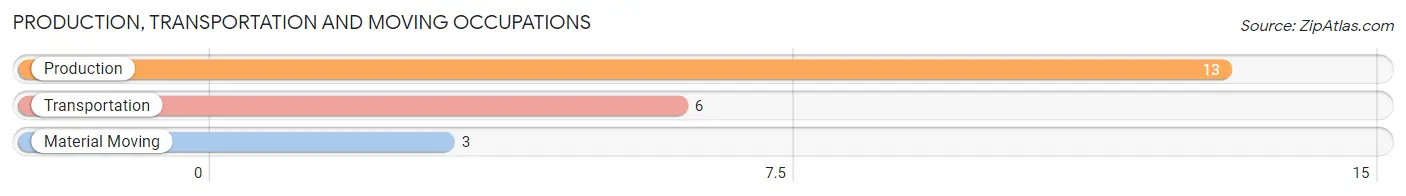
Production, Transportation and Moving Occupations by Sex
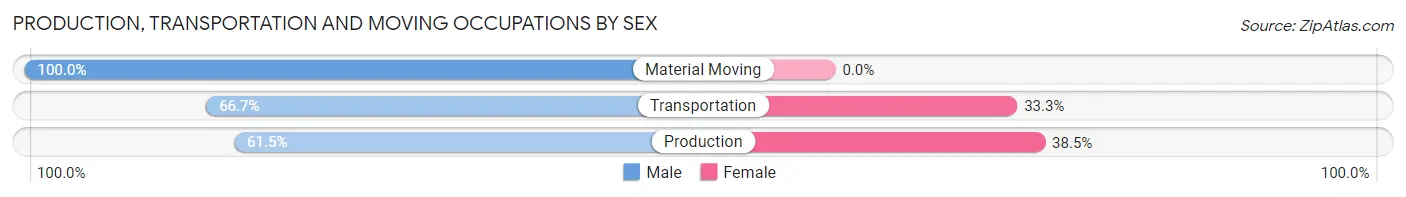
| Occupation | Male | Female |
| Production | 8 (61.5%) | 5 (38.5%) |
| Transportation | 4 (66.7%) | 2 (33.3%) |
| Material Moving | 3 (100.0%) | 0 (0.0%) |
| Total (Category) | 15 (68.2%) | 7 (31.8%) |
| Total (Overall) | 93 (53.1%) | 82 (46.9%) |
Employment Industries by Sex in Mayfield
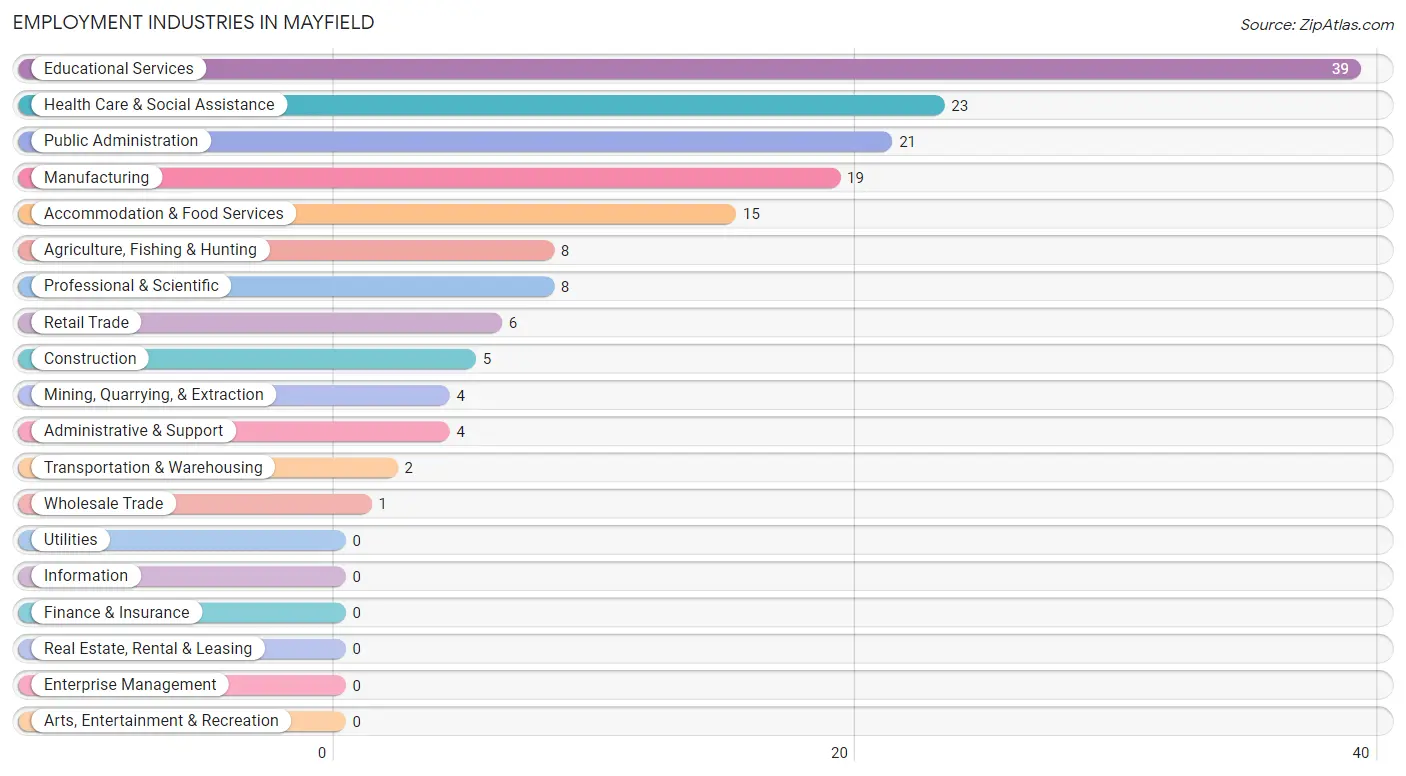
Employment Industries in Mayfield
The major employment industries in Mayfield include Educational Services (39 | 22.3%), Health Care & Social Assistance (23 | 13.1%), Public Administration (21 | 12.0%), Manufacturing (19 | 10.9%), and Accommodation & Food Services (15 | 8.6%).
Employment Industries by Sex in Mayfield
The Mayfield industries that see more men than women are Agriculture, Fishing & Hunting (100.0%), Mining, Quarrying, & Extraction (100.0%), and Construction (100.0%), whereas the industries that tend to have a higher number of women are Accommodation & Food Services (100.0%), Health Care & Social Assistance (95.7%), and Educational Services (64.1%).
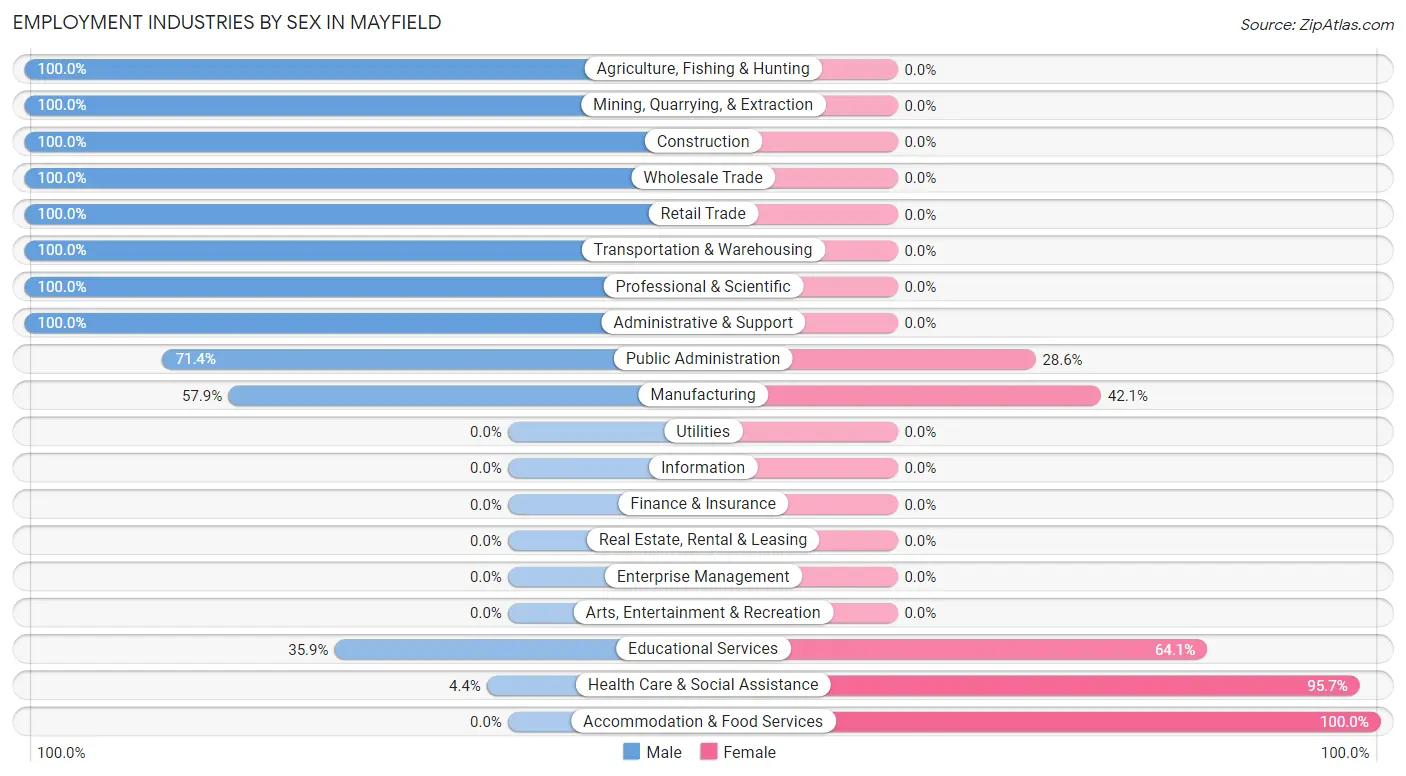
| Industry | Male | Female |
| Agriculture, Fishing & Hunting | 8 (100.0%) | 0 (0.0%) |
| Mining, Quarrying, & Extraction | 4 (100.0%) | 0 (0.0%) |
| Construction | 5 (100.0%) | 0 (0.0%) |
| Manufacturing | 11 (57.9%) | 8 (42.1%) |
| Wholesale Trade | 1 (100.0%) | 0 (0.0%) |
| Retail Trade | 6 (100.0%) | 0 (0.0%) |
| Transportation & Warehousing | 2 (100.0%) | 0 (0.0%) |
| Utilities | 0 (0.0%) | 0 (0.0%) |
| Information | 0 (0.0%) | 0 (0.0%) |
| Finance & Insurance | 0 (0.0%) | 0 (0.0%) |
| Real Estate, Rental & Leasing | 0 (0.0%) | 0 (0.0%) |
| Professional & Scientific | 8 (100.0%) | 0 (0.0%) |
| Enterprise Management | 0 (0.0%) | 0 (0.0%) |
| Administrative & Support | 4 (100.0%) | 0 (0.0%) |
| Educational Services | 14 (35.9%) | 25 (64.1%) |
| Health Care & Social Assistance | 1 (4.3%) | 22 (95.7%) |
| Arts, Entertainment & Recreation | 0 (0.0%) | 0 (0.0%) |
| Accommodation & Food Services | 0 (0.0%) | 15 (100.0%) |
| Public Administration | 15 (71.4%) | 6 (28.6%) |
| Total | 93 (53.1%) | 82 (46.9%) |
Education in Mayfield
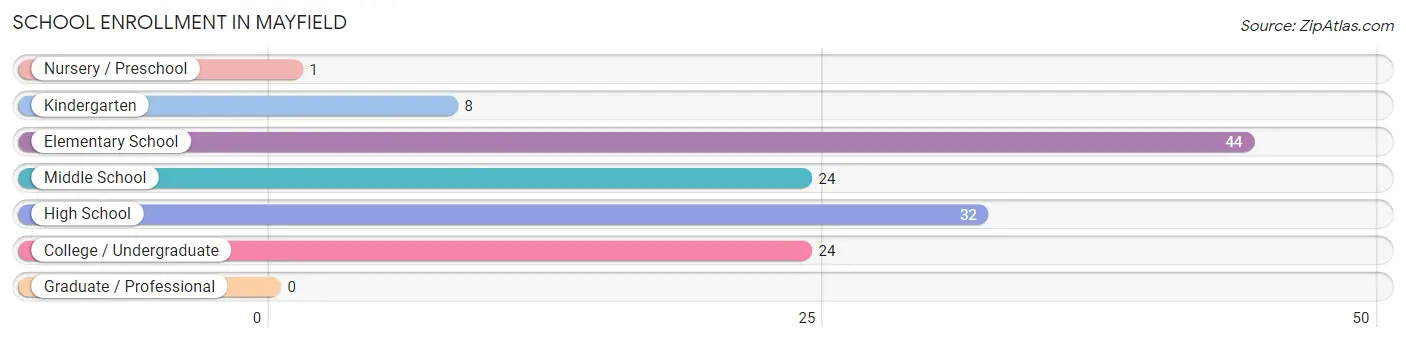
School Enrollment in Mayfield
The most common levels of schooling among the 133 students in Mayfield are elementary school (44 | 33.1%), high school (32 | 24.1%), and middle school (24 | 18.0%).
| School Level | # Students | % Students |
| Nursery / Preschool | 1 | 0.7% |
| Kindergarten | 8 | 6.0% |
| Elementary School | 44 | 33.1% |
| Middle School | 24 | 18.0% |
| High School | 32 | 24.1% |
| College / Undergraduate | 24 | 18.0% |
| Graduate / Professional | 0 | 0.0% |
| Total | 133 | 100.0% |
School Enrollment by Age by Funding Source in Mayfield
Out of a total of 133 students who are enrolled in schools in Mayfield, 6 (4.5%) attend a private institution, while the remaining 127 (95.5%) are enrolled in public schools. The age group of 3 to 4 year olds has the highest likelihood of being enrolled in private schools, with 1 (100.0% in the age bracket) enrolled. Conversely, the age group of 5 to 9 year old has the lowest likelihood of being enrolled in a private school, with 46 (100.0% in the age bracket) attending a public institution.
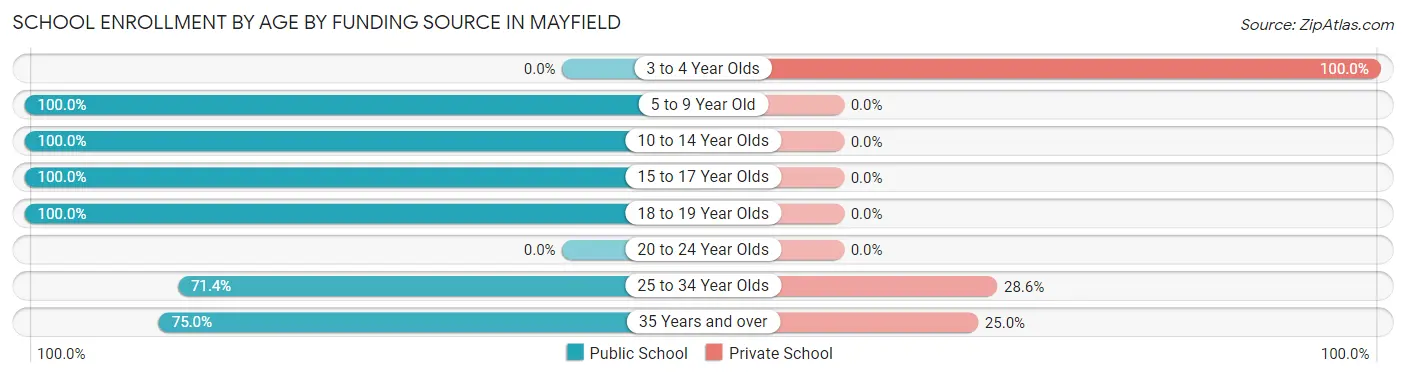
| Age Bracket | Public School | Private School |
| 3 to 4 Year Olds | 0 (0.0%) | 1 (100.0%) |
| 5 to 9 Year Old | 46 (100.0%) | 0 (0.0%) |
| 10 to 14 Year Olds | 35 (100.0%) | 0 (0.0%) |
| 15 to 17 Year Olds | 27 (100.0%) | 0 (0.0%) |
| 18 to 19 Year Olds | 5 (100.0%) | 0 (0.0%) |
| 20 to 24 Year Olds | 0 (0.0%) | 0 (0.0%) |
| 25 to 34 Year Olds | 5 (71.4%) | 2 (28.6%) |
| 35 Years and over | 9 (75.0%) | 3 (25.0%) |
| Total | 127 (95.5%) | 6 (4.5%) |
Educational Attainment by Field of Study in Mayfield
Education (36 | 51.4%), bio, nature & agricultural (7 | 10.0%), social sciences (6 | 8.6%), science & technology (4 | 5.7%), and liberal arts & history (4 | 5.7%) are the most common fields of study among 70 individuals in Mayfield who have obtained a bachelor's degree or higher.
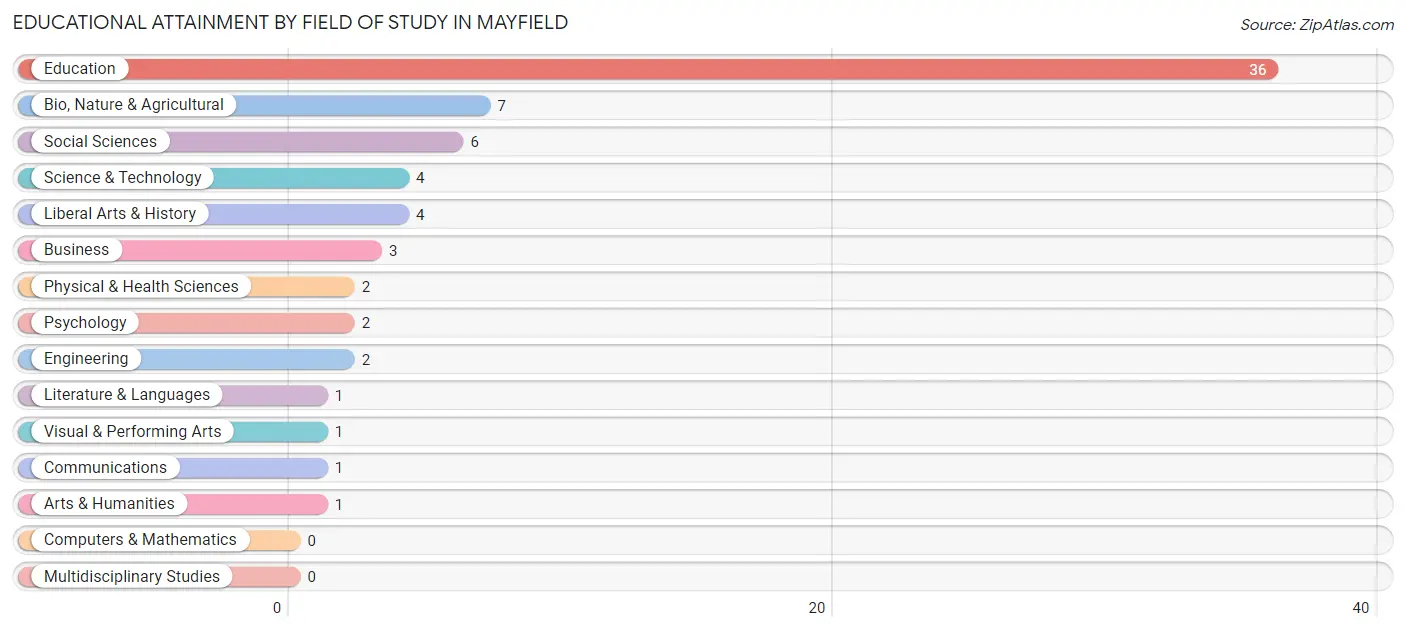
| Field of Study | # Graduates | % Graduates |
| Computers & Mathematics | 0 | 0.0% |
| Bio, Nature & Agricultural | 7 | 10.0% |
| Physical & Health Sciences | 2 | 2.9% |
| Psychology | 2 | 2.9% |
| Social Sciences | 6 | 8.6% |
| Engineering | 2 | 2.9% |
| Multidisciplinary Studies | 0 | 0.0% |
| Science & Technology | 4 | 5.7% |
| Business | 3 | 4.3% |
| Education | 36 | 51.4% |
| Literature & Languages | 1 | 1.4% |
| Liberal Arts & History | 4 | 5.7% |
| Visual & Performing Arts | 1 | 1.4% |
| Communications | 1 | 1.4% |
| Arts & Humanities | 1 | 1.4% |
| Total | 70 | 100.0% |
Transportation & Commute in Mayfield
Vehicle Availability by Sex in Mayfield
The most prevalent vehicle ownership categories in Mayfield are males with 3 vehicles (25, accounting for 26.9%) and females with 3 vehicles (25, making up 30.5%).
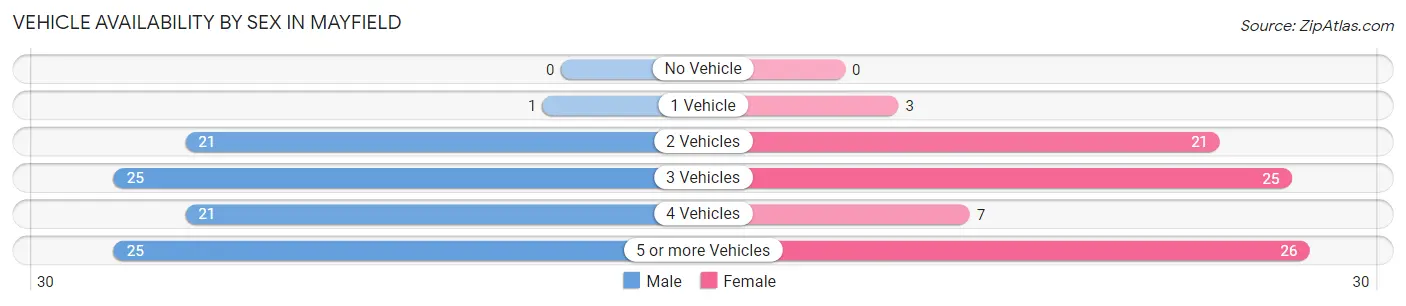
| Vehicles Available | Male | Female |
| No Vehicle | 0 (0.0%) | 0 (0.0%) |
| 1 Vehicle | 1 (1.1%) | 3 (3.7%) |
| 2 Vehicles | 21 (22.6%) | 21 (25.6%) |
| 3 Vehicles | 25 (26.9%) | 25 (30.5%) |
| 4 Vehicles | 21 (22.6%) | 7 (8.5%) |
| 5 or more Vehicles | 25 (26.9%) | 26 (31.7%) |
| Total | 93 (100.0%) | 82 (100.0%) |
Commute Time in Mayfield
The most frequently occuring commute durations in Mayfield are 10 to 14 minutes (44 commuters, 28.0%), 20 to 24 minutes (19 commuters, 12.1%), and 15 to 19 minutes (18 commuters, 11.5%).
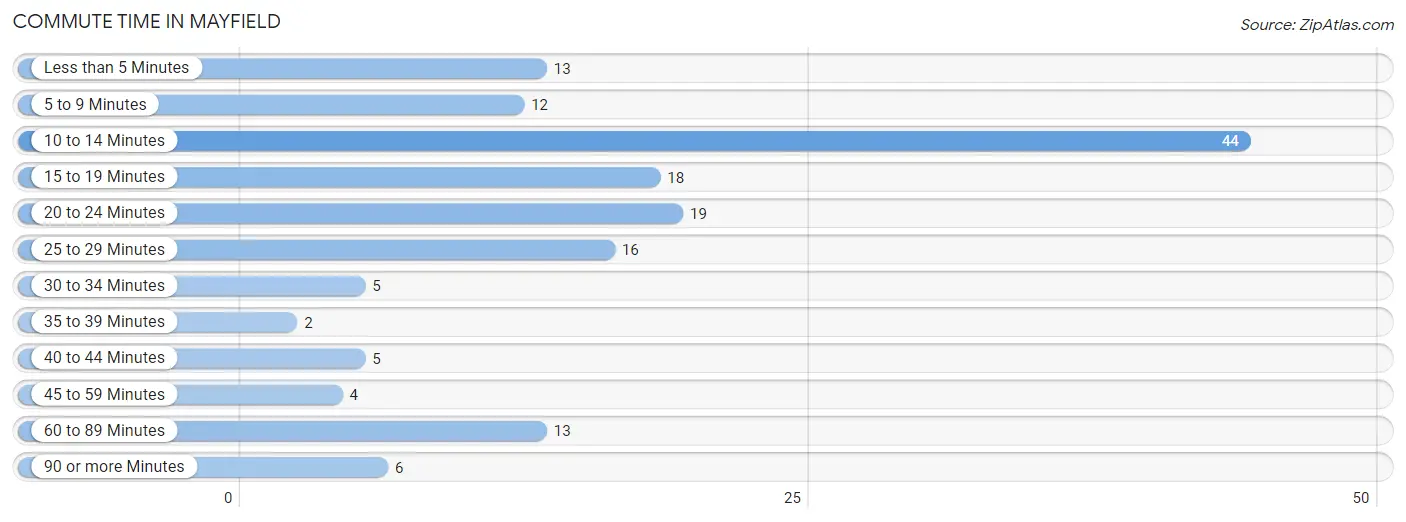
| Commute Time | # Commuters | % Commuters |
| Less than 5 Minutes | 13 | 8.3% |
| 5 to 9 Minutes | 12 | 7.6% |
| 10 to 14 Minutes | 44 | 28.0% |
| 15 to 19 Minutes | 18 | 11.5% |
| 20 to 24 Minutes | 19 | 12.1% |
| 25 to 29 Minutes | 16 | 10.2% |
| 30 to 34 Minutes | 5 | 3.2% |
| 35 to 39 Minutes | 2 | 1.3% |
| 40 to 44 Minutes | 5 | 3.2% |
| 45 to 59 Minutes | 4 | 2.5% |
| 60 to 89 Minutes | 13 | 8.3% |
| 90 or more Minutes | 6 | 3.8% |
Commute Time by Sex in Mayfield
The most common commute times in Mayfield are 10 to 14 minutes (23 commuters, 27.1%) for males and 10 to 14 minutes (21 commuters, 29.2%) for females.
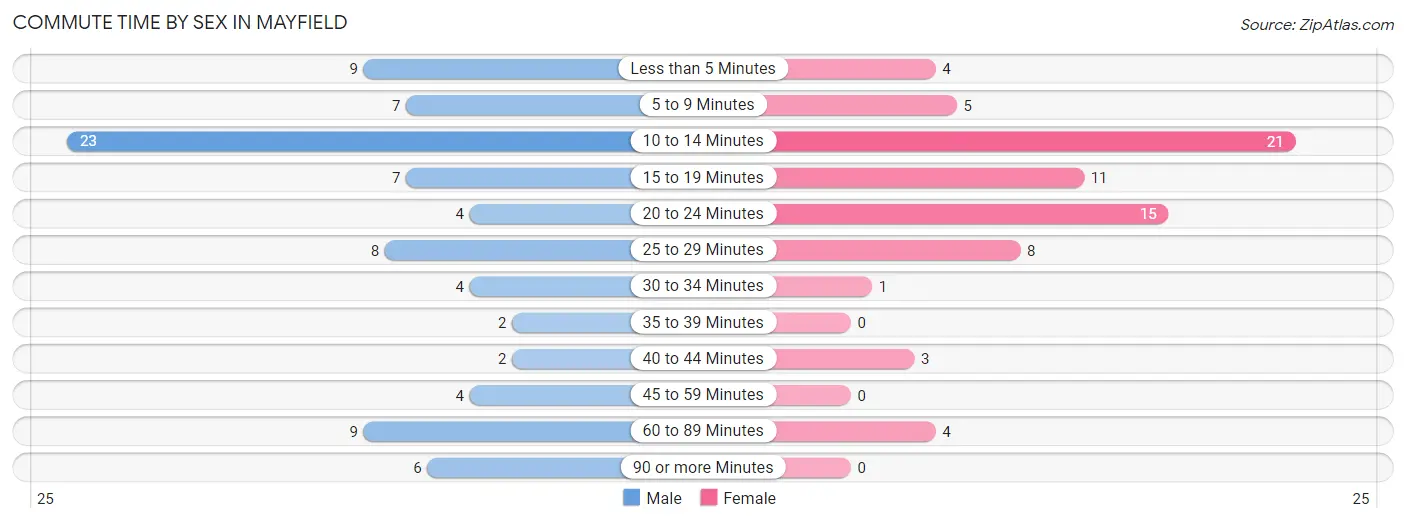
| Commute Time | Male | Female |
| Less than 5 Minutes | 9 (10.6%) | 4 (5.6%) |
| 5 to 9 Minutes | 7 (8.2%) | 5 (6.9%) |
| 10 to 14 Minutes | 23 (27.1%) | 21 (29.2%) |
| 15 to 19 Minutes | 7 (8.2%) | 11 (15.3%) |
| 20 to 24 Minutes | 4 (4.7%) | 15 (20.8%) |
| 25 to 29 Minutes | 8 (9.4%) | 8 (11.1%) |
| 30 to 34 Minutes | 4 (4.7%) | 1 (1.4%) |
| 35 to 39 Minutes | 2 (2.4%) | 0 (0.0%) |
| 40 to 44 Minutes | 2 (2.4%) | 3 (4.2%) |
| 45 to 59 Minutes | 4 (4.7%) | 0 (0.0%) |
| 60 to 89 Minutes | 9 (10.6%) | 4 (5.6%) |
| 90 or more Minutes | 6 (7.1%) | 0 (0.0%) |
Time of Departure to Work by Sex in Mayfield
The most frequent times of departure to work in Mayfield are 6:30 AM to 6:59 AM (28, 32.9%) for males and 7:00 AM to 7:29 AM (26, 36.1%) for females.
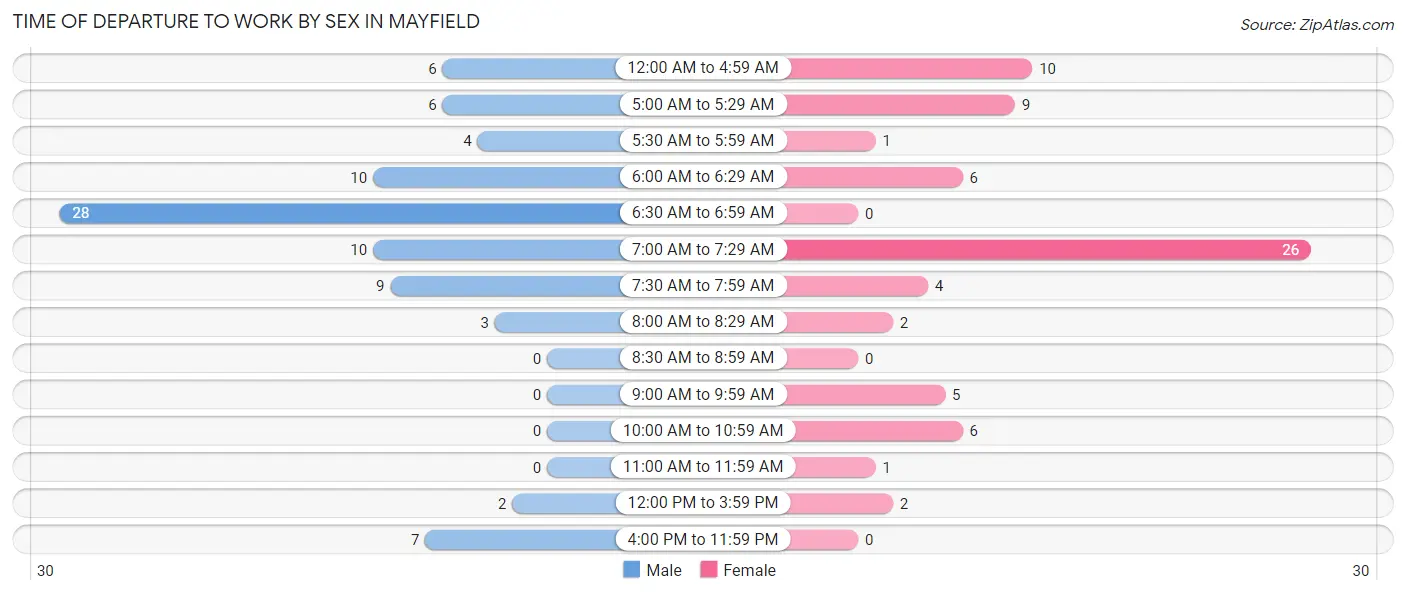
| Time of Departure | Male | Female |
| 12:00 AM to 4:59 AM | 6 (7.1%) | 10 (13.9%) |
| 5:00 AM to 5:29 AM | 6 (7.1%) | 9 (12.5%) |
| 5:30 AM to 5:59 AM | 4 (4.7%) | 1 (1.4%) |
| 6:00 AM to 6:29 AM | 10 (11.8%) | 6 (8.3%) |
| 6:30 AM to 6:59 AM | 28 (32.9%) | 0 (0.0%) |
| 7:00 AM to 7:29 AM | 10 (11.8%) | 26 (36.1%) |
| 7:30 AM to 7:59 AM | 9 (10.6%) | 4 (5.6%) |
| 8:00 AM to 8:29 AM | 3 (3.5%) | 2 (2.8%) |
| 8:30 AM to 8:59 AM | 0 (0.0%) | 0 (0.0%) |
| 9:00 AM to 9:59 AM | 0 (0.0%) | 5 (6.9%) |
| 10:00 AM to 10:59 AM | 0 (0.0%) | 6 (8.3%) |
| 11:00 AM to 11:59 AM | 0 (0.0%) | 1 (1.4%) |
| 12:00 PM to 3:59 PM | 2 (2.4%) | 2 (2.8%) |
| 4:00 PM to 11:59 PM | 7 (8.2%) | 0 (0.0%) |
| Total | 85 (100.0%) | 72 (100.0%) |
Housing Occupancy in Mayfield
Occupancy by Ownership in Mayfield
Of the total 126 dwellings in Mayfield, owner-occupied units account for 123 (97.6%), while renter-occupied units make up 3 (2.4%).
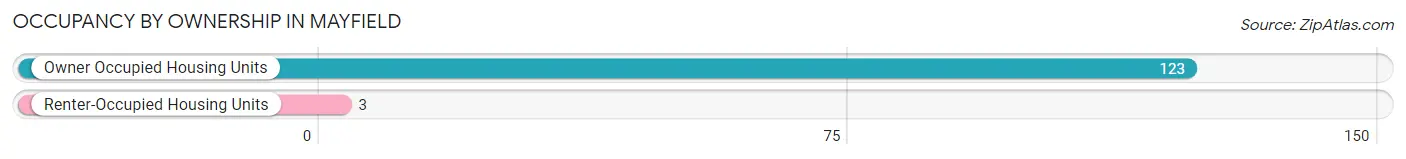
| Occupancy | # Housing Units | % Housing Units |
| Owner Occupied Housing Units | 123 | 97.6% |
| Renter-Occupied Housing Units | 3 | 2.4% |
| Total Occupied Housing Units | 126 | 100.0% |
Occupancy by Household Size in Mayfield
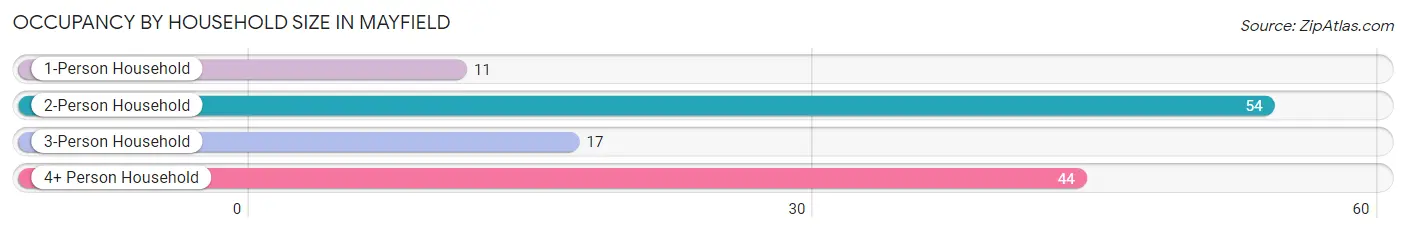
| Household Size | # Housing Units | % Housing Units |
| 1-Person Household | 11 | 8.7% |
| 2-Person Household | 54 | 42.9% |
| 3-Person Household | 17 | 13.5% |
| 4+ Person Household | 44 | 34.9% |
| Total Housing Units | 126 | 100.0% |
Occupancy by Ownership by Household Size in Mayfield
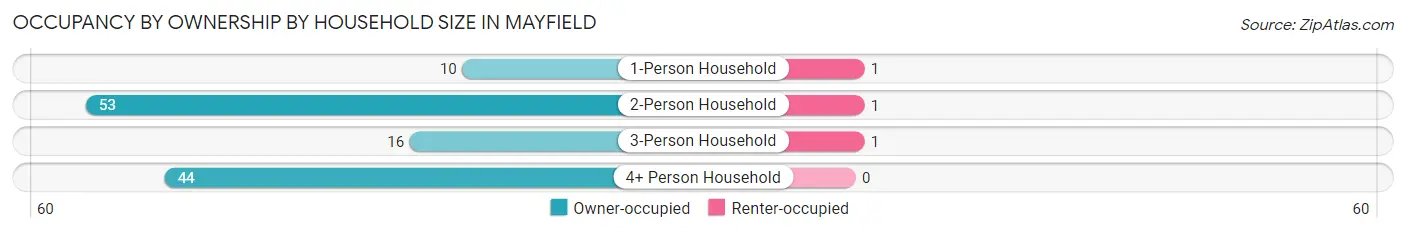
| Household Size | Owner-occupied | Renter-occupied |
| 1-Person Household | 10 (90.9%) | 1 (9.1%) |
| 2-Person Household | 53 (98.2%) | 1 (1.8%) |
| 3-Person Household | 16 (94.1%) | 1 (5.9%) |
| 4+ Person Household | 44 (100.0%) | 0 (0.0%) |
| Total Housing Units | 123 (97.6%) | 3 (2.4%) |
Occupancy by Educational Attainment in Mayfield
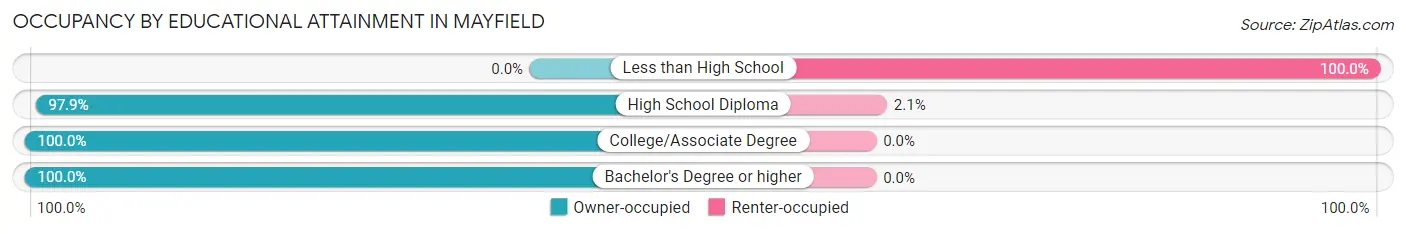
| Household Size | Owner-occupied | Renter-occupied |
| Less than High School | 0 (0.0%) | 2 (100.0%) |
| High School Diploma | 46 (97.9%) | 1 (2.1%) |
| College/Associate Degree | 44 (100.0%) | 0 (0.0%) |
| Bachelor's Degree or higher | 33 (100.0%) | 0 (0.0%) |
Occupancy by Age of Householder in Mayfield
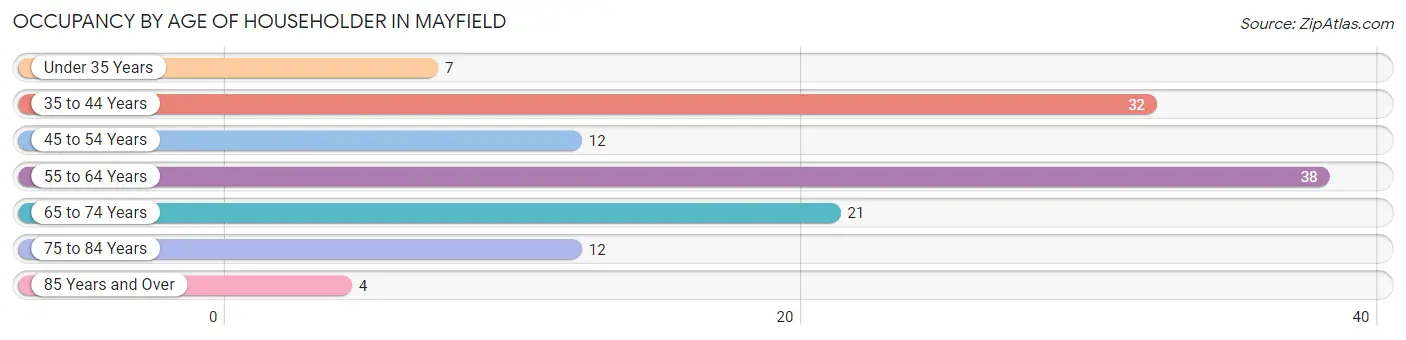
| Age Bracket | # Households | % Households |
| Under 35 Years | 7 | 5.6% |
| 35 to 44 Years | 32 | 25.4% |
| 45 to 54 Years | 12 | 9.5% |
| 55 to 64 Years | 38 | 30.2% |
| 65 to 74 Years | 21 | 16.7% |
| 75 to 84 Years | 12 | 9.5% |
| 85 Years and Over | 4 | 3.2% |
| Total | 126 | 100.0% |
Housing Finances in Mayfield
Median Income by Occupancy in Mayfield
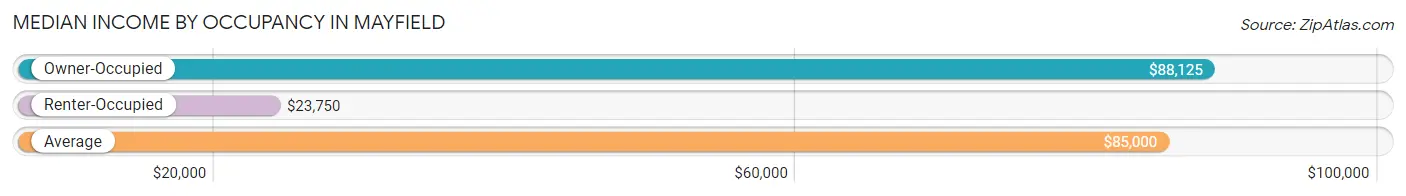
| Occupancy Type | # Households | Median Income |
| Owner-Occupied | 123 (97.6%) | $88,125 |
| Renter-Occupied | 3 (2.4%) | $23,750 |
| Average | 126 (100.0%) | $85,000 |
Occupancy by Householder Income Bracket in Mayfield
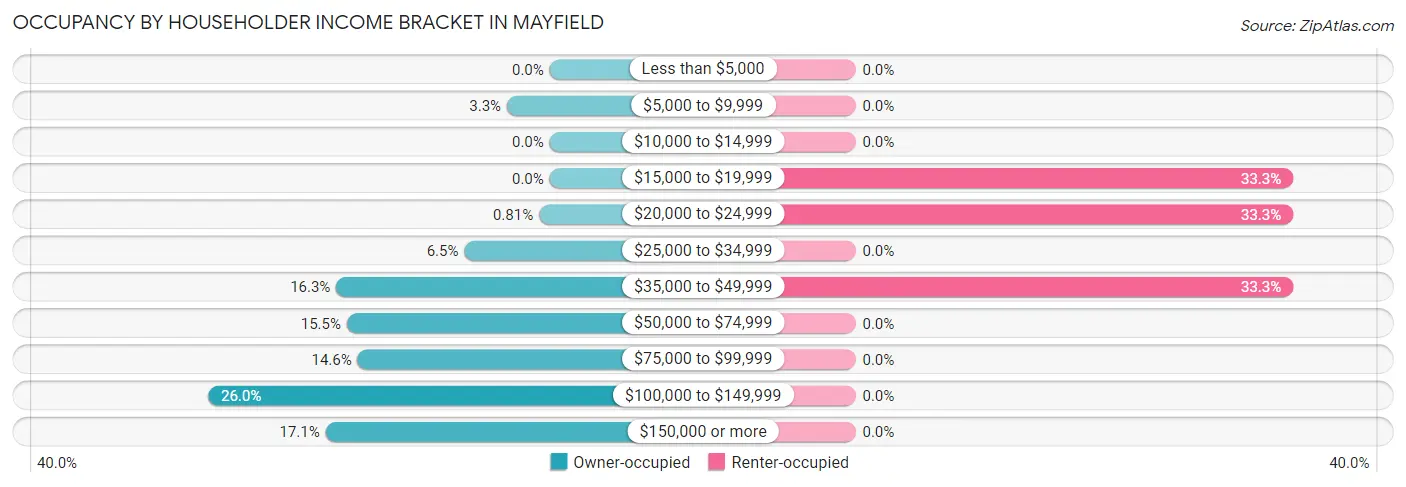
| Income Bracket | Owner-occupied | Renter-occupied |
| Less than $5,000 | 0 (0.0%) | 0 (0.0%) |
| $5,000 to $9,999 | 4 (3.3%) | 0 (0.0%) |
| $10,000 to $14,999 | 0 (0.0%) | 0 (0.0%) |
| $15,000 to $19,999 | 0 (0.0%) | 1 (33.3%) |
| $20,000 to $24,999 | 1 (0.8%) | 1 (33.3%) |
| $25,000 to $34,999 | 8 (6.5%) | 0 (0.0%) |
| $35,000 to $49,999 | 20 (16.3%) | 1 (33.3%) |
| $50,000 to $74,999 | 19 (15.4%) | 0 (0.0%) |
| $75,000 to $99,999 | 18 (14.6%) | 0 (0.0%) |
| $100,000 to $149,999 | 32 (26.0%) | 0 (0.0%) |
| $150,000 or more | 21 (17.1%) | 0 (0.0%) |
| Total | 123 (100.0%) | 3 (100.0%) |
Monthly Housing Cost Tiers in Mayfield
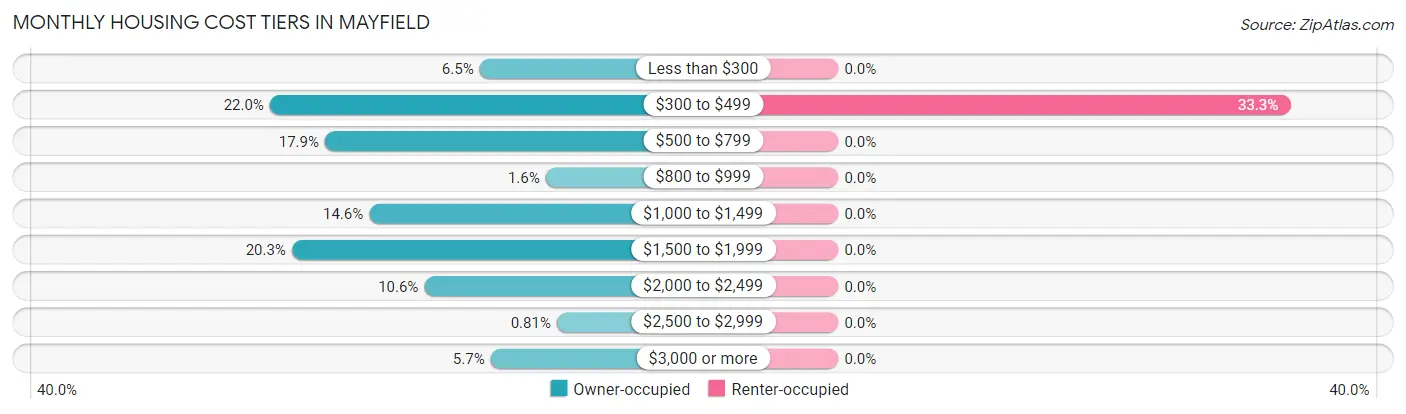
| Monthly Cost | Owner-occupied | Renter-occupied |
| Less than $300 | 8 (6.5%) | 0 (0.0%) |
| $300 to $499 | 27 (22.0%) | 1 (33.3%) |
| $500 to $799 | 22 (17.9%) | 0 (0.0%) |
| $800 to $999 | 2 (1.6%) | 0 (0.0%) |
| $1,000 to $1,499 | 18 (14.6%) | 0 (0.0%) |
| $1,500 to $1,999 | 25 (20.3%) | 0 (0.0%) |
| $2,000 to $2,499 | 13 (10.6%) | 0 (0.0%) |
| $2,500 to $2,999 | 1 (0.8%) | 0 (0.0%) |
| $3,000 or more | 7 (5.7%) | 0 (0.0%) |
| Total | 123 (100.0%) | 3 (100.0%) |
Physical Housing Characteristics in Mayfield
Housing Structures in Mayfield
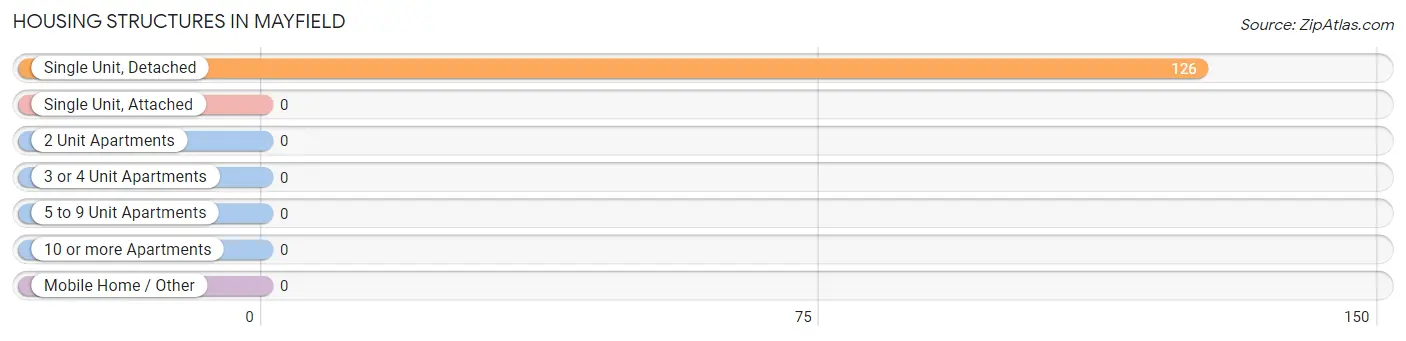
| Structure Type | # Housing Units | % Housing Units |
| Single Unit, Detached | 126 | 100.0% |
| Single Unit, Attached | 0 | 0.0% |
| 2 Unit Apartments | 0 | 0.0% |
| 3 or 4 Unit Apartments | 0 | 0.0% |
| 5 to 9 Unit Apartments | 0 | 0.0% |
| 10 or more Apartments | 0 | 0.0% |
| Mobile Home / Other | 0 | 0.0% |
| Total | 126 | 100.0% |
Housing Structures by Occupancy in Mayfield
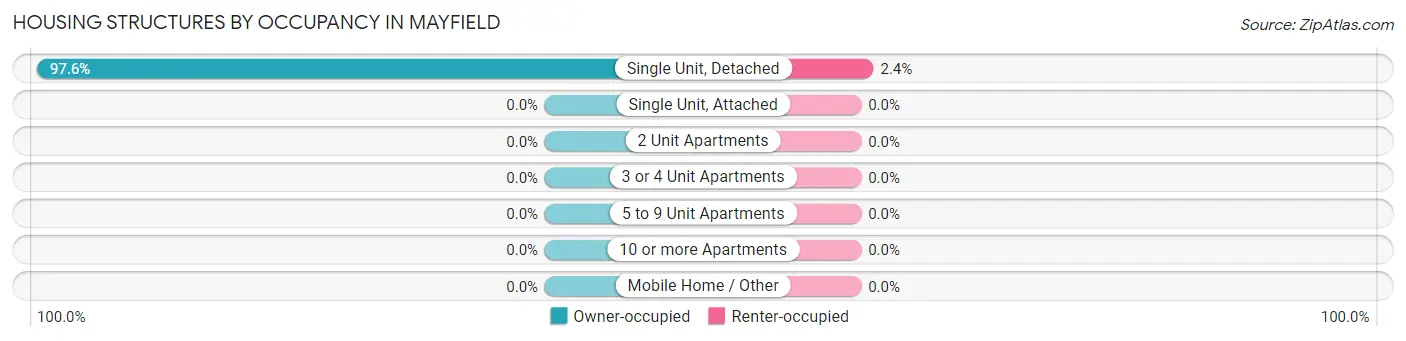
| Structure Type | Owner-occupied | Renter-occupied |
| Single Unit, Detached | 123 (97.6%) | 3 (2.4%) |
| Single Unit, Attached | 0 (0.0%) | 0 (0.0%) |
| 2 Unit Apartments | 0 (0.0%) | 0 (0.0%) |
| 3 or 4 Unit Apartments | 0 (0.0%) | 0 (0.0%) |
| 5 to 9 Unit Apartments | 0 (0.0%) | 0 (0.0%) |
| 10 or more Apartments | 0 (0.0%) | 0 (0.0%) |
| Mobile Home / Other | 0 (0.0%) | 0 (0.0%) |
| Total | 123 (97.6%) | 3 (2.4%) |
Housing Structures by Number of Rooms in Mayfield
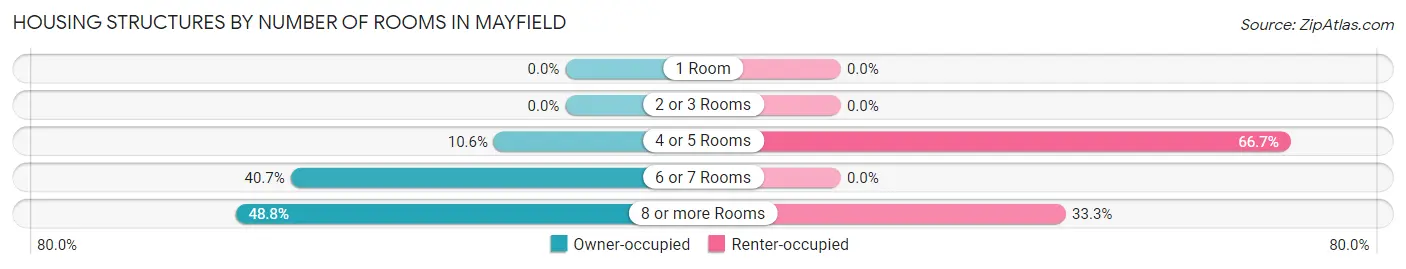
| Number of Rooms | Owner-occupied | Renter-occupied |
| 1 Room | 0 (0.0%) | 0 (0.0%) |
| 2 or 3 Rooms | 0 (0.0%) | 0 (0.0%) |
| 4 or 5 Rooms | 13 (10.6%) | 2 (66.7%) |
| 6 or 7 Rooms | 50 (40.6%) | 0 (0.0%) |
| 8 or more Rooms | 60 (48.8%) | 1 (33.3%) |
| Total | 123 (100.0%) | 3 (100.0%) |
Housing Structure by Heating Type in Mayfield
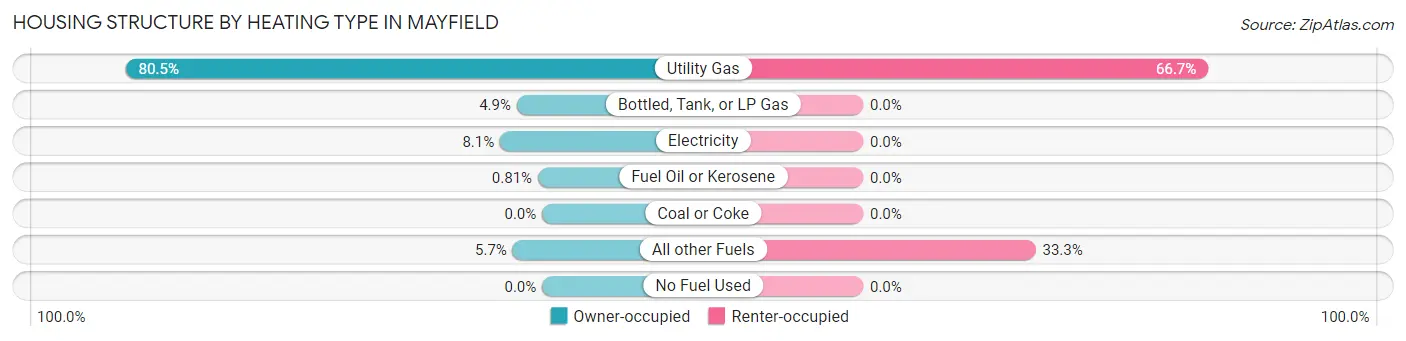
| Heating Type | Owner-occupied | Renter-occupied |
| Utility Gas | 99 (80.5%) | 2 (66.7%) |
| Bottled, Tank, or LP Gas | 6 (4.9%) | 0 (0.0%) |
| Electricity | 10 (8.1%) | 0 (0.0%) |
| Fuel Oil or Kerosene | 1 (0.8%) | 0 (0.0%) |
| Coal or Coke | 0 (0.0%) | 0 (0.0%) |
| All other Fuels | 7 (5.7%) | 1 (33.3%) |
| No Fuel Used | 0 (0.0%) | 0 (0.0%) |
| Total | 123 (100.0%) | 3 (100.0%) |
Household Vehicle Usage in Mayfield
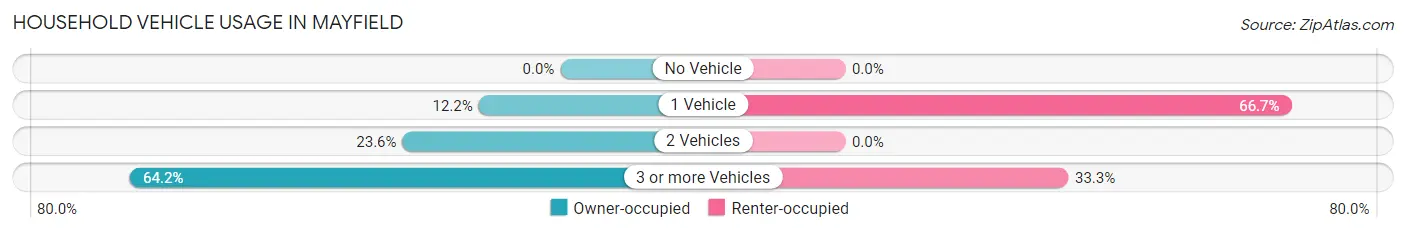
| Vehicles per Household | Owner-occupied | Renter-occupied |
| No Vehicle | 0 (0.0%) | 0 (0.0%) |
| 1 Vehicle | 15 (12.2%) | 2 (66.7%) |
| 2 Vehicles | 29 (23.6%) | 0 (0.0%) |
| 3 or more Vehicles | 79 (64.2%) | 1 (33.3%) |
| Total | 123 (100.0%) | 3 (100.0%) |
Real Estate & Mortgages in Mayfield
Real Estate and Mortgage Overview in Mayfield
| Characteristic | Without Mortgage | With Mortgage |
| Housing Units | 53 | 70 |
| Median Property Value | $325,000 | $250,000 |
| Median Household Income | $69,792 | $17 |
| Monthly Housing Costs | $458 | $7 |
| Real Estate Taxes | $1,917 | $0 |
Property Value by Mortgage Status in Mayfield
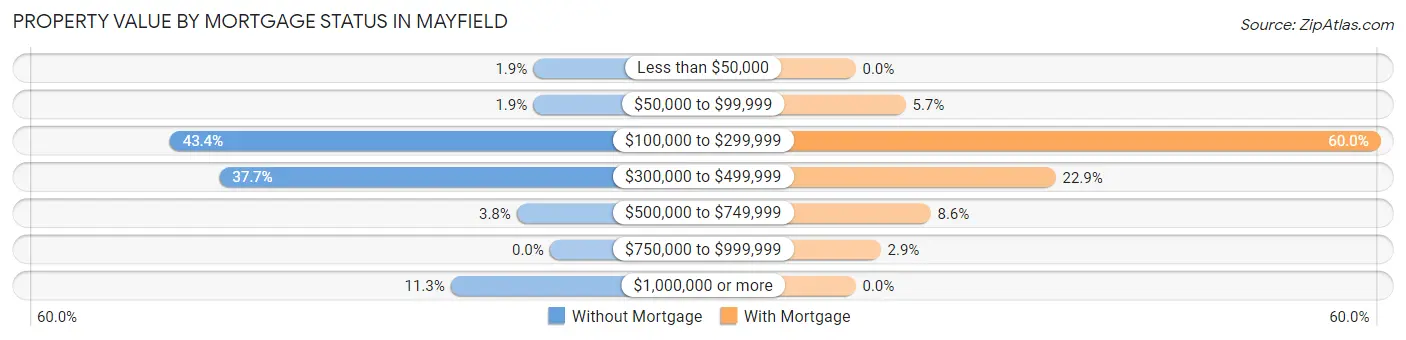
| Property Value | Without Mortgage | With Mortgage |
| Less than $50,000 | 1 (1.9%) | 0 (0.0%) |
| $50,000 to $99,999 | 1 (1.9%) | 4 (5.7%) |
| $100,000 to $299,999 | 23 (43.4%) | 42 (60.0%) |
| $300,000 to $499,999 | 20 (37.7%) | 16 (22.9%) |
| $500,000 to $749,999 | 2 (3.8%) | 6 (8.6%) |
| $750,000 to $999,999 | 0 (0.0%) | 2 (2.9%) |
| $1,000,000 or more | 6 (11.3%) | 0 (0.0%) |
| Total | 53 (100.0%) | 70 (100.0%) |
Household Income by Mortgage Status in Mayfield
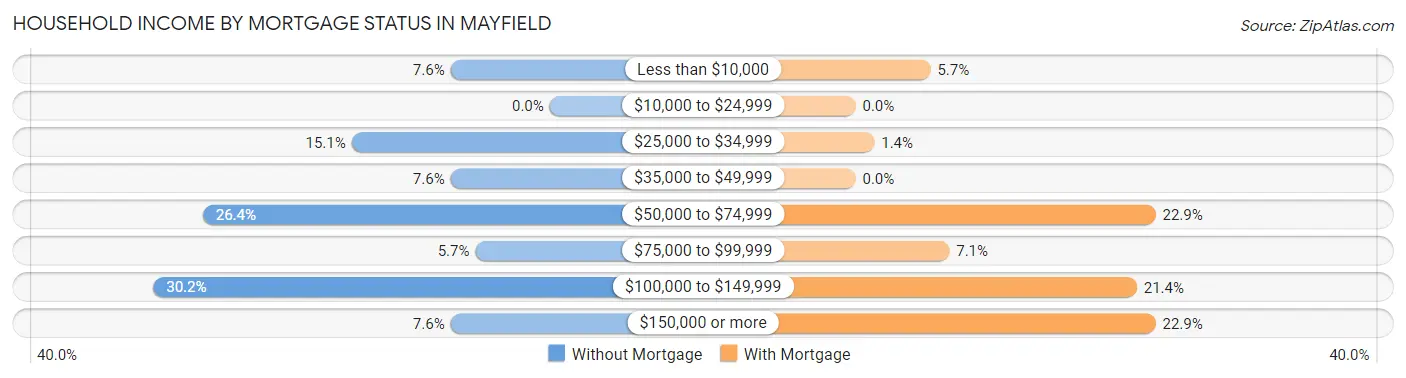
| Household Income | Without Mortgage | With Mortgage |
| Less than $10,000 | 4 (7.5%) | 4 (5.7%) |
| $10,000 to $24,999 | 0 (0.0%) | 0 (0.0%) |
| $25,000 to $34,999 | 8 (15.1%) | 1 (1.4%) |
| $35,000 to $49,999 | 4 (7.5%) | 0 (0.0%) |
| $50,000 to $74,999 | 14 (26.4%) | 16 (22.9%) |
| $75,000 to $99,999 | 3 (5.7%) | 5 (7.1%) |
| $100,000 to $149,999 | 16 (30.2%) | 15 (21.4%) |
| $150,000 or more | 4 (7.5%) | 16 (22.9%) |
| Total | 53 (100.0%) | 70 (100.0%) |
Property Value to Household Income Ratio in Mayfield
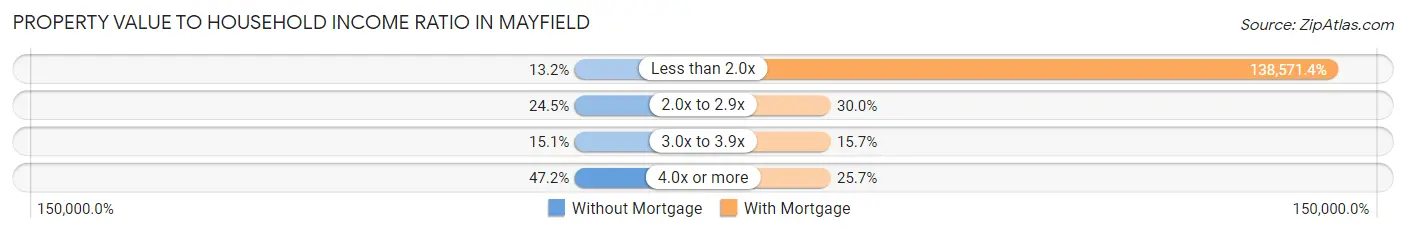
| Value-to-Income Ratio | Without Mortgage | With Mortgage |
| Less than 2.0x | 7 (13.2%) | 97,000 (138,571.4%) |
| 2.0x to 2.9x | 13 (24.5%) | 21 (30.0%) |
| 3.0x to 3.9x | 8 (15.1%) | 11 (15.7%) |
| 4.0x or more | 25 (47.2%) | 18 (25.7%) |
| Total | 53 (100.0%) | 70 (100.0%) |
Real Estate Taxes by Mortgage Status in Mayfield
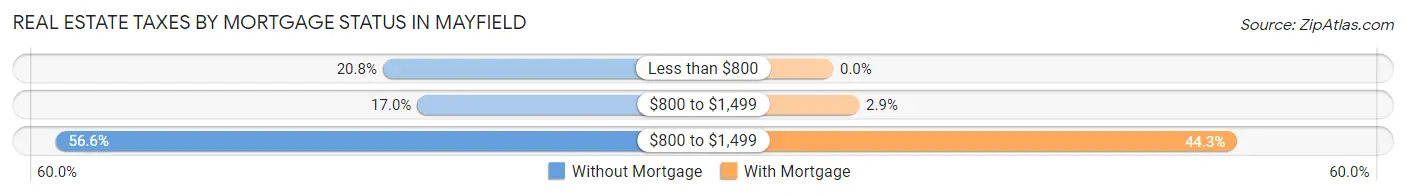
| Property Taxes | Without Mortgage | With Mortgage |
| Less than $800 | 11 (20.7%) | 0 (0.0%) |
| $800 to $1,499 | 9 (17.0%) | 2 (2.9%) |
| $800 to $1,499 | 30 (56.6%) | 31 (44.3%) |
| Total | 53 (100.0%) | 70 (100.0%) |
Health & Disability in Mayfield
Health Insurance Coverage by Age in Mayfield
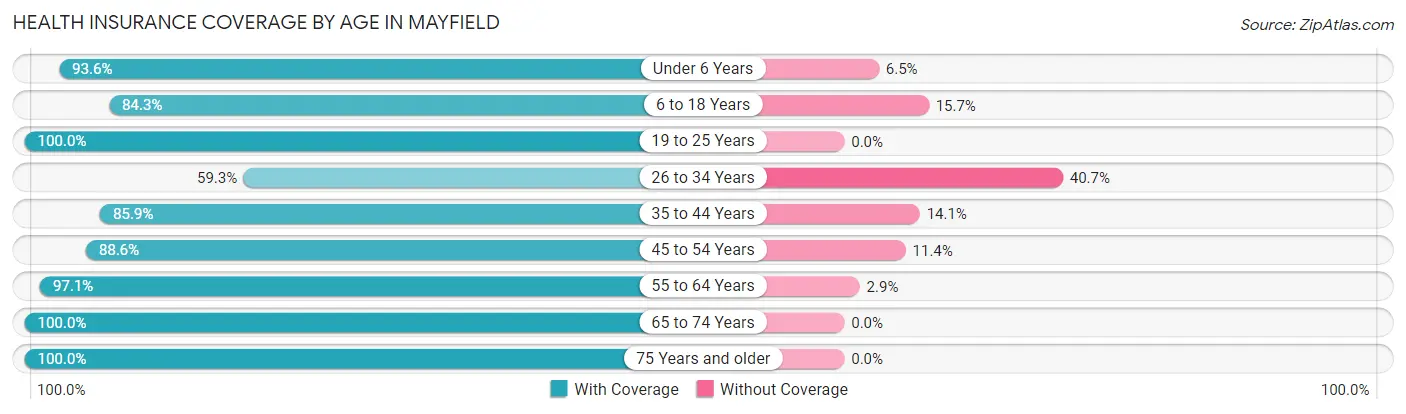
| Age Bracket | With Coverage | Without Coverage |
| Under 6 Years | 29 (93.5%) | 2 (6.5%) |
| 6 to 18 Years | 91 (84.3%) | 17 (15.7%) |
| 19 to 25 Years | 12 (100.0%) | 0 (0.0%) |
| 26 to 34 Years | 16 (59.3%) | 11 (40.7%) |
| 35 to 44 Years | 55 (85.9%) | 9 (14.1%) |
| 45 to 54 Years | 31 (88.6%) | 4 (11.4%) |
| 55 to 64 Years | 68 (97.1%) | 2 (2.9%) |
| 65 to 74 Years | 43 (100.0%) | 0 (0.0%) |
| 75 Years and older | 26 (100.0%) | 0 (0.0%) |
| Total | 371 (89.2%) | 45 (10.8%) |
Health Insurance Coverage by Citizenship Status in Mayfield
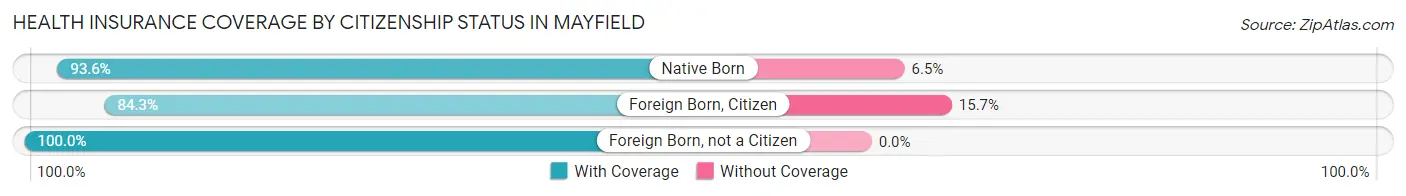
| Citizenship Status | With Coverage | Without Coverage |
| Native Born | 29 (93.5%) | 2 (6.5%) |
| Foreign Born, Citizen | 91 (84.3%) | 17 (15.7%) |
| Foreign Born, not a Citizen | 12 (100.0%) | 0 (0.0%) |
Health Insurance Coverage by Household Income in Mayfield
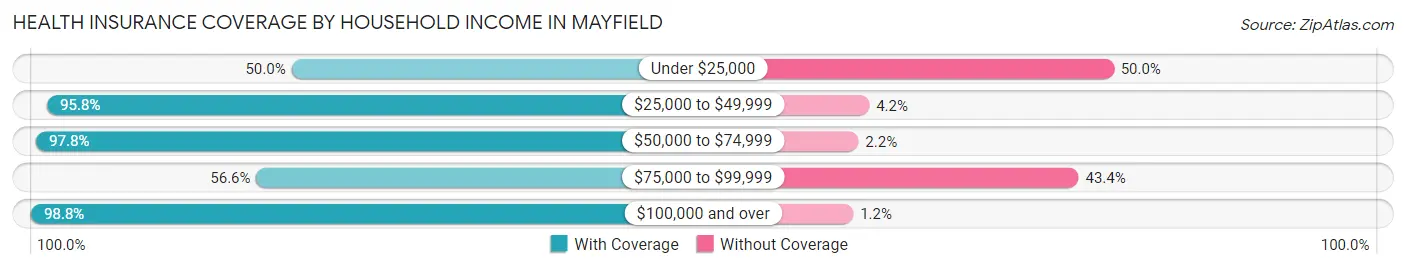
| Household Income | With Coverage | Without Coverage |
| Under $25,000 | 4 (50.0%) | 4 (50.0%) |
| $25,000 to $49,999 | 114 (95.8%) | 5 (4.2%) |
| $50,000 to $74,999 | 45 (97.8%) | 1 (2.2%) |
| $75,000 to $99,999 | 43 (56.6%) | 33 (43.4%) |
| $100,000 and over | 165 (98.8%) | 2 (1.2%) |
Public vs Private Health Insurance Coverage by Age in Mayfield
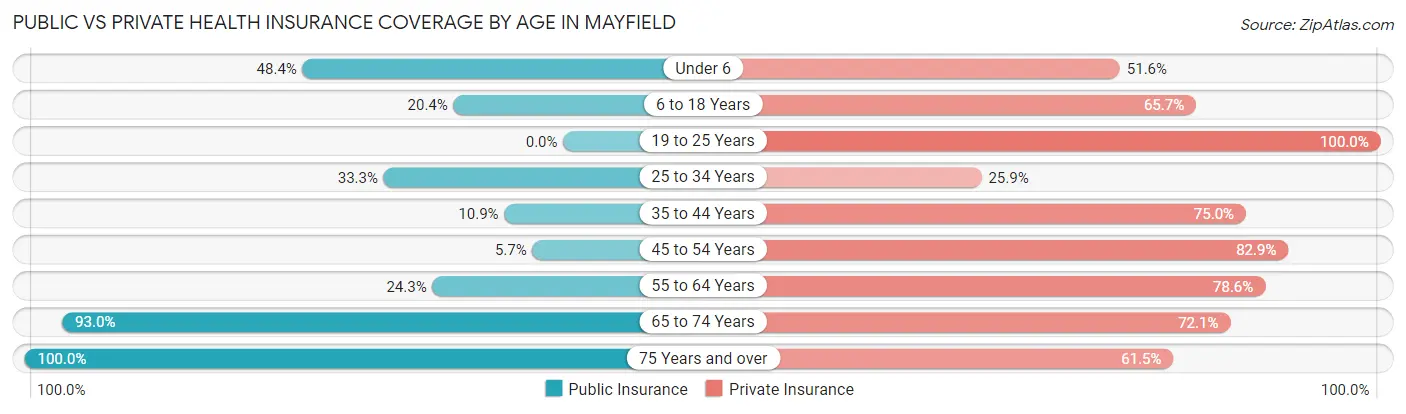
| Age Bracket | Public Insurance | Private Insurance |
| Under 6 | 15 (48.4%) | 16 (51.6%) |
| 6 to 18 Years | 22 (20.4%) | 71 (65.7%) |
| 19 to 25 Years | 0 (0.0%) | 12 (100.0%) |
| 25 to 34 Years | 9 (33.3%) | 7 (25.9%) |
| 35 to 44 Years | 7 (10.9%) | 48 (75.0%) |
| 45 to 54 Years | 2 (5.7%) | 29 (82.9%) |
| 55 to 64 Years | 17 (24.3%) | 55 (78.6%) |
| 65 to 74 Years | 40 (93.0%) | 31 (72.1%) |
| 75 Years and over | 26 (100.0%) | 16 (61.5%) |
| Total | 138 (33.2%) | 285 (68.5%) |
Disability Status by Sex by Age in Mayfield
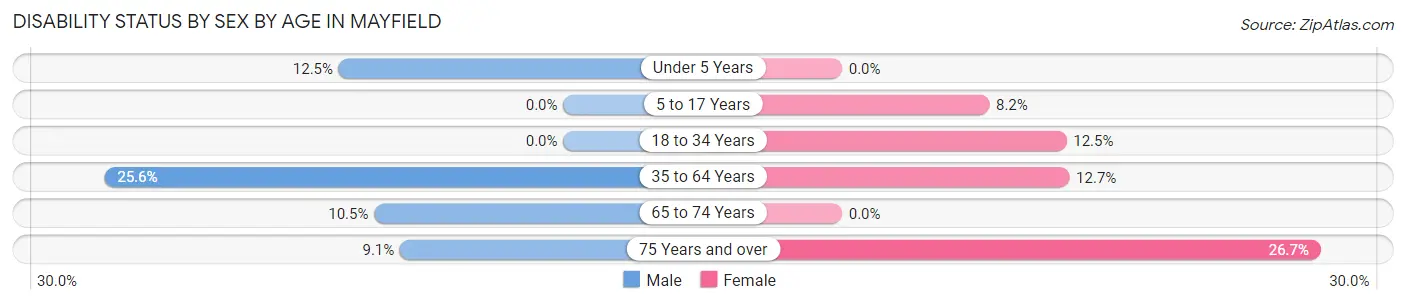
| Age Bracket | Male | Female |
| Under 5 Years | 2 (12.5%) | 0 (0.0%) |
| 5 to 17 Years | 0 (0.0%) | 5 (8.2%) |
| 18 to 34 Years | 0 (0.0%) | 3 (12.5%) |
| 35 to 64 Years | 23 (25.6%) | 10 (12.7%) |
| 65 to 74 Years | 2 (10.5%) | 0 (0.0%) |
| 75 Years and over | 1 (9.1%) | 4 (26.7%) |
Disability Class by Sex by Age in Mayfield
Disability Class: Hearing Difficulty
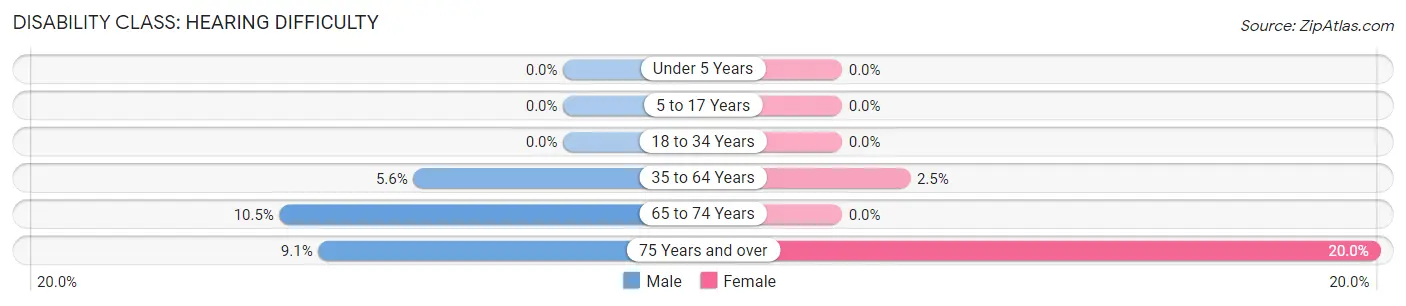
| Age Bracket | Male | Female |
| Under 5 Years | 0 (0.0%) | 0 (0.0%) |
| 5 to 17 Years | 0 (0.0%) | 0 (0.0%) |
| 18 to 34 Years | 0 (0.0%) | 0 (0.0%) |
| 35 to 64 Years | 5 (5.6%) | 2 (2.5%) |
| 65 to 74 Years | 2 (10.5%) | 0 (0.0%) |
| 75 Years and over | 1 (9.1%) | 3 (20.0%) |
Disability Class: Vision Difficulty
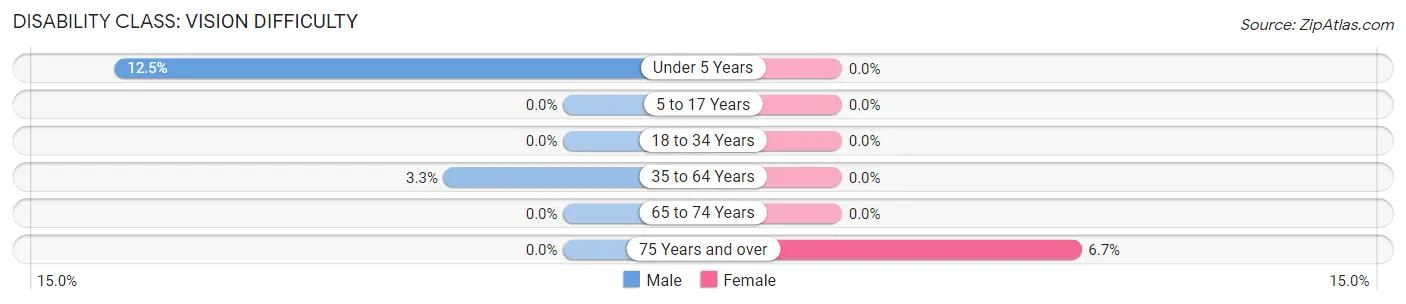
| Age Bracket | Male | Female |
| Under 5 Years | 2 (12.5%) | 0 (0.0%) |
| 5 to 17 Years | 0 (0.0%) | 0 (0.0%) |
| 18 to 34 Years | 0 (0.0%) | 0 (0.0%) |
| 35 to 64 Years | 3 (3.3%) | 0 (0.0%) |
| 65 to 74 Years | 0 (0.0%) | 0 (0.0%) |
| 75 Years and over | 0 (0.0%) | 1 (6.7%) |
Disability Class: Cognitive Difficulty
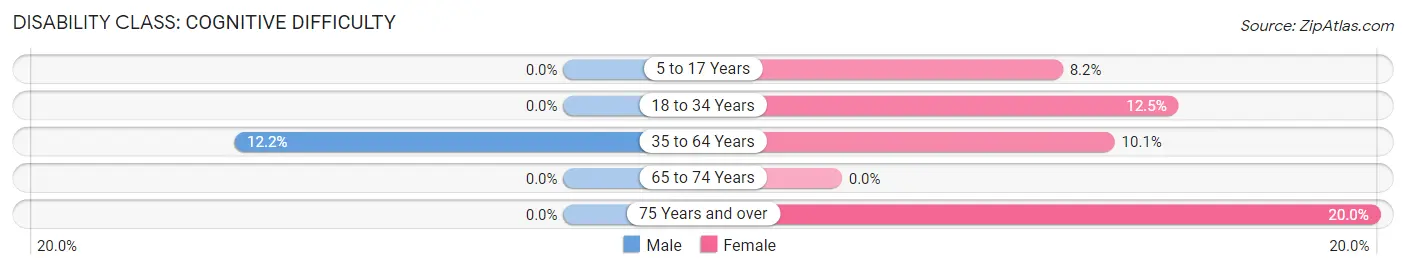
| Age Bracket | Male | Female |
| 5 to 17 Years | 0 (0.0%) | 5 (8.2%) |
| 18 to 34 Years | 0 (0.0%) | 3 (12.5%) |
| 35 to 64 Years | 11 (12.2%) | 8 (10.1%) |
| 65 to 74 Years | 0 (0.0%) | 0 (0.0%) |
| 75 Years and over | 0 (0.0%) | 3 (20.0%) |
Disability Class: Ambulatory Difficulty
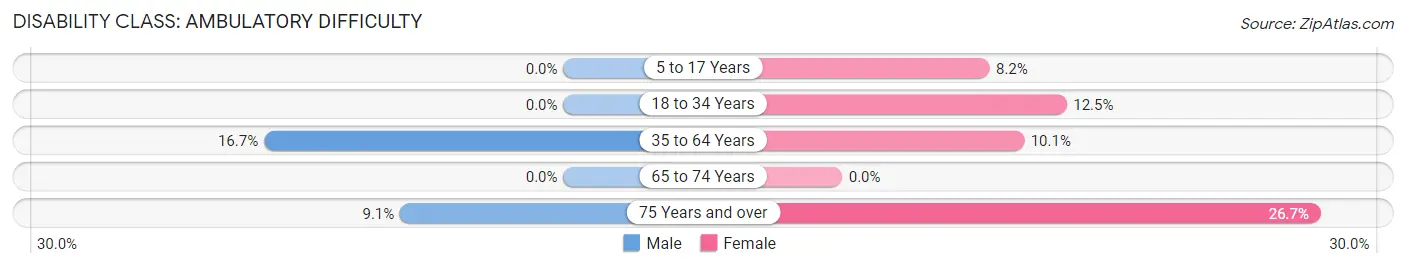
| Age Bracket | Male | Female |
| 5 to 17 Years | 0 (0.0%) | 5 (8.2%) |
| 18 to 34 Years | 0 (0.0%) | 3 (12.5%) |
| 35 to 64 Years | 15 (16.7%) | 8 (10.1%) |
| 65 to 74 Years | 0 (0.0%) | 0 (0.0%) |
| 75 Years and over | 1 (9.1%) | 4 (26.7%) |
Disability Class: Self-Care Difficulty
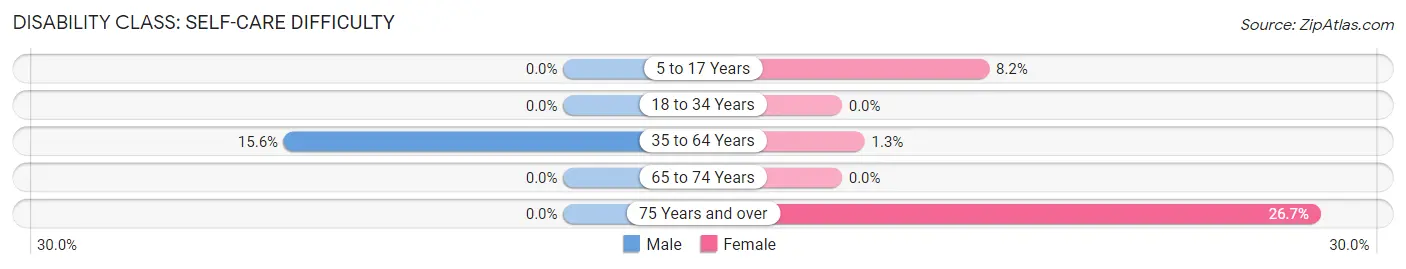
| Age Bracket | Male | Female |
| 5 to 17 Years | 0 (0.0%) | 5 (8.2%) |
| 18 to 34 Years | 0 (0.0%) | 0 (0.0%) |
| 35 to 64 Years | 14 (15.6%) | 1 (1.3%) |
| 65 to 74 Years | 0 (0.0%) | 0 (0.0%) |
| 75 Years and over | 0 (0.0%) | 4 (26.7%) |
Technology Access in Mayfield
Computing Device Access in Mayfield
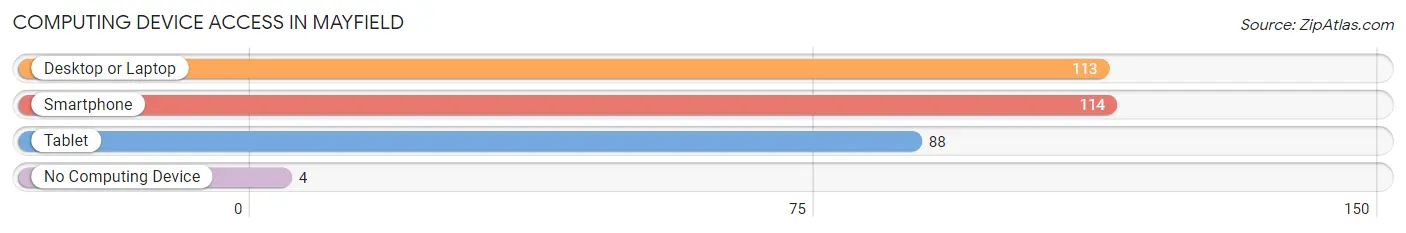
| Device Type | # Households | % Households |
| Desktop or Laptop | 113 | 89.7% |
| Smartphone | 114 | 90.5% |
| Tablet | 88 | 69.8% |
| No Computing Device | 4 | 3.2% |
| Total | 126 | 100.0% |
Internet Access in Mayfield
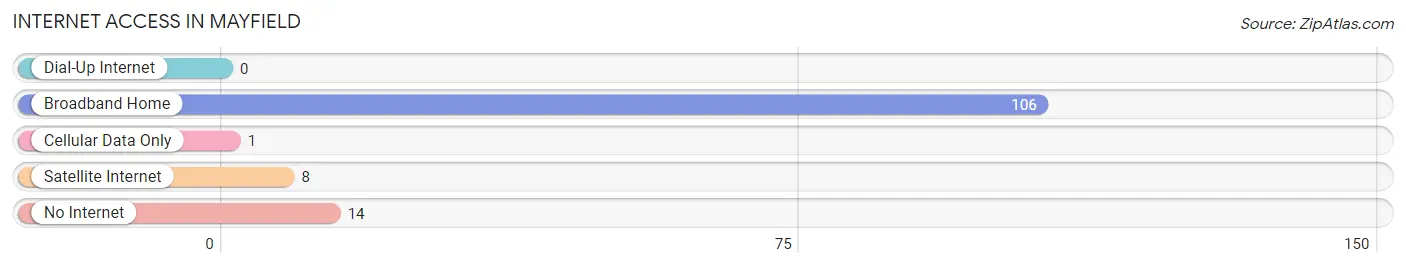
| Internet Type | # Households | % Households |
| Dial-Up Internet | 0 | 0.0% |
| Broadband Home | 106 | 84.1% |
| Cellular Data Only | 1 | 0.8% |
| Satellite Internet | 8 | 6.4% |
| No Internet | 14 | 11.1% |
| Total | 126 | 100.0% |
Mayfield Summary
Mayfield, Utah is a small city located in the southwestern part of the state, in Sanpete County. It is situated at the base of the Wasatch Mountains, and is surrounded by the towns of Ephraim, Manti, and Gunnison. The city has a population of 1,845 people, according to the 2010 census.
Geography
Mayfield is located at the base of the Wasatch Mountains, in the Sanpete Valley. The city is situated at an elevation of 5,890 feet, and is surrounded by the towns of Ephraim, Manti, and Gunnison. The city is located in the Central Time Zone, and is about a two-hour drive from Salt Lake City.
The city is situated on the banks of the San Pitch River, which flows through the city and provides a source of recreation for the locals. The city is also home to a number of small lakes, including Mayfield Lake, which is located just outside of town.
The city is home to a variety of wildlife, including deer, elk, and moose. The area is also home to a variety of birds, including bald eagles, hawks, and owls.
History
Mayfield was first settled in 1859 by a group of Mormon pioneers. The city was named after William Mayfield, who was one of the first settlers in the area. The city was incorporated in 1877, and has since grown to become a thriving community.
The city has a rich history, and is home to a number of historic sites, including the Mayfield Tabernacle, which was built in 1877. The tabernacle is still in use today, and is a popular destination for visitors to the area.
Economy
Mayfield is a small city, and the economy is largely based on agriculture and tourism. The city is home to a number of farms, which produce a variety of crops, including corn, wheat, and hay. The city is also home to a number of small businesses, including restaurants, shops, and other services.
The city is also home to a number of tourist attractions, including the Mayfield Tabernacle, the San Pitch River, and the nearby Wasatch Mountains. The city is also home to a number of festivals and events, including the Mayfield Days Festival, which is held every year in June.
Demographics
According to the 2010 census, the population of Mayfield was 1,845 people. The population is largely made up of white (93.3%) and Hispanic (4.2%) residents. The median household income in the city is $41,944, and the median age is 33.7 years.
Mayfield is a small city, but it is a thriving community with a rich history and a vibrant economy. The city is home to a variety of attractions, and is a popular destination for visitors to the area. The city is also home to a number of small businesses, which provide a variety of services to the local community.
Common Questions
What is the Total Population of Mayfield?
Total Population of Mayfield is 416.
What is the Total Male Population of Mayfield?
Total Male Population of Mayfield is 203.
What is the Total Female Population of Mayfield?
Total Female Population of Mayfield is 213.
What is the Ratio of Males per 100 Females in Mayfield?
There are 95.31 Males per 100 Females in Mayfield.
What is the Ratio of Females per 100 Males in Mayfield?
There are 104.93 Females per 100 Males in Mayfield.
What is the Median Population Age in Mayfield?
Median Population Age in Mayfield is 38.9 Years.
What is the Average Family Size in Mayfield
Average Family Size in Mayfield is 3.5 People.
What is the Average Household Size in Mayfield
Average Household Size in Mayfield is 3.3 People.
What is Per Capita Income in Mayfield?
Per Capita income in Mayfield is $29,687.
What is the Median Family Income in Mayfield?
Median Family Income in Mayfield is $95,500.
What is the Median Household income in Mayfield?
Median Household Income in Mayfield is $85,000.
What is Income or Wage Gap in Mayfield?
Income or Wage Gap in Mayfield is 74.9%.
Women in Mayfield earn 25.1 cents for every dollar earned by a man.
What is Inequality or Gini Index in Mayfield?
Inequality or Gini Index in Mayfield is 0.33.
How Large is the Labor Force in Mayfield?
There are 179 People in the Labor Forcein in Mayfield.
What is the Percentage of People in the Labor Force in Mayfield?
59.7% of People are in the Labor Force in Mayfield.
What is the Unemployment Rate in Mayfield?
Unemployment Rate in Mayfield is 2.2%.