Independence, UT
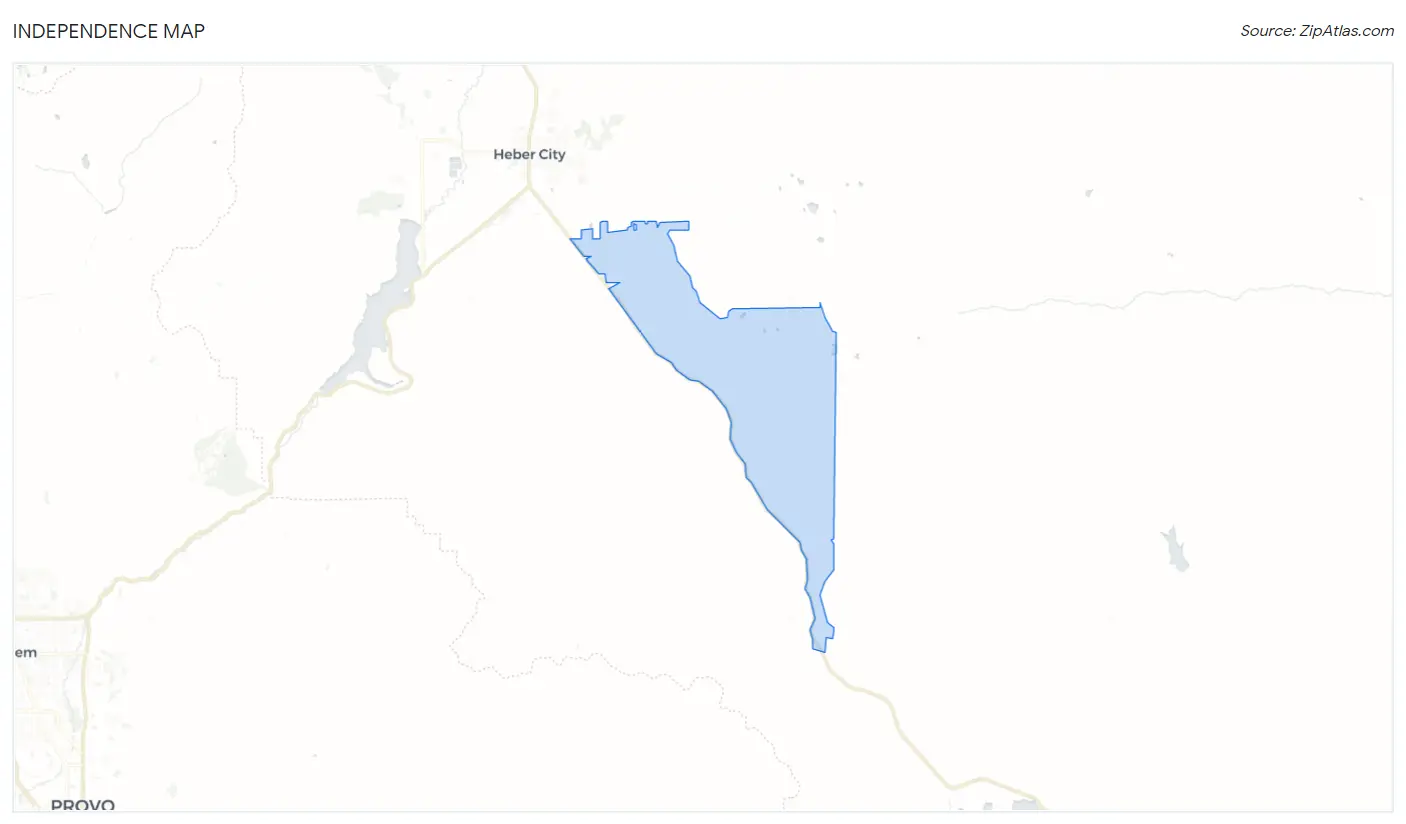
Independence Map
Independence Overview
100
TOTAL POPULATION
51
MALE POPULATION
49
FEMALE POPULATION
104.08
MALES / 100 FEMALES
96.08
FEMALES / 100 MALES
37.0
MEDIAN AGE
3.4
AVG FAMILY SIZE
3.5
AVG HOUSEHOLD SIZE
$56,398
PER CAPITA INCOME
$148,750
AVG FAMILY INCOME
$148,750
AVG HOUSEHOLD INCOME
0.38
INEQUALITY / GINI INDEX
48
LABOR FORCE [ PEOPLE ]
76.2%
PERCENT IN LABOR FORCE
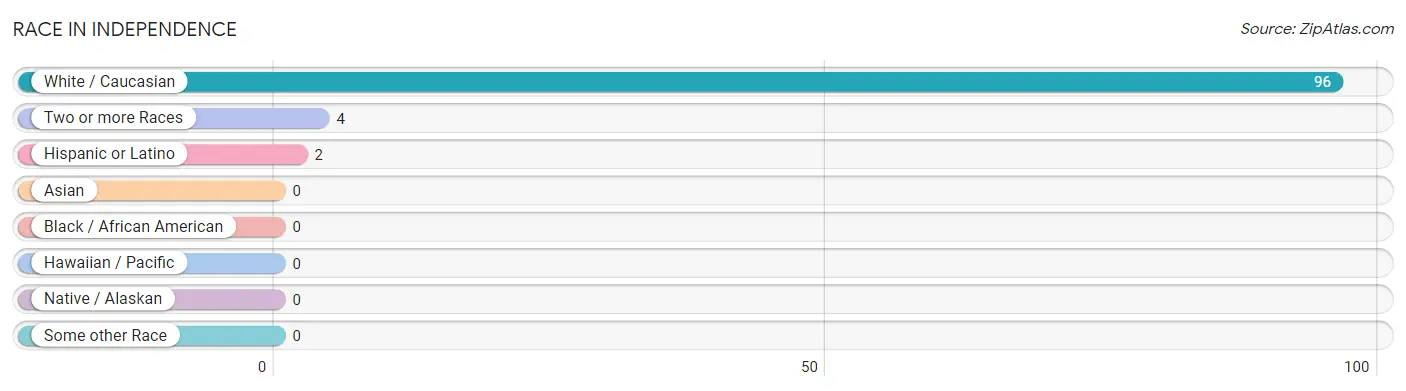
Race in Independence
The most populous races in Independence are White / Caucasian (96 | 96.0%), Two or more Races (4 | 4.0%), and Hispanic or Latino (2 | 2.0%).
| Race | # Population | % Population |
| Asian | 0 | 0.0% |
| Black / African American | 0 | 0.0% |
| Hawaiian / Pacific | 0 | 0.0% |
| Hispanic or Latino | 2 | 2.0% |
| Native / Alaskan | 0 | 0.0% |
| White / Caucasian | 96 | 96.0% |
| Two or more Races | 4 | 4.0% |
| Some other Race | 0 | 0.0% |
| Total | 100 | 100.0% |
Ancestry in Independence
The most populous ancestries reported in Independence are Italian (29 | 29.0%), European (12 | 12.0%), Scottish (12 | 12.0%), Dutch (10 | 10.0%), and English (9 | 9.0%), together accounting for 72.0% of all Independence residents.
| Ancestry | # Population | % Population |
| African | 1 | 1.0% |
| Dutch | 10 | 10.0% |
| English | 9 | 9.0% |
| European | 12 | 12.0% |
| German | 8 | 8.0% |
| Irish | 5 | 5.0% |
| Italian | 29 | 29.0% |
| Mexican | 2 | 2.0% |
| Northern European | 4 | 4.0% |
| Portuguese | 1 | 1.0% |
| Scottish | 12 | 12.0% |
| Subsaharan African | 1 | 1.0% |
| Swiss | 2 | 2.0% |
| Welsh | 1 | 1.0% | View All 14 Rows |
Immigrants in Independence
The most numerous immigrant groups reported in Independence came from , and Africa (1 | 1.0%), together accounting for 1.0% of all Independence residents.

| Immigration Origin | # Population | % Population |
| Africa | 1 | 1.0% | View All 1 Rows |
Sex and Age in Independence
Sex and Age in Independence
The most populous age groups in Independence are Under 5 Years (9 | 17.6%) for men and Under 5 Years (10 | 20.4%) for women.
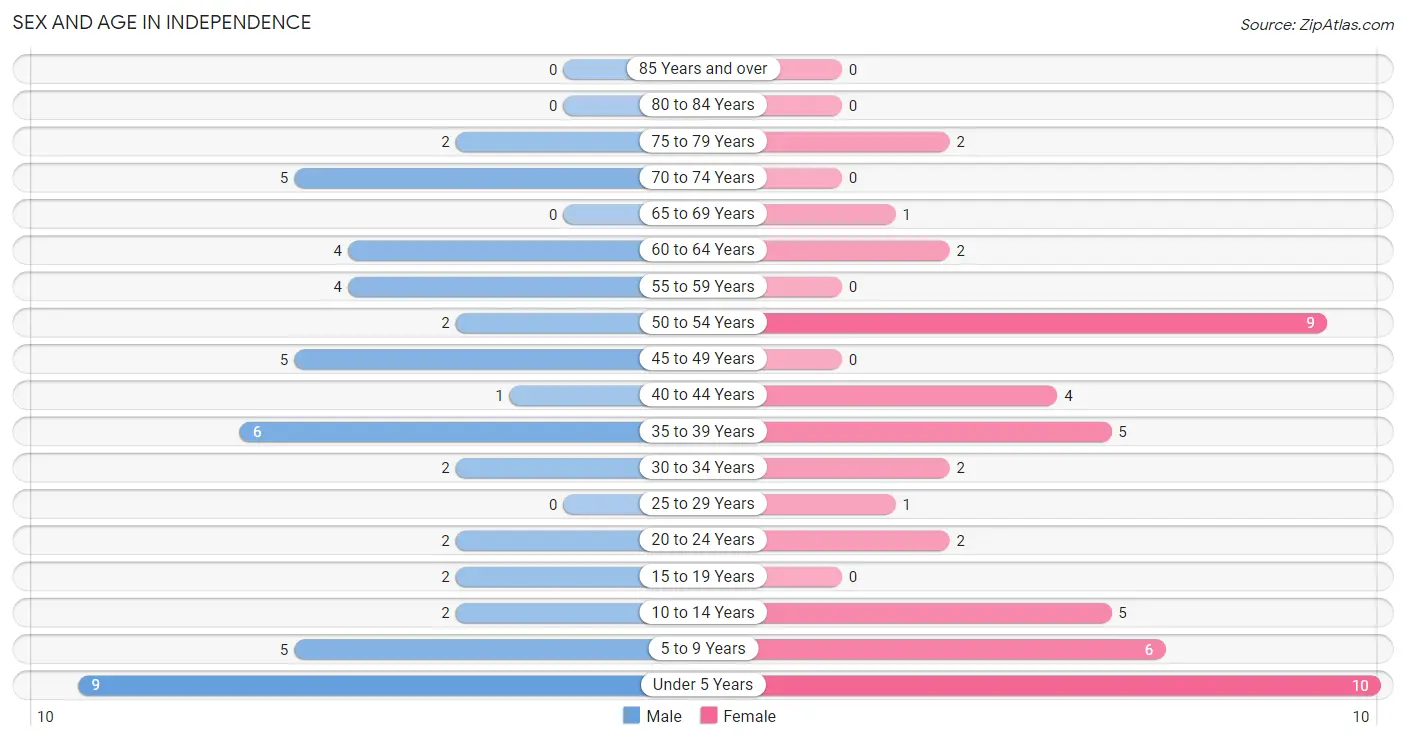
| Age Bracket | Male | Female |
| Under 5 Years | 9 (17.6%) | 10 (20.4%) |
| 5 to 9 Years | 5 (9.8%) | 6 (12.2%) |
| 10 to 14 Years | 2 (3.9%) | 5 (10.2%) |
| 15 to 19 Years | 2 (3.9%) | 0 (0.0%) |
| 20 to 24 Years | 2 (3.9%) | 2 (4.1%) |
| 25 to 29 Years | 0 (0.0%) | 1 (2.0%) |
| 30 to 34 Years | 2 (3.9%) | 2 (4.1%) |
| 35 to 39 Years | 6 (11.8%) | 5 (10.2%) |
| 40 to 44 Years | 1 (2.0%) | 4 (8.2%) |
| 45 to 49 Years | 5 (9.8%) | 0 (0.0%) |
| 50 to 54 Years | 2 (3.9%) | 9 (18.4%) |
| 55 to 59 Years | 4 (7.8%) | 0 (0.0%) |
| 60 to 64 Years | 4 (7.8%) | 2 (4.1%) |
| 65 to 69 Years | 0 (0.0%) | 1 (2.0%) |
| 70 to 74 Years | 5 (9.8%) | 0 (0.0%) |
| 75 to 79 Years | 2 (3.9%) | 2 (4.1%) |
| 80 to 84 Years | 0 (0.0%) | 0 (0.0%) |
| 85 Years and over | 0 (0.0%) | 0 (0.0%) |
| Total | 51 (100.0%) | 49 (100.0%) |
Families and Households in Independence
Median Family Size in Independence
The median family size in Independence is 3.41 persons per family, with married-couple families (23 | 79.3%) accounting for the largest median family size of 3.74 persons per family. On the other hand, single male/father families (5 | 17.2%) represent the smallest median family size with 2.00 persons per family.
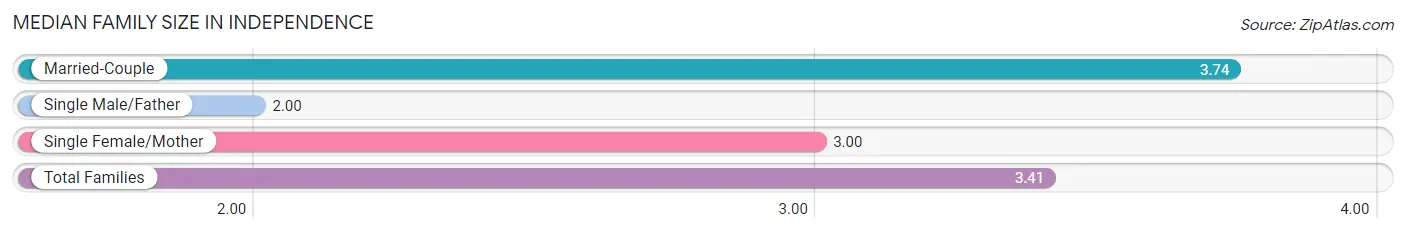
| Family Type | # Families | Family Size |
| Married-Couple | 23 (79.3%) | 3.74 |
| Single Male/Father | 5 (17.2%) | 2.00 |
| Single Female/Mother | 1 (3.5%) | 3.00 |
| Total Families | 29 (100.0%) | 3.41 |
Median Household Size in Independence
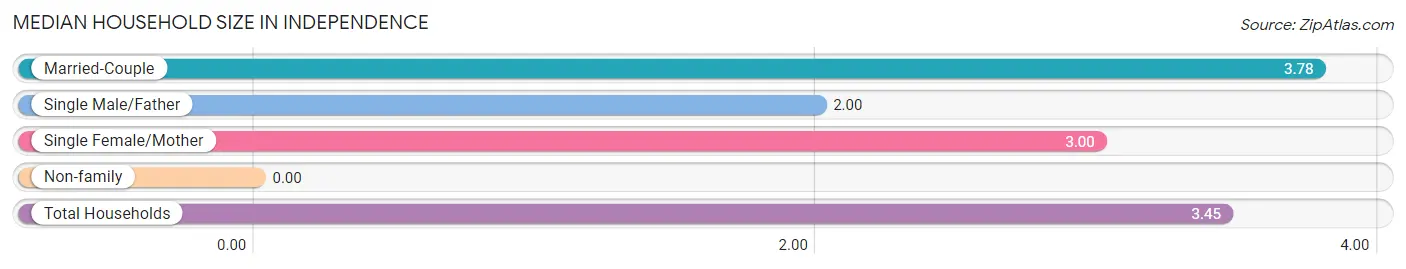
| Household Type | # Households | Household Size |
| Married-Couple | 23 (79.3%) | 3.78 |
| Single Male/Father | 5 (17.2%) | 2.00 |
| Single Female/Mother | 1 (3.5%) | 3.00 |
| Non-family | 0 (0.0%) | - |
| Total Households | 29 (100.0%) | 3.45 |
Household Size by Marriage Status in Independence
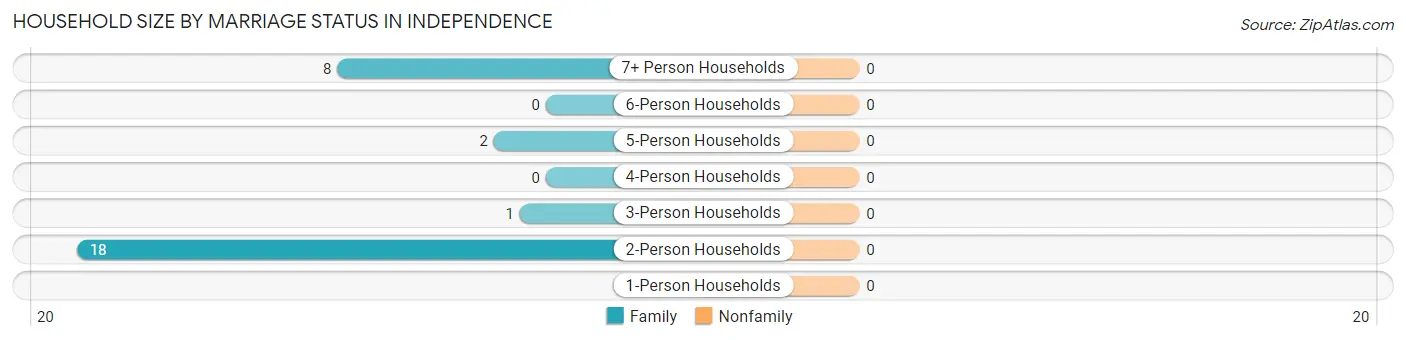
| Household Size | Family Households | Nonfamily Households |
| 1-Person Households | - | 0 (0.0%) |
| 2-Person Households | 18 (62.1%) | 0 (0.0%) |
| 3-Person Households | 1 (3.5%) | 0 (0.0%) |
| 4-Person Households | 0 (0.0%) | 0 (0.0%) |
| 5-Person Households | 2 (6.9%) | 0 (0.0%) |
| 6-Person Households | 0 (0.0%) | 0 (0.0%) |
| 7+ Person Households | 8 (27.6%) | 0 (0.0%) |
| Total | 29 (100.0%) | 0 (0.0%) |
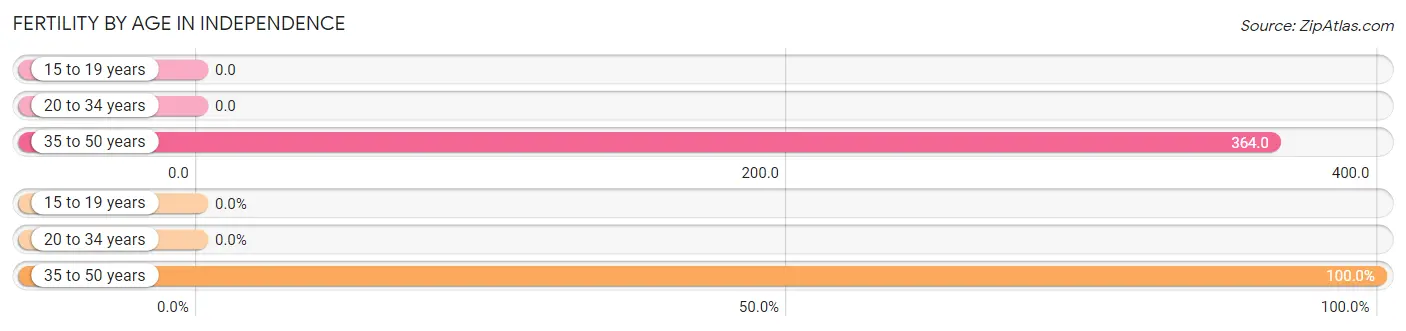
Female Fertility in Independence
Fertility by Age in Independence
Average fertility rate in Independence is 250.0 births per 1,000 women. Women in the age bracket of 35 to 50 years have the highest fertility rate with 364.0 births per 1,000 women. Women in the age bracket of 35 to 50 years acount for 100.0% of all women with births.
| Age Bracket | Women with Births | Births / 1,000 Women |
| 15 to 19 years | 0 (0.0%) | 0.0 |
| 20 to 34 years | 0 (0.0%) | 0.0 |
| 35 to 50 years | 4 (100.0%) | 364.0 |
| Total | 4 (100.0%) | 250.0 |
Fertility by Age by Marriage Status in Independence
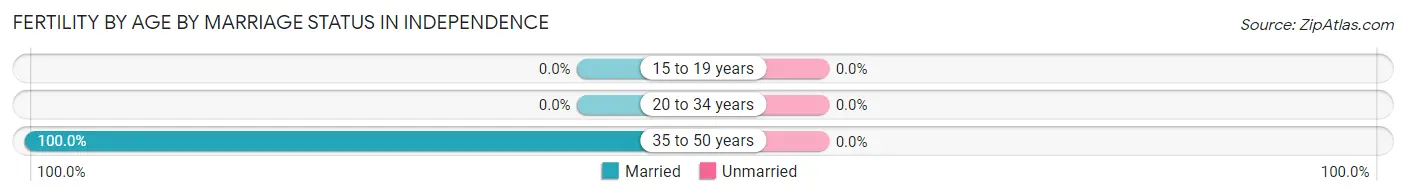
| Age Bracket | Married | Unmarried |
| 15 to 19 years | 0 (0.0%) | 0 (0.0%) |
| 20 to 34 years | 0 (0.0%) | 0 (0.0%) |
| 35 to 50 years | 4 (100.0%) | 0 (0.0%) |
| Total | 4 (100.0%) | 0 (0.0%) |
Fertility by Education in Independence
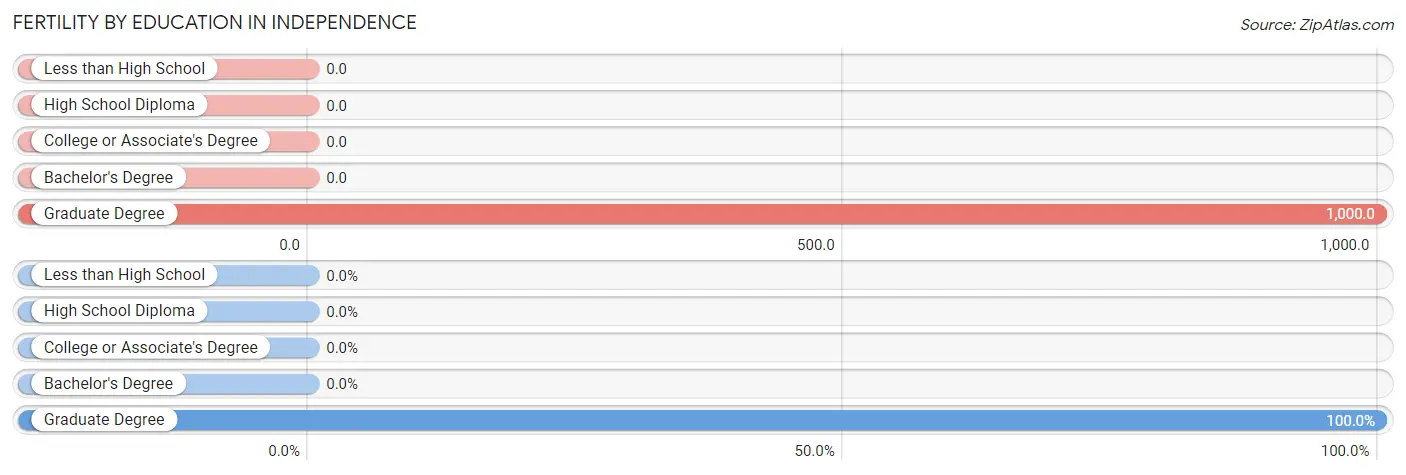
| Educational Attainment | Women with Births | Births / 1,000 Women |
| Less than High School | 0 (0.0%) | 0.0 |
| High School Diploma | 0 (0.0%) | 0.0 |
| College or Associate's Degree | 0 (0.0%) | 0.0 |
| Bachelor's Degree | 0 (0.0%) | 0.0 |
| Graduate Degree | 4 (100.0%) | 1,000.0 |
| Total | 4 (100.0%) | 250.0 |
Fertility by Education by Marriage Status in Independence
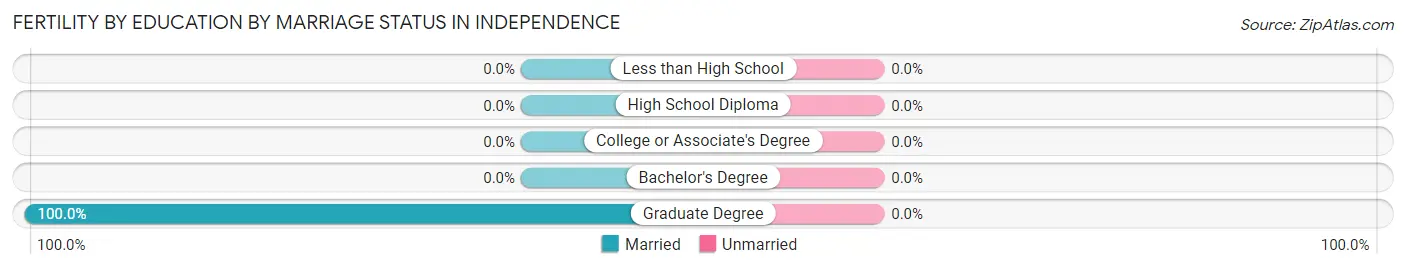
| Educational Attainment | Married | Unmarried |
| Less than High School | 0 (0.0%) | 0 (0.0%) |
| High School Diploma | 0 (0.0%) | 0 (0.0%) |
| College or Associate's Degree | 0 (0.0%) | 0 (0.0%) |
| Bachelor's Degree | 0 (0.0%) | 0 (0.0%) |
| Graduate Degree | 4 (100.0%) | 0 (0.0%) |
| Total | 4 (100.0%) | 0 (0.0%) |
Income in Independence
Income Overview in Independence
Per Capita Income in Independence is $56,398, while median incomes of families and households are $148,750 and $148,750 respectively.
| Characteristic | Number | Measure |
| Per Capita Income | 100 | $56,398 |
| Median Family Income | 29 | $148,750 |
| Mean Family Income | 29 | $193,245 |
| Median Household Income | 29 | $148,750 |
| Mean Household Income | 29 | $193,245 |
| Income Deficit | 29 | $0 |
| Wage / Income Gap (%) | 100 | 0.00% |
| Wage / Income Gap ($) | 100 | 100.00¢ per $1 |
| Gini / Inequality Index | 100 | 0.38 |
Earnings by Sex in Independence
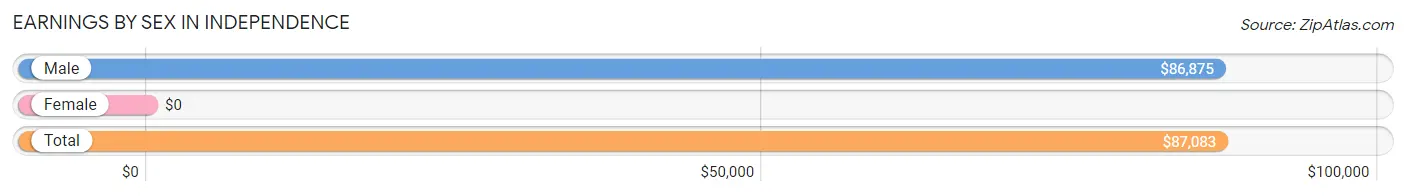
| Sex | Number | Average Earnings |
| Male | 27 (51.9%) | $86,875 |
| Female | 25 (48.1%) | $0 |
| Total | 52 (100.0%) | $87,083 |
Earnings by Sex by Income Bracket in Independence
The most common earnings brackets in Independence are $100,000+ for men (11 | 40.7%) and $75,000 to $99,999 for women (7 | 28.0%).
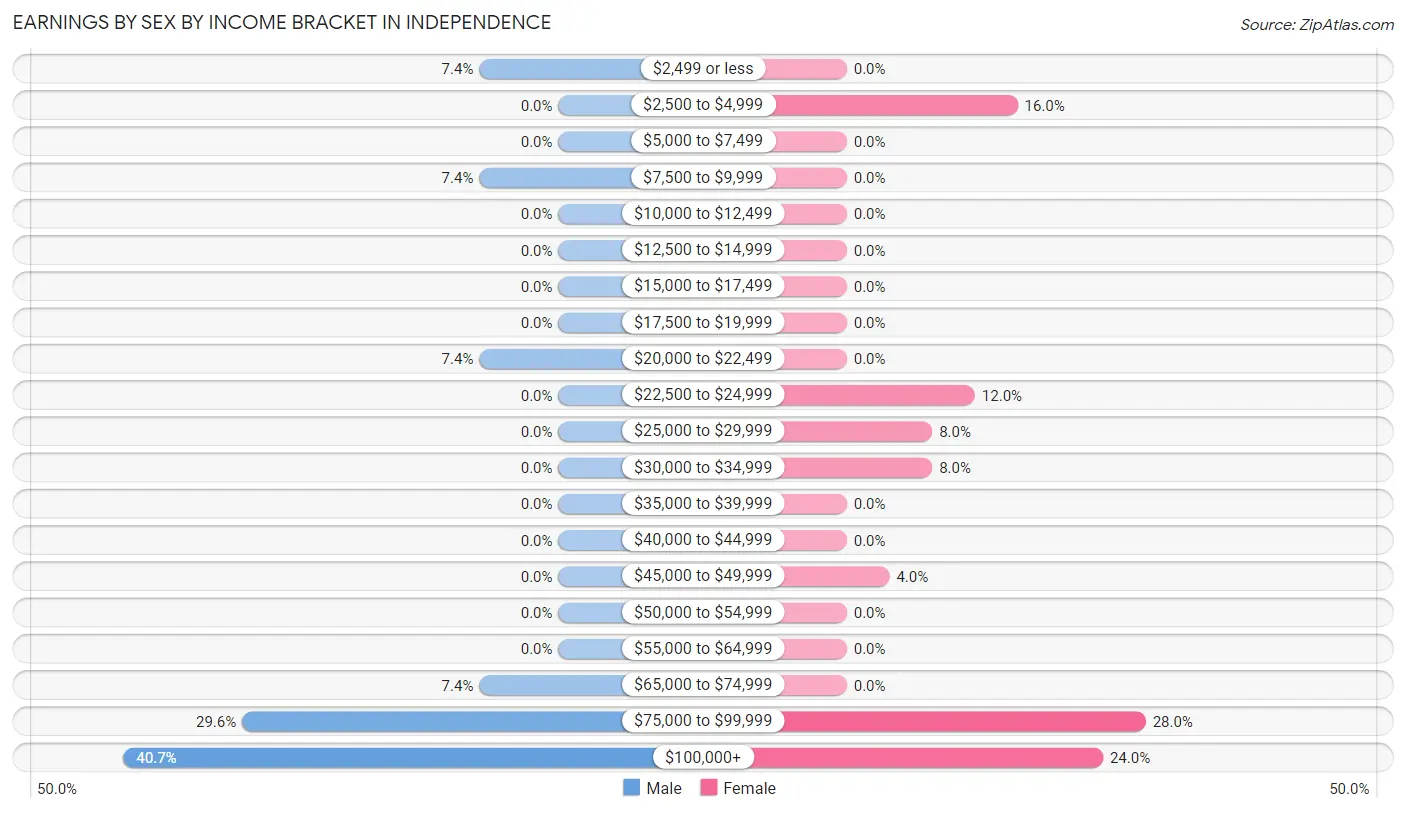
| Income | Male | Female |
| $2,499 or less | 2 (7.4%) | 0 (0.0%) |
| $2,500 to $4,999 | 0 (0.0%) | 4 (16.0%) |
| $5,000 to $7,499 | 0 (0.0%) | 0 (0.0%) |
| $7,500 to $9,999 | 2 (7.4%) | 0 (0.0%) |
| $10,000 to $12,499 | 0 (0.0%) | 0 (0.0%) |
| $12,500 to $14,999 | 0 (0.0%) | 0 (0.0%) |
| $15,000 to $17,499 | 0 (0.0%) | 0 (0.0%) |
| $17,500 to $19,999 | 0 (0.0%) | 0 (0.0%) |
| $20,000 to $22,499 | 2 (7.4%) | 0 (0.0%) |
| $22,500 to $24,999 | 0 (0.0%) | 3 (12.0%) |
| $25,000 to $29,999 | 0 (0.0%) | 2 (8.0%) |
| $30,000 to $34,999 | 0 (0.0%) | 2 (8.0%) |
| $35,000 to $39,999 | 0 (0.0%) | 0 (0.0%) |
| $40,000 to $44,999 | 0 (0.0%) | 0 (0.0%) |
| $45,000 to $49,999 | 0 (0.0%) | 1 (4.0%) |
| $50,000 to $54,999 | 0 (0.0%) | 0 (0.0%) |
| $55,000 to $64,999 | 0 (0.0%) | 0 (0.0%) |
| $65,000 to $74,999 | 2 (7.4%) | 0 (0.0%) |
| $75,000 to $99,999 | 8 (29.6%) | 7 (28.0%) |
| $100,000+ | 11 (40.7%) | 6 (24.0%) |
| Total | 27 (100.0%) | 25 (100.0%) |
Earnings by Sex by Educational Attainment in Independence
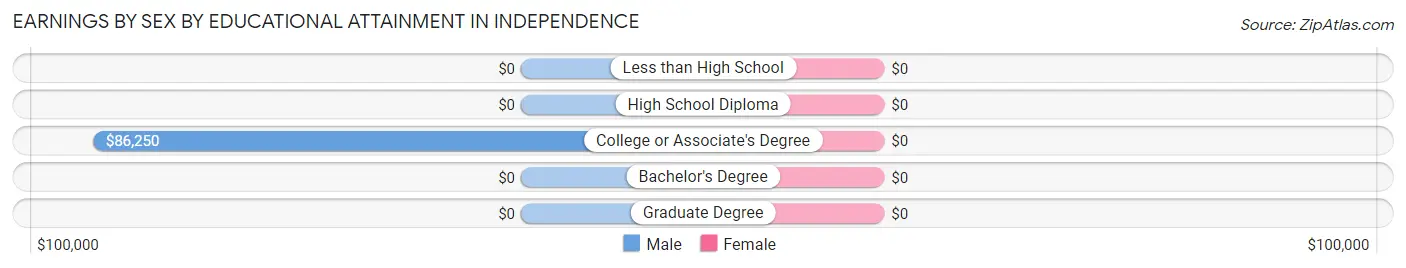
| Educational Attainment | Male Income | Female Income |
| Less than High School | - | - |
| High School Diploma | - | - |
| College or Associate's Degree | $86,250 | $0 |
| Bachelor's Degree | - | - |
| Graduate Degree | - | - |
| Total | $91,250 | $0 |
Family Income in Independence
Family Income Brackets in Independence
According to the Independence family income data, there are 10 families falling into the $100,000 to $149,999 income range, which is the most common income bracket and makes up 34.5% of all families.
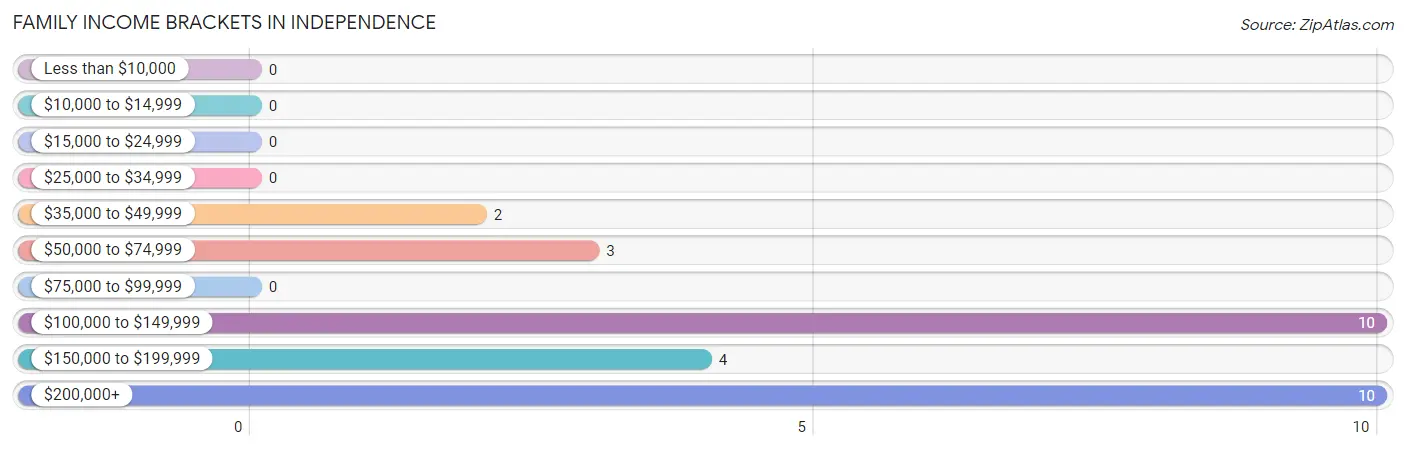
| Income Bracket | # Families | % Families |
| Less than $10,000 | 0 | 0.0% |
| $10,000 to $14,999 | 0 | 0.0% |
| $15,000 to $24,999 | 0 | 0.0% |
| $25,000 to $34,999 | 0 | 0.0% |
| $35,000 to $49,999 | 2 | 6.9% |
| $50,000 to $74,999 | 3 | 10.3% |
| $75,000 to $99,999 | 0 | 0.0% |
| $100,000 to $149,999 | 10 | 34.5% |
| $150,000 to $199,999 | 4 | 13.8% |
| $200,000+ | 10 | 34.5% |
Family Income by Famaliy Size in Independence
| Income Bracket | # Families | Median Income |
| 2-Person Families | 18 (62.1%) | $0 |
| 3-Person Families | 1 (3.5%) | $0 |
| 4-Person Families | 1 (3.5%) | $0 |
| 5-Person Families | 1 (3.5%) | $0 |
| 6-Person Families | 0 (0.0%) | $0 |
| 7+ Person Families | 8 (27.6%) | $0 |
| Total | 29 (100.0%) | $148,750 |
Family Income by Number of Earners in Independence
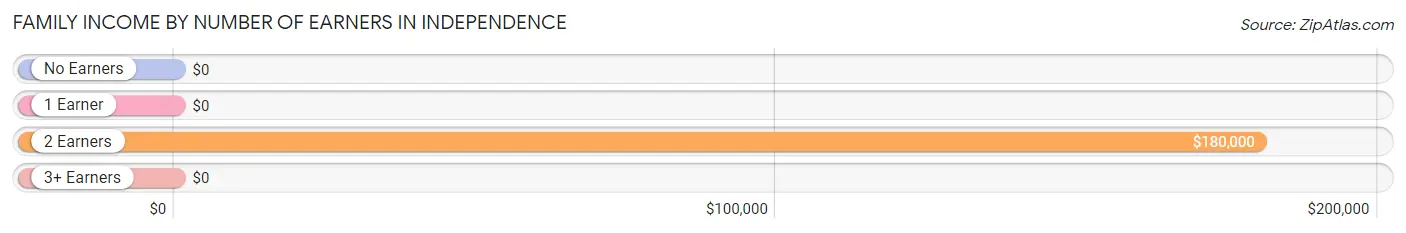
| Number of Earners | # Families | Median Income |
| No Earners | 2 (6.9%) | $0 |
| 1 Earner | 6 (20.7%) | $0 |
| 2 Earners | 20 (69.0%) | $180,000 |
| 3+ Earners | 1 (3.5%) | $0 |
| Total | 29 (100.0%) | $148,750 |
Household Income in Independence
Household Income Brackets in Independence
With 10 households falling in the category, the $100,000 to $149,999 income range is the most frequent in Independence, accounting for 34.5% of all households.
| Income Bracket | # Households | % Households |
| Less than $10,000 | 0 | 0.0% |
| $10,000 to $14,999 | 0 | 0.0% |
| $15,000 to $24,999 | 0 | 0.0% |
| $25,000 to $34,999 | 0 | 0.0% |
| $35,000 to $49,999 | 2 | 6.9% |
| $50,000 to $74,999 | 3 | 10.3% |
| $75,000 to $99,999 | 0 | 0.0% |
| $100,000 to $149,999 | 10 | 34.5% |
| $150,000 to $199,999 | 4 | 13.8% |
| $200,000+ | 10 | 34.5% |
Household Income by Householder Age in Independence
The median household income in Independence is $148,750, with the highest median household income of $233,750 found in the 45 to 64 years age bracket for the primary householder. A total of 8 households (27.6%) fall into this category. Meanwhile, the 15 to 24 years age bracket for the primary householder has the lowest median household income of $0, with 2 households (6.9%) in this group.
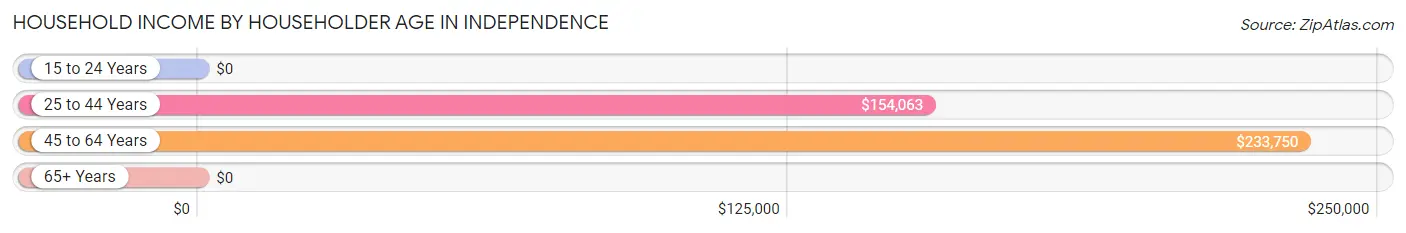
| Income Bracket | # Households | Median Income |
| 15 to 24 Years | 2 (6.9%) | $0 |
| 25 to 44 Years | 11 (37.9%) | $154,063 |
| 45 to 64 Years | 8 (27.6%) | $233,750 |
| 65+ Years | 8 (27.6%) | $0 |
| Total | 29 (100.0%) | $148,750 |
Poverty in Independence
Income Below Poverty by Sex and Age in Independence
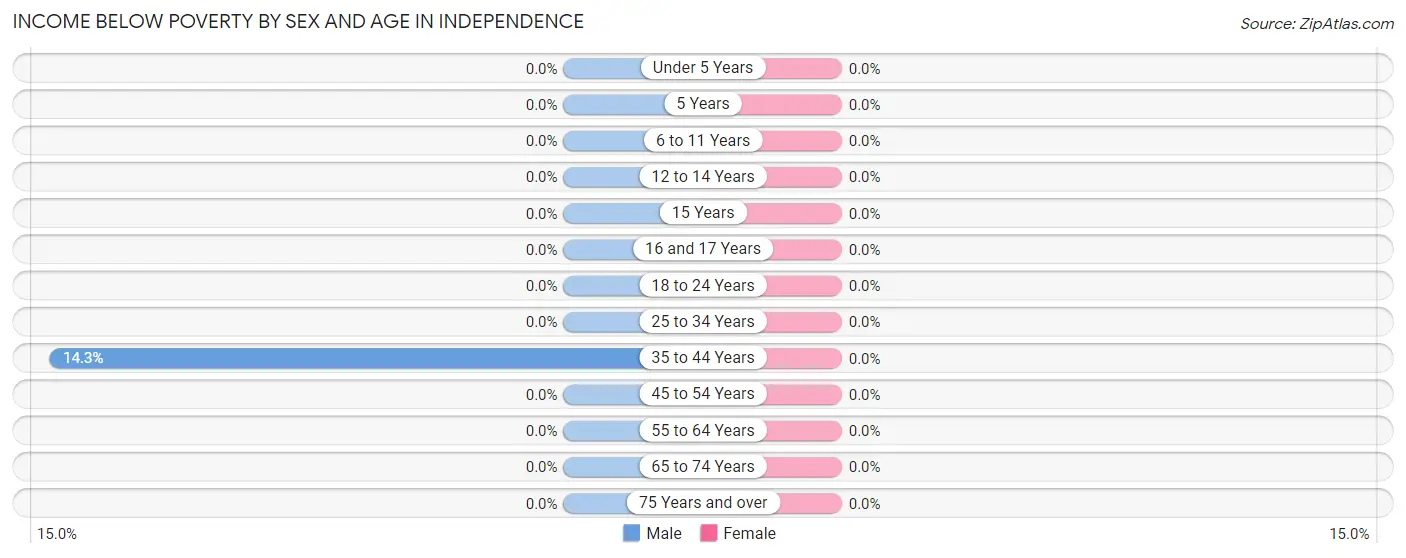
| Age Bracket | Male | Female |
| Under 5 Years | 0 (0.0%) | 0 (0.0%) |
| 5 Years | 0 (0.0%) | 0 (0.0%) |
| 6 to 11 Years | 0 (0.0%) | 0 (0.0%) |
| 12 to 14 Years | 0 (0.0%) | 0 (0.0%) |
| 15 Years | 0 (0.0%) | 0 (0.0%) |
| 16 and 17 Years | 0 (0.0%) | 0 (0.0%) |
| 18 to 24 Years | 0 (0.0%) | 0 (0.0%) |
| 25 to 34 Years | 0 (0.0%) | 0 (0.0%) |
| 35 to 44 Years | 1 (14.3%) | 0 (0.0%) |
| 45 to 54 Years | 0 (0.0%) | 0 (0.0%) |
| 55 to 64 Years | 0 (0.0%) | 0 (0.0%) |
| 65 to 74 Years | 0 (0.0%) | 0 (0.0%) |
| 75 Years and over | 0 (0.0%) | 0 (0.0%) |
| Total | 1 (2.0%) | 0 (0.0%) |
Income Above Poverty by Sex and Age in Independence
According to the poverty statistics in Independence, males aged under 5 years and females aged under 5 years are the age groups that are most secure financially, with 100.0% of males and 100.0% of females in these age groups living above the poverty line.
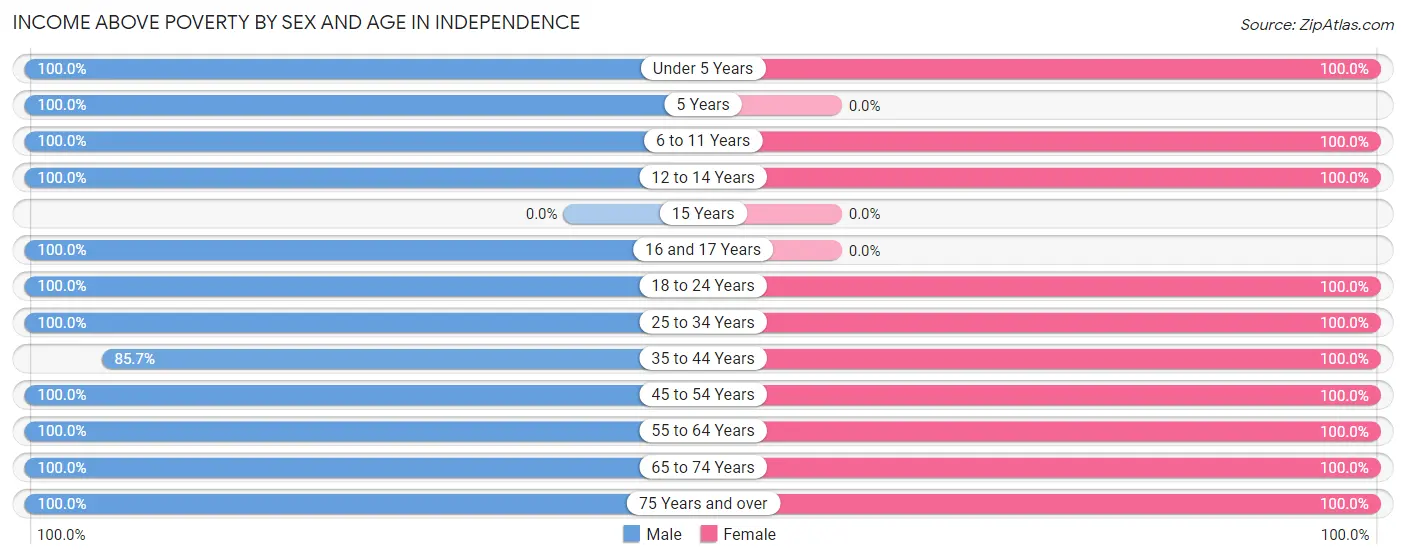
| Age Bracket | Male | Female |
| Under 5 Years | 9 (100.0%) | 10 (100.0%) |
| 5 Years | 3 (100.0%) | 0 (0.0%) |
| 6 to 11 Years | 3 (100.0%) | 6 (100.0%) |
| 12 to 14 Years | 1 (100.0%) | 5 (100.0%) |
| 15 Years | 0 (0.0%) | 0 (0.0%) |
| 16 and 17 Years | 2 (100.0%) | 0 (0.0%) |
| 18 to 24 Years | 2 (100.0%) | 2 (100.0%) |
| 25 to 34 Years | 2 (100.0%) | 3 (100.0%) |
| 35 to 44 Years | 6 (85.7%) | 9 (100.0%) |
| 45 to 54 Years | 7 (100.0%) | 9 (100.0%) |
| 55 to 64 Years | 8 (100.0%) | 2 (100.0%) |
| 65 to 74 Years | 5 (100.0%) | 1 (100.0%) |
| 75 Years and over | 2 (100.0%) | 2 (100.0%) |
| Total | 50 (98.0%) | 49 (100.0%) |
Income Below Poverty Among Married-Couple Families in Independence
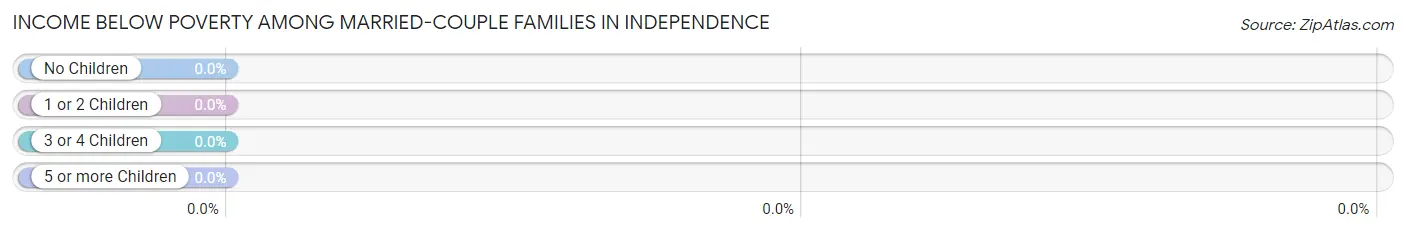
| Children | Above Poverty | Below Poverty |
| No Children | 12 (100.0%) | 0 (0.0%) |
| 1 or 2 Children | 3 (100.0%) | 0 (0.0%) |
| 3 or 4 Children | 0 (0.0%) | 0 (0.0%) |
| 5 or more Children | 8 (100.0%) | 0 (0.0%) |
| Total | 23 (100.0%) | 0 (0.0%) |
Income Below Poverty Among Single-Parent Households in Independence
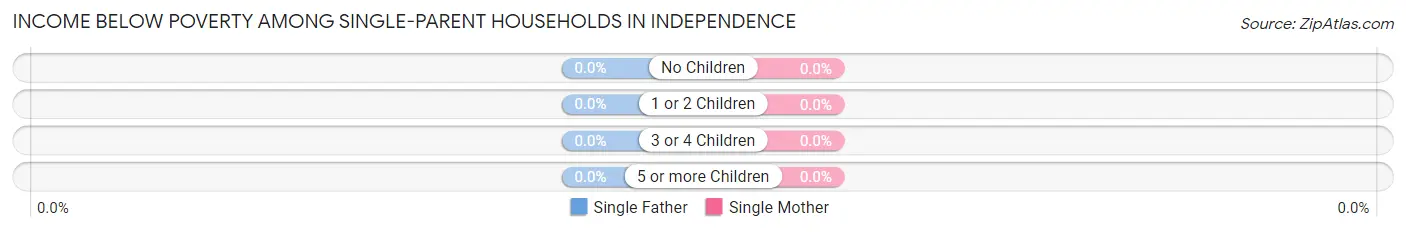
| Children | Single Father | Single Mother |
| No Children | 0 (0.0%) | 0 (0.0%) |
| 1 or 2 Children | 0 (0.0%) | 0 (0.0%) |
| 3 or 4 Children | 0 (0.0%) | 0 (0.0%) |
| 5 or more Children | 0 (0.0%) | 0 (0.0%) |
| Total | 0 (0.0%) | 0 (0.0%) |
Income Below Poverty Among Married-Couple vs Single-Parent Households in Independence
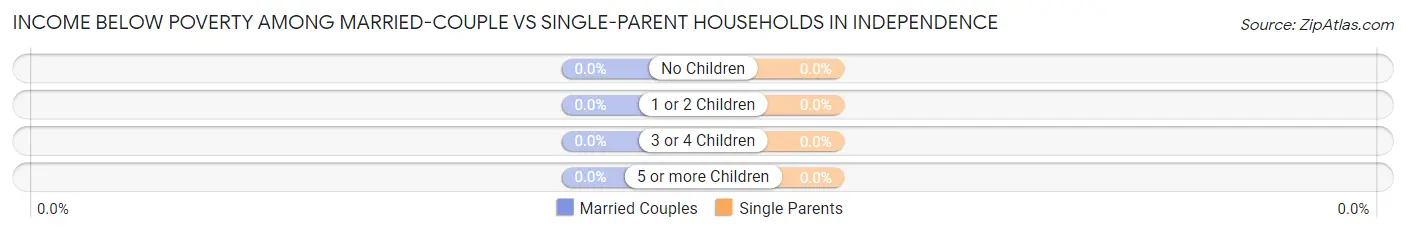
| Children | Married-Couple Families | Single-Parent Households |
| No Children | 0 (0.0%) | 0 (0.0%) |
| 1 or 2 Children | 0 (0.0%) | 0 (0.0%) |
| 3 or 4 Children | 0 (0.0%) | 0 (0.0%) |
| 5 or more Children | 0 (0.0%) | 0 (0.0%) |
| Total | 0 (0.0%) | 0 (0.0%) |
Employment Characteristics in Independence
Employment by Class of Employer in Independence
Among the 48 employed individuals in Independence, private company employees (22 | 45.8%), not-for-profit organizations (9 | 18.8%), and self-employed (not incorporated) (7 | 14.6%) make up the most common classes of employment.
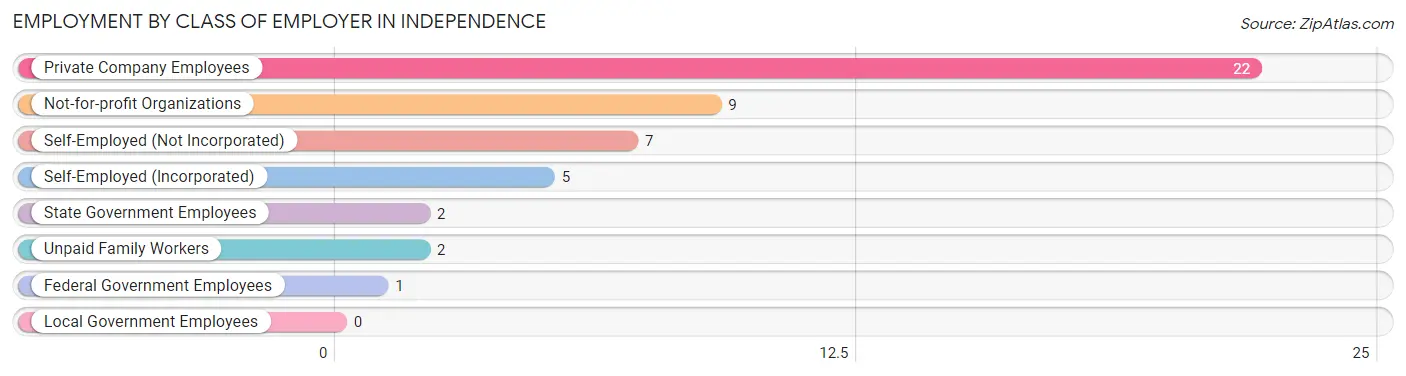
| Employer Class | # Employees | % Employees |
| Private Company Employees | 22 | 45.8% |
| Self-Employed (Incorporated) | 5 | 10.4% |
| Self-Employed (Not Incorporated) | 7 | 14.6% |
| Not-for-profit Organizations | 9 | 18.8% |
| Local Government Employees | 0 | 0.0% |
| State Government Employees | 2 | 4.2% |
| Federal Government Employees | 1 | 2.1% |
| Unpaid Family Workers | 2 | 4.2% |
| Total | 48 | 100.0% |
Employment Status by Age in Independence
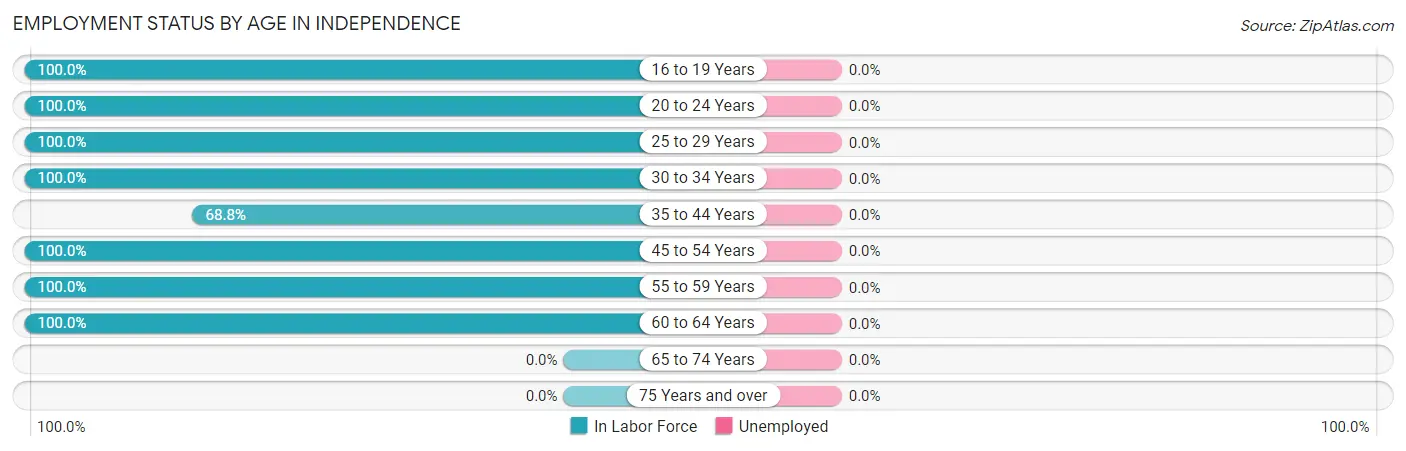
| Age Bracket | In Labor Force | Unemployed |
| 16 to 19 Years | 2 (100.0%) | 0 (0.0%) |
| 20 to 24 Years | 4 (100.0%) | 0 (0.0%) |
| 25 to 29 Years | 1 (100.0%) | 0 (0.0%) |
| 30 to 34 Years | 4 (100.0%) | 0 (0.0%) |
| 35 to 44 Years | 11 (68.8%) | 0 (0.0%) |
| 45 to 54 Years | 16 (100.0%) | 0 (0.0%) |
| 55 to 59 Years | 4 (100.0%) | 0 (0.0%) |
| 60 to 64 Years | 6 (100.0%) | 0 (0.0%) |
| 65 to 74 Years | 0 (0.0%) | 0 (0.0%) |
| 75 Years and over | 0 (0.0%) | 0 (0.0%) |
| Total | 48 (76.2%) | 0 (0.0%) |
Employment Status by Educational Attainment in Independence
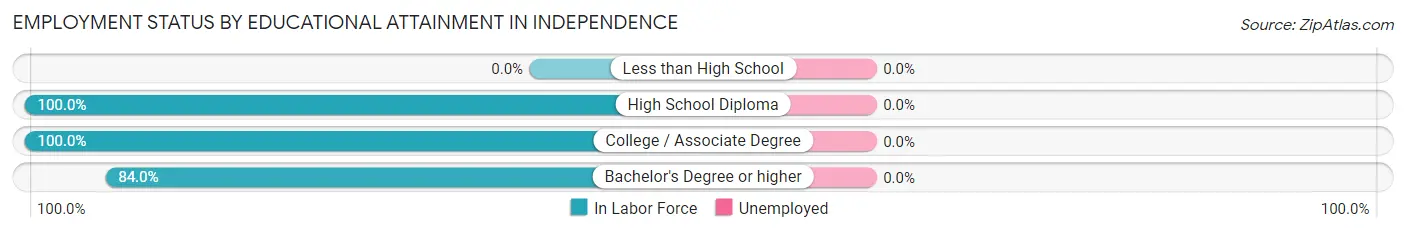
| Educational Attainment | In Labor Force | Unemployed |
| Less than High School | 0 (0.0%) | 0 (0.0%) |
| High School Diploma | 7 (100.0%) | 0 (0.0%) |
| College / Associate Degree | 14 (100.0%) | 0 (0.0%) |
| Bachelor's Degree or higher | 21 (84.0%) | 0 (0.0%) |
| Total | 42 (89.4%) | 0 (0.0%) |
Employment Occupations by Sex in Independence
Management, Business, Science and Arts Occupations
The most common Management, Business, Science and Arts occupations in Independence are Business & Financial (9 | 18.8%), Community & Social Service (8 | 16.7%), Arts, Media & Entertainment (8 | 16.7%), Management (6 | 12.5%), and Health Diagnosing & Treating (2 | 4.2%).
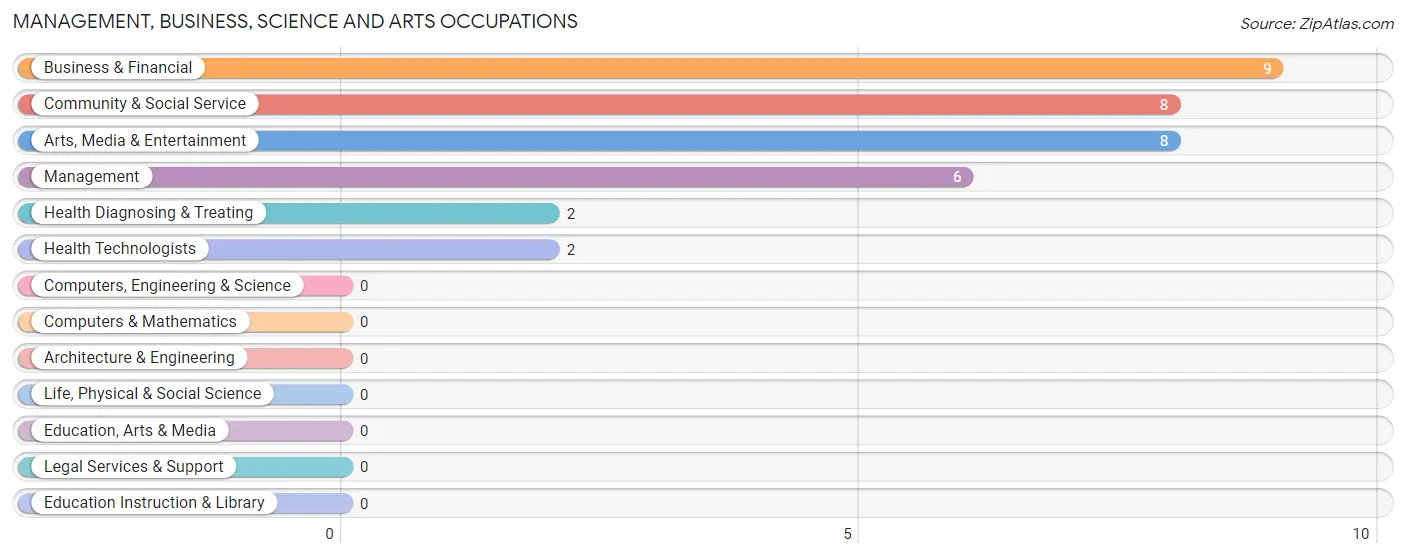
Management, Business, Science and Arts Occupations by Sex
Within the Management, Business, Science and Arts occupations in Independence, the most male-oriented occupations are Community & Social Service (50.0%), Arts, Media & Entertainment (50.0%), and Management (33.3%), while the most female-oriented occupations are Health Diagnosing & Treating (100.0%), Health Technologists (100.0%), and Business & Financial (77.8%).
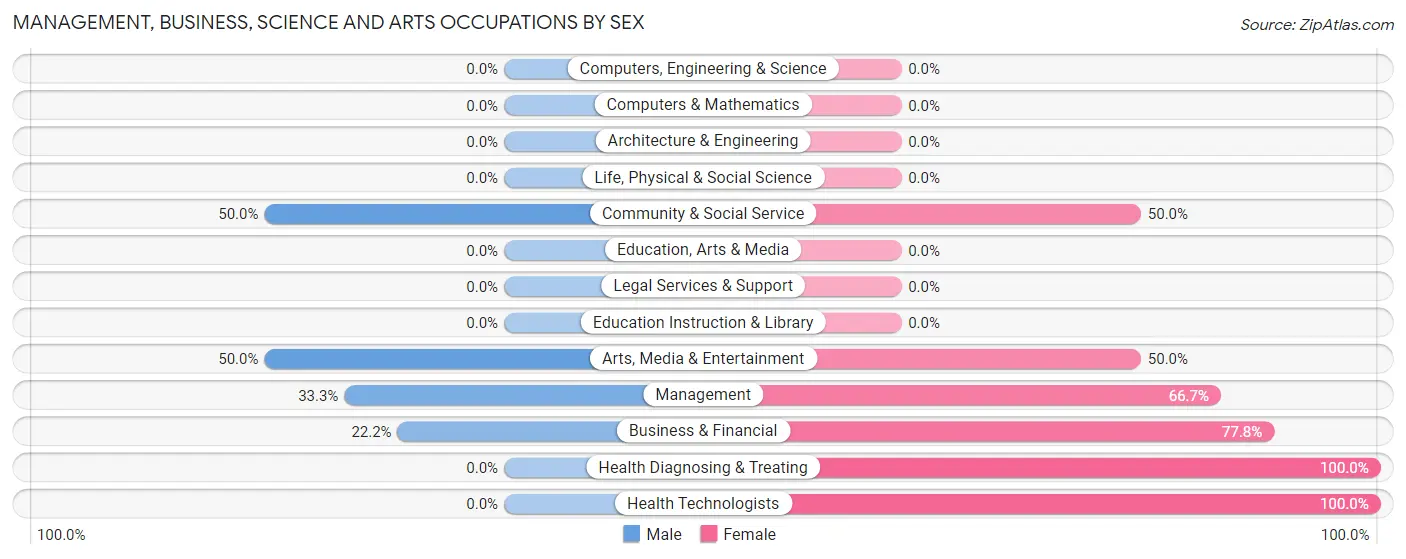
| Occupation | Male | Female |
| Management | 2 (33.3%) | 4 (66.7%) |
| Business & Financial | 2 (22.2%) | 7 (77.8%) |
| Computers, Engineering & Science | 0 (0.0%) | 0 (0.0%) |
| Computers & Mathematics | 0 (0.0%) | 0 (0.0%) |
| Architecture & Engineering | 0 (0.0%) | 0 (0.0%) |
| Life, Physical & Social Science | 0 (0.0%) | 0 (0.0%) |
| Community & Social Service | 4 (50.0%) | 4 (50.0%) |
| Education, Arts & Media | 0 (0.0%) | 0 (0.0%) |
| Legal Services & Support | 0 (0.0%) | 0 (0.0%) |
| Education Instruction & Library | 0 (0.0%) | 0 (0.0%) |
| Arts, Media & Entertainment | 4 (50.0%) | 4 (50.0%) |
| Health Diagnosing & Treating | 0 (0.0%) | 2 (100.0%) |
| Health Technologists | 0 (0.0%) | 2 (100.0%) |
| Total (Category) | 8 (32.0%) | 17 (68.0%) |
| Total (Overall) | 27 (56.2%) | 21 (43.8%) |
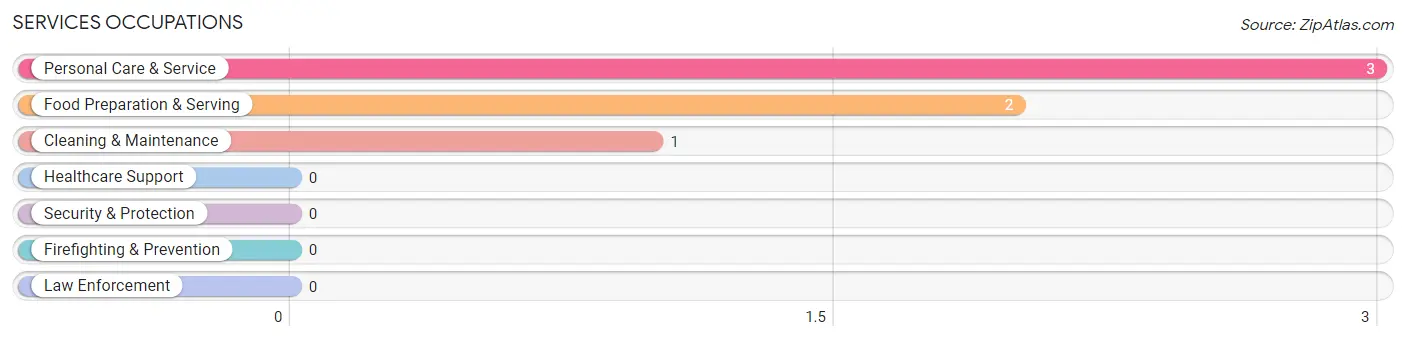
Services Occupations
The most common Services occupations in Independence are Personal Care & Service (3 | 6.2%), Food Preparation & Serving (2 | 4.2%), and Cleaning & Maintenance (1 | 2.1%).
Services Occupations by Sex
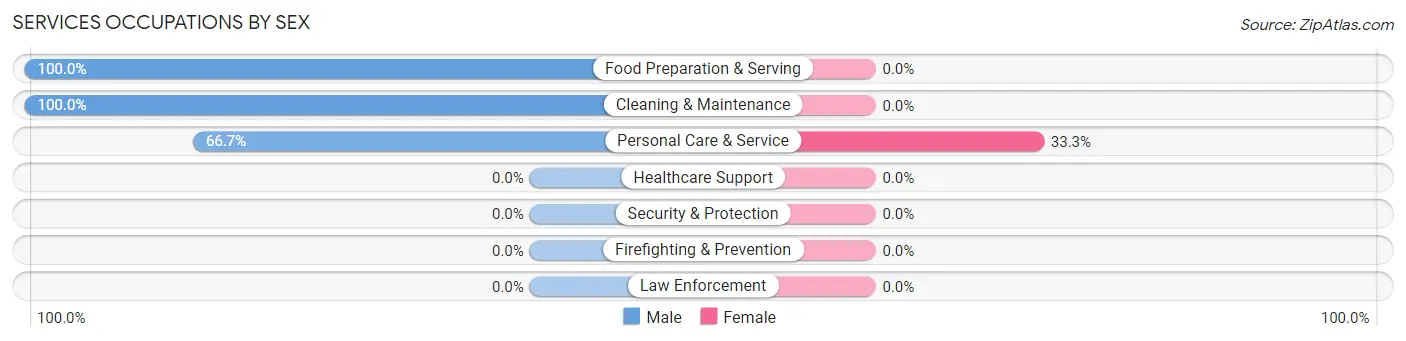
| Occupation | Male | Female |
| Healthcare Support | 0 (0.0%) | 0 (0.0%) |
| Security & Protection | 0 (0.0%) | 0 (0.0%) |
| Firefighting & Prevention | 0 (0.0%) | 0 (0.0%) |
| Law Enforcement | 0 (0.0%) | 0 (0.0%) |
| Food Preparation & Serving | 2 (100.0%) | 0 (0.0%) |
| Cleaning & Maintenance | 1 (100.0%) | 0 (0.0%) |
| Personal Care & Service | 2 (66.7%) | 1 (33.3%) |
| Total (Category) | 5 (83.3%) | 1 (16.7%) |
| Total (Overall) | 27 (56.2%) | 21 (43.8%) |
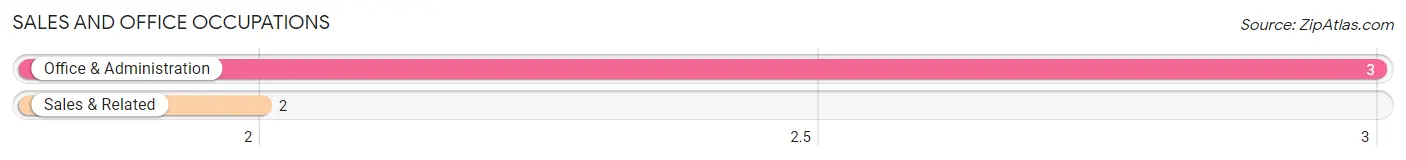
Sales and Office Occupations
The most common Sales and Office occupations in Independence are Office & Administration (3 | 6.2%), and Sales & Related (2 | 4.2%).
Sales and Office Occupations by Sex
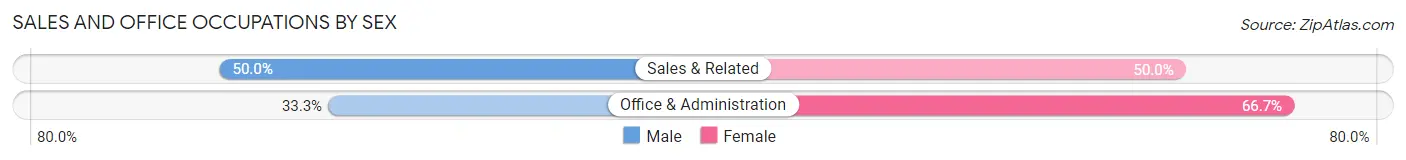
| Occupation | Male | Female |
| Sales & Related | 1 (50.0%) | 1 (50.0%) |
| Office & Administration | 1 (33.3%) | 2 (66.7%) |
| Total (Category) | 2 (40.0%) | 3 (60.0%) |
| Total (Overall) | 27 (56.2%) | 21 (43.8%) |
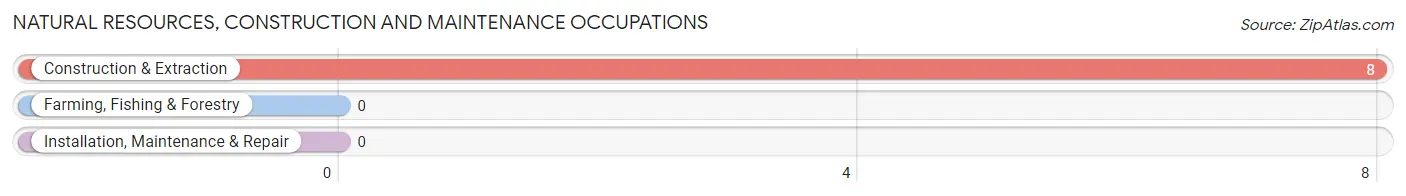
Natural Resources, Construction and Maintenance Occupations
The most common Natural Resources, Construction and Maintenance occupations in Independence are , and Construction & Extraction (8 | 16.7%).
Natural Resources, Construction and Maintenance Occupations by Sex
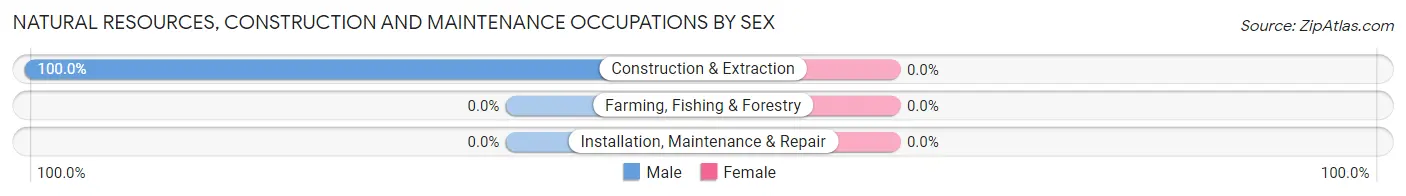
| Occupation | Male | Female |
| Farming, Fishing & Forestry | 0 (0.0%) | 0 (0.0%) |
| Construction & Extraction | 8 (100.0%) | 0 (0.0%) |
| Installation, Maintenance & Repair | 0 (0.0%) | 0 (0.0%) |
| Total (Category) | 8 (100.0%) | 0 (0.0%) |
| Total (Overall) | 27 (56.2%) | 21 (43.8%) |
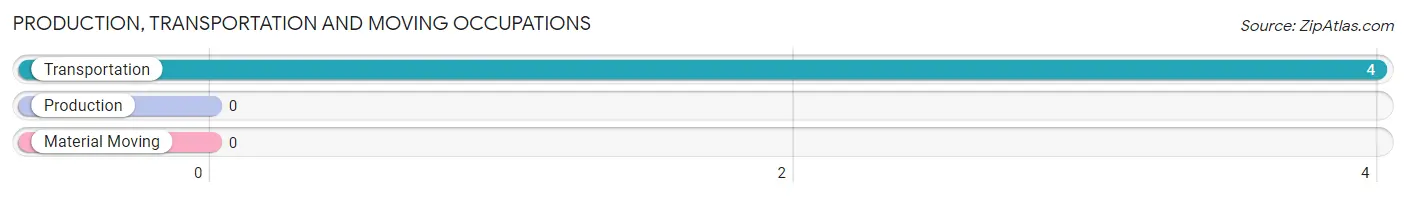
Production, Transportation and Moving Occupations
The most common Production, Transportation and Moving occupations in Independence are , and Transportation (4 | 8.3%).
Production, Transportation and Moving Occupations by Sex
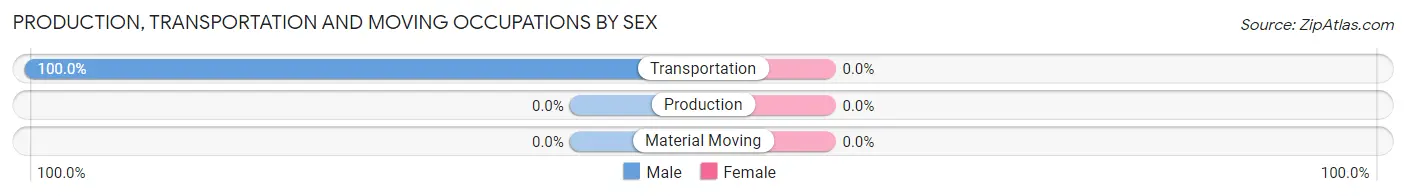
| Occupation | Male | Female |
| Production | 0 (0.0%) | 0 (0.0%) |
| Transportation | 4 (100.0%) | 0 (0.0%) |
| Material Moving | 0 (0.0%) | 0 (0.0%) |
| Total (Category) | 4 (100.0%) | 0 (0.0%) |
| Total (Overall) | 27 (56.2%) | 21 (43.8%) |
Employment Industries by Sex in Independence
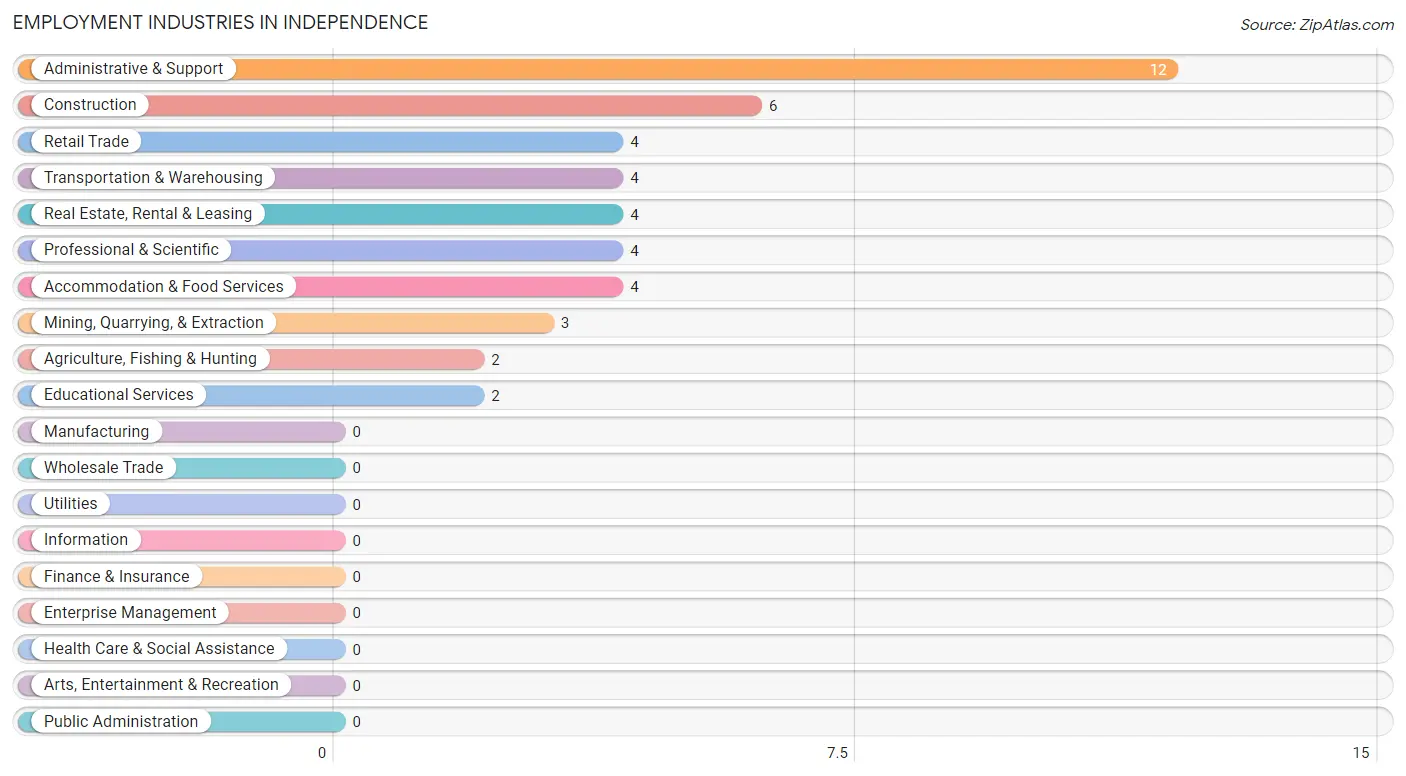
Employment Industries in Independence
The major employment industries in Independence include Administrative & Support (12 | 25.0%), Construction (6 | 12.5%), Retail Trade (4 | 8.3%), Transportation & Warehousing (4 | 8.3%), and Real Estate, Rental & Leasing (4 | 8.3%).
Employment Industries by Sex in Independence
The Independence industries that see more men than women are Agriculture, Fishing & Hunting (100.0%), Mining, Quarrying, & Extraction (100.0%), and Construction (100.0%), whereas the industries that tend to have a higher number of women are Retail Trade (100.0%), Professional & Scientific (100.0%), and Educational Services (100.0%).
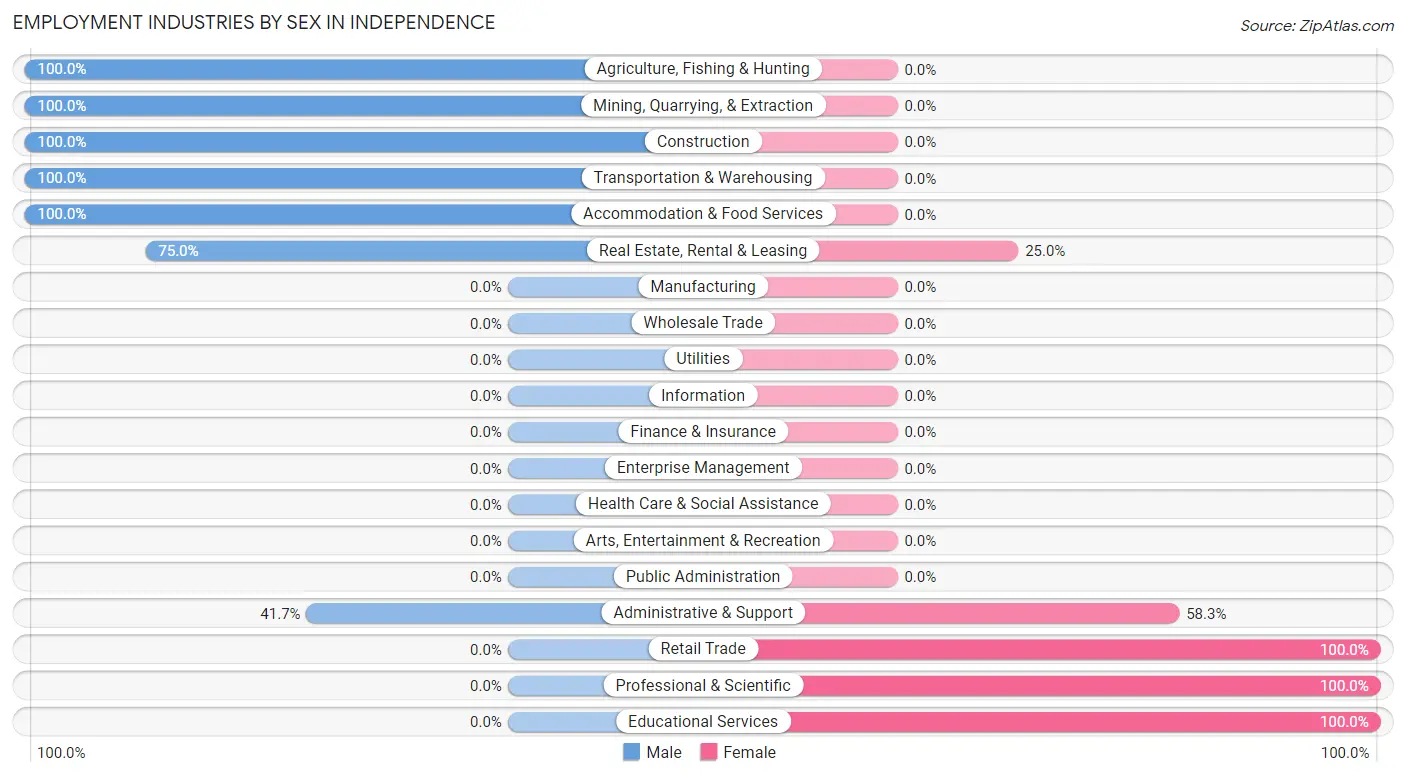
| Industry | Male | Female |
| Agriculture, Fishing & Hunting | 2 (100.0%) | 0 (0.0%) |
| Mining, Quarrying, & Extraction | 3 (100.0%) | 0 (0.0%) |
| Construction | 6 (100.0%) | 0 (0.0%) |
| Manufacturing | 0 (0.0%) | 0 (0.0%) |
| Wholesale Trade | 0 (0.0%) | 0 (0.0%) |
| Retail Trade | 0 (0.0%) | 4 (100.0%) |
| Transportation & Warehousing | 4 (100.0%) | 0 (0.0%) |
| Utilities | 0 (0.0%) | 0 (0.0%) |
| Information | 0 (0.0%) | 0 (0.0%) |
| Finance & Insurance | 0 (0.0%) | 0 (0.0%) |
| Real Estate, Rental & Leasing | 3 (75.0%) | 1 (25.0%) |
| Professional & Scientific | 0 (0.0%) | 4 (100.0%) |
| Enterprise Management | 0 (0.0%) | 0 (0.0%) |
| Administrative & Support | 5 (41.7%) | 7 (58.3%) |
| Educational Services | 0 (0.0%) | 2 (100.0%) |
| Health Care & Social Assistance | 0 (0.0%) | 0 (0.0%) |
| Arts, Entertainment & Recreation | 0 (0.0%) | 0 (0.0%) |
| Accommodation & Food Services | 4 (100.0%) | 0 (0.0%) |
| Public Administration | 0 (0.0%) | 0 (0.0%) |
| Total | 27 (56.2%) | 21 (43.8%) |
Education in Independence
School Enrollment in Independence
The most common levels of schooling among the 19 students in Independence are elementary school (7 | 36.8%), middle school (7 | 36.8%), and nursery / preschool (2 | 10.5%).
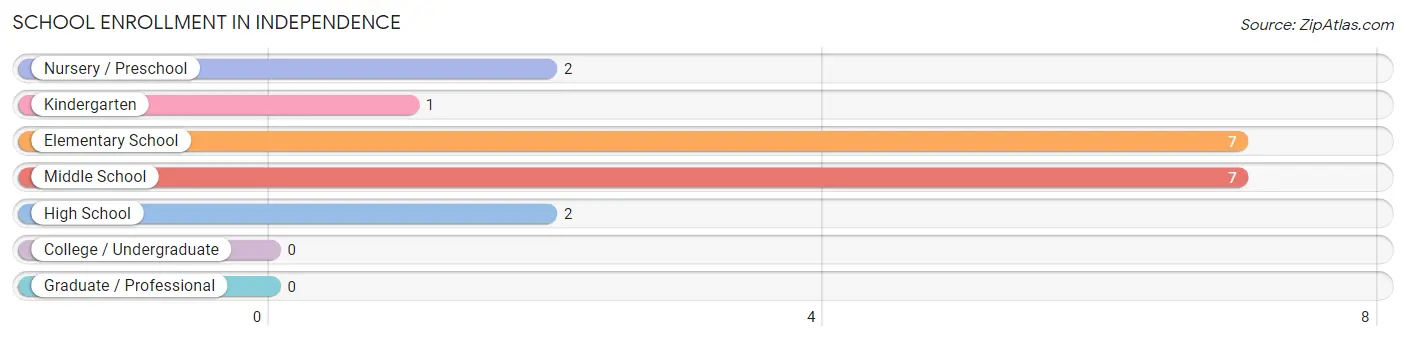
| School Level | # Students | % Students |
| Nursery / Preschool | 2 | 10.5% |
| Kindergarten | 1 | 5.3% |
| Elementary School | 7 | 36.8% |
| Middle School | 7 | 36.8% |
| High School | 2 | 10.5% |
| College / Undergraduate | 0 | 0.0% |
| Graduate / Professional | 0 | 0.0% |
| Total | 19 | 100.0% |
School Enrollment by Age by Funding Source in Independence
Out of a total of 19 students who are enrolled in schools in Independence, 1 (5.3%) attend a private institution, while the remaining 18 (94.7%) are enrolled in public schools. The age group of 10 to 14 year olds has the highest likelihood of being enrolled in private schools, with 1 (14.3% in the age bracket) enrolled. Conversely, the age group of 5 to 9 year old has the lowest likelihood of being enrolled in a private school, with 10 (100.0% in the age bracket) attending a public institution.
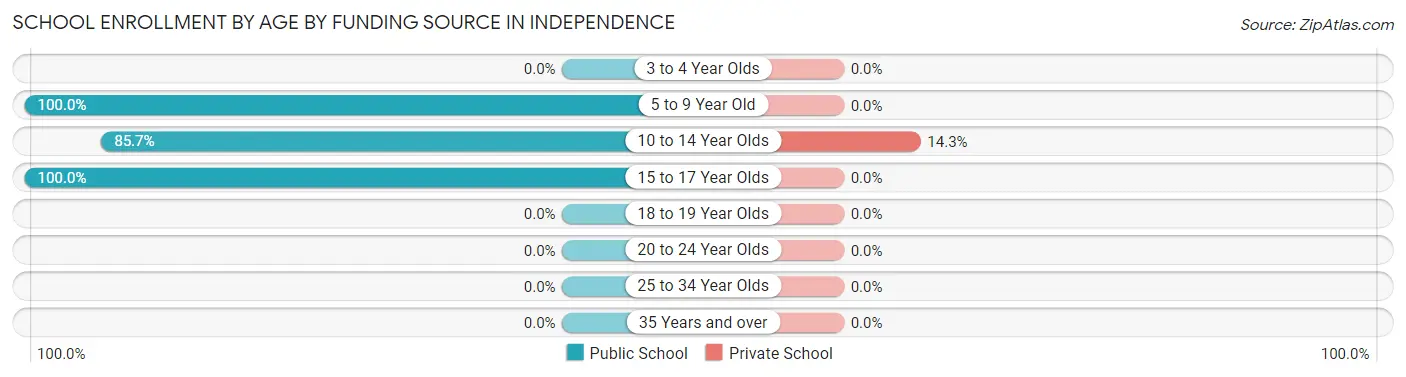
| Age Bracket | Public School | Private School |
| 3 to 4 Year Olds | 0 (0.0%) | 0 (0.0%) |
| 5 to 9 Year Old | 10 (100.0%) | 0 (0.0%) |
| 10 to 14 Year Olds | 6 (85.7%) | 1 (14.3%) |
| 15 to 17 Year Olds | 2 (100.0%) | 0 (0.0%) |
| 18 to 19 Year Olds | 0 (0.0%) | 0 (0.0%) |
| 20 to 24 Year Olds | 0 (0.0%) | 0 (0.0%) |
| 25 to 34 Year Olds | 0 (0.0%) | 0 (0.0%) |
| 35 Years and over | 0 (0.0%) | 0 (0.0%) |
| Total | 18 (94.7%) | 1 (5.3%) |
Educational Attainment by Field of Study in Independence
Social sciences (7 | 22.6%), business (6 | 19.4%), visual & performing arts (6 | 19.4%), arts & humanities (6 | 19.4%), and physical & health sciences (4 | 12.9%) are the most common fields of study among 31 individuals in Independence who have obtained a bachelor's degree or higher.
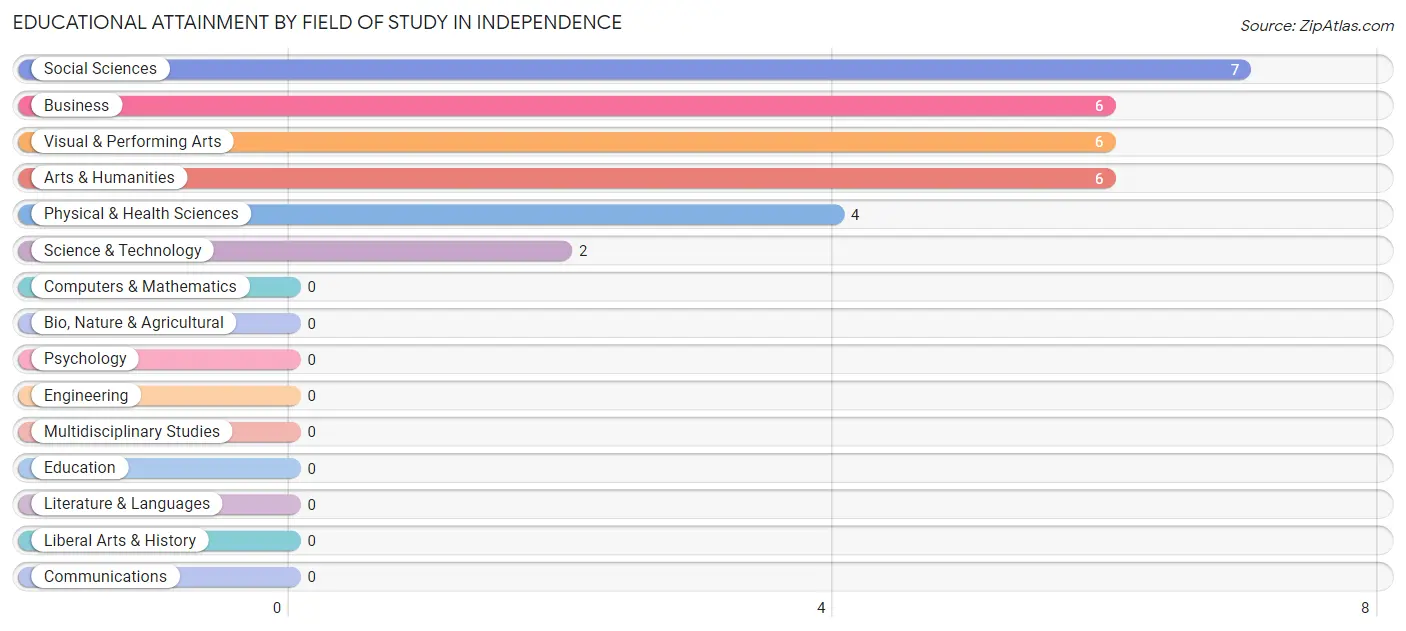
| Field of Study | # Graduates | % Graduates |
| Computers & Mathematics | 0 | 0.0% |
| Bio, Nature & Agricultural | 0 | 0.0% |
| Physical & Health Sciences | 4 | 12.9% |
| Psychology | 0 | 0.0% |
| Social Sciences | 7 | 22.6% |
| Engineering | 0 | 0.0% |
| Multidisciplinary Studies | 0 | 0.0% |
| Science & Technology | 2 | 6.5% |
| Business | 6 | 19.4% |
| Education | 0 | 0.0% |
| Literature & Languages | 0 | 0.0% |
| Liberal Arts & History | 0 | 0.0% |
| Visual & Performing Arts | 6 | 19.4% |
| Communications | 0 | 0.0% |
| Arts & Humanities | 6 | 19.4% |
| Total | 31 | 100.0% |
Transportation & Commute in Independence
Vehicle Availability by Sex in Independence
The most prevalent vehicle ownership categories in Independence are males with 2 vehicles (10, accounting for 37.0%) and females with 2 vehicles (11, making up 47.6%).
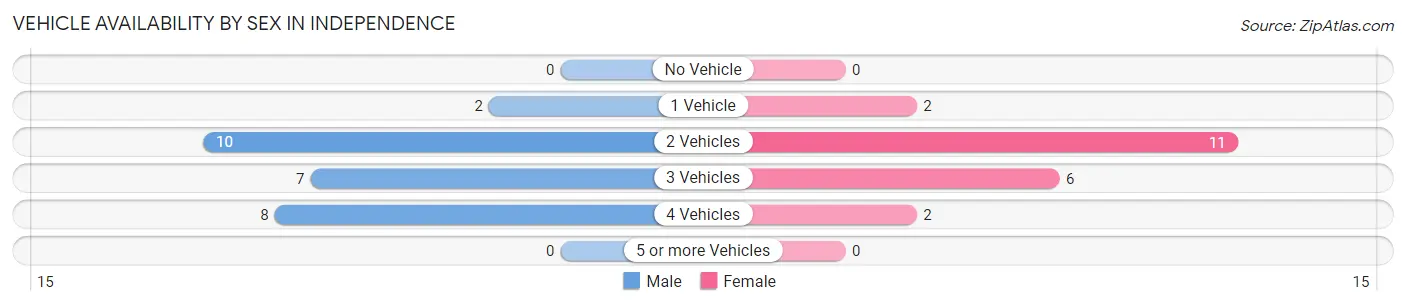
| Vehicles Available | Male | Female |
| No Vehicle | 0 (0.0%) | 0 (0.0%) |
| 1 Vehicle | 2 (7.4%) | 2 (9.5%) |
| 2 Vehicles | 10 (37.0%) | 11 (52.4%) |
| 3 Vehicles | 7 (25.9%) | 6 (28.6%) |
| 4 Vehicles | 8 (29.6%) | 2 (9.5%) |
| 5 or more Vehicles | 0 (0.0%) | 0 (0.0%) |
| Total | 27 (100.0%) | 21 (100.0%) |
Commute Time in Independence
The most frequently occuring commute durations in Independence are 45 to 59 minutes (10 commuters, 24.4%), 20 to 24 minutes (8 commuters, 19.5%), and 5 to 9 minutes (6 commuters, 14.6%).
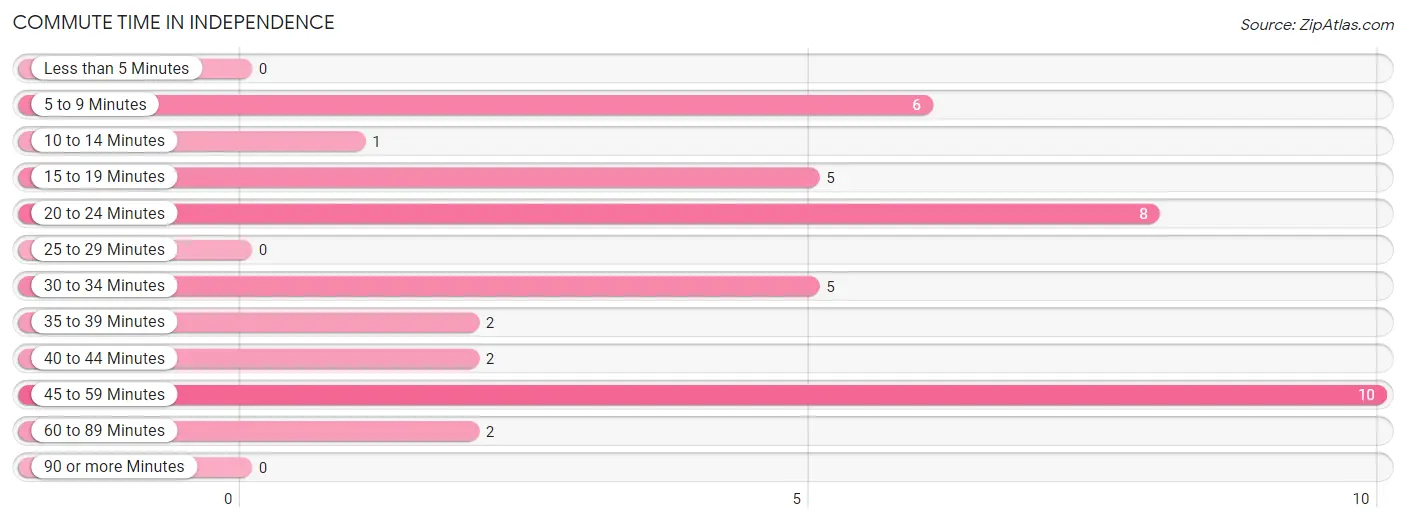
| Commute Time | # Commuters | % Commuters |
| Less than 5 Minutes | 0 | 0.0% |
| 5 to 9 Minutes | 6 | 14.6% |
| 10 to 14 Minutes | 1 | 2.4% |
| 15 to 19 Minutes | 5 | 12.2% |
| 20 to 24 Minutes | 8 | 19.5% |
| 25 to 29 Minutes | 0 | 0.0% |
| 30 to 34 Minutes | 5 | 12.2% |
| 35 to 39 Minutes | 2 | 4.9% |
| 40 to 44 Minutes | 2 | 4.9% |
| 45 to 59 Minutes | 10 | 24.4% |
| 60 to 89 Minutes | 2 | 4.9% |
| 90 or more Minutes | 0 | 0.0% |
Commute Time by Sex in Independence
The most common commute times in Independence are 45 to 59 minutes (10 commuters, 41.7%) for males and 20 to 24 minutes (7 commuters, 41.2%) for females.
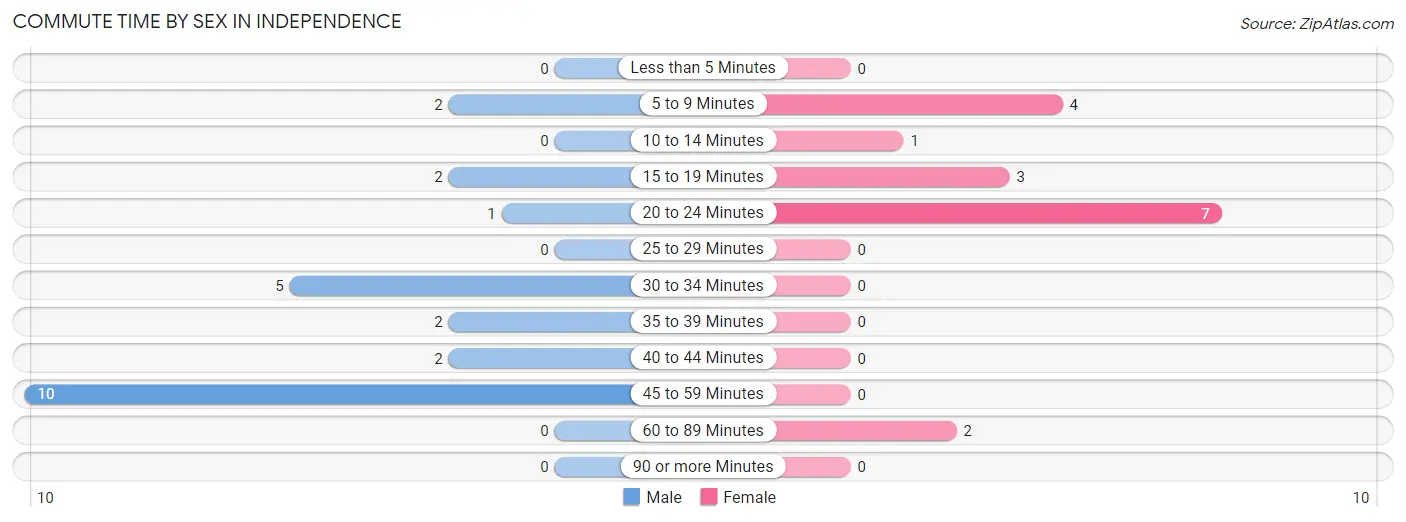
| Commute Time | Male | Female |
| Less than 5 Minutes | 0 (0.0%) | 0 (0.0%) |
| 5 to 9 Minutes | 2 (8.3%) | 4 (23.5%) |
| 10 to 14 Minutes | 0 (0.0%) | 1 (5.9%) |
| 15 to 19 Minutes | 2 (8.3%) | 3 (17.6%) |
| 20 to 24 Minutes | 1 (4.2%) | 7 (41.2%) |
| 25 to 29 Minutes | 0 (0.0%) | 0 (0.0%) |
| 30 to 34 Minutes | 5 (20.8%) | 0 (0.0%) |
| 35 to 39 Minutes | 2 (8.3%) | 0 (0.0%) |
| 40 to 44 Minutes | 2 (8.3%) | 0 (0.0%) |
| 45 to 59 Minutes | 10 (41.7%) | 0 (0.0%) |
| 60 to 89 Minutes | 0 (0.0%) | 2 (11.8%) |
| 90 or more Minutes | 0 (0.0%) | 0 (0.0%) |
Time of Departure to Work by Sex in Independence
The most frequent times of departure to work in Independence are 7:00 AM to 7:29 AM (7, 29.2%) for males and 12:00 AM to 4:59 AM (7, 41.2%) for females.
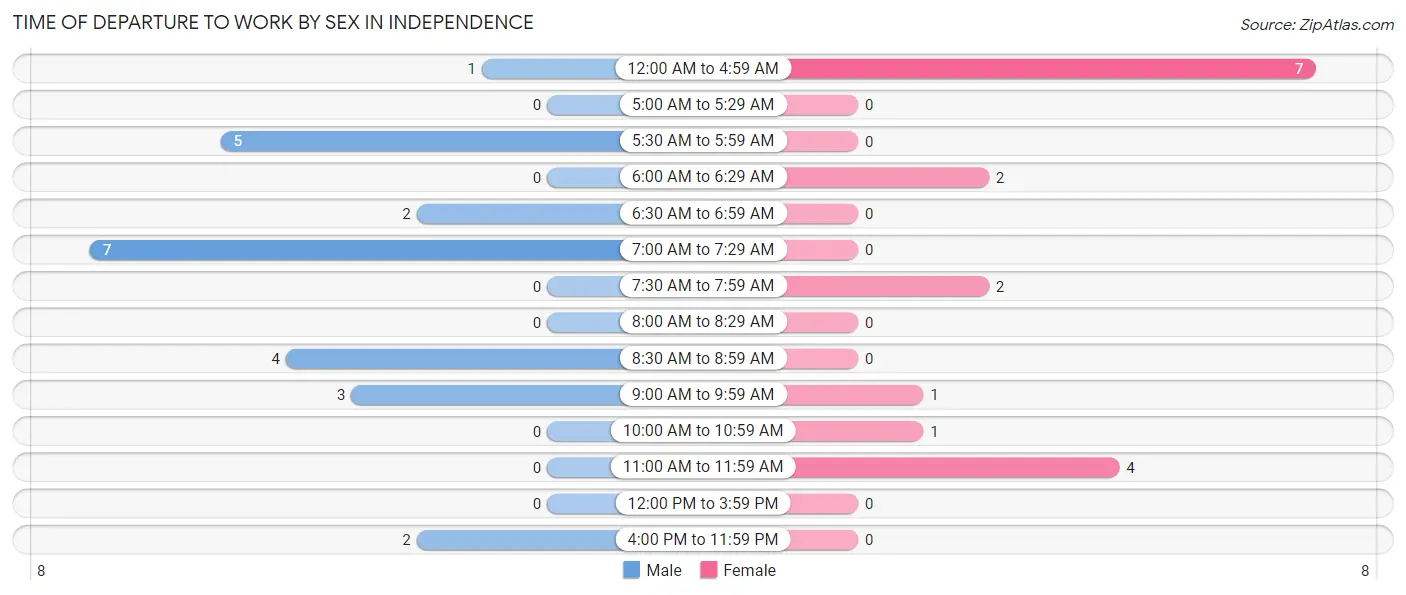
| Time of Departure | Male | Female |
| 12:00 AM to 4:59 AM | 1 (4.2%) | 7 (41.2%) |
| 5:00 AM to 5:29 AM | 0 (0.0%) | 0 (0.0%) |
| 5:30 AM to 5:59 AM | 5 (20.8%) | 0 (0.0%) |
| 6:00 AM to 6:29 AM | 0 (0.0%) | 2 (11.8%) |
| 6:30 AM to 6:59 AM | 2 (8.3%) | 0 (0.0%) |
| 7:00 AM to 7:29 AM | 7 (29.2%) | 0 (0.0%) |
| 7:30 AM to 7:59 AM | 0 (0.0%) | 2 (11.8%) |
| 8:00 AM to 8:29 AM | 0 (0.0%) | 0 (0.0%) |
| 8:30 AM to 8:59 AM | 4 (16.7%) | 0 (0.0%) |
| 9:00 AM to 9:59 AM | 3 (12.5%) | 1 (5.9%) |
| 10:00 AM to 10:59 AM | 0 (0.0%) | 1 (5.9%) |
| 11:00 AM to 11:59 AM | 0 (0.0%) | 4 (23.5%) |
| 12:00 PM to 3:59 PM | 0 (0.0%) | 0 (0.0%) |
| 4:00 PM to 11:59 PM | 2 (8.3%) | 0 (0.0%) |
| Total | 24 (100.0%) | 17 (100.0%) |
Housing Occupancy in Independence
Occupancy by Ownership in Independence
Of the total 29 dwellings in Independence, owner-occupied units account for 25 (86.2%), while renter-occupied units make up 4 (13.8%).
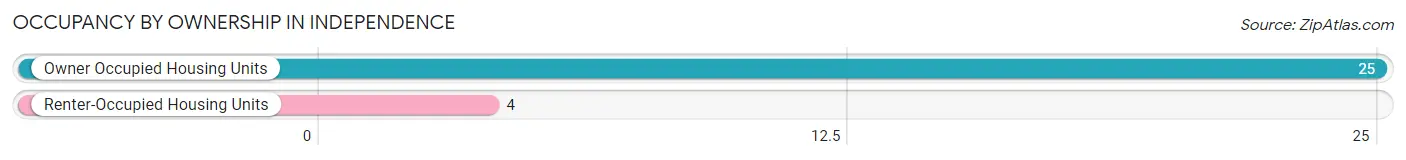
| Occupancy | # Housing Units | % Housing Units |
| Owner Occupied Housing Units | 25 | 86.2% |
| Renter-Occupied Housing Units | 4 | 13.8% |
| Total Occupied Housing Units | 29 | 100.0% |
Occupancy by Household Size in Independence
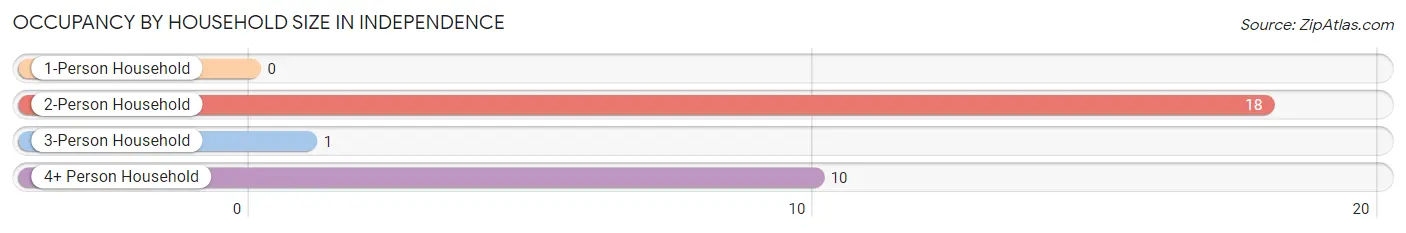
| Household Size | # Housing Units | % Housing Units |
| 1-Person Household | 0 | 0.0% |
| 2-Person Household | 18 | 62.1% |
| 3-Person Household | 1 | 3.5% |
| 4+ Person Household | 10 | 34.5% |
| Total Housing Units | 29 | 100.0% |
Occupancy by Ownership by Household Size in Independence
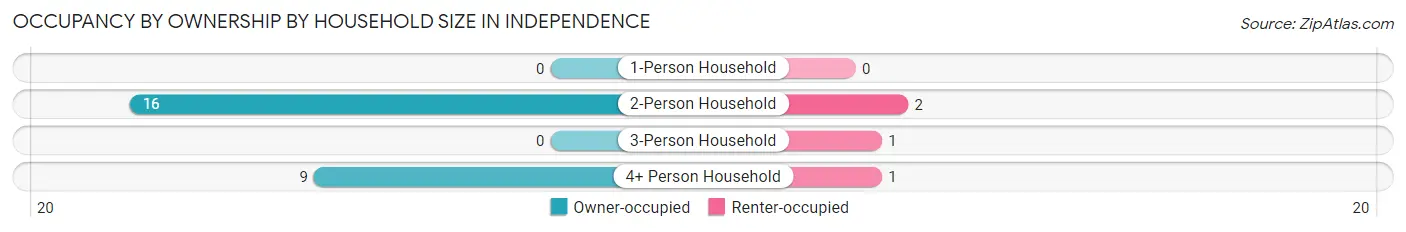
| Household Size | Owner-occupied | Renter-occupied |
| 1-Person Household | 0 (0.0%) | 0 (0.0%) |
| 2-Person Household | 16 (88.9%) | 2 (11.1%) |
| 3-Person Household | 0 (0.0%) | 1 (100.0%) |
| 4+ Person Household | 9 (90.0%) | 1 (10.0%) |
| Total Housing Units | 25 (86.2%) | 4 (13.8%) |
Occupancy by Educational Attainment in Independence
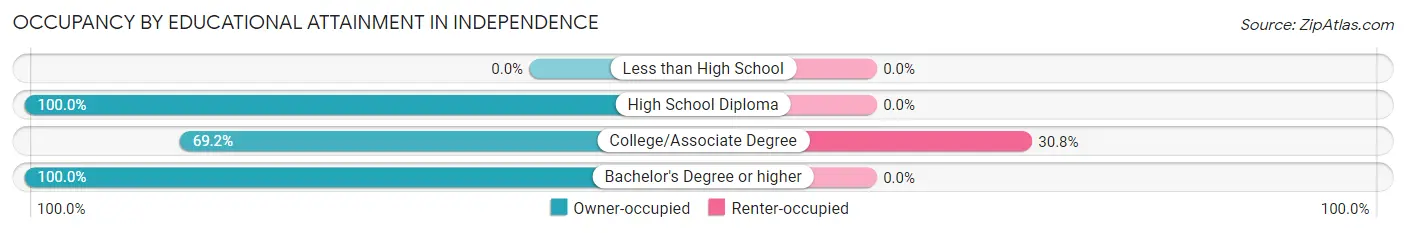
| Household Size | Owner-occupied | Renter-occupied |
| Less than High School | 0 (0.0%) | 0 (0.0%) |
| High School Diploma | 2 (100.0%) | 0 (0.0%) |
| College/Associate Degree | 9 (69.2%) | 4 (30.8%) |
| Bachelor's Degree or higher | 14 (100.0%) | 0 (0.0%) |
Occupancy by Age of Householder in Independence
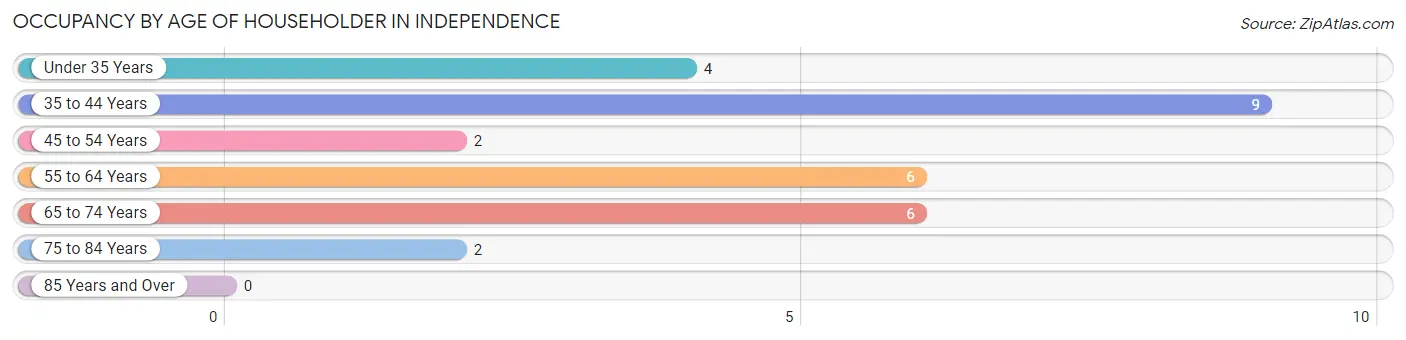
| Age Bracket | # Households | % Households |
| Under 35 Years | 4 | 13.8% |
| 35 to 44 Years | 9 | 31.0% |
| 45 to 54 Years | 2 | 6.9% |
| 55 to 64 Years | 6 | 20.7% |
| 65 to 74 Years | 6 | 20.7% |
| 75 to 84 Years | 2 | 6.9% |
| 85 Years and Over | 0 | 0.0% |
| Total | 29 | 100.0% |
Housing Finances in Independence
Median Income by Occupancy in Independence
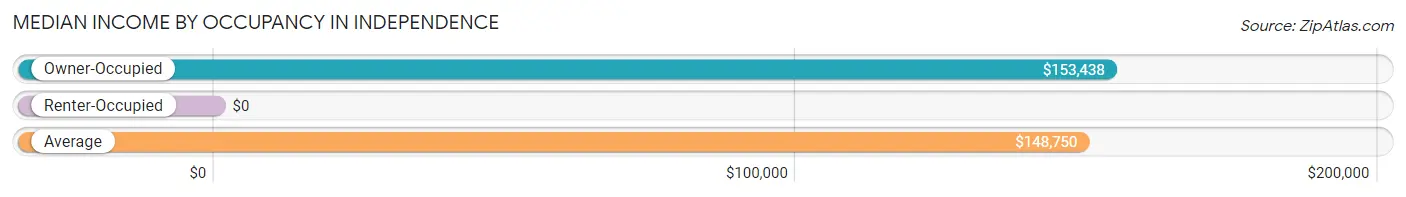
| Occupancy Type | # Households | Median Income |
| Owner-Occupied | 25 (86.2%) | $153,438 |
| Renter-Occupied | 4 (13.8%) | $0 |
| Average | 29 (100.0%) | $148,750 |
Occupancy by Householder Income Bracket in Independence
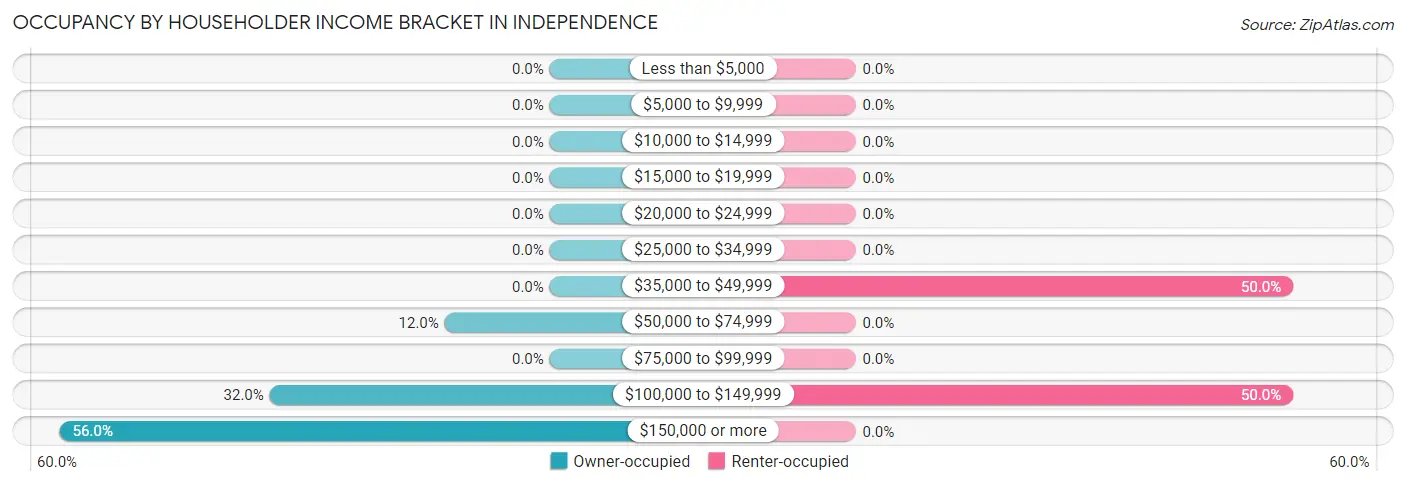
| Income Bracket | Owner-occupied | Renter-occupied |
| Less than $5,000 | 0 (0.0%) | 0 (0.0%) |
| $5,000 to $9,999 | 0 (0.0%) | 0 (0.0%) |
| $10,000 to $14,999 | 0 (0.0%) | 0 (0.0%) |
| $15,000 to $19,999 | 0 (0.0%) | 0 (0.0%) |
| $20,000 to $24,999 | 0 (0.0%) | 0 (0.0%) |
| $25,000 to $34,999 | 0 (0.0%) | 0 (0.0%) |
| $35,000 to $49,999 | 0 (0.0%) | 2 (50.0%) |
| $50,000 to $74,999 | 3 (12.0%) | 0 (0.0%) |
| $75,000 to $99,999 | 0 (0.0%) | 0 (0.0%) |
| $100,000 to $149,999 | 8 (32.0%) | 2 (50.0%) |
| $150,000 or more | 14 (56.0%) | 0 (0.0%) |
| Total | 25 (100.0%) | 4 (100.0%) |
Monthly Housing Cost Tiers in Independence
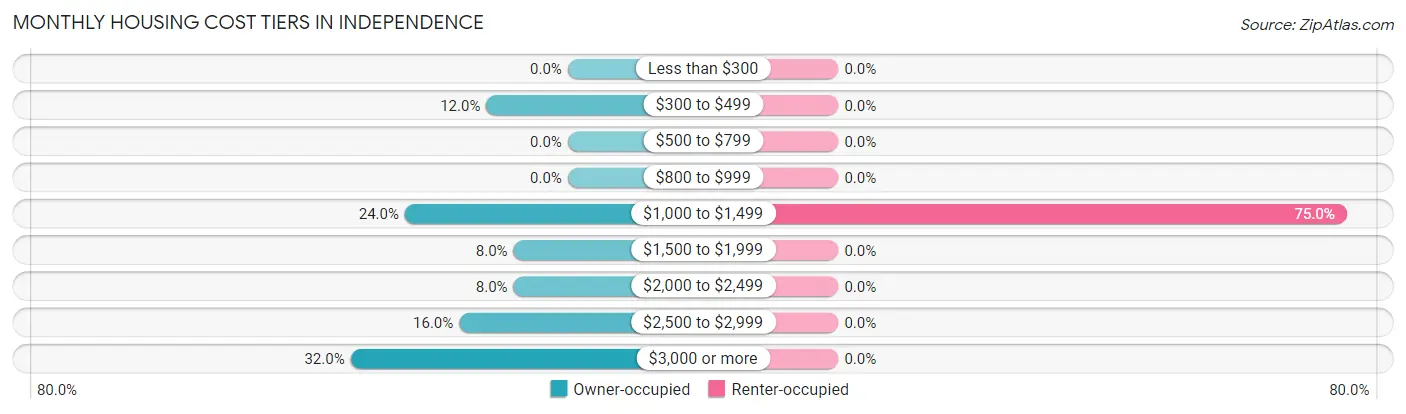
| Monthly Cost | Owner-occupied | Renter-occupied |
| Less than $300 | 0 (0.0%) | 0 (0.0%) |
| $300 to $499 | 3 (12.0%) | 0 (0.0%) |
| $500 to $799 | 0 (0.0%) | 0 (0.0%) |
| $800 to $999 | 0 (0.0%) | 0 (0.0%) |
| $1,000 to $1,499 | 6 (24.0%) | 3 (75.0%) |
| $1,500 to $1,999 | 2 (8.0%) | 0 (0.0%) |
| $2,000 to $2,499 | 2 (8.0%) | 0 (0.0%) |
| $2,500 to $2,999 | 4 (16.0%) | 0 (0.0%) |
| $3,000 or more | 8 (32.0%) | 0 (0.0%) |
| Total | 25 (100.0%) | 4 (100.0%) |
Physical Housing Characteristics in Independence
Housing Structures in Independence
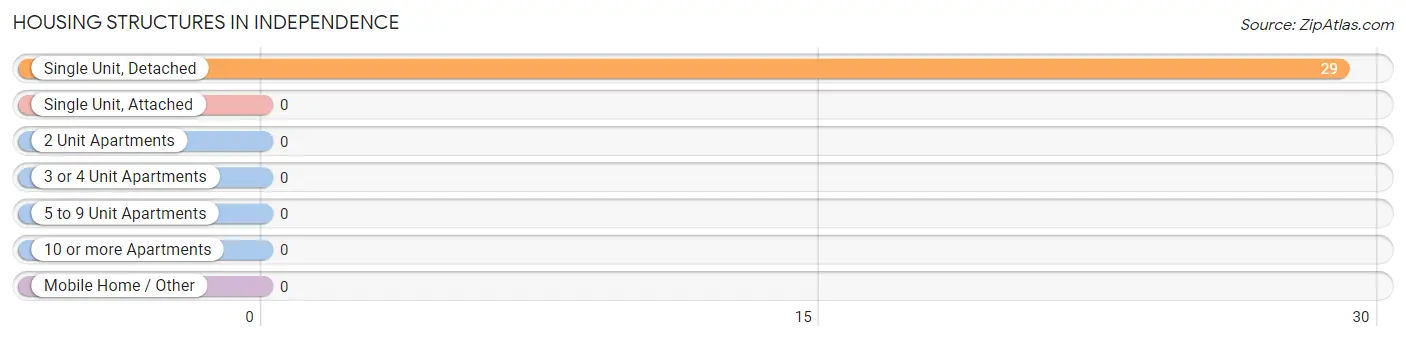
| Structure Type | # Housing Units | % Housing Units |
| Single Unit, Detached | 29 | 100.0% |
| Single Unit, Attached | 0 | 0.0% |
| 2 Unit Apartments | 0 | 0.0% |
| 3 or 4 Unit Apartments | 0 | 0.0% |
| 5 to 9 Unit Apartments | 0 | 0.0% |
| 10 or more Apartments | 0 | 0.0% |
| Mobile Home / Other | 0 | 0.0% |
| Total | 29 | 100.0% |
Housing Structures by Occupancy in Independence
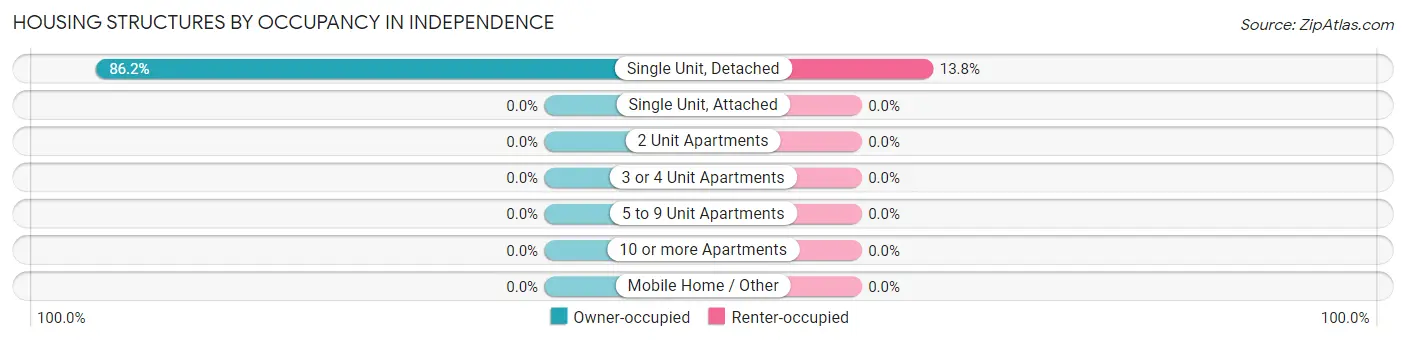
| Structure Type | Owner-occupied | Renter-occupied |
| Single Unit, Detached | 25 (86.2%) | 4 (13.8%) |
| Single Unit, Attached | 0 (0.0%) | 0 (0.0%) |
| 2 Unit Apartments | 0 (0.0%) | 0 (0.0%) |
| 3 or 4 Unit Apartments | 0 (0.0%) | 0 (0.0%) |
| 5 to 9 Unit Apartments | 0 (0.0%) | 0 (0.0%) |
| 10 or more Apartments | 0 (0.0%) | 0 (0.0%) |
| Mobile Home / Other | 0 (0.0%) | 0 (0.0%) |
| Total | 25 (86.2%) | 4 (13.8%) |
Housing Structures by Number of Rooms in Independence
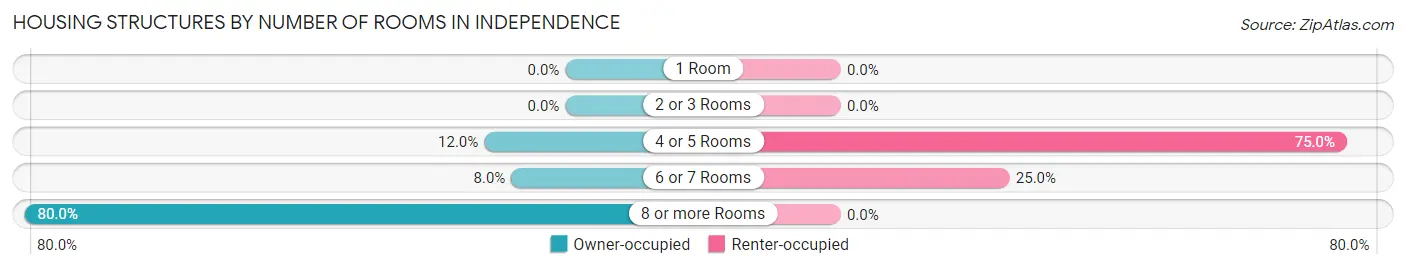
| Number of Rooms | Owner-occupied | Renter-occupied |
| 1 Room | 0 (0.0%) | 0 (0.0%) |
| 2 or 3 Rooms | 0 (0.0%) | 0 (0.0%) |
| 4 or 5 Rooms | 3 (12.0%) | 3 (75.0%) |
| 6 or 7 Rooms | 2 (8.0%) | 1 (25.0%) |
| 8 or more Rooms | 20 (80.0%) | 0 (0.0%) |
| Total | 25 (100.0%) | 4 (100.0%) |
Housing Structure by Heating Type in Independence
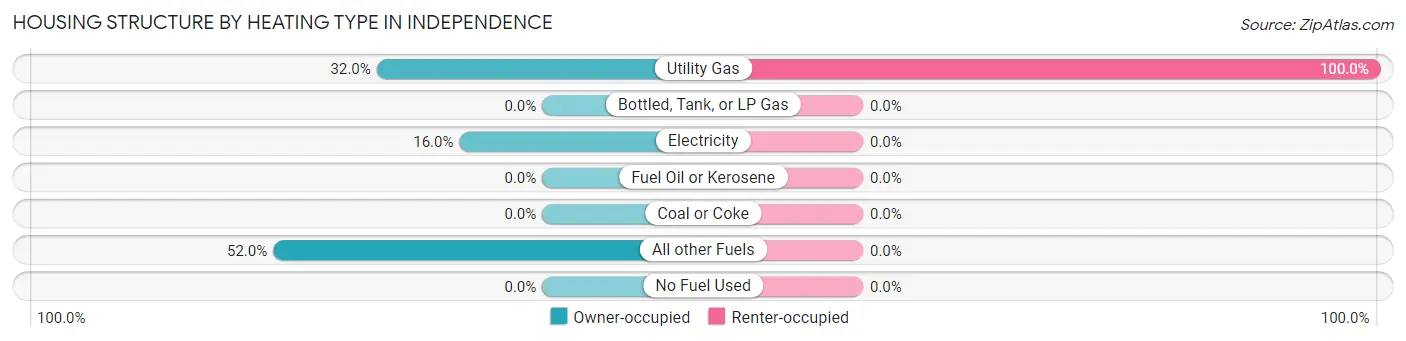
| Heating Type | Owner-occupied | Renter-occupied |
| Utility Gas | 8 (32.0%) | 4 (100.0%) |
| Bottled, Tank, or LP Gas | 0 (0.0%) | 0 (0.0%) |
| Electricity | 4 (16.0%) | 0 (0.0%) |
| Fuel Oil or Kerosene | 0 (0.0%) | 0 (0.0%) |
| Coal or Coke | 0 (0.0%) | 0 (0.0%) |
| All other Fuels | 13 (52.0%) | 0 (0.0%) |
| No Fuel Used | 0 (0.0%) | 0 (0.0%) |
| Total | 25 (100.0%) | 4 (100.0%) |
Household Vehicle Usage in Independence
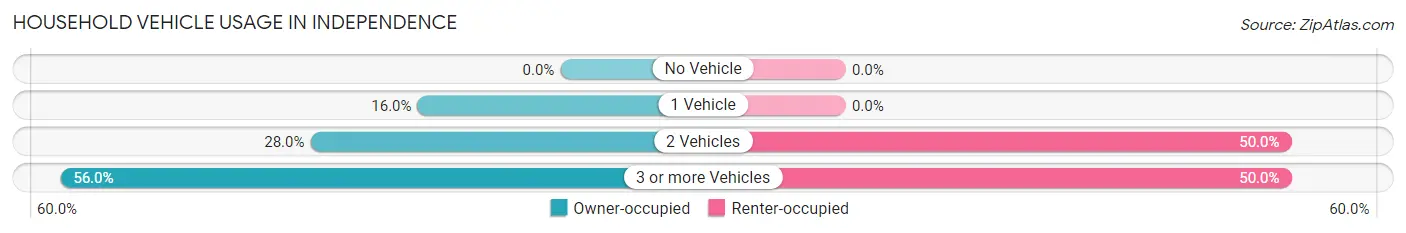
| Vehicles per Household | Owner-occupied | Renter-occupied |
| No Vehicle | 0 (0.0%) | 0 (0.0%) |
| 1 Vehicle | 4 (16.0%) | 0 (0.0%) |
| 2 Vehicles | 7 (28.0%) | 2 (50.0%) |
| 3 or more Vehicles | 14 (56.0%) | 2 (50.0%) |
| Total | 25 (100.0%) | 4 (100.0%) |
Real Estate & Mortgages in Independence
Real Estate and Mortgage Overview in Independence
| Characteristic | Without Mortgage | With Mortgage |
| Housing Units | 3 | 22 |
| Median Property Value | - | - |
| Median Household Income | - | - |
| Monthly Housing Costs | - | - |
| Real Estate Taxes | - | - |
Property Value by Mortgage Status in Independence
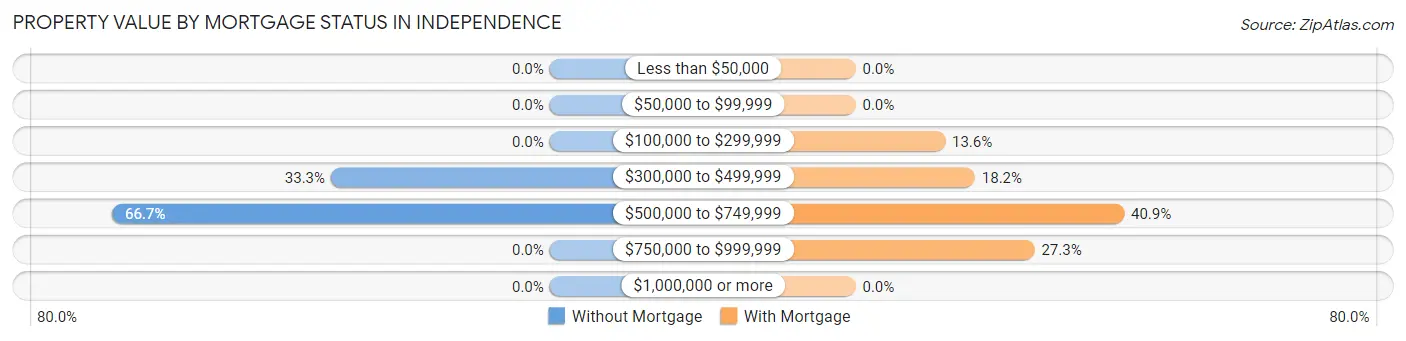
| Property Value | Without Mortgage | With Mortgage |
| Less than $50,000 | 0 (0.0%) | 0 (0.0%) |
| $50,000 to $99,999 | 0 (0.0%) | 0 (0.0%) |
| $100,000 to $299,999 | 0 (0.0%) | 3 (13.6%) |
| $300,000 to $499,999 | 1 (33.3%) | 4 (18.2%) |
| $500,000 to $749,999 | 2 (66.7%) | 9 (40.9%) |
| $750,000 to $999,999 | 0 (0.0%) | 6 (27.3%) |
| $1,000,000 or more | 0 (0.0%) | 0 (0.0%) |
| Total | 3 (100.0%) | 22 (100.0%) |
Household Income by Mortgage Status in Independence
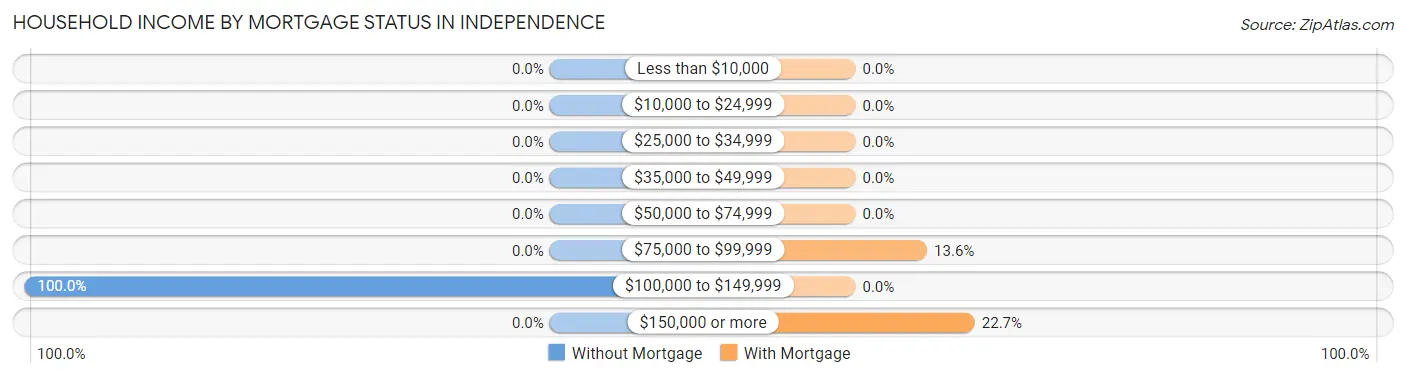
| Household Income | Without Mortgage | With Mortgage |
| Less than $10,000 | 0 (0.0%) | 0 (0.0%) |
| $10,000 to $24,999 | 0 (0.0%) | 0 (0.0%) |
| $25,000 to $34,999 | 0 (0.0%) | 0 (0.0%) |
| $35,000 to $49,999 | 0 (0.0%) | 0 (0.0%) |
| $50,000 to $74,999 | 0 (0.0%) | 0 (0.0%) |
| $75,000 to $99,999 | 0 (0.0%) | 3 (13.6%) |
| $100,000 to $149,999 | 3 (100.0%) | 0 (0.0%) |
| $150,000 or more | 0 (0.0%) | 5 (22.7%) |
| Total | 3 (100.0%) | 22 (100.0%) |
Property Value to Household Income Ratio in Independence
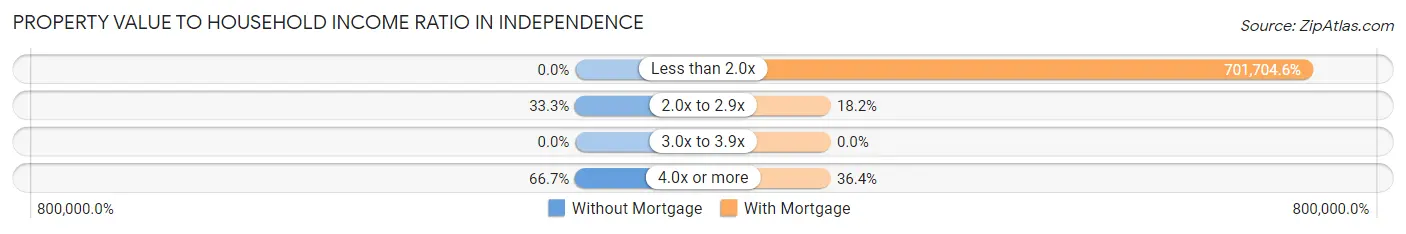
| Value-to-Income Ratio | Without Mortgage | With Mortgage |
| Less than 2.0x | 0 (0.0%) | 154,375 (701,704.6%) |
| 2.0x to 2.9x | 1 (33.3%) | 4 (18.2%) |
| 3.0x to 3.9x | 0 (0.0%) | 0 (0.0%) |
| 4.0x or more | 2 (66.7%) | 8 (36.4%) |
| Total | 3 (100.0%) | 22 (100.0%) |
Real Estate Taxes by Mortgage Status in Independence
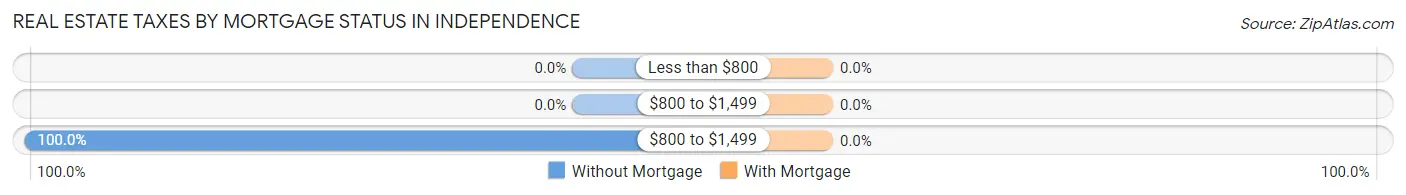
| Property Taxes | Without Mortgage | With Mortgage |
| Less than $800 | 0 (0.0%) | 0 (0.0%) |
| $800 to $1,499 | 0 (0.0%) | 0 (0.0%) |
| $800 to $1,499 | 3 (100.0%) | 0 (0.0%) |
| Total | 3 (100.0%) | 22 (100.0%) |
Health & Disability in Independence
Health Insurance Coverage by Age in Independence
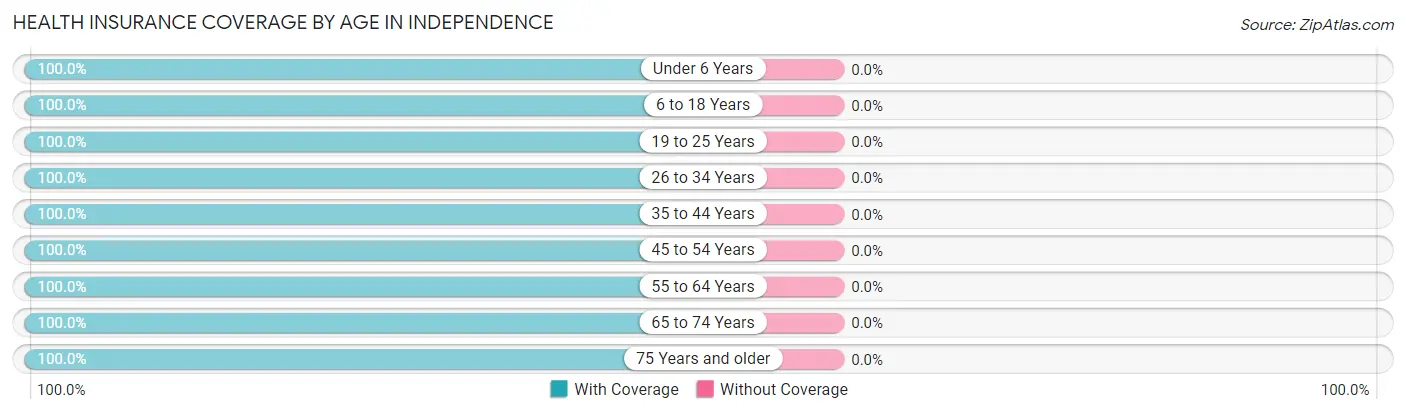
| Age Bracket | With Coverage | Without Coverage |
| Under 6 Years | 22 (100.0%) | 0 (0.0%) |
| 6 to 18 Years | 17 (100.0%) | 0 (0.0%) |
| 19 to 25 Years | 4 (100.0%) | 0 (0.0%) |
| 26 to 34 Years | 5 (100.0%) | 0 (0.0%) |
| 35 to 44 Years | 16 (100.0%) | 0 (0.0%) |
| 45 to 54 Years | 16 (100.0%) | 0 (0.0%) |
| 55 to 64 Years | 10 (100.0%) | 0 (0.0%) |
| 65 to 74 Years | 6 (100.0%) | 0 (0.0%) |
| 75 Years and older | 4 (100.0%) | 0 (0.0%) |
| Total | 100 (100.0%) | 0 (0.0%) |
Health Insurance Coverage by Citizenship Status in Independence
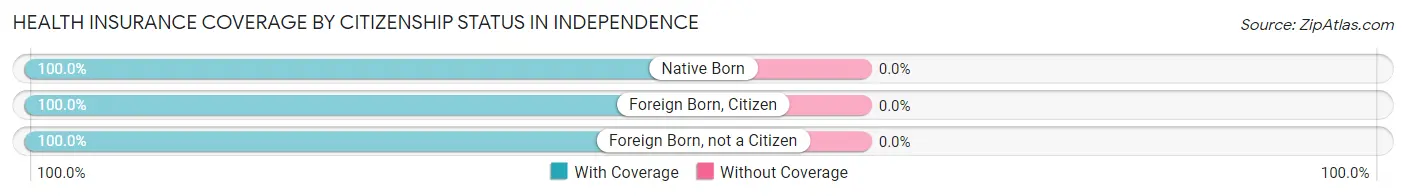
| Citizenship Status | With Coverage | Without Coverage |
| Native Born | 22 (100.0%) | 0 (0.0%) |
| Foreign Born, Citizen | 17 (100.0%) | 0 (0.0%) |
| Foreign Born, not a Citizen | 4 (100.0%) | 0 (0.0%) |
Health Insurance Coverage by Household Income in Independence
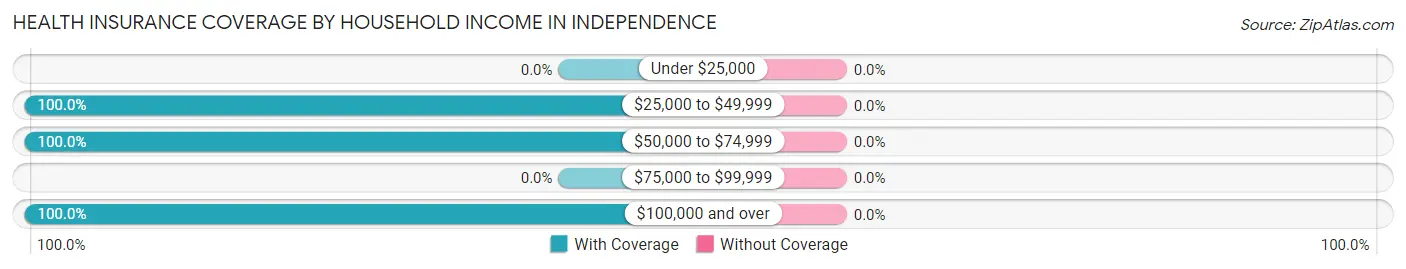
| Household Income | With Coverage | Without Coverage |
| Under $25,000 | 0 (0.0%) | 0 (0.0%) |
| $25,000 to $49,999 | 4 (100.0%) | 0 (0.0%) |
| $50,000 to $74,999 | 7 (100.0%) | 0 (0.0%) |
| $75,000 to $99,999 | 0 (0.0%) | 0 (0.0%) |
| $100,000 and over | 89 (100.0%) | 0 (0.0%) |
Public vs Private Health Insurance Coverage by Age in Independence
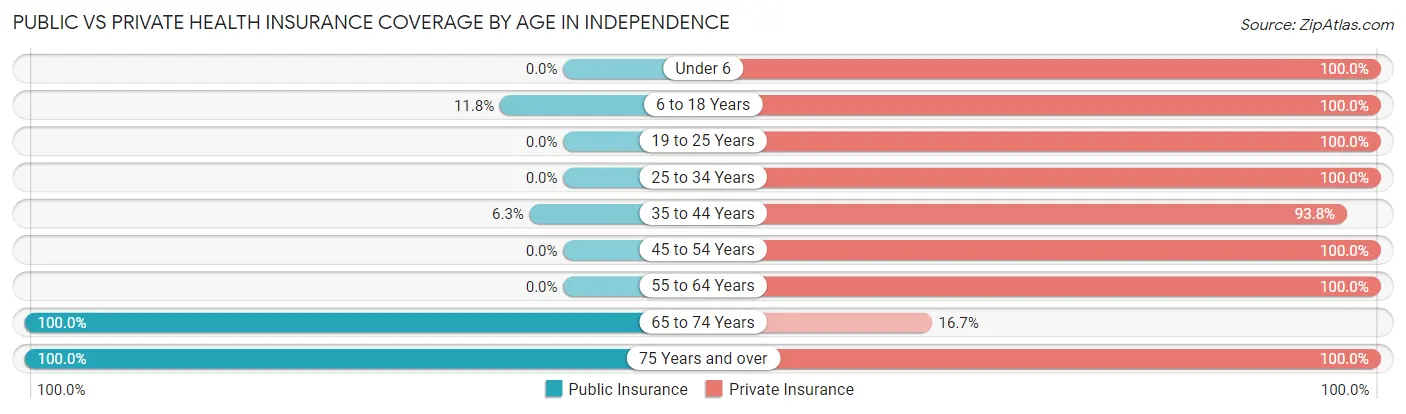
| Age Bracket | Public Insurance | Private Insurance |
| Under 6 | 0 (0.0%) | 22 (100.0%) |
| 6 to 18 Years | 2 (11.8%) | 17 (100.0%) |
| 19 to 25 Years | 0 (0.0%) | 4 (100.0%) |
| 25 to 34 Years | 0 (0.0%) | 5 (100.0%) |
| 35 to 44 Years | 1 (6.2%) | 15 (93.8%) |
| 45 to 54 Years | 0 (0.0%) | 16 (100.0%) |
| 55 to 64 Years | 0 (0.0%) | 10 (100.0%) |
| 65 to 74 Years | 6 (100.0%) | 1 (16.7%) |
| 75 Years and over | 4 (100.0%) | 4 (100.0%) |
| Total | 13 (13.0%) | 94 (94.0%) |
Disability Status by Sex by Age in Independence
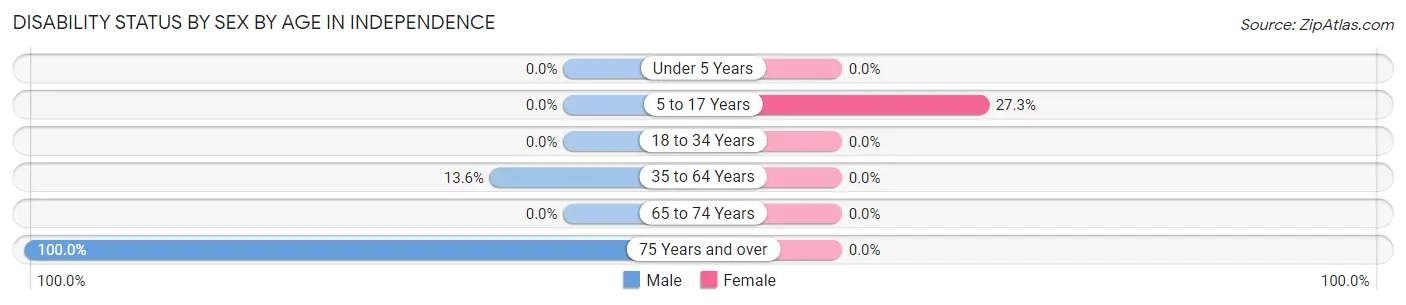
| Age Bracket | Male | Female |
| Under 5 Years | 0 (0.0%) | 0 (0.0%) |
| 5 to 17 Years | 0 (0.0%) | 3 (27.3%) |
| 18 to 34 Years | 0 (0.0%) | 0 (0.0%) |
| 35 to 64 Years | 3 (13.6%) | 0 (0.0%) |
| 65 to 74 Years | 0 (0.0%) | 0 (0.0%) |
| 75 Years and over | 2 (100.0%) | 0 (0.0%) |
Disability Class by Sex by Age in Independence
Disability Class: Hearing Difficulty
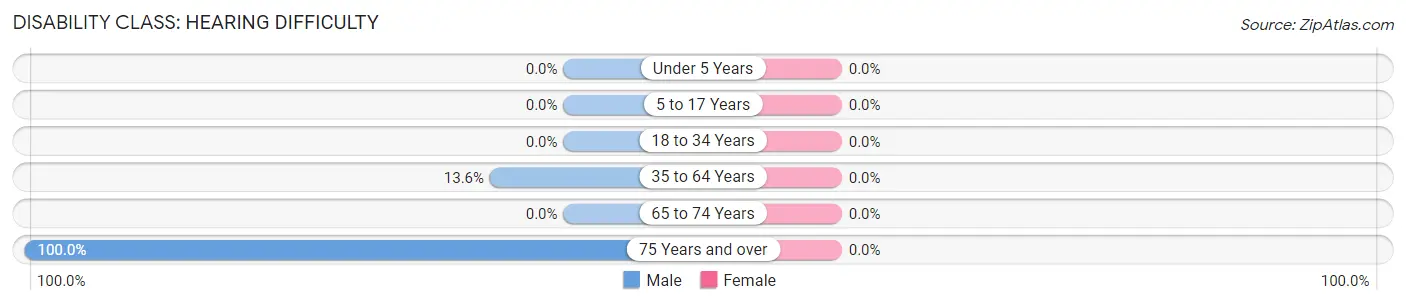
| Age Bracket | Male | Female |
| Under 5 Years | 0 (0.0%) | 0 (0.0%) |
| 5 to 17 Years | 0 (0.0%) | 0 (0.0%) |
| 18 to 34 Years | 0 (0.0%) | 0 (0.0%) |
| 35 to 64 Years | 3 (13.6%) | 0 (0.0%) |
| 65 to 74 Years | 0 (0.0%) | 0 (0.0%) |
| 75 Years and over | 2 (100.0%) | 0 (0.0%) |
Disability Class: Vision Difficulty
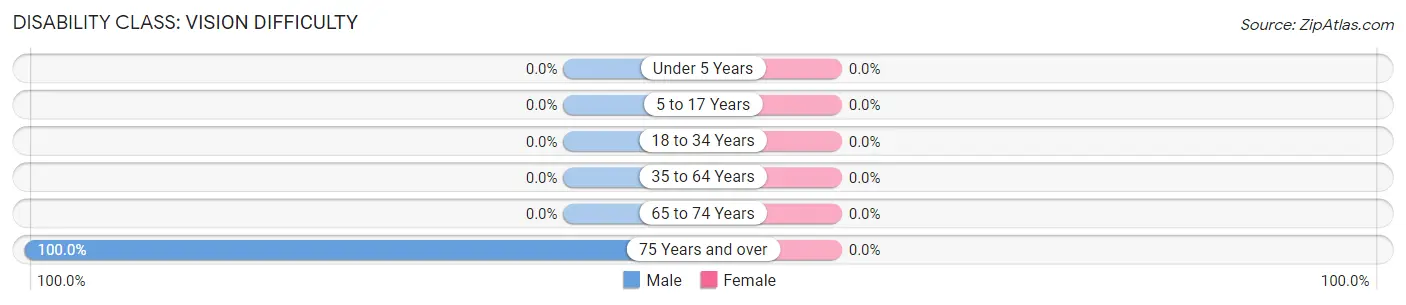
| Age Bracket | Male | Female |
| Under 5 Years | 0 (0.0%) | 0 (0.0%) |
| 5 to 17 Years | 0 (0.0%) | 0 (0.0%) |
| 18 to 34 Years | 0 (0.0%) | 0 (0.0%) |
| 35 to 64 Years | 0 (0.0%) | 0 (0.0%) |
| 65 to 74 Years | 0 (0.0%) | 0 (0.0%) |
| 75 Years and over | 2 (100.0%) | 0 (0.0%) |
Disability Class: Cognitive Difficulty
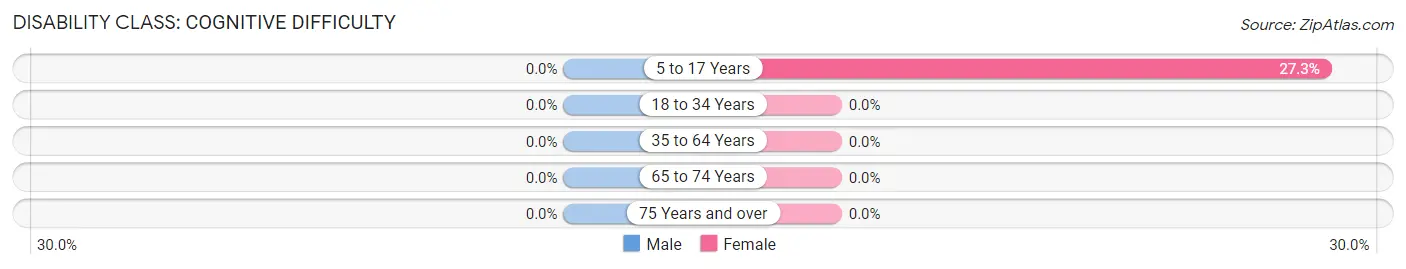
| Age Bracket | Male | Female |
| 5 to 17 Years | 0 (0.0%) | 3 (27.3%) |
| 18 to 34 Years | 0 (0.0%) | 0 (0.0%) |
| 35 to 64 Years | 0 (0.0%) | 0 (0.0%) |
| 65 to 74 Years | 0 (0.0%) | 0 (0.0%) |
| 75 Years and over | 0 (0.0%) | 0 (0.0%) |
Disability Class: Ambulatory Difficulty
| Age Bracket | Male | Female |
| 5 to 17 Years | 0 (0.0%) | 0 (0.0%) |
| 18 to 34 Years | 0 (0.0%) | 0 (0.0%) |
| 35 to 64 Years | 0 (0.0%) | 0 (0.0%) |
| 65 to 74 Years | 0 (0.0%) | 0 (0.0%) |
| 75 Years and over | 0 (0.0%) | 0 (0.0%) |
Disability Class: Self-Care Difficulty
| Age Bracket | Male | Female |
| 5 to 17 Years | 0 (0.0%) | 0 (0.0%) |
| 18 to 34 Years | 0 (0.0%) | 0 (0.0%) |
| 35 to 64 Years | 0 (0.0%) | 0 (0.0%) |
| 65 to 74 Years | 0 (0.0%) | 0 (0.0%) |
| 75 Years and over | 0 (0.0%) | 0 (0.0%) |
Technology Access in Independence
Computing Device Access in Independence
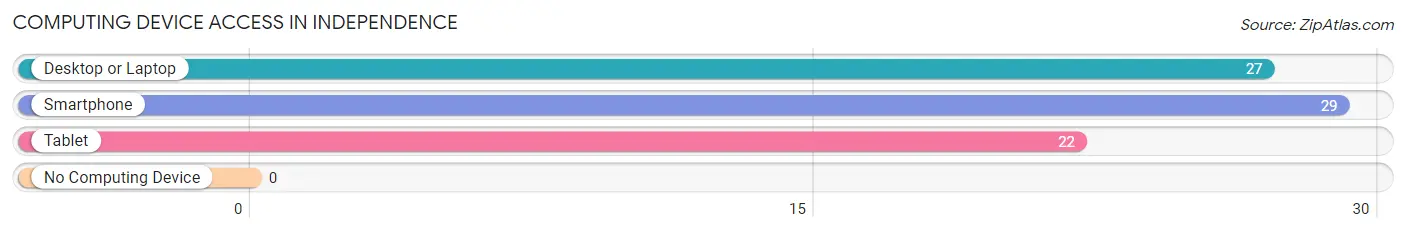
| Device Type | # Households | % Households |
| Desktop or Laptop | 27 | 93.1% |
| Smartphone | 29 | 100.0% |
| Tablet | 22 | 75.9% |
| No Computing Device | 0 | 0.0% |
| Total | 29 | 100.0% |
Internet Access in Independence
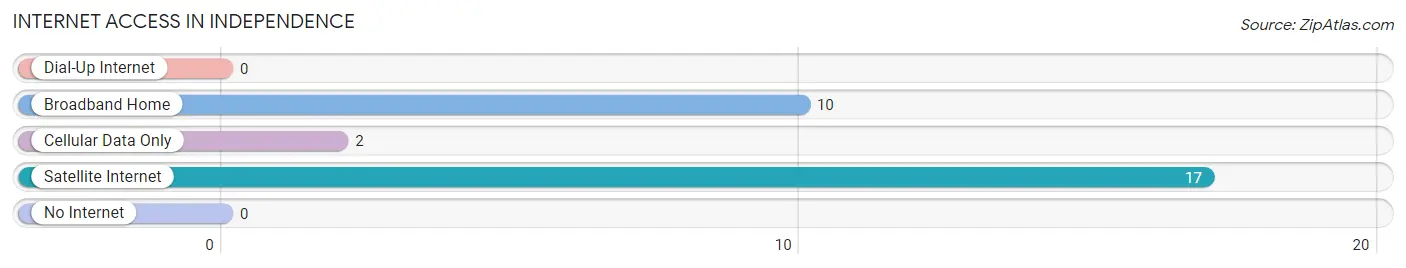
| Internet Type | # Households | % Households |
| Dial-Up Internet | 0 | 0.0% |
| Broadband Home | 10 | 34.5% |
| Cellular Data Only | 2 | 6.9% |
| Satellite Internet | 17 | 58.6% |
| No Internet | 0 | 0.0% |
| Total | 29 | 100.0% |
Independence Summary
Independence is a small city located in the southwestern corner of Utah, in the heart of the Great Basin. It is situated in the Sevier Valley, which is surrounded by the Wasatch Mountains to the east and the Fishlake National Forest to the west. The city is located about 30 miles south of Richfield, the county seat of Sevier County, and about 90 miles south of Salt Lake City.
History
Independence was first settled in 1864 by a group of Mormon pioneers led by John D. Lee. The settlers named the area after the Declaration of Independence, which was signed in 1776. The settlers were attracted to the area due to its fertile soil and abundant water supply. The settlers built a fort and established a small community, which grew to become the city of Independence.
In 1871, the Utah Territorial Legislature created Sevier County, with Independence as its county seat. The city was incorporated in 1876 and has remained the county seat ever since.
Geography
Independence is located in the southwestern corner of Utah, in the heart of the Great Basin. It is situated in the Sevier Valley, which is surrounded by the Wasatch Mountains to the east and the Fishlake National Forest to the west. The city is located about 30 miles south of Richfield, the county seat of Sevier County, and about 90 miles south of Salt Lake City.
The city has a total area of 4.2 square miles, all of which is land. The elevation of the city is 5,890 feet above sea level. The climate is semi-arid, with hot summers and cold winters.
Economy
The economy of Independence is largely based on agriculture and tourism. The city is home to several farms and ranches, which produce a variety of crops, including hay, alfalfa, corn, wheat, and potatoes. The city is also home to several tourist attractions, including the Sevier Valley Center, which hosts a variety of events throughout the year.
The city is also home to several businesses, including a grocery store, a hardware store, a bank, and a post office. The city is served by the Sevier Valley Railroad, which connects the city to Richfield and other nearby towns.
Demographics
As of the 2010 census, the population of Independence was 1,845. The racial makeup of the city was 95.3% White, 0.2% African American, 0.7% Native American, 0.2% Asian, 0.1% Pacific Islander, 1.2% from other races, and 2.3% from two or more races. Hispanic or Latino of any race were 3.3% of the population.
The median income for a household in the city was $37,500, and the median income for a family was $41,250. The per capita income for the city was $17,845. About 11.2% of families and 13.2% of the population were below the poverty line, including 16.2% of those under age 18 and 8.3% of those age 65 or over.
Common Questions
What is the Total Population of Independence?
Total Population of Independence is 100.
What is the Total Male Population of Independence?
Total Male Population of Independence is 51.
What is the Total Female Population of Independence?
Total Female Population of Independence is 49.
What is the Ratio of Males per 100 Females in Independence?
There are 104.08 Males per 100 Females in Independence.
What is the Ratio of Females per 100 Males in Independence?
There are 96.08 Females per 100 Males in Independence.
What is the Median Population Age in Independence?
Median Population Age in Independence is 37.0 Years.
What is the Average Family Size in Independence
Average Family Size in Independence is 3.4 People.
What is the Average Household Size in Independence
Average Household Size in Independence is 3.5 People.
What is Per Capita Income in Independence?
Per Capita income in Independence is $56,398.
What is the Median Family Income in Independence?
Median Family Income in Independence is $148,750.
What is the Median Household income in Independence?
Median Household Income in Independence is $148,750.
What is Inequality or Gini Index in Independence?
Inequality or Gini Index in Independence is 0.38.
How Large is the Labor Force in Independence?
There are 48 People in the Labor Forcein in Independence.
What is the Percentage of People in the Labor Force in Independence?
76.2% of People are in the Labor Force in Independence.