Cove, UT
Cove Map
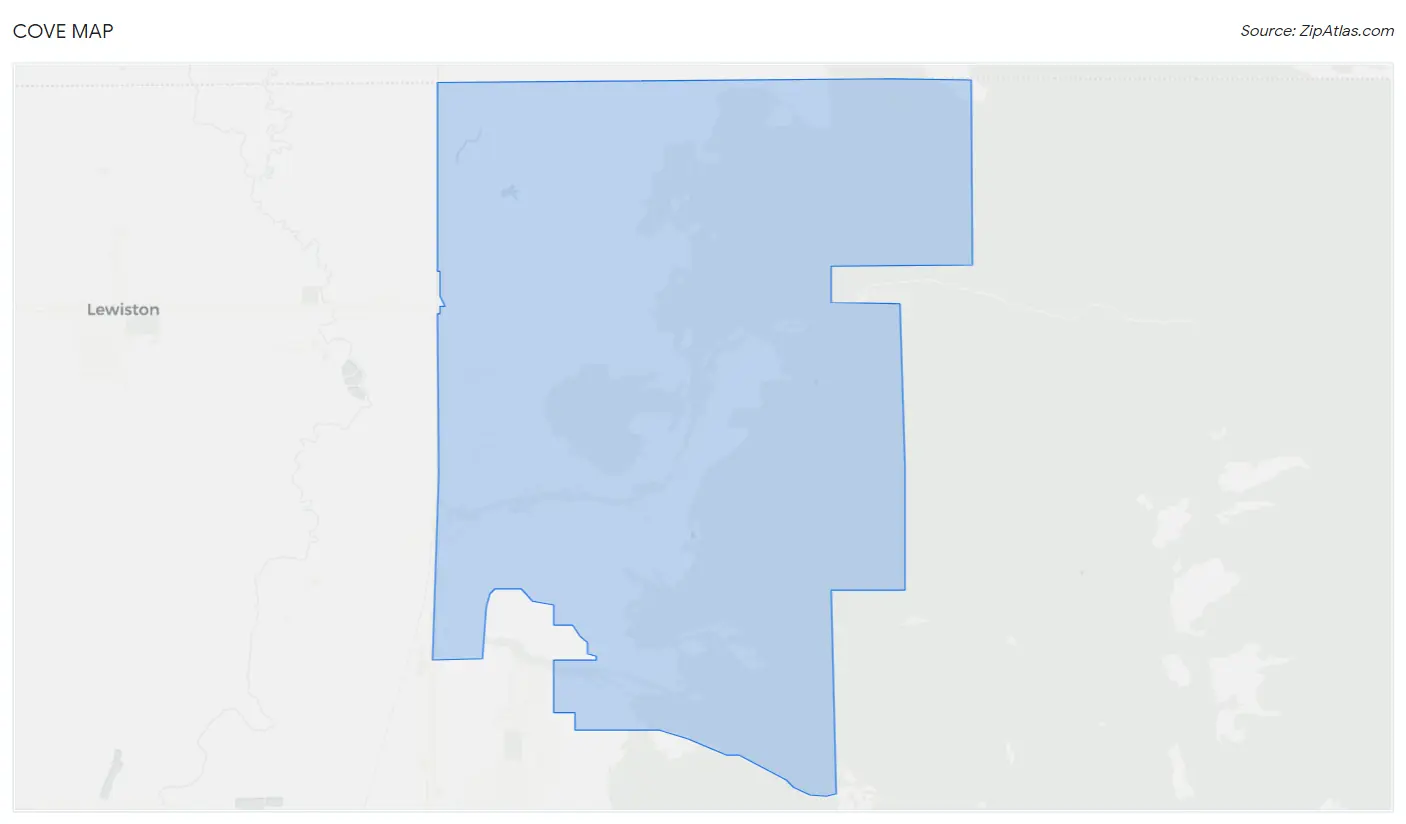
Cove Overview
475
TOTAL POPULATION
234
MALE POPULATION
241
FEMALE POPULATION
97.10
MALES / 100 FEMALES
102.99
FEMALES / 100 MALES
30.9
MEDIAN AGE
4.4
AVG FAMILY SIZE
4.4
AVG HOUSEHOLD SIZE
$25,560
PER CAPITA INCOME
0.33
INEQUALITY / GINI INDEX
166
LABOR FORCE [ PEOPLE ]
59.7%
PERCENT IN LABOR FORCE
Cove Area Codes
Race in Cove
The most populous races in Cove are , and White / Caucasian (475 | 100.0%).
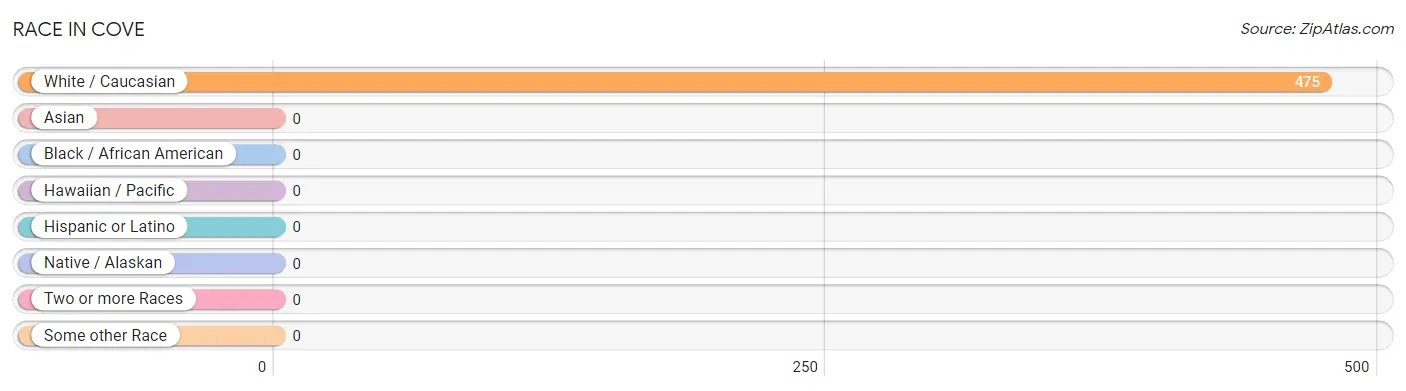
| Race | # Population | % Population |
| Asian | 0 | 0.0% |
| Black / African American | 0 | 0.0% |
| Hawaiian / Pacific | 0 | 0.0% |
| Hispanic or Latino | 0 | 0.0% |
| Native / Alaskan | 0 | 0.0% |
| White / Caucasian | 475 | 100.0% |
| Two or more Races | 0 | 0.0% |
| Some other Race | 0 | 0.0% |
| Total | 475 | 100.0% |
Ancestry in Cove
The most populous ancestries reported in Cove are American (137 | 28.8%), Welsh (50 | 10.5%), English (46 | 9.7%), Swedish (25 | 5.3%), and Irish (20 | 4.2%), together accounting for 58.5% of all Cove residents.
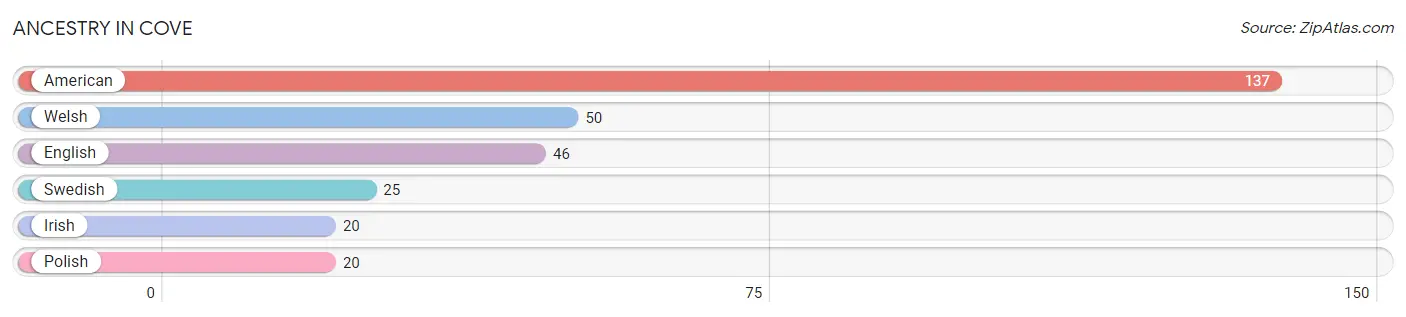
| Ancestry | # Population | % Population |
| American | 137 | 28.8% |
| English | 46 | 9.7% |
| Irish | 20 | 4.2% |
| Polish | 20 | 4.2% |
| Swedish | 25 | 5.3% |
| Welsh | 50 | 10.5% | View All 6 Rows |
Immigrants in Cove

| Immigration Origin | # Population | % Population | View All 0 Rows |
Sex and Age in Cove
Sex and Age in Cove
The most populous age groups in Cove are 35 to 39 Years (51 | 21.8%) for men and Under 5 Years (52 | 21.6%) for women.
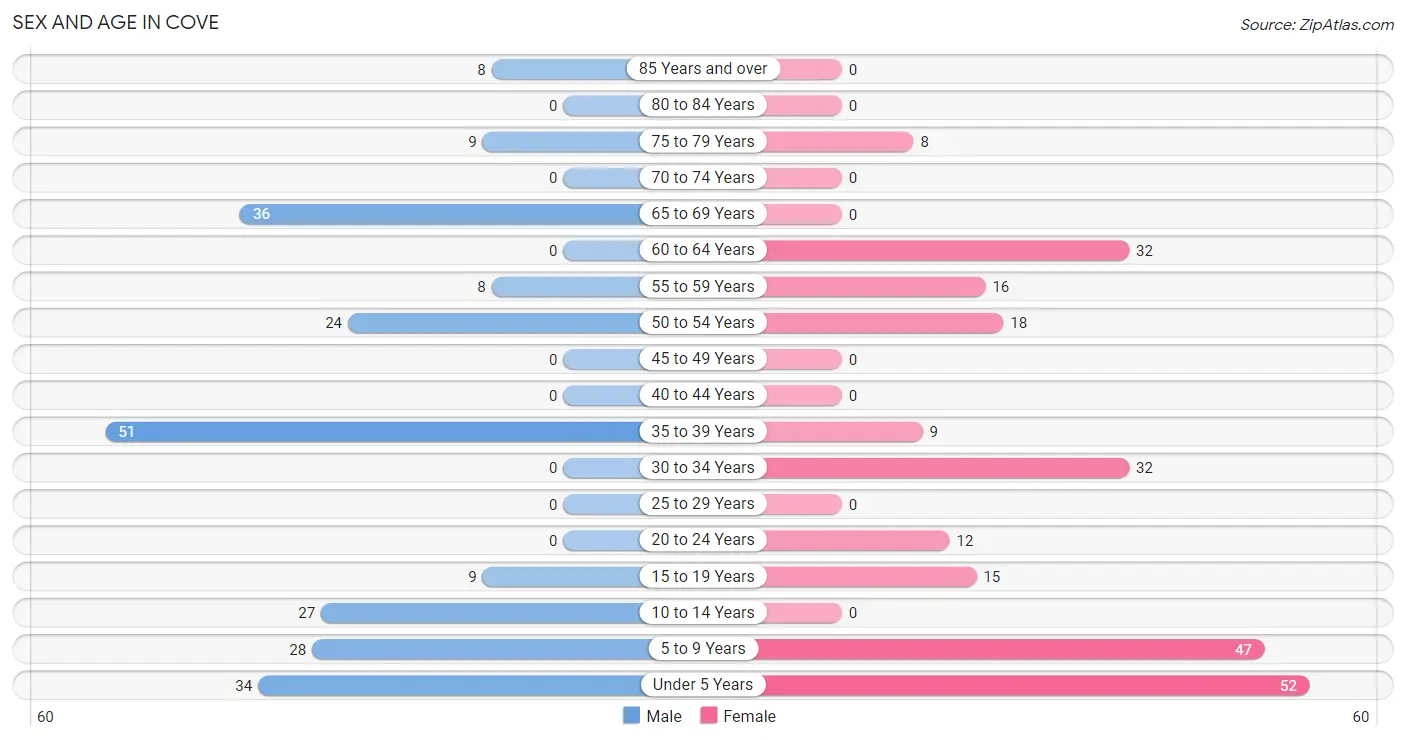
| Age Bracket | Male | Female |
| Under 5 Years | 34 (14.5%) | 52 (21.6%) |
| 5 to 9 Years | 28 (12.0%) | 47 (19.5%) |
| 10 to 14 Years | 27 (11.5%) | 0 (0.0%) |
| 15 to 19 Years | 9 (3.8%) | 15 (6.2%) |
| 20 to 24 Years | 0 (0.0%) | 12 (5.0%) |
| 25 to 29 Years | 0 (0.0%) | 0 (0.0%) |
| 30 to 34 Years | 0 (0.0%) | 32 (13.3%) |
| 35 to 39 Years | 51 (21.8%) | 9 (3.7%) |
| 40 to 44 Years | 0 (0.0%) | 0 (0.0%) |
| 45 to 49 Years | 0 (0.0%) | 0 (0.0%) |
| 50 to 54 Years | 24 (10.3%) | 18 (7.5%) |
| 55 to 59 Years | 8 (3.4%) | 16 (6.6%) |
| 60 to 64 Years | 0 (0.0%) | 32 (13.3%) |
| 65 to 69 Years | 36 (15.4%) | 0 (0.0%) |
| 70 to 74 Years | 0 (0.0%) | 0 (0.0%) |
| 75 to 79 Years | 9 (3.8%) | 8 (3.3%) |
| 80 to 84 Years | 0 (0.0%) | 0 (0.0%) |
| 85 Years and over | 8 (3.4%) | 0 (0.0%) |
| Total | 234 (100.0%) | 241 (100.0%) |
Families and Households in Cove
Median Family Size in Cove
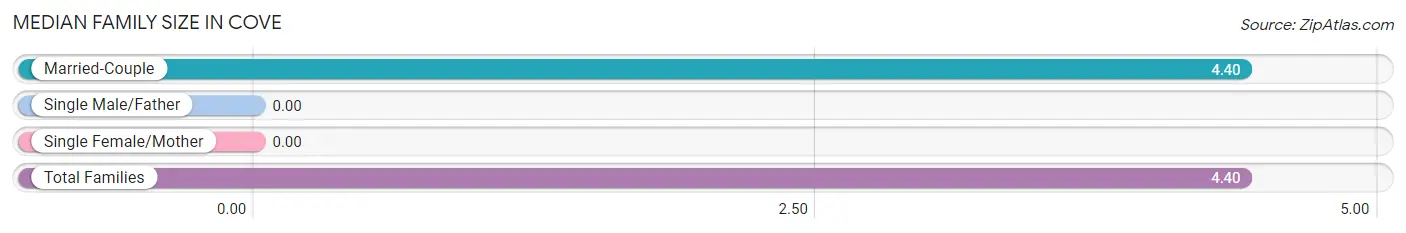
| Family Type | # Families | Family Size |
| Married-Couple | 108 (100.0%) | 4.40 |
| Single Male/Father | 0 (0.0%) | - |
| Single Female/Mother | 0 (0.0%) | - |
| Total Families | 108 (100.0%) | 4.40 |
Median Household Size in Cove
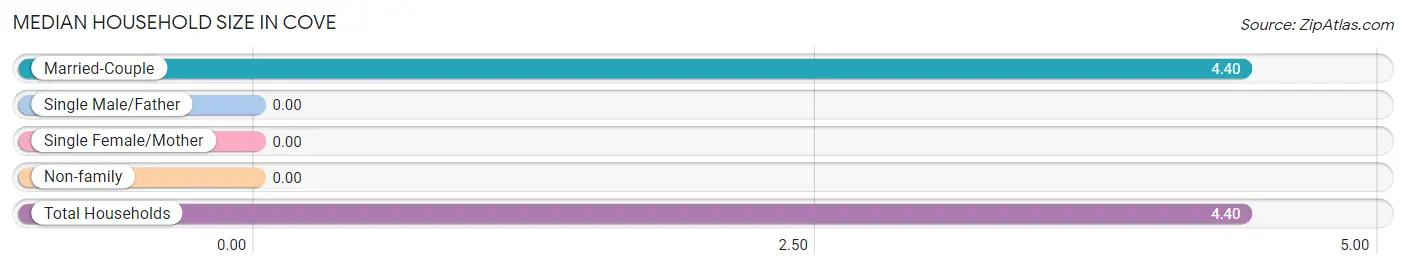
| Household Type | # Households | Household Size |
| Married-Couple | 108 (100.0%) | 4.40 |
| Single Male/Father | 0 (0.0%) | - |
| Single Female/Mother | 0 (0.0%) | - |
| Non-family | 0 (0.0%) | - |
| Total Households | 108 (100.0%) | 4.40 |
Household Size by Marriage Status in Cove
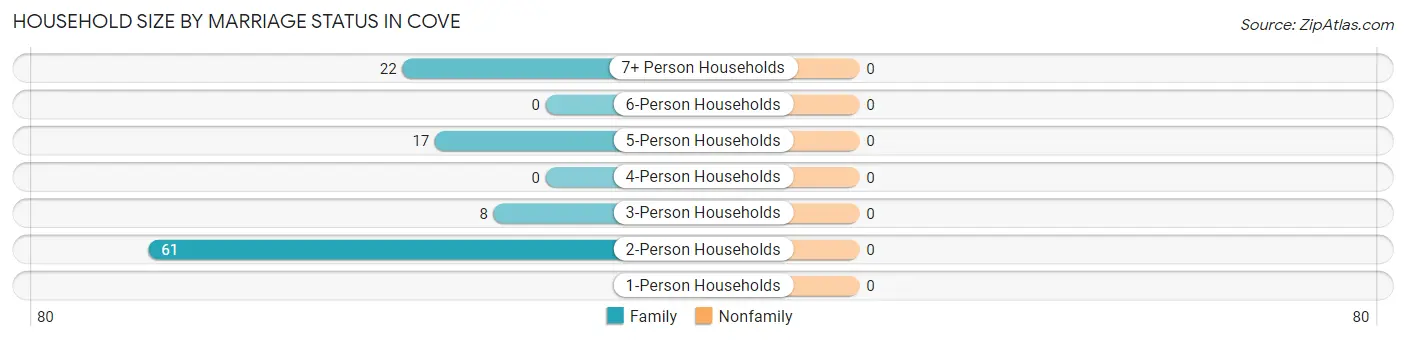
| Household Size | Family Households | Nonfamily Households |
| 1-Person Households | - | 0 (0.0%) |
| 2-Person Households | 61 (56.5%) | 0 (0.0%) |
| 3-Person Households | 8 (7.4%) | 0 (0.0%) |
| 4-Person Households | 0 (0.0%) | 0 (0.0%) |
| 5-Person Households | 17 (15.7%) | 0 (0.0%) |
| 6-Person Households | 0 (0.0%) | 0 (0.0%) |
| 7+ Person Households | 22 (20.4%) | 0 (0.0%) |
| Total | 108 (100.0%) | 0 (0.0%) |
Female Fertility in Cove
Fertility by Age in Cove
Average fertility rate in Cove is 221.0 births per 1,000 women. Women in the age bracket of 20 to 34 years have the highest fertility rate with 341.0 births per 1,000 women. Women in the age bracket of 20 to 34 years acount for 100.0% of all women with births.
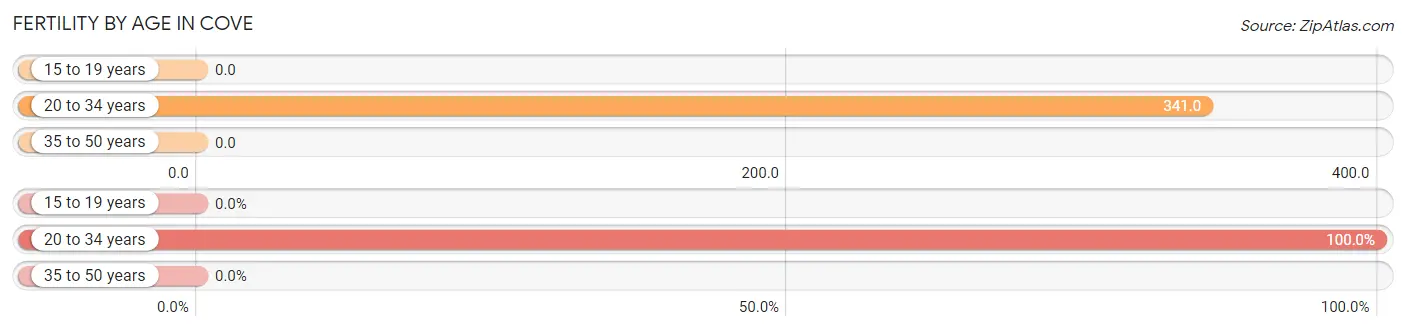
| Age Bracket | Women with Births | Births / 1,000 Women |
| 15 to 19 years | 0 (0.0%) | 0.0 |
| 20 to 34 years | 15 (100.0%) | 341.0 |
| 35 to 50 years | 0 (0.0%) | 0.0 |
| Total | 15 (100.0%) | 221.0 |
Fertility by Age by Marriage Status in Cove
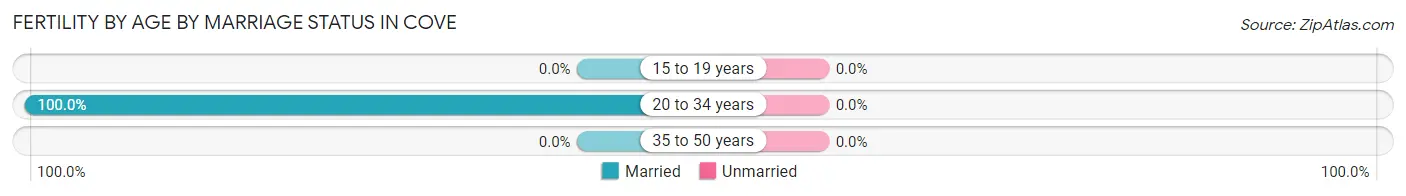
| Age Bracket | Married | Unmarried |
| 15 to 19 years | 0 (0.0%) | 0 (0.0%) |
| 20 to 34 years | 15 (100.0%) | 0 (0.0%) |
| 35 to 50 years | 0 (0.0%) | 0 (0.0%) |
| Total | 15 (100.0%) | 0 (0.0%) |
Fertility by Education in Cove
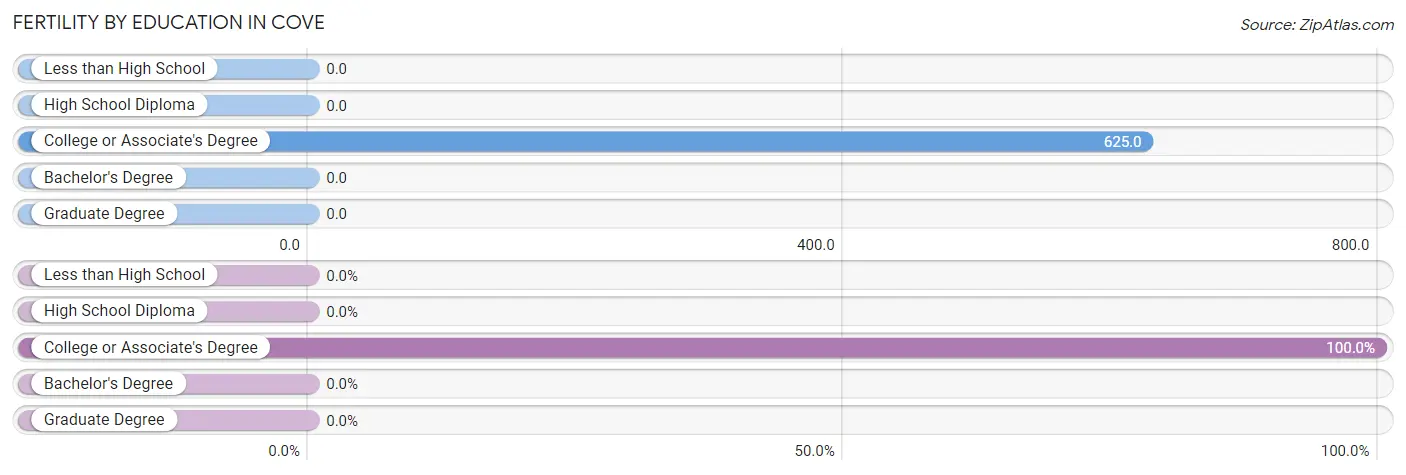
| Educational Attainment | Women with Births | Births / 1,000 Women |
| Less than High School | 0 (0.0%) | 0.0 |
| High School Diploma | 0 (0.0%) | 0.0 |
| College or Associate's Degree | 15 (100.0%) | 625.0 |
| Bachelor's Degree | 0 (0.0%) | 0.0 |
| Graduate Degree | 0 (0.0%) | 0.0 |
| Total | 15 (100.0%) | 221.0 |
Fertility by Education by Marriage Status in Cove
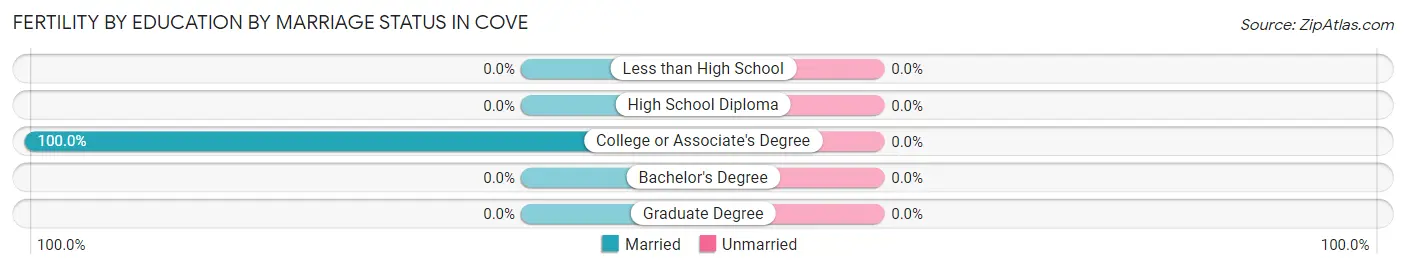
| Educational Attainment | Married | Unmarried |
| Less than High School | 0 (0.0%) | 0 (0.0%) |
| High School Diploma | 0 (0.0%) | 0 (0.0%) |
| College or Associate's Degree | 15 (100.0%) | 0 (0.0%) |
| Bachelor's Degree | 0 (0.0%) | 0 (0.0%) |
| Graduate Degree | 0 (0.0%) | 0 (0.0%) |
| Total | 15 (100.0%) | 0 (0.0%) |
Income in Cove
Income Overview in Cove
| Characteristic | Number | Measure |
| Per Capita Income | 475 | $25,560 |
| Median Family Income | 108 | $0 |
| Mean Family Income | 108 | $105,794 |
| Median Household Income | 108 | $0 |
| Mean Household Income | 108 | $105,794 |
| Income Deficit | 108 | $0 |
| Wage / Income Gap (%) | 475 | 0.00% |
| Wage / Income Gap ($) | 475 | 100.00¢ per $1 |
| Gini / Inequality Index | 475 | 0.33 |
Earnings by Sex in Cove
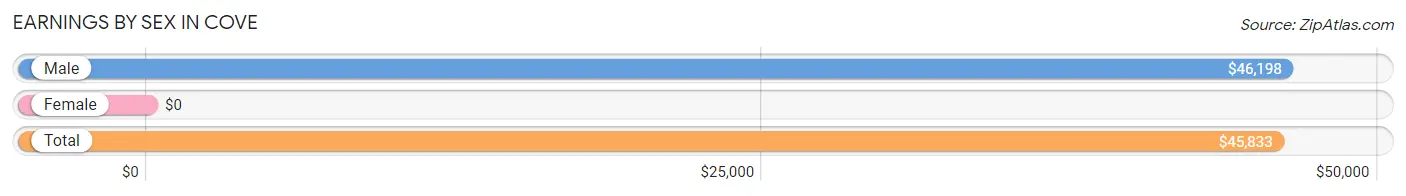
| Sex | Number | Average Earnings |
| Male | 73 (41.9%) | $46,198 |
| Female | 101 (58.1%) | $0 |
| Total | 174 (100.0%) | $45,833 |
Earnings by Sex by Income Bracket in Cove
The most common earnings brackets in Cove are $45,000 to $49,999 for men (24 | 32.9%) and $75,000 to $99,999 for women (24 | 23.8%).
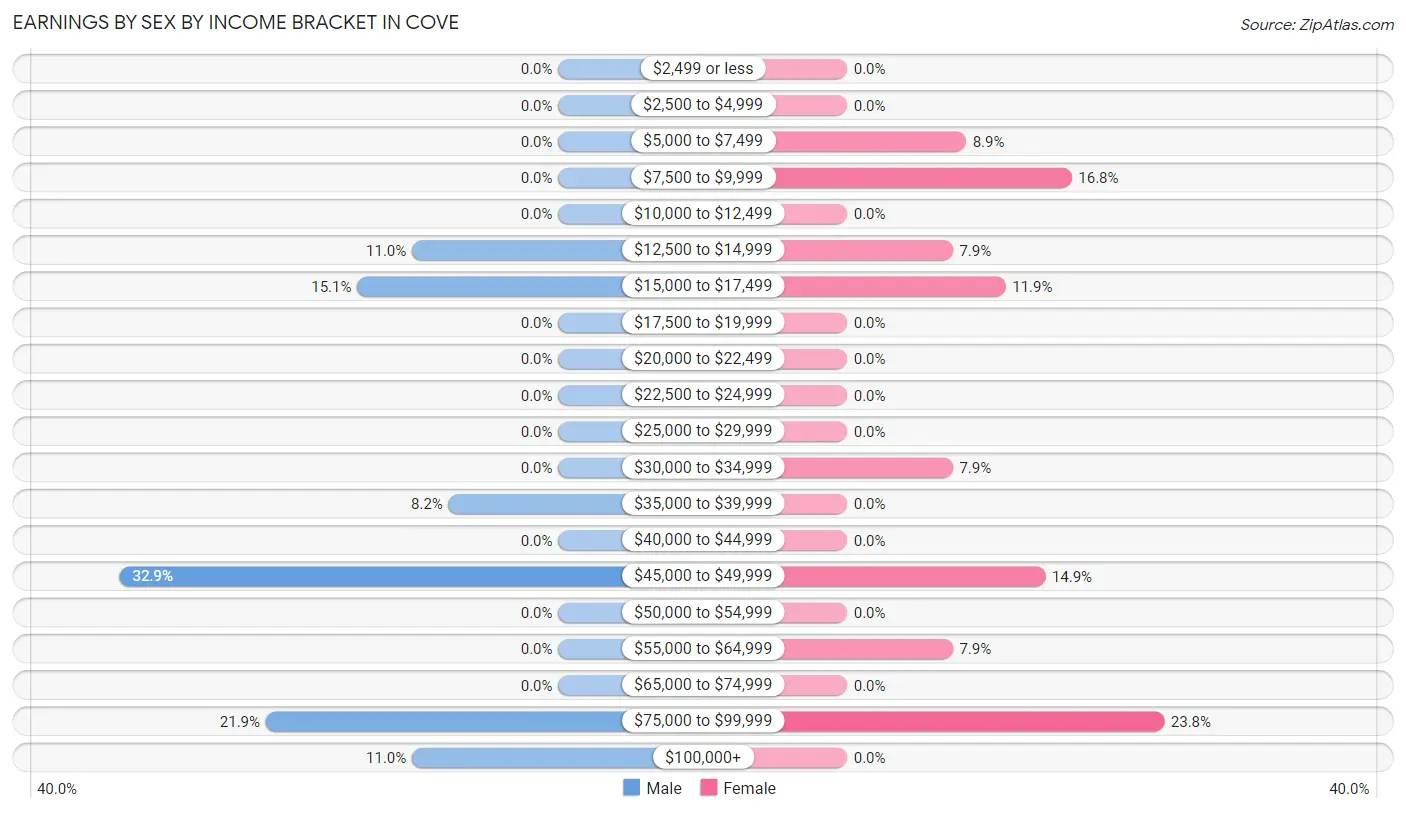
| Income | Male | Female |
| $2,499 or less | 0 (0.0%) | 0 (0.0%) |
| $2,500 to $4,999 | 0 (0.0%) | 0 (0.0%) |
| $5,000 to $7,499 | 0 (0.0%) | 9 (8.9%) |
| $7,500 to $9,999 | 0 (0.0%) | 17 (16.8%) |
| $10,000 to $12,499 | 0 (0.0%) | 0 (0.0%) |
| $12,500 to $14,999 | 8 (11.0%) | 8 (7.9%) |
| $15,000 to $17,499 | 11 (15.1%) | 12 (11.9%) |
| $17,500 to $19,999 | 0 (0.0%) | 0 (0.0%) |
| $20,000 to $22,499 | 0 (0.0%) | 0 (0.0%) |
| $22,500 to $24,999 | 0 (0.0%) | 0 (0.0%) |
| $25,000 to $29,999 | 0 (0.0%) | 0 (0.0%) |
| $30,000 to $34,999 | 0 (0.0%) | 8 (7.9%) |
| $35,000 to $39,999 | 6 (8.2%) | 0 (0.0%) |
| $40,000 to $44,999 | 0 (0.0%) | 0 (0.0%) |
| $45,000 to $49,999 | 24 (32.9%) | 15 (14.8%) |
| $50,000 to $54,999 | 0 (0.0%) | 0 (0.0%) |
| $55,000 to $64,999 | 0 (0.0%) | 8 (7.9%) |
| $65,000 to $74,999 | 0 (0.0%) | 0 (0.0%) |
| $75,000 to $99,999 | 16 (21.9%) | 24 (23.8%) |
| $100,000+ | 8 (11.0%) | 0 (0.0%) |
| Total | 73 (100.0%) | 101 (100.0%) |
Earnings by Sex by Educational Attainment in Cove
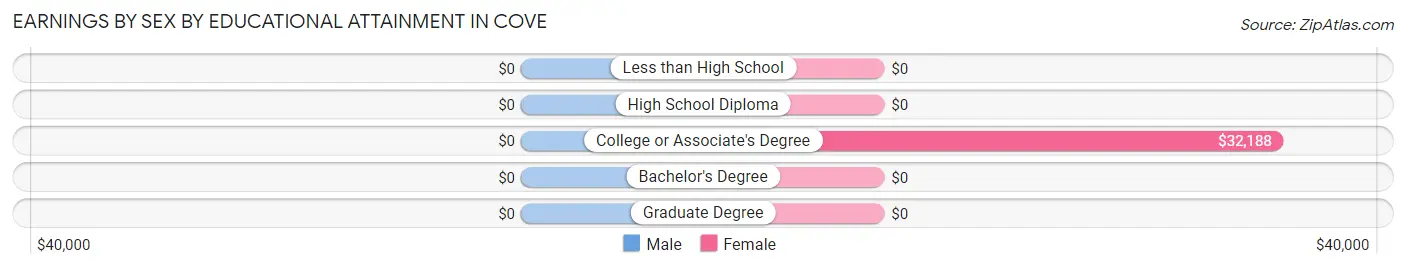
| Educational Attainment | Male Income | Female Income |
| Less than High School | - | - |
| High School Diploma | - | - |
| College or Associate's Degree | - | - |
| Bachelor's Degree | - | - |
| Graduate Degree | - | - |
| Total | $46,198 | $47,917 |
Family Income in Cove
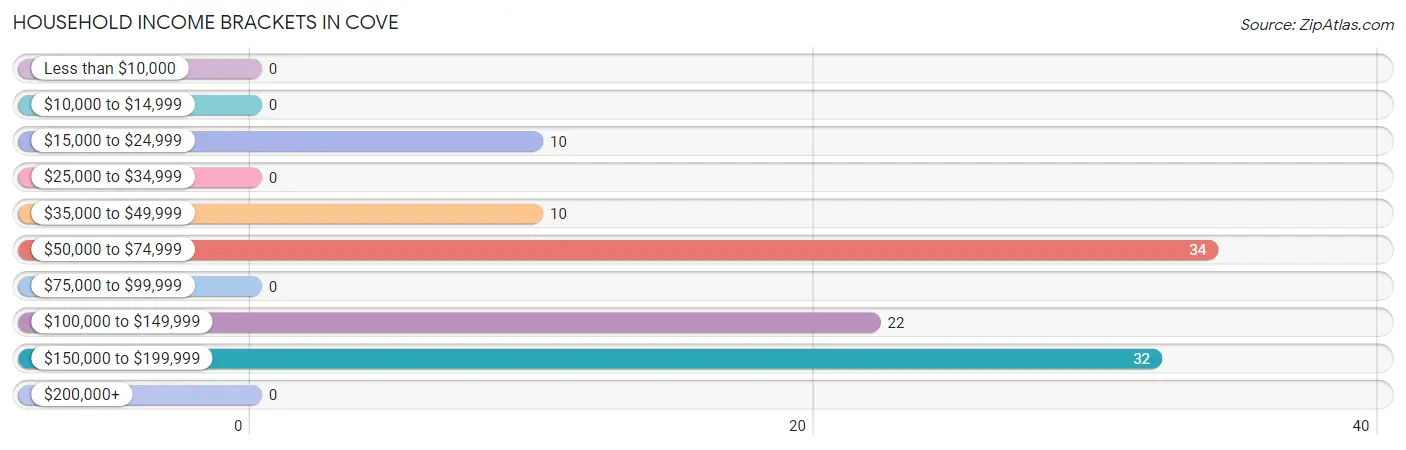
Family Income Brackets in Cove
According to the Cove family income data, there are 34 families falling into the $50,000 to $74,999 income range, which is the most common income bracket and makes up 31.5% of all families.
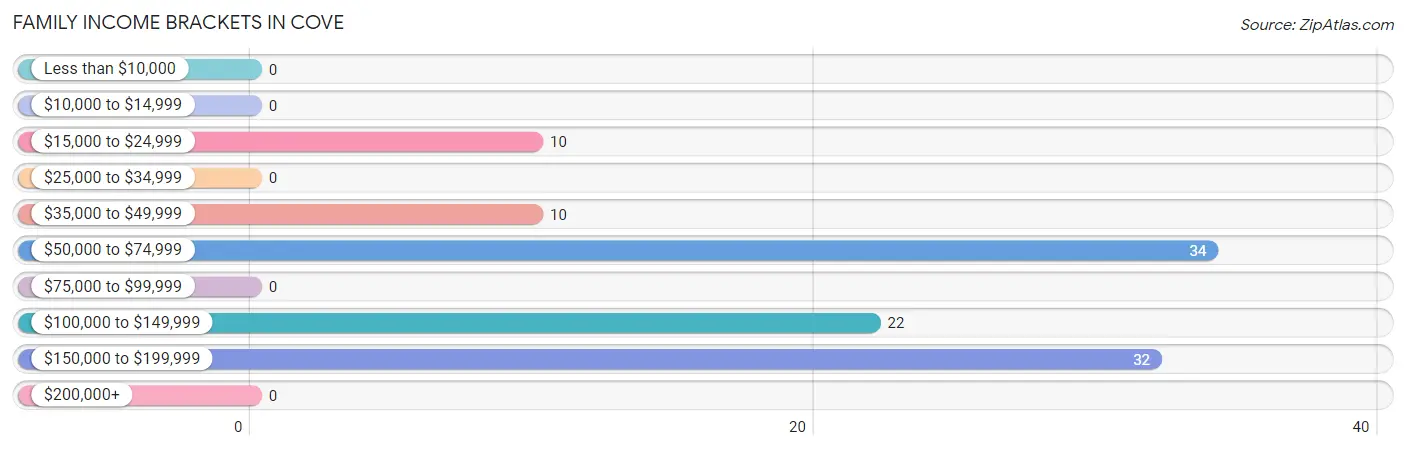
| Income Bracket | # Families | % Families |
| Less than $10,000 | 0 | 0.0% |
| $10,000 to $14,999 | 0 | 0.0% |
| $15,000 to $24,999 | 10 | 9.3% |
| $25,000 to $34,999 | 0 | 0.0% |
| $35,000 to $49,999 | 10 | 9.3% |
| $50,000 to $74,999 | 34 | 31.5% |
| $75,000 to $99,999 | 0 | 0.0% |
| $100,000 to $149,999 | 22 | 20.4% |
| $150,000 to $199,999 | 32 | 29.6% |
| $200,000+ | 0 | 0.0% |
Family Income by Famaliy Size in Cove
| Income Bracket | # Families | Median Income |
| 2-Person Families | 61 (56.5%) | $0 |
| 3-Person Families | 8 (7.4%) | $0 |
| 4-Person Families | 0 (0.0%) | $0 |
| 5-Person Families | 17 (15.7%) | $0 |
| 6-Person Families | 0 (0.0%) | $0 |
| 7+ Person Families | 22 (20.4%) | $0 |
| Total | 108 (100.0%) | $0 |
Family Income by Number of Earners in Cove
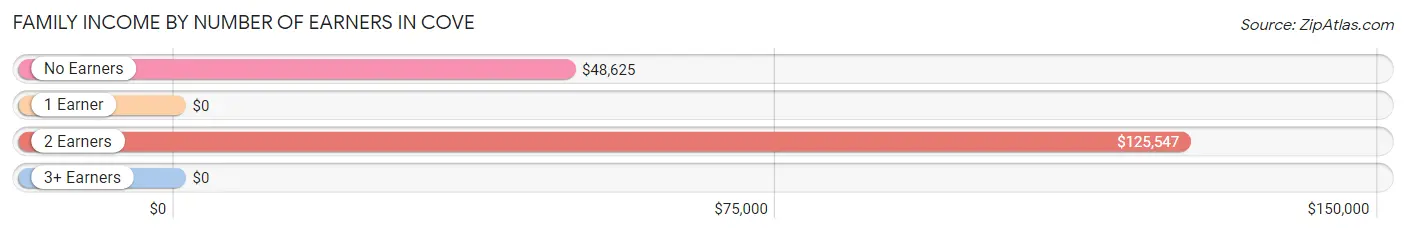
| Number of Earners | # Families | Median Income |
| No Earners | 29 (26.9%) | $48,625 |
| 1 Earner | 24 (22.2%) | $0 |
| 2 Earners | 41 (38.0%) | $125,547 |
| 3+ Earners | 14 (13.0%) | $0 |
| Total | 108 (100.0%) | $0 |
Household Income in Cove
Household Income Brackets in Cove
With 34 households falling in the category, the $50,000 to $74,999 income range is the most frequent in Cove, accounting for 31.5% of all households.
| Income Bracket | # Households | % Households |
| Less than $10,000 | 0 | 0.0% |
| $10,000 to $14,999 | 0 | 0.0% |
| $15,000 to $24,999 | 10 | 9.3% |
| $25,000 to $34,999 | 0 | 0.0% |
| $35,000 to $49,999 | 10 | 9.3% |
| $50,000 to $74,999 | 34 | 31.5% |
| $75,000 to $99,999 | 0 | 0.0% |
| $100,000 to $149,999 | 22 | 20.4% |
| $150,000 to $199,999 | 32 | 29.6% |
| $200,000+ | 0 | 0.0% |
Household Income by Householder Age in Cove
The median household income in Cove is $0, with the highest median household income of $173,750 found in the 45 to 64 years age bracket for the primary householder. A total of 56 households (51.8%) fall into this category.
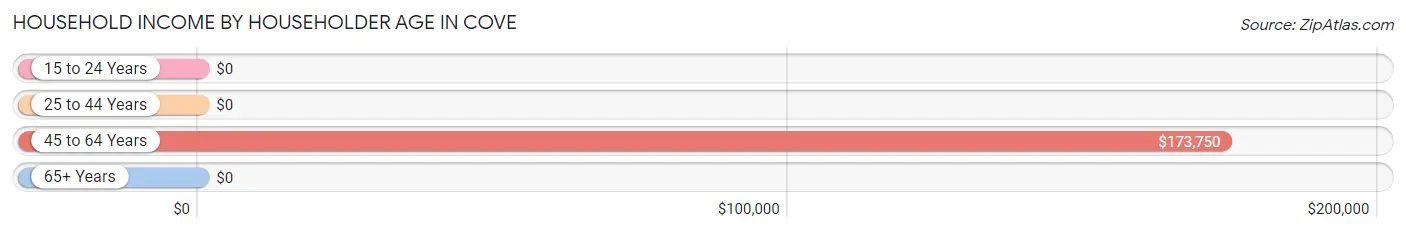
| Income Bracket | # Households | Median Income |
| 15 to 24 Years | 0 (0.0%) | $0 |
| 25 to 44 Years | 33 (30.6%) | $0 |
| 45 to 64 Years | 56 (51.8%) | $173,750 |
| 65+ Years | 19 (17.6%) | $0 |
| Total | 108 (100.0%) | $0 |
Poverty in Cove
Income Below Poverty by Sex and Age in Cove
With 4.3% poverty level for males and 4.2% for females among the residents of Cove, 45 to 54 year old males and 45 to 54 year old females are the most vulnerable to poverty, with 10 males (41.7%) and 10 females (55.6%) in their respective age groups living below the poverty level.
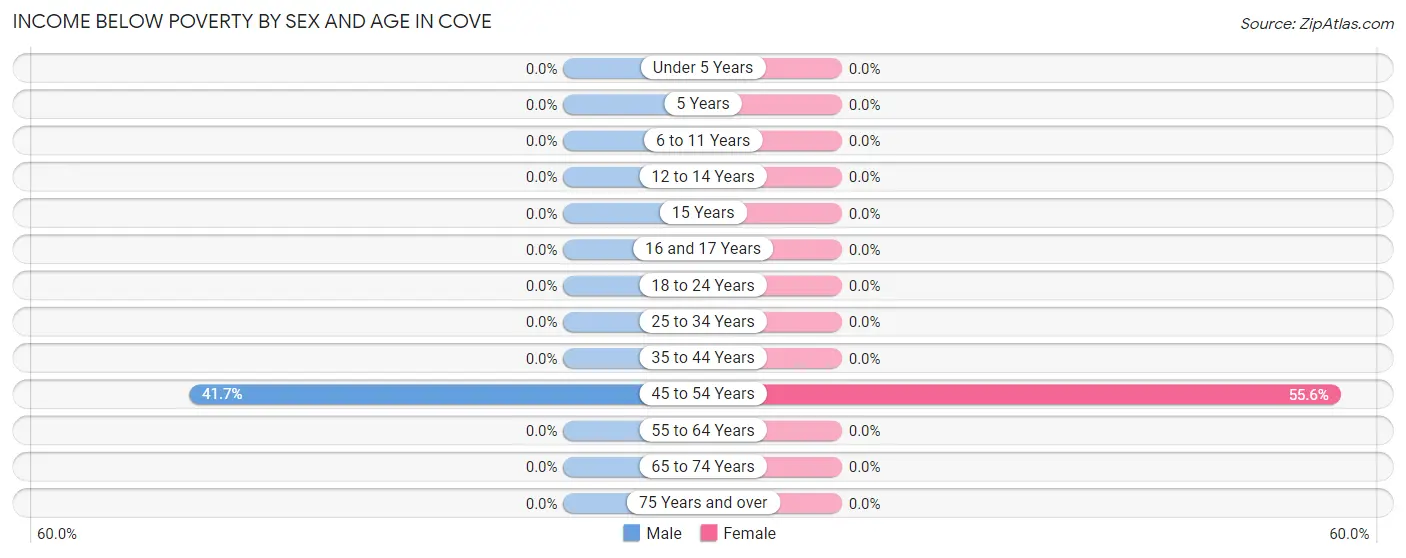
| Age Bracket | Male | Female |
| Under 5 Years | 0 (0.0%) | 0 (0.0%) |
| 5 Years | 0 (0.0%) | 0 (0.0%) |
| 6 to 11 Years | 0 (0.0%) | 0 (0.0%) |
| 12 to 14 Years | 0 (0.0%) | 0 (0.0%) |
| 15 Years | 0 (0.0%) | 0 (0.0%) |
| 16 and 17 Years | 0 (0.0%) | 0 (0.0%) |
| 18 to 24 Years | 0 (0.0%) | 0 (0.0%) |
| 25 to 34 Years | 0 (0.0%) | 0 (0.0%) |
| 35 to 44 Years | 0 (0.0%) | 0 (0.0%) |
| 45 to 54 Years | 10 (41.7%) | 10 (55.6%) |
| 55 to 64 Years | 0 (0.0%) | 0 (0.0%) |
| 65 to 74 Years | 0 (0.0%) | 0 (0.0%) |
| 75 Years and over | 0 (0.0%) | 0 (0.0%) |
| Total | 10 (4.3%) | 10 (4.2%) |
Income Above Poverty by Sex and Age in Cove
According to the poverty statistics in Cove, males aged under 5 years and females aged under 5 years are the age groups that are most secure financially, with 100.0% of males and 100.0% of females in these age groups living above the poverty line.
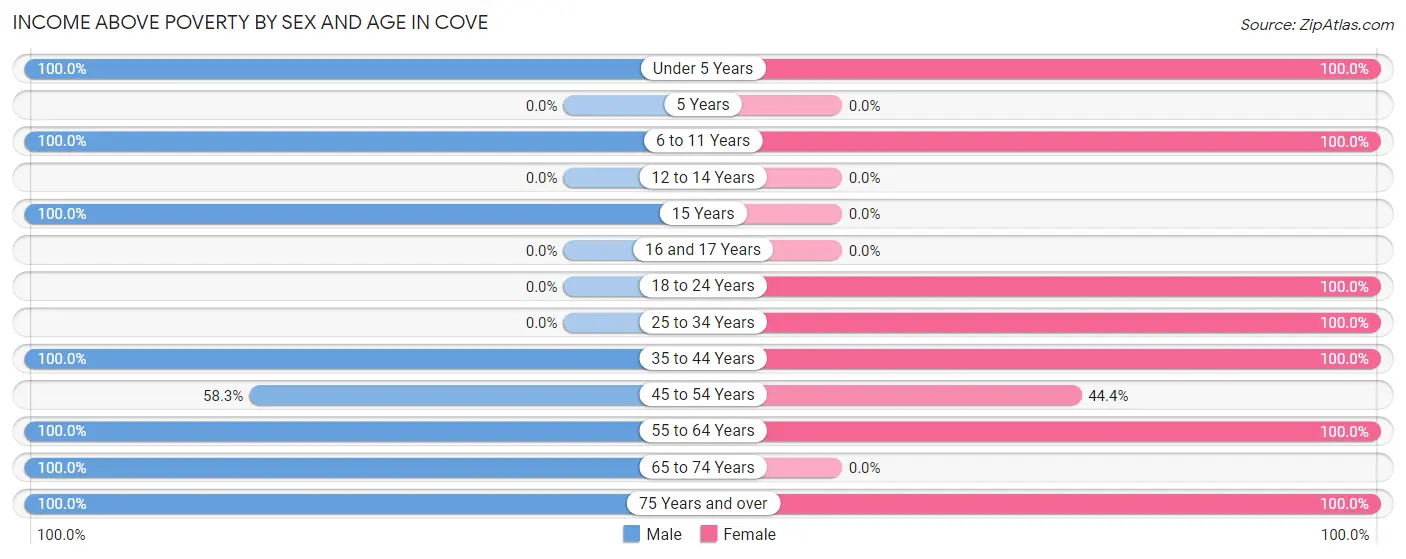
| Age Bracket | Male | Female |
| Under 5 Years | 34 (100.0%) | 52 (100.0%) |
| 5 Years | 0 (0.0%) | 0 (0.0%) |
| 6 to 11 Years | 55 (100.0%) | 47 (100.0%) |
| 12 to 14 Years | 0 (0.0%) | 0 (0.0%) |
| 15 Years | 9 (100.0%) | 0 (0.0%) |
| 16 and 17 Years | 0 (0.0%) | 0 (0.0%) |
| 18 to 24 Years | 0 (0.0%) | 27 (100.0%) |
| 25 to 34 Years | 0 (0.0%) | 32 (100.0%) |
| 35 to 44 Years | 51 (100.0%) | 9 (100.0%) |
| 45 to 54 Years | 14 (58.3%) | 8 (44.4%) |
| 55 to 64 Years | 8 (100.0%) | 48 (100.0%) |
| 65 to 74 Years | 36 (100.0%) | 0 (0.0%) |
| 75 Years and over | 17 (100.0%) | 8 (100.0%) |
| Total | 224 (95.7%) | 231 (95.9%) |
Income Below Poverty Among Married-Couple Families in Cove
The poverty statistics for married-couple families in Cove show that 9.3% or 10 of the total 108 families live below the poverty line. Families with no children have the highest poverty rate of 14.5%, comprising of 10 families. On the other hand, families with 3 or 4 children have the lowest poverty rate of 0.0%, which includes 0 families.
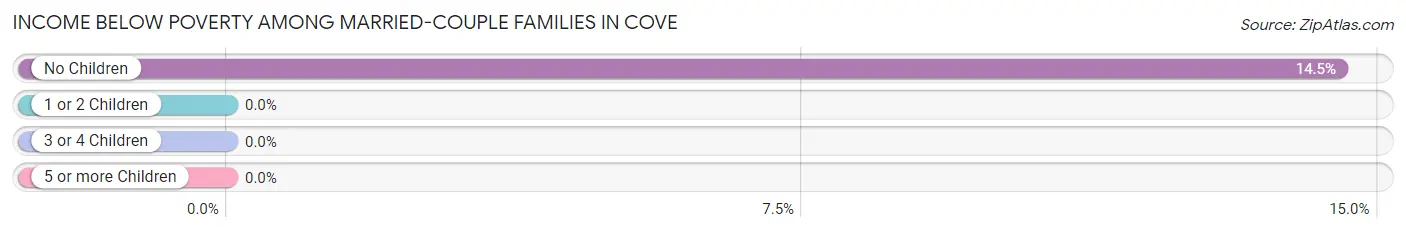
| Children | Above Poverty | Below Poverty |
| No Children | 59 (85.5%) | 10 (14.5%) |
| 1 or 2 Children | 0 (0.0%) | 0 (0.0%) |
| 3 or 4 Children | 23 (100.0%) | 0 (0.0%) |
| 5 or more Children | 16 (100.0%) | 0 (0.0%) |
| Total | 98 (90.7%) | 10 (9.3%) |
Income Below Poverty Among Single-Parent Households in Cove
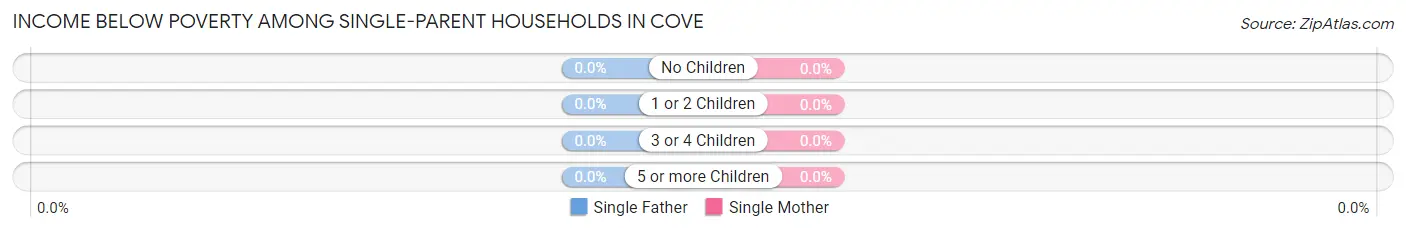
| Children | Single Father | Single Mother |
| No Children | 0 (0.0%) | 0 (0.0%) |
| 1 or 2 Children | 0 (0.0%) | 0 (0.0%) |
| 3 or 4 Children | 0 (0.0%) | 0 (0.0%) |
| 5 or more Children | 0 (0.0%) | 0 (0.0%) |
| Total | 0 (0.0%) | 0 (0.0%) |
Income Below Poverty Among Married-Couple vs Single-Parent Households in Cove
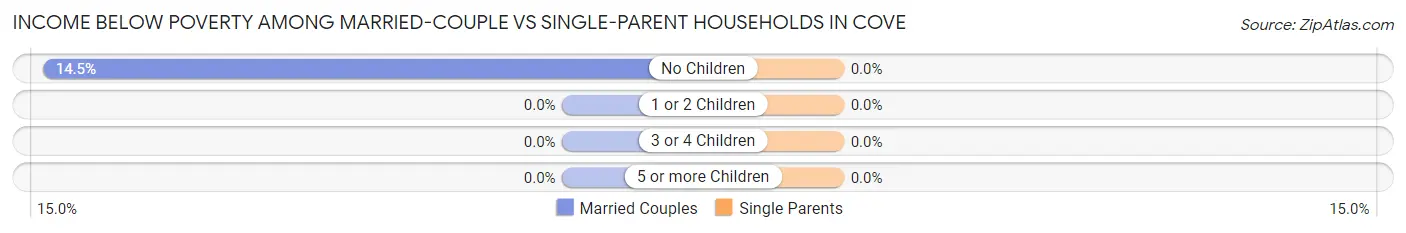
| Children | Married-Couple Families | Single-Parent Households |
| No Children | 10 (14.5%) | 0 (0.0%) |
| 1 or 2 Children | 0 (0.0%) | 0 (0.0%) |
| 3 or 4 Children | 0 (0.0%) | 0 (0.0%) |
| 5 or more Children | 0 (0.0%) | 0 (0.0%) |
| Total | 10 (9.3%) | 0 (0.0%) |
Employment Characteristics in Cove
Employment by Class of Employer in Cove
Among the 166 employed individuals in Cove, private company employees (118 | 71.1%), local government employees (24 | 14.5%), and federal government employees (16 | 9.6%) make up the most common classes of employment.
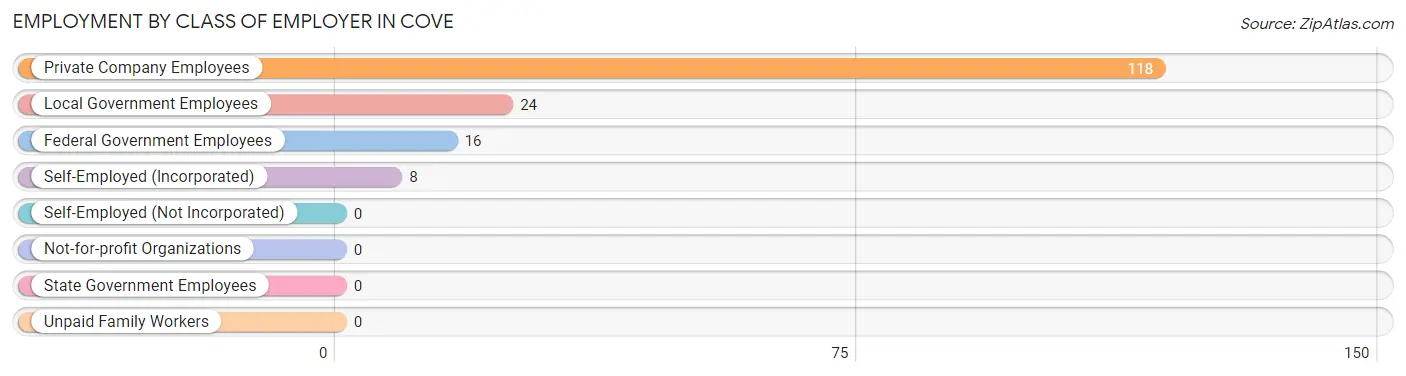
| Employer Class | # Employees | % Employees |
| Private Company Employees | 118 | 71.1% |
| Self-Employed (Incorporated) | 8 | 4.8% |
| Self-Employed (Not Incorporated) | 0 | 0.0% |
| Not-for-profit Organizations | 0 | 0.0% |
| Local Government Employees | 24 | 14.5% |
| State Government Employees | 0 | 0.0% |
| Federal Government Employees | 16 | 9.6% |
| Unpaid Family Workers | 0 | 0.0% |
| Total | 166 | 100.0% |
Employment Status by Age in Cove
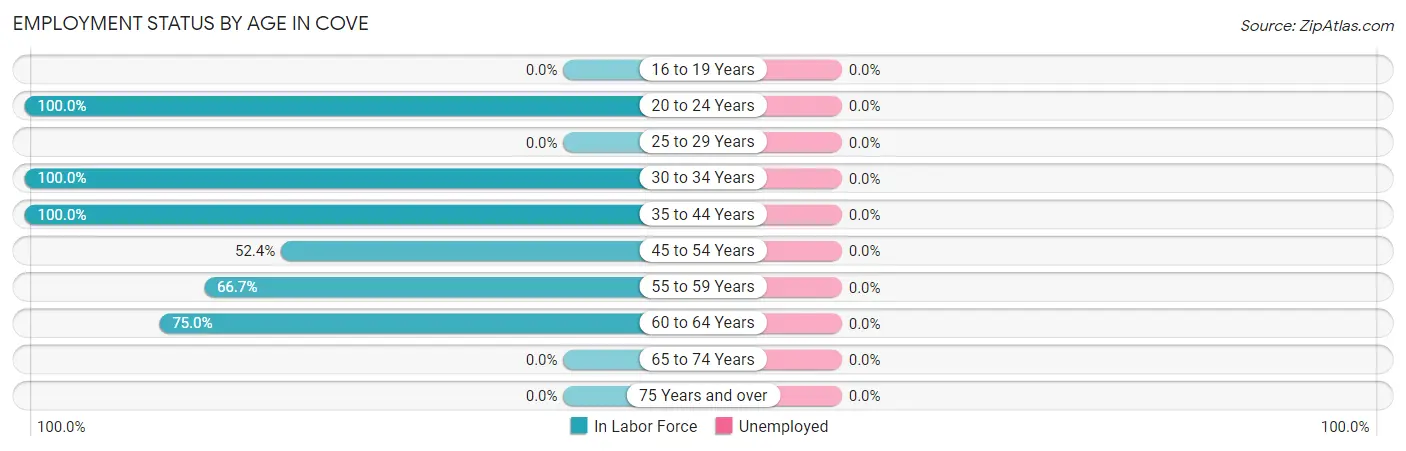
| Age Bracket | In Labor Force | Unemployed |
| 16 to 19 Years | 0 (0.0%) | 0 (0.0%) |
| 20 to 24 Years | 12 (100.0%) | 0 (0.0%) |
| 25 to 29 Years | 0 (0.0%) | 0 (0.0%) |
| 30 to 34 Years | 32 (100.0%) | 0 (0.0%) |
| 35 to 44 Years | 60 (100.0%) | 0 (0.0%) |
| 45 to 54 Years | 22 (52.4%) | 0 (0.0%) |
| 55 to 59 Years | 16 (66.7%) | 0 (0.0%) |
| 60 to 64 Years | 24 (75.0%) | 0 (0.0%) |
| 65 to 74 Years | 0 (0.0%) | 0 (0.0%) |
| 75 Years and over | 0 (0.0%) | 0 (0.0%) |
| Total | 166 (59.7%) | 0 (0.0%) |
Employment Status by Educational Attainment in Cove
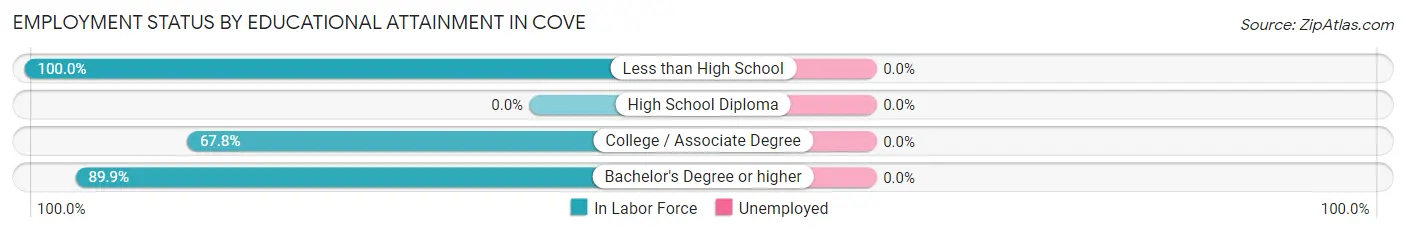
| Educational Attainment | In Labor Force | Unemployed |
| Less than High School | 24 (100.0%) | 0 (0.0%) |
| High School Diploma | 0 (0.0%) | 0 (0.0%) |
| College / Associate Degree | 59 (67.8%) | 0 (0.0%) |
| Bachelor's Degree or higher | 71 (89.9%) | 0 (0.0%) |
| Total | 154 (81.1%) | 0 (0.0%) |
Employment Occupations by Sex in Cove
Management, Business, Science and Arts Occupations
The most common Management, Business, Science and Arts occupations in Cove are Management (39 | 23.5%), Community & Social Service (33 | 19.9%), Education Instruction & Library (33 | 19.9%), Computers, Engineering & Science (8 | 4.8%), and Life, Physical & Social Science (8 | 4.8%).
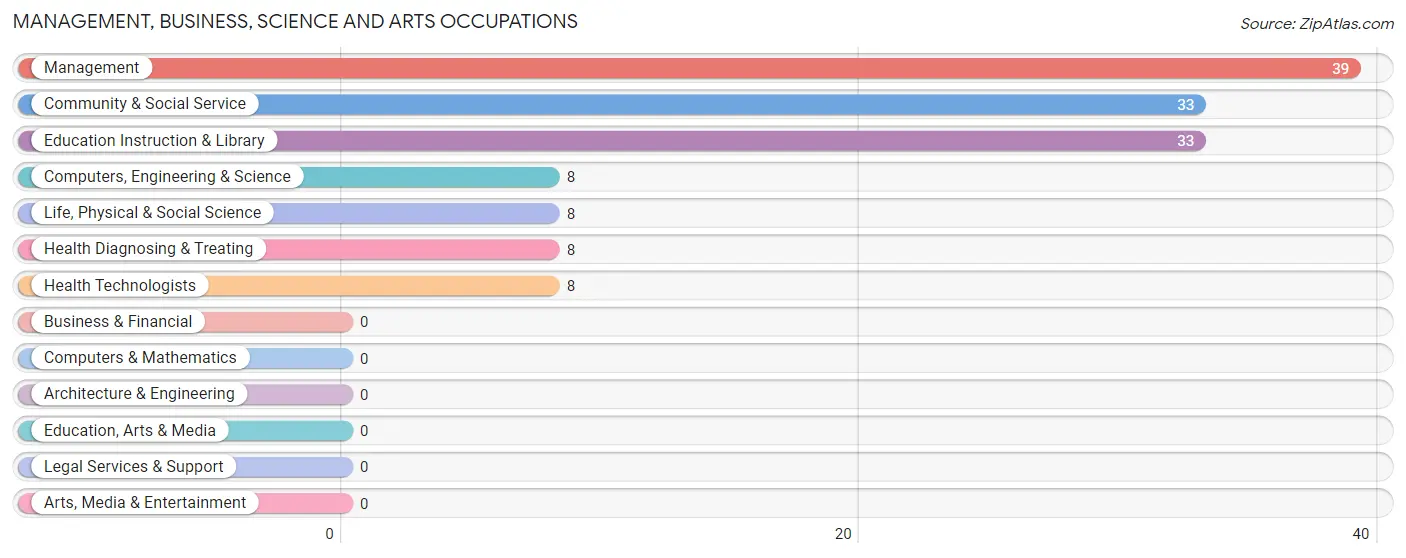
Management, Business, Science and Arts Occupations by Sex
Within the Management, Business, Science and Arts occupations in Cove, the most male-oriented occupations are Computers, Engineering & Science (100.0%), Life, Physical & Social Science (100.0%), and Management (61.5%), while the most female-oriented occupations are Community & Social Service (100.0%), Education Instruction & Library (100.0%), and Health Diagnosing & Treating (100.0%).
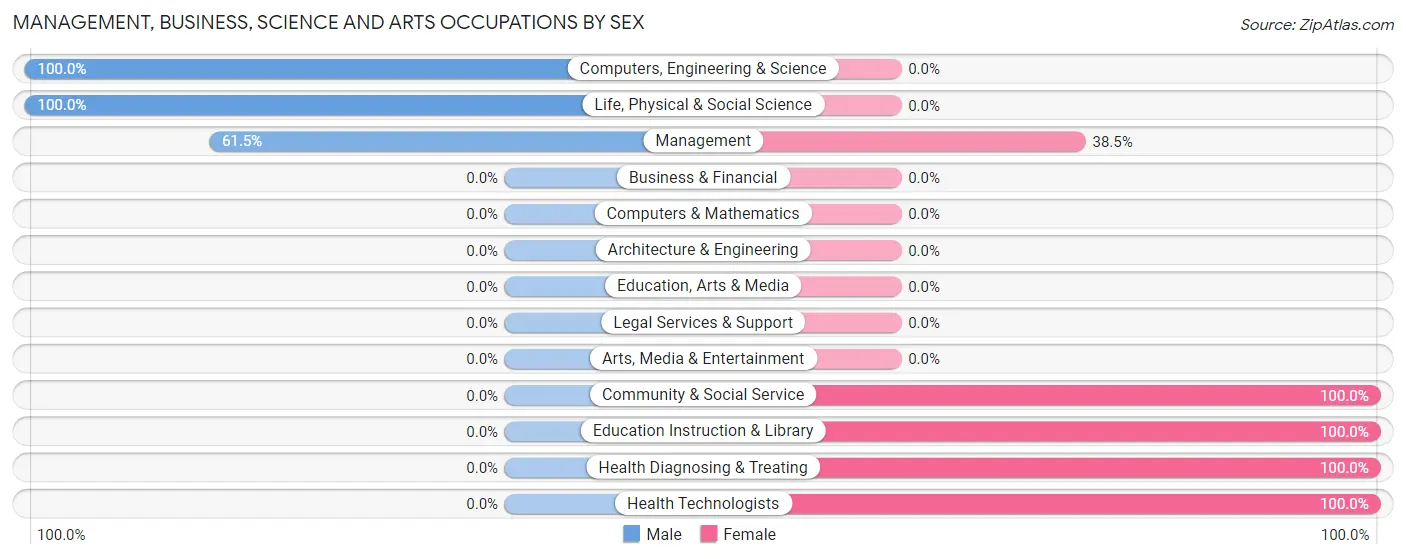
| Occupation | Male | Female |
| Management | 24 (61.5%) | 15 (38.5%) |
| Business & Financial | 0 (0.0%) | 0 (0.0%) |
| Computers, Engineering & Science | 8 (100.0%) | 0 (0.0%) |
| Computers & Mathematics | 0 (0.0%) | 0 (0.0%) |
| Architecture & Engineering | 0 (0.0%) | 0 (0.0%) |
| Life, Physical & Social Science | 8 (100.0%) | 0 (0.0%) |
| Community & Social Service | 0 (0.0%) | 33 (100.0%) |
| Education, Arts & Media | 0 (0.0%) | 0 (0.0%) |
| Legal Services & Support | 0 (0.0%) | 0 (0.0%) |
| Education Instruction & Library | 0 (0.0%) | 33 (100.0%) |
| Arts, Media & Entertainment | 0 (0.0%) | 0 (0.0%) |
| Health Diagnosing & Treating | 0 (0.0%) | 8 (100.0%) |
| Health Technologists | 0 (0.0%) | 8 (100.0%) |
| Total (Category) | 32 (36.4%) | 56 (63.6%) |
| Total (Overall) | 73 (44.0%) | 93 (56.0%) |
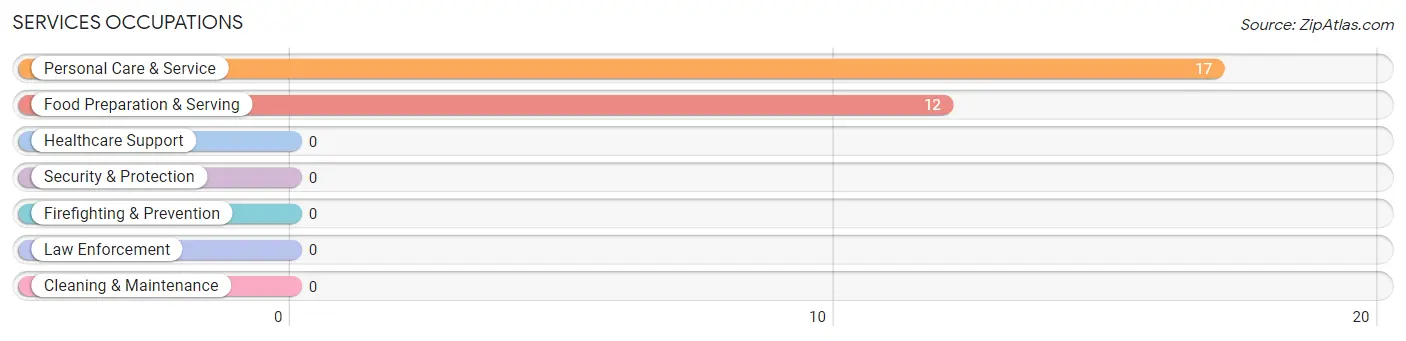
Services Occupations
The most common Services occupations in Cove are Personal Care & Service (17 | 10.2%), and Food Preparation & Serving (12 | 7.2%).
Services Occupations by Sex
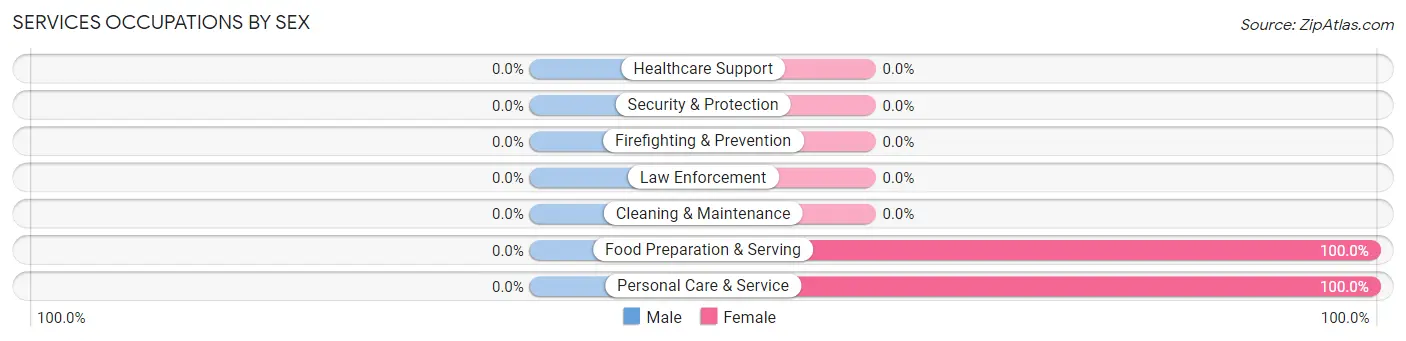
| Occupation | Male | Female |
| Healthcare Support | 0 (0.0%) | 0 (0.0%) |
| Security & Protection | 0 (0.0%) | 0 (0.0%) |
| Firefighting & Prevention | 0 (0.0%) | 0 (0.0%) |
| Law Enforcement | 0 (0.0%) | 0 (0.0%) |
| Food Preparation & Serving | 0 (0.0%) | 12 (100.0%) |
| Cleaning & Maintenance | 0 (0.0%) | 0 (0.0%) |
| Personal Care & Service | 0 (0.0%) | 17 (100.0%) |
| Total (Category) | 0 (0.0%) | 29 (100.0%) |
| Total (Overall) | 73 (44.0%) | 93 (56.0%) |
Sales and Office Occupations
The most common Sales and Office occupations in Cove are , and Sales & Related (11 | 6.6%).
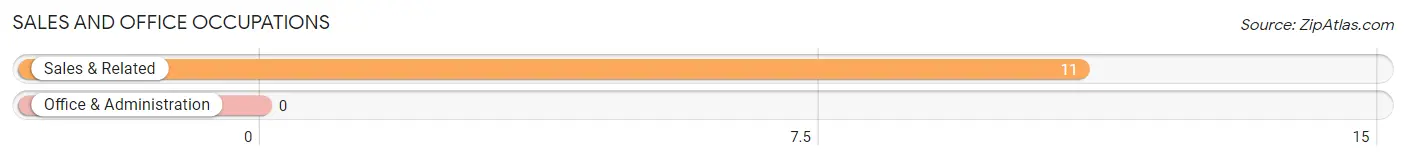
Sales and Office Occupations by Sex
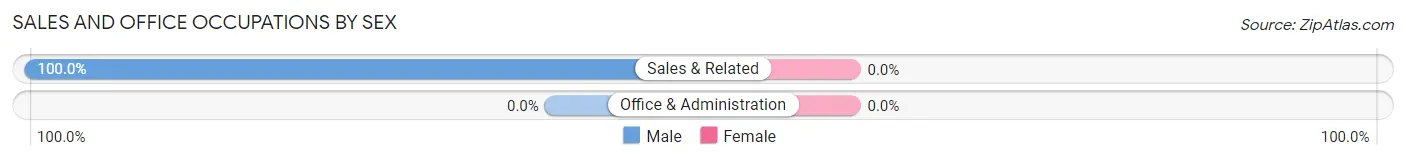
| Occupation | Male | Female |
| Sales & Related | 11 (100.0%) | 0 (0.0%) |
| Office & Administration | 0 (0.0%) | 0 (0.0%) |
| Total (Category) | 11 (100.0%) | 0 (0.0%) |
| Total (Overall) | 73 (44.0%) | 93 (56.0%) |
Natural Resources, Construction and Maintenance Occupations
The most common Natural Resources, Construction and Maintenance occupations in Cove are , and Construction & Extraction (6 | 3.6%).
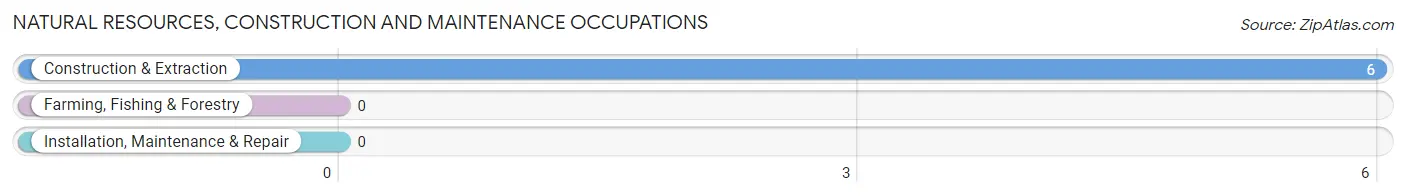
Natural Resources, Construction and Maintenance Occupations by Sex
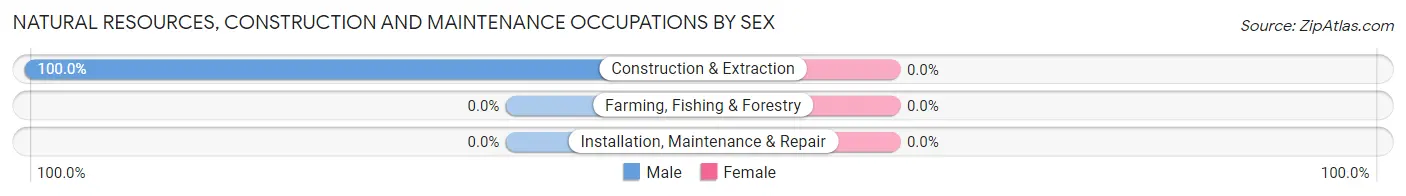
| Occupation | Male | Female |
| Farming, Fishing & Forestry | 0 (0.0%) | 0 (0.0%) |
| Construction & Extraction | 6 (100.0%) | 0 (0.0%) |
| Installation, Maintenance & Repair | 0 (0.0%) | 0 (0.0%) |
| Total (Category) | 6 (100.0%) | 0 (0.0%) |
| Total (Overall) | 73 (44.0%) | 93 (56.0%) |
Production, Transportation and Moving Occupations
The most common Production, Transportation and Moving occupations in Cove are , and Production (32 | 19.3%).
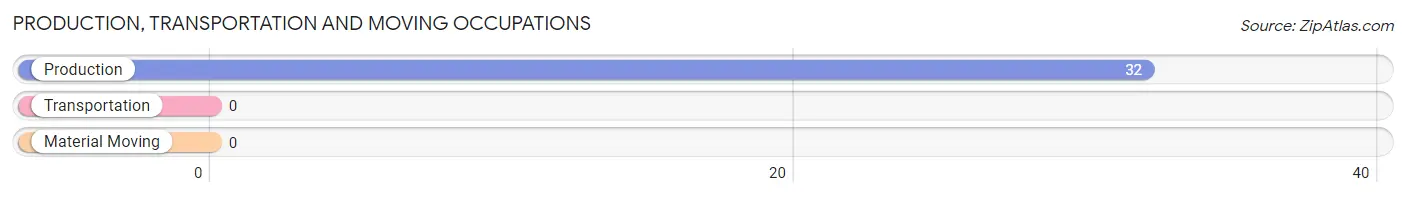
Production, Transportation and Moving Occupations by Sex
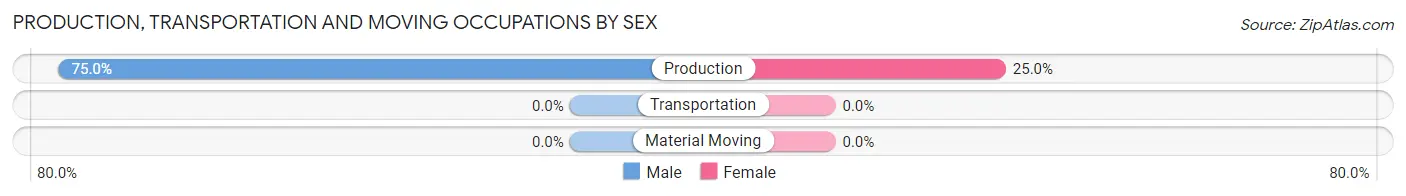
| Occupation | Male | Female |
| Production | 24 (75.0%) | 8 (25.0%) |
| Transportation | 0 (0.0%) | 0 (0.0%) |
| Material Moving | 0 (0.0%) | 0 (0.0%) |
| Total (Category) | 24 (75.0%) | 8 (25.0%) |
| Total (Overall) | 73 (44.0%) | 93 (56.0%) |
Employment Industries by Sex in Cove
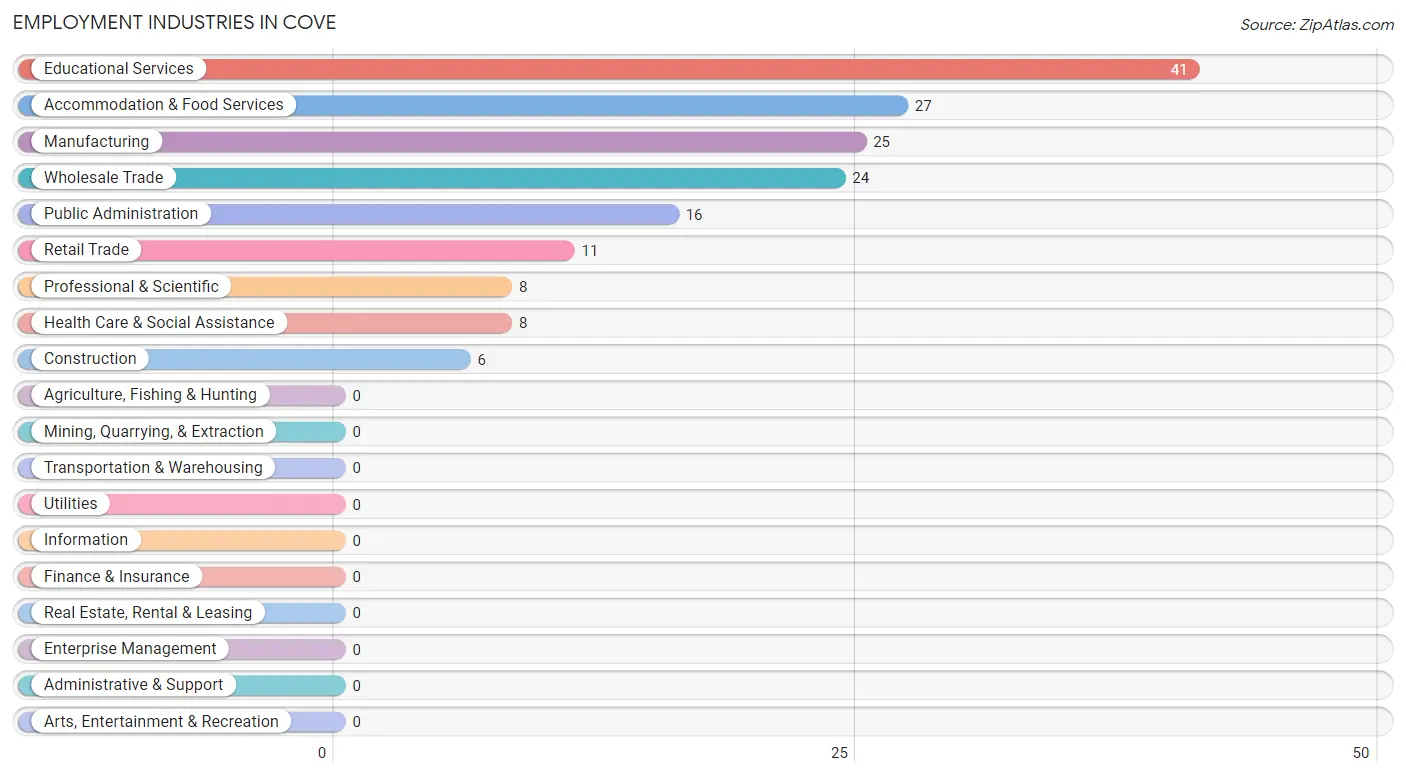
Employment Industries in Cove
The major employment industries in Cove include Educational Services (41 | 24.7%), Accommodation & Food Services (27 | 16.3%), Manufacturing (25 | 15.1%), Wholesale Trade (24 | 14.5%), and Public Administration (16 | 9.6%).
Employment Industries by Sex in Cove
The Cove industries that see more men than women are Construction (100.0%), Wholesale Trade (100.0%), and Retail Trade (100.0%), whereas the industries that tend to have a higher number of women are Manufacturing (100.0%), Health Care & Social Assistance (100.0%), and Accommodation & Food Services (100.0%).
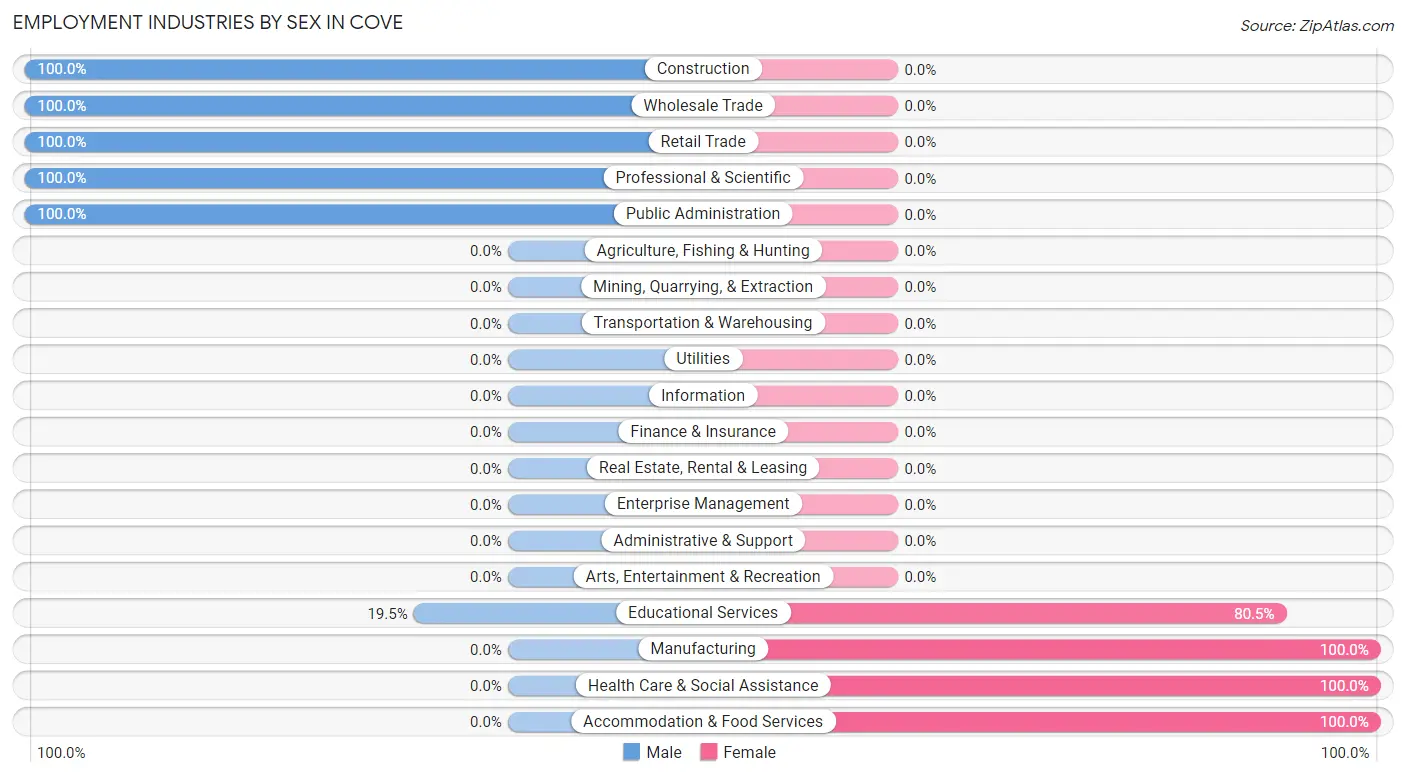
| Industry | Male | Female |
| Agriculture, Fishing & Hunting | 0 (0.0%) | 0 (0.0%) |
| Mining, Quarrying, & Extraction | 0 (0.0%) | 0 (0.0%) |
| Construction | 6 (100.0%) | 0 (0.0%) |
| Manufacturing | 0 (0.0%) | 25 (100.0%) |
| Wholesale Trade | 24 (100.0%) | 0 (0.0%) |
| Retail Trade | 11 (100.0%) | 0 (0.0%) |
| Transportation & Warehousing | 0 (0.0%) | 0 (0.0%) |
| Utilities | 0 (0.0%) | 0 (0.0%) |
| Information | 0 (0.0%) | 0 (0.0%) |
| Finance & Insurance | 0 (0.0%) | 0 (0.0%) |
| Real Estate, Rental & Leasing | 0 (0.0%) | 0 (0.0%) |
| Professional & Scientific | 8 (100.0%) | 0 (0.0%) |
| Enterprise Management | 0 (0.0%) | 0 (0.0%) |
| Administrative & Support | 0 (0.0%) | 0 (0.0%) |
| Educational Services | 8 (19.5%) | 33 (80.5%) |
| Health Care & Social Assistance | 0 (0.0%) | 8 (100.0%) |
| Arts, Entertainment & Recreation | 0 (0.0%) | 0 (0.0%) |
| Accommodation & Food Services | 0 (0.0%) | 27 (100.0%) |
| Public Administration | 16 (100.0%) | 0 (0.0%) |
| Total | 73 (44.0%) | 93 (56.0%) |
Education in Cove
School Enrollment in Cove
The most common levels of schooling among the 168 students in Cove are elementary school (70 | 41.7%), college / undergraduate (25 | 14.9%), and high school (24 | 14.3%).
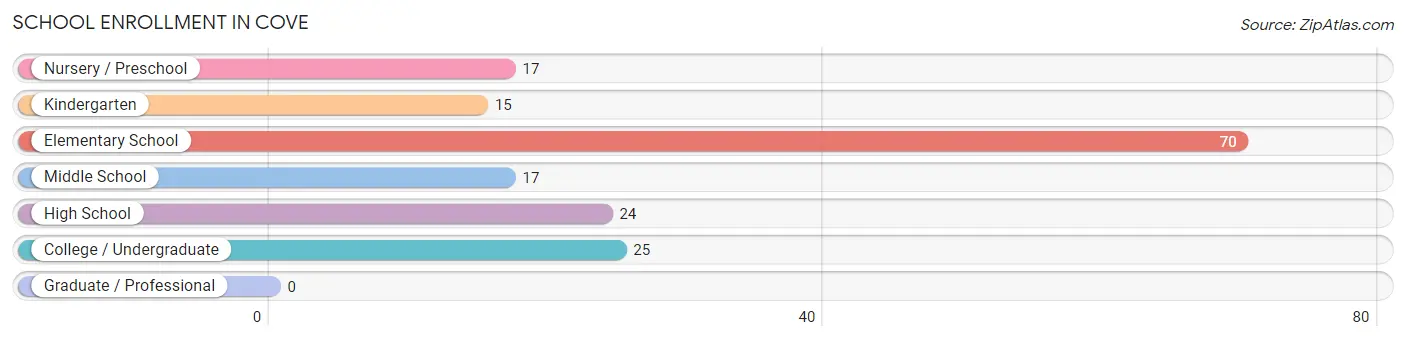
| School Level | # Students | % Students |
| Nursery / Preschool | 17 | 10.1% |
| Kindergarten | 15 | 8.9% |
| Elementary School | 70 | 41.7% |
| Middle School | 17 | 10.1% |
| High School | 24 | 14.3% |
| College / Undergraduate | 25 | 14.9% |
| Graduate / Professional | 0 | 0.0% |
| Total | 168 | 100.0% |
School Enrollment by Age by Funding Source in Cove
Out of a total of 168 students who are enrolled in schools in Cove, 17 (10.1%) attend a private institution, while the remaining 151 (89.9%) are enrolled in public schools. The age group of 3 to 4 year olds has the highest likelihood of being enrolled in private schools, with 17 (100.0% in the age bracket) enrolled. Conversely, the age group of 5 to 9 year old has the lowest likelihood of being enrolled in a private school, with 75 (100.0% in the age bracket) attending a public institution.
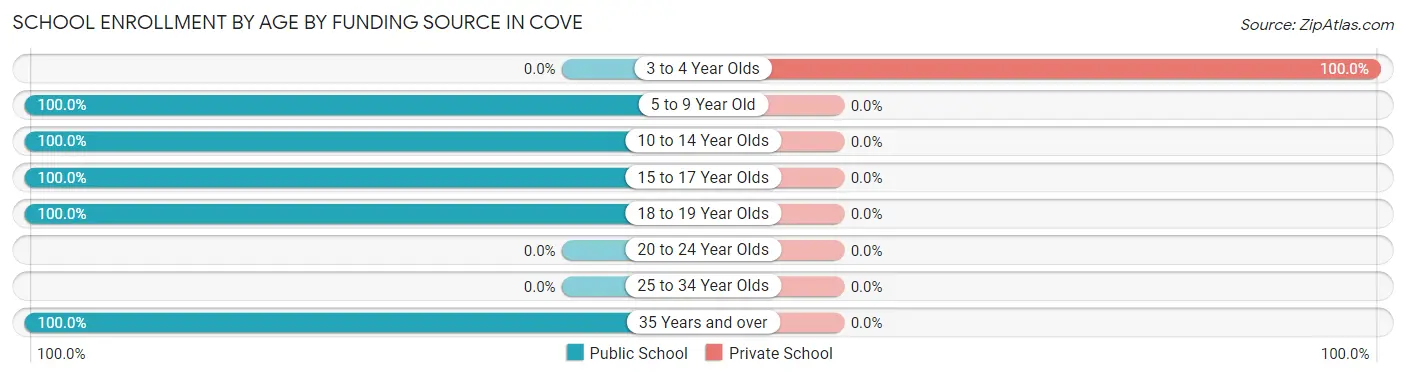
| Age Bracket | Public School | Private School |
| 3 to 4 Year Olds | 0 (0.0%) | 17 (100.0%) |
| 5 to 9 Year Old | 75 (100.0%) | 0 (0.0%) |
| 10 to 14 Year Olds | 27 (100.0%) | 0 (0.0%) |
| 15 to 17 Year Olds | 9 (100.0%) | 0 (0.0%) |
| 18 to 19 Year Olds | 15 (100.0%) | 0 (0.0%) |
| 20 to 24 Year Olds | 0 (0.0%) | 0 (0.0%) |
| 25 to 34 Year Olds | 0 (0.0%) | 0 (0.0%) |
| 35 Years and over | 25 (100.0%) | 0 (0.0%) |
| Total | 151 (89.9%) | 17 (10.1%) |
Educational Attainment by Field of Study in Cove
Education (50 | 47.6%), physical & health sciences (17 | 16.2%), bio, nature & agricultural (8 | 7.6%), science & technology (8 | 7.6%), and business (8 | 7.6%) are the most common fields of study among 105 individuals in Cove who have obtained a bachelor's degree or higher.
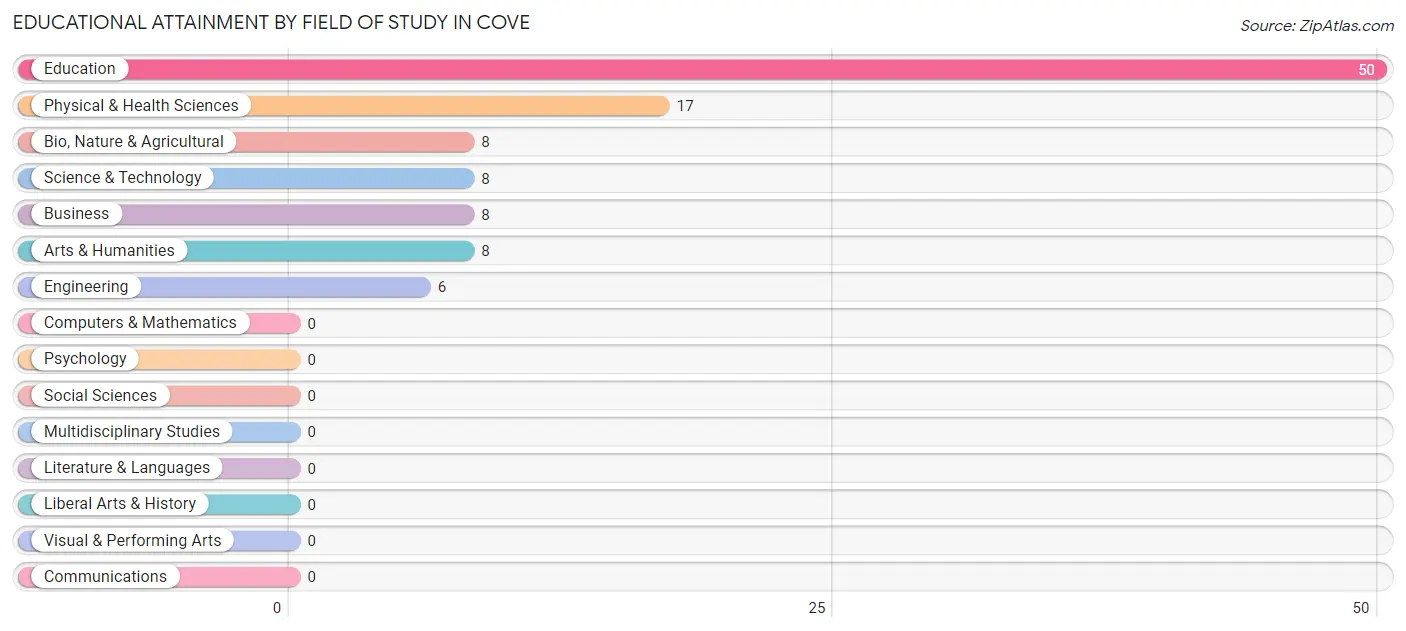
| Field of Study | # Graduates | % Graduates |
| Computers & Mathematics | 0 | 0.0% |
| Bio, Nature & Agricultural | 8 | 7.6% |
| Physical & Health Sciences | 17 | 16.2% |
| Psychology | 0 | 0.0% |
| Social Sciences | 0 | 0.0% |
| Engineering | 6 | 5.7% |
| Multidisciplinary Studies | 0 | 0.0% |
| Science & Technology | 8 | 7.6% |
| Business | 8 | 7.6% |
| Education | 50 | 47.6% |
| Literature & Languages | 0 | 0.0% |
| Liberal Arts & History | 0 | 0.0% |
| Visual & Performing Arts | 0 | 0.0% |
| Communications | 0 | 0.0% |
| Arts & Humanities | 8 | 7.6% |
| Total | 105 | 100.0% |
Transportation & Commute in Cove
Vehicle Availability by Sex in Cove
The most prevalent vehicle ownership categories in Cove are males with 4 vehicles (25, accounting for 34.3%) and females with 4 vehicles (29, making up 26.9%).
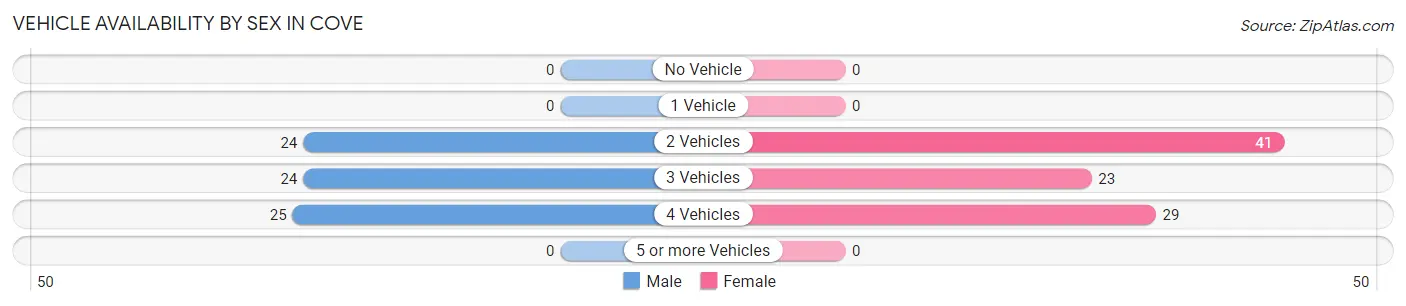
| Vehicles Available | Male | Female |
| No Vehicle | 0 (0.0%) | 0 (0.0%) |
| 1 Vehicle | 0 (0.0%) | 0 (0.0%) |
| 2 Vehicles | 24 (32.9%) | 41 (44.1%) |
| 3 Vehicles | 24 (32.9%) | 23 (24.7%) |
| 4 Vehicles | 25 (34.3%) | 29 (31.2%) |
| 5 or more Vehicles | 0 (0.0%) | 0 (0.0%) |
| Total | 73 (100.0%) | 93 (100.0%) |
Commute Time in Cove
The most frequently occuring commute durations in Cove are 10 to 14 minutes (51 commuters, 34.0%), 15 to 19 minutes (51 commuters, 34.0%), and 90 or more minutes (32 commuters, 21.3%).
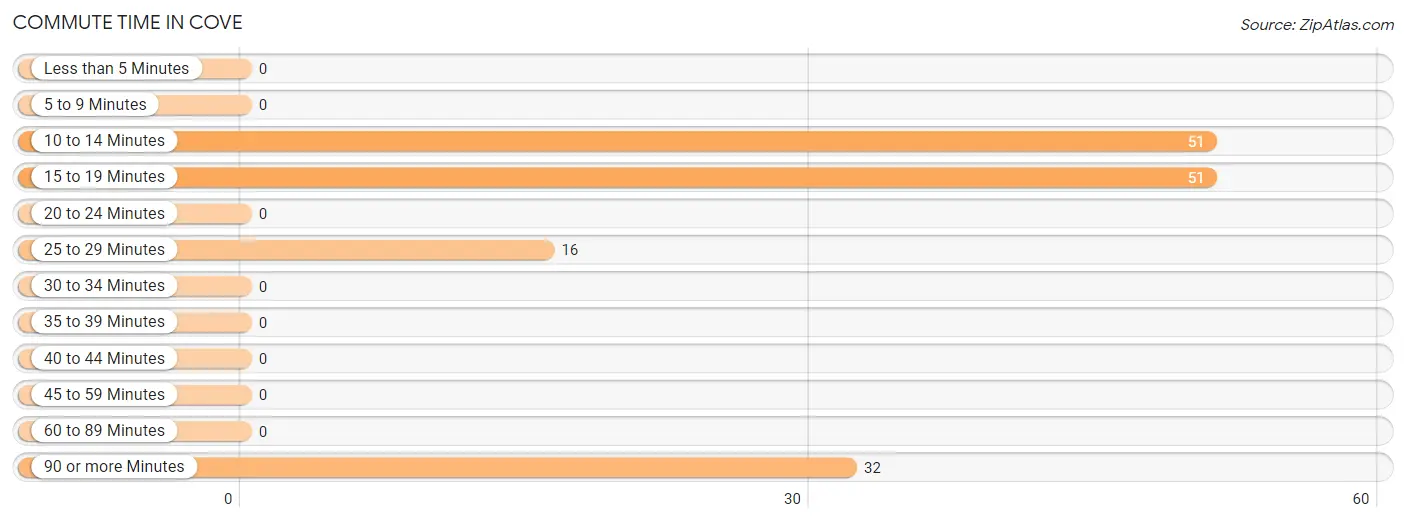
| Commute Time | # Commuters | % Commuters |
| Less than 5 Minutes | 0 | 0.0% |
| 5 to 9 Minutes | 0 | 0.0% |
| 10 to 14 Minutes | 51 | 34.0% |
| 15 to 19 Minutes | 51 | 34.0% |
| 20 to 24 Minutes | 0 | 0.0% |
| 25 to 29 Minutes | 16 | 10.7% |
| 30 to 34 Minutes | 0 | 0.0% |
| 35 to 39 Minutes | 0 | 0.0% |
| 40 to 44 Minutes | 0 | 0.0% |
| 45 to 59 Minutes | 0 | 0.0% |
| 60 to 89 Minutes | 0 | 0.0% |
| 90 or more Minutes | 32 | 21.3% |
Commute Time by Sex in Cove
The most common commute times in Cove are 90 or more minutes (32 commuters, 49.2%) for males and 15 to 19 minutes (51 commuters, 60.0%) for females.
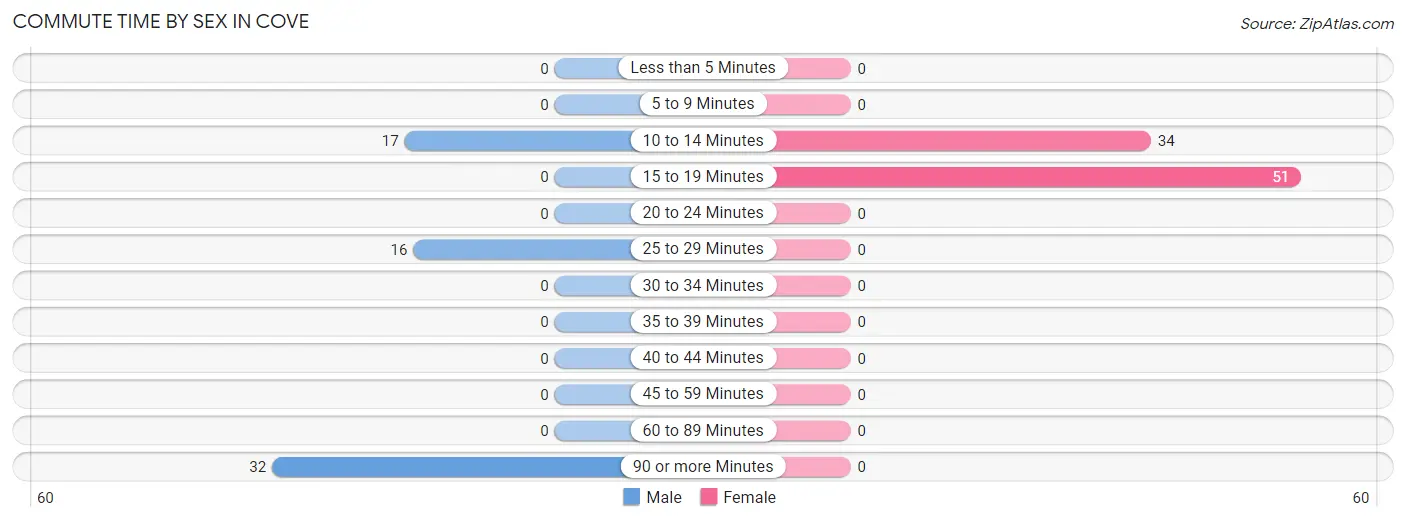
| Commute Time | Male | Female |
| Less than 5 Minutes | 0 (0.0%) | 0 (0.0%) |
| 5 to 9 Minutes | 0 (0.0%) | 0 (0.0%) |
| 10 to 14 Minutes | 17 (26.2%) | 34 (40.0%) |
| 15 to 19 Minutes | 0 (0.0%) | 51 (60.0%) |
| 20 to 24 Minutes | 0 (0.0%) | 0 (0.0%) |
| 25 to 29 Minutes | 16 (24.6%) | 0 (0.0%) |
| 30 to 34 Minutes | 0 (0.0%) | 0 (0.0%) |
| 35 to 39 Minutes | 0 (0.0%) | 0 (0.0%) |
| 40 to 44 Minutes | 0 (0.0%) | 0 (0.0%) |
| 45 to 59 Minutes | 0 (0.0%) | 0 (0.0%) |
| 60 to 89 Minutes | 0 (0.0%) | 0 (0.0%) |
| 90 or more Minutes | 32 (49.2%) | 0 (0.0%) |
Time of Departure to Work by Sex in Cove
The most frequent times of departure to work in Cove are 12:00 AM to 4:59 AM (24, 36.9%) for males and 7:00 AM to 7:29 AM (39, 45.9%) for females.
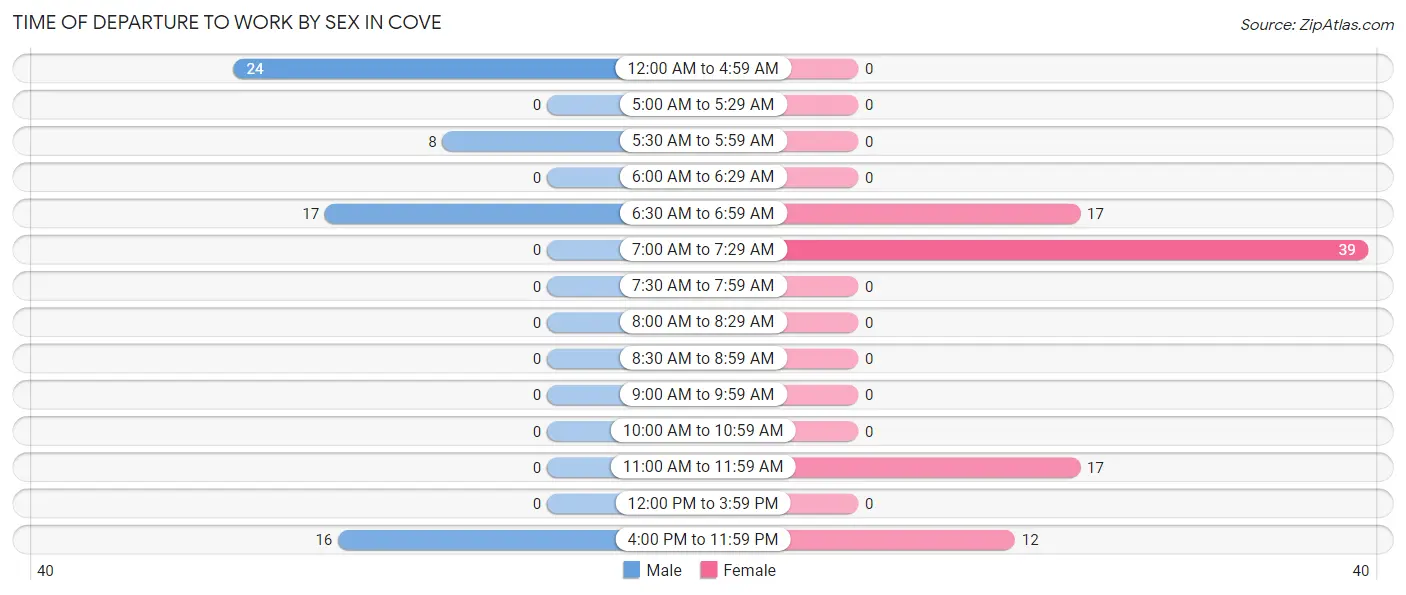
| Time of Departure | Male | Female |
| 12:00 AM to 4:59 AM | 24 (36.9%) | 0 (0.0%) |
| 5:00 AM to 5:29 AM | 0 (0.0%) | 0 (0.0%) |
| 5:30 AM to 5:59 AM | 8 (12.3%) | 0 (0.0%) |
| 6:00 AM to 6:29 AM | 0 (0.0%) | 0 (0.0%) |
| 6:30 AM to 6:59 AM | 17 (26.2%) | 17 (20.0%) |
| 7:00 AM to 7:29 AM | 0 (0.0%) | 39 (45.9%) |
| 7:30 AM to 7:59 AM | 0 (0.0%) | 0 (0.0%) |
| 8:00 AM to 8:29 AM | 0 (0.0%) | 0 (0.0%) |
| 8:30 AM to 8:59 AM | 0 (0.0%) | 0 (0.0%) |
| 9:00 AM to 9:59 AM | 0 (0.0%) | 0 (0.0%) |
| 10:00 AM to 10:59 AM | 0 (0.0%) | 0 (0.0%) |
| 11:00 AM to 11:59 AM | 0 (0.0%) | 17 (20.0%) |
| 12:00 PM to 3:59 PM | 0 (0.0%) | 0 (0.0%) |
| 4:00 PM to 11:59 PM | 16 (24.6%) | 12 (14.1%) |
| Total | 65 (100.0%) | 85 (100.0%) |
Housing Occupancy in Cove
Occupancy by Ownership in Cove
Of the total 108 dwellings in Cove, owner-occupied units account for 102 (94.4%), while renter-occupied units make up 6 (5.6%).
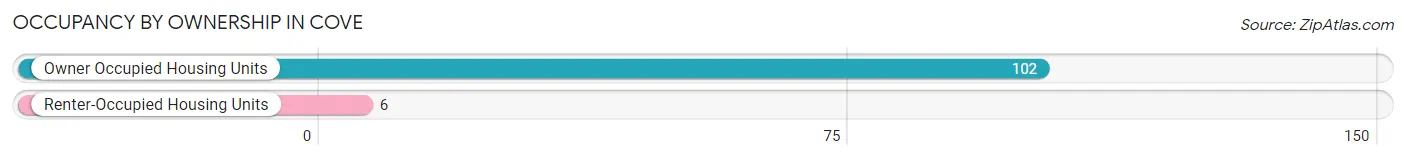
| Occupancy | # Housing Units | % Housing Units |
| Owner Occupied Housing Units | 102 | 94.4% |
| Renter-Occupied Housing Units | 6 | 5.6% |
| Total Occupied Housing Units | 108 | 100.0% |
Occupancy by Household Size in Cove
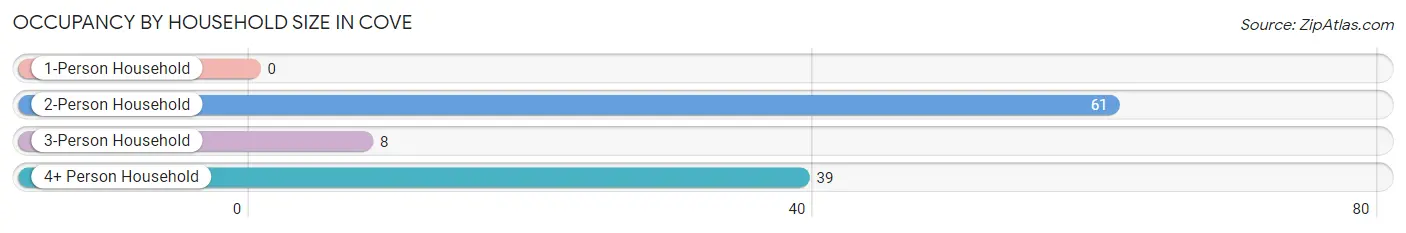
| Household Size | # Housing Units | % Housing Units |
| 1-Person Household | 0 | 0.0% |
| 2-Person Household | 61 | 56.5% |
| 3-Person Household | 8 | 7.4% |
| 4+ Person Household | 39 | 36.1% |
| Total Housing Units | 108 | 100.0% |
Occupancy by Ownership by Household Size in Cove
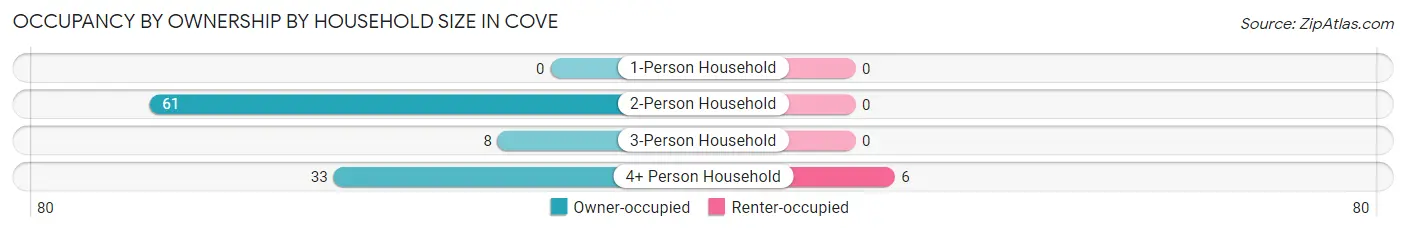
| Household Size | Owner-occupied | Renter-occupied |
| 1-Person Household | 0 (0.0%) | 0 (0.0%) |
| 2-Person Household | 61 (100.0%) | 0 (0.0%) |
| 3-Person Household | 8 (100.0%) | 0 (0.0%) |
| 4+ Person Household | 33 (84.6%) | 6 (15.4%) |
| Total Housing Units | 102 (94.4%) | 6 (5.6%) |
Occupancy by Educational Attainment in Cove
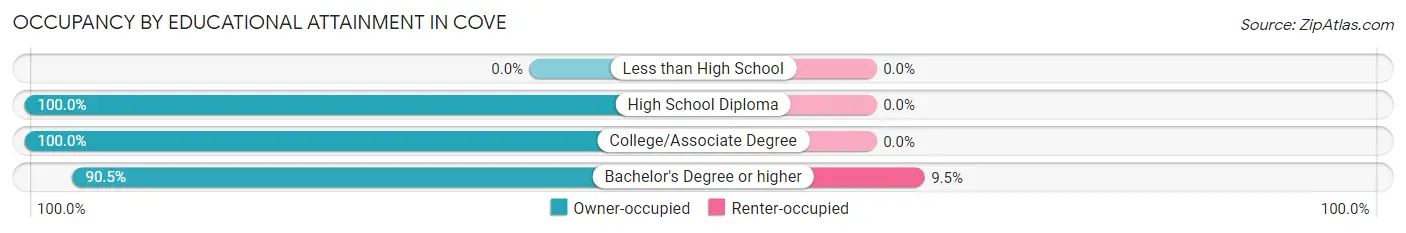
| Household Size | Owner-occupied | Renter-occupied |
| Less than High School | 0 (0.0%) | 0 (0.0%) |
| High School Diploma | 9 (100.0%) | 0 (0.0%) |
| College/Associate Degree | 36 (100.0%) | 0 (0.0%) |
| Bachelor's Degree or higher | 57 (90.5%) | 6 (9.5%) |
Occupancy by Age of Householder in Cove
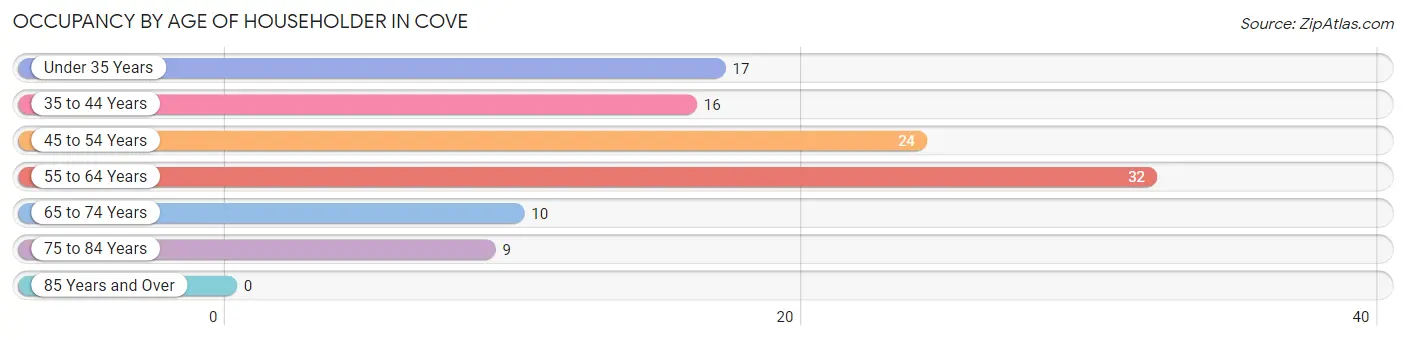
| Age Bracket | # Households | % Households |
| Under 35 Years | 17 | 15.7% |
| 35 to 44 Years | 16 | 14.8% |
| 45 to 54 Years | 24 | 22.2% |
| 55 to 64 Years | 32 | 29.6% |
| 65 to 74 Years | 10 | 9.3% |
| 75 to 84 Years | 9 | 8.3% |
| 85 Years and Over | 0 | 0.0% |
| Total | 108 | 100.0% |
Housing Finances in Cove
Median Income by Occupancy in Cove
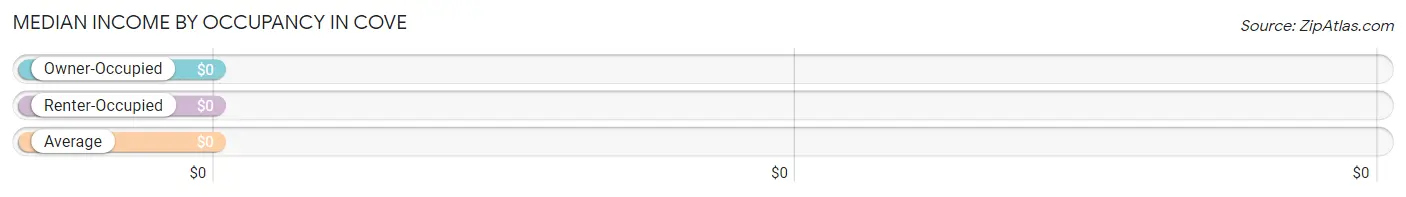
| Occupancy Type | # Households | Median Income |
| Owner-Occupied | 102 (94.4%) | $0 |
| Renter-Occupied | 6 (5.6%) | $0 |
| Average | 108 (100.0%) | $0 |
Occupancy by Householder Income Bracket in Cove
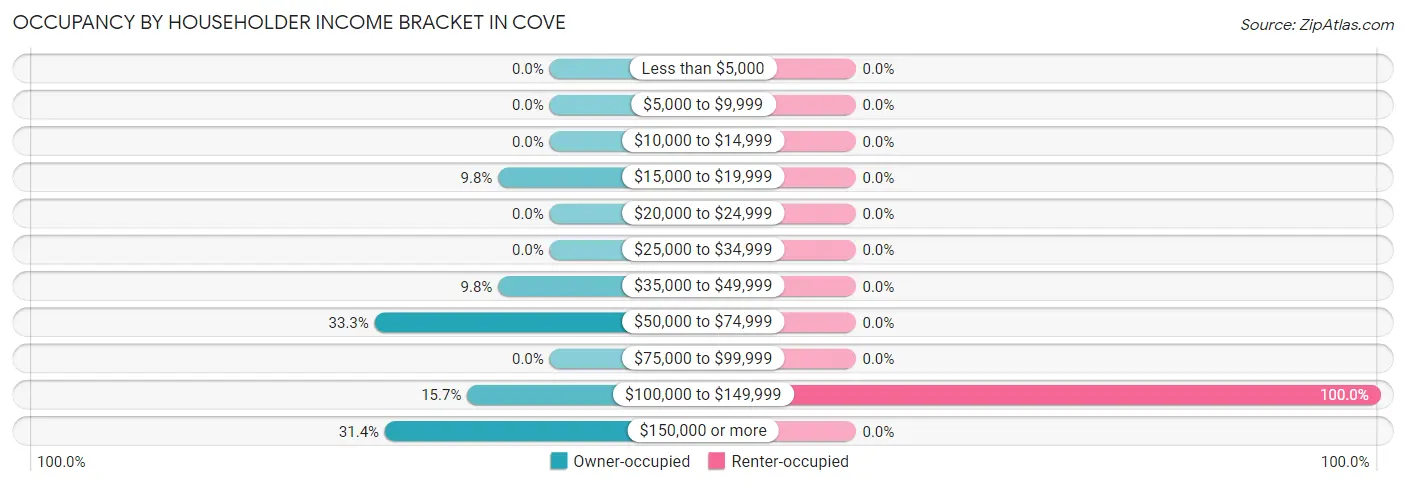
| Income Bracket | Owner-occupied | Renter-occupied |
| Less than $5,000 | 0 (0.0%) | 0 (0.0%) |
| $5,000 to $9,999 | 0 (0.0%) | 0 (0.0%) |
| $10,000 to $14,999 | 0 (0.0%) | 0 (0.0%) |
| $15,000 to $19,999 | 10 (9.8%) | 0 (0.0%) |
| $20,000 to $24,999 | 0 (0.0%) | 0 (0.0%) |
| $25,000 to $34,999 | 0 (0.0%) | 0 (0.0%) |
| $35,000 to $49,999 | 10 (9.8%) | 0 (0.0%) |
| $50,000 to $74,999 | 34 (33.3%) | 0 (0.0%) |
| $75,000 to $99,999 | 0 (0.0%) | 0 (0.0%) |
| $100,000 to $149,999 | 16 (15.7%) | 6 (100.0%) |
| $150,000 or more | 32 (31.4%) | 0 (0.0%) |
| Total | 102 (100.0%) | 6 (100.0%) |
Monthly Housing Cost Tiers in Cove
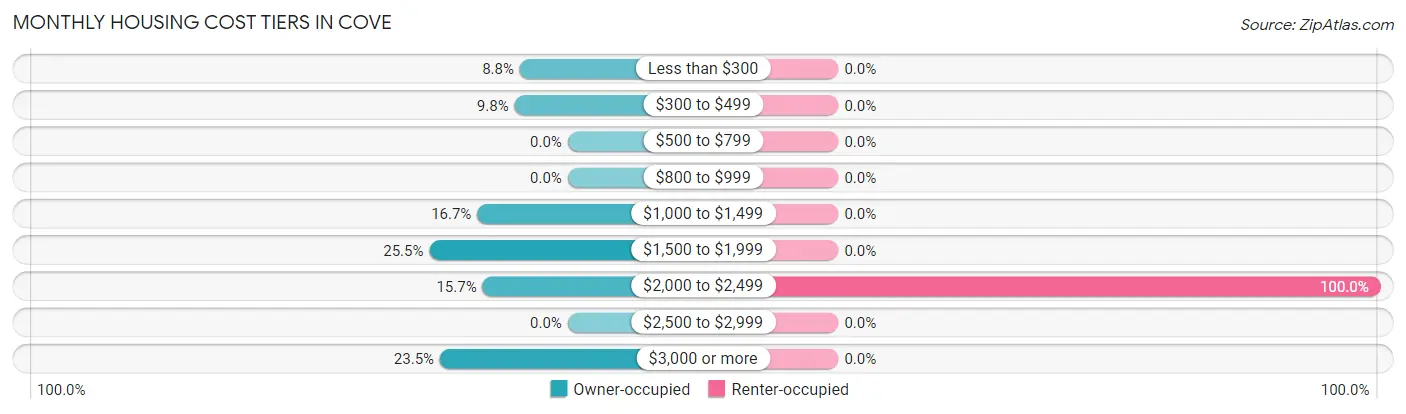
| Monthly Cost | Owner-occupied | Renter-occupied |
| Less than $300 | 9 (8.8%) | 0 (0.0%) |
| $300 to $499 | 10 (9.8%) | 0 (0.0%) |
| $500 to $799 | 0 (0.0%) | 0 (0.0%) |
| $800 to $999 | 0 (0.0%) | 0 (0.0%) |
| $1,000 to $1,499 | 17 (16.7%) | 0 (0.0%) |
| $1,500 to $1,999 | 26 (25.5%) | 0 (0.0%) |
| $2,000 to $2,499 | 16 (15.7%) | 6 (100.0%) |
| $2,500 to $2,999 | 0 (0.0%) | 0 (0.0%) |
| $3,000 or more | 24 (23.5%) | 0 (0.0%) |
| Total | 102 (100.0%) | 6 (100.0%) |
Physical Housing Characteristics in Cove
Housing Structures in Cove
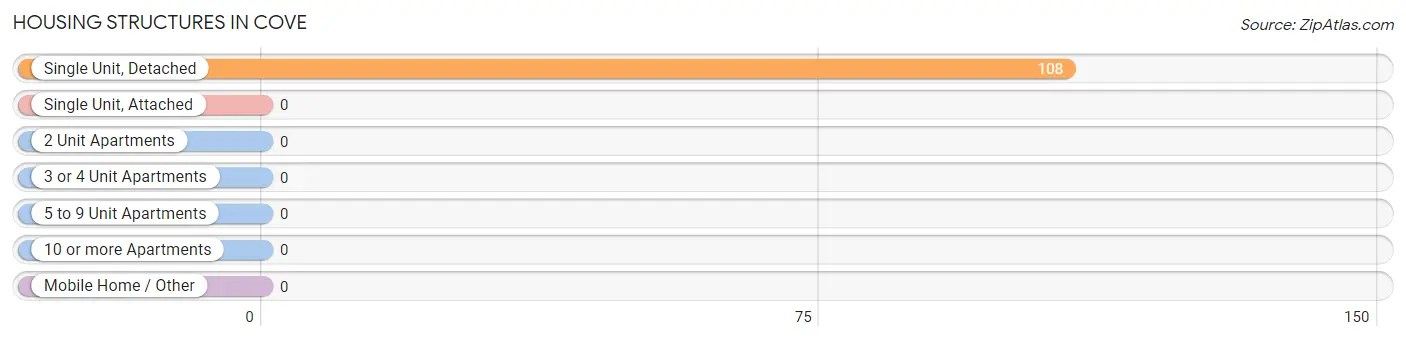
| Structure Type | # Housing Units | % Housing Units |
| Single Unit, Detached | 108 | 100.0% |
| Single Unit, Attached | 0 | 0.0% |
| 2 Unit Apartments | 0 | 0.0% |
| 3 or 4 Unit Apartments | 0 | 0.0% |
| 5 to 9 Unit Apartments | 0 | 0.0% |
| 10 or more Apartments | 0 | 0.0% |
| Mobile Home / Other | 0 | 0.0% |
| Total | 108 | 100.0% |
Housing Structures by Occupancy in Cove
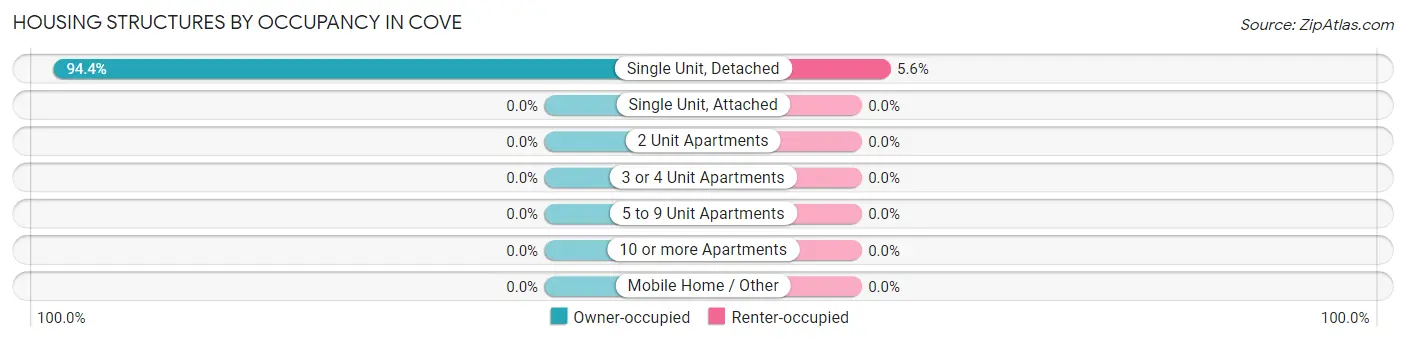
| Structure Type | Owner-occupied | Renter-occupied |
| Single Unit, Detached | 102 (94.4%) | 6 (5.6%) |
| Single Unit, Attached | 0 (0.0%) | 0 (0.0%) |
| 2 Unit Apartments | 0 (0.0%) | 0 (0.0%) |
| 3 or 4 Unit Apartments | 0 (0.0%) | 0 (0.0%) |
| 5 to 9 Unit Apartments | 0 (0.0%) | 0 (0.0%) |
| 10 or more Apartments | 0 (0.0%) | 0 (0.0%) |
| Mobile Home / Other | 0 (0.0%) | 0 (0.0%) |
| Total | 102 (94.4%) | 6 (5.6%) |
Housing Structures by Number of Rooms in Cove
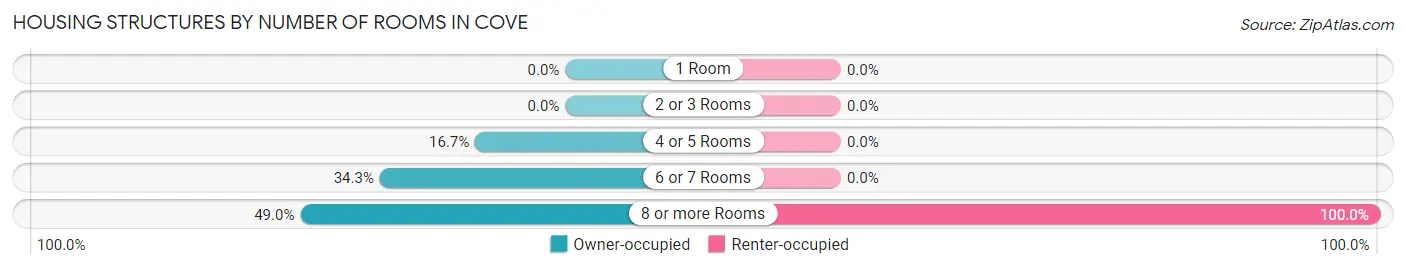
| Number of Rooms | Owner-occupied | Renter-occupied |
| 1 Room | 0 (0.0%) | 0 (0.0%) |
| 2 or 3 Rooms | 0 (0.0%) | 0 (0.0%) |
| 4 or 5 Rooms | 17 (16.7%) | 0 (0.0%) |
| 6 or 7 Rooms | 35 (34.3%) | 0 (0.0%) |
| 8 or more Rooms | 50 (49.0%) | 6 (100.0%) |
| Total | 102 (100.0%) | 6 (100.0%) |
Housing Structure by Heating Type in Cove
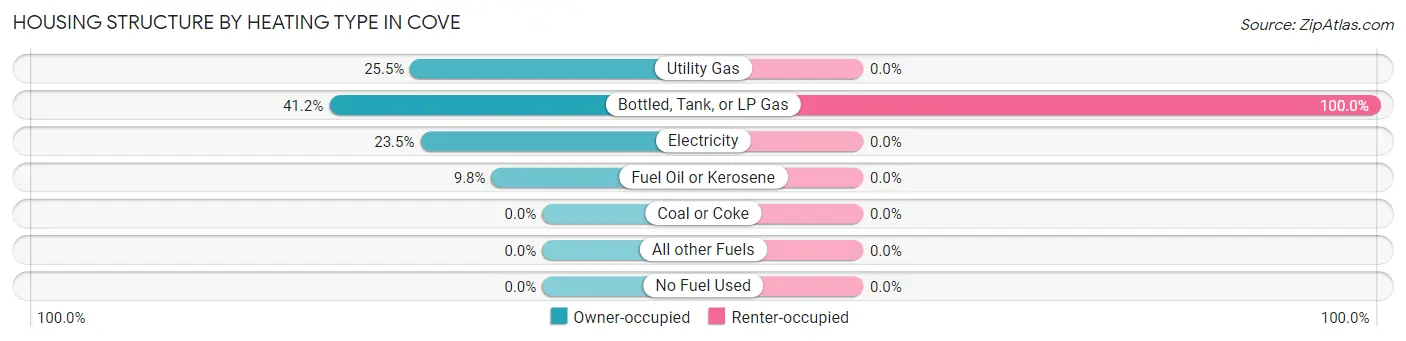
| Heating Type | Owner-occupied | Renter-occupied |
| Utility Gas | 26 (25.5%) | 0 (0.0%) |
| Bottled, Tank, or LP Gas | 42 (41.2%) | 6 (100.0%) |
| Electricity | 24 (23.5%) | 0 (0.0%) |
| Fuel Oil or Kerosene | 10 (9.8%) | 0 (0.0%) |
| Coal or Coke | 0 (0.0%) | 0 (0.0%) |
| All other Fuels | 0 (0.0%) | 0 (0.0%) |
| No Fuel Used | 0 (0.0%) | 0 (0.0%) |
| Total | 102 (100.0%) | 6 (100.0%) |
Household Vehicle Usage in Cove
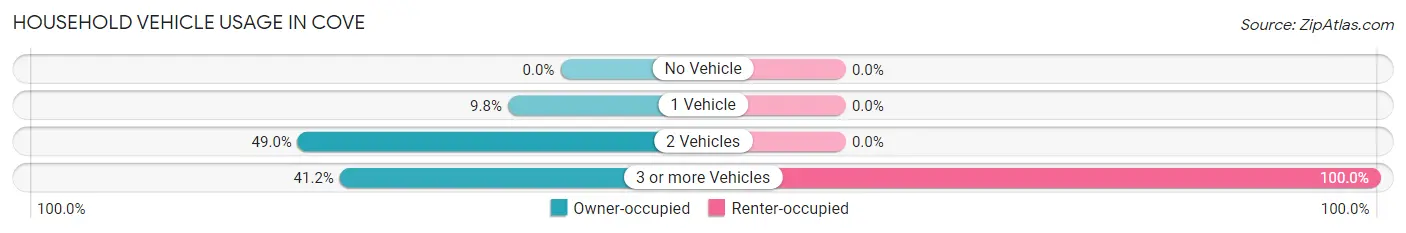
| Vehicles per Household | Owner-occupied | Renter-occupied |
| No Vehicle | 0 (0.0%) | 0 (0.0%) |
| 1 Vehicle | 10 (9.8%) | 0 (0.0%) |
| 2 Vehicles | 50 (49.0%) | 0 (0.0%) |
| 3 or more Vehicles | 42 (41.2%) | 6 (100.0%) |
| Total | 102 (100.0%) | 6 (100.0%) |
Real Estate & Mortgages in Cove
Real Estate and Mortgage Overview in Cove
| Characteristic | Without Mortgage | With Mortgage |
| Housing Units | 19 | 83 |
| Median Property Value | - | - |
| Median Household Income | - | - |
| Monthly Housing Costs | - | - |
| Real Estate Taxes | - | - |
Property Value by Mortgage Status in Cove
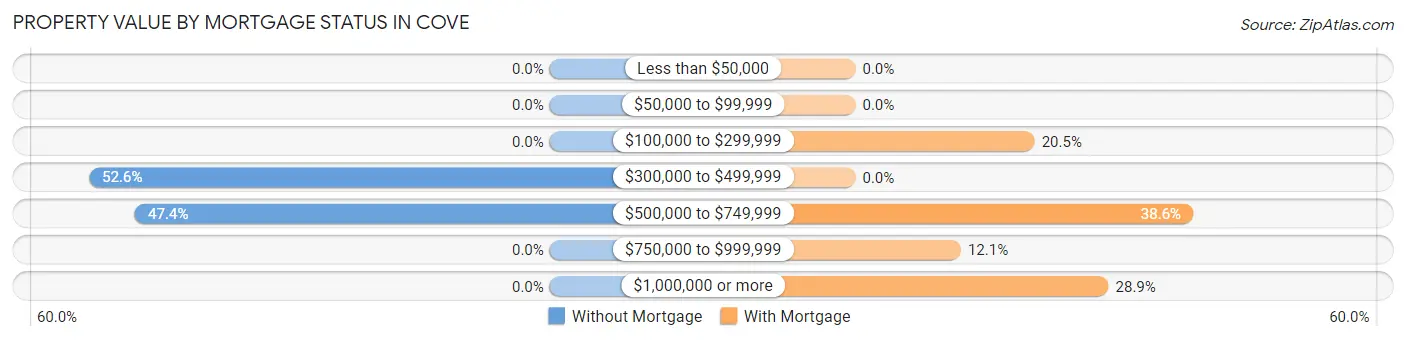
| Property Value | Without Mortgage | With Mortgage |
| Less than $50,000 | 0 (0.0%) | 0 (0.0%) |
| $50,000 to $99,999 | 0 (0.0%) | 0 (0.0%) |
| $100,000 to $299,999 | 0 (0.0%) | 17 (20.5%) |
| $300,000 to $499,999 | 10 (52.6%) | 0 (0.0%) |
| $500,000 to $749,999 | 9 (47.4%) | 32 (38.6%) |
| $750,000 to $999,999 | 0 (0.0%) | 10 (12.0%) |
| $1,000,000 or more | 0 (0.0%) | 24 (28.9%) |
| Total | 19 (100.0%) | 83 (100.0%) |
Household Income by Mortgage Status in Cove
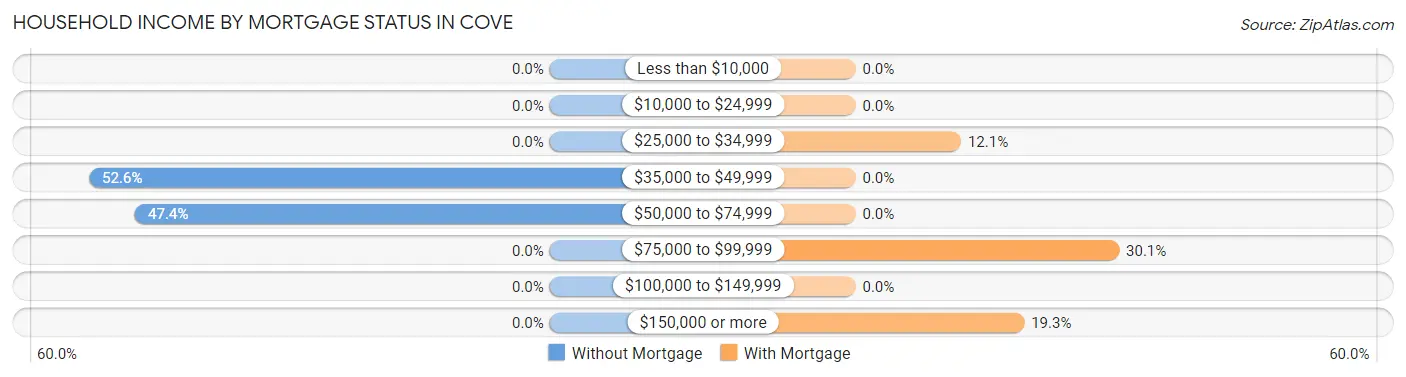
| Household Income | Without Mortgage | With Mortgage |
| Less than $10,000 | 0 (0.0%) | 0 (0.0%) |
| $10,000 to $24,999 | 0 (0.0%) | 0 (0.0%) |
| $25,000 to $34,999 | 0 (0.0%) | 10 (12.0%) |
| $35,000 to $49,999 | 10 (52.6%) | 0 (0.0%) |
| $50,000 to $74,999 | 9 (47.4%) | 0 (0.0%) |
| $75,000 to $99,999 | 0 (0.0%) | 25 (30.1%) |
| $100,000 to $149,999 | 0 (0.0%) | 0 (0.0%) |
| $150,000 or more | 0 (0.0%) | 16 (19.3%) |
| Total | 19 (100.0%) | 83 (100.0%) |
Property Value to Household Income Ratio in Cove
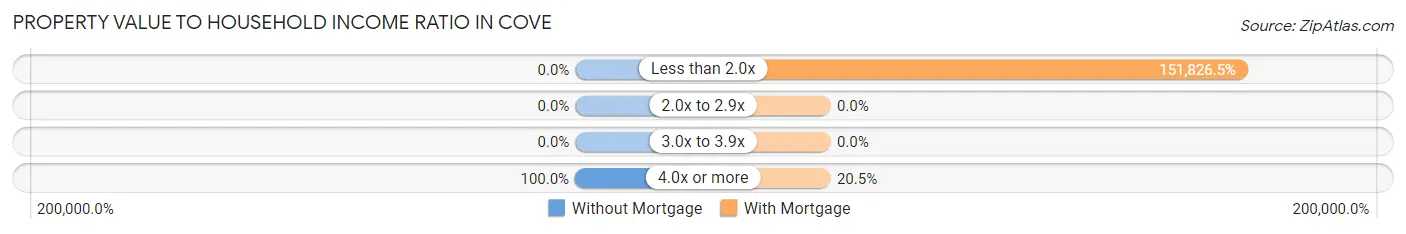
| Value-to-Income Ratio | Without Mortgage | With Mortgage |
| Less than 2.0x | 0 (0.0%) | 126,016 (151,826.5%) |
| 2.0x to 2.9x | 0 (0.0%) | 0 (0.0%) |
| 3.0x to 3.9x | 0 (0.0%) | 0 (0.0%) |
| 4.0x or more | 19 (100.0%) | 17 (20.5%) |
| Total | 19 (100.0%) | 83 (100.0%) |
Real Estate Taxes by Mortgage Status in Cove
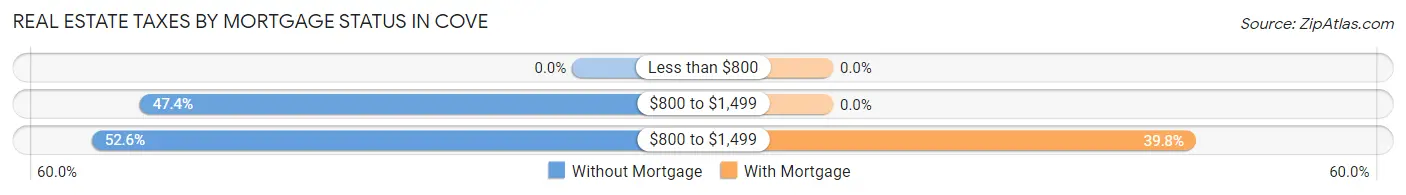
| Property Taxes | Without Mortgage | With Mortgage |
| Less than $800 | 0 (0.0%) | 0 (0.0%) |
| $800 to $1,499 | 9 (47.4%) | 0 (0.0%) |
| $800 to $1,499 | 10 (52.6%) | 33 (39.8%) |
| Total | 19 (100.0%) | 83 (100.0%) |
Health & Disability in Cove
Health Insurance Coverage by Age in Cove
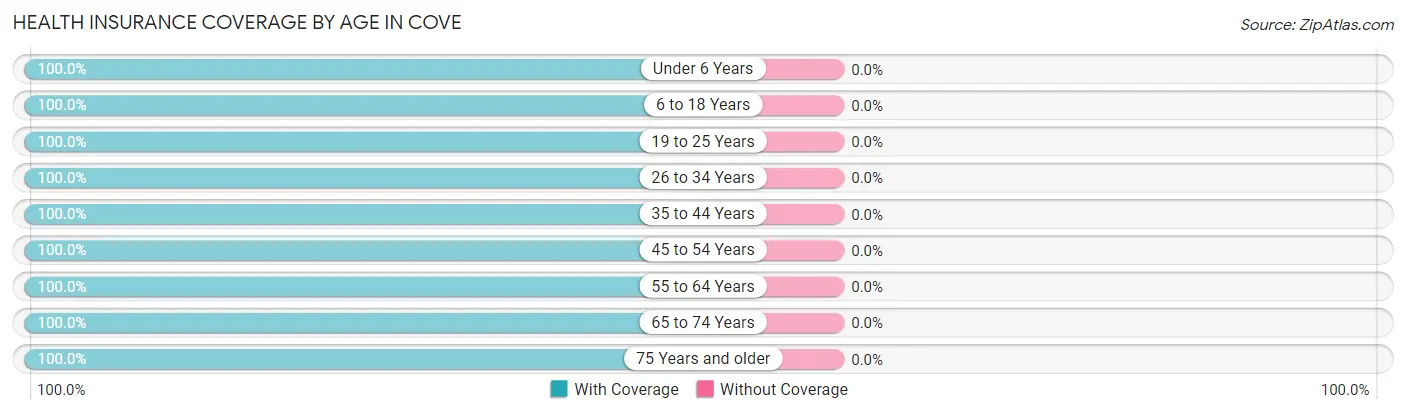
| Age Bracket | With Coverage | Without Coverage |
| Under 6 Years | 86 (100.0%) | 0 (0.0%) |
| 6 to 18 Years | 126 (100.0%) | 0 (0.0%) |
| 19 to 25 Years | 12 (100.0%) | 0 (0.0%) |
| 26 to 34 Years | 32 (100.0%) | 0 (0.0%) |
| 35 to 44 Years | 60 (100.0%) | 0 (0.0%) |
| 45 to 54 Years | 42 (100.0%) | 0 (0.0%) |
| 55 to 64 Years | 56 (100.0%) | 0 (0.0%) |
| 65 to 74 Years | 36 (100.0%) | 0 (0.0%) |
| 75 Years and older | 25 (100.0%) | 0 (0.0%) |
| Total | 475 (100.0%) | 0 (0.0%) |
Health Insurance Coverage by Citizenship Status in Cove
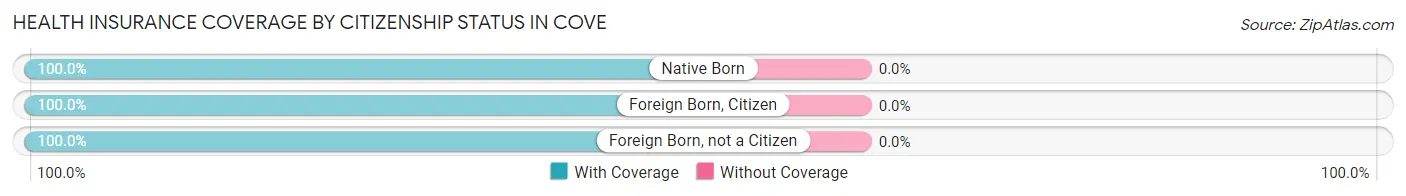
| Citizenship Status | With Coverage | Without Coverage |
| Native Born | 86 (100.0%) | 0 (0.0%) |
| Foreign Born, Citizen | 126 (100.0%) | 0 (0.0%) |
| Foreign Born, not a Citizen | 12 (100.0%) | 0 (0.0%) |
Health Insurance Coverage by Household Income in Cove
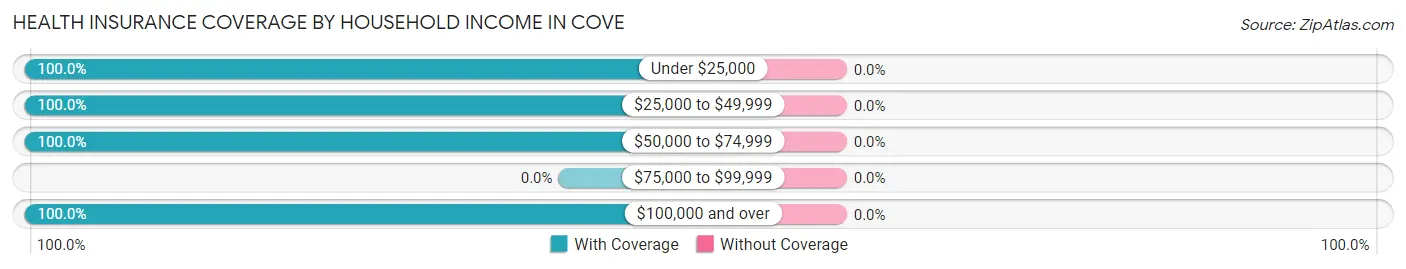
| Household Income | With Coverage | Without Coverage |
| Under $25,000 | 20 (100.0%) | 0 (0.0%) |
| $25,000 to $49,999 | 18 (100.0%) | 0 (0.0%) |
| $50,000 to $74,999 | 144 (100.0%) | 0 (0.0%) |
| $75,000 to $99,999 | 0 (0.0%) | 0 (0.0%) |
| $100,000 and over | 293 (100.0%) | 0 (0.0%) |
Public vs Private Health Insurance Coverage by Age in Cove
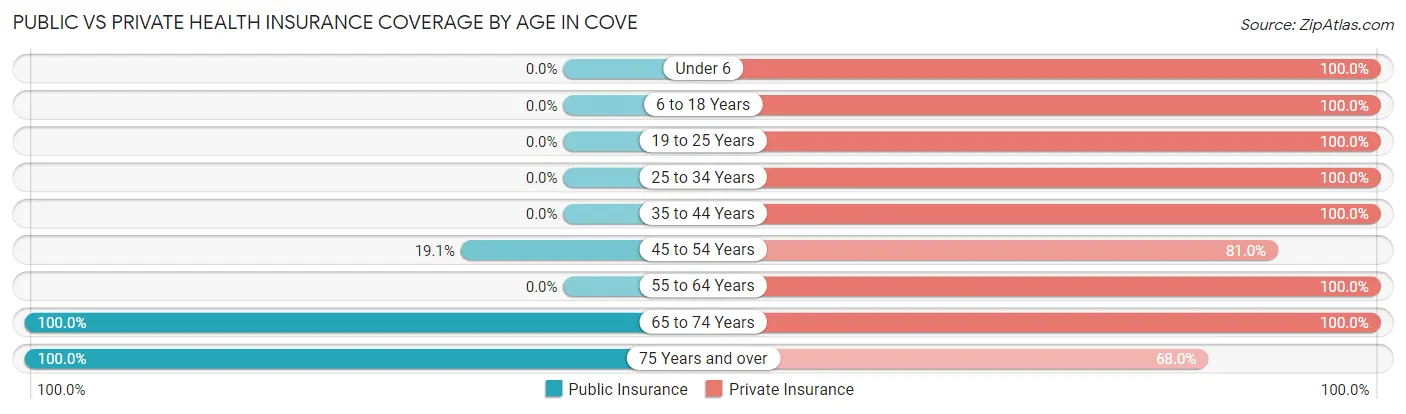
| Age Bracket | Public Insurance | Private Insurance |
| Under 6 | 0 (0.0%) | 86 (100.0%) |
| 6 to 18 Years | 0 (0.0%) | 126 (100.0%) |
| 19 to 25 Years | 0 (0.0%) | 12 (100.0%) |
| 25 to 34 Years | 0 (0.0%) | 32 (100.0%) |
| 35 to 44 Years | 0 (0.0%) | 60 (100.0%) |
| 45 to 54 Years | 8 (19.1%) | 34 (80.9%) |
| 55 to 64 Years | 0 (0.0%) | 56 (100.0%) |
| 65 to 74 Years | 36 (100.0%) | 36 (100.0%) |
| 75 Years and over | 25 (100.0%) | 17 (68.0%) |
| Total | 69 (14.5%) | 459 (96.6%) |
Disability Status by Sex by Age in Cove

| Age Bracket | Male | Female |
| Under 5 Years | 0 (0.0%) | 0 (0.0%) |
| 5 to 17 Years | 0 (0.0%) | 0 (0.0%) |
| 18 to 34 Years | 0 (0.0%) | 0 (0.0%) |
| 35 to 64 Years | 0 (0.0%) | 0 (0.0%) |
| 65 to 74 Years | 0 (0.0%) | 0 (0.0%) |
| 75 Years and over | 9 (52.9%) | 8 (100.0%) |
Disability Class by Sex by Age in Cove
Disability Class: Hearing Difficulty
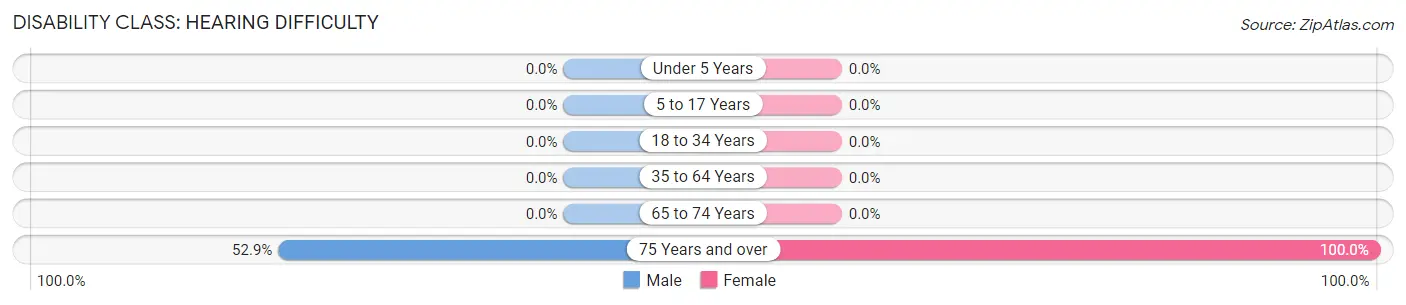
| Age Bracket | Male | Female |
| Under 5 Years | 0 (0.0%) | 0 (0.0%) |
| 5 to 17 Years | 0 (0.0%) | 0 (0.0%) |
| 18 to 34 Years | 0 (0.0%) | 0 (0.0%) |
| 35 to 64 Years | 0 (0.0%) | 0 (0.0%) |
| 65 to 74 Years | 0 (0.0%) | 0 (0.0%) |
| 75 Years and over | 9 (52.9%) | 8 (100.0%) |
Disability Class: Vision Difficulty
| Age Bracket | Male | Female |
| Under 5 Years | 0 (0.0%) | 0 (0.0%) |
| 5 to 17 Years | 0 (0.0%) | 0 (0.0%) |
| 18 to 34 Years | 0 (0.0%) | 0 (0.0%) |
| 35 to 64 Years | 0 (0.0%) | 0 (0.0%) |
| 65 to 74 Years | 0 (0.0%) | 0 (0.0%) |
| 75 Years and over | 0 (0.0%) | 0 (0.0%) |
Disability Class: Cognitive Difficulty
| Age Bracket | Male | Female |
| 5 to 17 Years | 0 (0.0%) | 0 (0.0%) |
| 18 to 34 Years | 0 (0.0%) | 0 (0.0%) |
| 35 to 64 Years | 0 (0.0%) | 0 (0.0%) |
| 65 to 74 Years | 0 (0.0%) | 0 (0.0%) |
| 75 Years and over | 0 (0.0%) | 0 (0.0%) |
Disability Class: Ambulatory Difficulty
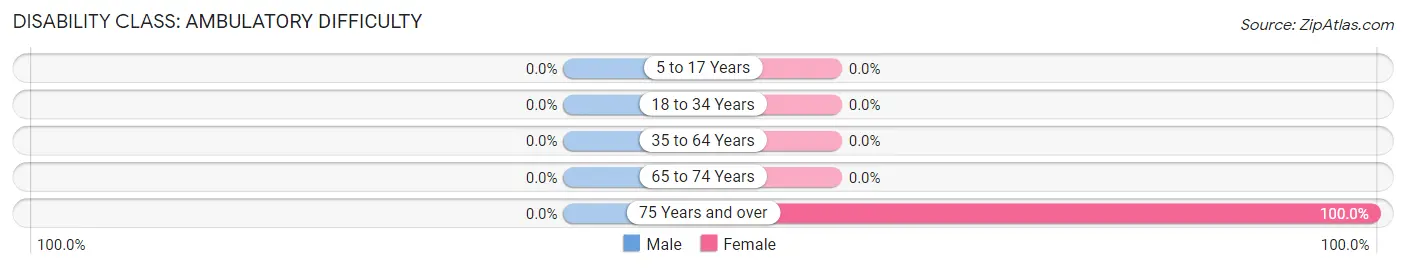
| Age Bracket | Male | Female |
| 5 to 17 Years | 0 (0.0%) | 0 (0.0%) |
| 18 to 34 Years | 0 (0.0%) | 0 (0.0%) |
| 35 to 64 Years | 0 (0.0%) | 0 (0.0%) |
| 65 to 74 Years | 0 (0.0%) | 0 (0.0%) |
| 75 Years and over | 0 (0.0%) | 8 (100.0%) |
Disability Class: Self-Care Difficulty

| Age Bracket | Male | Female |
| 5 to 17 Years | 0 (0.0%) | 0 (0.0%) |
| 18 to 34 Years | 0 (0.0%) | 0 (0.0%) |
| 35 to 64 Years | 0 (0.0%) | 0 (0.0%) |
| 65 to 74 Years | 0 (0.0%) | 0 (0.0%) |
| 75 Years and over | 0 (0.0%) | 0 (0.0%) |
Technology Access in Cove
Computing Device Access in Cove
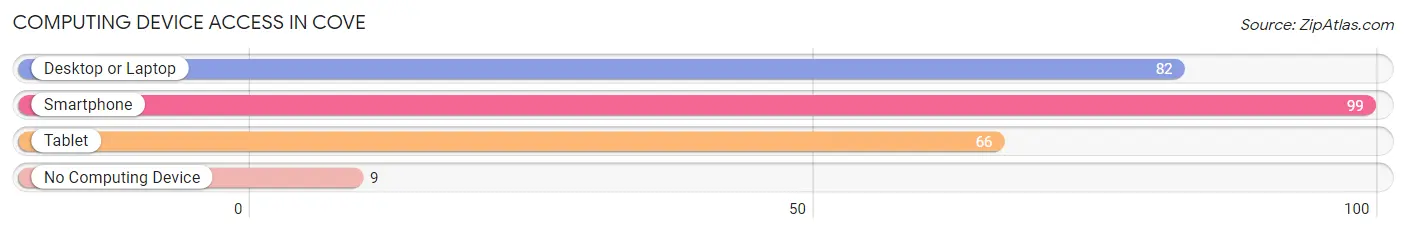
| Device Type | # Households | % Households |
| Desktop or Laptop | 82 | 75.9% |
| Smartphone | 99 | 91.7% |
| Tablet | 66 | 61.1% |
| No Computing Device | 9 | 8.3% |
| Total | 108 | 100.0% |
Internet Access in Cove
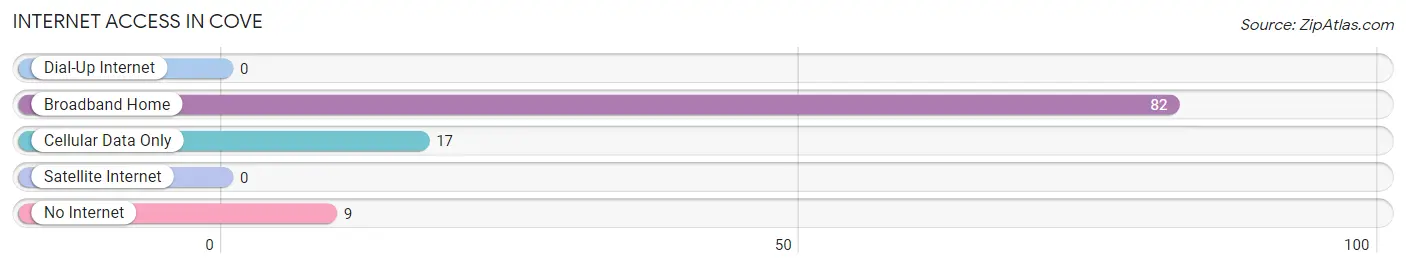
| Internet Type | # Households | % Households |
| Dial-Up Internet | 0 | 0.0% |
| Broadband Home | 82 | 75.9% |
| Cellular Data Only | 17 | 15.7% |
| Satellite Internet | 0 | 0.0% |
| No Internet | 9 | 8.3% |
| Total | 108 | 100.0% |
Cove Summary
Cove, Utah is a small town located in Cache County, Utah. It is situated in the northern part of the state, just south of the Idaho border. The town is located in the foothills of the Wasatch Mountains, and is surrounded by beautiful scenery. The population of Cove in 2000 was 1,072.
Geography
Cove is located in the northern part of Cache County, Utah, just south of the Idaho border. It is situated in the foothills of the Wasatch Mountains, and is surrounded by beautiful scenery. The town is located at an elevation of 4,890 feet above sea level. The area is characterized by rolling hills, with the highest point in the area being the summit of Mount Logan, which is 8,726 feet above sea level. The climate in Cove is semi-arid, with hot summers and cold winters.
Economy
The economy of Cove is largely based on agriculture and tourism. The town is home to several farms, which produce a variety of crops, including hay, wheat, corn, and alfalfa. The town is also home to several small businesses, including a grocery store, a hardware store, and a restaurant. Tourism is also an important part of the local economy, as the town is located near several popular recreational areas, including Bear Lake State Park and the Wasatch Mountains.
Demographics
As of the 2000 census, the population of Cove was 1,072. The racial makeup of the town was 97.2% White, 0.3% African American, 0.3% Native American, 0.3% Asian, 0.2% Pacific Islander, 0.7% from other races, and 0.9% from two or more races. Hispanic or Latino of any race were 1.7% of the population.
The median income for a household in Cove was $37,500, and the median income for a family was $41,250. The per capita income for the town was $17,845. About 8.2% of families and 10.2% of the population were below the poverty line, including 11.2% of those under age 18 and 8.3% of those age 65 or over.
History
Cove was first settled in 1864 by a group of Mormon pioneers. The town was named after the nearby Cove Creek, which was named by the pioneers for its resemblance to a cove. The town was incorporated in 1891, and the first post office was established in 1892.
In the early 1900s, Cove was a thriving agricultural community, with several farms producing hay, wheat, corn, and alfalfa. The town also had several small businesses, including a grocery store, a hardware store, and a restaurant.
In the late 20th century, Cove began to experience a decline in population as many of its residents moved away in search of better economic opportunities. However, the town has seen a resurgence in recent years, as more people have moved to the area in search of a rural lifestyle.
Common Questions
What is the Total Population of Cove?
Total Population of Cove is 475.
What is the Total Male Population of Cove?
Total Male Population of Cove is 234.
What is the Total Female Population of Cove?
Total Female Population of Cove is 241.
What is the Ratio of Males per 100 Females in Cove?
There are 97.10 Males per 100 Females in Cove.
What is the Ratio of Females per 100 Males in Cove?
There are 102.99 Females per 100 Males in Cove.
What is the Median Population Age in Cove?
Median Population Age in Cove is 30.9 Years.
What is the Average Family Size in Cove
Average Family Size in Cove is 4.4 People.
What is the Average Household Size in Cove
Average Household Size in Cove is 4.4 People.
What is Per Capita Income in Cove?
Per Capita income in Cove is $25,560.
What is Inequality or Gini Index in Cove?
Inequality or Gini Index in Cove is 0.33.
How Large is the Labor Force in Cove?
There are 166 People in the Labor Forcein in Cove.
What is the Percentage of People in the Labor Force in Cove?
59.7% of People are in the Labor Force in Cove.