Weber County, UT
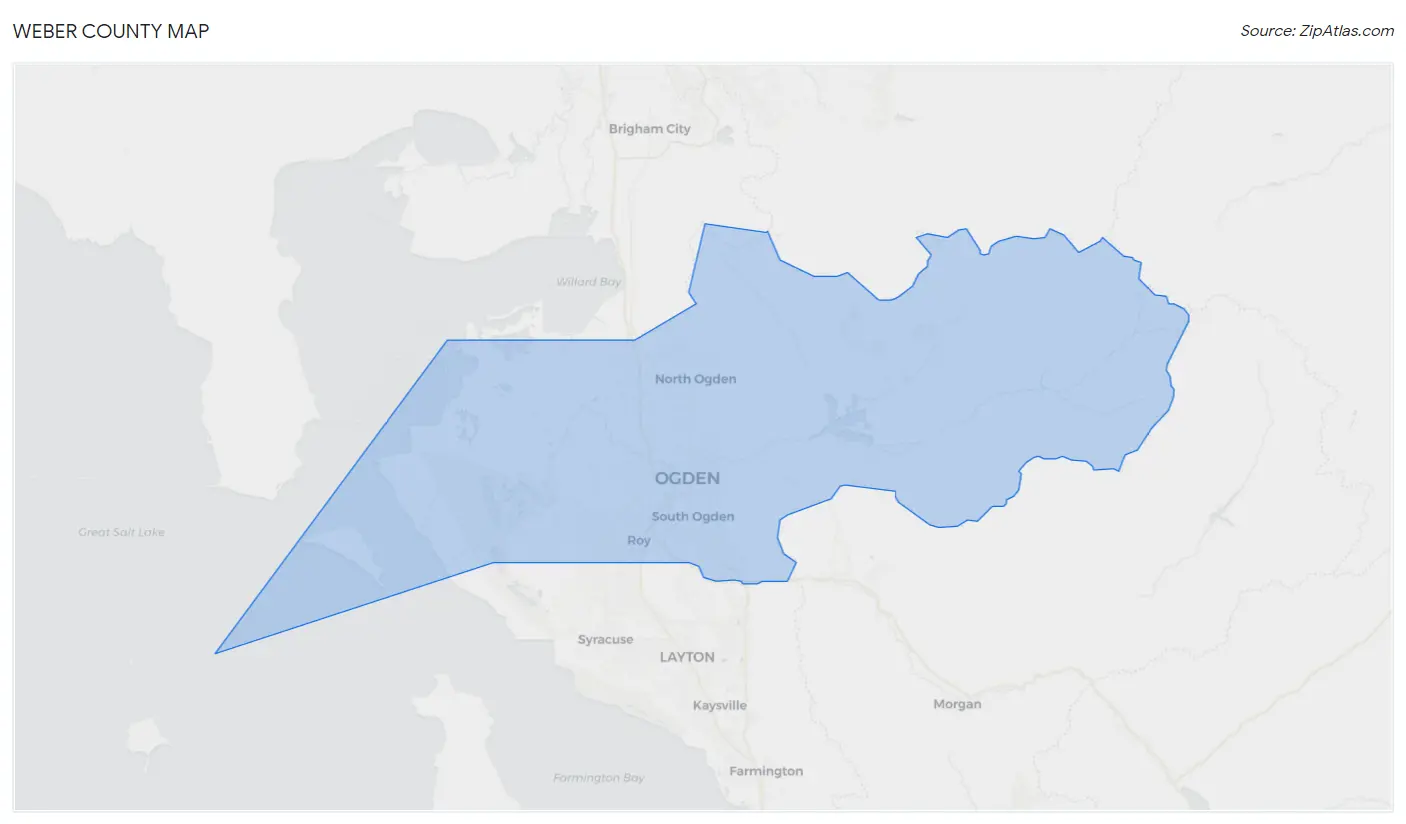
Weber County Map
Weber County Overview
262,960
TOTAL POPULATION
133,298
MALE POPULATION
129,662
FEMALE POPULATION
102.80
MALES / 100 FEMALES
97.27
FEMALES / 100 MALES
33.2
MEDIAN AGE
3.4
AVG FAMILY SIZE
2.9
AVG HOUSEHOLD SIZE
$34,778
PER CAPITA INCOME
$93,444
AVG FAMILY INCOME
$82,291
AVG HOUSEHOLD INCOME
37.5%
WAGE / INCOME GAP [ % ]
62.5¢/ $1
WAGE / INCOME GAP [ $ ]
$11,364
FAMILY INCOME DEFICIT
0.40
INEQUALITY / GINI INDEX
138,233
LABOR FORCE [ PEOPLE ]
69.4%
PERCENT IN LABOR FORCE
3.1%
UNEMPLOYMENT RATE
Race in Weber County
The most populous races in Weber County are White / Caucasian (223,362 | 84.9%), Hispanic or Latino (49,388 | 18.8%), and Two or more Races (17,660 | 6.7%).
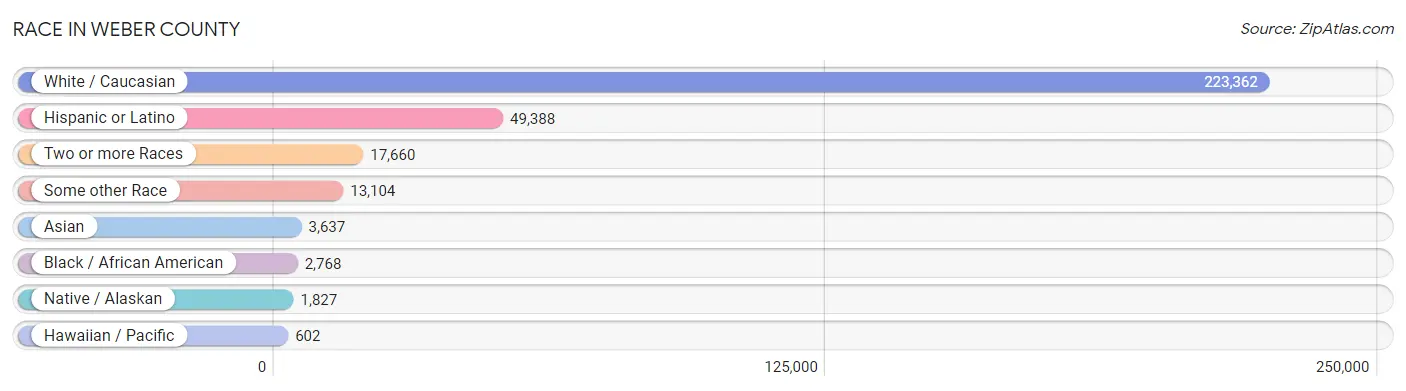
| Race | # Population | % Population |
| Asian | 3,637 | 1.4% |
| Black / African American | 2,768 | 1.1% |
| Hawaiian / Pacific | 602 | 0.2% |
| Hispanic or Latino | 49,388 | 18.8% |
| Native / Alaskan | 1,827 | 0.7% |
| White / Caucasian | 223,362 | 84.9% |
| Two or more Races | 17,660 | 6.7% |
| Some other Race | 13,104 | 5.0% |
| Total | 262,960 | 100.0% |
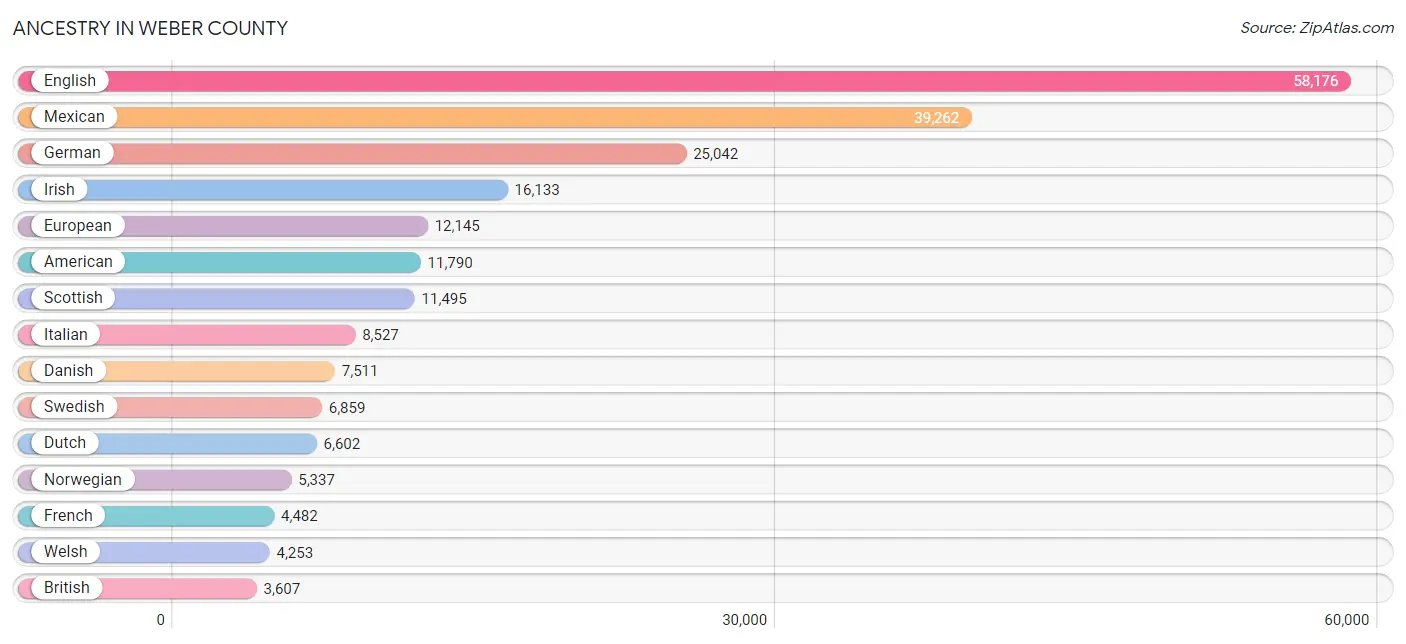
Ancestry in Weber County
The most populous ancestries reported in Weber County are English (58,176 | 22.1%), Mexican (39,262 | 14.9%), German (25,042 | 9.5%), Irish (16,133 | 6.1%), and European (12,145 | 4.6%), together accounting for 57.3% of all Weber County residents.
| Ancestry | # Population | % Population |
| African | 294 | 0.1% |
| Alaskan Athabascan | 27 | 0.0% |
| Albanian | 18 | 0.0% |
| Aleut | 28 | 0.0% |
| American | 11,790 | 4.5% |
| Apache | 42 | 0.0% |
| Arab | 773 | 0.3% |
| Arapaho | 10 | 0.0% |
| Argentinean | 160 | 0.1% |
| Armenian | 97 | 0.0% |
| Australian | 85 | 0.0% |
| Austrian | 316 | 0.1% |
| Bangladeshi | 125 | 0.1% |
| Basque | 89 | 0.0% |
| Belgian | 209 | 0.1% |
| Bhutanese | 1,542 | 0.6% |
| Blackfeet | 281 | 0.1% |
| Bolivian | 13 | 0.0% |
| Brazilian | 190 | 0.1% |
| British | 3,607 | 1.4% |
| Bulgarian | 98 | 0.0% |
| Burmese | 733 | 0.3% |
| Cajun | 58 | 0.0% |
| Canadian | 461 | 0.2% |
| Celtic | 119 | 0.1% |
| Central American | 2,378 | 0.9% |
| Central American Indian | 517 | 0.2% |
| Cherokee | 440 | 0.2% |
| Cheyenne | 69 | 0.0% |
| Chickasaw | 58 | 0.0% |
| Chilean | 207 | 0.1% |
| Chippewa | 41 | 0.0% |
| Choctaw | 256 | 0.1% |
| Colombian | 98 | 0.0% |
| Costa Rican | 72 | 0.0% |
| Cree | 3 | 0.0% |
| Creek | 61 | 0.0% |
| Croatian | 223 | 0.1% |
| Crow | 20 | 0.0% |
| Cuban | 151 | 0.1% |
| Czech | 374 | 0.1% |
| Czechoslovakian | 110 | 0.0% |
| Danish | 7,511 | 2.9% |
| Delaware | 19 | 0.0% |
| Dominican | 150 | 0.1% |
| Dutch | 6,602 | 2.5% |
| Eastern European | 454 | 0.2% |
| Ecuadorian | 90 | 0.0% |
| Egyptian | 55 | 0.0% |
| English | 58,176 | 22.1% |
| European | 12,145 | 4.6% |
| Fijian | 27 | 0.0% |
| Filipino | 133 | 0.1% |
| Finnish | 662 | 0.3% |
| French | 4,482 | 1.7% |
| French Canadian | 620 | 0.2% |
| German | 25,042 | 9.5% |
| Ghanaian | 11 | 0.0% |
| Greek | 892 | 0.3% |
| Guamanian / Chamorro | 73 | 0.0% |
| Guatemalan | 415 | 0.2% |
| Guyanese | 11 | 0.0% |
| Haitian | 66 | 0.0% |
| Honduran | 124 | 0.1% |
| Hopi | 54 | 0.0% |
| Hungarian | 251 | 0.1% |
| Icelander | 86 | 0.0% |
| Indian (Asian) | 1,290 | 0.5% |
| Inupiat | 85 | 0.0% |
| Iranian | 54 | 0.0% |
| Irish | 16,133 | 6.1% |
| Italian | 8,527 | 3.2% |
| Jamaican | 164 | 0.1% |
| Japanese | 159 | 0.1% |
| Kiowa | 21 | 0.0% |
| Korean | 1,240 | 0.5% |
| Laotian | 44 | 0.0% |
| Latvian | 15 | 0.0% |
| Lebanese | 120 | 0.1% |
| Liberian | 8 | 0.0% |
| Lithuanian | 195 | 0.1% |
| Macedonian | 42 | 0.0% |
| Malaysian | 147 | 0.1% |
| Marshallese | 17 | 0.0% |
| Mexican | 39,262 | 14.9% |
| Mexican American Indian | 464 | 0.2% |
| Mongolian | 95 | 0.0% |
| Moroccan | 238 | 0.1% |
| Native Hawaiian | 399 | 0.2% |
| Navajo | 600 | 0.2% |
| New Zealander | 52 | 0.0% |
| Nicaraguan | 49 | 0.0% |
| Nigerian | 55 | 0.0% |
| Northern European | 561 | 0.2% |
| Norwegian | 5,337 | 2.0% |
| Osage | 8 | 0.0% |
| Pakistani | 369 | 0.1% |
| Panamanian | 32 | 0.0% |
| Paraguayan | 50 | 0.0% |
| Peruvian | 361 | 0.1% |
| Polish | 2,401 | 0.9% |
| Portuguese | 325 | 0.1% |
| Potawatomi | 14 | 0.0% |
| Pueblo | 72 | 0.0% |
| Puerto Rican | 1,254 | 0.5% |
| Puget Sound Salish | 40 | 0.0% |
| Romanian | 201 | 0.1% |
| Russian | 704 | 0.3% |
| Salvadoran | 1,668 | 0.6% |
| Samoan | 722 | 0.3% |
| Scandinavian | 2,435 | 0.9% |
| Scotch-Irish | 1,980 | 0.7% |
| Scottish | 11,495 | 4.4% |
| Serbian | 75 | 0.0% |
| Shoshone | 195 | 0.1% |
| Sioux | 170 | 0.1% |
| Slavic | 134 | 0.1% |
| Slovak | 27 | 0.0% |
| Slovene | 113 | 0.0% |
| Somali | 37 | 0.0% |
| South American | 1,217 | 0.5% |
| South American Indian | 103 | 0.0% |
| Spaniard | 1,441 | 0.5% |
| Spanish | 1,236 | 0.5% |
| Spanish American | 81 | 0.0% |
| Spanish American Indian | 146 | 0.1% |
| Sri Lankan | 524 | 0.2% |
| Subsaharan African | 533 | 0.2% |
| Sudanese | 37 | 0.0% |
| Swedish | 6,859 | 2.6% |
| Swiss | 1,777 | 0.7% |
| Syrian | 97 | 0.0% |
| Thai | 209 | 0.1% |
| Tongan | 233 | 0.1% |
| Trinidadian and Tobagonian | 58 | 0.0% |
| Turkish | 30 | 0.0% |
| Ukrainian | 186 | 0.1% |
| Uruguayan | 42 | 0.0% |
| Ute | 55 | 0.0% |
| Venezuelan | 17 | 0.0% |
| Welsh | 4,253 | 1.6% |
| West Indian | 47 | 0.0% |
| Yugoslavian | 52 | 0.0% |
| Yup'ik | 10 | 0.0% | View All 144 Rows |
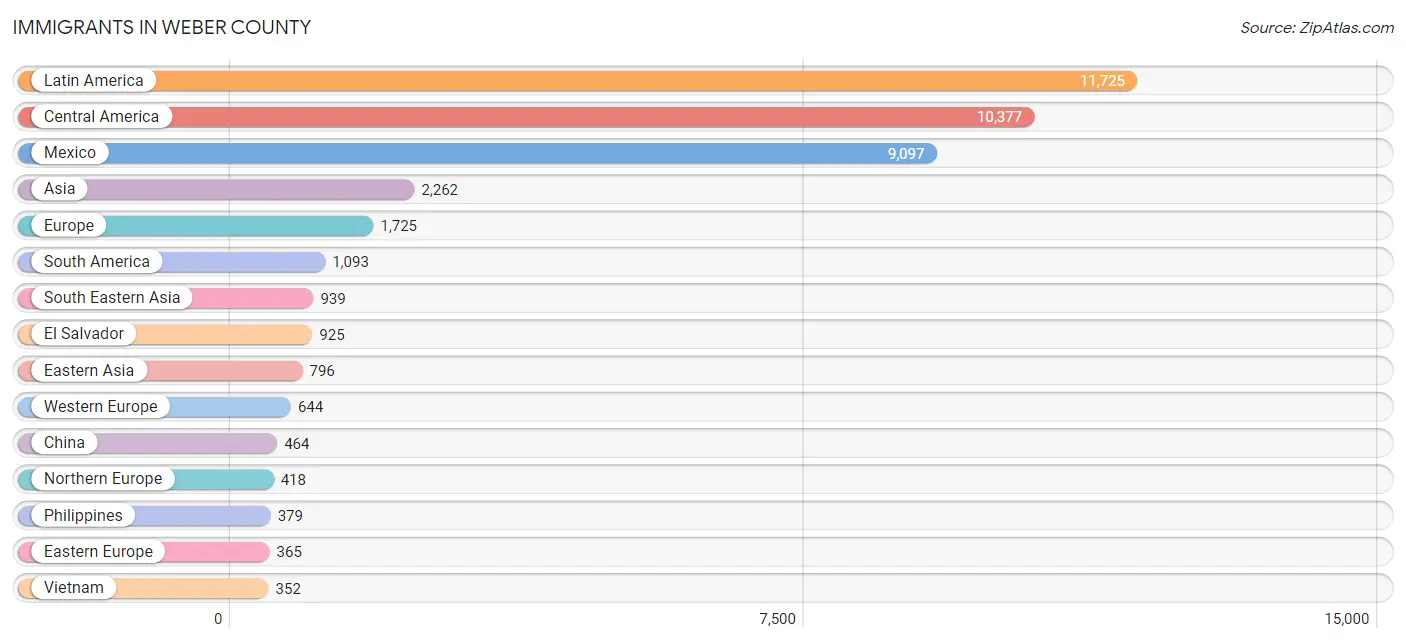
Immigrants in Weber County
The most numerous immigrant groups reported in Weber County came from Latin America (11,725 | 4.5%), Central America (10,377 | 4.0%), Mexico (9,097 | 3.5%), Asia (2,262 | 0.9%), and Europe (1,725 | 0.7%), together accounting for 13.4% of all Weber County residents.
| Immigration Origin | # Population | % Population |
| Africa | 277 | 0.1% |
| Argentina | 150 | 0.1% |
| Armenia | 22 | 0.0% |
| Asia | 2,262 | 0.9% |
| Australia | 25 | 0.0% |
| Austria | 20 | 0.0% |
| Azores | 6 | 0.0% |
| Belgium | 152 | 0.1% |
| Belize | 5 | 0.0% |
| Bolivia | 13 | 0.0% |
| Brazil | 179 | 0.1% |
| Bulgaria | 117 | 0.0% |
| Cambodia | 45 | 0.0% |
| Canada | 334 | 0.1% |
| Caribbean | 255 | 0.1% |
| Central America | 10,377 | 4.0% |
| Chile | 120 | 0.1% |
| China | 464 | 0.2% |
| Colombia | 95 | 0.0% |
| Costa Rica | 19 | 0.0% |
| Croatia | 23 | 0.0% |
| Cuba | 68 | 0.0% |
| Czechoslovakia | 26 | 0.0% |
| Denmark | 4 | 0.0% |
| Dominican Republic | 76 | 0.0% |
| Eastern Africa | 149 | 0.1% |
| Eastern Asia | 796 | 0.3% |
| Eastern Europe | 365 | 0.1% |
| Ecuador | 28 | 0.0% |
| El Salvador | 925 | 0.4% |
| England | 204 | 0.1% |
| Europe | 1,725 | 0.7% |
| France | 94 | 0.0% |
| Germany | 247 | 0.1% |
| Ghana | 15 | 0.0% |
| Greece | 91 | 0.0% |
| Guatemala | 194 | 0.1% |
| Honduras | 79 | 0.0% |
| Hong Kong | 44 | 0.0% |
| Hungary | 19 | 0.0% |
| India | 31 | 0.0% |
| Indonesia | 25 | 0.0% |
| Iran | 46 | 0.0% |
| Iraq | 6 | 0.0% |
| Ireland | 17 | 0.0% |
| Italy | 41 | 0.0% |
| Jamaica | 65 | 0.0% |
| Japan | 86 | 0.0% |
| Jordan | 19 | 0.0% |
| Kazakhstan | 32 | 0.0% |
| Kenya | 19 | 0.0% |
| Korea | 246 | 0.1% |
| Kuwait | 8 | 0.0% |
| Laos | 56 | 0.0% |
| Latin America | 11,725 | 4.5% |
| Liberia | 15 | 0.0% |
| Mexico | 9,097 | 3.5% |
| Middle Africa | 12 | 0.0% |
| Moldova | 43 | 0.0% |
| Netherlands | 129 | 0.1% |
| Nicaragua | 49 | 0.0% |
| Nigeria | 19 | 0.0% |
| Northern Europe | 418 | 0.2% |
| Norway | 22 | 0.0% |
| Oceania | 216 | 0.1% |
| Pakistan | 201 | 0.1% |
| Panama | 9 | 0.0% |
| Peru | 286 | 0.1% |
| Philippines | 379 | 0.1% |
| Poland | 25 | 0.0% |
| Portugal | 6 | 0.0% |
| Romania | 58 | 0.0% |
| Russia | 36 | 0.0% |
| Saudi Arabia | 162 | 0.1% |
| Scotland | 23 | 0.0% |
| Singapore | 15 | 0.0% |
| Somalia | 37 | 0.0% |
| South Africa | 36 | 0.0% |
| South America | 1,093 | 0.4% |
| South Central Asia | 310 | 0.1% |
| South Eastern Asia | 939 | 0.4% |
| Southern Europe | 298 | 0.1% |
| Spain | 160 | 0.1% |
| Switzerland | 2 | 0.0% |
| Taiwan | 97 | 0.0% |
| Thailand | 67 | 0.0% |
| Trinidad and Tobago | 46 | 0.0% |
| Ukraine | 18 | 0.0% |
| Uruguay | 165 | 0.1% |
| Venezuela | 7 | 0.0% |
| Vietnam | 352 | 0.1% |
| Western Africa | 79 | 0.0% |
| Western Asia | 217 | 0.1% |
| Western Europe | 644 | 0.2% |
| Zaire | 12 | 0.0% | View All 95 Rows |
Sex and Age in Weber County
Sex and Age in Weber County
The most populous age groups in Weber County are 25 to 29 Years (10,657 | 8.0%) for men and 10 to 14 Years (10,480 | 8.1%) for women.
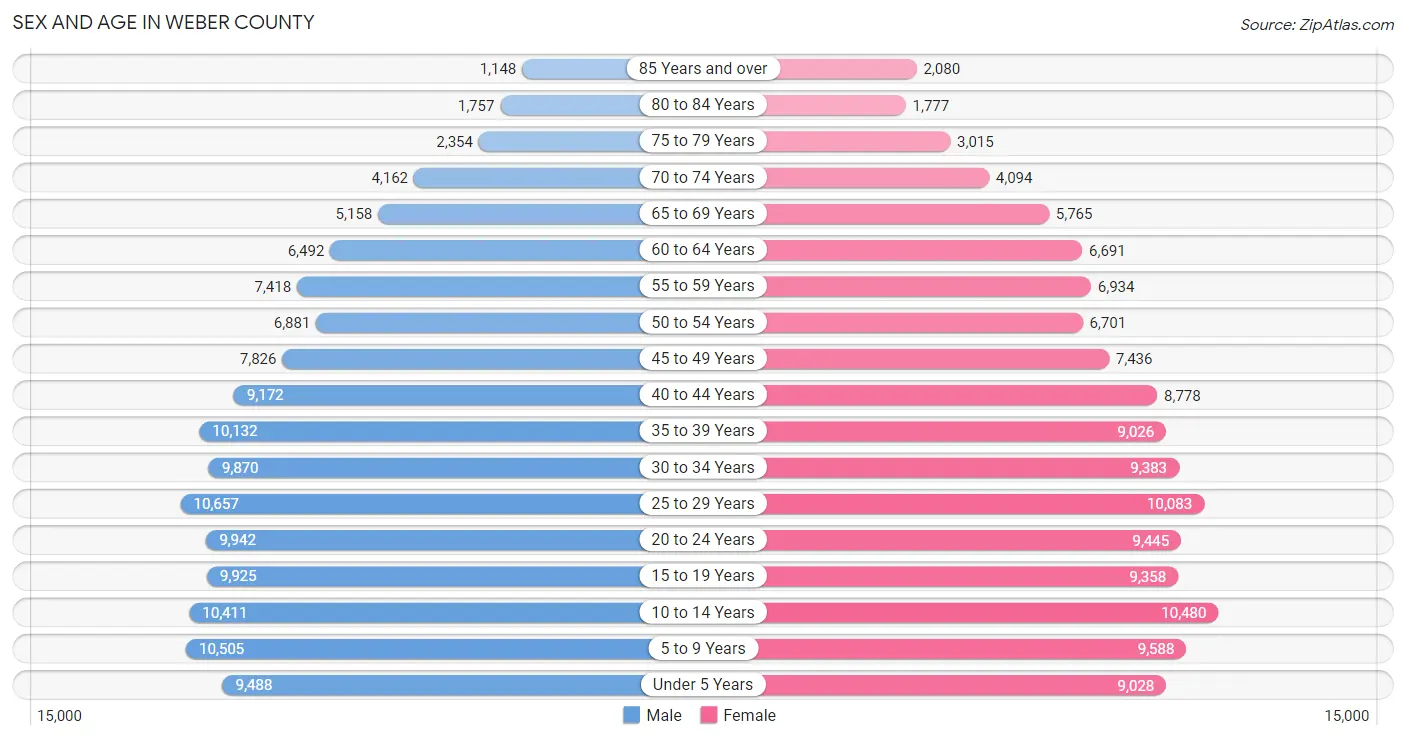
| Age Bracket | Male | Female |
| Under 5 Years | 9,488 (7.1%) | 9,028 (7.0%) |
| 5 to 9 Years | 10,505 (7.9%) | 9,588 (7.4%) |
| 10 to 14 Years | 10,411 (7.8%) | 10,480 (8.1%) |
| 15 to 19 Years | 9,925 (7.4%) | 9,358 (7.2%) |
| 20 to 24 Years | 9,942 (7.5%) | 9,445 (7.3%) |
| 25 to 29 Years | 10,657 (8.0%) | 10,083 (7.8%) |
| 30 to 34 Years | 9,870 (7.4%) | 9,383 (7.2%) |
| 35 to 39 Years | 10,132 (7.6%) | 9,026 (7.0%) |
| 40 to 44 Years | 9,172 (6.9%) | 8,778 (6.8%) |
| 45 to 49 Years | 7,826 (5.9%) | 7,436 (5.7%) |
| 50 to 54 Years | 6,881 (5.2%) | 6,701 (5.2%) |
| 55 to 59 Years | 7,418 (5.6%) | 6,934 (5.3%) |
| 60 to 64 Years | 6,492 (4.9%) | 6,691 (5.2%) |
| 65 to 69 Years | 5,158 (3.9%) | 5,765 (4.4%) |
| 70 to 74 Years | 4,162 (3.1%) | 4,094 (3.2%) |
| 75 to 79 Years | 2,354 (1.8%) | 3,015 (2.3%) |
| 80 to 84 Years | 1,757 (1.3%) | 1,777 (1.4%) |
| 85 Years and over | 1,148 (0.9%) | 2,080 (1.6%) |
| Total | 133,298 (100.0%) | 129,662 (100.0%) |
Families and Households in Weber County
Median Family Size in Weber County
The median family size in Weber County is 3.38 persons per family, with married-couple families (50,609 | 77.1%) accounting for the largest median family size of 3.46 persons per family. On the other hand, single male/father families (5,677 | 8.6%) represent the smallest median family size with 2.94 persons per family.
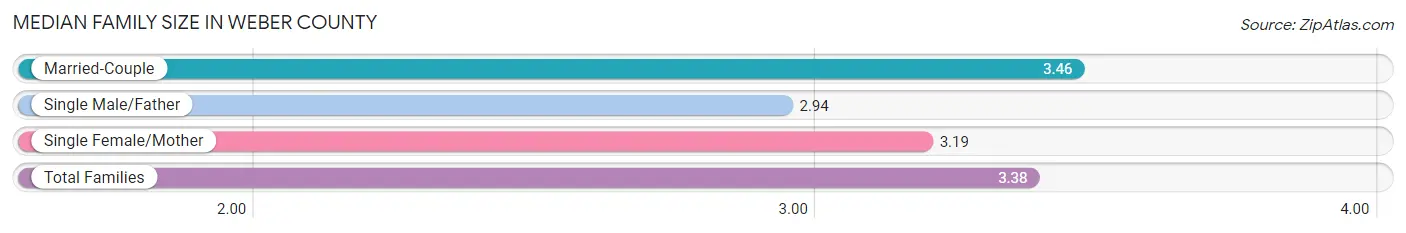
| Family Type | # Families | Family Size |
| Married-Couple | 50,609 (77.1%) | 3.46 |
| Single Male/Father | 5,677 (8.6%) | 2.94 |
| Single Female/Mother | 9,335 (14.2%) | 3.19 |
| Total Families | 65,621 (100.0%) | 3.38 |
Median Household Size in Weber County
The median household size in Weber County is 2.89 persons per household, with married-couple households (50,609 | 56.2%) accounting for the largest median household size of 3.51 persons per household. non-family households (24,369 | 27.1%) represent the smallest median household size with 1.27 persons per household.
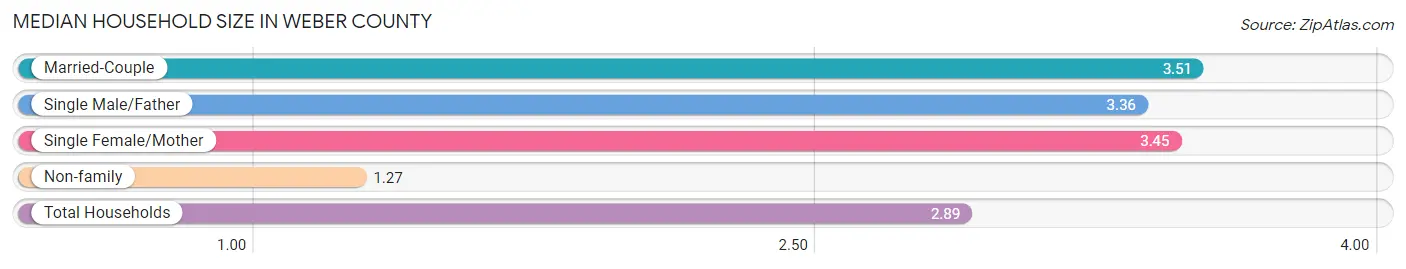
| Household Type | # Households | Household Size |
| Married-Couple | 50,609 (56.2%) | 3.51 |
| Single Male/Father | 5,677 (6.3%) | 3.36 |
| Single Female/Mother | 9,335 (10.4%) | 3.45 |
| Non-family | 24,369 (27.1%) | 1.27 |
| Total Households | 89,990 (100.0%) | 2.89 |
Household Size by Marriage Status in Weber County
Out of a total of 89,990 households in Weber County, 65,621 (72.9%) are family households, while 24,369 (27.1%) are nonfamily households. The most numerous type of family households are 2-person households, comprising 23,838, and the most common type of nonfamily households are 1-person households, comprising 19,540.
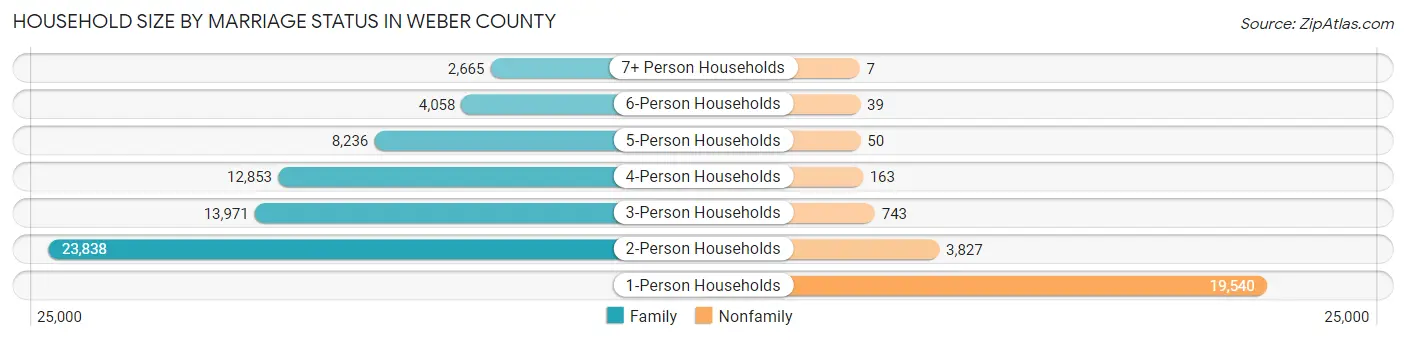
| Household Size | Family Households | Nonfamily Households |
| 1-Person Households | - | 19,540 (21.7%) |
| 2-Person Households | 23,838 (26.5%) | 3,827 (4.3%) |
| 3-Person Households | 13,971 (15.5%) | 743 (0.8%) |
| 4-Person Households | 12,853 (14.3%) | 163 (0.2%) |
| 5-Person Households | 8,236 (9.1%) | 50 (0.1%) |
| 6-Person Households | 4,058 (4.5%) | 39 (0.0%) |
| 7+ Person Households | 2,665 (3.0%) | 7 (0.0%) |
| Total | 65,621 (72.9%) | 24,369 (27.1%) |
Female Fertility in Weber County
Fertility by Age in Weber County
Average fertility rate in Weber County is 65.0 births per 1,000 women. Women in the age bracket of 20 to 34 years have the highest fertility rate with 112.0 births per 1,000 women. Women in the age bracket of 20 to 34 years acount for 76.7% of all women with births.
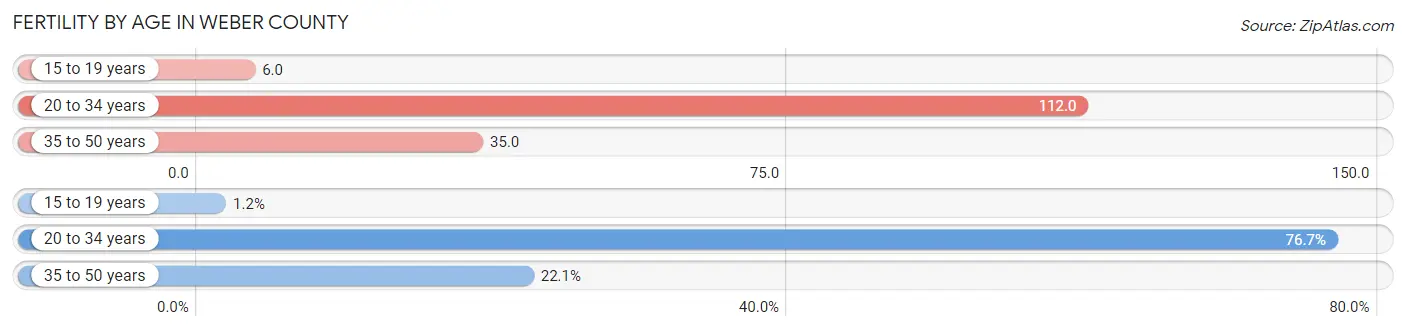
| Age Bracket | Women with Births | Births / 1,000 Women |
| 15 to 19 years | 52 (1.2%) | 6.0 |
| 20 to 34 years | 3,245 (76.7%) | 112.0 |
| 35 to 50 years | 936 (22.1%) | 35.0 |
| Total | 4,233 (100.0%) | 65.0 |
Fertility by Age by Marriage Status in Weber County
74.5% of women with births (4,233) in Weber County are married. The highest percentage of unmarried women with births falls into 15 to 19 years age bracket with 73.1% of them unmarried at the time of birth, while the lowest percentage of unmarried women with births belong to 20 to 34 years age bracket with 21.8% of them unmarried.
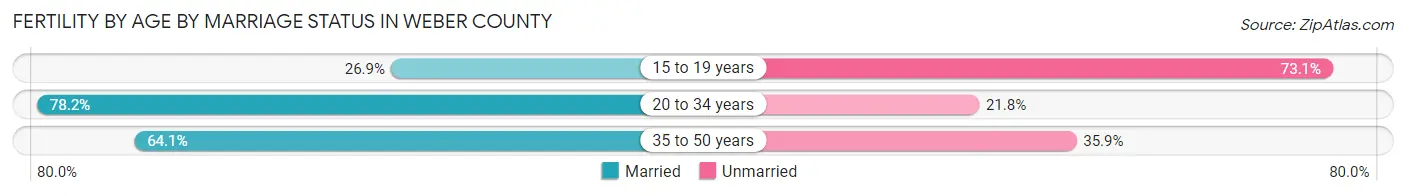
| Age Bracket | Married | Unmarried |
| 15 to 19 years | 14 (26.9%) | 38 (73.1%) |
| 20 to 34 years | 2,538 (78.2%) | 707 (21.8%) |
| 35 to 50 years | 600 (64.1%) | 336 (35.9%) |
| Total | 3,154 (74.5%) | 1,079 (25.5%) |
Fertility by Education in Weber County
Average fertility rate in Weber County is 65.0 births per 1,000 women. Women with the education attainment of bachelor's degree have the highest fertility rate of 91.0 births per 1,000 women, while women with the education attainment of less than high school have the lowest fertility at 46.0 births per 1,000 women. Women with the education attainment of high school diploma represent 31.9% of all women with births.
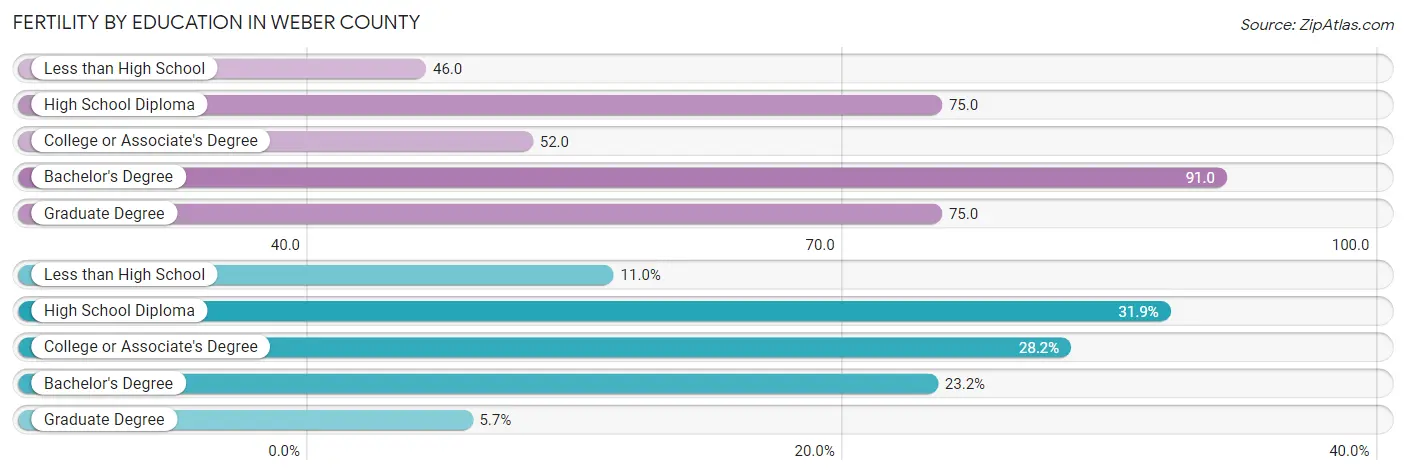
| Educational Attainment | Women with Births | Births / 1,000 Women |
| Less than High School | 467 (11.0%) | 46.0 |
| High School Diploma | 1,350 (31.9%) | 75.0 |
| College or Associate's Degree | 1,192 (28.2%) | 52.0 |
| Bachelor's Degree | 981 (23.2%) | 91.0 |
| Graduate Degree | 243 (5.7%) | 75.0 |
| Total | 4,233 (100.0%) | 65.0 |
Fertility by Education by Marriage Status in Weber County
25.5% of women with births in Weber County are unmarried. Women with the educational attainment of graduate degree are most likely to be married with 100.0% of them married at childbirth, while women with the educational attainment of high school diploma are least likely to be married with 46.5% of them unmarried at childbirth.
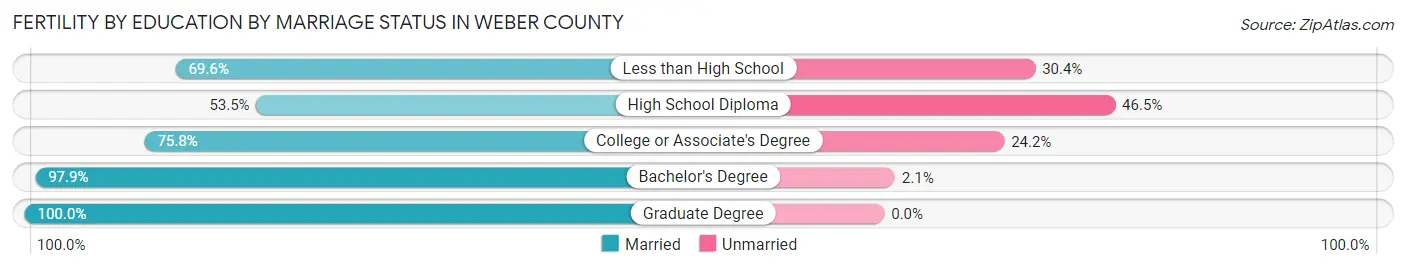
| Educational Attainment | Married | Unmarried |
| Less than High School | 325 (69.6%) | 142 (30.4%) |
| High School Diploma | 722 (53.5%) | 628 (46.5%) |
| College or Associate's Degree | 904 (75.8%) | 288 (24.2%) |
| Bachelor's Degree | 960 (97.9%) | 21 (2.1%) |
| Graduate Degree | 243 (100.0%) | 0 (0.0%) |
| Total | 3,154 (74.5%) | 1,079 (25.5%) |
Income in Weber County
Income Overview in Weber County
Per Capita Income in Weber County is $34,778, while median incomes of families and households are $93,444 and $82,291 respectively.
| Characteristic | Number | Measure |
| Per Capita Income | 262,960 | $34,778 |
| Median Family Income | 65,621 | $93,444 |
| Mean Family Income | 65,621 | $111,726 |
| Median Household Income | 89,990 | $82,291 |
| Mean Household Income | 89,990 | $99,422 |
| Income Deficit | 65,621 | $11,364 |
| Wage / Income Gap (%) | 262,960 | 37.49% |
| Wage / Income Gap ($) | 262,960 | 62.51¢ per $1 |
| Gini / Inequality Index | 262,960 | 0.40 |
Earnings by Sex in Weber County
Average Earnings in Weber County are $40,706, $50,231 for men and $31,399 for women, a difference of 37.5%.
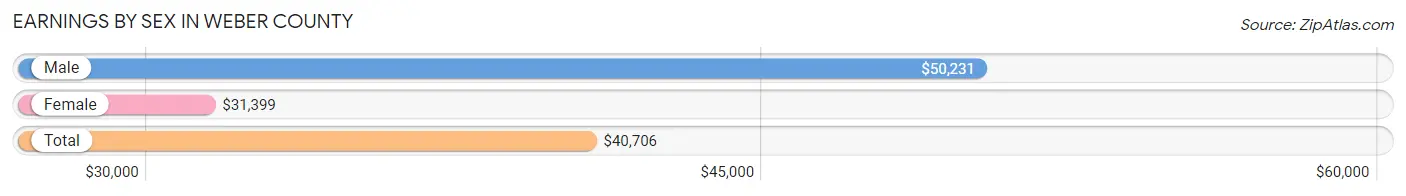
| Sex | Number | Average Earnings |
| Male | 79,808 (55.3%) | $50,231 |
| Female | 64,544 (44.7%) | $31,399 |
| Total | 144,352 (100.0%) | $40,706 |
Earnings by Sex by Income Bracket in Weber County
The most common earnings brackets in Weber County are $100,000+ for men (11,964 | 15.0%) and $30,000 to $34,999 for women (5,090 | 7.9%).
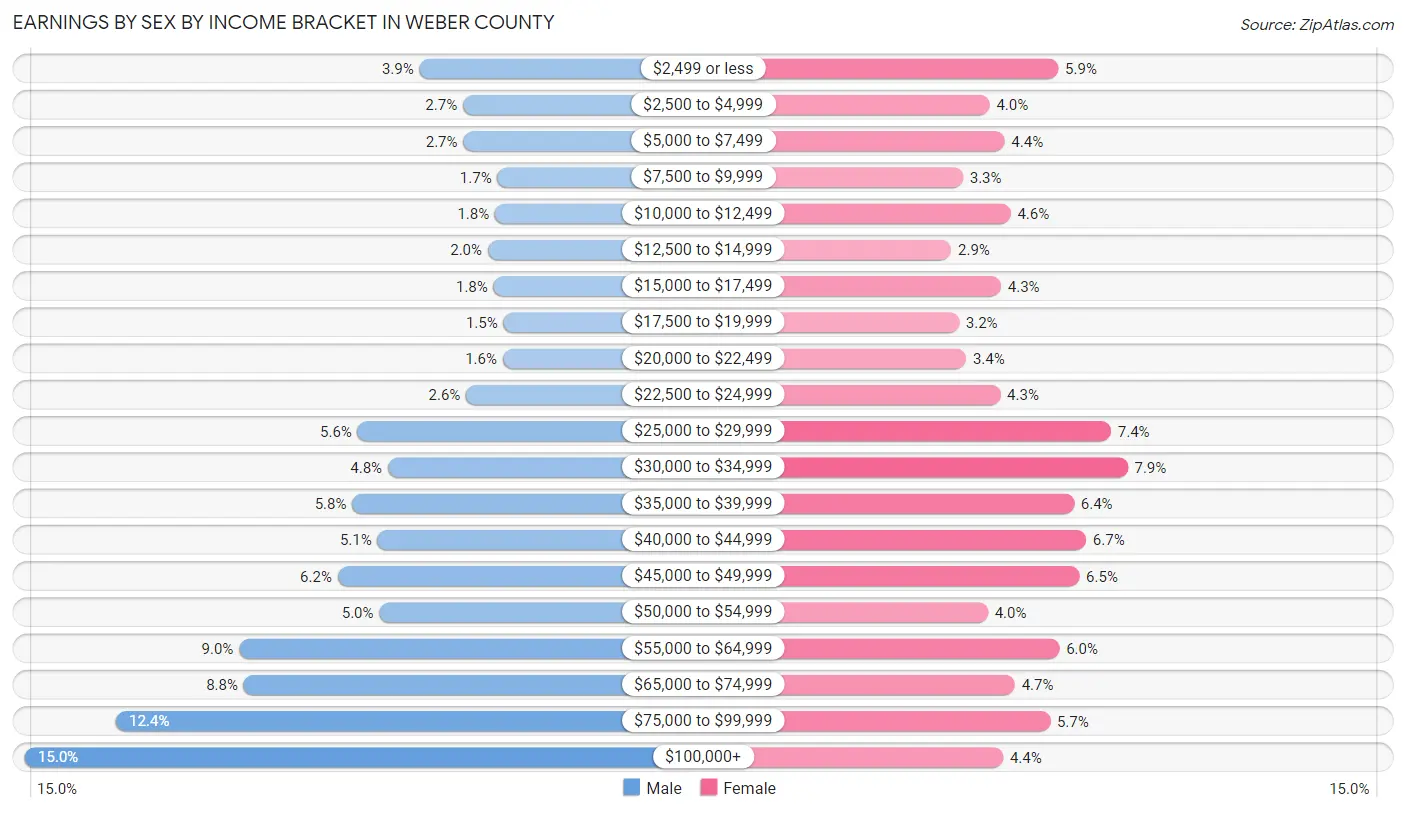
| Income | Male | Female |
| $2,499 or less | 3,115 (3.9%) | 3,837 (5.9%) |
| $2,500 to $4,999 | 2,142 (2.7%) | 2,591 (4.0%) |
| $5,000 to $7,499 | 2,134 (2.7%) | 2,859 (4.4%) |
| $7,500 to $9,999 | 1,367 (1.7%) | 2,107 (3.3%) |
| $10,000 to $12,499 | 1,418 (1.8%) | 2,967 (4.6%) |
| $12,500 to $14,999 | 1,580 (2.0%) | 1,888 (2.9%) |
| $15,000 to $17,499 | 1,451 (1.8%) | 2,793 (4.3%) |
| $17,500 to $19,999 | 1,228 (1.5%) | 2,032 (3.2%) |
| $20,000 to $22,499 | 1,245 (1.6%) | 2,165 (3.4%) |
| $22,500 to $24,999 | 2,065 (2.6%) | 2,784 (4.3%) |
| $25,000 to $29,999 | 4,502 (5.6%) | 4,786 (7.4%) |
| $30,000 to $34,999 | 3,826 (4.8%) | 5,090 (7.9%) |
| $35,000 to $39,999 | 4,624 (5.8%) | 4,120 (6.4%) |
| $40,000 to $44,999 | 4,052 (5.1%) | 4,335 (6.7%) |
| $45,000 to $49,999 | 4,950 (6.2%) | 4,216 (6.5%) |
| $50,000 to $54,999 | 4,015 (5.0%) | 2,556 (4.0%) |
| $55,000 to $64,999 | 7,158 (9.0%) | 3,855 (6.0%) |
| $65,000 to $74,999 | 7,052 (8.8%) | 3,045 (4.7%) |
| $75,000 to $99,999 | 9,920 (12.4%) | 3,683 (5.7%) |
| $100,000+ | 11,964 (15.0%) | 2,835 (4.4%) |
| Total | 79,808 (100.0%) | 64,544 (100.0%) |
Earnings by Sex by Educational Attainment in Weber County
Average earnings in Weber County are $58,694 for men and $36,676 for women, a difference of 37.5%. Men with an educational attainment of graduate degree enjoy the highest average annual earnings of $96,491, while those with less than high school education earn the least with $41,871. Women with an educational attainment of graduate degree earn the most with the average annual earnings of $67,905, while those with less than high school education have the smallest earnings of $27,986.
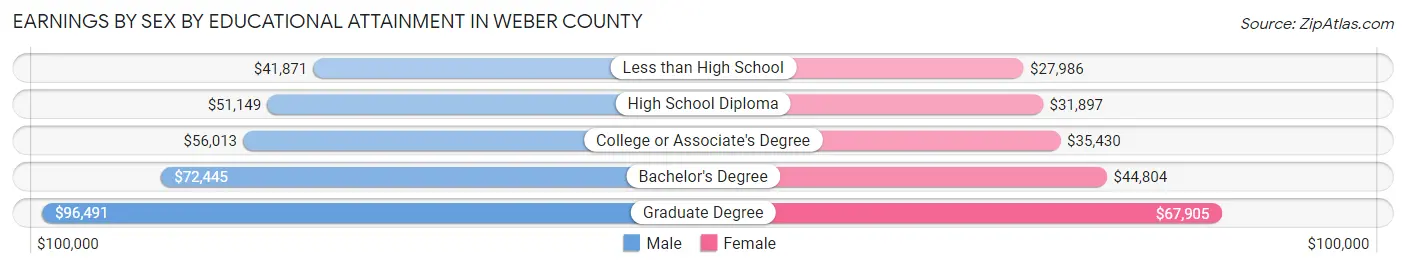
| Educational Attainment | Male Income | Female Income |
| Less than High School | $41,871 | $27,986 |
| High School Diploma | $51,149 | $31,897 |
| College or Associate's Degree | $56,013 | $35,430 |
| Bachelor's Degree | $72,445 | $44,804 |
| Graduate Degree | $96,491 | $67,905 |
| Total | $58,694 | $36,676 |
Family Income in Weber County
Family Income Brackets in Weber County
According to the Weber County family income data, there are 16,274 families falling into the $100,000 to $149,999 income range, which is the most common income bracket and makes up 24.8% of all families. Conversely, the $10,000 to $14,999 income bracket is the least frequent group with only 525 families (0.8%) belonging to this category.
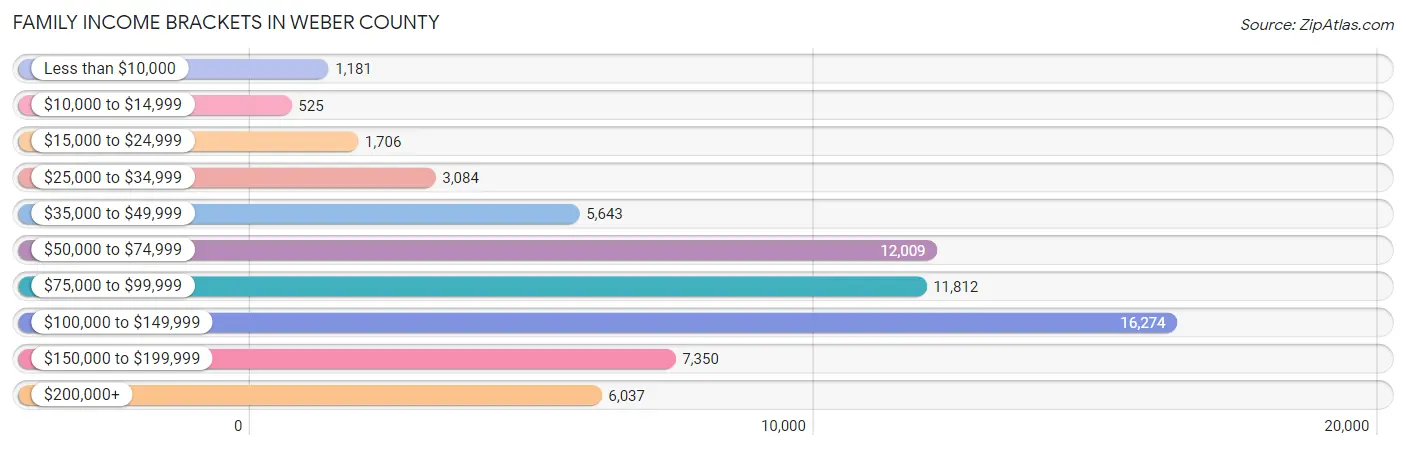
| Income Bracket | # Families | % Families |
| Less than $10,000 | 1,181 | 1.8% |
| $10,000 to $14,999 | 525 | 0.8% |
| $15,000 to $24,999 | 1,706 | 2.6% |
| $25,000 to $34,999 | 3,084 | 4.7% |
| $35,000 to $49,999 | 5,643 | 8.6% |
| $50,000 to $74,999 | 12,009 | 18.3% |
| $75,000 to $99,999 | 11,812 | 18.0% |
| $100,000 to $149,999 | 16,274 | 24.8% |
| $150,000 to $199,999 | 7,350 | 11.2% |
| $200,000+ | 6,037 | 9.2% |
Family Income by Famaliy Size in Weber County
7+ person families (2,333 | 3.6%) account for the highest median family income in Weber County with $117,737 per family, while 2-person families (25,928 | 39.5%) have the highest median income of $40,998 per family member.
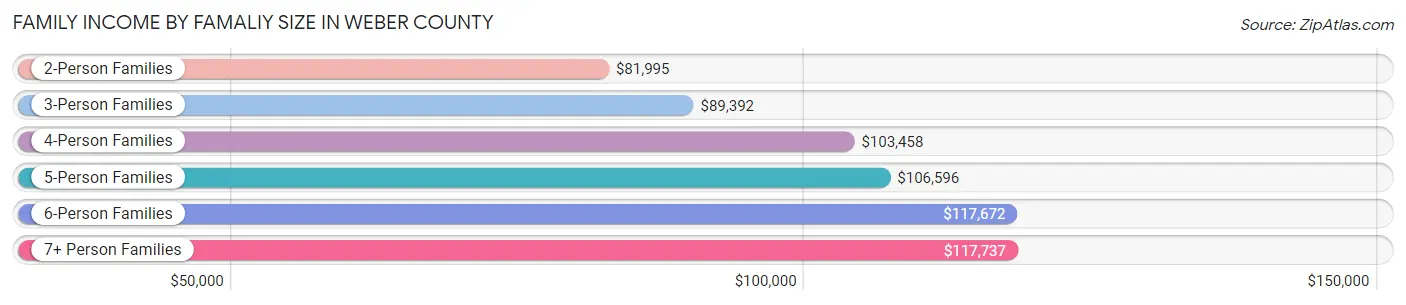
| Income Bracket | # Families | Median Income |
| 2-Person Families | 25,928 (39.5%) | $81,995 |
| 3-Person Families | 13,678 (20.8%) | $89,392 |
| 4-Person Families | 12,372 (18.9%) | $103,458 |
| 5-Person Families | 7,699 (11.7%) | $106,596 |
| 6-Person Families | 3,611 (5.5%) | $117,672 |
| 7+ Person Families | 2,333 (3.6%) | $117,737 |
| Total | 65,621 (100.0%) | $93,444 |
Family Income by Number of Earners in Weber County
The median family income in Weber County is $93,444, with families comprising 3+ earners (11,581) having the highest median family income of $138,790, while families with no earners (7,506) have the lowest median family income of $59,134, accounting for 17.6% and 11.4% of families, respectively.
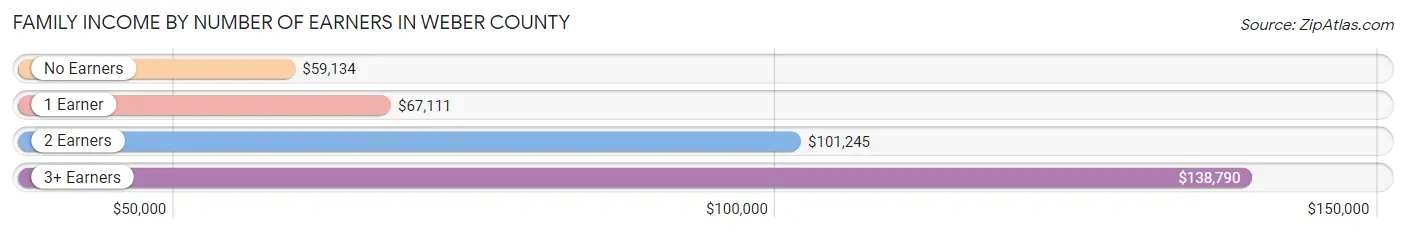
| Number of Earners | # Families | Median Income |
| No Earners | 7,506 (11.4%) | $59,134 |
| 1 Earner | 19,609 (29.9%) | $67,111 |
| 2 Earners | 26,925 (41.0%) | $101,245 |
| 3+ Earners | 11,581 (17.6%) | $138,790 |
| Total | 65,621 (100.0%) | $93,444 |
Household Income in Weber County
Household Income Brackets in Weber County
With 19,618 households falling in the category, the $100,000 to $149,999 income range is the most frequent in Weber County, accounting for 21.8% of all households. In contrast, only 2,070 households (2.3%) fall into the $10,000 to $14,999 income bracket, making it the least populous group.
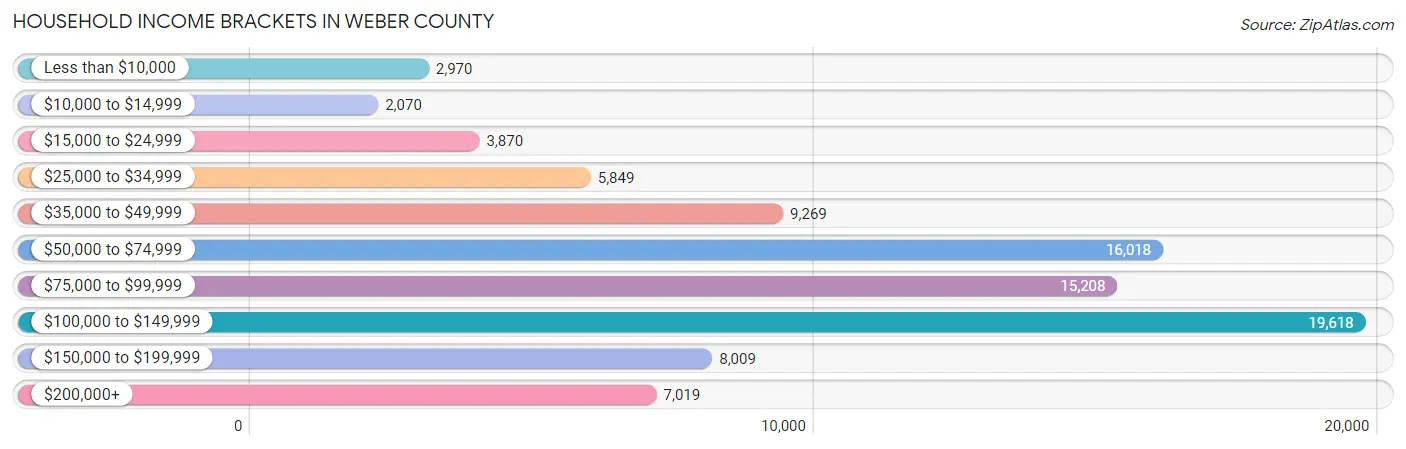
| Income Bracket | # Households | % Households |
| Less than $10,000 | 2,970 | 3.3% |
| $10,000 to $14,999 | 2,070 | 2.3% |
| $15,000 to $24,999 | 3,870 | 4.3% |
| $25,000 to $34,999 | 5,849 | 6.5% |
| $35,000 to $49,999 | 9,269 | 10.3% |
| $50,000 to $74,999 | 16,018 | 17.8% |
| $75,000 to $99,999 | 15,208 | 16.9% |
| $100,000 to $149,999 | 19,618 | 21.8% |
| $150,000 to $199,999 | 8,009 | 8.9% |
| $200,000+ | 7,019 | 7.8% |
Household Income by Householder Age in Weber County
The median household income in Weber County is $82,291, with the highest median household income of $101,720 found in the 45 to 64 years age bracket for the primary householder. A total of 30,459 households (33.9%) fall into this category. Meanwhile, the 15 to 24 years age bracket for the primary householder has the lowest median household income of $52,002, with 4,513 households (5.0%) in this group.
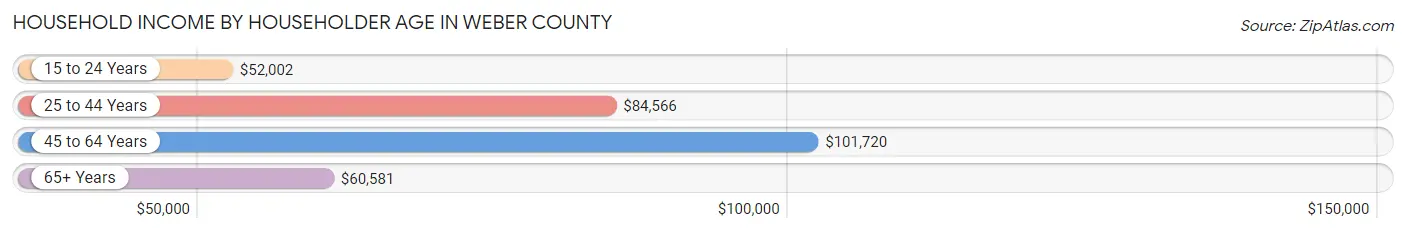
| Income Bracket | # Households | Median Income |
| 15 to 24 Years | 4,513 (5.0%) | $52,002 |
| 25 to 44 Years | 35,782 (39.8%) | $84,566 |
| 45 to 64 Years | 30,459 (33.9%) | $101,720 |
| 65+ Years | 19,236 (21.4%) | $60,581 |
| Total | 89,990 (100.0%) | $82,291 |
Poverty in Weber County
Income Below Poverty by Sex and Age in Weber County
With 7.1% poverty level for males and 8.2% for females among the residents of Weber County, 15 year old males and 18 to 24 year old females are the most vulnerable to poverty, with 268 males (12.2%) and 1,325 females (10.5%) in their respective age groups living below the poverty level.
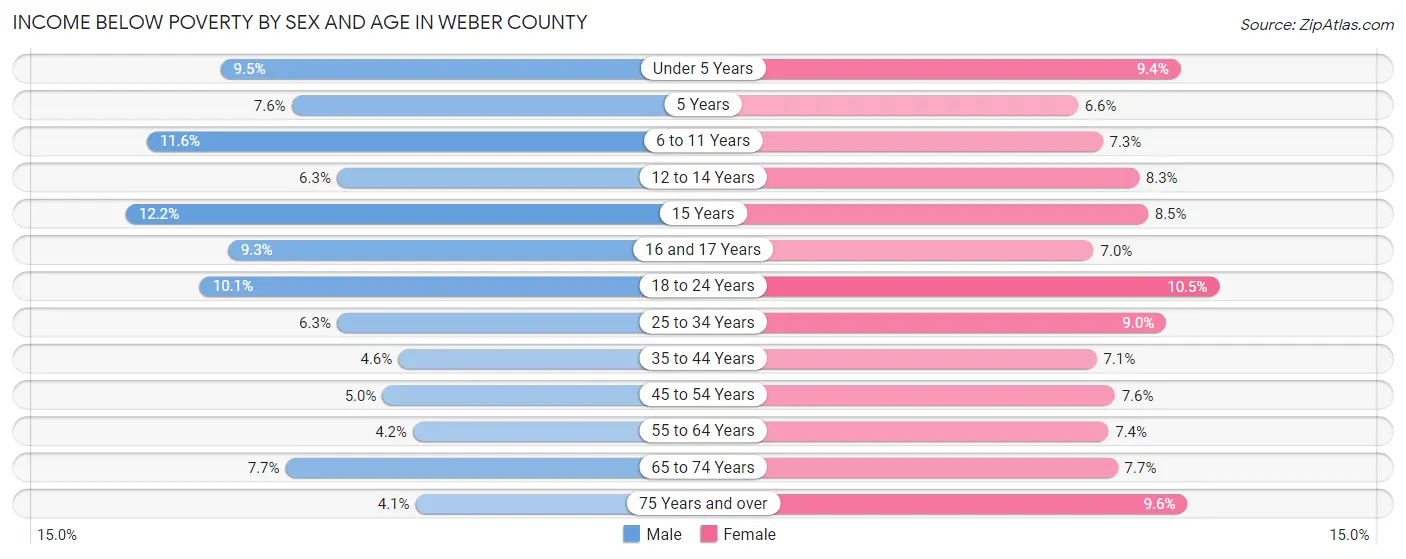
| Age Bracket | Male | Female |
| Under 5 Years | 890 (9.5%) | 841 (9.4%) |
| 5 Years | 171 (7.6%) | 108 (6.6%) |
| 6 to 11 Years | 1,488 (11.6%) | 857 (7.3%) |
| 12 to 14 Years | 354 (6.3%) | 520 (8.3%) |
| 15 Years | 268 (12.2%) | 174 (8.5%) |
| 16 and 17 Years | 378 (9.3%) | 279 (7.0%) |
| 18 to 24 Years | 1,352 (10.1%) | 1,325 (10.5%) |
| 25 to 34 Years | 1,280 (6.3%) | 1,749 (9.0%) |
| 35 to 44 Years | 877 (4.6%) | 1,259 (7.1%) |
| 45 to 54 Years | 731 (5.0%) | 1,072 (7.6%) |
| 55 to 64 Years | 577 (4.2%) | 1,001 (7.4%) |
| 65 to 74 Years | 714 (7.7%) | 752 (7.7%) |
| 75 Years and over | 211 (4.1%) | 638 (9.6%) |
| Total | 9,291 (7.1%) | 10,575 (8.2%) |
Income Above Poverty by Sex and Age in Weber County
According to the poverty statistics in Weber County, males aged 75 years and over and females aged 5 years are the age groups that are most secure financially, with 95.9% of males and 93.4% of females in these age groups living above the poverty line.
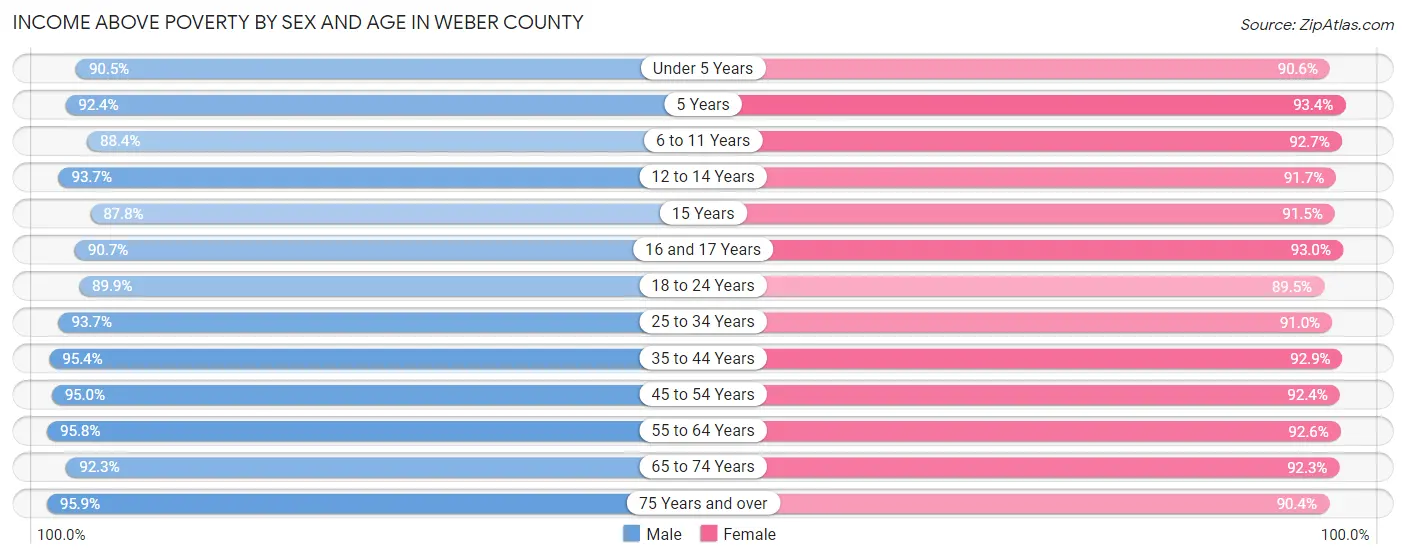
| Age Bracket | Male | Female |
| Under 5 Years | 8,444 (90.5%) | 8,080 (90.6%) |
| 5 Years | 2,087 (92.4%) | 1,535 (93.4%) |
| 6 to 11 Years | 11,338 (88.4%) | 10,952 (92.7%) |
| 12 to 14 Years | 5,252 (93.7%) | 5,769 (91.7%) |
| 15 Years | 1,933 (87.8%) | 1,868 (91.5%) |
| 16 and 17 Years | 3,669 (90.7%) | 3,702 (93.0%) |
| 18 to 24 Years | 12,009 (89.9%) | 11,283 (89.5%) |
| 25 to 34 Years | 19,004 (93.7%) | 17,617 (91.0%) |
| 35 to 44 Years | 18,169 (95.4%) | 16,498 (92.9%) |
| 45 to 54 Years | 13,778 (95.0%) | 13,035 (92.4%) |
| 55 to 64 Years | 13,199 (95.8%) | 12,493 (92.6%) |
| 65 to 74 Years | 8,516 (92.3%) | 9,040 (92.3%) |
| 75 Years and over | 4,913 (95.9%) | 5,991 (90.4%) |
| Total | 122,311 (92.9%) | 117,863 (91.8%) |
Income Below Poverty Among Married-Couple Families in Weber County
The poverty statistics for married-couple families in Weber County show that 2.7% or 1,363 of the total 50,609 families live below the poverty line. Families with 5 or more children have the highest poverty rate of 8.6%, comprising of 88 families. On the other hand, families with no children have the lowest poverty rate of 1.6%, which includes 414 families.
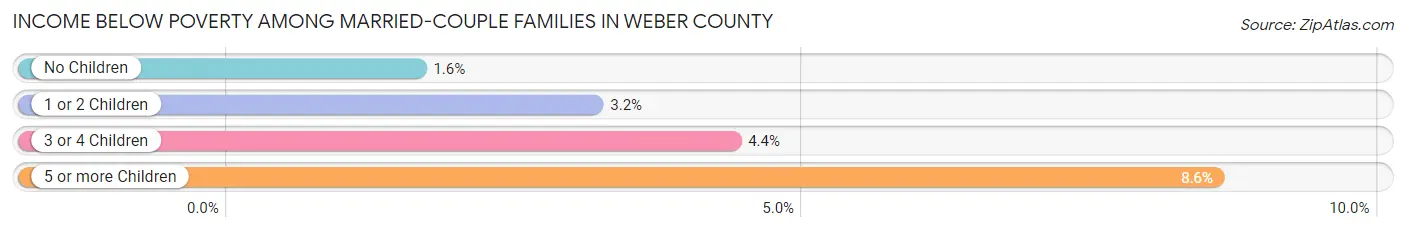
| Children | Above Poverty | Below Poverty |
| No Children | 24,836 (98.4%) | 414 (1.6%) |
| 1 or 2 Children | 16,530 (96.8%) | 543 (3.2%) |
| 3 or 4 Children | 6,944 (95.6%) | 318 (4.4%) |
| 5 or more Children | 936 (91.4%) | 88 (8.6%) |
| Total | 49,246 (97.3%) | 1,363 (2.7%) |
Income Below Poverty Among Single-Parent Households in Weber County
According to the poverty data in Weber County, 3.6% or 205 single-father households and 18.4% or 1,716 single-mother households are living below the poverty line. Among single-father households, those with 5 or more children have the highest poverty rate, with 34 households (46.0%) experiencing poverty. Likewise, among single-mother households, those with 3 or 4 children have the highest poverty rate, with 538 households (40.4%) falling below the poverty line.
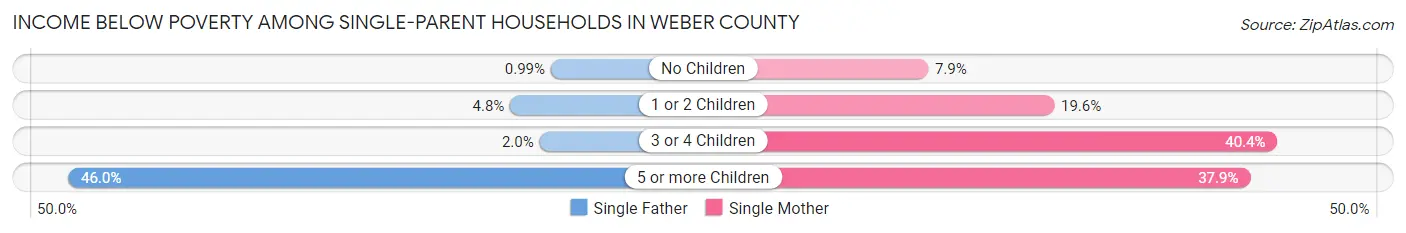
| Children | Single Father | Single Mother |
| No Children | 19 (1.0%) | 273 (7.9%) |
| 1 or 2 Children | 134 (4.8%) | 866 (19.6%) |
| 3 or 4 Children | 18 (2.0%) | 538 (40.4%) |
| 5 or more Children | 34 (46.0%) | 39 (37.9%) |
| Total | 205 (3.6%) | 1,716 (18.4%) |
Income Below Poverty Among Married-Couple vs Single-Parent Households in Weber County
The poverty data for Weber County shows that 1,363 of the married-couple family households (2.7%) and 1,921 of the single-parent households (12.8%) are living below the poverty level. Within the married-couple family households, those with 5 or more children have the highest poverty rate, with 88 households (8.6%) falling below the poverty line. Among the single-parent households, those with 5 or more children have the highest poverty rate, with 73 household (41.2%) living below poverty.
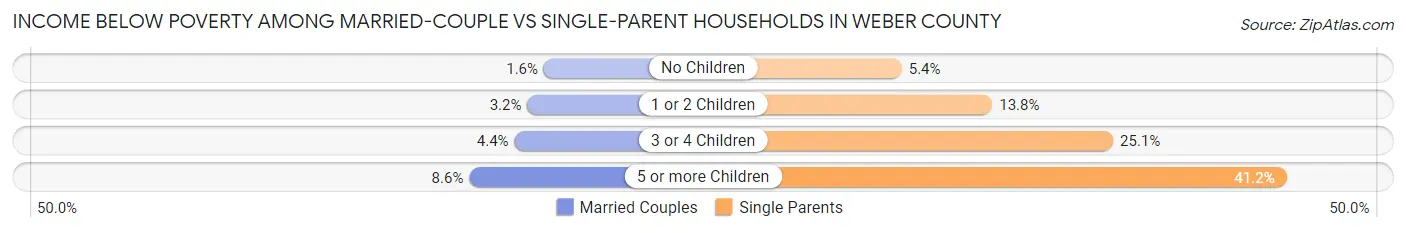
| Children | Married-Couple Families | Single-Parent Households |
| No Children | 414 (1.6%) | 292 (5.4%) |
| 1 or 2 Children | 543 (3.2%) | 1,000 (13.8%) |
| 3 or 4 Children | 318 (4.4%) | 556 (25.1%) |
| 5 or more Children | 88 (8.6%) | 73 (41.2%) |
| Total | 1,363 (2.7%) | 1,921 (12.8%) |
Employment Characteristics in Weber County
Employment by Class of Employer in Weber County
Among the 131,828 employed individuals in Weber County, private company employees (88,757 | 67.3%), federal government employees (12,171 | 9.2%), and local government employees (7,716 | 5.9%) make up the most common classes of employment.
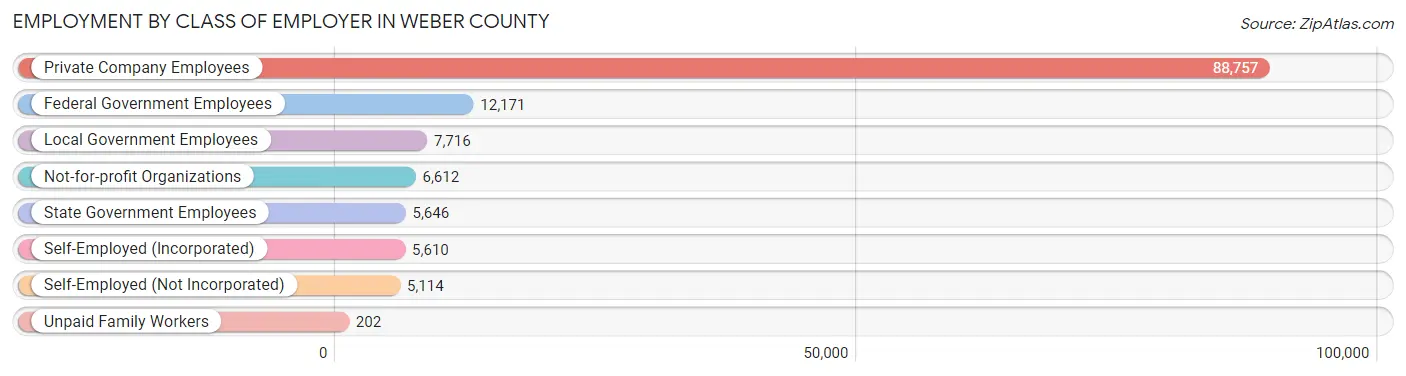
| Employer Class | # Employees | % Employees |
| Private Company Employees | 88,757 | 67.3% |
| Self-Employed (Incorporated) | 5,610 | 4.3% |
| Self-Employed (Not Incorporated) | 5,114 | 3.9% |
| Not-for-profit Organizations | 6,612 | 5.0% |
| Local Government Employees | 7,716 | 5.9% |
| State Government Employees | 5,646 | 4.3% |
| Federal Government Employees | 12,171 | 9.2% |
| Unpaid Family Workers | 202 | 0.2% |
| Total | 131,828 | 100.0% |
Employment Status by Age in Weber County
According to the labor force statistics for Weber County, out of the total population over 16 years of age (199,183), 69.4% or 138,233 individuals are in the labor force, with 3.1% or 4,285 of them unemployed. The age group with the highest labor force participation rate is 25 to 29 years, with 86.7% or 17,982 individuals in the labor force. Within the labor force, the 16 to 19 years age range has the highest percentage of unemployed individuals, with 8.9% or 756 of them being unemployed.
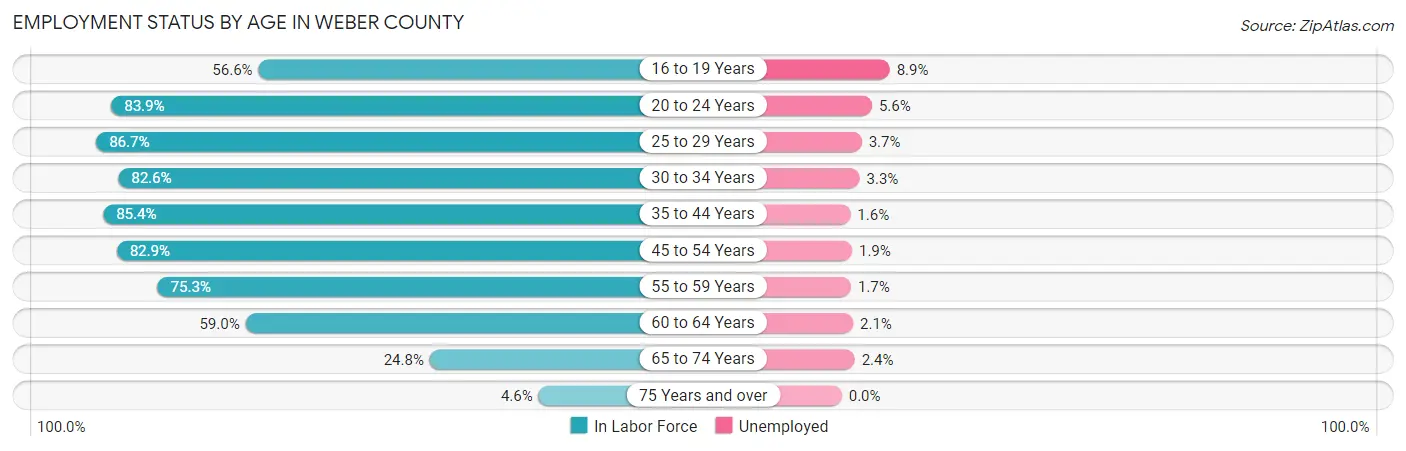
| Age Bracket | In Labor Force | Unemployed |
| 16 to 19 Years | 8,493 (56.6%) | 756 (8.9%) |
| 20 to 24 Years | 16,266 (83.9%) | 911 (5.6%) |
| 25 to 29 Years | 17,982 (86.7%) | 665 (3.7%) |
| 30 to 34 Years | 15,903 (82.6%) | 525 (3.3%) |
| 35 to 44 Years | 31,690 (85.4%) | 507 (1.6%) |
| 45 to 54 Years | 23,912 (82.9%) | 454 (1.9%) |
| 55 to 59 Years | 10,807 (75.3%) | 184 (1.7%) |
| 60 to 64 Years | 7,778 (59.0%) | 163 (2.1%) |
| 65 to 74 Years | 4,756 (24.8%) | 114 (2.4%) |
| 75 Years and over | 558 (4.6%) | 0 (0.0%) |
| Total | 138,233 (69.4%) | 4,285 (3.1%) |
Employment Status by Educational Attainment in Weber County
According to labor force statistics for Weber County, 81.0% of individuals (108,119) out of the total population between 25 and 64 years of age (133,480) are in the labor force, with 2.3% or 2,487 of them being unemployed. The group with the highest labor force participation rate are those with the educational attainment of bachelor's degree or higher, with 86.0% or 31,360 individuals in the labor force. Within the labor force, individuals with less than high school education have the highest percentage of unemployment, with 4.5% or 310 of them being unemployed.
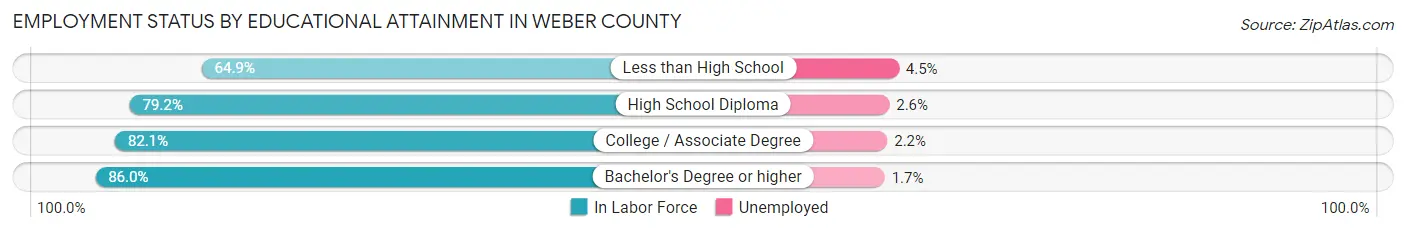
| Educational Attainment | In Labor Force | Unemployed |
| Less than High School | 6,891 (64.9%) | 478 (4.5%) |
| High School Diploma | 31,188 (79.2%) | 1,024 (2.6%) |
| College / Associate Degree | 38,602 (82.1%) | 1,034 (2.2%) |
| Bachelor's Degree or higher | 31,360 (86.0%) | 620 (1.7%) |
| Total | 108,119 (81.0%) | 3,070 (2.3%) |
Employment Occupations by Sex in Weber County
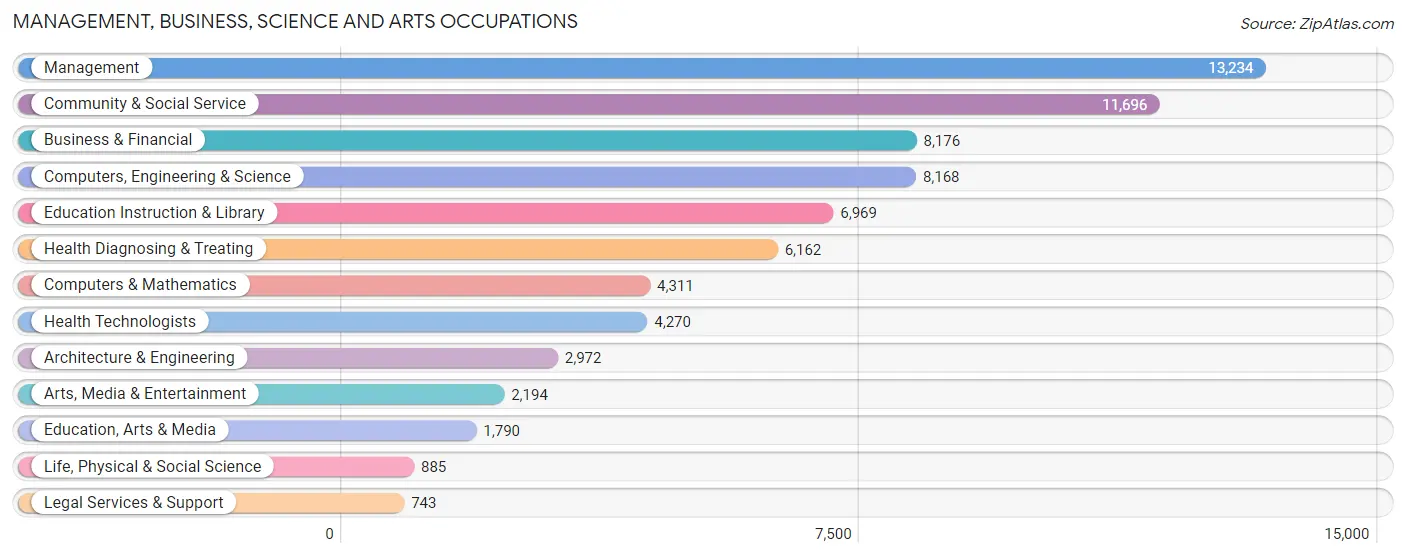
Management, Business, Science and Arts Occupations
The most common Management, Business, Science and Arts occupations in Weber County are Management (13,234 | 10.0%), Community & Social Service (11,696 | 8.8%), Business & Financial (8,176 | 6.2%), Computers, Engineering & Science (8,168 | 6.1%), and Education Instruction & Library (6,969 | 5.2%).
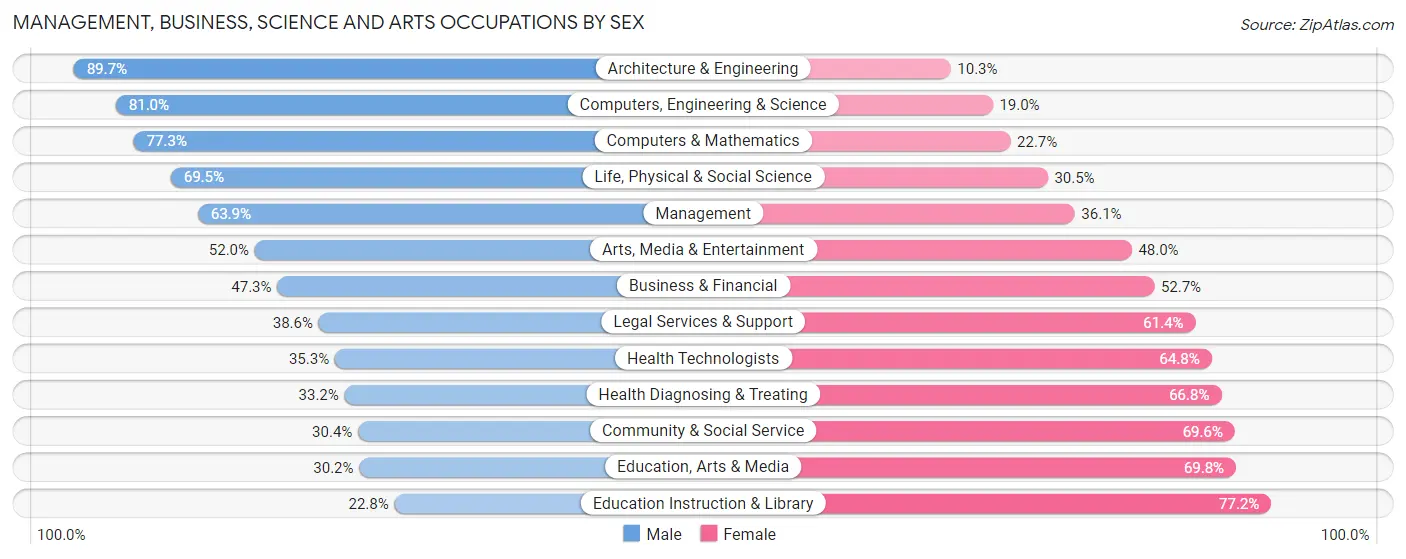
Management, Business, Science and Arts Occupations by Sex
Within the Management, Business, Science and Arts occupations in Weber County, the most male-oriented occupations are Architecture & Engineering (89.7%), Computers, Engineering & Science (81.0%), and Computers & Mathematics (77.3%), while the most female-oriented occupations are Education Instruction & Library (77.2%), Education, Arts & Media (69.8%), and Community & Social Service (69.6%).
| Occupation | Male | Female |
| Management | 8,451 (63.9%) | 4,783 (36.1%) |
| Business & Financial | 3,865 (47.3%) | 4,311 (52.7%) |
| Computers, Engineering & Science | 6,613 (81.0%) | 1,555 (19.0%) |
| Computers & Mathematics | 3,331 (77.3%) | 980 (22.7%) |
| Architecture & Engineering | 2,667 (89.7%) | 305 (10.3%) |
| Life, Physical & Social Science | 615 (69.5%) | 270 (30.5%) |
| Community & Social Service | 3,558 (30.4%) | 8,138 (69.6%) |
| Education, Arts & Media | 540 (30.2%) | 1,250 (69.8%) |
| Legal Services & Support | 287 (38.6%) | 456 (61.4%) |
| Education Instruction & Library | 1,591 (22.8%) | 5,378 (77.2%) |
| Arts, Media & Entertainment | 1,140 (52.0%) | 1,054 (48.0%) |
| Health Diagnosing & Treating | 2,048 (33.2%) | 4,114 (66.8%) |
| Health Technologists | 1,505 (35.2%) | 2,765 (64.7%) |
| Total (Category) | 24,535 (51.7%) | 22,901 (48.3%) |
| Total (Overall) | 73,760 (55.6%) | 58,949 (44.4%) |
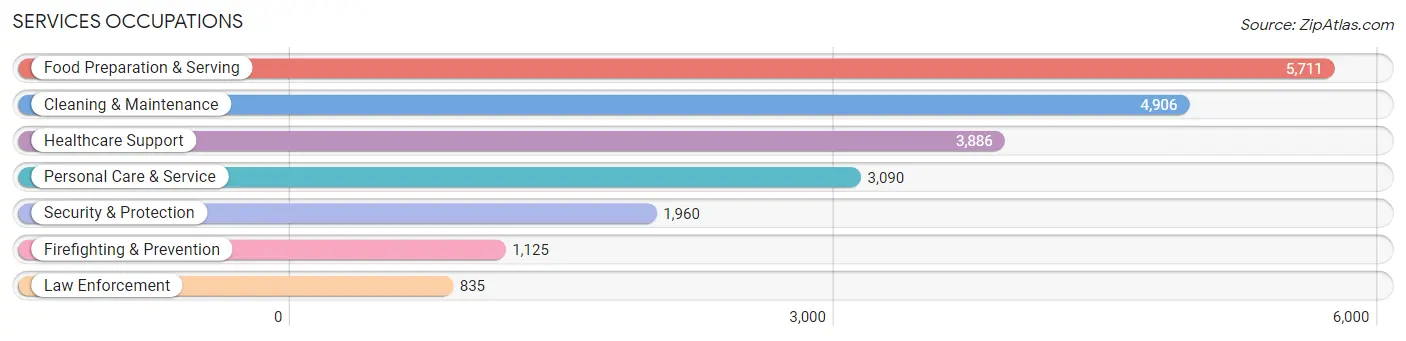
Services Occupations
The most common Services occupations in Weber County are Food Preparation & Serving (5,711 | 4.3%), Cleaning & Maintenance (4,906 | 3.7%), Healthcare Support (3,886 | 2.9%), Personal Care & Service (3,090 | 2.3%), and Security & Protection (1,960 | 1.5%).
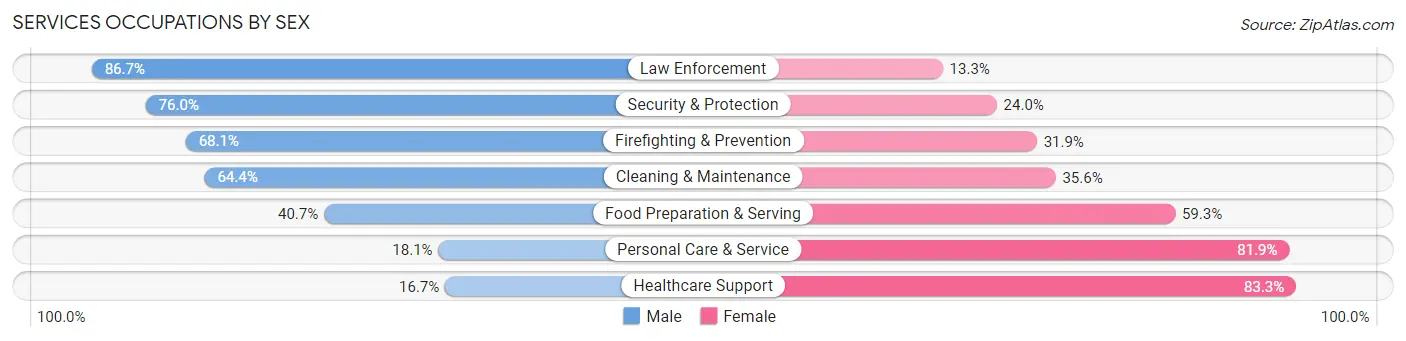
Services Occupations by Sex
Within the Services occupations in Weber County, the most male-oriented occupations are Law Enforcement (86.7%), Security & Protection (76.0%), and Firefighting & Prevention (68.1%), while the most female-oriented occupations are Healthcare Support (83.3%), Personal Care & Service (81.9%), and Food Preparation & Serving (59.3%).
| Occupation | Male | Female |
| Healthcare Support | 650 (16.7%) | 3,236 (83.3%) |
| Security & Protection | 1,490 (76.0%) | 470 (24.0%) |
| Firefighting & Prevention | 766 (68.1%) | 359 (31.9%) |
| Law Enforcement | 724 (86.7%) | 111 (13.3%) |
| Food Preparation & Serving | 2,325 (40.7%) | 3,386 (59.3%) |
| Cleaning & Maintenance | 3,158 (64.4%) | 1,748 (35.6%) |
| Personal Care & Service | 558 (18.1%) | 2,532 (81.9%) |
| Total (Category) | 8,181 (41.8%) | 11,372 (58.2%) |
| Total (Overall) | 73,760 (55.6%) | 58,949 (44.4%) |
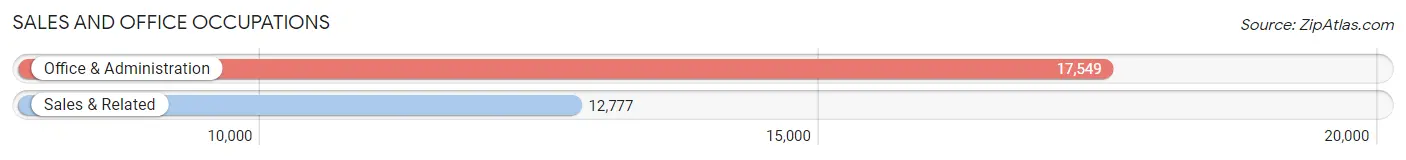
Sales and Office Occupations
The most common Sales and Office occupations in Weber County are Office & Administration (17,549 | 13.2%), and Sales & Related (12,777 | 9.6%).
Sales and Office Occupations by Sex
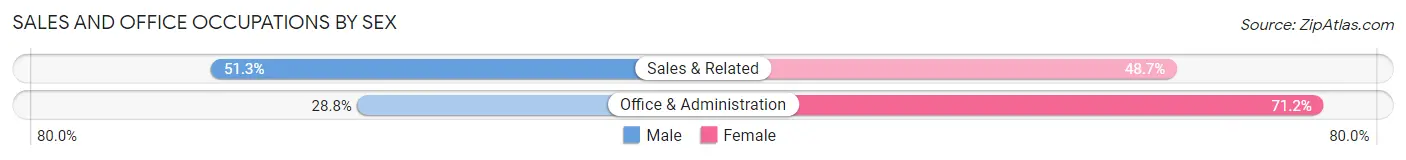
| Occupation | Male | Female |
| Sales & Related | 6,556 (51.3%) | 6,221 (48.7%) |
| Office & Administration | 5,047 (28.8%) | 12,502 (71.2%) |
| Total (Category) | 11,603 (38.3%) | 18,723 (61.7%) |
| Total (Overall) | 73,760 (55.6%) | 58,949 (44.4%) |
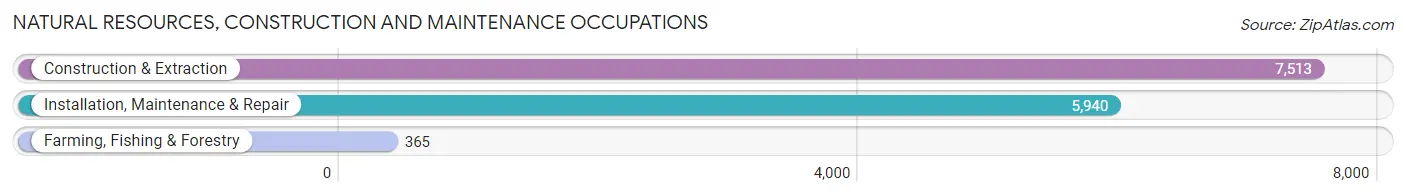
Natural Resources, Construction and Maintenance Occupations
The most common Natural Resources, Construction and Maintenance occupations in Weber County are Construction & Extraction (7,513 | 5.7%), Installation, Maintenance & Repair (5,940 | 4.5%), and Farming, Fishing & Forestry (365 | 0.3%).
Natural Resources, Construction and Maintenance Occupations by Sex
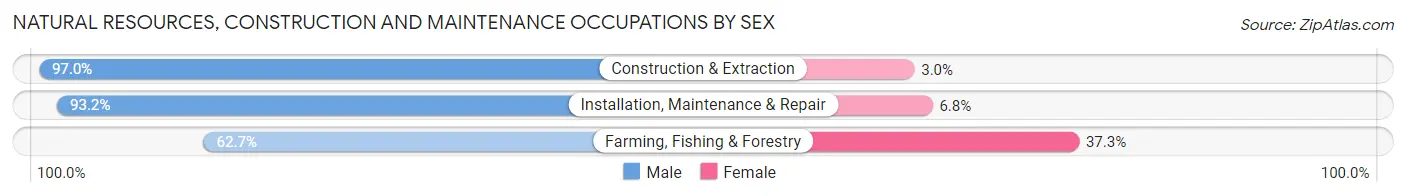
| Occupation | Male | Female |
| Farming, Fishing & Forestry | 229 (62.7%) | 136 (37.3%) |
| Construction & Extraction | 7,288 (97.0%) | 225 (3.0%) |
| Installation, Maintenance & Repair | 5,538 (93.2%) | 402 (6.8%) |
| Total (Category) | 13,055 (94.5%) | 763 (5.5%) |
| Total (Overall) | 73,760 (55.6%) | 58,949 (44.4%) |
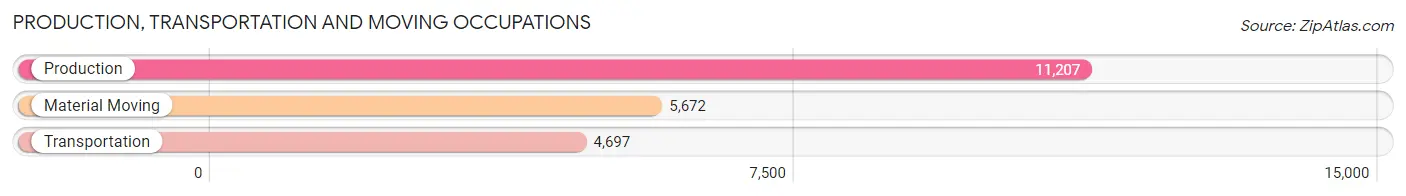
Production, Transportation and Moving Occupations
The most common Production, Transportation and Moving occupations in Weber County are Production (11,207 | 8.4%), Material Moving (5,672 | 4.3%), and Transportation (4,697 | 3.5%).
Production, Transportation and Moving Occupations by Sex
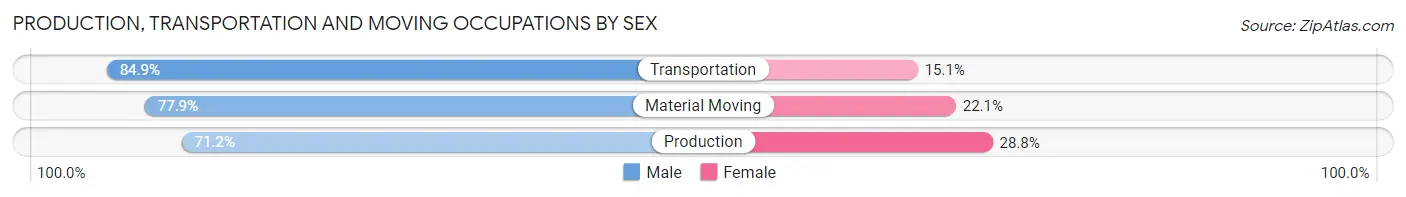
| Occupation | Male | Female |
| Production | 7,977 (71.2%) | 3,230 (28.8%) |
| Transportation | 3,989 (84.9%) | 708 (15.1%) |
| Material Moving | 4,420 (77.9%) | 1,252 (22.1%) |
| Total (Category) | 16,386 (75.9%) | 5,190 (24.0%) |
| Total (Overall) | 73,760 (55.6%) | 58,949 (44.4%) |
Employment Industries by Sex in Weber County
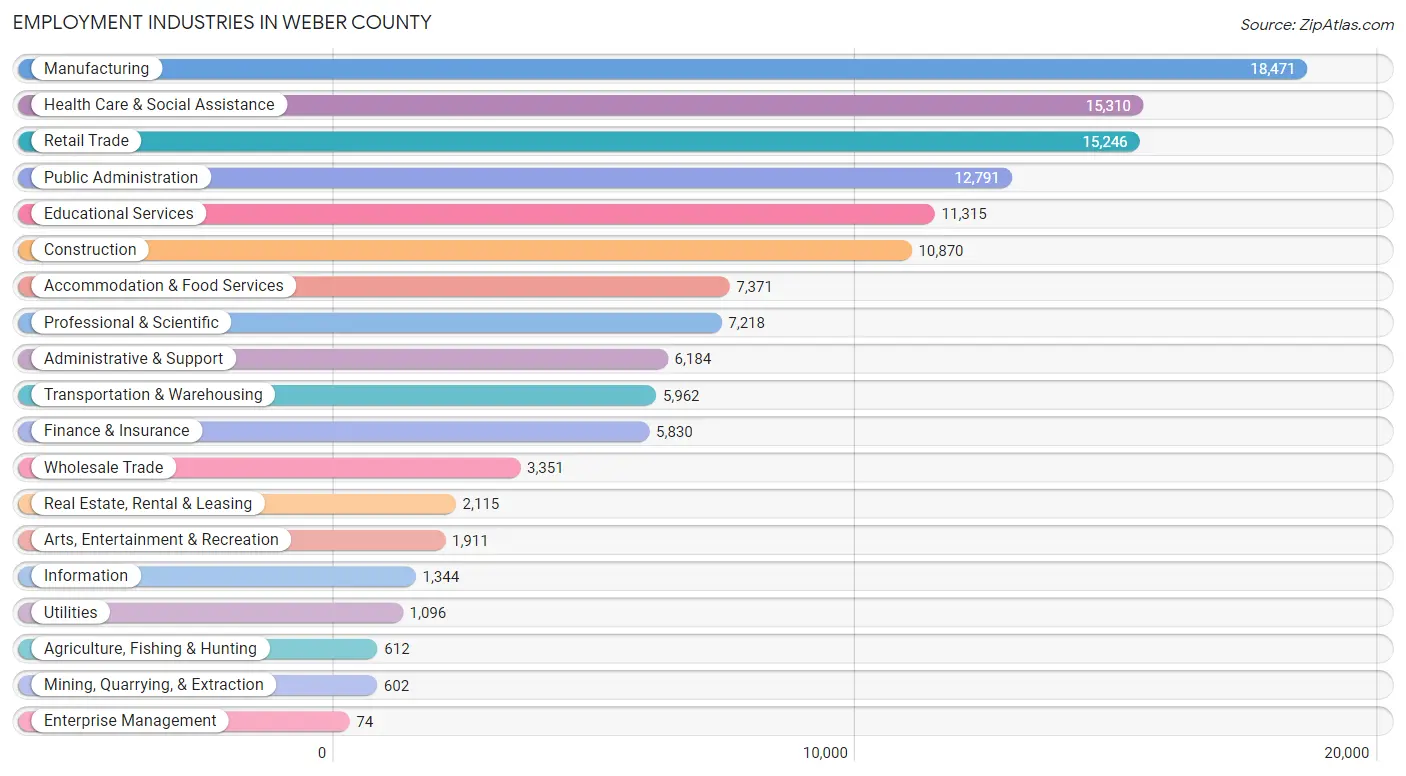
Employment Industries in Weber County
The major employment industries in Weber County include Manufacturing (18,471 | 13.9%), Health Care & Social Assistance (15,310 | 11.5%), Retail Trade (15,246 | 11.5%), Public Administration (12,791 | 9.6%), and Educational Services (11,315 | 8.5%).
Employment Industries by Sex in Weber County
The Weber County industries that see more men than women are Construction (89.3%), Utilities (89.0%), and Wholesale Trade (81.6%), whereas the industries that tend to have a higher number of women are Health Care & Social Assistance (71.9%), Educational Services (68.9%), and Finance & Insurance (61.3%).
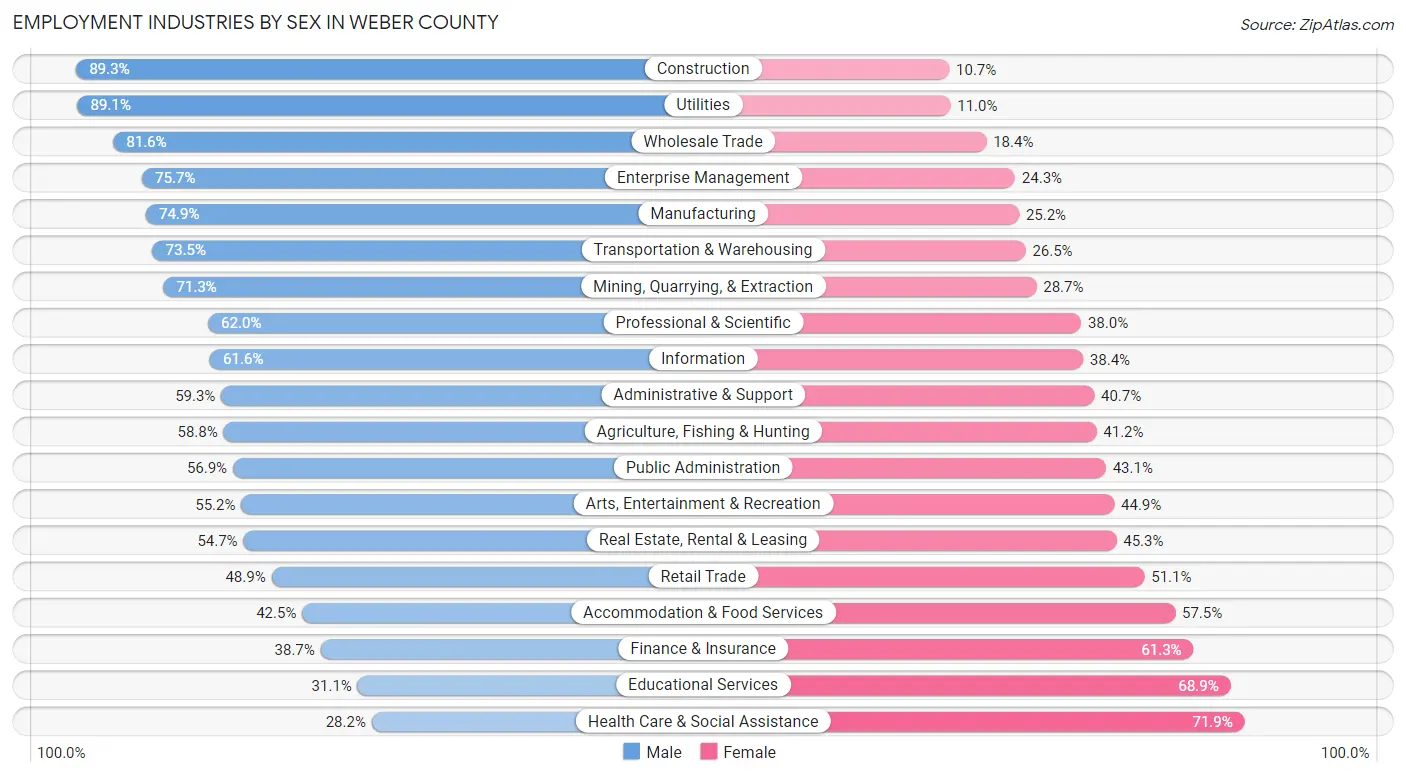
| Industry | Male | Female |
| Agriculture, Fishing & Hunting | 360 (58.8%) | 252 (41.2%) |
| Mining, Quarrying, & Extraction | 429 (71.3%) | 173 (28.7%) |
| Construction | 9,707 (89.3%) | 1,163 (10.7%) |
| Manufacturing | 13,825 (74.9%) | 4,646 (25.2%) |
| Wholesale Trade | 2,735 (81.6%) | 616 (18.4%) |
| Retail Trade | 7,456 (48.9%) | 7,790 (51.1%) |
| Transportation & Warehousing | 4,382 (73.5%) | 1,580 (26.5%) |
| Utilities | 976 (89.0%) | 120 (11.0%) |
| Information | 828 (61.6%) | 516 (38.4%) |
| Finance & Insurance | 2,258 (38.7%) | 3,572 (61.3%) |
| Real Estate, Rental & Leasing | 1,157 (54.7%) | 958 (45.3%) |
| Professional & Scientific | 4,476 (62.0%) | 2,742 (38.0%) |
| Enterprise Management | 56 (75.7%) | 18 (24.3%) |
| Administrative & Support | 3,668 (59.3%) | 2,516 (40.7%) |
| Educational Services | 3,514 (31.1%) | 7,801 (68.9%) |
| Health Care & Social Assistance | 4,309 (28.1%) | 11,001 (71.9%) |
| Arts, Entertainment & Recreation | 1,054 (55.1%) | 857 (44.9%) |
| Accommodation & Food Services | 3,135 (42.5%) | 4,236 (57.5%) |
| Public Administration | 7,275 (56.9%) | 5,516 (43.1%) |
| Total | 73,760 (55.6%) | 58,949 (44.4%) |
Education in Weber County
School Enrollment in Weber County
The most common levels of schooling among the 72,686 students in Weber County are middle school (16,331 | 22.5%), elementary school (16,015 | 22.0%), and high school (15,714 | 21.6%).
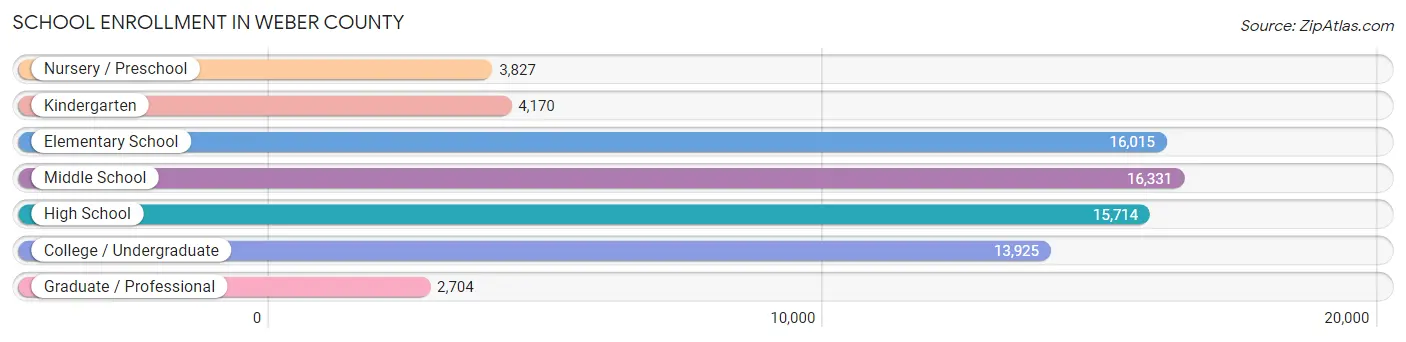
| School Level | # Students | % Students |
| Nursery / Preschool | 3,827 | 5.3% |
| Kindergarten | 4,170 | 5.7% |
| Elementary School | 16,015 | 22.0% |
| Middle School | 16,331 | 22.5% |
| High School | 15,714 | 21.6% |
| College / Undergraduate | 13,925 | 19.2% |
| Graduate / Professional | 2,704 | 3.7% |
| Total | 72,686 | 100.0% |
School Enrollment by Age by Funding Source in Weber County
Out of a total of 72,686 students who are enrolled in schools in Weber County, 6,905 (9.5%) attend a private institution, while the remaining 65,781 (90.5%) are enrolled in public schools. The age group of 3 to 4 year olds has the highest likelihood of being enrolled in private schools, with 1,063 (38.9% in the age bracket) enrolled. Conversely, the age group of 15 to 17 year olds has the lowest likelihood of being enrolled in a private school, with 11,241 (95.7% in the age bracket) attending a public institution.
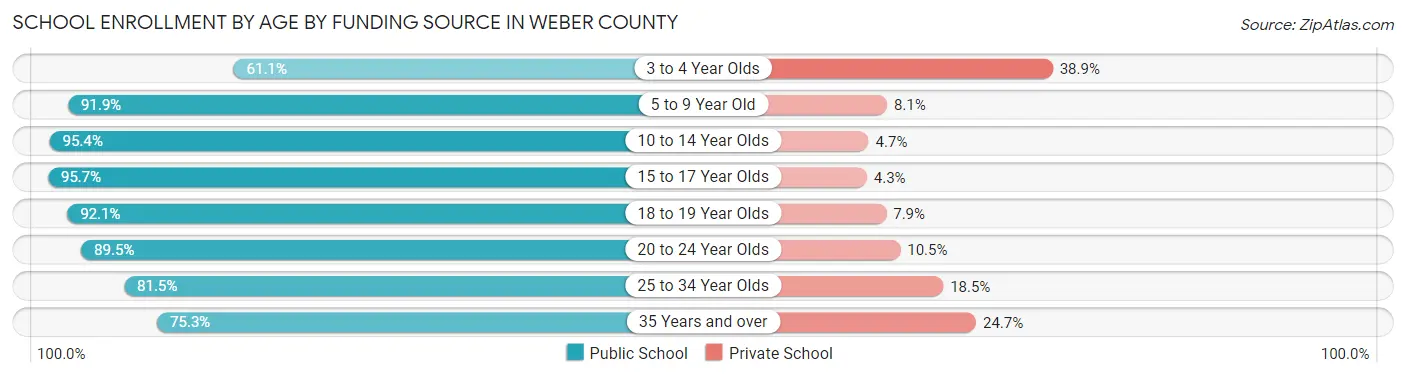
| Age Bracket | Public School | Private School |
| 3 to 4 Year Olds | 1,667 (61.1%) | 1,063 (38.9%) |
| 5 to 9 Year Old | 17,520 (91.9%) | 1,539 (8.1%) |
| 10 to 14 Year Olds | 19,382 (95.4%) | 945 (4.6%) |
| 15 to 17 Year Olds | 11,241 (95.7%) | 508 (4.3%) |
| 18 to 19 Year Olds | 3,560 (92.1%) | 307 (7.9%) |
| 20 to 24 Year Olds | 5,515 (89.5%) | 650 (10.5%) |
| 25 to 34 Year Olds | 4,028 (81.5%) | 917 (18.5%) |
| 35 Years and over | 2,896 (75.3%) | 948 (24.7%) |
| Total | 65,781 (90.5%) | 6,905 (9.5%) |
Educational Attainment by Field of Study in Weber County
Business (9,945 | 20.6%), education (6,436 | 13.4%), science & technology (5,223 | 10.8%), arts & humanities (4,500 | 9.3%), and engineering (3,901 | 8.1%) are the most common fields of study among 48,177 individuals in Weber County who have obtained a bachelor's degree or higher.
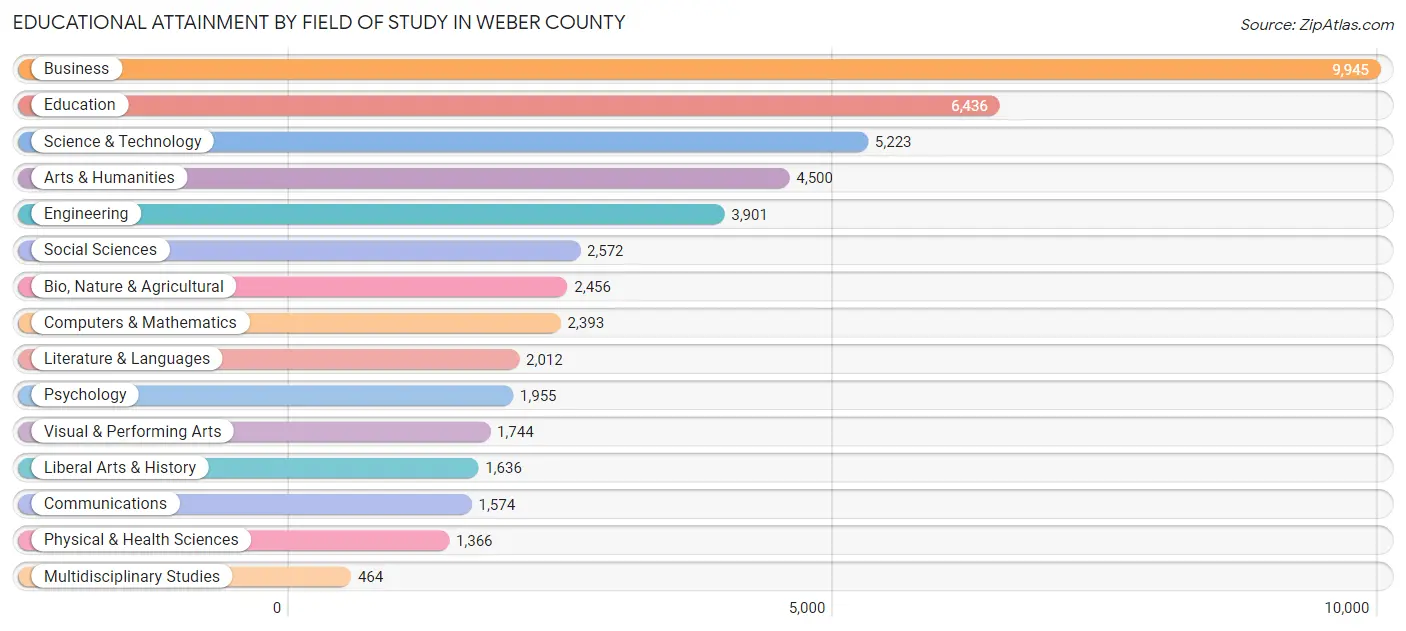
| Field of Study | # Graduates | % Graduates |
| Computers & Mathematics | 2,393 | 5.0% |
| Bio, Nature & Agricultural | 2,456 | 5.1% |
| Physical & Health Sciences | 1,366 | 2.8% |
| Psychology | 1,955 | 4.1% |
| Social Sciences | 2,572 | 5.3% |
| Engineering | 3,901 | 8.1% |
| Multidisciplinary Studies | 464 | 1.0% |
| Science & Technology | 5,223 | 10.8% |
| Business | 9,945 | 20.6% |
| Education | 6,436 | 13.4% |
| Literature & Languages | 2,012 | 4.2% |
| Liberal Arts & History | 1,636 | 3.4% |
| Visual & Performing Arts | 1,744 | 3.6% |
| Communications | 1,574 | 3.3% |
| Arts & Humanities | 4,500 | 9.3% |
| Total | 48,177 | 100.0% |
Transportation & Commute in Weber County
Vehicle Availability by Sex in Weber County
The most prevalent vehicle ownership categories in Weber County are males with 2 vehicles (27,244, accounting for 37.2%) and females with 2 vehicles (20,585, making up 46.9%).
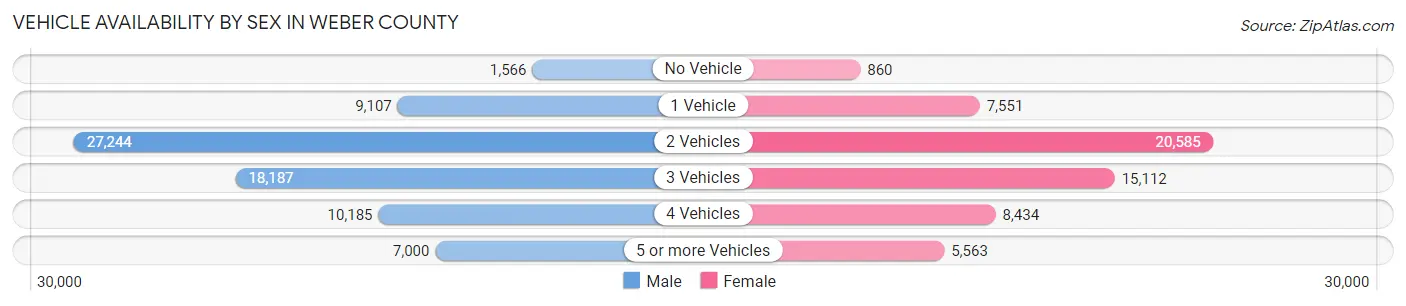
| Vehicles Available | Male | Female |
| No Vehicle | 1,566 (2.1%) | 860 (1.5%) |
| 1 Vehicle | 9,107 (12.4%) | 7,551 (13.0%) |
| 2 Vehicles | 27,244 (37.2%) | 20,585 (35.4%) |
| 3 Vehicles | 18,187 (24.8%) | 15,112 (26.0%) |
| 4 Vehicles | 10,185 (13.9%) | 8,434 (14.5%) |
| 5 or more Vehicles | 7,000 (9.6%) | 5,563 (9.6%) |
| Total | 73,289 (100.0%) | 58,105 (100.0%) |
Commute Time in Weber County
The most frequently occuring commute durations in Weber County are 15 to 19 minutes (22,999 commuters, 20.0%), 20 to 24 minutes (20,722 commuters, 18.0%), and 10 to 14 minutes (18,450 commuters, 16.0%).
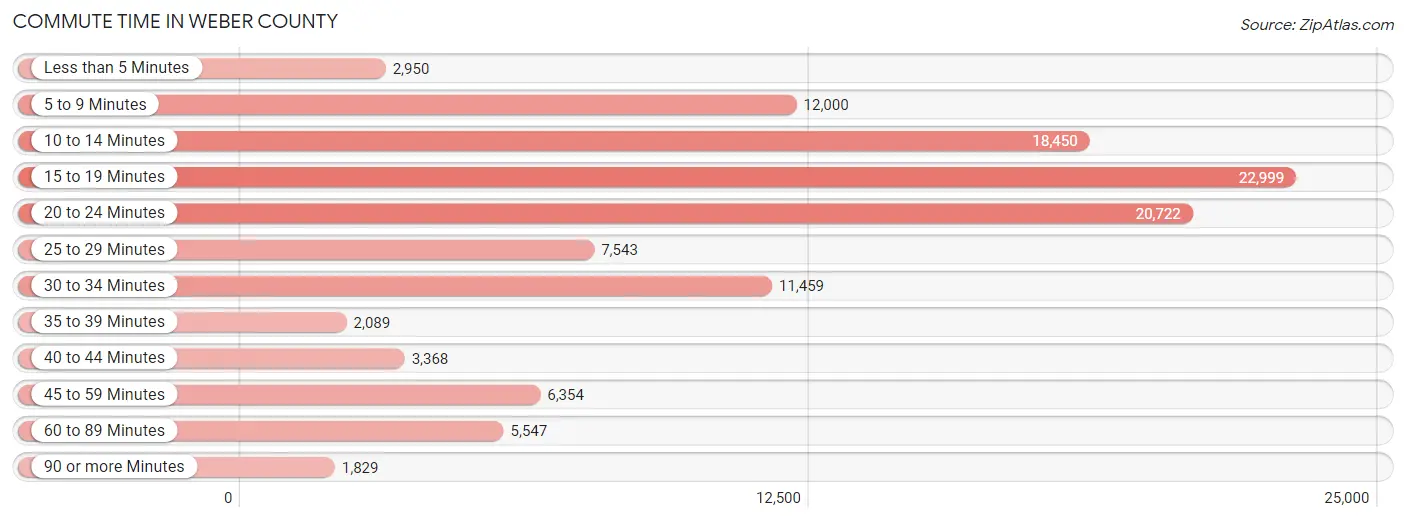
| Commute Time | # Commuters | % Commuters |
| Less than 5 Minutes | 2,950 | 2.6% |
| 5 to 9 Minutes | 12,000 | 10.4% |
| 10 to 14 Minutes | 18,450 | 16.0% |
| 15 to 19 Minutes | 22,999 | 20.0% |
| 20 to 24 Minutes | 20,722 | 18.0% |
| 25 to 29 Minutes | 7,543 | 6.5% |
| 30 to 34 Minutes | 11,459 | 9.9% |
| 35 to 39 Minutes | 2,089 | 1.8% |
| 40 to 44 Minutes | 3,368 | 2.9% |
| 45 to 59 Minutes | 6,354 | 5.5% |
| 60 to 89 Minutes | 5,547 | 4.8% |
| 90 or more Minutes | 1,829 | 1.6% |
Commute Time by Sex in Weber County
The most common commute times in Weber County are 15 to 19 minutes (12,549 commuters, 19.2%) for males and 15 to 19 minutes (10,450 commuters, 20.9%) for females.
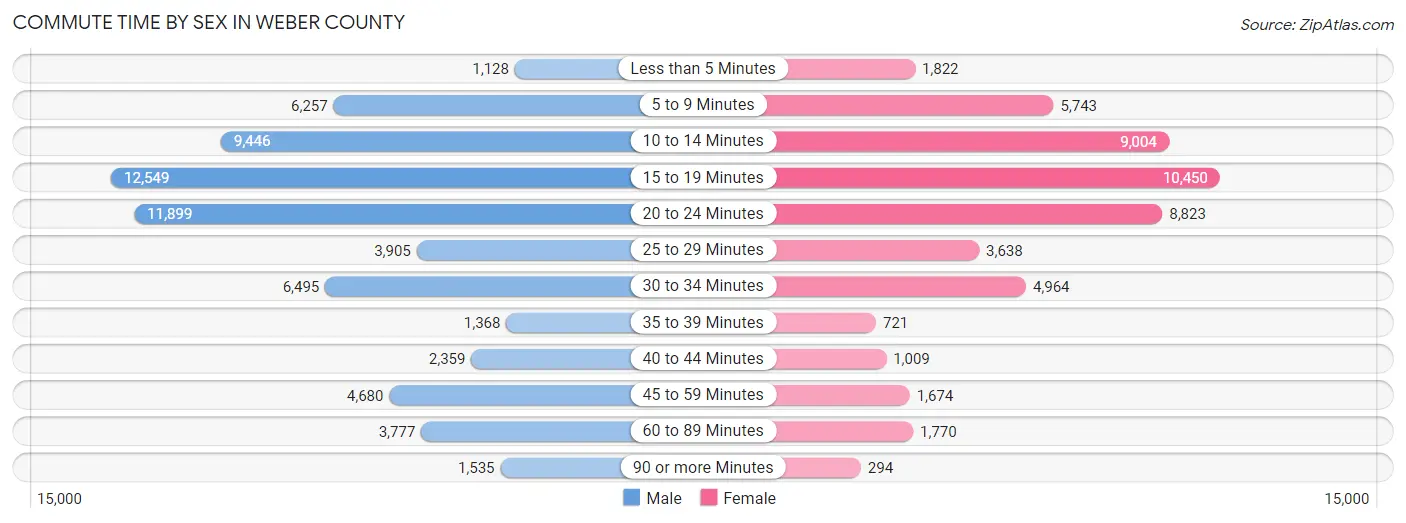
| Commute Time | Male | Female |
| Less than 5 Minutes | 1,128 (1.7%) | 1,822 (3.6%) |
| 5 to 9 Minutes | 6,257 (9.6%) | 5,743 (11.5%) |
| 10 to 14 Minutes | 9,446 (14.4%) | 9,004 (18.0%) |
| 15 to 19 Minutes | 12,549 (19.2%) | 10,450 (20.9%) |
| 20 to 24 Minutes | 11,899 (18.2%) | 8,823 (17.7%) |
| 25 to 29 Minutes | 3,905 (6.0%) | 3,638 (7.3%) |
| 30 to 34 Minutes | 6,495 (9.9%) | 4,964 (10.0%) |
| 35 to 39 Minutes | 1,368 (2.1%) | 721 (1.4%) |
| 40 to 44 Minutes | 2,359 (3.6%) | 1,009 (2.0%) |
| 45 to 59 Minutes | 4,680 (7.2%) | 1,674 (3.4%) |
| 60 to 89 Minutes | 3,777 (5.8%) | 1,770 (3.5%) |
| 90 or more Minutes | 1,535 (2.4%) | 294 (0.6%) |
Time of Departure to Work by Sex in Weber County
The most frequent times of departure to work in Weber County are 7:00 AM to 7:29 AM (7,700, 11.8%) for males and 7:30 AM to 7:59 AM (7,566, 15.2%) for females.
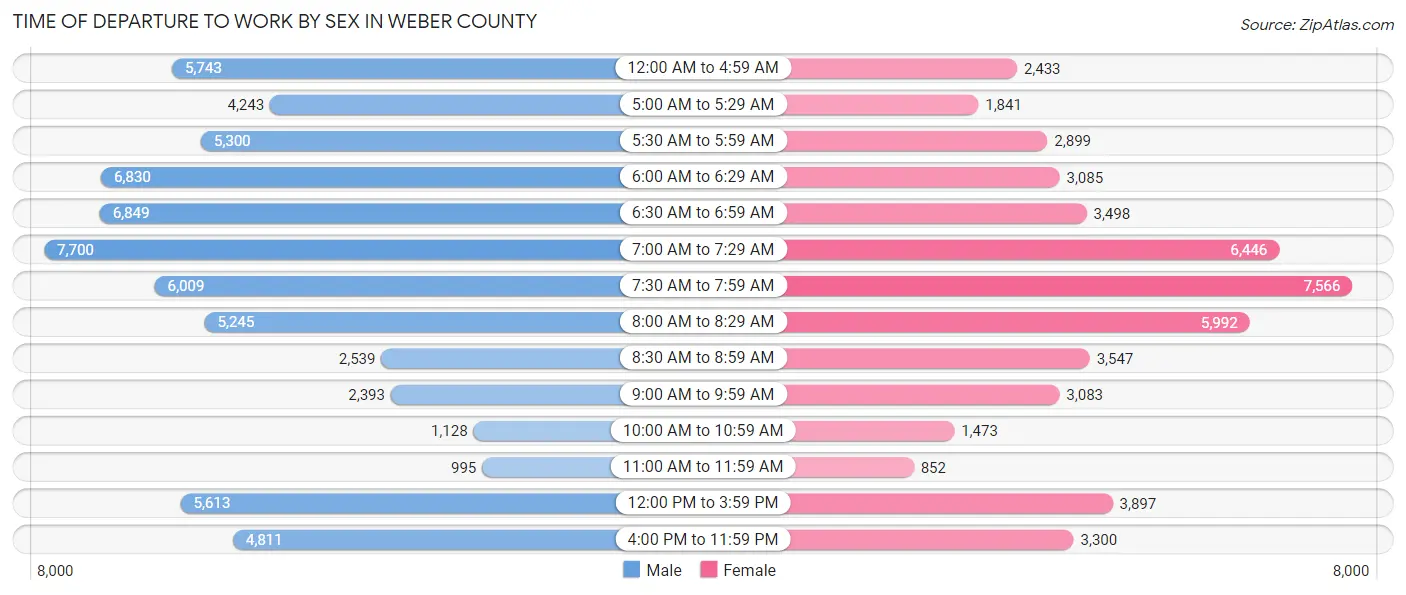
| Time of Departure | Male | Female |
| 12:00 AM to 4:59 AM | 5,743 (8.8%) | 2,433 (4.9%) |
| 5:00 AM to 5:29 AM | 4,243 (6.5%) | 1,841 (3.7%) |
| 5:30 AM to 5:59 AM | 5,300 (8.1%) | 2,899 (5.8%) |
| 6:00 AM to 6:29 AM | 6,830 (10.4%) | 3,085 (6.2%) |
| 6:30 AM to 6:59 AM | 6,849 (10.5%) | 3,498 (7.0%) |
| 7:00 AM to 7:29 AM | 7,700 (11.8%) | 6,446 (12.9%) |
| 7:30 AM to 7:59 AM | 6,009 (9.2%) | 7,566 (15.2%) |
| 8:00 AM to 8:29 AM | 5,245 (8.0%) | 5,992 (12.0%) |
| 8:30 AM to 8:59 AM | 2,539 (3.9%) | 3,547 (7.1%) |
| 9:00 AM to 9:59 AM | 2,393 (3.7%) | 3,083 (6.2%) |
| 10:00 AM to 10:59 AM | 1,128 (1.7%) | 1,473 (2.9%) |
| 11:00 AM to 11:59 AM | 995 (1.5%) | 852 (1.7%) |
| 12:00 PM to 3:59 PM | 5,613 (8.6%) | 3,897 (7.8%) |
| 4:00 PM to 11:59 PM | 4,811 (7.4%) | 3,300 (6.6%) |
| Total | 65,398 (100.0%) | 49,912 (100.0%) |
Housing Occupancy in Weber County
Occupancy by Ownership in Weber County
Of the total 89,990 dwellings in Weber County, owner-occupied units account for 66,741 (74.2%), while renter-occupied units make up 23,249 (25.8%).
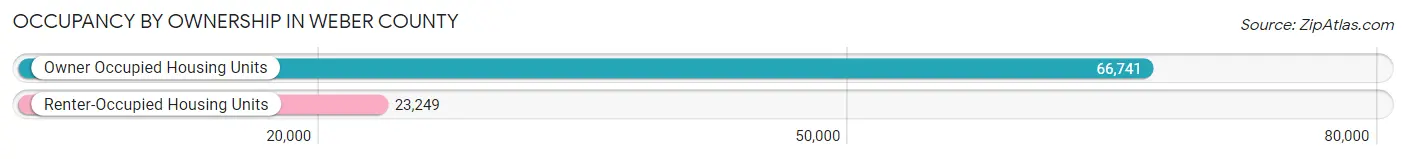
| Occupancy | # Housing Units | % Housing Units |
| Owner Occupied Housing Units | 66,741 | 74.2% |
| Renter-Occupied Housing Units | 23,249 | 25.8% |
| Total Occupied Housing Units | 89,990 | 100.0% |
Occupancy by Household Size in Weber County
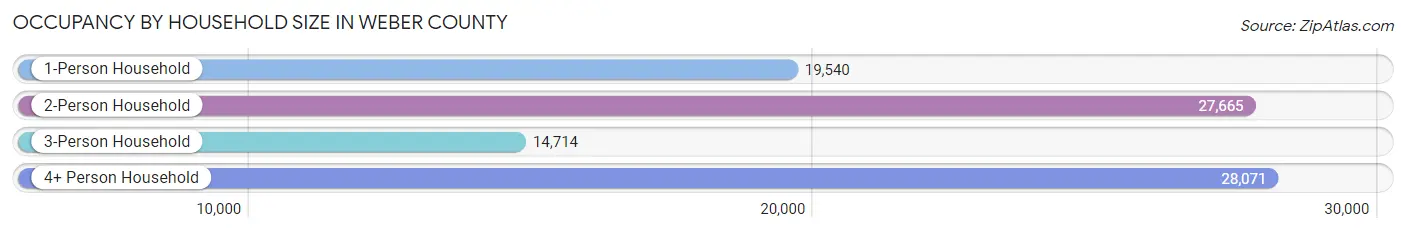
| Household Size | # Housing Units | % Housing Units |
| 1-Person Household | 19,540 | 21.7% |
| 2-Person Household | 27,665 | 30.7% |
| 3-Person Household | 14,714 | 16.4% |
| 4+ Person Household | 28,071 | 31.2% |
| Total Housing Units | 89,990 | 100.0% |
Occupancy by Ownership by Household Size in Weber County
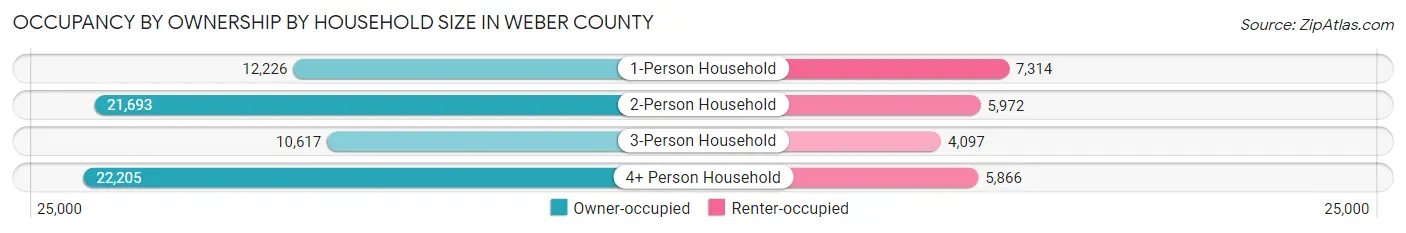
| Household Size | Owner-occupied | Renter-occupied |
| 1-Person Household | 12,226 (62.6%) | 7,314 (37.4%) |
| 2-Person Household | 21,693 (78.4%) | 5,972 (21.6%) |
| 3-Person Household | 10,617 (72.2%) | 4,097 (27.8%) |
| 4+ Person Household | 22,205 (79.1%) | 5,866 (20.9%) |
| Total Housing Units | 66,741 (74.2%) | 23,249 (25.8%) |
Occupancy by Educational Attainment in Weber County
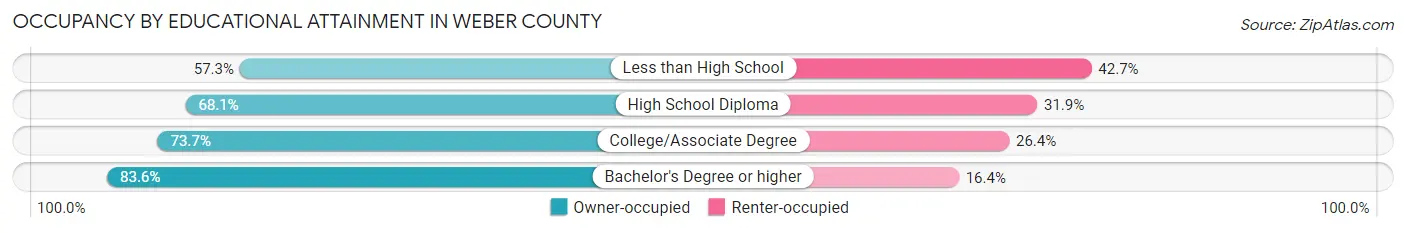
| Household Size | Owner-occupied | Renter-occupied |
| Less than High School | 3,295 (57.3%) | 2,452 (42.7%) |
| High School Diploma | 15,485 (68.1%) | 7,255 (31.9%) |
| College/Associate Degree | 25,618 (73.7%) | 9,167 (26.4%) |
| Bachelor's Degree or higher | 22,343 (83.6%) | 4,375 (16.4%) |
Occupancy by Age of Householder in Weber County
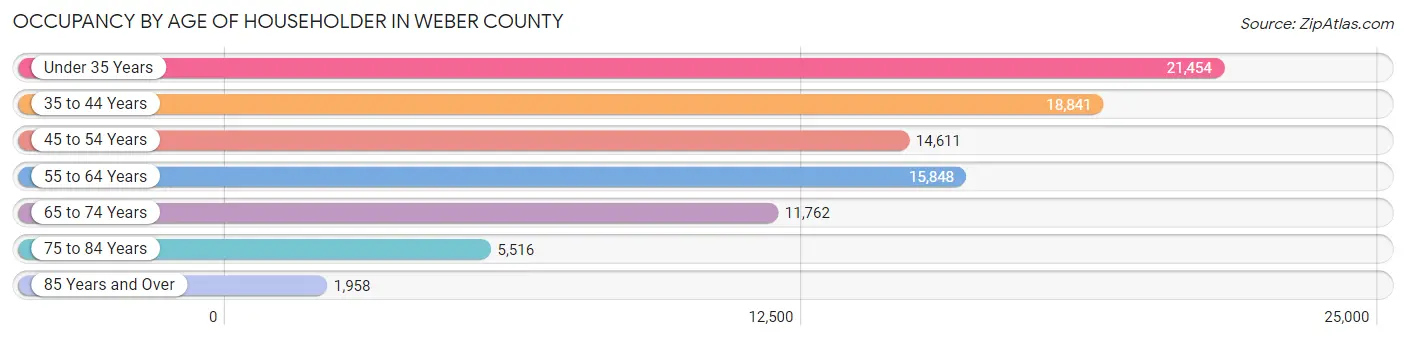
| Age Bracket | # Households | % Households |
| Under 35 Years | 21,454 | 23.8% |
| 35 to 44 Years | 18,841 | 20.9% |
| 45 to 54 Years | 14,611 | 16.2% |
| 55 to 64 Years | 15,848 | 17.6% |
| 65 to 74 Years | 11,762 | 13.1% |
| 75 to 84 Years | 5,516 | 6.1% |
| 85 Years and Over | 1,958 | 2.2% |
| Total | 89,990 | 100.0% |
Housing Finances in Weber County
Median Income by Occupancy in Weber County
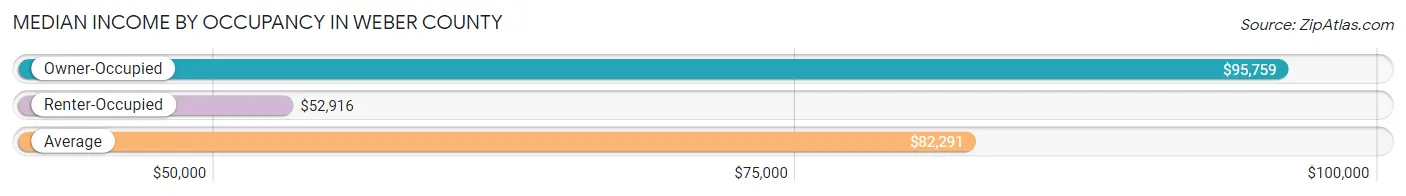
| Occupancy Type | # Households | Median Income |
| Owner-Occupied | 66,741 (74.2%) | $95,759 |
| Renter-Occupied | 23,249 (25.8%) | $52,916 |
| Average | 89,990 (100.0%) | $82,291 |
Occupancy by Householder Income Bracket in Weber County
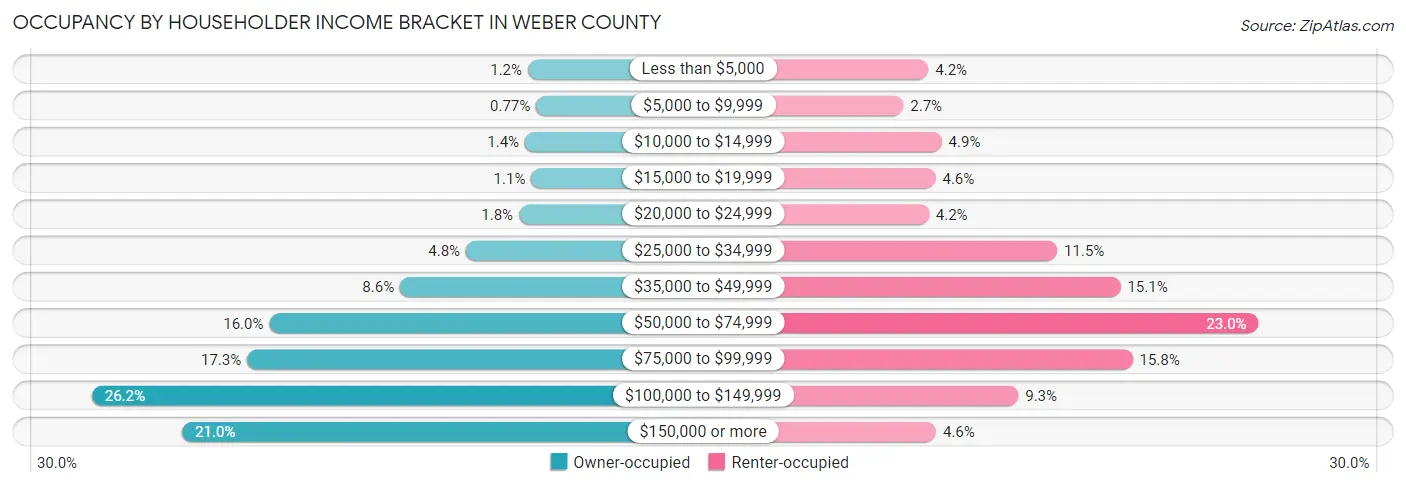
| Income Bracket | Owner-occupied | Renter-occupied |
| Less than $5,000 | 825 (1.2%) | 968 (4.2%) |
| $5,000 to $9,999 | 511 (0.8%) | 635 (2.7%) |
| $10,000 to $14,999 | 944 (1.4%) | 1,145 (4.9%) |
| $15,000 to $19,999 | 700 (1.1%) | 1,062 (4.6%) |
| $20,000 to $24,999 | 1,167 (1.8%) | 975 (4.2%) |
| $25,000 to $34,999 | 3,191 (4.8%) | 2,678 (11.5%) |
| $35,000 to $49,999 | 5,705 (8.6%) | 3,521 (15.1%) |
| $50,000 to $74,999 | 10,689 (16.0%) | 5,352 (23.0%) |
| $75,000 to $99,999 | 11,538 (17.3%) | 3,680 (15.8%) |
| $100,000 to $149,999 | 17,458 (26.2%) | 2,163 (9.3%) |
| $150,000 or more | 14,013 (21.0%) | 1,070 (4.6%) |
| Total | 66,741 (100.0%) | 23,249 (100.0%) |
Monthly Housing Cost Tiers in Weber County
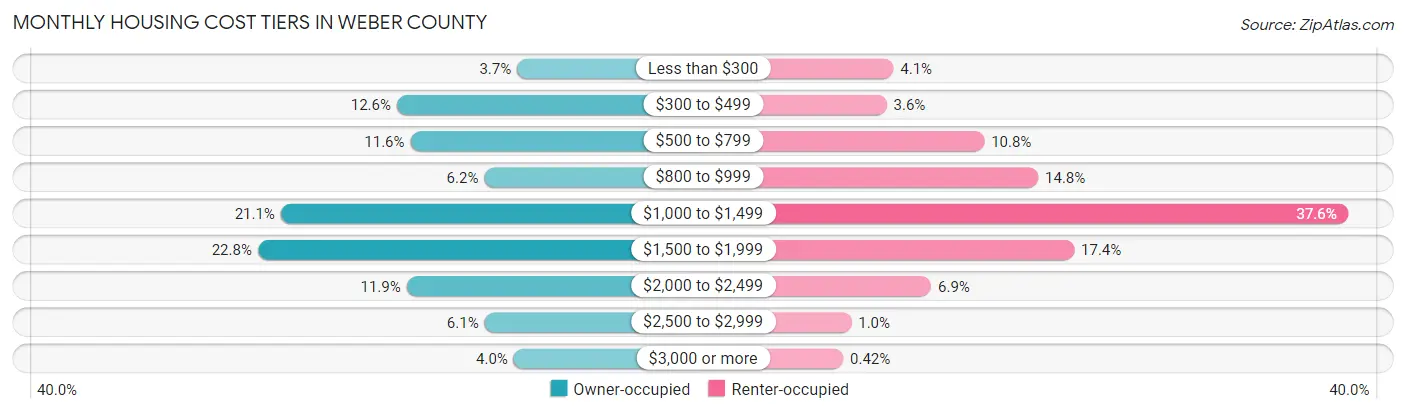
| Monthly Cost | Owner-occupied | Renter-occupied |
| Less than $300 | 2,490 (3.7%) | 957 (4.1%) |
| $300 to $499 | 8,406 (12.6%) | 841 (3.6%) |
| $500 to $799 | 7,734 (11.6%) | 2,513 (10.8%) |
| $800 to $999 | 4,102 (6.1%) | 3,437 (14.8%) |
| $1,000 to $1,499 | 14,106 (21.1%) | 8,752 (37.6%) |
| $1,500 to $1,999 | 15,236 (22.8%) | 4,052 (17.4%) |
| $2,000 to $2,499 | 7,921 (11.9%) | 1,604 (6.9%) |
| $2,500 to $2,999 | 4,091 (6.1%) | 236 (1.0%) |
| $3,000 or more | 2,655 (4.0%) | 97 (0.4%) |
| Total | 66,741 (100.0%) | 23,249 (100.0%) |
Physical Housing Characteristics in Weber County
Housing Structures in Weber County
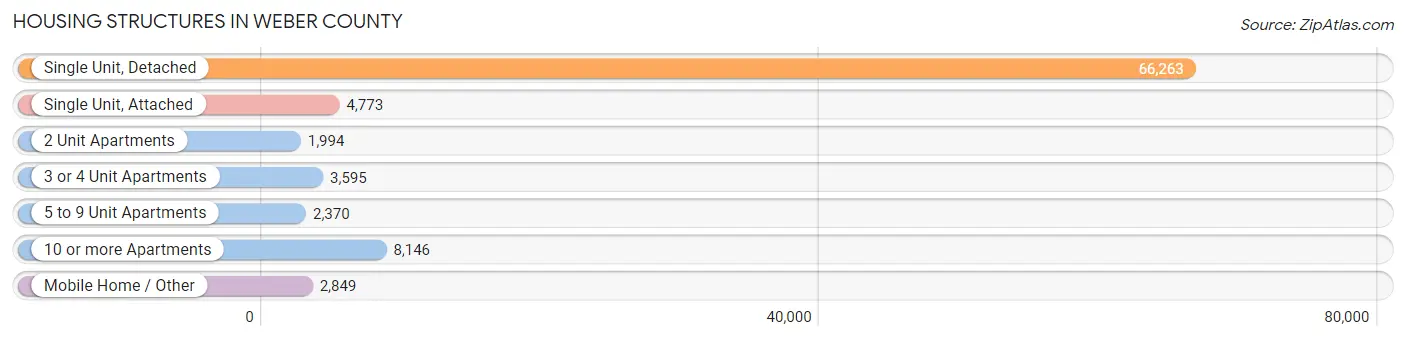
| Structure Type | # Housing Units | % Housing Units |
| Single Unit, Detached | 66,263 | 73.6% |
| Single Unit, Attached | 4,773 | 5.3% |
| 2 Unit Apartments | 1,994 | 2.2% |
| 3 or 4 Unit Apartments | 3,595 | 4.0% |
| 5 to 9 Unit Apartments | 2,370 | 2.6% |
| 10 or more Apartments | 8,146 | 9.0% |
| Mobile Home / Other | 2,849 | 3.2% |
| Total | 89,990 | 100.0% |
Housing Structures by Occupancy in Weber County
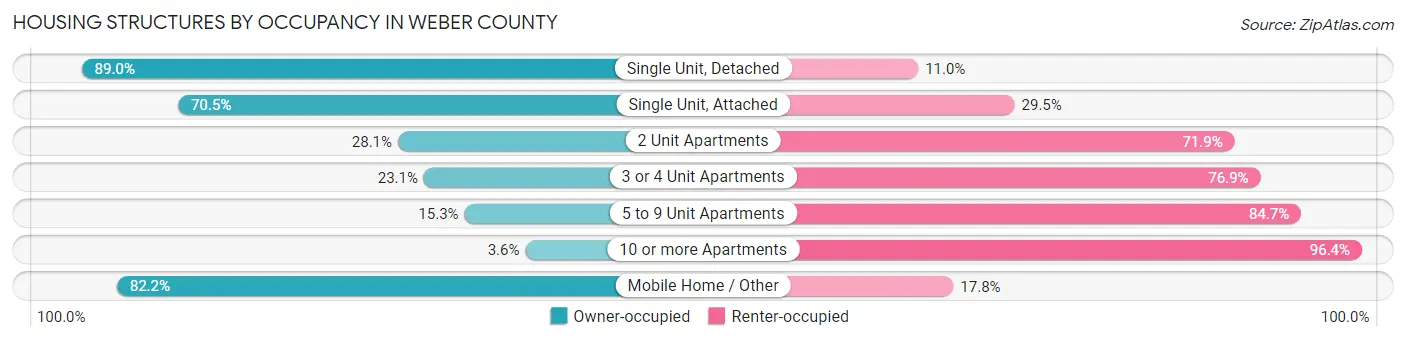
| Structure Type | Owner-occupied | Renter-occupied |
| Single Unit, Detached | 58,986 (89.0%) | 7,277 (11.0%) |
| Single Unit, Attached | 3,363 (70.5%) | 1,410 (29.5%) |
| 2 Unit Apartments | 561 (28.1%) | 1,433 (71.9%) |
| 3 or 4 Unit Apartments | 832 (23.1%) | 2,763 (76.9%) |
| 5 to 9 Unit Apartments | 363 (15.3%) | 2,007 (84.7%) |
| 10 or more Apartments | 293 (3.6%) | 7,853 (96.4%) |
| Mobile Home / Other | 2,343 (82.2%) | 506 (17.8%) |
| Total | 66,741 (74.2%) | 23,249 (25.8%) |
Housing Structures by Number of Rooms in Weber County
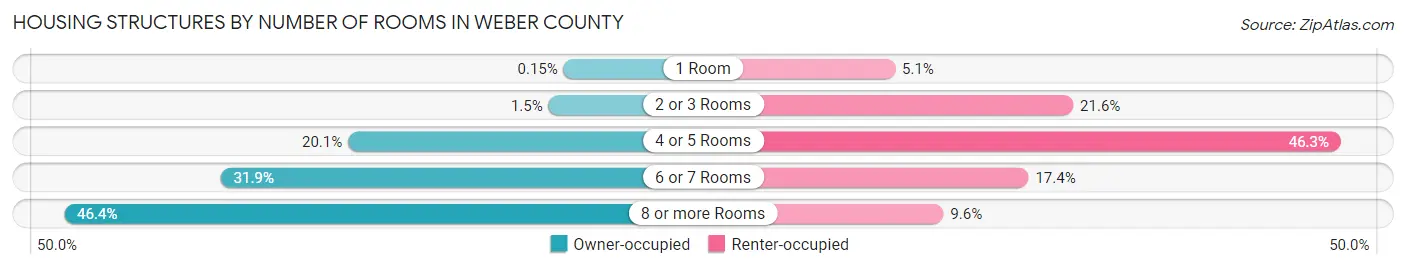
| Number of Rooms | Owner-occupied | Renter-occupied |
| 1 Room | 98 (0.2%) | 1,186 (5.1%) |
| 2 or 3 Rooms | 1,031 (1.5%) | 5,015 (21.6%) |
| 4 or 5 Rooms | 13,408 (20.1%) | 10,768 (46.3%) |
| 6 or 7 Rooms | 21,271 (31.9%) | 4,055 (17.4%) |
| 8 or more Rooms | 30,933 (46.4%) | 2,225 (9.6%) |
| Total | 66,741 (100.0%) | 23,249 (100.0%) |
Housing Structure by Heating Type in Weber County
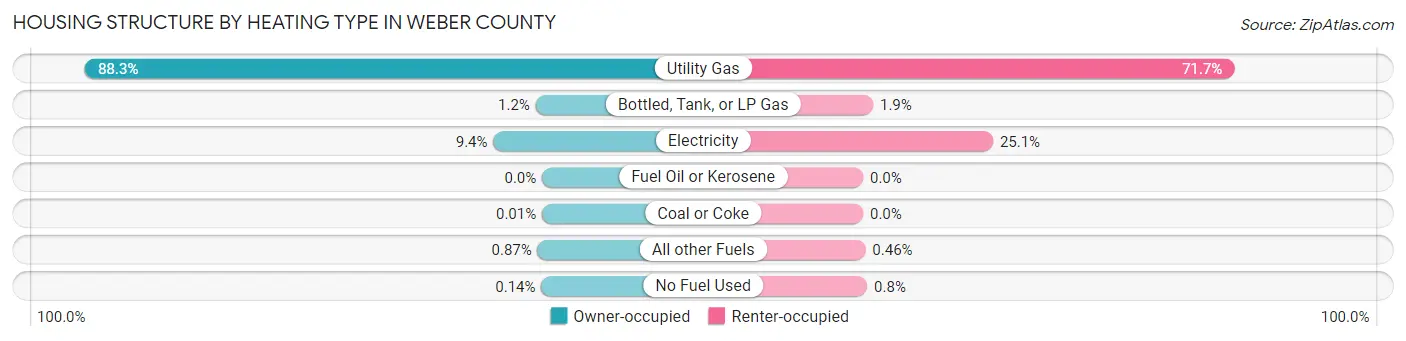
| Heating Type | Owner-occupied | Renter-occupied |
| Utility Gas | 58,949 (88.3%) | 16,673 (71.7%) |
| Bottled, Tank, or LP Gas | 825 (1.2%) | 448 (1.9%) |
| Electricity | 6,289 (9.4%) | 5,836 (25.1%) |
| Fuel Oil or Kerosene | 0 (0.0%) | 0 (0.0%) |
| Coal or Coke | 5 (0.0%) | 0 (0.0%) |
| All other Fuels | 579 (0.9%) | 106 (0.5%) |
| No Fuel Used | 94 (0.1%) | 186 (0.8%) |
| Total | 66,741 (100.0%) | 23,249 (100.0%) |
Household Vehicle Usage in Weber County
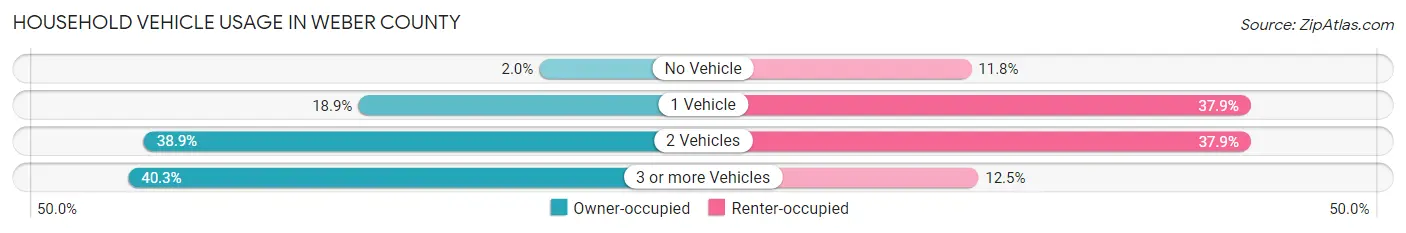
| Vehicles per Household | Owner-occupied | Renter-occupied |
| No Vehicle | 1,312 (2.0%) | 2,744 (11.8%) |
| 1 Vehicle | 12,589 (18.9%) | 8,803 (37.9%) |
| 2 Vehicles | 25,933 (38.9%) | 8,807 (37.9%) |
| 3 or more Vehicles | 26,907 (40.3%) | 2,895 (12.4%) |
| Total | 66,741 (100.0%) | 23,249 (100.0%) |
Real Estate & Mortgages in Weber County
Real Estate and Mortgage Overview in Weber County
| Characteristic | Without Mortgage | With Mortgage |
| Housing Units | 19,157 | 47,584 |
| Median Property Value | $325,400 | $354,900 |
| Median Household Income | $74,691 | $10,466 |
| Monthly Housing Costs | $483 | $2,552 |
| Real Estate Taxes | $2,209 | $1,066 |
Property Value by Mortgage Status in Weber County
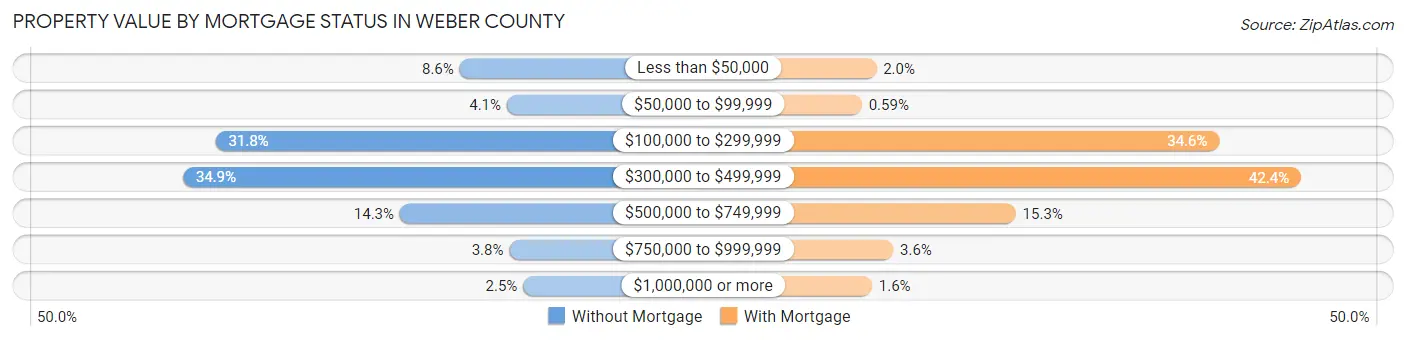
| Property Value | Without Mortgage | With Mortgage |
| Less than $50,000 | 1,642 (8.6%) | 937 (2.0%) |
| $50,000 to $99,999 | 779 (4.1%) | 281 (0.6%) |
| $100,000 to $299,999 | 6,095 (31.8%) | 16,482 (34.6%) |
| $300,000 to $499,999 | 6,691 (34.9%) | 20,191 (42.4%) |
| $500,000 to $749,999 | 2,731 (14.3%) | 7,255 (15.2%) |
| $750,000 to $999,999 | 736 (3.8%) | 1,702 (3.6%) |
| $1,000,000 or more | 483 (2.5%) | 736 (1.5%) |
| Total | 19,157 (100.0%) | 47,584 (100.0%) |
Household Income by Mortgage Status in Weber County
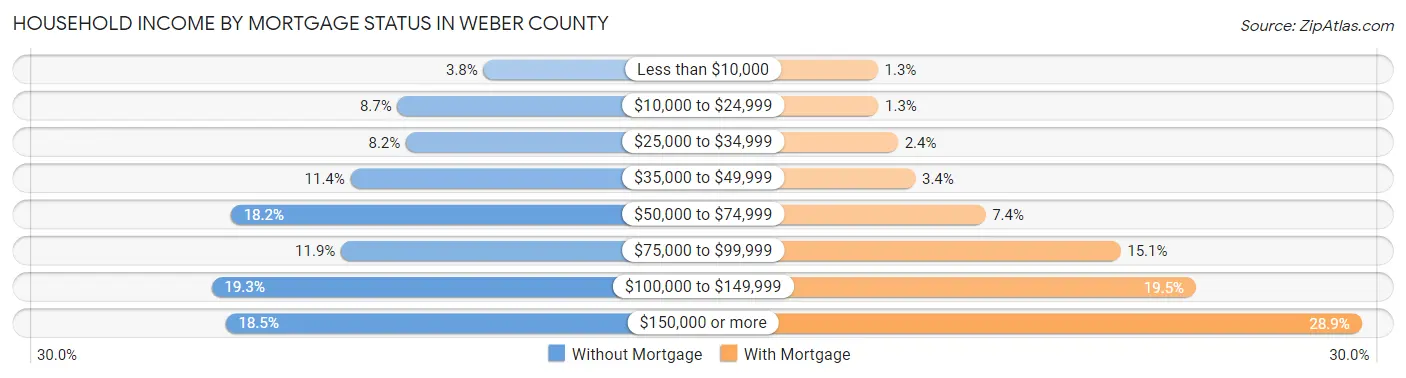
| Household Income | Without Mortgage | With Mortgage |
| Less than $10,000 | 723 (3.8%) | 599 (1.3%) |
| $10,000 to $24,999 | 1,664 (8.7%) | 613 (1.3%) |
| $25,000 to $34,999 | 1,571 (8.2%) | 1,147 (2.4%) |
| $35,000 to $49,999 | 2,178 (11.4%) | 1,620 (3.4%) |
| $50,000 to $74,999 | 3,490 (18.2%) | 3,527 (7.4%) |
| $75,000 to $99,999 | 2,282 (11.9%) | 7,199 (15.1%) |
| $100,000 to $149,999 | 3,702 (19.3%) | 9,256 (19.5%) |
| $150,000 or more | 3,547 (18.5%) | 13,756 (28.9%) |
| Total | 19,157 (100.0%) | 47,584 (100.0%) |
Property Value to Household Income Ratio in Weber County
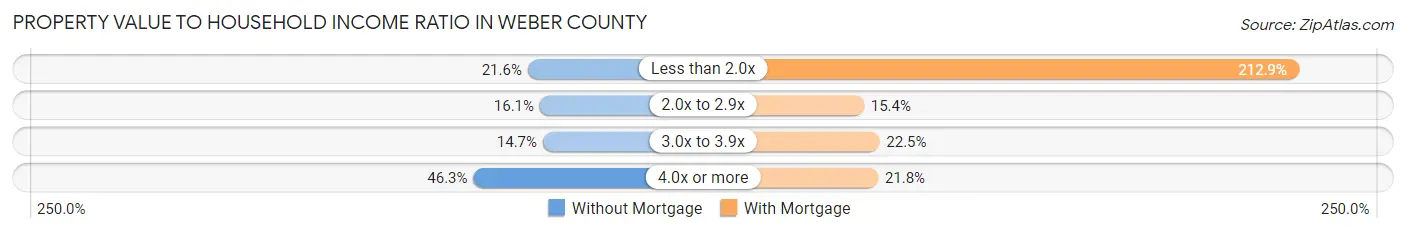
| Value-to-Income Ratio | Without Mortgage | With Mortgage |
| Less than 2.0x | 4,133 (21.6%) | 101,300 (212.9%) |
| 2.0x to 2.9x | 3,076 (16.1%) | 7,315 (15.4%) |
| 3.0x to 3.9x | 2,816 (14.7%) | 10,682 (22.5%) |
| 4.0x or more | 8,861 (46.3%) | 10,371 (21.8%) |
| Total | 19,157 (100.0%) | 47,584 (100.0%) |
Real Estate Taxes by Mortgage Status in Weber County
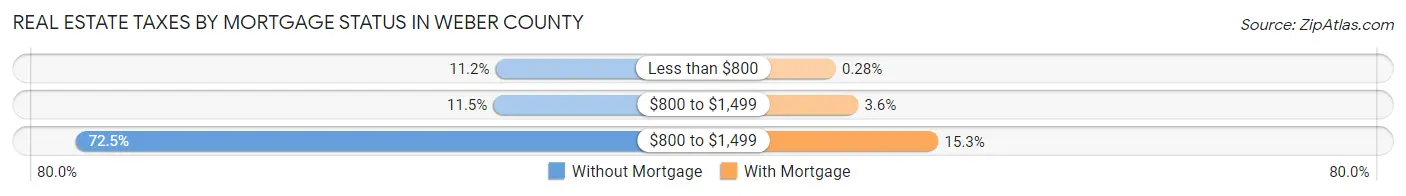
| Property Taxes | Without Mortgage | With Mortgage |
| Less than $800 | 2,150 (11.2%) | 132 (0.3%) |
| $800 to $1,499 | 2,210 (11.5%) | 1,699 (3.6%) |
| $800 to $1,499 | 13,897 (72.5%) | 7,269 (15.3%) |
| Total | 19,157 (100.0%) | 47,584 (100.0%) |
Health & Disability in Weber County
Health Insurance Coverage by Age in Weber County
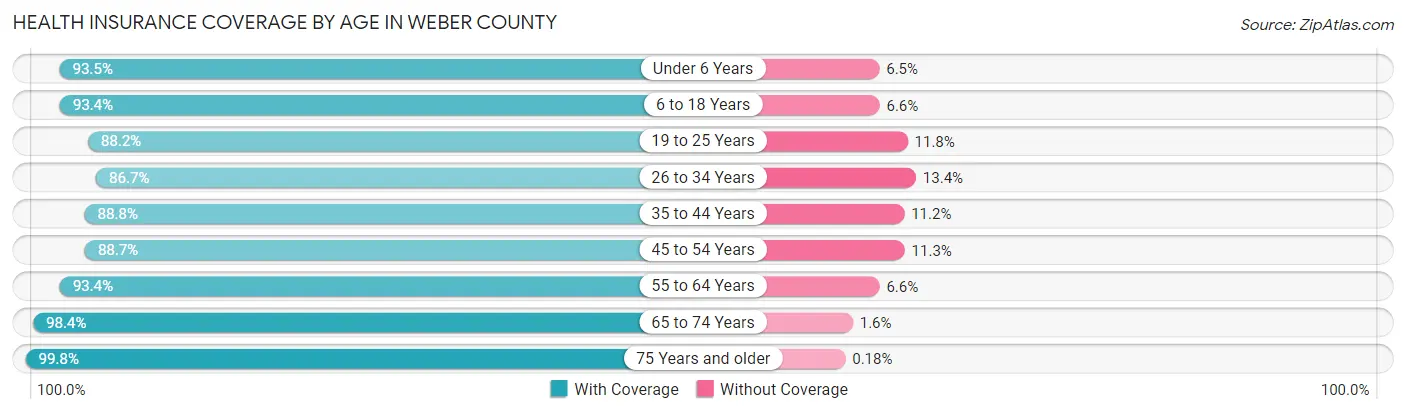
| Age Bracket | With Coverage | Without Coverage |
| Under 6 Years | 20,966 (93.5%) | 1,464 (6.5%) |
| 6 to 18 Years | 49,536 (93.4%) | 3,483 (6.6%) |
| 19 to 25 Years | 23,542 (88.2%) | 3,153 (11.8%) |
| 26 to 34 Years | 30,057 (86.7%) | 4,630 (13.4%) |
| 35 to 44 Years | 32,363 (88.8%) | 4,073 (11.2%) |
| 45 to 54 Years | 25,348 (88.7%) | 3,215 (11.3%) |
| 55 to 64 Years | 25,482 (93.4%) | 1,788 (6.6%) |
| 65 to 74 Years | 18,721 (98.4%) | 301 (1.6%) |
| 75 Years and older | 11,732 (99.8%) | 21 (0.2%) |
| Total | 237,747 (91.5%) | 22,128 (8.5%) |
Health Insurance Coverage by Citizenship Status in Weber County
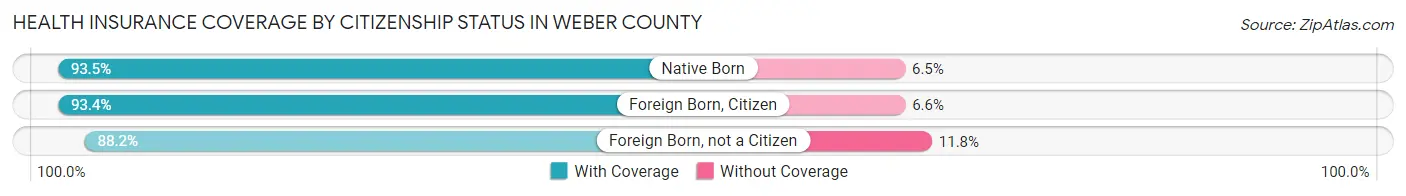
| Citizenship Status | With Coverage | Without Coverage |
| Native Born | 20,966 (93.5%) | 1,464 (6.5%) |
| Foreign Born, Citizen | 49,536 (93.4%) | 3,483 (6.6%) |
| Foreign Born, not a Citizen | 23,542 (88.2%) | 3,153 (11.8%) |
Health Insurance Coverage by Household Income in Weber County
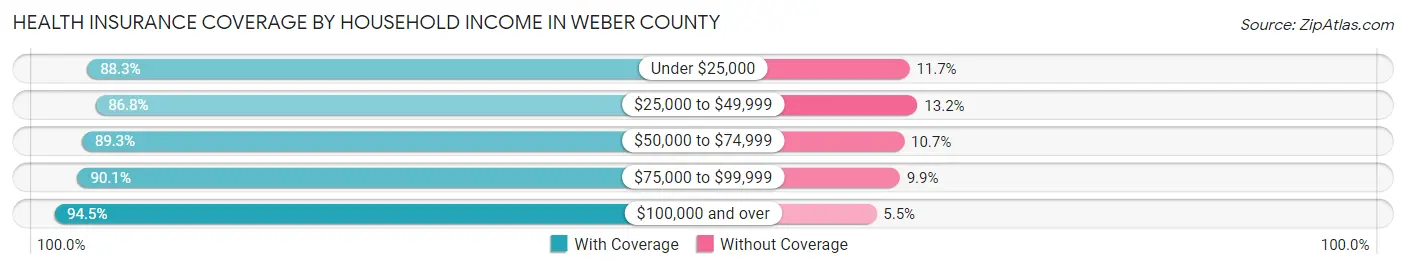
| Household Income | With Coverage | Without Coverage |
| Under $25,000 | 13,570 (88.3%) | 1,805 (11.7%) |
| $25,000 to $49,999 | 27,788 (86.8%) | 4,238 (13.2%) |
| $50,000 to $74,999 | 38,147 (89.3%) | 4,578 (10.7%) |
| $75,000 to $99,999 | 41,555 (90.1%) | 4,570 (9.9%) |
| $100,000 and over | 115,583 (94.5%) | 6,762 (5.5%) |
Public vs Private Health Insurance Coverage by Age in Weber County
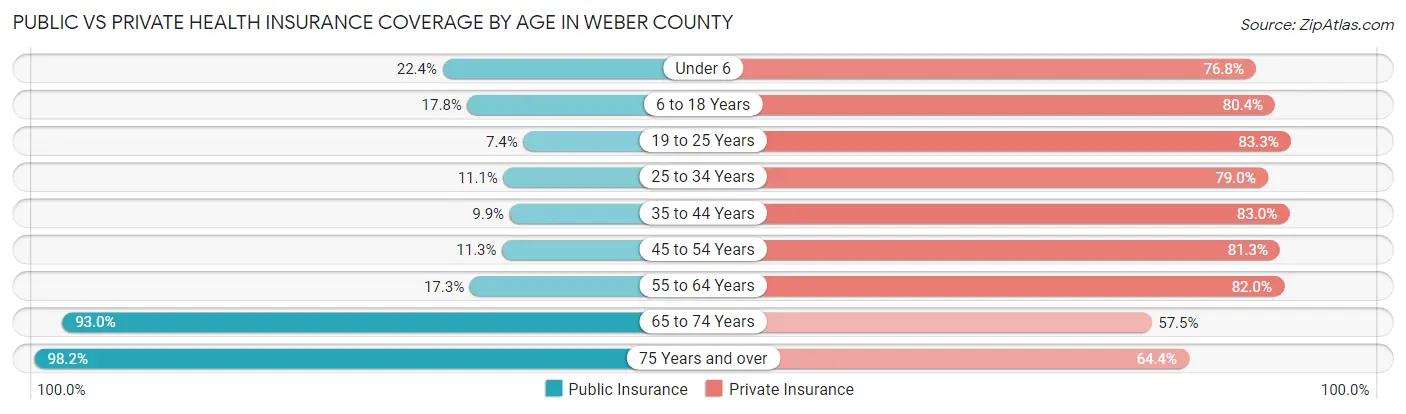
| Age Bracket | Public Insurance | Private Insurance |
| Under 6 | 5,017 (22.4%) | 17,232 (76.8%) |
| 6 to 18 Years | 9,414 (17.8%) | 42,617 (80.4%) |
| 19 to 25 Years | 1,970 (7.4%) | 22,231 (83.3%) |
| 25 to 34 Years | 3,840 (11.1%) | 27,406 (79.0%) |
| 35 to 44 Years | 3,611 (9.9%) | 30,250 (83.0%) |
| 45 to 54 Years | 3,233 (11.3%) | 23,220 (81.3%) |
| 55 to 64 Years | 4,726 (17.3%) | 22,366 (82.0%) |
| 65 to 74 Years | 17,693 (93.0%) | 10,928 (57.5%) |
| 75 Years and over | 11,537 (98.2%) | 7,569 (64.4%) |
| Total | 61,041 (23.5%) | 203,819 (78.4%) |
Disability Status by Sex by Age in Weber County
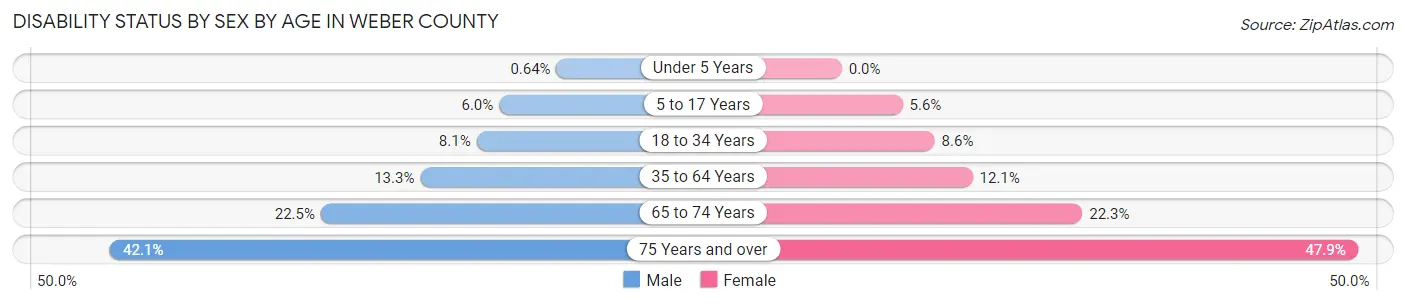
| Age Bracket | Male | Female |
| Under 5 Years | 61 (0.6%) | 0 (0.0%) |
| 5 to 17 Years | 1,619 (6.0%) | 1,471 (5.6%) |
| 18 to 34 Years | 2,680 (8.1%) | 2,743 (8.6%) |
| 35 to 64 Years | 6,245 (13.3%) | 5,492 (12.1%) |
| 65 to 74 Years | 2,078 (22.5%) | 2,186 (22.3%) |
| 75 Years and over | 2,155 (42.1%) | 3,173 (47.9%) |
Disability Class by Sex by Age in Weber County
Disability Class: Hearing Difficulty
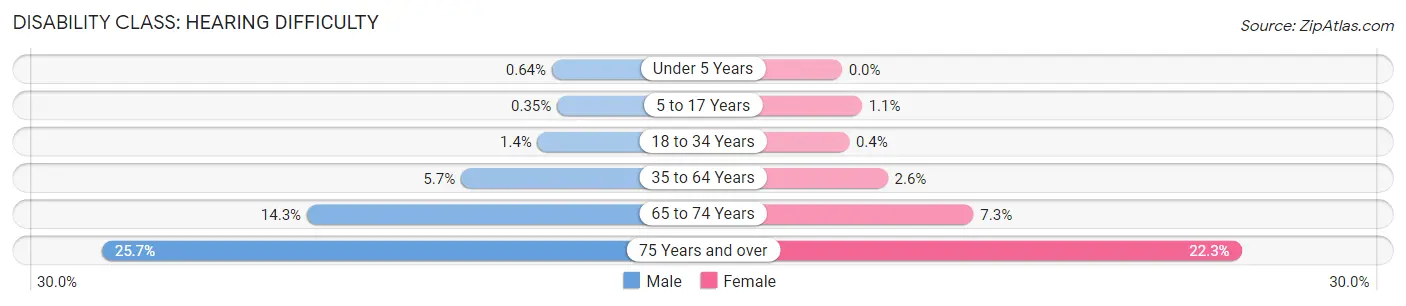
| Age Bracket | Male | Female |
| Under 5 Years | 61 (0.6%) | 0 (0.0%) |
| 5 to 17 Years | 96 (0.4%) | 289 (1.1%) |
| 18 to 34 Years | 475 (1.4%) | 127 (0.4%) |
| 35 to 64 Years | 2,680 (5.7%) | 1,155 (2.5%) |
| 65 to 74 Years | 1,318 (14.3%) | 718 (7.3%) |
| 75 Years and over | 1,317 (25.7%) | 1,475 (22.3%) |
Disability Class: Vision Difficulty
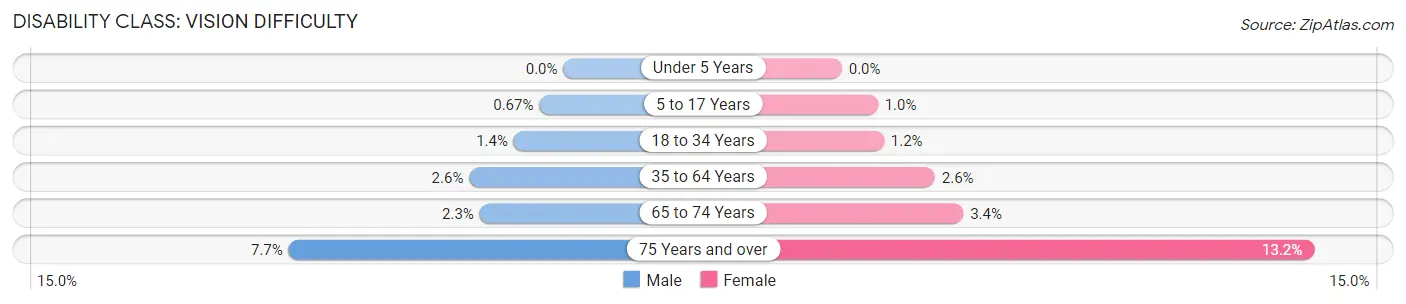
| Age Bracket | Male | Female |
| Under 5 Years | 0 (0.0%) | 0 (0.0%) |
| 5 to 17 Years | 183 (0.7%) | 261 (1.0%) |
| 18 to 34 Years | 459 (1.4%) | 374 (1.2%) |
| 35 to 64 Years | 1,231 (2.6%) | 1,172 (2.6%) |
| 65 to 74 Years | 215 (2.3%) | 331 (3.4%) |
| 75 Years and over | 392 (7.6%) | 872 (13.2%) |
Disability Class: Cognitive Difficulty
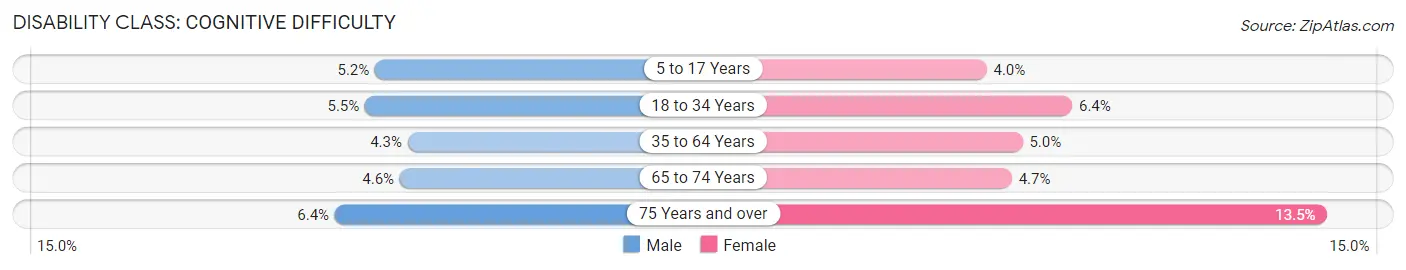
| Age Bracket | Male | Female |
| 5 to 17 Years | 1,424 (5.2%) | 1,051 (4.0%) |
| 18 to 34 Years | 1,833 (5.5%) | 2,041 (6.4%) |
| 35 to 64 Years | 2,038 (4.3%) | 2,278 (5.0%) |
| 65 to 74 Years | 420 (4.5%) | 463 (4.7%) |
| 75 Years and over | 326 (6.4%) | 896 (13.5%) |
Disability Class: Ambulatory Difficulty
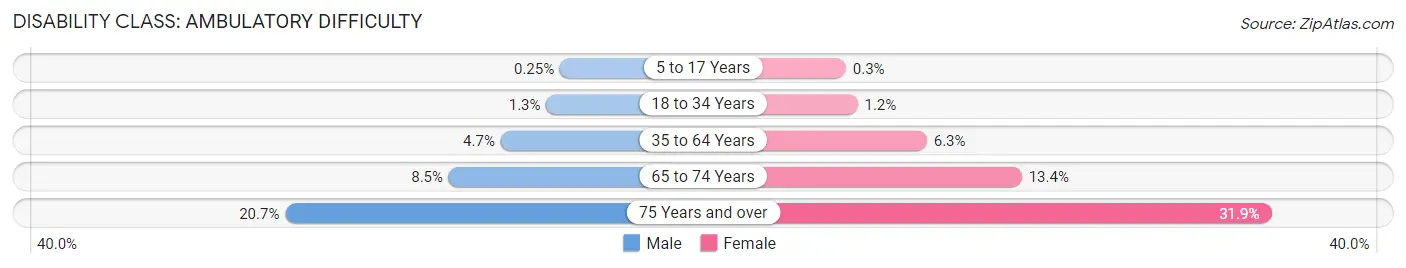
| Age Bracket | Male | Female |
| 5 to 17 Years | 67 (0.3%) | 77 (0.3%) |
| 18 to 34 Years | 418 (1.3%) | 374 (1.2%) |
| 35 to 64 Years | 2,187 (4.6%) | 2,856 (6.3%) |
| 65 to 74 Years | 785 (8.5%) | 1,308 (13.4%) |
| 75 Years and over | 1,058 (20.6%) | 2,113 (31.9%) |
Disability Class: Self-Care Difficulty
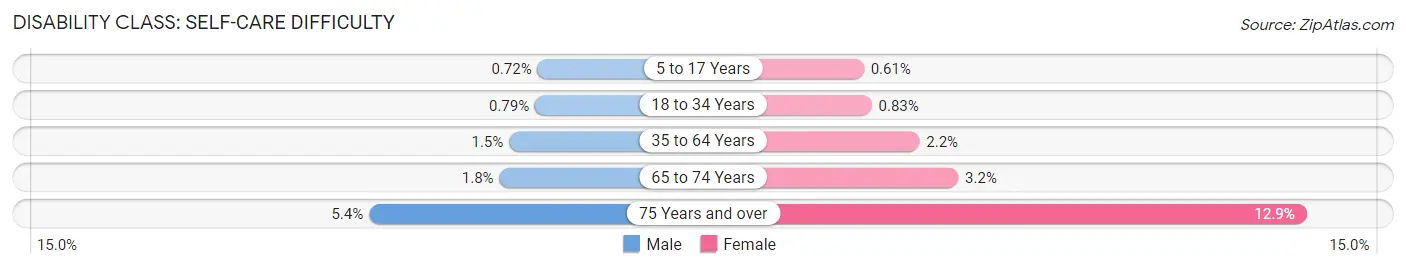
| Age Bracket | Male | Female |
| 5 to 17 Years | 196 (0.7%) | 158 (0.6%) |
| 18 to 34 Years | 264 (0.8%) | 263 (0.8%) |
| 35 to 64 Years | 709 (1.5%) | 979 (2.2%) |
| 65 to 74 Years | 164 (1.8%) | 317 (3.2%) |
| 75 Years and over | 277 (5.4%) | 858 (12.9%) |
Technology Access in Weber County
Computing Device Access in Weber County
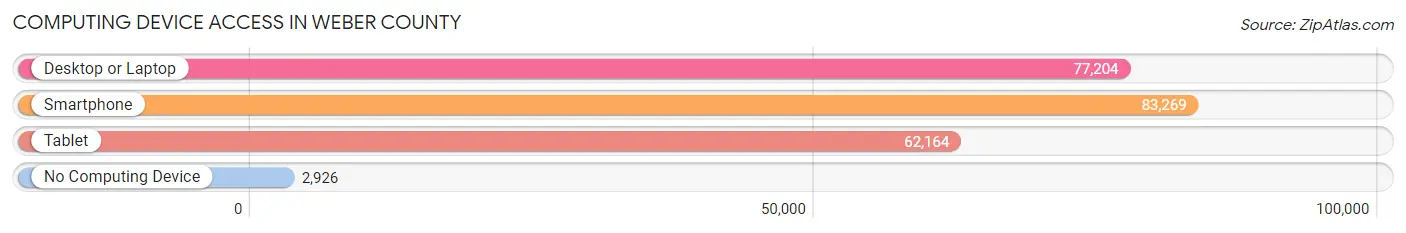
| Device Type | # Households | % Households |
| Desktop or Laptop | 77,204 | 85.8% |
| Smartphone | 83,269 | 92.5% |
| Tablet | 62,164 | 69.1% |
| No Computing Device | 2,926 | 3.3% |
| Total | 89,990 | 100.0% |
Internet Access in Weber County
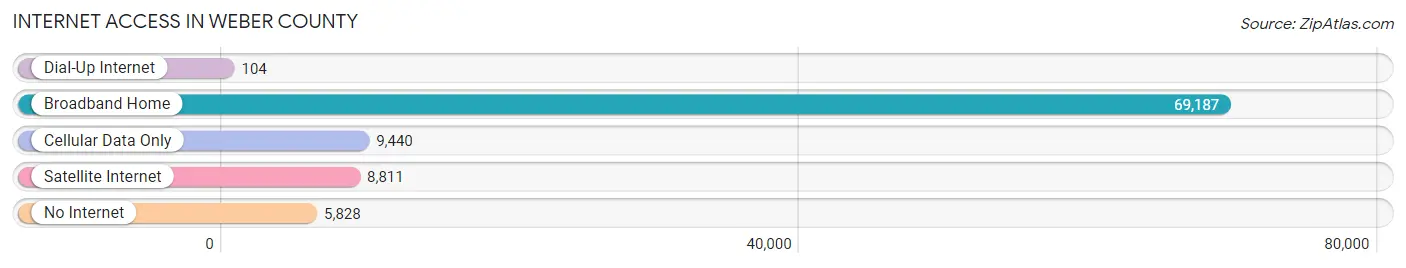
| Internet Type | # Households | % Households |
| Dial-Up Internet | 104 | 0.1% |
| Broadband Home | 69,187 | 76.9% |
| Cellular Data Only | 9,440 | 10.5% |
| Satellite Internet | 8,811 | 9.8% |
| No Internet | 5,828 | 6.5% |
| Total | 89,990 | 100.0% |
Weber County Summary
Weber County is located in the northern part of Utah and is part of the Ogden-Clearfield Metropolitan Statistical Area. It is bordered by Davis County to the north, Morgan County to the east, Box Elder County to the south, and the Wasatch Mountains to the west. The county seat is Ogden, which is also the largest city in the county. Weber County was established in 1850 and named after John Henry Weber, an early fur trader in the area.
Geography
Weber County covers an area of 1,521 square miles and is located in the Wasatch Range of the Rocky Mountains. The county is divided into two distinct regions: the Wasatch Front and the Wasatch Plateau. The Wasatch Front is a narrow strip of land along the eastern edge of the county that is characterized by its flat terrain and urban development. The Wasatch Plateau is located in the western part of the county and is characterized by its rugged terrain and sparsely populated rural areas. The highest point in the county is Ben Lomond Peak, which rises to an elevation of 9,712 feet.
The county is home to several rivers and streams, including the Ogden River, Weber River, and Bear River. The Ogden River is the largest river in the county and is a major source of irrigation for the area. The Weber River is the second largest river in the county and is a popular destination for fishing and recreation. The Bear River is the third largest river in the county and is a major source of hydroelectric power.
Climate
Weber County has a semi-arid climate, with hot summers and cold winters. The average annual temperature is around 50°F, with temperatures ranging from an average low of 28°F in January to an average high of 79°F in July. The average annual precipitation is around 16 inches, with most of the precipitation falling in the spring and summer months.
Demographics
As of the 2010 census, Weber County had a population of 231,236. The population was spread out with a median age of 30.7 years. The racial makeup of the county was 87.2% White, 2.3% African American, 1.2% Native American, 2.3% Asian, 0.3% Pacific Islander, 4.7% from other races, and 2.2% from two or more races. Hispanic or Latino of any race were 11.2% of the population.
Economy
Weber County is home to a diverse economy, with a variety of industries providing employment opportunities. The largest employers in the county are Hill Air Force Base, Weber State University, and Intermountain Healthcare. Other major employers include Ogden City, Weber County, and the Ogden-Clearfield Metropolitan Statistical Area.
The county is also home to several major industries, including manufacturing, healthcare, and retail. Manufacturing is the largest industry in the county, with companies such as ATK, ATK Space Systems, and ATK Aerospace providing employment opportunities. Healthcare is the second largest industry in the county, with Intermountain Healthcare, Ogden Regional Medical Center, and McKay-Dee Hospital providing employment opportunities. Retail is the third largest industry in the county, with companies such as Walmart, Smith's, and Target providing employment opportunities.
Conclusion
Weber County is a diverse and vibrant county located in the northern part of Utah. It is home to a variety of industries, including manufacturing, healthcare, and retail, and is a major employer in the Ogden-Clearfield Metropolitan Statistical Area. The county is also home to several rivers and streams, as well as the Wasatch Range of the Rocky Mountains. With its diverse economy, vibrant culture, and beautiful scenery, Weber County is an ideal place to live and work.
Common Questions
What is the Total Population of Weber County?
Total Population of Weber County is 262,960.
What is the Total Male Population of Weber County?
Total Male Population of Weber County is 133,298.
What is the Total Female Population of Weber County?
Total Female Population of Weber County is 129,662.
What is the Ratio of Males per 100 Females in Weber County?
There are 102.80 Males per 100 Females in Weber County.
What is the Ratio of Females per 100 Males in Weber County?
There are 97.27 Females per 100 Males in Weber County.
What is the Median Population Age in Weber County?
Median Population Age in Weber County is 33.2 Years.
What is the Average Family Size in Weber County
Average Family Size in Weber County is 3.4 People.
What is the Average Household Size in Weber County
Average Household Size in Weber County is 2.9 People.
What is Per Capita Income in Weber County?
Per Capita income in Weber County is $34,778.
What is the Median Family Income in Weber County?
Median Family Income in Weber County is $93,444.
What is the Median Household income in Weber County?
Median Household Income in Weber County is $82,291.
What is Income or Wage Gap in Weber County?
Income or Wage Gap in Weber County is 37.5%.
Women in Weber County earn 62.5 cents for every dollar earned by a man.
What is Family Income Deficit in Weber County?
Family Income Deficit in Weber County is $11,364.
Families that are below poverty line in Weber County earn $11,364 less on average than the poverty threshold level.
What is Inequality or Gini Index in Weber County?
Inequality or Gini Index in Weber County is 0.40.
How Large is the Labor Force in Weber County?
There are 138,233 People in the Labor Forcein in Weber County.
What is the Percentage of People in the Labor Force in Weber County?
69.4% of People are in the Labor Force in Weber County.
What is the Unemployment Rate in Weber County?
Unemployment Rate in Weber County is 3.1%.