Wayne County, UT
Wayne County Map
Wayne County Overview
2,532
TOTAL POPULATION
1,299
MALE POPULATION
1,233
FEMALE POPULATION
105.35
MALES / 100 FEMALES
94.92
FEMALES / 100 MALES
43.0
MEDIAN AGE
2.7
AVG FAMILY SIZE
2.4
AVG HOUSEHOLD SIZE
$32,605
PER CAPITA INCOME
$86,010
AVG FAMILY INCOME
$64,870
AVG HOUSEHOLD INCOME
5.2%
WAGE / INCOME GAP [ % ]
94.8¢/ $1
WAGE / INCOME GAP [ $ ]
0.37
INEQUALITY / GINI INDEX
1,282
LABOR FORCE [ PEOPLE ]
63.3%
PERCENT IN LABOR FORCE
0.6%
UNEMPLOYMENT RATE
Wayne County Area Codes
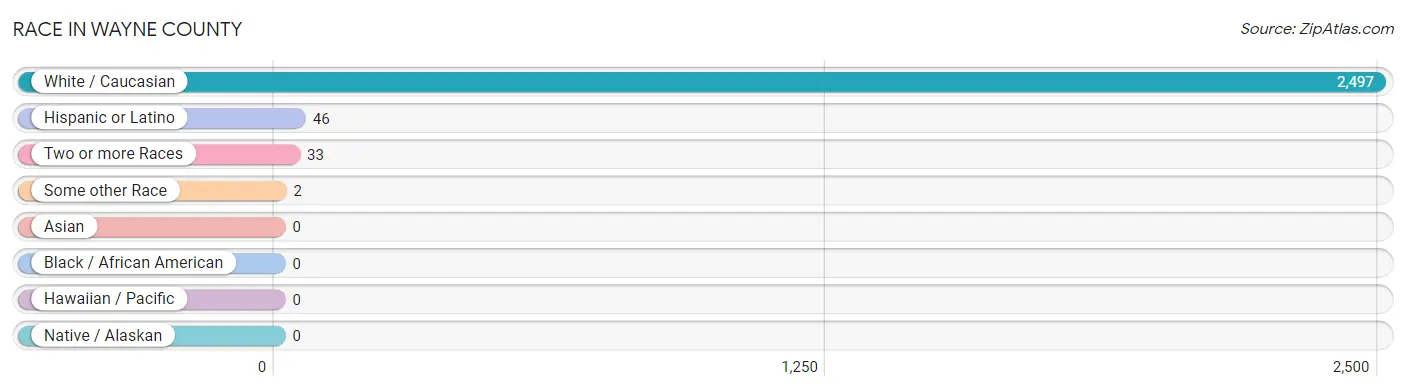
Race in Wayne County
The most populous races in Wayne County are White / Caucasian (2,497 | 98.6%), Hispanic or Latino (46 | 1.8%), and Two or more Races (33 | 1.3%).
| Race | # Population | % Population |
| Asian | 0 | 0.0% |
| Black / African American | 0 | 0.0% |
| Hawaiian / Pacific | 0 | 0.0% |
| Hispanic or Latino | 46 | 1.8% |
| Native / Alaskan | 0 | 0.0% |
| White / Caucasian | 2,497 | 98.6% |
| Two or more Races | 33 | 1.3% |
| Some other Race | 2 | 0.1% |
| Total | 2,532 | 100.0% |
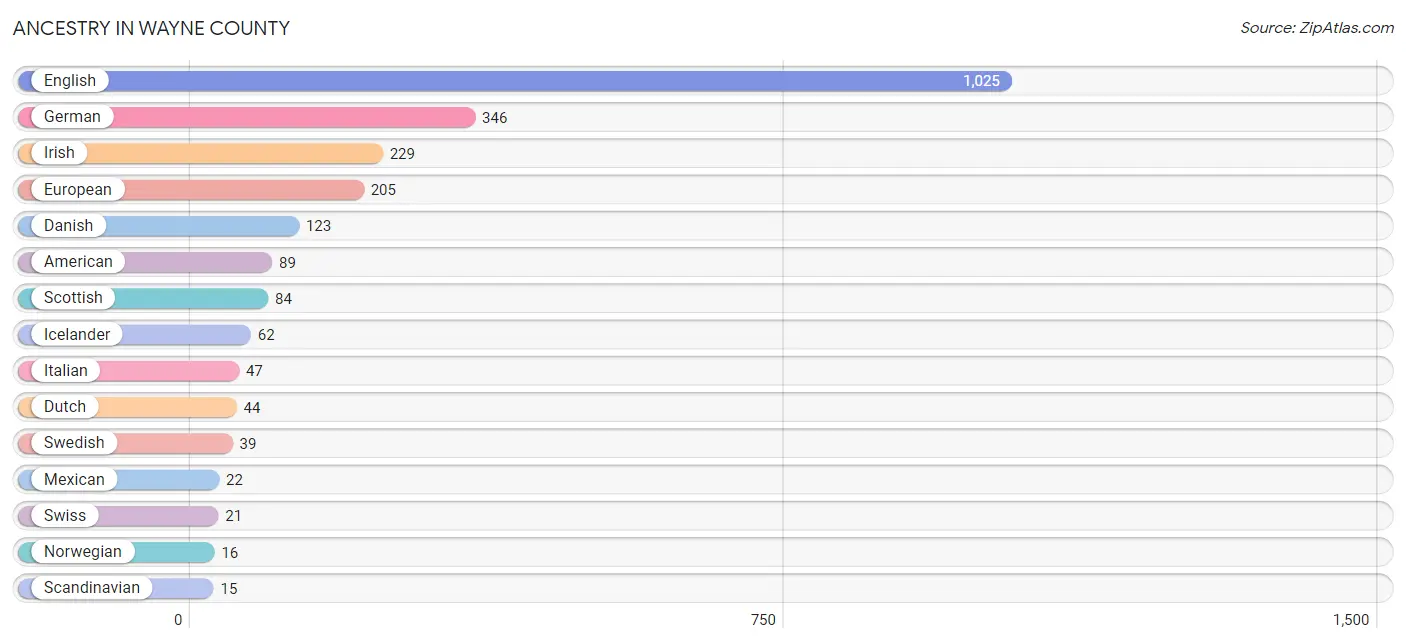
Ancestry in Wayne County
The most populous ancestries reported in Wayne County are English (1,025 | 40.5%), German (346 | 13.7%), Irish (229 | 9.0%), European (205 | 8.1%), and Danish (123 | 4.9%), together accounting for 76.1% of all Wayne County residents.
| Ancestry | # Population | % Population |
| American | 89 | 3.5% |
| British | 12 | 0.5% |
| Danish | 123 | 4.9% |
| Dutch | 44 | 1.7% |
| Eastern European | 5 | 0.2% |
| English | 1,025 | 40.5% |
| European | 205 | 8.1% |
| French | 10 | 0.4% |
| German | 346 | 13.7% |
| Icelander | 62 | 2.5% |
| Irish | 229 | 9.0% |
| Italian | 47 | 1.9% |
| Lithuanian | 1 | 0.0% |
| Mexican | 22 | 0.9% |
| Norwegian | 16 | 0.6% |
| Portuguese | 3 | 0.1% |
| Puerto Rican | 1 | 0.0% |
| Samoan | 3 | 0.1% |
| Scandinavian | 15 | 0.6% |
| Scotch-Irish | 11 | 0.4% |
| Scottish | 84 | 3.3% |
| Swedish | 39 | 1.5% |
| Swiss | 21 | 0.8% |
| Welsh | 8 | 0.3% | View All 24 Rows |
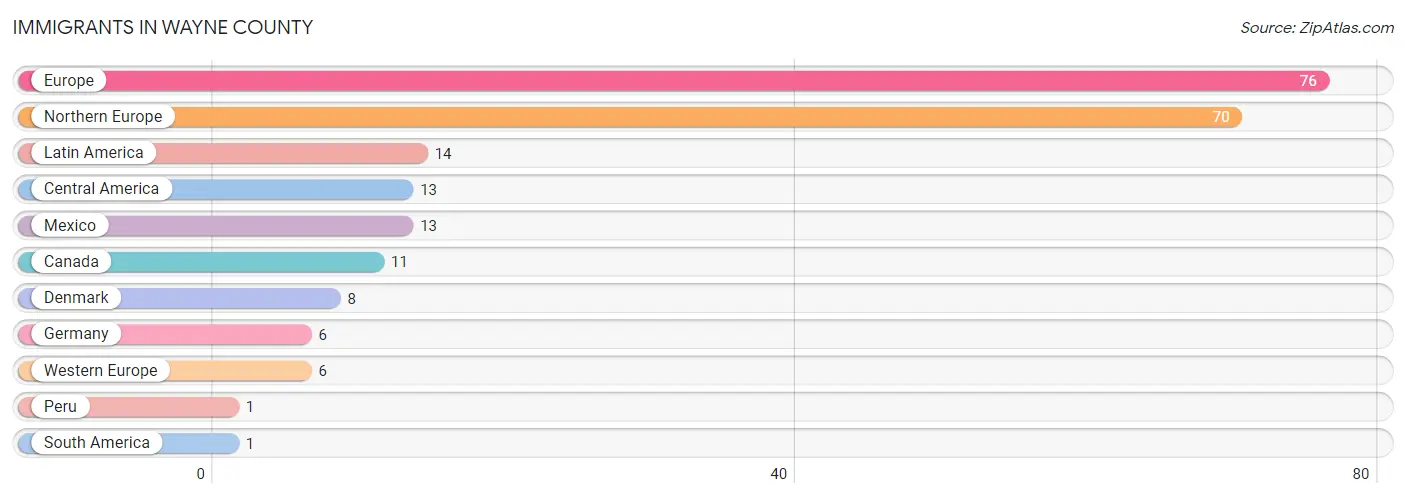
Immigrants in Wayne County
The most numerous immigrant groups reported in Wayne County came from Europe (76 | 3.0%), Northern Europe (70 | 2.8%), Latin America (14 | 0.5%), Central America (13 | 0.5%), and Mexico (13 | 0.5%), together accounting for 7.3% of all Wayne County residents.
| Immigration Origin | # Population | % Population |
| Canada | 11 | 0.4% |
| Central America | 13 | 0.5% |
| Denmark | 8 | 0.3% |
| Europe | 76 | 3.0% |
| Germany | 6 | 0.2% |
| Latin America | 14 | 0.5% |
| Mexico | 13 | 0.5% |
| Northern Europe | 70 | 2.8% |
| Peru | 1 | 0.0% |
| South America | 1 | 0.0% |
| Western Europe | 6 | 0.2% | View All 11 Rows |
Sex and Age in Wayne County
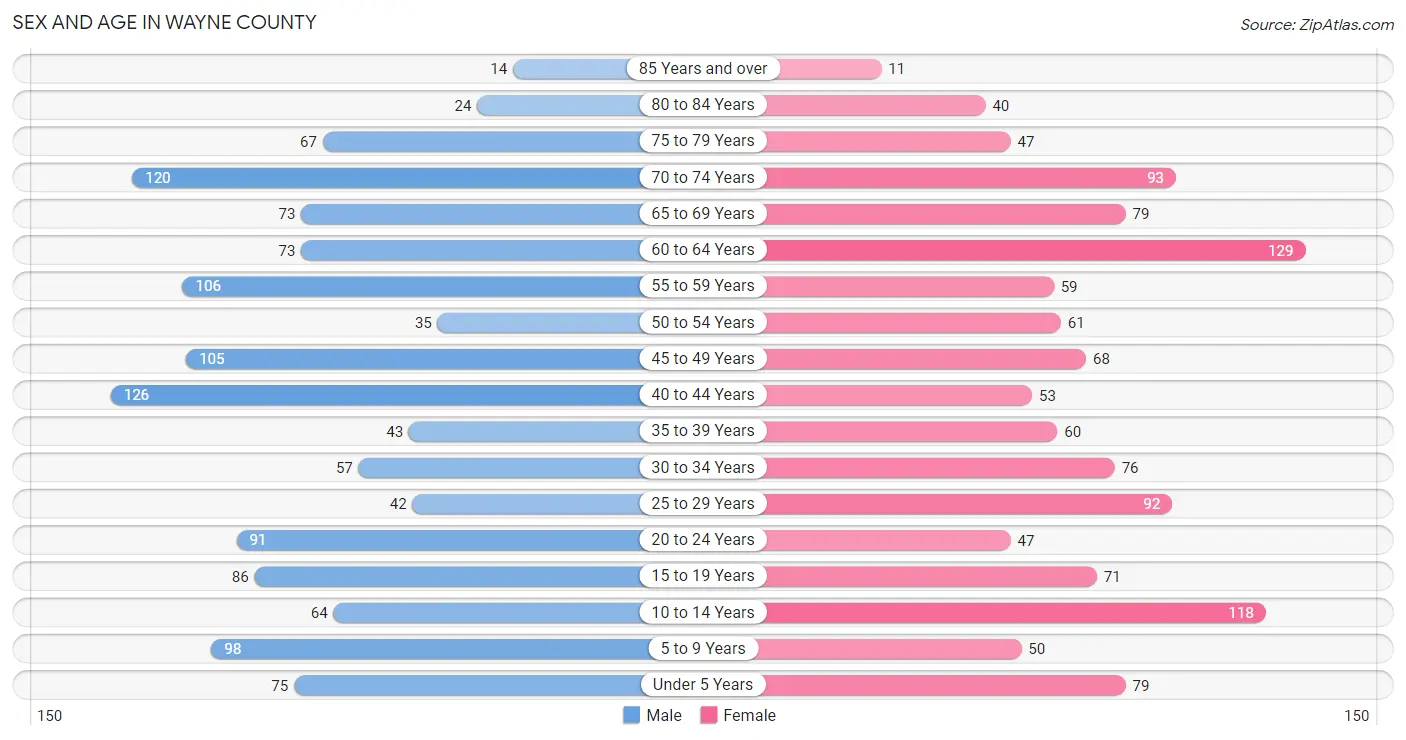
Sex and Age in Wayne County
The most populous age groups in Wayne County are 40 to 44 Years (126 | 9.7%) for men and 60 to 64 Years (129 | 10.5%) for women.
| Age Bracket | Male | Female |
| Under 5 Years | 75 (5.8%) | 79 (6.4%) |
| 5 to 9 Years | 98 (7.5%) | 50 (4.1%) |
| 10 to 14 Years | 64 (4.9%) | 118 (9.6%) |
| 15 to 19 Years | 86 (6.6%) | 71 (5.8%) |
| 20 to 24 Years | 91 (7.0%) | 47 (3.8%) |
| 25 to 29 Years | 42 (3.2%) | 92 (7.5%) |
| 30 to 34 Years | 57 (4.4%) | 76 (6.2%) |
| 35 to 39 Years | 43 (3.3%) | 60 (4.9%) |
| 40 to 44 Years | 126 (9.7%) | 53 (4.3%) |
| 45 to 49 Years | 105 (8.1%) | 68 (5.5%) |
| 50 to 54 Years | 35 (2.7%) | 61 (5.0%) |
| 55 to 59 Years | 106 (8.2%) | 59 (4.8%) |
| 60 to 64 Years | 73 (5.6%) | 129 (10.5%) |
| 65 to 69 Years | 73 (5.6%) | 79 (6.4%) |
| 70 to 74 Years | 120 (9.2%) | 93 (7.5%) |
| 75 to 79 Years | 67 (5.2%) | 47 (3.8%) |
| 80 to 84 Years | 24 (1.8%) | 40 (3.2%) |
| 85 Years and over | 14 (1.1%) | 11 (0.9%) |
| Total | 1,299 (100.0%) | 1,233 (100.0%) |
Families and Households in Wayne County
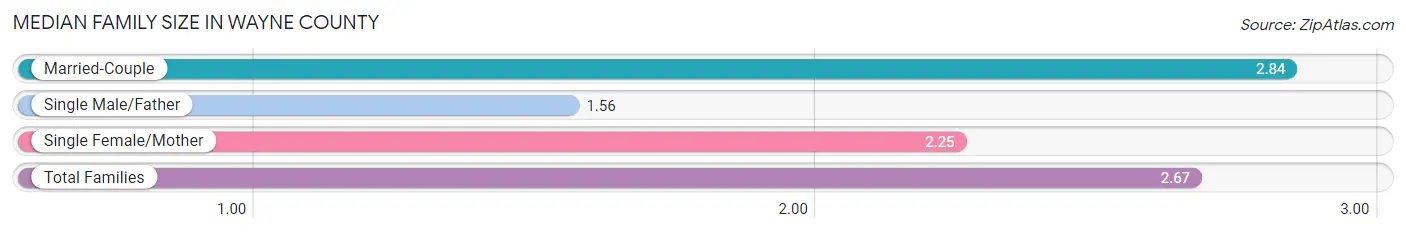
Median Family Size in Wayne County
The median family size in Wayne County is 2.67 persons per family, with married-couple families (672 | 80.7%) accounting for the largest median family size of 2.84 persons per family. On the other hand, single male/father families (77 | 9.2%) represent the smallest median family size with 1.56 persons per family.
| Family Type | # Families | Family Size |
| Married-Couple | 672 (80.7%) | 2.84 |
| Single Male/Father | 77 (9.2%) | 1.56 |
| Single Female/Mother | 84 (10.1%) | 2.25 |
| Total Families | 833 (100.0%) | 2.67 |
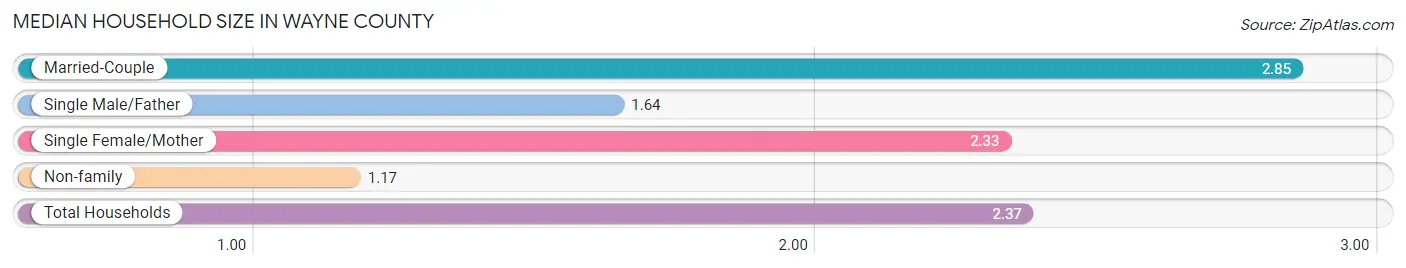
Median Household Size in Wayne County
The median household size in Wayne County is 2.37 persons per household, with married-couple households (672 | 63.9%) accounting for the largest median household size of 2.85 persons per household. non-family households (218 | 20.7%) represent the smallest median household size with 1.17 persons per household.
| Household Type | # Households | Household Size |
| Married-Couple | 672 (63.9%) | 2.85 |
| Single Male/Father | 77 (7.3%) | 1.64 |
| Single Female/Mother | 84 (8.0%) | 2.33 |
| Non-family | 218 (20.7%) | 1.17 |
| Total Households | 1,051 (100.0%) | 2.37 |
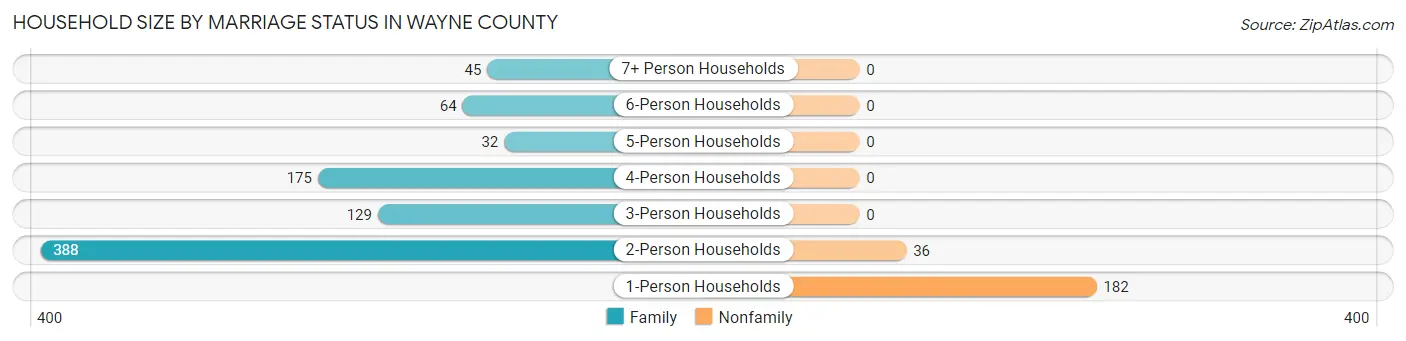
Household Size by Marriage Status in Wayne County
Out of a total of 1,051 households in Wayne County, 833 (79.3%) are family households, while 218 (20.7%) are nonfamily households. The most numerous type of family households are 2-person households, comprising 388, and the most common type of nonfamily households are 1-person households, comprising 182.
| Household Size | Family Households | Nonfamily Households |
| 1-Person Households | - | 182 (17.3%) |
| 2-Person Households | 388 (36.9%) | 36 (3.4%) |
| 3-Person Households | 129 (12.3%) | 0 (0.0%) |
| 4-Person Households | 175 (16.7%) | 0 (0.0%) |
| 5-Person Households | 32 (3.0%) | 0 (0.0%) |
| 6-Person Households | 64 (6.1%) | 0 (0.0%) |
| 7+ Person Households | 45 (4.3%) | 0 (0.0%) |
| Total | 833 (79.3%) | 218 (20.7%) |
Female Fertility in Wayne County
Fertility by Age in Wayne County
Average fertility rate in Wayne County is 122.0 births per 1,000 women. Women in the age bracket of 20 to 34 years have the highest fertility rate with 223.0 births per 1,000 women. Women in the age bracket of 20 to 34 years acount for 82.8% of all women with births.
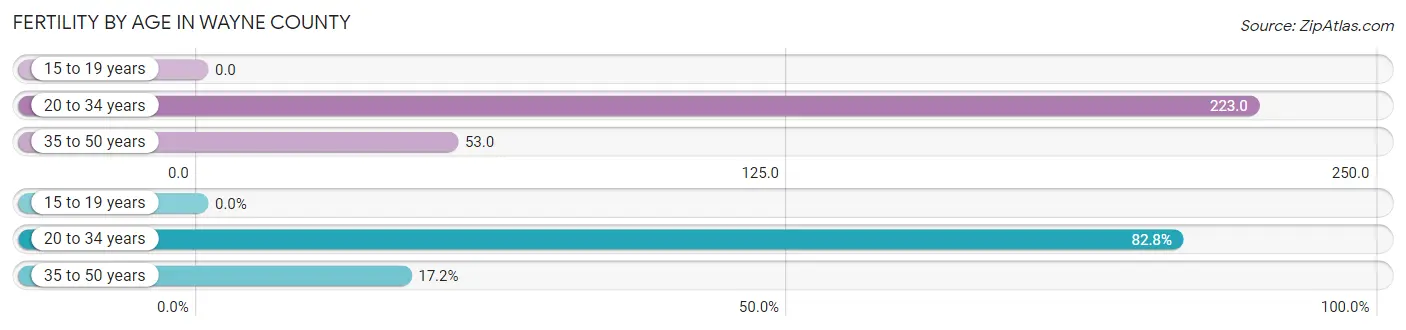
| Age Bracket | Women with Births | Births / 1,000 Women |
| 15 to 19 years | 0 (0.0%) | 0.0 |
| 20 to 34 years | 48 (82.8%) | 223.0 |
| 35 to 50 years | 10 (17.2%) | 53.0 |
| Total | 58 (100.0%) | 122.0 |
Fertility by Age by Marriage Status in Wayne County
98.3% of women with births (58) in Wayne County are married. The highest percentage of unmarried women with births falls into 20 to 34 years age bracket with 2.1% of them unmarried at the time of birth, while the lowest percentage of unmarried women with births belong to 35 to 50 years age bracket with 0.0% of them unmarried.
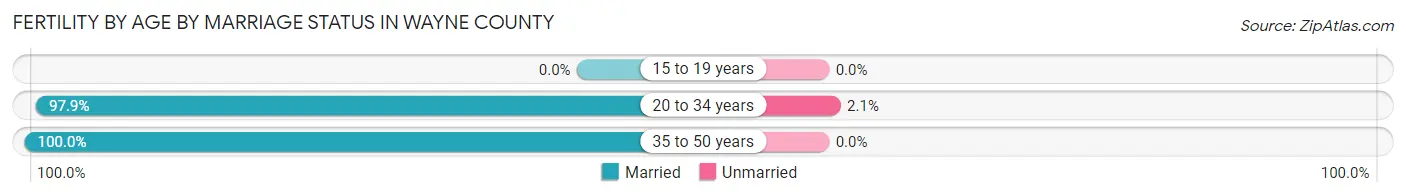
| Age Bracket | Married | Unmarried |
| 15 to 19 years | 0 (0.0%) | 0 (0.0%) |
| 20 to 34 years | 47 (97.9%) | 1 (2.1%) |
| 35 to 50 years | 10 (100.0%) | 0 (0.0%) |
| Total | 57 (98.3%) | 1 (1.7%) |
Fertility by Education in Wayne County
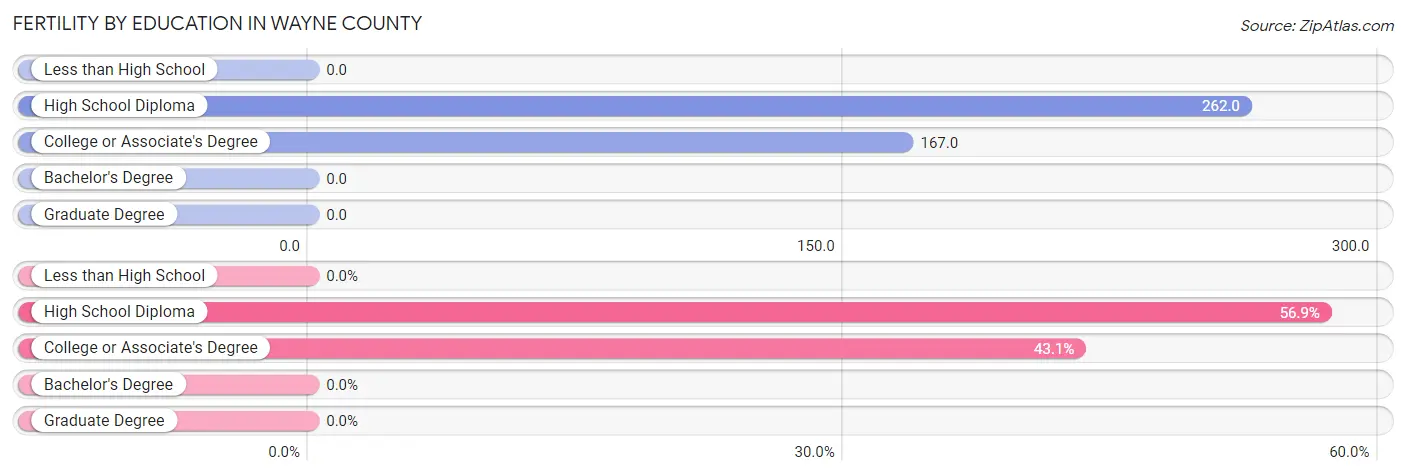
| Educational Attainment | Women with Births | Births / 1,000 Women |
| Less than High School | 0 (0.0%) | 0.0 |
| High School Diploma | 33 (56.9%) | 262.0 |
| College or Associate's Degree | 25 (43.1%) | 167.0 |
| Bachelor's Degree | 0 (0.0%) | 0.0 |
| Graduate Degree | 0 (0.0%) | 0.0 |
| Total | 58 (100.0%) | 122.0 |
Fertility by Education by Marriage Status in Wayne County
1.7% of women with births in Wayne County are unmarried. Women with the educational attainment of high school diploma are most likely to be married with 100.0% of them married at childbirth, while women with the educational attainment of college or associate's degree are least likely to be married with 4.0% of them unmarried at childbirth.
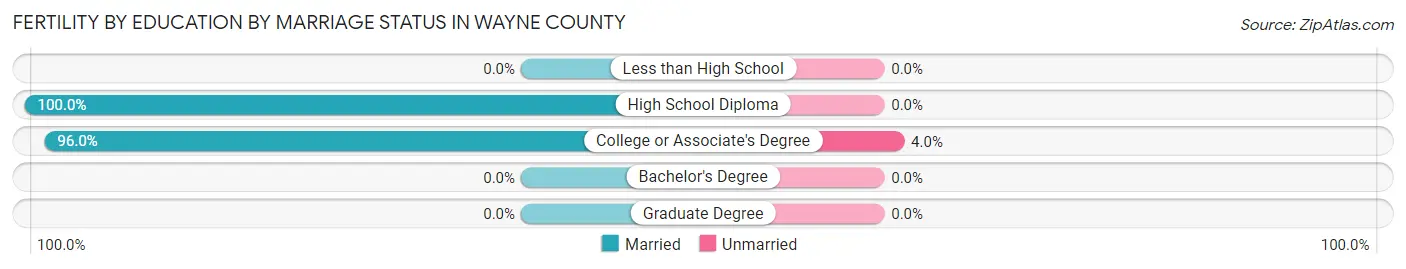
| Educational Attainment | Married | Unmarried |
| Less than High School | 0 (0.0%) | 0 (0.0%) |
| High School Diploma | 33 (100.0%) | 0 (0.0%) |
| College or Associate's Degree | 24 (96.0%) | 1 (4.0%) |
| Bachelor's Degree | 0 (0.0%) | 0 (0.0%) |
| Graduate Degree | 0 (0.0%) | 0 (0.0%) |
| Total | 57 (98.3%) | 1 (1.7%) |
Income in Wayne County
Income Overview in Wayne County
Per Capita Income in Wayne County is $32,605, while median incomes of families and households are $86,010 and $64,870 respectively.
| Characteristic | Number | Measure |
| Per Capita Income | 2,532 | $32,605 |
| Median Family Income | 833 | $86,010 |
| Mean Family Income | 833 | $87,773 |
| Median Household Income | 1,051 | $64,870 |
| Mean Household Income | 1,051 | $78,610 |
| Income Deficit | 833 | $0 |
| Wage / Income Gap (%) | 2,532 | 5.16% |
| Wage / Income Gap ($) | 2,532 | 94.84¢ per $1 |
| Gini / Inequality Index | 2,532 | 0.37 |
Earnings by Sex in Wayne County
Average Earnings in Wayne County are $36,768, $37,847 for men and $35,893 for women, a difference of 5.2%.
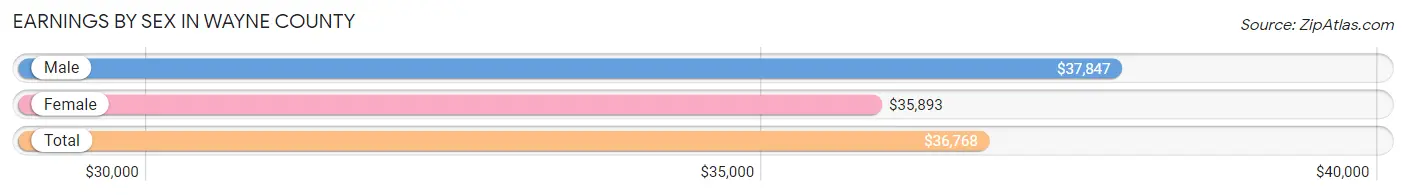
| Sex | Number | Average Earnings |
| Male | 733 (53.3%) | $37,847 |
| Female | 643 (46.7%) | $35,893 |
| Total | 1,376 (100.0%) | $36,768 |
Earnings by Sex by Income Bracket in Wayne County
The most common earnings brackets in Wayne County are $75,000 to $99,999 for men (104 | 14.2%) and $35,000 to $39,999 for women (97 | 15.1%).
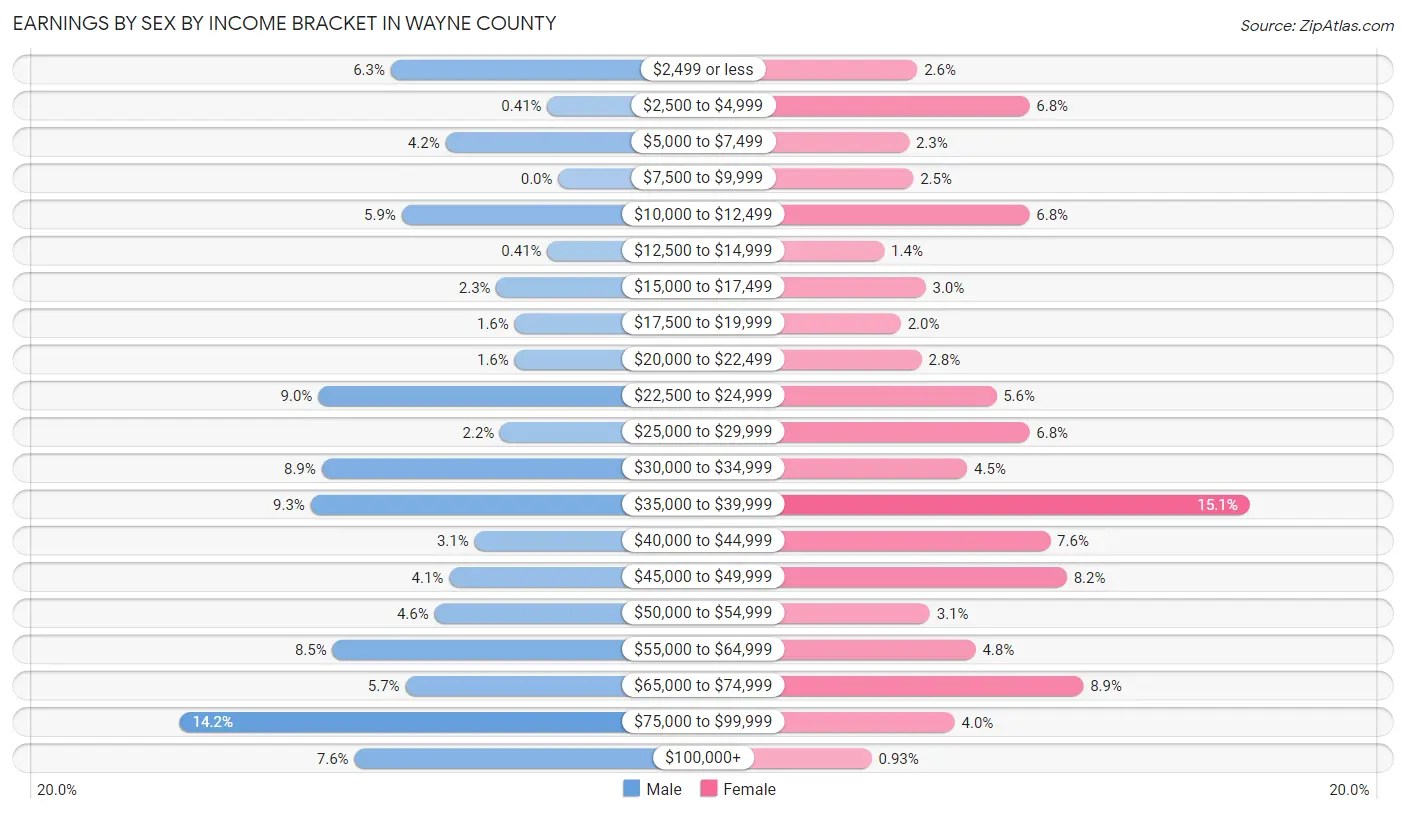
| Income | Male | Female |
| $2,499 or less | 46 (6.3%) | 17 (2.6%) |
| $2,500 to $4,999 | 3 (0.4%) | 44 (6.8%) |
| $5,000 to $7,499 | 31 (4.2%) | 15 (2.3%) |
| $7,500 to $9,999 | 0 (0.0%) | 16 (2.5%) |
| $10,000 to $12,499 | 43 (5.9%) | 44 (6.8%) |
| $12,500 to $14,999 | 3 (0.4%) | 9 (1.4%) |
| $15,000 to $17,499 | 17 (2.3%) | 19 (2.9%) |
| $17,500 to $19,999 | 12 (1.6%) | 13 (2.0%) |
| $20,000 to $22,499 | 12 (1.6%) | 18 (2.8%) |
| $22,500 to $24,999 | 66 (9.0%) | 36 (5.6%) |
| $25,000 to $29,999 | 16 (2.2%) | 44 (6.8%) |
| $30,000 to $34,999 | 65 (8.9%) | 29 (4.5%) |
| $35,000 to $39,999 | 68 (9.3%) | 97 (15.1%) |
| $40,000 to $44,999 | 23 (3.1%) | 49 (7.6%) |
| $45,000 to $49,999 | 30 (4.1%) | 53 (8.2%) |
| $50,000 to $54,999 | 34 (4.6%) | 20 (3.1%) |
| $55,000 to $64,999 | 62 (8.5%) | 31 (4.8%) |
| $65,000 to $74,999 | 42 (5.7%) | 57 (8.9%) |
| $75,000 to $99,999 | 104 (14.2%) | 26 (4.0%) |
| $100,000+ | 56 (7.6%) | 6 (0.9%) |
| Total | 733 (100.0%) | 643 (100.0%) |
Earnings by Sex by Educational Attainment in Wayne County
Average earnings in Wayne County are $46,759 for men and $37,630 for women, a difference of 19.5%. Men with an educational attainment of graduate degree enjoy the highest average annual earnings of $195,893, while those with high school diploma education earn the least with $24,551. Women with an educational attainment of bachelor's degree earn the most with the average annual earnings of $49,688, while those with graduate degree education have the smallest earnings of $28,382.
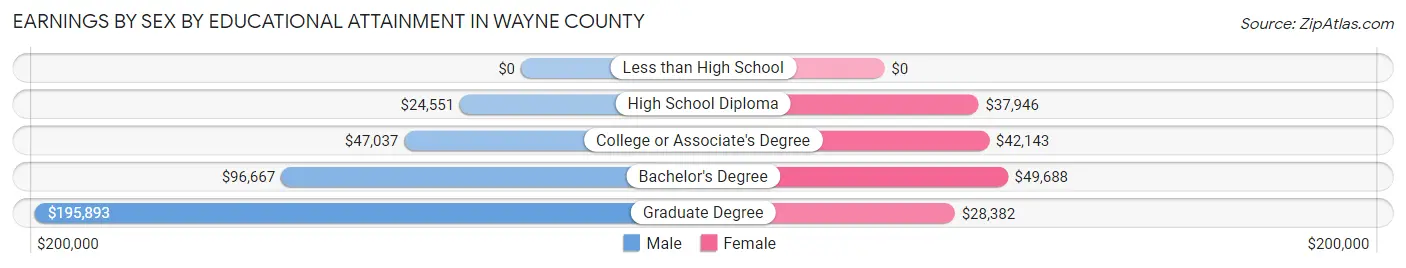
| Educational Attainment | Male Income | Female Income |
| Less than High School | - | - |
| High School Diploma | $24,551 | $37,946 |
| College or Associate's Degree | $47,037 | $42,143 |
| Bachelor's Degree | $96,667 | $49,688 |
| Graduate Degree | $195,893 | $28,382 |
| Total | $46,759 | $37,630 |
Family Income in Wayne County
Family Income Brackets in Wayne County
According to the Wayne County family income data, there are 189 families falling into the $100,000 to $149,999 income range, which is the most common income bracket and makes up 22.7% of all families. Conversely, the $10,000 to $14,999 income bracket is the least frequent group with only 6 families (0.7%) belonging to this category.
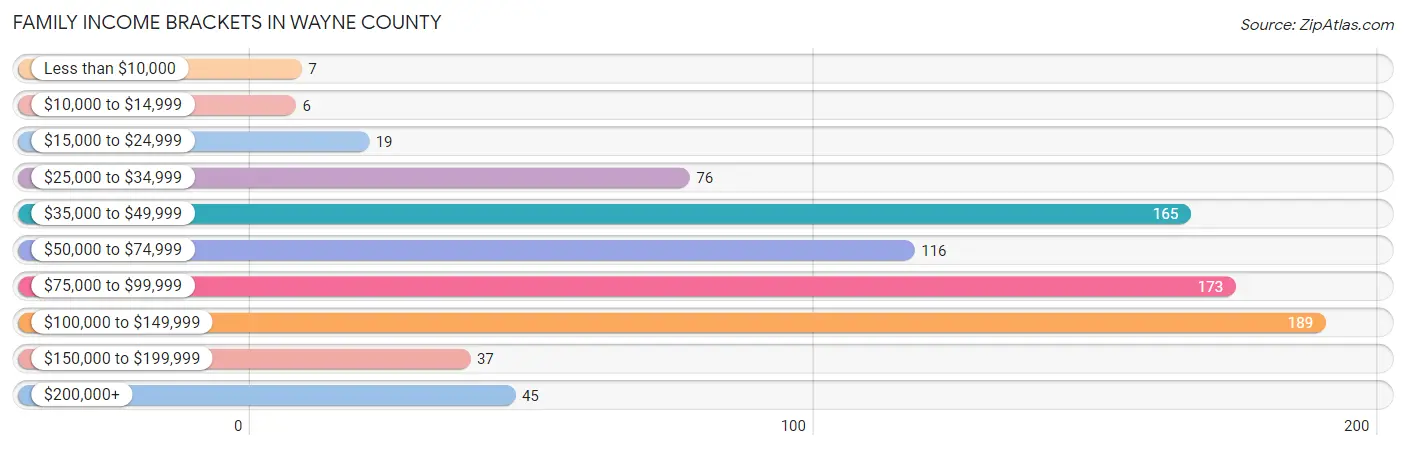
| Income Bracket | # Families | % Families |
| Less than $10,000 | 7 | 0.8% |
| $10,000 to $14,999 | 6 | 0.7% |
| $15,000 to $24,999 | 19 | 2.3% |
| $25,000 to $34,999 | 76 | 9.1% |
| $35,000 to $49,999 | 165 | 19.8% |
| $50,000 to $74,999 | 116 | 13.9% |
| $75,000 to $99,999 | 173 | 20.8% |
| $100,000 to $149,999 | 189 | 22.7% |
| $150,000 to $199,999 | 37 | 4.4% |
| $200,000+ | 45 | 5.4% |
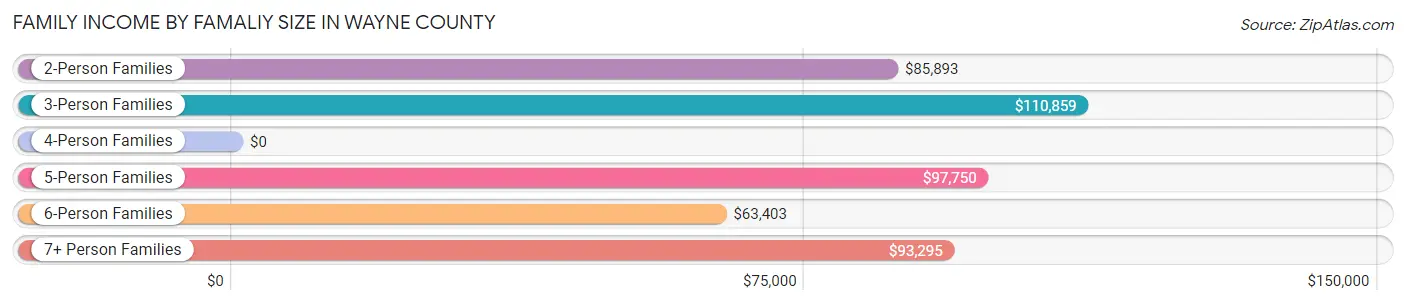
Family Income by Famaliy Size in Wayne County
3-person families (151 | 18.1%) account for the highest median family income in Wayne County with $110,859 per family, while 2-person families (388 | 46.6%) have the highest median income of $42,946 per family member.
| Income Bracket | # Families | Median Income |
| 2-Person Families | 388 (46.6%) | $85,893 |
| 3-Person Families | 151 (18.1%) | $110,859 |
| 4-Person Families | 153 (18.4%) | $0 |
| 5-Person Families | 55 (6.6%) | $97,750 |
| 6-Person Families | 41 (4.9%) | $63,403 |
| 7+ Person Families | 45 (5.4%) | $93,295 |
| Total | 833 (100.0%) | $86,010 |
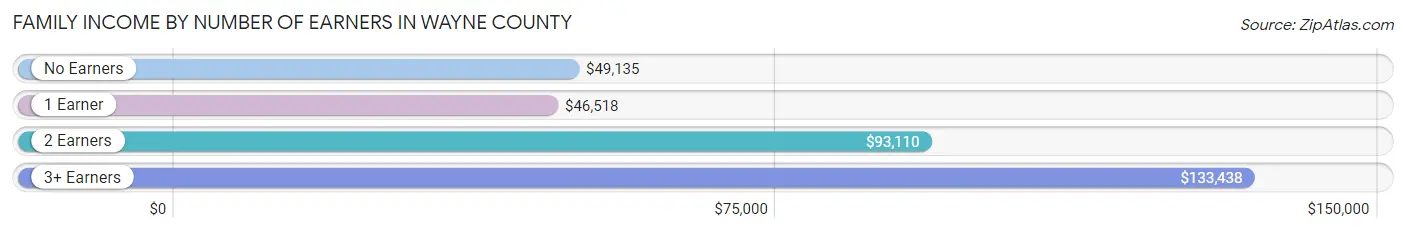
Family Income by Number of Earners in Wayne County
The median family income in Wayne County is $86,010, with families comprising 3+ earners (124) having the highest median family income of $133,438, while families with 1 earner (281) have the lowest median family income of $46,518, accounting for 14.9% and 33.7% of families, respectively.
| Number of Earners | # Families | Median Income |
| No Earners | 119 (14.3%) | $49,135 |
| 1 Earner | 281 (33.7%) | $46,518 |
| 2 Earners | 309 (37.1%) | $93,110 |
| 3+ Earners | 124 (14.9%) | $133,438 |
| Total | 833 (100.0%) | $86,010 |
Household Income in Wayne County
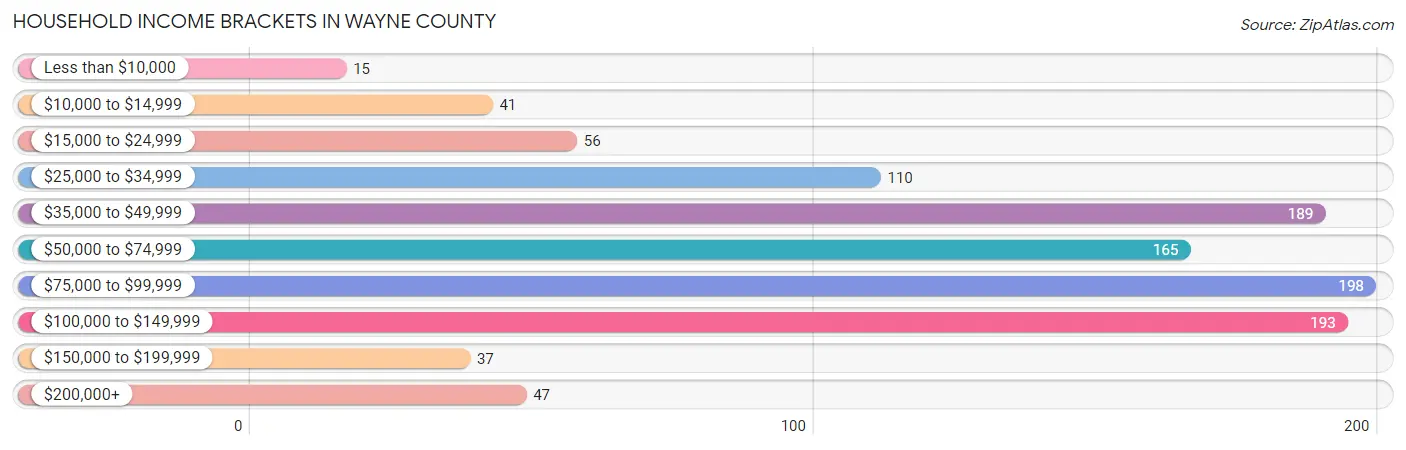
Household Income Brackets in Wayne County
With 198 households falling in the category, the $75,000 to $99,999 income range is the most frequent in Wayne County, accounting for 18.8% of all households. In contrast, only 15 households (1.4%) fall into the less than $10,000 income bracket, making it the least populous group.
| Income Bracket | # Households | % Households |
| Less than $10,000 | 15 | 1.4% |
| $10,000 to $14,999 | 41 | 3.9% |
| $15,000 to $24,999 | 56 | 5.3% |
| $25,000 to $34,999 | 110 | 10.5% |
| $35,000 to $49,999 | 189 | 18.0% |
| $50,000 to $74,999 | 165 | 15.7% |
| $75,000 to $99,999 | 198 | 18.8% |
| $100,000 to $149,999 | 193 | 18.4% |
| $150,000 to $199,999 | 37 | 3.5% |
| $200,000+ | 47 | 4.5% |
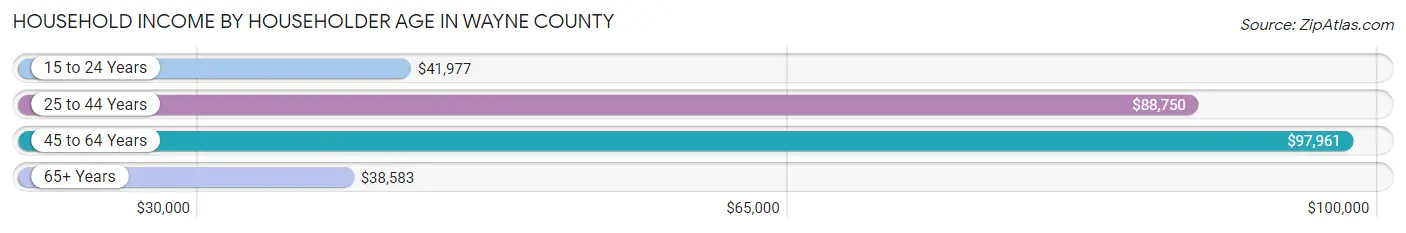
Household Income by Householder Age in Wayne County
The median household income in Wayne County is $64,870, with the highest median household income of $97,961 found in the 45 to 64 years age bracket for the primary householder. A total of 372 households (35.4%) fall into this category. Meanwhile, the 65+ years age bracket for the primary householder has the lowest median household income of $38,583, with 309 households (29.4%) in this group.
| Income Bracket | # Households | Median Income |
| 15 to 24 Years | 68 (6.5%) | $41,977 |
| 25 to 44 Years | 302 (28.7%) | $88,750 |
| 45 to 64 Years | 372 (35.4%) | $97,961 |
| 65+ Years | 309 (29.4%) | $38,583 |
| Total | 1,051 (100.0%) | $64,870 |
Poverty in Wayne County
Income Below Poverty by Sex and Age in Wayne County
With 7.6% poverty level for males and 9.4% for females among the residents of Wayne County, 65 to 74 year old males and 5 year old females are the most vulnerable to poverty, with 29 males (15.0%) and 6 females (54.5%) in their respective age groups living below the poverty level.
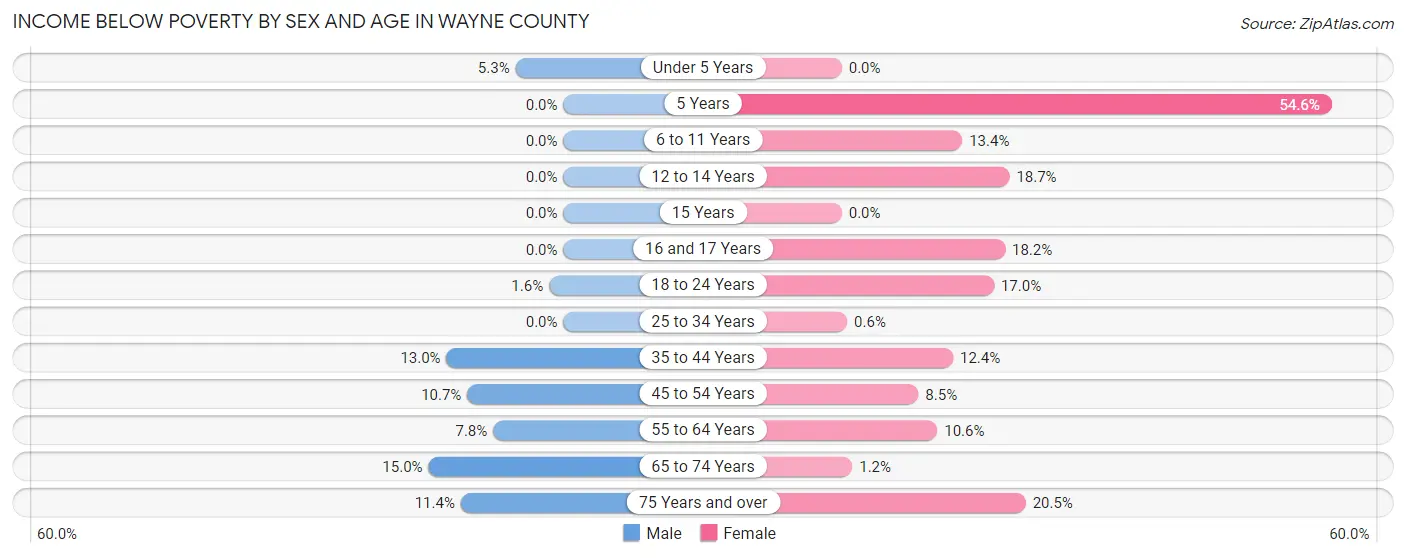
| Age Bracket | Male | Female |
| Under 5 Years | 4 (5.3%) | 0 (0.0%) |
| 5 Years | 0 (0.0%) | 6 (54.5%) |
| 6 to 11 Years | 0 (0.0%) | 11 (13.4%) |
| 12 to 14 Years | 0 (0.0%) | 14 (18.7%) |
| 15 Years | 0 (0.0%) | 0 (0.0%) |
| 16 and 17 Years | 0 (0.0%) | 8 (18.2%) |
| 18 to 24 Years | 2 (1.6%) | 10 (17.0%) |
| 25 to 34 Years | 0 (0.0%) | 1 (0.6%) |
| 35 to 44 Years | 22 (13.0%) | 14 (12.4%) |
| 45 to 54 Years | 15 (10.7%) | 11 (8.5%) |
| 55 to 64 Years | 14 (7.8%) | 20 (10.6%) |
| 65 to 74 Years | 29 (15.0%) | 2 (1.2%) |
| 75 Years and over | 12 (11.4%) | 17 (20.5%) |
| Total | 98 (7.6%) | 114 (9.4%) |
Income Above Poverty by Sex and Age in Wayne County
According to the poverty statistics in Wayne County, males aged 5 years and females aged under 5 years are the age groups that are most secure financially, with 100.0% of males and 100.0% of females in these age groups living above the poverty line.
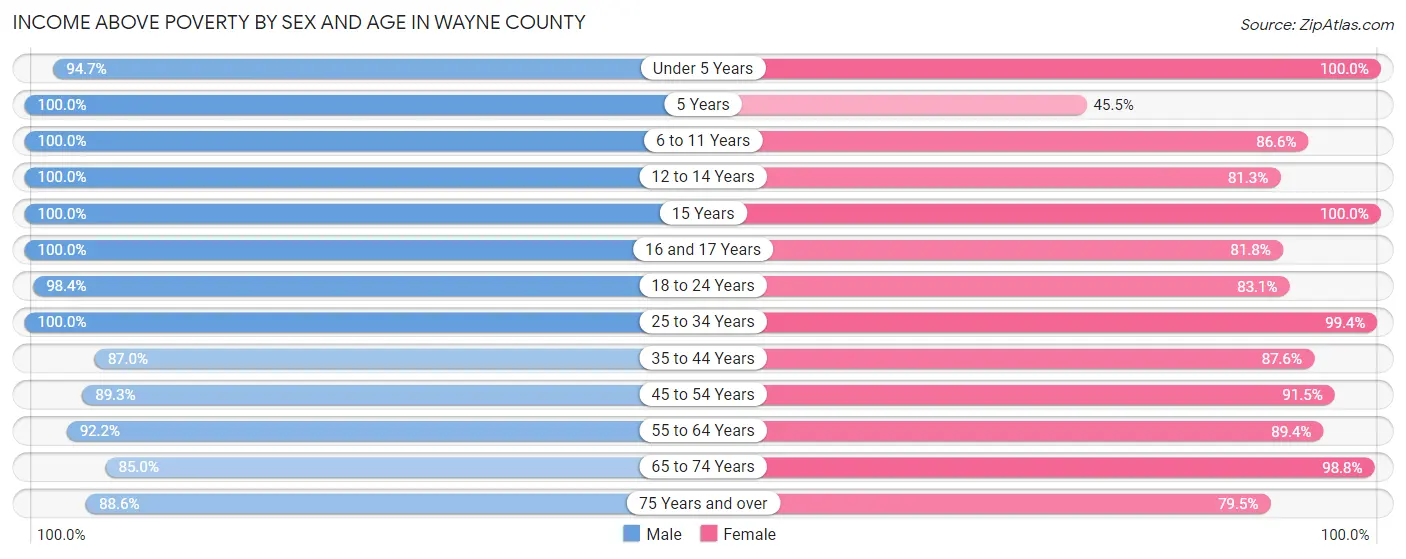
| Age Bracket | Male | Female |
| Under 5 Years | 71 (94.7%) | 79 (100.0%) |
| 5 Years | 27 (100.0%) | 5 (45.5%) |
| 6 to 11 Years | 84 (100.0%) | 71 (86.6%) |
| 12 to 14 Years | 45 (100.0%) | 61 (81.3%) |
| 15 Years | 5 (100.0%) | 13 (100.0%) |
| 16 and 17 Years | 44 (100.0%) | 36 (81.8%) |
| 18 to 24 Years | 123 (98.4%) | 49 (83.1%) |
| 25 to 34 Years | 99 (100.0%) | 167 (99.4%) |
| 35 to 44 Years | 147 (87.0%) | 99 (87.6%) |
| 45 to 54 Years | 125 (89.3%) | 118 (91.5%) |
| 55 to 64 Years | 165 (92.2%) | 168 (89.4%) |
| 65 to 74 Years | 164 (85.0%) | 169 (98.8%) |
| 75 Years and over | 93 (88.6%) | 66 (79.5%) |
| Total | 1,192 (92.4%) | 1,101 (90.6%) |
Income Below Poverty Among Married-Couple Families in Wayne County
The poverty statistics for married-couple families in Wayne County show that 4.3% or 29 of the total 672 families live below the poverty line. Families with 5 or more children have the highest poverty rate of 23.3%, comprising of 10 families. On the other hand, families with 3 or 4 children have the lowest poverty rate of 0.0%, which includes 0 families.
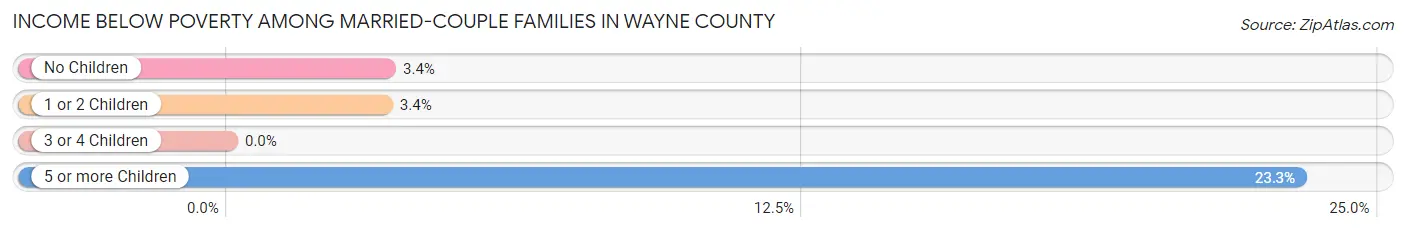
| Children | Above Poverty | Below Poverty |
| No Children | 365 (96.6%) | 13 (3.4%) |
| 1 or 2 Children | 172 (96.6%) | 6 (3.4%) |
| 3 or 4 Children | 73 (100.0%) | 0 (0.0%) |
| 5 or more Children | 33 (76.7%) | 10 (23.3%) |
| Total | 643 (95.7%) | 29 (4.3%) |
Income Below Poverty Among Single-Parent Households in Wayne County
According to the poverty data in Wayne County, 11.7% or 9 single-father households and 4.8% or 4 single-mother households are living below the poverty line. Among single-father households, those with 1 or 2 children have the highest poverty rate, with 9 households (39.1%) experiencing poverty. Likewise, among single-mother households, those with 1 or 2 children have the highest poverty rate, with 4 households (18.2%) falling below the poverty line.
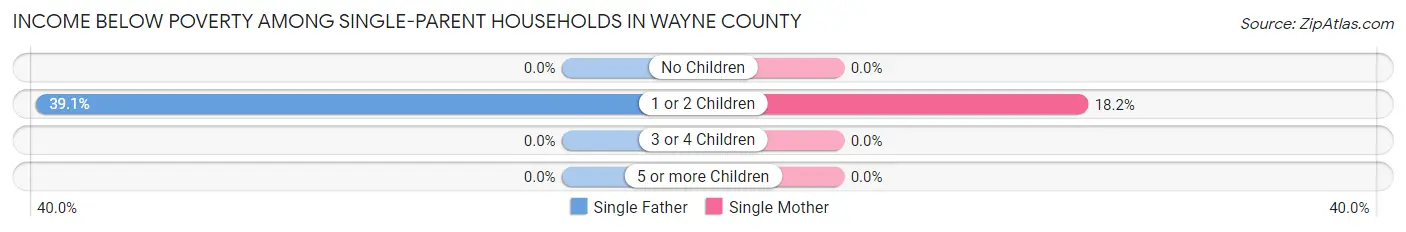
| Children | Single Father | Single Mother |
| No Children | 0 (0.0%) | 0 (0.0%) |
| 1 or 2 Children | 9 (39.1%) | 4 (18.2%) |
| 3 or 4 Children | 0 (0.0%) | 0 (0.0%) |
| 5 or more Children | 0 (0.0%) | 0 (0.0%) |
| Total | 9 (11.7%) | 4 (4.8%) |
Income Below Poverty Among Married-Couple vs Single-Parent Households in Wayne County
The poverty data for Wayne County shows that 29 of the married-couple family households (4.3%) and 13 of the single-parent households (8.1%) are living below the poverty level. Within the married-couple family households, those with 5 or more children have the highest poverty rate, with 10 households (23.3%) falling below the poverty line. Among the single-parent households, those with 1 or 2 children have the highest poverty rate, with 13 household (28.9%) living below poverty.
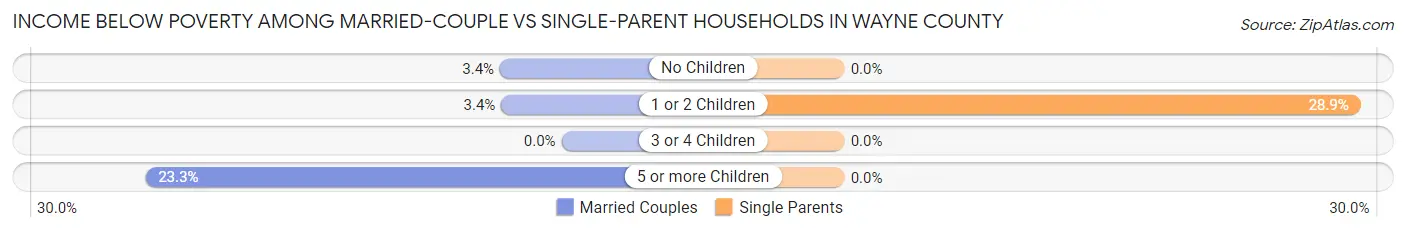
| Children | Married-Couple Families | Single-Parent Households |
| No Children | 13 (3.4%) | 0 (0.0%) |
| 1 or 2 Children | 6 (3.4%) | 13 (28.9%) |
| 3 or 4 Children | 0 (0.0%) | 0 (0.0%) |
| 5 or more Children | 10 (23.3%) | 0 (0.0%) |
| Total | 29 (4.3%) | 13 (8.1%) |
Employment Characteristics in Wayne County
Employment by Class of Employer in Wayne County
Among the 1,271 employed individuals in Wayne County, private company employees (650 | 51.1%), self-employed (not incorporated) (222 | 17.5%), and federal government employees (132 | 10.4%) make up the most common classes of employment.
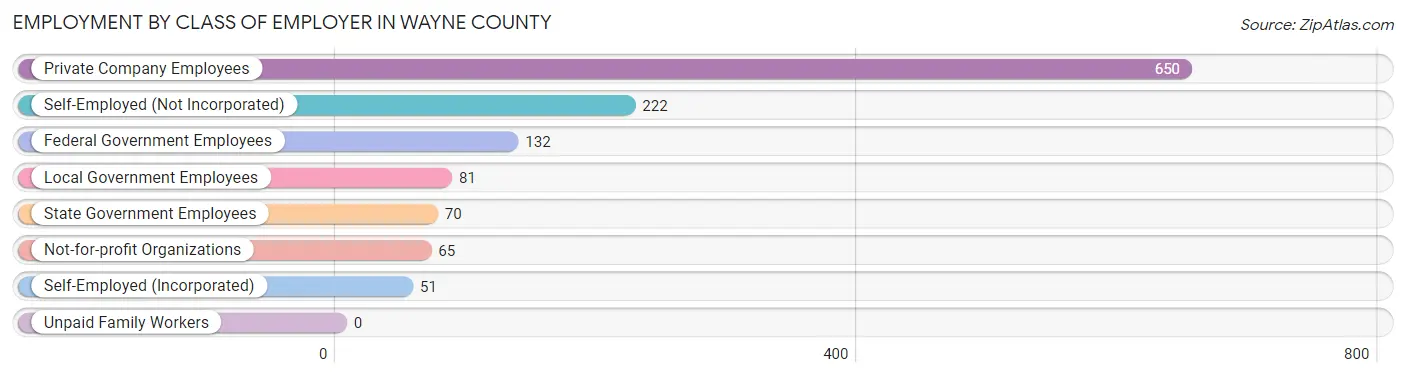
| Employer Class | # Employees | % Employees |
| Private Company Employees | 650 | 51.1% |
| Self-Employed (Incorporated) | 51 | 4.0% |
| Self-Employed (Not Incorporated) | 222 | 17.5% |
| Not-for-profit Organizations | 65 | 5.1% |
| Local Government Employees | 81 | 6.4% |
| State Government Employees | 70 | 5.5% |
| Federal Government Employees | 132 | 10.4% |
| Unpaid Family Workers | 0 | 0.0% |
| Total | 1,271 | 100.0% |
Employment Status by Age in Wayne County
According to the labor force statistics for Wayne County, out of the total population over 16 years of age (2,026), 63.3% or 1,282 individuals are in the labor force, with 0.6% or 8 of them unemployed. The age group with the highest labor force participation rate is 30 to 34 years, with 97.7% or 130 individuals in the labor force. Within the labor force, the 65 to 74 years age range has the highest percentage of unemployed individuals, with 7.8% or 6 of them being unemployed.
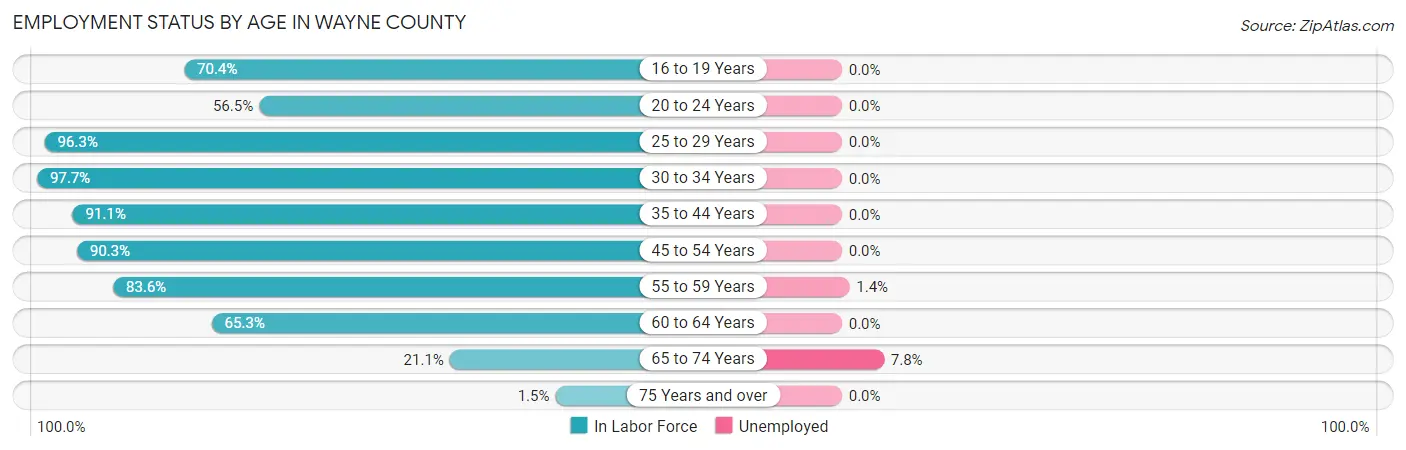
| Age Bracket | In Labor Force | Unemployed |
| 16 to 19 Years | 95 (70.4%) | 0 (0.0%) |
| 20 to 24 Years | 78 (56.5%) | 0 (0.0%) |
| 25 to 29 Years | 129 (96.3%) | 0 (0.0%) |
| 30 to 34 Years | 130 (97.7%) | 0 (0.0%) |
| 35 to 44 Years | 257 (91.1%) | 0 (0.0%) |
| 45 to 54 Years | 243 (90.3%) | 0 (0.0%) |
| 55 to 59 Years | 138 (83.6%) | 2 (1.4%) |
| 60 to 64 Years | 132 (65.3%) | 0 (0.0%) |
| 65 to 74 Years | 77 (21.1%) | 6 (7.8%) |
| 75 Years and over | 3 (1.5%) | 0 (0.0%) |
| Total | 1,282 (63.3%) | 8 (0.6%) |
Employment Status by Educational Attainment in Wayne County
According to labor force statistics for Wayne County, 86.8% of individuals (1,029) out of the total population between 25 and 64 years of age (1,185) are in the labor force, with 0.2% or 2 of them being unemployed. The group with the highest labor force participation rate are those with the educational attainment of college / associate degree, with 91.7% or 499 individuals in the labor force. Within the labor force, individuals with college / associate degree education have the highest percentage of unemployment, with 0.4% or 2 of them being unemployed.
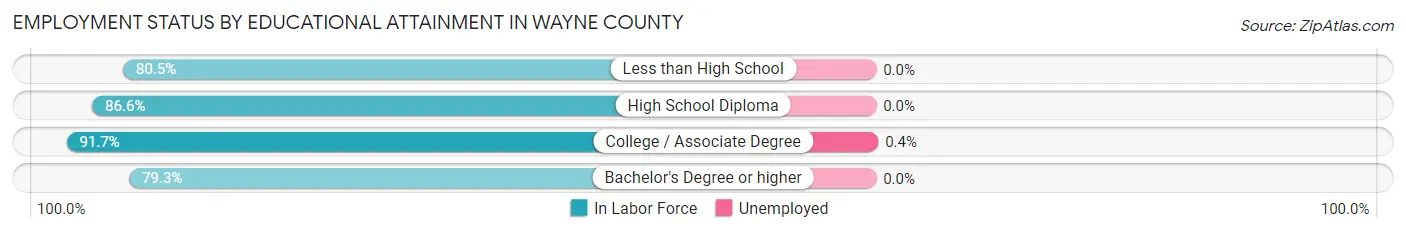
| Educational Attainment | In Labor Force | Unemployed |
| Less than High School | 70 (80.5%) | 0 (0.0%) |
| High School Diploma | 246 (86.6%) | 0 (0.0%) |
| College / Associate Degree | 499 (91.7%) | 2 (0.4%) |
| Bachelor's Degree or higher | 214 (79.3%) | 0 (0.0%) |
| Total | 1,029 (86.8%) | 2 (0.2%) |
Employment Occupations by Sex in Wayne County
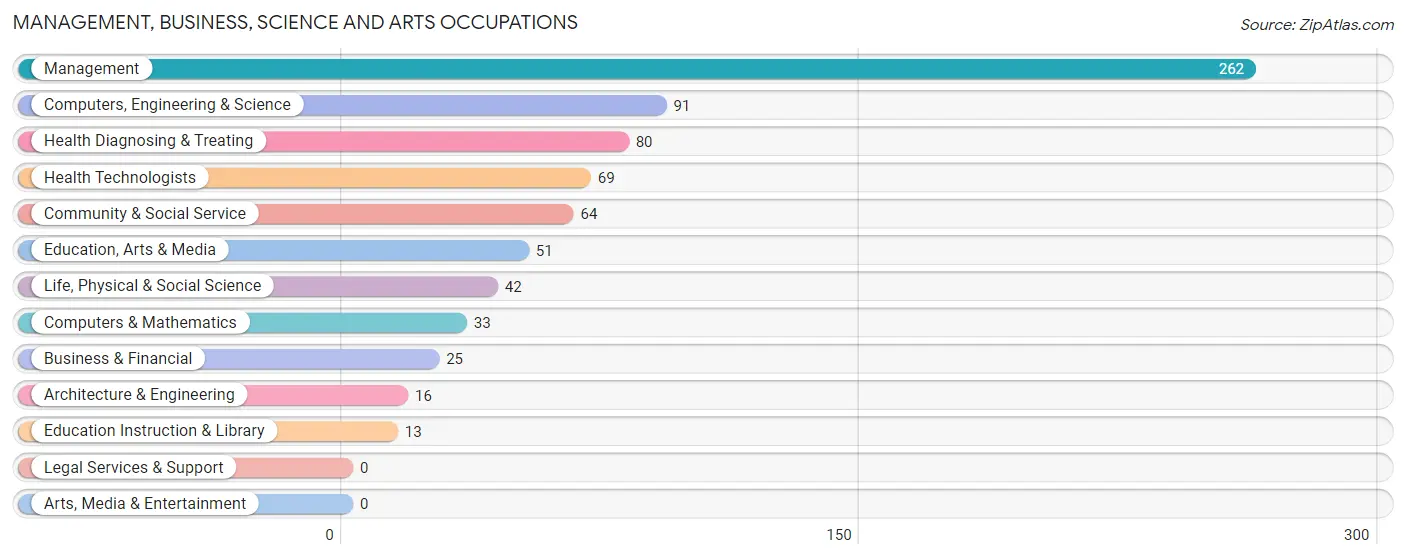
Management, Business, Science and Arts Occupations
The most common Management, Business, Science and Arts occupations in Wayne County are Management (262 | 20.6%), Computers, Engineering & Science (91 | 7.1%), Health Diagnosing & Treating (80 | 6.3%), Health Technologists (69 | 5.4%), and Community & Social Service (64 | 5.0%).
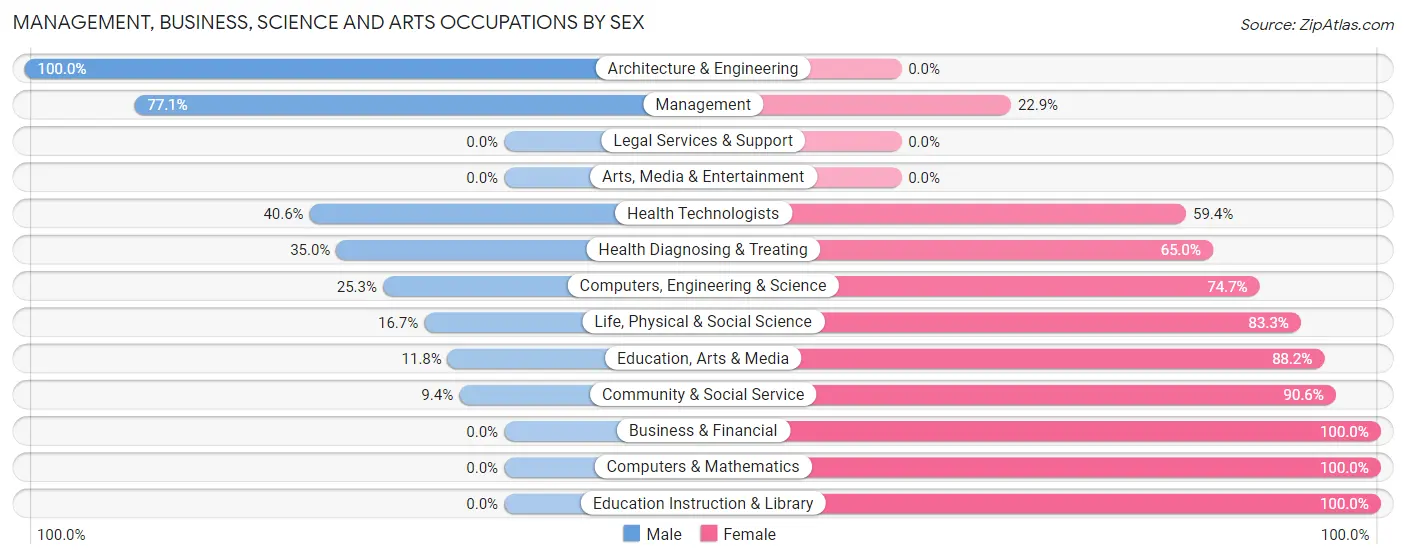
Management, Business, Science and Arts Occupations by Sex
Within the Management, Business, Science and Arts occupations in Wayne County, the most male-oriented occupations are Architecture & Engineering (100.0%), Management (77.1%), and Health Technologists (40.6%), while the most female-oriented occupations are Business & Financial (100.0%), Computers & Mathematics (100.0%), and Education Instruction & Library (100.0%).
| Occupation | Male | Female |
| Management | 202 (77.1%) | 60 (22.9%) |
| Business & Financial | 0 (0.0%) | 25 (100.0%) |
| Computers, Engineering & Science | 23 (25.3%) | 68 (74.7%) |
| Computers & Mathematics | 0 (0.0%) | 33 (100.0%) |
| Architecture & Engineering | 16 (100.0%) | 0 (0.0%) |
| Life, Physical & Social Science | 7 (16.7%) | 35 (83.3%) |
| Community & Social Service | 6 (9.4%) | 58 (90.6%) |
| Education, Arts & Media | 6 (11.8%) | 45 (88.2%) |
| Legal Services & Support | 0 (0.0%) | 0 (0.0%) |
| Education Instruction & Library | 0 (0.0%) | 13 (100.0%) |
| Arts, Media & Entertainment | 0 (0.0%) | 0 (0.0%) |
| Health Diagnosing & Treating | 28 (35.0%) | 52 (65.0%) |
| Health Technologists | 28 (40.6%) | 41 (59.4%) |
| Total (Category) | 259 (49.6%) | 263 (50.4%) |
| Total (Overall) | 698 (54.8%) | 576 (45.2%) |
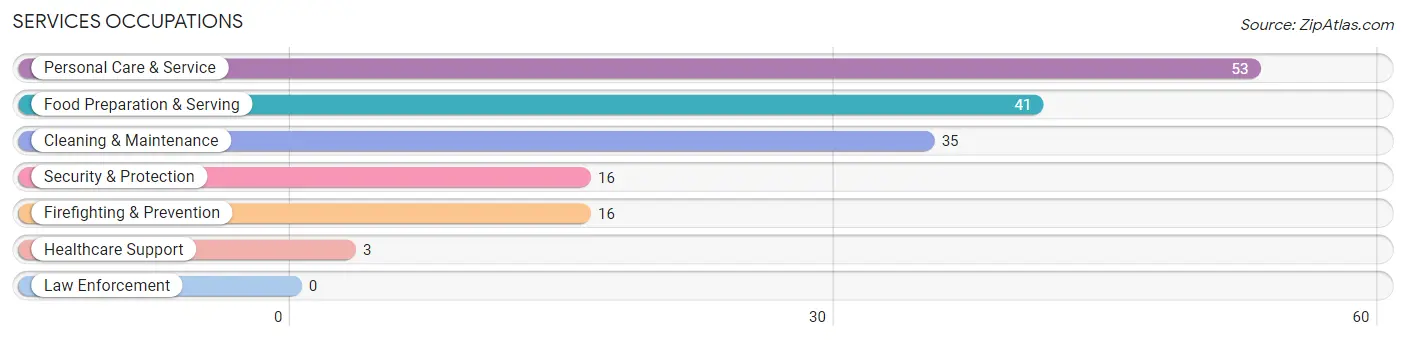
Services Occupations
The most common Services occupations in Wayne County are Personal Care & Service (53 | 4.2%), Food Preparation & Serving (41 | 3.2%), Cleaning & Maintenance (35 | 2.8%), Security & Protection (16 | 1.3%), and Firefighting & Prevention (16 | 1.3%).
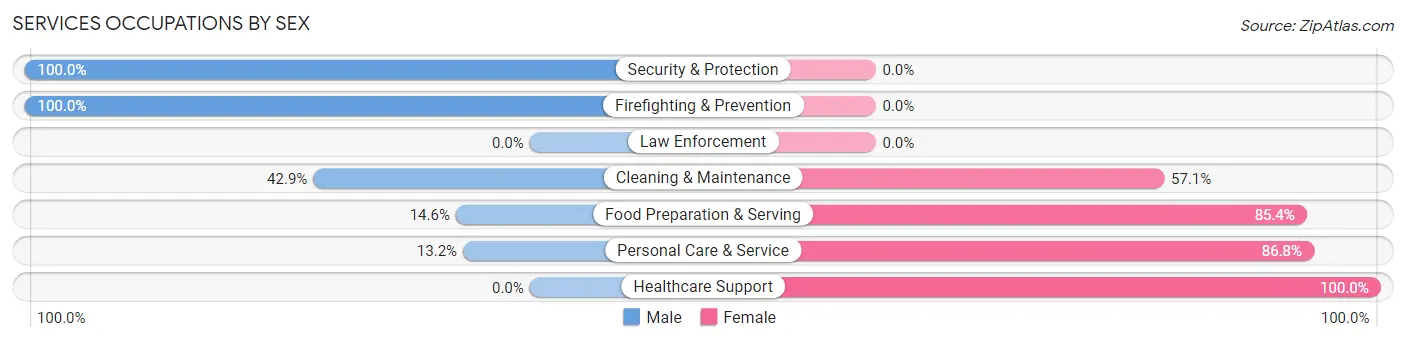
Services Occupations by Sex
Within the Services occupations in Wayne County, the most male-oriented occupations are Security & Protection (100.0%), Firefighting & Prevention (100.0%), and Cleaning & Maintenance (42.9%), while the most female-oriented occupations are Healthcare Support (100.0%), Personal Care & Service (86.8%), and Food Preparation & Serving (85.4%).
| Occupation | Male | Female |
| Healthcare Support | 0 (0.0%) | 3 (100.0%) |
| Security & Protection | 16 (100.0%) | 0 (0.0%) |
| Firefighting & Prevention | 16 (100.0%) | 0 (0.0%) |
| Law Enforcement | 0 (0.0%) | 0 (0.0%) |
| Food Preparation & Serving | 6 (14.6%) | 35 (85.4%) |
| Cleaning & Maintenance | 15 (42.9%) | 20 (57.1%) |
| Personal Care & Service | 7 (13.2%) | 46 (86.8%) |
| Total (Category) | 44 (29.7%) | 104 (70.3%) |
| Total (Overall) | 698 (54.8%) | 576 (45.2%) |
Sales and Office Occupations
The most common Sales and Office occupations in Wayne County are Sales & Related (142 | 11.2%), and Office & Administration (102 | 8.0%).
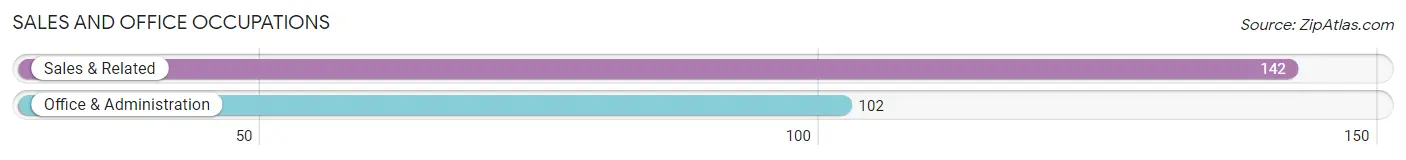
Sales and Office Occupations by Sex

| Occupation | Male | Female |
| Sales & Related | 49 (34.5%) | 93 (65.5%) |
| Office & Administration | 4 (3.9%) | 98 (96.1%) |
| Total (Category) | 53 (21.7%) | 191 (78.3%) |
| Total (Overall) | 698 (54.8%) | 576 (45.2%) |
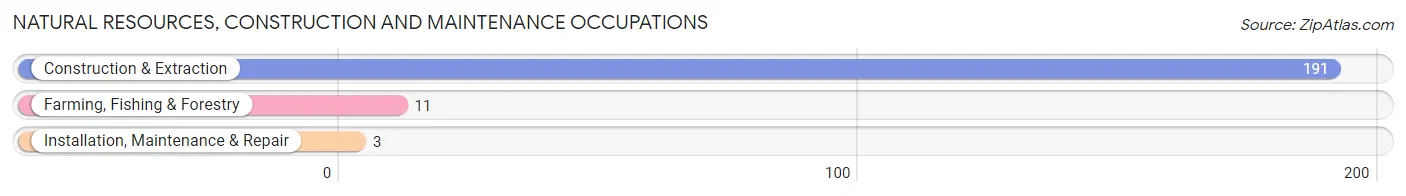
Natural Resources, Construction and Maintenance Occupations
The most common Natural Resources, Construction and Maintenance occupations in Wayne County are Construction & Extraction (191 | 15.0%), Farming, Fishing & Forestry (11 | 0.9%), and Installation, Maintenance & Repair (3 | 0.2%).
Natural Resources, Construction and Maintenance Occupations by Sex
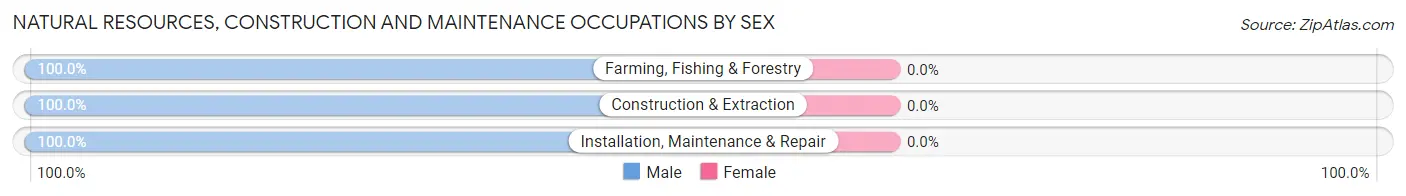
| Occupation | Male | Female |
| Farming, Fishing & Forestry | 11 (100.0%) | 0 (0.0%) |
| Construction & Extraction | 191 (100.0%) | 0 (0.0%) |
| Installation, Maintenance & Repair | 3 (100.0%) | 0 (0.0%) |
| Total (Category) | 205 (100.0%) | 0 (0.0%) |
| Total (Overall) | 698 (54.8%) | 576 (45.2%) |
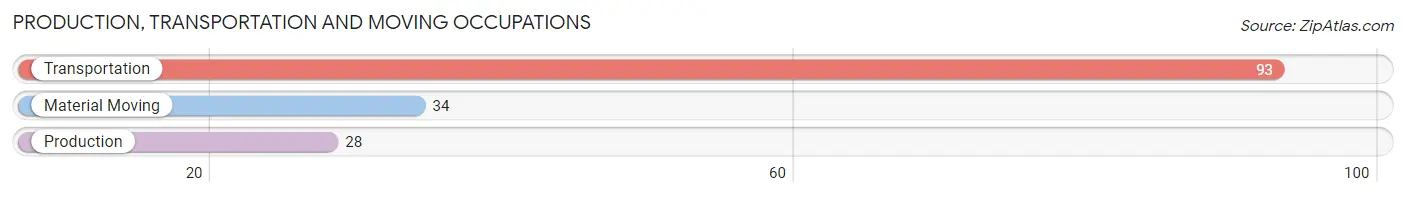
Production, Transportation and Moving Occupations
The most common Production, Transportation and Moving occupations in Wayne County are Transportation (93 | 7.3%), Material Moving (34 | 2.7%), and Production (28 | 2.2%).
Production, Transportation and Moving Occupations by Sex
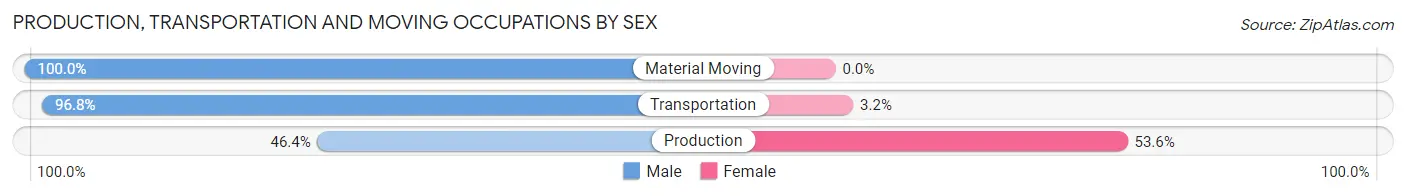
| Occupation | Male | Female |
| Production | 13 (46.4%) | 15 (53.6%) |
| Transportation | 90 (96.8%) | 3 (3.2%) |
| Material Moving | 34 (100.0%) | 0 (0.0%) |
| Total (Category) | 137 (88.4%) | 18 (11.6%) |
| Total (Overall) | 698 (54.8%) | 576 (45.2%) |
Employment Industries by Sex in Wayne County
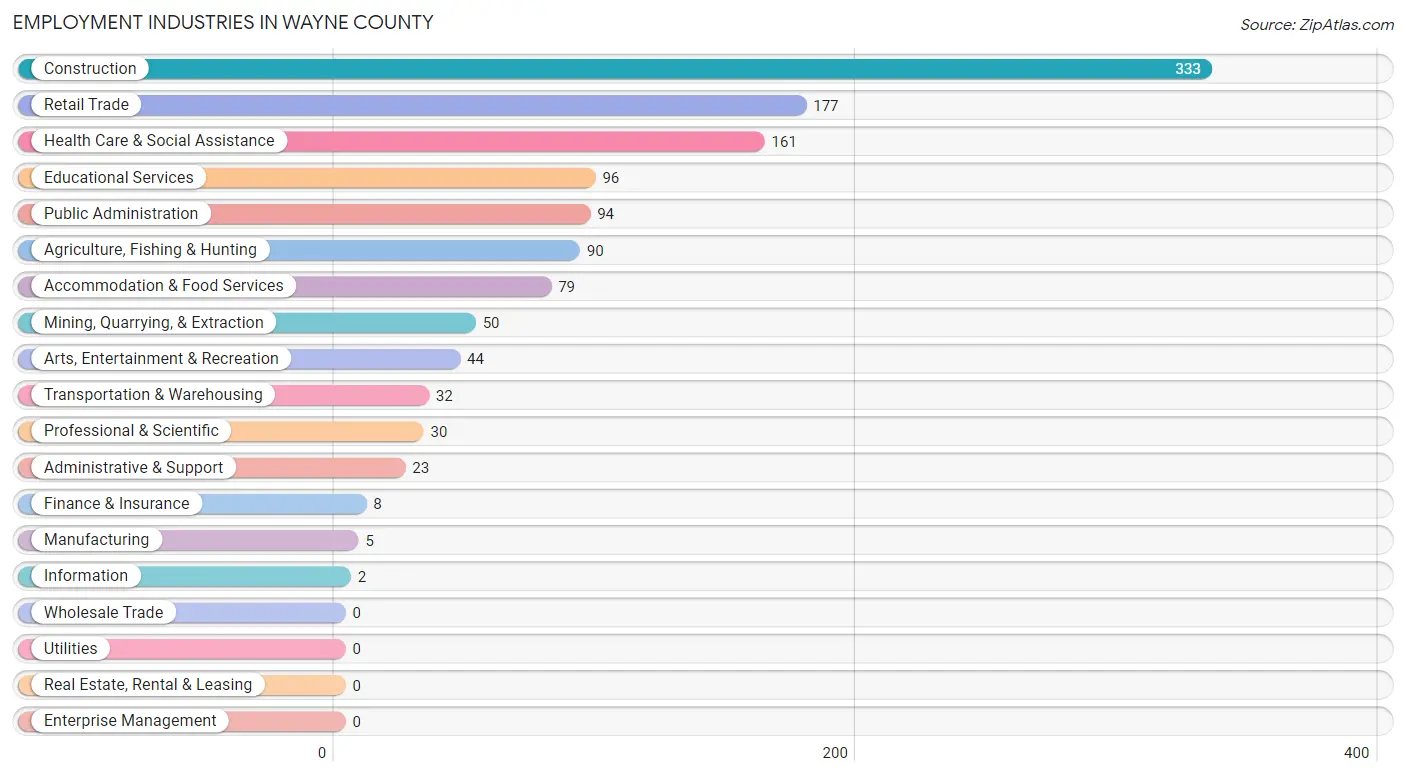
Employment Industries in Wayne County
The major employment industries in Wayne County include Construction (333 | 26.1%), Retail Trade (177 | 13.9%), Health Care & Social Assistance (161 | 12.6%), Educational Services (96 | 7.5%), and Public Administration (94 | 7.4%).
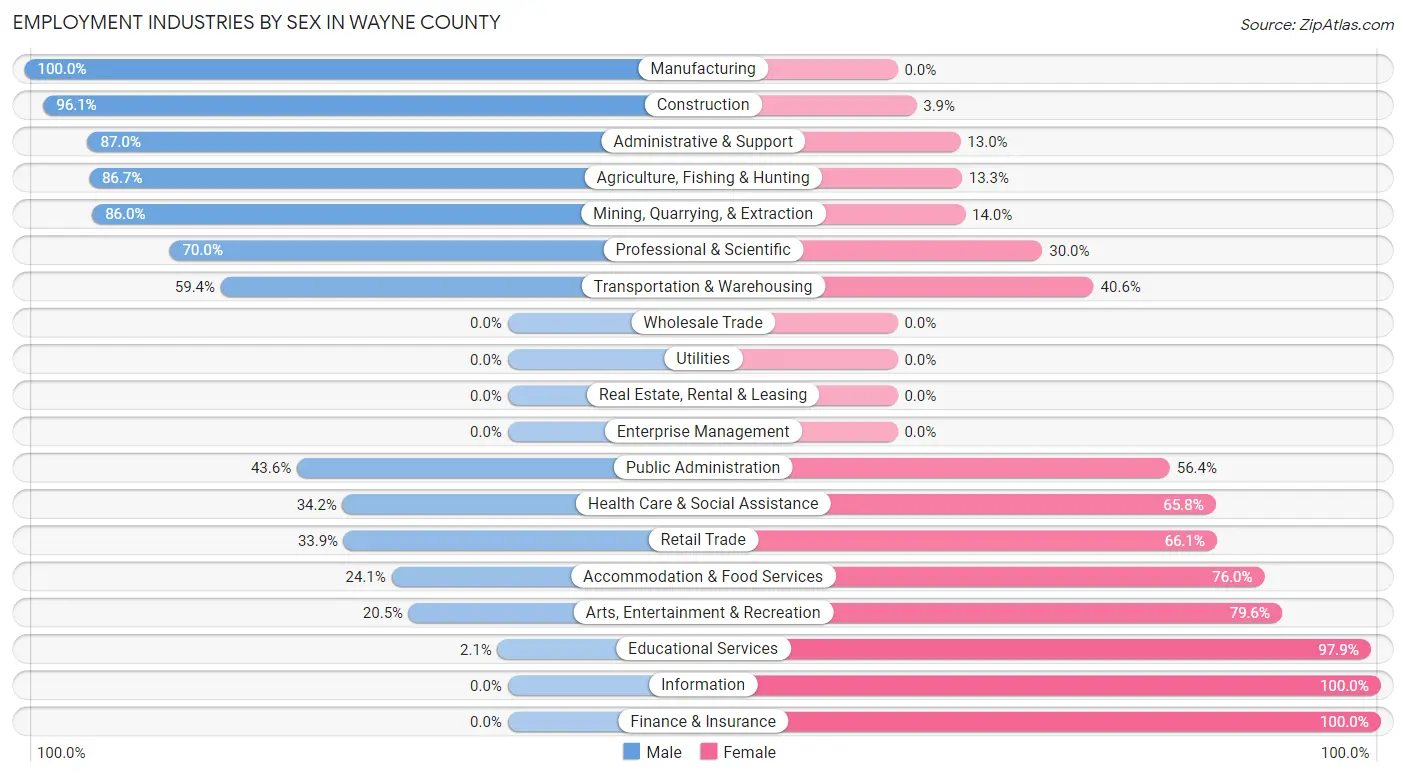
Employment Industries by Sex in Wayne County
The Wayne County industries that see more men than women are Manufacturing (100.0%), Construction (96.1%), and Administrative & Support (87.0%), whereas the industries that tend to have a higher number of women are Information (100.0%), Finance & Insurance (100.0%), and Educational Services (97.9%).
| Industry | Male | Female |
| Agriculture, Fishing & Hunting | 78 (86.7%) | 12 (13.3%) |
| Mining, Quarrying, & Extraction | 43 (86.0%) | 7 (14.0%) |
| Construction | 320 (96.1%) | 13 (3.9%) |
| Manufacturing | 5 (100.0%) | 0 (0.0%) |
| Wholesale Trade | 0 (0.0%) | 0 (0.0%) |
| Retail Trade | 60 (33.9%) | 117 (66.1%) |
| Transportation & Warehousing | 19 (59.4%) | 13 (40.6%) |
| Utilities | 0 (0.0%) | 0 (0.0%) |
| Information | 0 (0.0%) | 2 (100.0%) |
| Finance & Insurance | 0 (0.0%) | 8 (100.0%) |
| Real Estate, Rental & Leasing | 0 (0.0%) | 0 (0.0%) |
| Professional & Scientific | 21 (70.0%) | 9 (30.0%) |
| Enterprise Management | 0 (0.0%) | 0 (0.0%) |
| Administrative & Support | 20 (87.0%) | 3 (13.0%) |
| Educational Services | 2 (2.1%) | 94 (97.9%) |
| Health Care & Social Assistance | 55 (34.2%) | 106 (65.8%) |
| Arts, Entertainment & Recreation | 9 (20.4%) | 35 (79.5%) |
| Accommodation & Food Services | 19 (24.0%) | 60 (75.9%) |
| Public Administration | 41 (43.6%) | 53 (56.4%) |
| Total | 698 (54.8%) | 576 (45.2%) |
Education in Wayne County
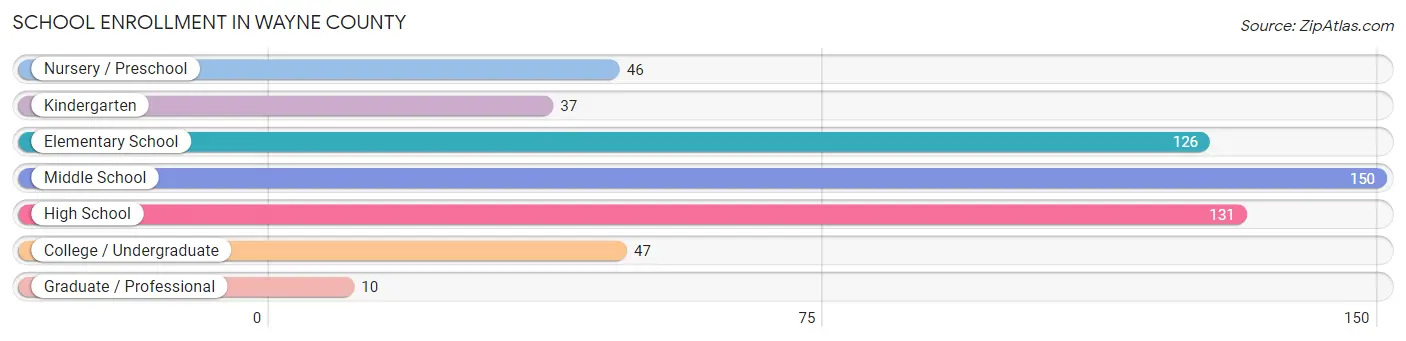
School Enrollment in Wayne County
The most common levels of schooling among the 547 students in Wayne County are middle school (150 | 27.4%), high school (131 | 23.9%), and elementary school (126 | 23.0%).
| School Level | # Students | % Students |
| Nursery / Preschool | 46 | 8.4% |
| Kindergarten | 37 | 6.8% |
| Elementary School | 126 | 23.0% |
| Middle School | 150 | 27.4% |
| High School | 131 | 23.9% |
| College / Undergraduate | 47 | 8.6% |
| Graduate / Professional | 10 | 1.8% |
| Total | 547 | 100.0% |
School Enrollment by Age by Funding Source in Wayne County
Out of a total of 547 students who are enrolled in schools in Wayne County, 15 (2.7%) attend a private institution, while the remaining 532 (97.3%) are enrolled in public schools. The age group of 35 years and over has the highest likelihood of being enrolled in private schools, with 4 (12.5% in the age bracket) enrolled. Conversely, the age group of 3 to 4 year olds has the lowest likelihood of being enrolled in a private school, with 41 (100.0% in the age bracket) attending a public institution.
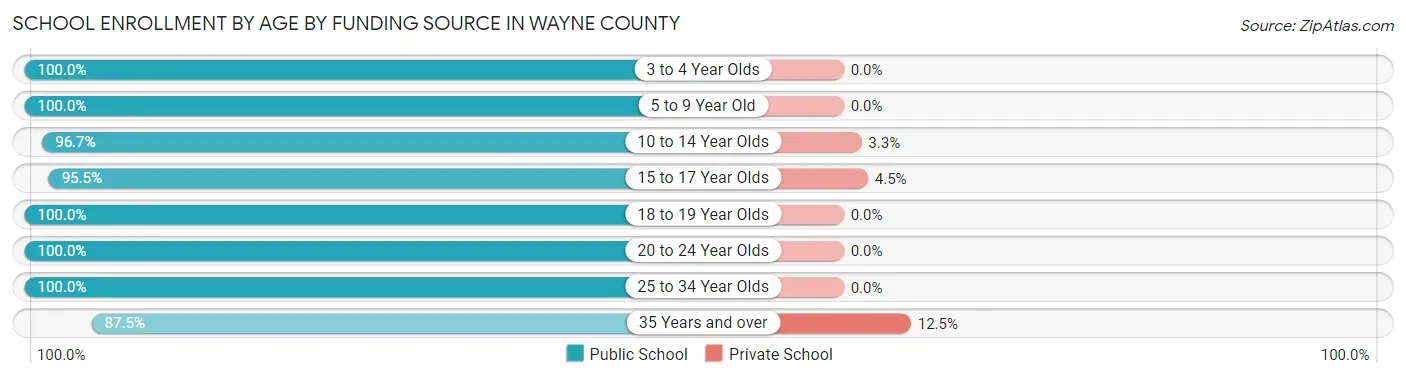
| Age Bracket | Public School | Private School |
| 3 to 4 Year Olds | 41 (100.0%) | 0 (0.0%) |
| 5 to 9 Year Old | 148 (100.0%) | 0 (0.0%) |
| 10 to 14 Year Olds | 176 (96.7%) | 6 (3.3%) |
| 15 to 17 Year Olds | 106 (95.5%) | 5 (4.5%) |
| 18 to 19 Year Olds | 19 (100.0%) | 0 (0.0%) |
| 20 to 24 Year Olds | 8 (100.0%) | 0 (0.0%) |
| 25 to 34 Year Olds | 6 (100.0%) | 0 (0.0%) |
| 35 Years and over | 28 (87.5%) | 4 (12.5%) |
| Total | 532 (97.3%) | 15 (2.7%) |
Educational Attainment by Field of Study in Wayne County
Bio, nature & agricultural (62 | 15.2%), science & technology (57 | 14.0%), education (57 | 14.0%), business (50 | 12.2%), and communications (47 | 11.5%) are the most common fields of study among 408 individuals in Wayne County who have obtained a bachelor's degree or higher.
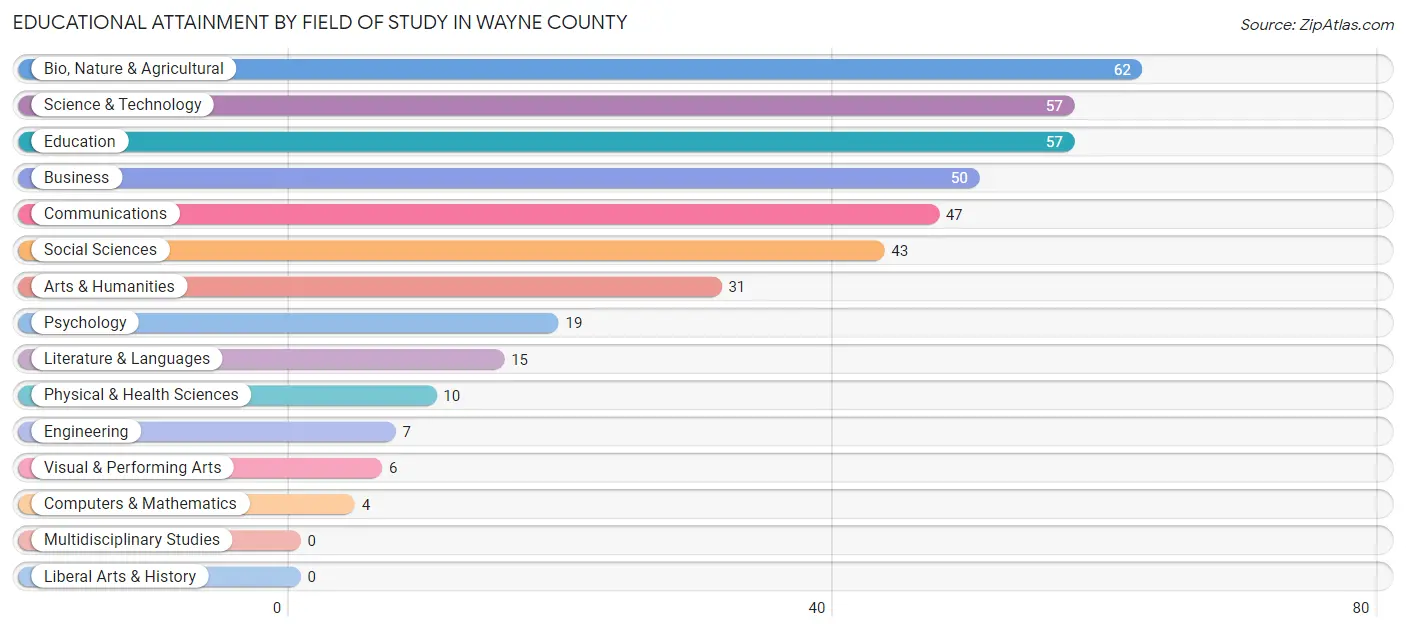
| Field of Study | # Graduates | % Graduates |
| Computers & Mathematics | 4 | 1.0% |
| Bio, Nature & Agricultural | 62 | 15.2% |
| Physical & Health Sciences | 10 | 2.5% |
| Psychology | 19 | 4.7% |
| Social Sciences | 43 | 10.5% |
| Engineering | 7 | 1.7% |
| Multidisciplinary Studies | 0 | 0.0% |
| Science & Technology | 57 | 14.0% |
| Business | 50 | 12.2% |
| Education | 57 | 14.0% |
| Literature & Languages | 15 | 3.7% |
| Liberal Arts & History | 0 | 0.0% |
| Visual & Performing Arts | 6 | 1.5% |
| Communications | 47 | 11.5% |
| Arts & Humanities | 31 | 7.6% |
| Total | 408 | 100.0% |
Transportation & Commute in Wayne County
Vehicle Availability by Sex in Wayne County
The most prevalent vehicle ownership categories in Wayne County are males with 2 vehicles (190, accounting for 27.5%) and females with 2 vehicles (212, making up 33.0%).
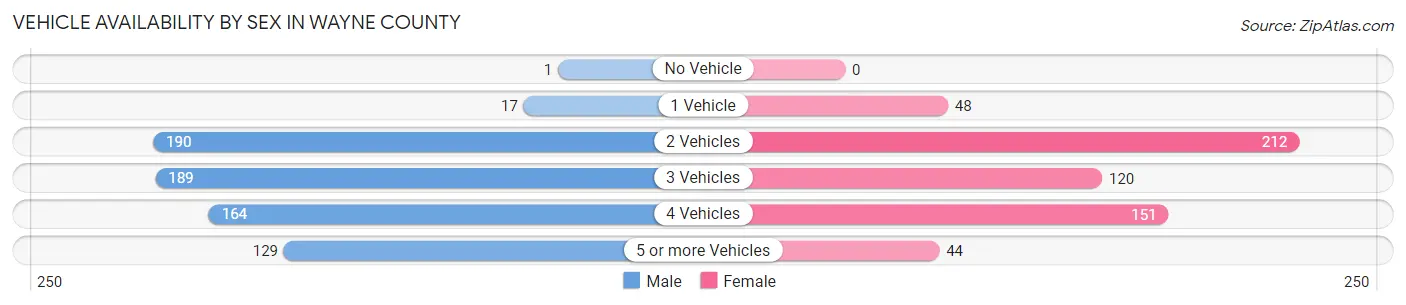
| Vehicles Available | Male | Female |
| No Vehicle | 1 (0.1%) | 0 (0.0%) |
| 1 Vehicle | 17 (2.5%) | 48 (8.4%) |
| 2 Vehicles | 190 (27.5%) | 212 (36.9%) |
| 3 Vehicles | 189 (27.4%) | 120 (20.9%) |
| 4 Vehicles | 164 (23.8%) | 151 (26.3%) |
| 5 or more Vehicles | 129 (18.7%) | 44 (7.6%) |
| Total | 690 (100.0%) | 575 (100.0%) |
Commute Time in Wayne County
The most frequently occuring commute durations in Wayne County are less than 5 minutes (264 commuters, 27.0%), 5 to 9 minutes (221 commuters, 22.6%), and 10 to 14 minutes (119 commuters, 12.2%).
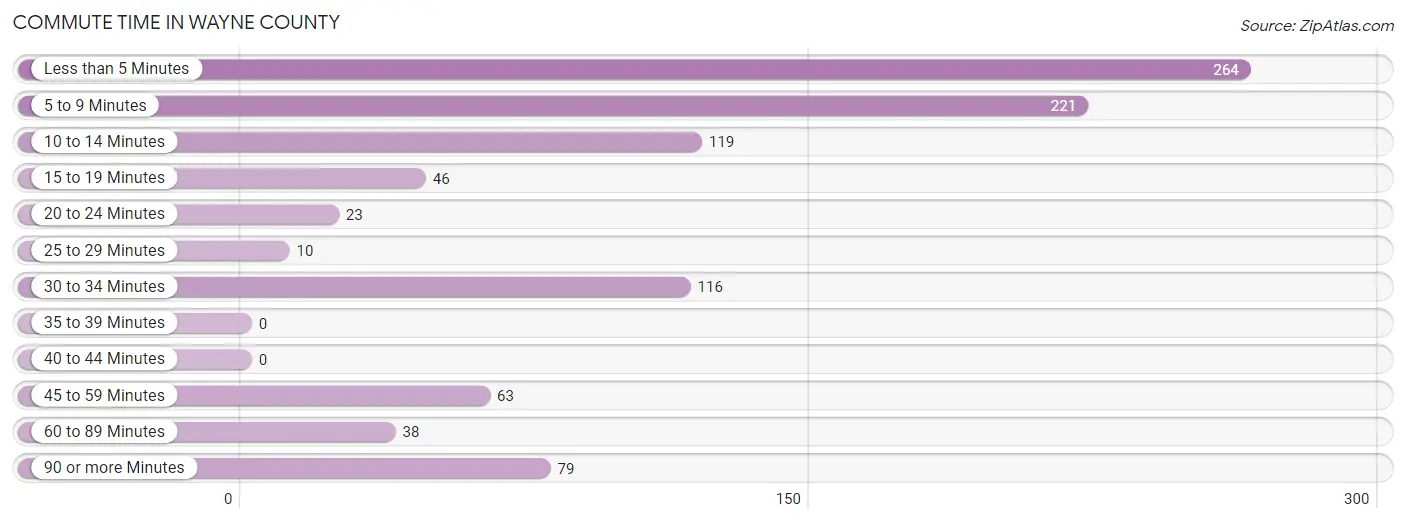
| Commute Time | # Commuters | % Commuters |
| Less than 5 Minutes | 264 | 27.0% |
| 5 to 9 Minutes | 221 | 22.6% |
| 10 to 14 Minutes | 119 | 12.2% |
| 15 to 19 Minutes | 46 | 4.7% |
| 20 to 24 Minutes | 23 | 2.4% |
| 25 to 29 Minutes | 10 | 1.0% |
| 30 to 34 Minutes | 116 | 11.8% |
| 35 to 39 Minutes | 0 | 0.0% |
| 40 to 44 Minutes | 0 | 0.0% |
| 45 to 59 Minutes | 63 | 6.4% |
| 60 to 89 Minutes | 38 | 3.9% |
| 90 or more Minutes | 79 | 8.1% |
Commute Time by Sex in Wayne County
The most common commute times in Wayne County are less than 5 minutes (151 commuters, 25.6%) for males and less than 5 minutes (113 commuters, 29.0%) for females.
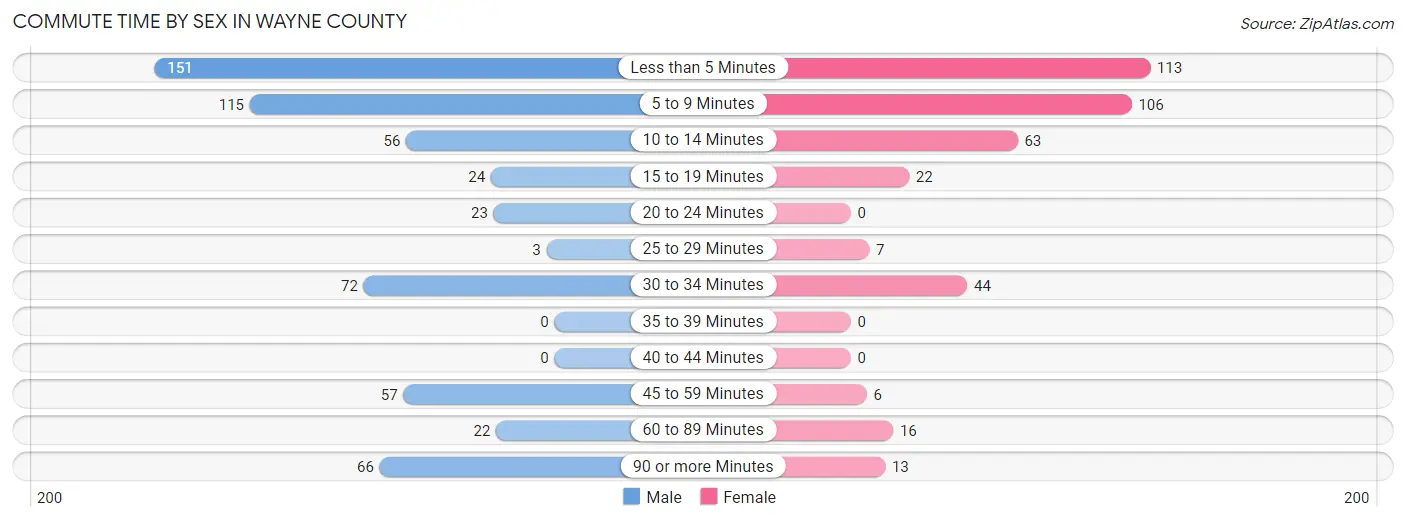
| Commute Time | Male | Female |
| Less than 5 Minutes | 151 (25.6%) | 113 (29.0%) |
| 5 to 9 Minutes | 115 (19.5%) | 106 (27.2%) |
| 10 to 14 Minutes | 56 (9.5%) | 63 (16.2%) |
| 15 to 19 Minutes | 24 (4.1%) | 22 (5.6%) |
| 20 to 24 Minutes | 23 (3.9%) | 0 (0.0%) |
| 25 to 29 Minutes | 3 (0.5%) | 7 (1.8%) |
| 30 to 34 Minutes | 72 (12.2%) | 44 (11.3%) |
| 35 to 39 Minutes | 0 (0.0%) | 0 (0.0%) |
| 40 to 44 Minutes | 0 (0.0%) | 0 (0.0%) |
| 45 to 59 Minutes | 57 (9.7%) | 6 (1.5%) |
| 60 to 89 Minutes | 22 (3.7%) | 16 (4.1%) |
| 90 or more Minutes | 66 (11.2%) | 13 (3.3%) |
Time of Departure to Work by Sex in Wayne County
The most frequent times of departure to work in Wayne County are 8:00 AM to 8:29 AM (117, 19.9%) for males and 7:00 AM to 7:29 AM (88, 22.6%) for females.
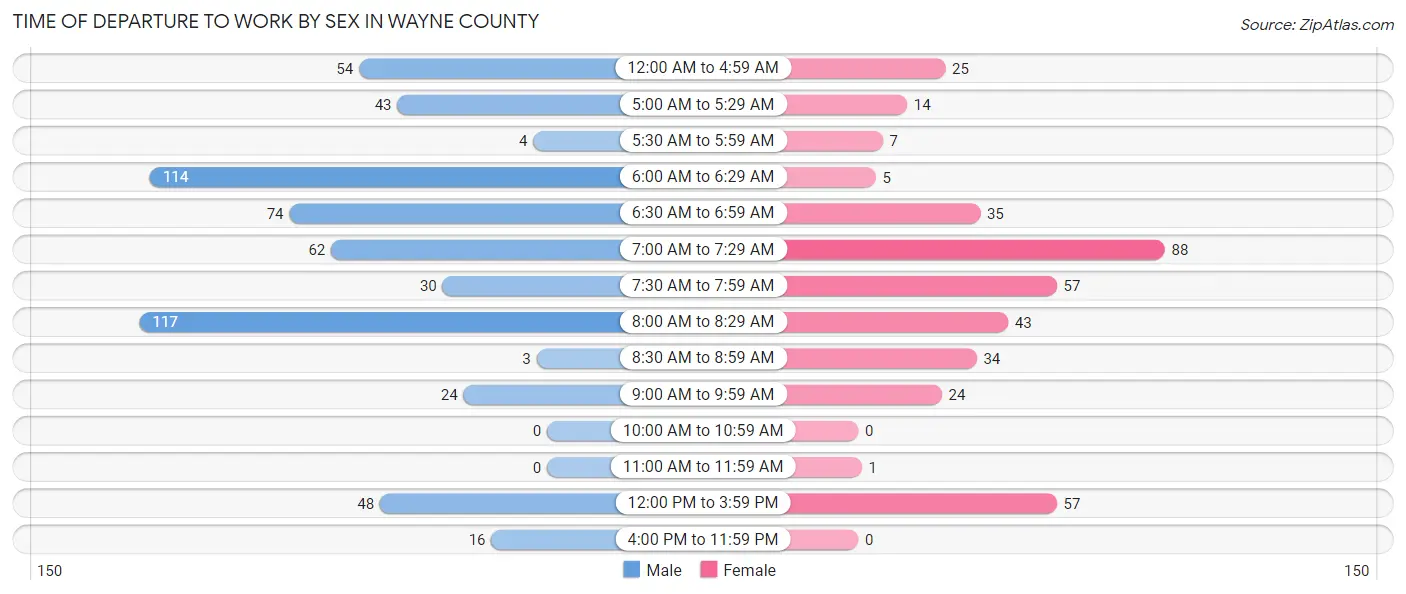
| Time of Departure | Male | Female |
| 12:00 AM to 4:59 AM | 54 (9.2%) | 25 (6.4%) |
| 5:00 AM to 5:29 AM | 43 (7.3%) | 14 (3.6%) |
| 5:30 AM to 5:59 AM | 4 (0.7%) | 7 (1.8%) |
| 6:00 AM to 6:29 AM | 114 (19.4%) | 5 (1.3%) |
| 6:30 AM to 6:59 AM | 74 (12.6%) | 35 (9.0%) |
| 7:00 AM to 7:29 AM | 62 (10.5%) | 88 (22.6%) |
| 7:30 AM to 7:59 AM | 30 (5.1%) | 57 (14.6%) |
| 8:00 AM to 8:29 AM | 117 (19.9%) | 43 (11.0%) |
| 8:30 AM to 8:59 AM | 3 (0.5%) | 34 (8.7%) |
| 9:00 AM to 9:59 AM | 24 (4.1%) | 24 (6.1%) |
| 10:00 AM to 10:59 AM | 0 (0.0%) | 0 (0.0%) |
| 11:00 AM to 11:59 AM | 0 (0.0%) | 1 (0.3%) |
| 12:00 PM to 3:59 PM | 48 (8.2%) | 57 (14.6%) |
| 4:00 PM to 11:59 PM | 16 (2.7%) | 0 (0.0%) |
| Total | 589 (100.0%) | 390 (100.0%) |
Housing Occupancy in Wayne County
Occupancy by Ownership in Wayne County
Of the total 1,051 dwellings in Wayne County, owner-occupied units account for 821 (78.1%), while renter-occupied units make up 230 (21.9%).
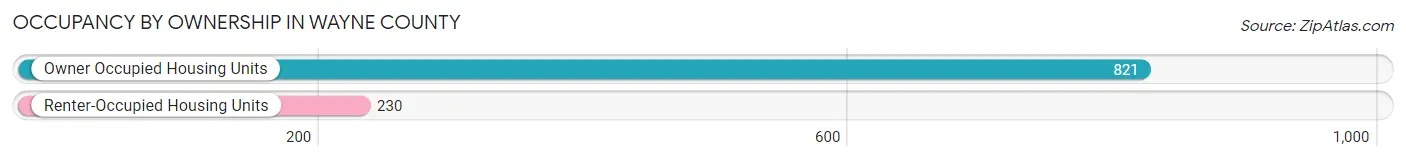
| Occupancy | # Housing Units | % Housing Units |
| Owner Occupied Housing Units | 821 | 78.1% |
| Renter-Occupied Housing Units | 230 | 21.9% |
| Total Occupied Housing Units | 1,051 | 100.0% |
Occupancy by Household Size in Wayne County
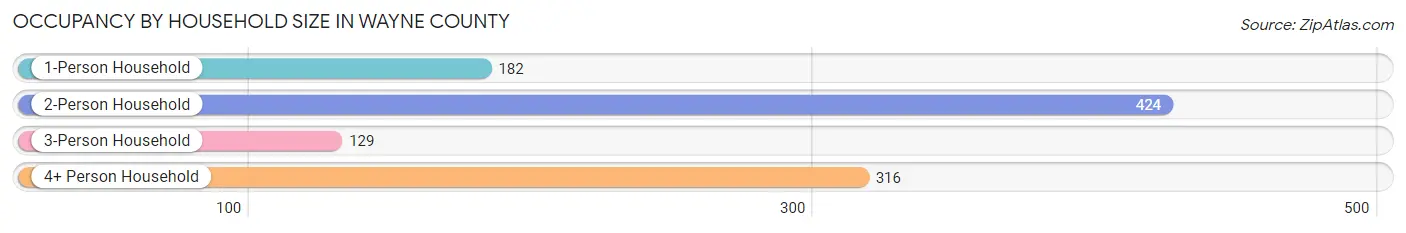
| Household Size | # Housing Units | % Housing Units |
| 1-Person Household | 182 | 17.3% |
| 2-Person Household | 424 | 40.3% |
| 3-Person Household | 129 | 12.3% |
| 4+ Person Household | 316 | 30.1% |
| Total Housing Units | 1,051 | 100.0% |
Occupancy by Ownership by Household Size in Wayne County
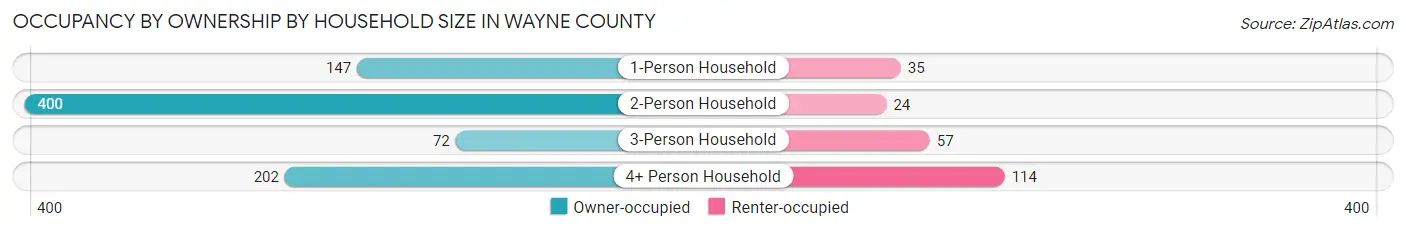
| Household Size | Owner-occupied | Renter-occupied |
| 1-Person Household | 147 (80.8%) | 35 (19.2%) |
| 2-Person Household | 400 (94.3%) | 24 (5.7%) |
| 3-Person Household | 72 (55.8%) | 57 (44.2%) |
| 4+ Person Household | 202 (63.9%) | 114 (36.1%) |
| Total Housing Units | 821 (78.1%) | 230 (21.9%) |
Occupancy by Educational Attainment in Wayne County
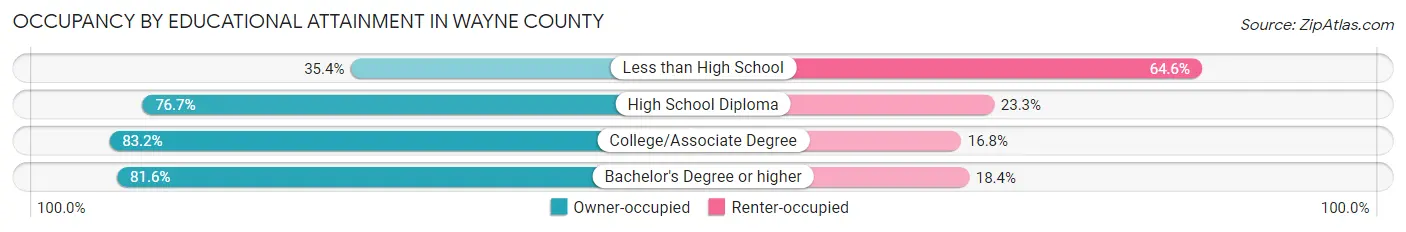
| Household Size | Owner-occupied | Renter-occupied |
| Less than High School | 28 (35.4%) | 51 (64.6%) |
| High School Diploma | 138 (76.7%) | 42 (23.3%) |
| College/Associate Degree | 446 (83.2%) | 90 (16.8%) |
| Bachelor's Degree or higher | 209 (81.6%) | 47 (18.4%) |
Occupancy by Age of Householder in Wayne County
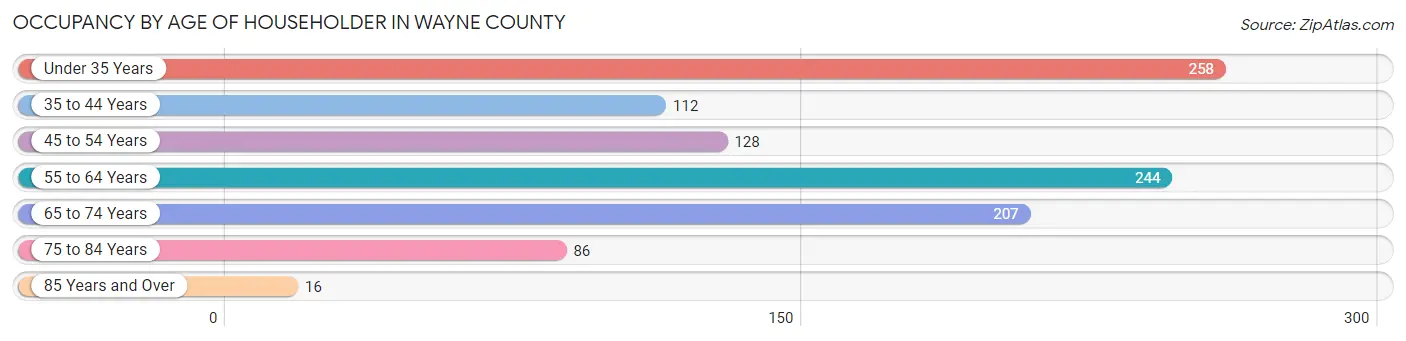
| Age Bracket | # Households | % Households |
| Under 35 Years | 258 | 24.5% |
| 35 to 44 Years | 112 | 10.7% |
| 45 to 54 Years | 128 | 12.2% |
| 55 to 64 Years | 244 | 23.2% |
| 65 to 74 Years | 207 | 19.7% |
| 75 to 84 Years | 86 | 8.2% |
| 85 Years and Over | 16 | 1.5% |
| Total | 1,051 | 100.0% |
Housing Finances in Wayne County
Median Income by Occupancy in Wayne County
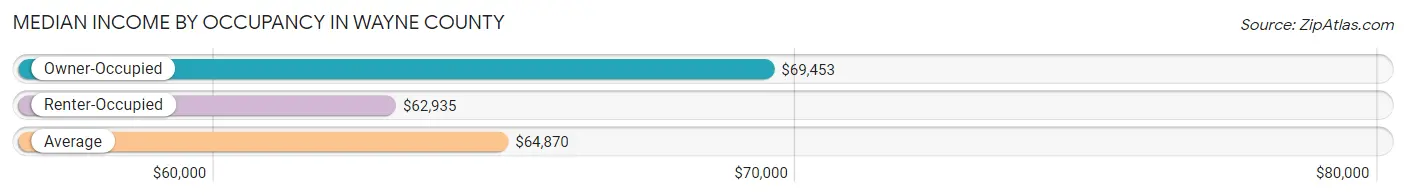
| Occupancy Type | # Households | Median Income |
| Owner-Occupied | 821 (78.1%) | $69,453 |
| Renter-Occupied | 230 (21.9%) | $62,935 |
| Average | 1,051 (100.0%) | $64,870 |
Occupancy by Householder Income Bracket in Wayne County
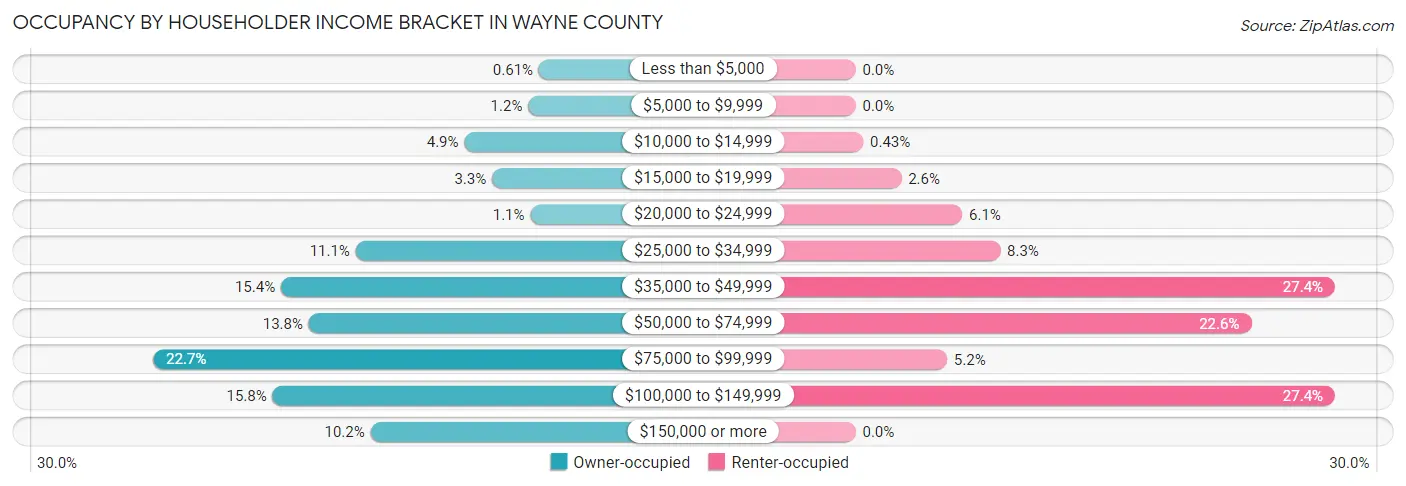
| Income Bracket | Owner-occupied | Renter-occupied |
| Less than $5,000 | 5 (0.6%) | 0 (0.0%) |
| $5,000 to $9,999 | 10 (1.2%) | 0 (0.0%) |
| $10,000 to $14,999 | 40 (4.9%) | 1 (0.4%) |
| $15,000 to $19,999 | 27 (3.3%) | 6 (2.6%) |
| $20,000 to $24,999 | 9 (1.1%) | 14 (6.1%) |
| $25,000 to $34,999 | 91 (11.1%) | 19 (8.3%) |
| $35,000 to $49,999 | 126 (15.3%) | 63 (27.4%) |
| $50,000 to $74,999 | 113 (13.8%) | 52 (22.6%) |
| $75,000 to $99,999 | 186 (22.7%) | 12 (5.2%) |
| $100,000 to $149,999 | 130 (15.8%) | 63 (27.4%) |
| $150,000 or more | 84 (10.2%) | 0 (0.0%) |
| Total | 821 (100.0%) | 230 (100.0%) |
Monthly Housing Cost Tiers in Wayne County
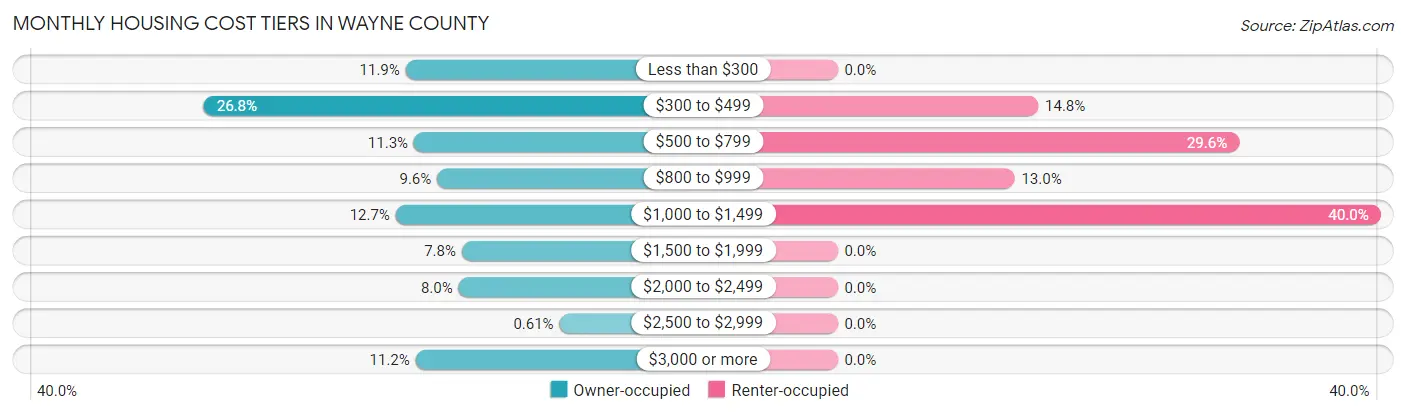
| Monthly Cost | Owner-occupied | Renter-occupied |
| Less than $300 | 98 (11.9%) | 0 (0.0%) |
| $300 to $499 | 220 (26.8%) | 34 (14.8%) |
| $500 to $799 | 93 (11.3%) | 68 (29.6%) |
| $800 to $999 | 79 (9.6%) | 30 (13.0%) |
| $1,000 to $1,499 | 104 (12.7%) | 92 (40.0%) |
| $1,500 to $1,999 | 64 (7.8%) | 0 (0.0%) |
| $2,000 to $2,499 | 66 (8.0%) | 0 (0.0%) |
| $2,500 to $2,999 | 5 (0.6%) | 0 (0.0%) |
| $3,000 or more | 92 (11.2%) | 0 (0.0%) |
| Total | 821 (100.0%) | 230 (100.0%) |
Physical Housing Characteristics in Wayne County
Housing Structures in Wayne County
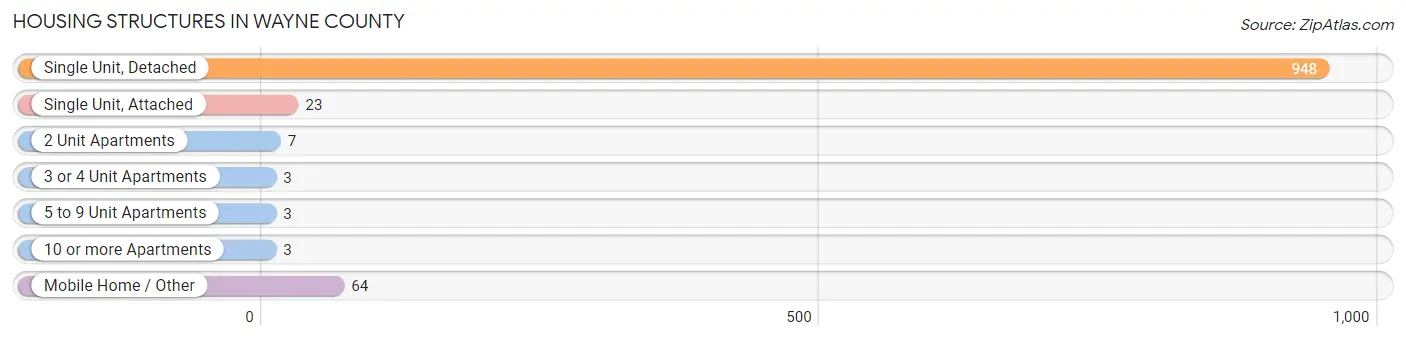
| Structure Type | # Housing Units | % Housing Units |
| Single Unit, Detached | 948 | 90.2% |
| Single Unit, Attached | 23 | 2.2% |
| 2 Unit Apartments | 7 | 0.7% |
| 3 or 4 Unit Apartments | 3 | 0.3% |
| 5 to 9 Unit Apartments | 3 | 0.3% |
| 10 or more Apartments | 3 | 0.3% |
| Mobile Home / Other | 64 | 6.1% |
| Total | 1,051 | 100.0% |
Housing Structures by Occupancy in Wayne County
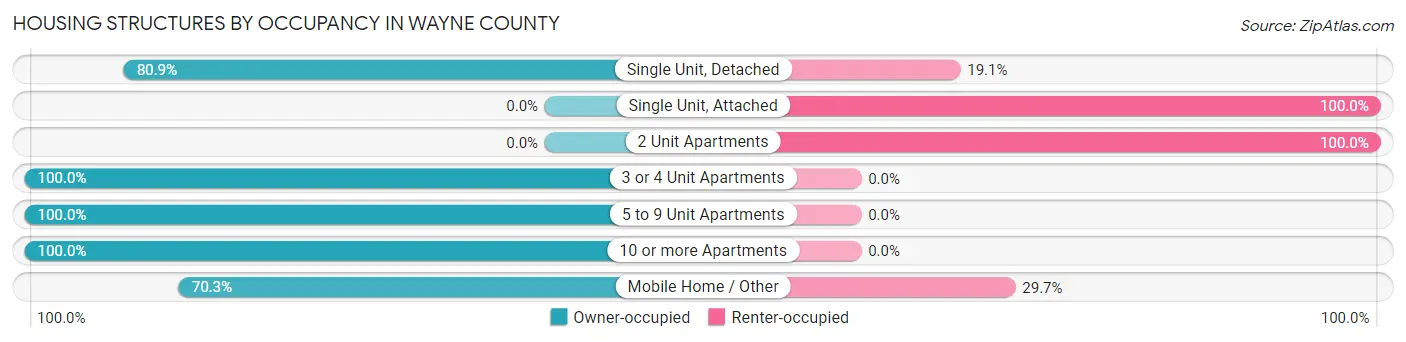
| Structure Type | Owner-occupied | Renter-occupied |
| Single Unit, Detached | 767 (80.9%) | 181 (19.1%) |
| Single Unit, Attached | 0 (0.0%) | 23 (100.0%) |
| 2 Unit Apartments | 0 (0.0%) | 7 (100.0%) |
| 3 or 4 Unit Apartments | 3 (100.0%) | 0 (0.0%) |
| 5 to 9 Unit Apartments | 3 (100.0%) | 0 (0.0%) |
| 10 or more Apartments | 3 (100.0%) | 0 (0.0%) |
| Mobile Home / Other | 45 (70.3%) | 19 (29.7%) |
| Total | 821 (78.1%) | 230 (21.9%) |
Housing Structures by Number of Rooms in Wayne County
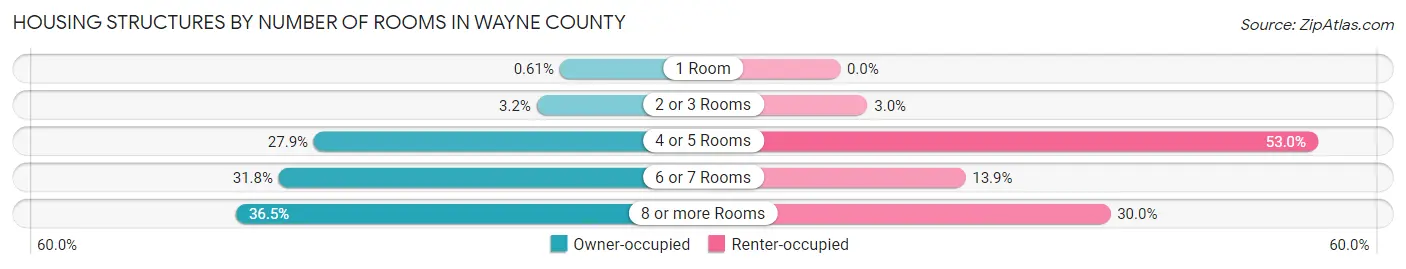
| Number of Rooms | Owner-occupied | Renter-occupied |
| 1 Room | 5 (0.6%) | 0 (0.0%) |
| 2 or 3 Rooms | 26 (3.2%) | 7 (3.0%) |
| 4 or 5 Rooms | 229 (27.9%) | 122 (53.0%) |
| 6 or 7 Rooms | 261 (31.8%) | 32 (13.9%) |
| 8 or more Rooms | 300 (36.5%) | 69 (30.0%) |
| Total | 821 (100.0%) | 230 (100.0%) |
Housing Structure by Heating Type in Wayne County
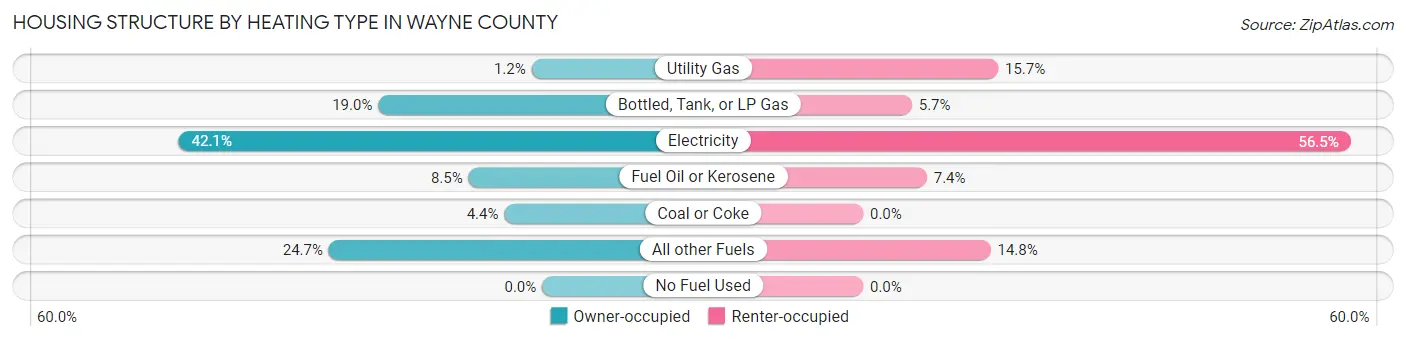
| Heating Type | Owner-occupied | Renter-occupied |
| Utility Gas | 10 (1.2%) | 36 (15.7%) |
| Bottled, Tank, or LP Gas | 156 (19.0%) | 13 (5.7%) |
| Electricity | 346 (42.1%) | 130 (56.5%) |
| Fuel Oil or Kerosene | 70 (8.5%) | 17 (7.4%) |
| Coal or Coke | 36 (4.4%) | 0 (0.0%) |
| All other Fuels | 203 (24.7%) | 34 (14.8%) |
| No Fuel Used | 0 (0.0%) | 0 (0.0%) |
| Total | 821 (100.0%) | 230 (100.0%) |
Household Vehicle Usage in Wayne County
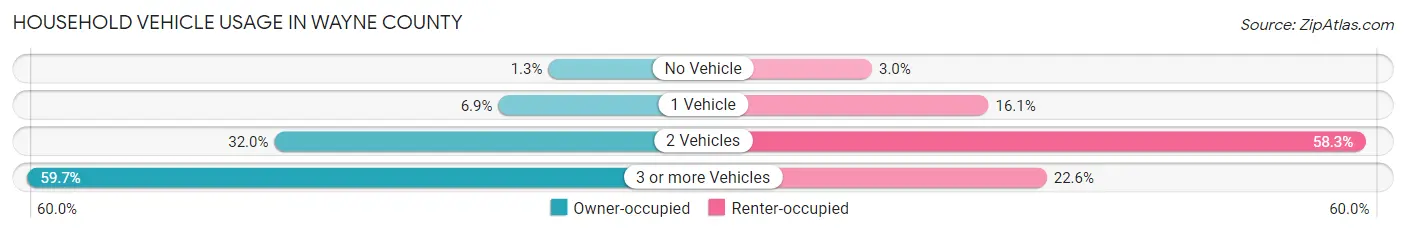
| Vehicles per Household | Owner-occupied | Renter-occupied |
| No Vehicle | 11 (1.3%) | 7 (3.0%) |
| 1 Vehicle | 57 (6.9%) | 37 (16.1%) |
| 2 Vehicles | 263 (32.0%) | 134 (58.3%) |
| 3 or more Vehicles | 490 (59.7%) | 52 (22.6%) |
| Total | 821 (100.0%) | 230 (100.0%) |
Real Estate & Mortgages in Wayne County
Real Estate and Mortgage Overview in Wayne County
| Characteristic | Without Mortgage | With Mortgage |
| Housing Units | 370 | 451 |
| Median Property Value | $273,100 | $342,800 |
| Median Household Income | $52,742 | $62 |
| Monthly Housing Costs | $366 | $92 |
| Real Estate Taxes | $1,023 | $0 |
Property Value by Mortgage Status in Wayne County
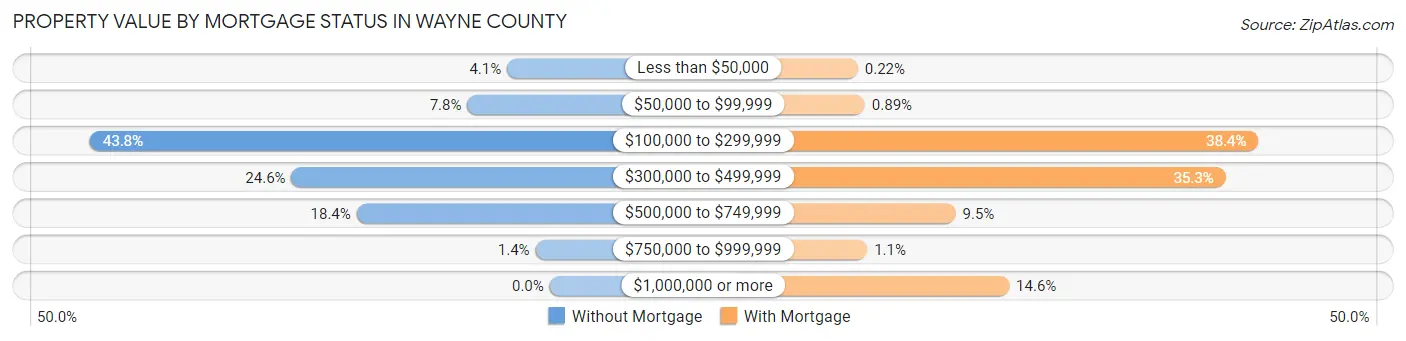
| Property Value | Without Mortgage | With Mortgage |
| Less than $50,000 | 15 (4.1%) | 1 (0.2%) |
| $50,000 to $99,999 | 29 (7.8%) | 4 (0.9%) |
| $100,000 to $299,999 | 162 (43.8%) | 173 (38.4%) |
| $300,000 to $499,999 | 91 (24.6%) | 159 (35.2%) |
| $500,000 to $749,999 | 68 (18.4%) | 43 (9.5%) |
| $750,000 to $999,999 | 5 (1.3%) | 5 (1.1%) |
| $1,000,000 or more | 0 (0.0%) | 66 (14.6%) |
| Total | 370 (100.0%) | 451 (100.0%) |
Household Income by Mortgage Status in Wayne County
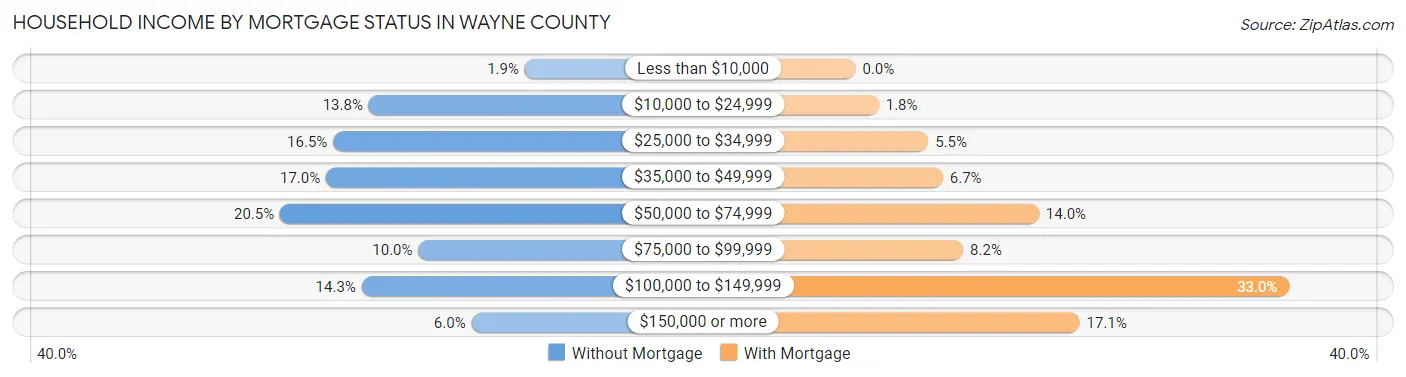
| Household Income | Without Mortgage | With Mortgage |
| Less than $10,000 | 7 (1.9%) | 0 (0.0%) |
| $10,000 to $24,999 | 51 (13.8%) | 8 (1.8%) |
| $25,000 to $34,999 | 61 (16.5%) | 25 (5.5%) |
| $35,000 to $49,999 | 63 (17.0%) | 30 (6.7%) |
| $50,000 to $74,999 | 76 (20.5%) | 63 (14.0%) |
| $75,000 to $99,999 | 37 (10.0%) | 37 (8.2%) |
| $100,000 to $149,999 | 53 (14.3%) | 149 (33.0%) |
| $150,000 or more | 22 (5.9%) | 77 (17.1%) |
| Total | 370 (100.0%) | 451 (100.0%) |
Property Value to Household Income Ratio in Wayne County
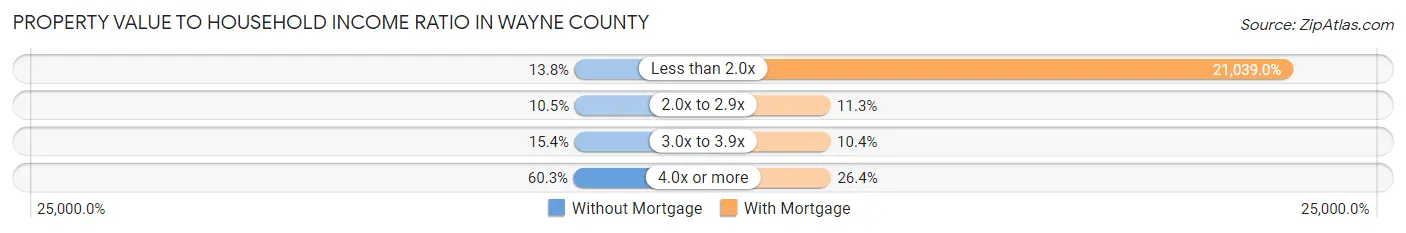
| Value-to-Income Ratio | Without Mortgage | With Mortgage |
| Less than 2.0x | 51 (13.8%) | 94,886 (21,039.0%) |
| 2.0x to 2.9x | 39 (10.5%) | 51 (11.3%) |
| 3.0x to 3.9x | 57 (15.4%) | 47 (10.4%) |
| 4.0x or more | 223 (60.3%) | 119 (26.4%) |
| Total | 370 (100.0%) | 451 (100.0%) |
Real Estate Taxes by Mortgage Status in Wayne County
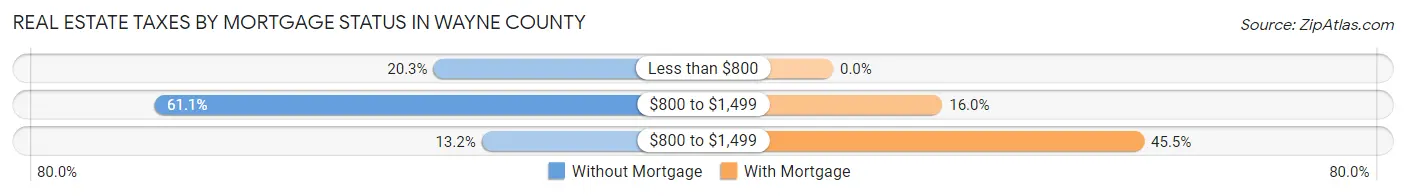
| Property Taxes | Without Mortgage | With Mortgage |
| Less than $800 | 75 (20.3%) | 0 (0.0%) |
| $800 to $1,499 | 226 (61.1%) | 72 (16.0%) |
| $800 to $1,499 | 49 (13.2%) | 205 (45.5%) |
| Total | 370 (100.0%) | 451 (100.0%) |
Health & Disability in Wayne County
Health Insurance Coverage by Age in Wayne County
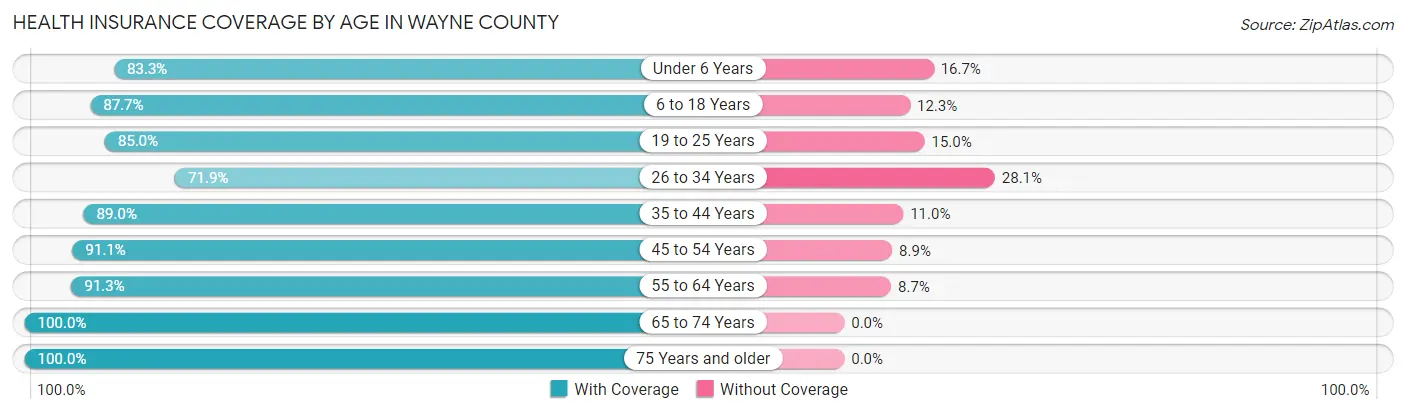
| Age Bracket | With Coverage | Without Coverage |
| Under 6 Years | 160 (83.3%) | 32 (16.7%) |
| 6 to 18 Years | 365 (87.7%) | 51 (12.3%) |
| 19 to 25 Years | 142 (85.0%) | 25 (15.0%) |
| 26 to 34 Years | 187 (71.9%) | 73 (28.1%) |
| 35 to 44 Years | 251 (89.0%) | 31 (11.0%) |
| 45 to 54 Years | 245 (91.1%) | 24 (8.9%) |
| 55 to 64 Years | 335 (91.3%) | 32 (8.7%) |
| 65 to 74 Years | 364 (100.0%) | 0 (0.0%) |
| 75 Years and older | 188 (100.0%) | 0 (0.0%) |
| Total | 2,237 (89.3%) | 268 (10.7%) |
Health Insurance Coverage by Citizenship Status in Wayne County
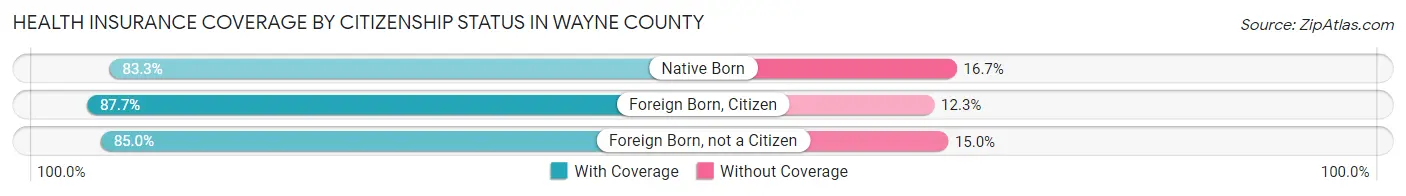
| Citizenship Status | With Coverage | Without Coverage |
| Native Born | 160 (83.3%) | 32 (16.7%) |
| Foreign Born, Citizen | 365 (87.7%) | 51 (12.3%) |
| Foreign Born, not a Citizen | 142 (85.0%) | 25 (15.0%) |
Health Insurance Coverage by Household Income in Wayne County
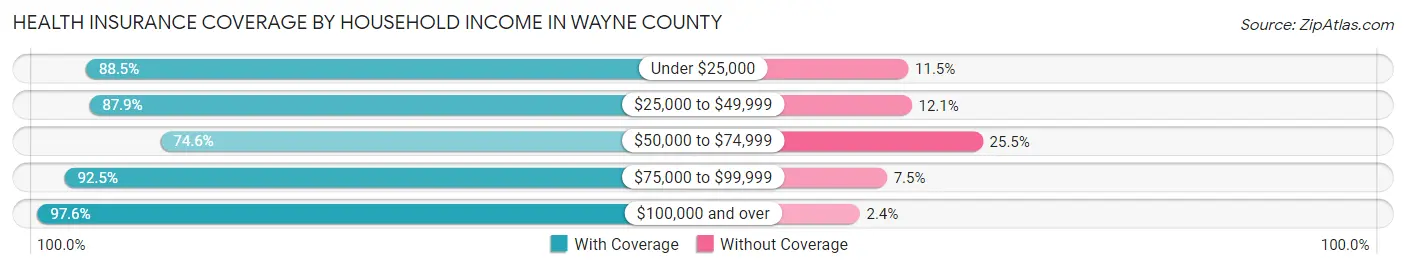
| Household Income | With Coverage | Without Coverage |
| Under $25,000 | 131 (88.5%) | 17 (11.5%) |
| $25,000 to $49,999 | 536 (87.9%) | 74 (12.1%) |
| $50,000 to $74,999 | 331 (74.6%) | 113 (25.5%) |
| $75,000 to $99,999 | 495 (92.5%) | 40 (7.5%) |
| $100,000 and over | 734 (97.6%) | 18 (2.4%) |
Public vs Private Health Insurance Coverage by Age in Wayne County
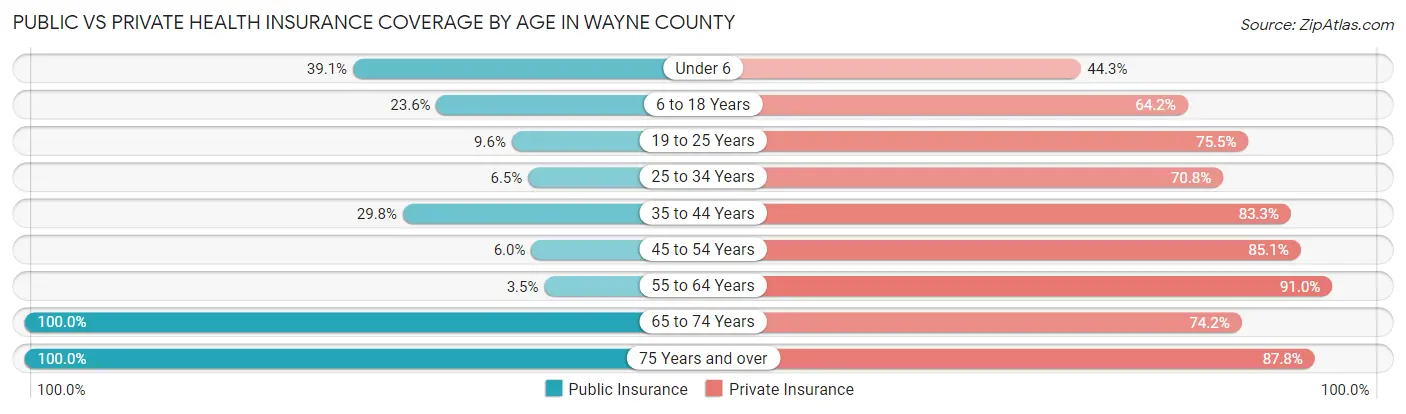
| Age Bracket | Public Insurance | Private Insurance |
| Under 6 | 75 (39.1%) | 85 (44.3%) |
| 6 to 18 Years | 98 (23.6%) | 267 (64.2%) |
| 19 to 25 Years | 16 (9.6%) | 126 (75.4%) |
| 25 to 34 Years | 17 (6.5%) | 184 (70.8%) |
| 35 to 44 Years | 84 (29.8%) | 235 (83.3%) |
| 45 to 54 Years | 16 (5.9%) | 229 (85.1%) |
| 55 to 64 Years | 13 (3.5%) | 334 (91.0%) |
| 65 to 74 Years | 364 (100.0%) | 270 (74.2%) |
| 75 Years and over | 188 (100.0%) | 165 (87.8%) |
| Total | 871 (34.8%) | 1,895 (75.6%) |
Disability Status by Sex by Age in Wayne County
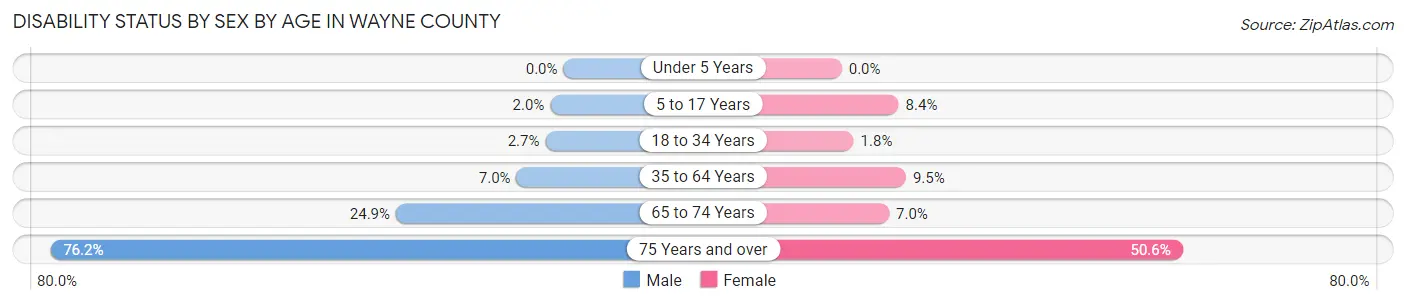
| Age Bracket | Male | Female |
| Under 5 Years | 0 (0.0%) | 0 (0.0%) |
| 5 to 17 Years | 4 (1.9%) | 19 (8.4%) |
| 18 to 34 Years | 6 (2.7%) | 4 (1.8%) |
| 35 to 64 Years | 34 (7.0%) | 41 (9.5%) |
| 65 to 74 Years | 48 (24.9%) | 12 (7.0%) |
| 75 Years and over | 80 (76.2%) | 42 (50.6%) |
Disability Class by Sex by Age in Wayne County
Disability Class: Hearing Difficulty
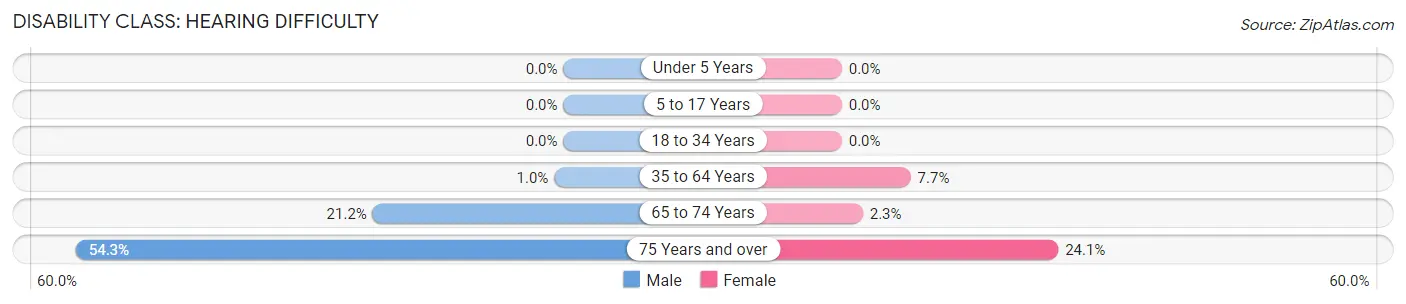
| Age Bracket | Male | Female |
| Under 5 Years | 0 (0.0%) | 0 (0.0%) |
| 5 to 17 Years | 0 (0.0%) | 0 (0.0%) |
| 18 to 34 Years | 0 (0.0%) | 0 (0.0%) |
| 35 to 64 Years | 5 (1.0%) | 33 (7.7%) |
| 65 to 74 Years | 41 (21.2%) | 4 (2.3%) |
| 75 Years and over | 57 (54.3%) | 20 (24.1%) |
Disability Class: Vision Difficulty
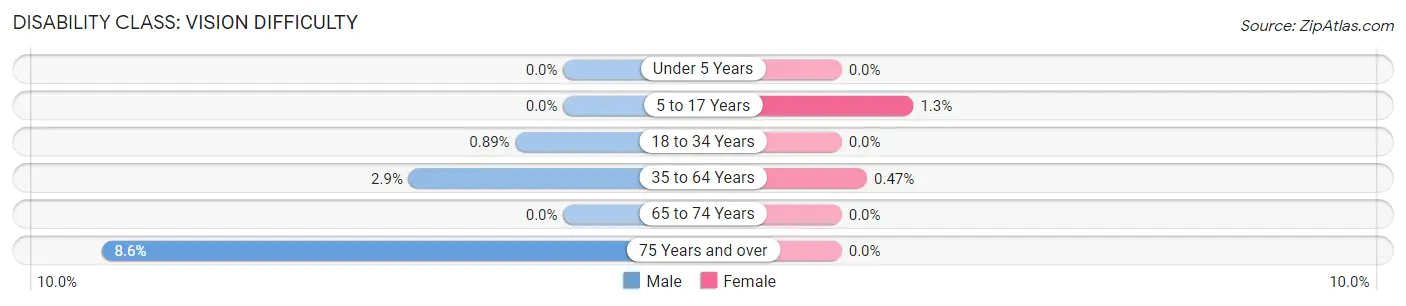
| Age Bracket | Male | Female |
| Under 5 Years | 0 (0.0%) | 0 (0.0%) |
| 5 to 17 Years | 0 (0.0%) | 3 (1.3%) |
| 18 to 34 Years | 2 (0.9%) | 0 (0.0%) |
| 35 to 64 Years | 14 (2.9%) | 2 (0.5%) |
| 65 to 74 Years | 0 (0.0%) | 0 (0.0%) |
| 75 Years and over | 9 (8.6%) | 0 (0.0%) |
Disability Class: Cognitive Difficulty
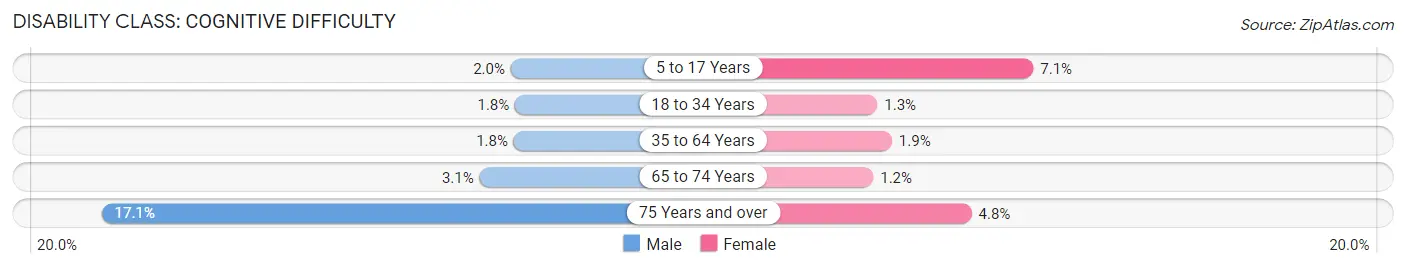
| Age Bracket | Male | Female |
| 5 to 17 Years | 4 (1.9%) | 16 (7.1%) |
| 18 to 34 Years | 4 (1.8%) | 3 (1.3%) |
| 35 to 64 Years | 9 (1.8%) | 8 (1.9%) |
| 65 to 74 Years | 6 (3.1%) | 2 (1.2%) |
| 75 Years and over | 18 (17.1%) | 4 (4.8%) |
Disability Class: Ambulatory Difficulty
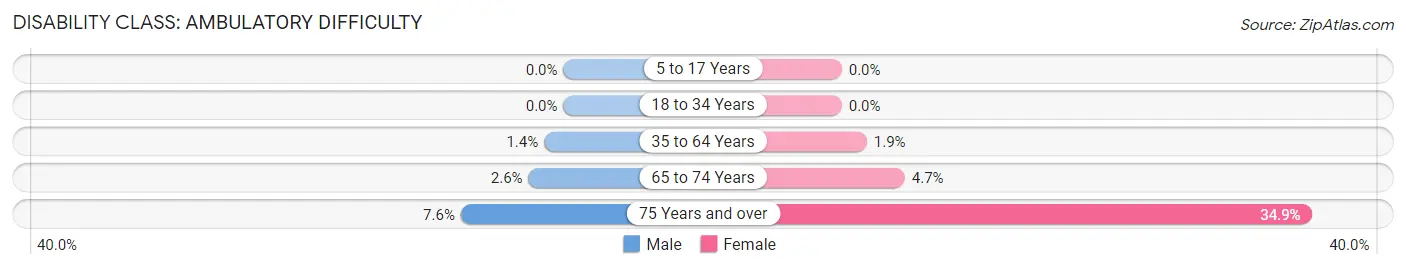
| Age Bracket | Male | Female |
| 5 to 17 Years | 0 (0.0%) | 0 (0.0%) |
| 18 to 34 Years | 0 (0.0%) | 0 (0.0%) |
| 35 to 64 Years | 7 (1.4%) | 8 (1.9%) |
| 65 to 74 Years | 5 (2.6%) | 8 (4.7%) |
| 75 Years and over | 8 (7.6%) | 29 (34.9%) |
Disability Class: Self-Care Difficulty
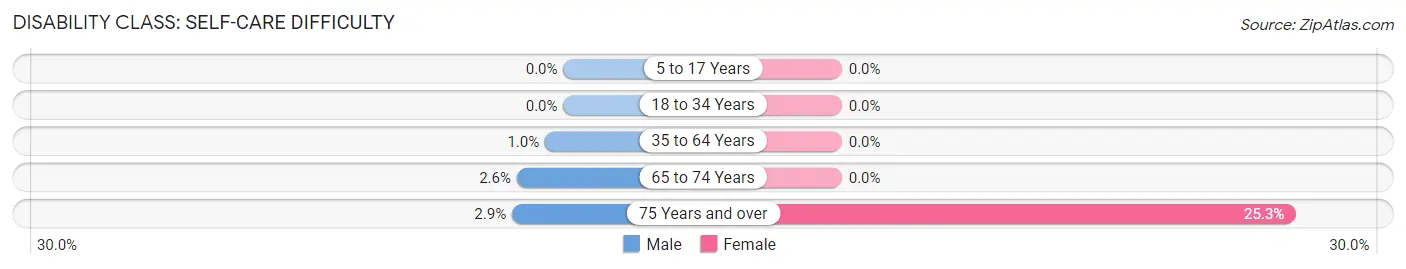
| Age Bracket | Male | Female |
| 5 to 17 Years | 0 (0.0%) | 0 (0.0%) |
| 18 to 34 Years | 0 (0.0%) | 0 (0.0%) |
| 35 to 64 Years | 5 (1.0%) | 0 (0.0%) |
| 65 to 74 Years | 5 (2.6%) | 0 (0.0%) |
| 75 Years and over | 3 (2.9%) | 21 (25.3%) |
Technology Access in Wayne County
Computing Device Access in Wayne County
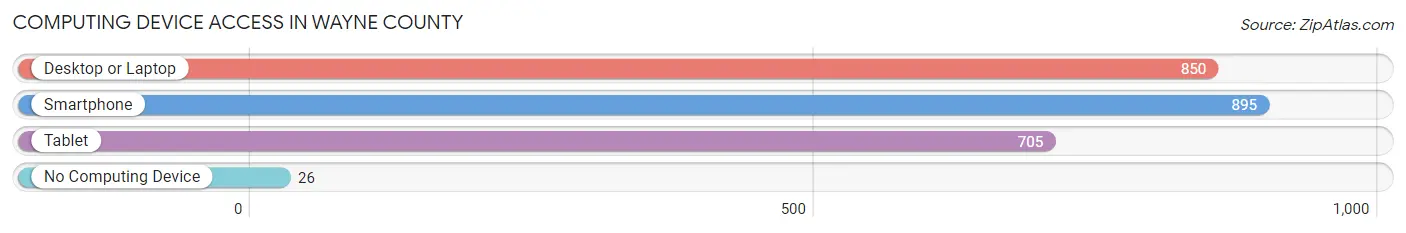
| Device Type | # Households | % Households |
| Desktop or Laptop | 850 | 80.9% |
| Smartphone | 895 | 85.2% |
| Tablet | 705 | 67.1% |
| No Computing Device | 26 | 2.5% |
| Total | 1,051 | 100.0% |
Internet Access in Wayne County
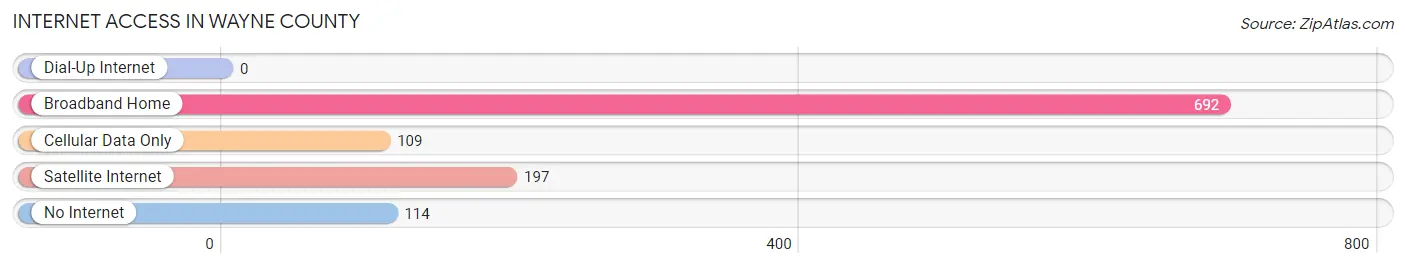
| Internet Type | # Households | % Households |
| Dial-Up Internet | 0 | 0.0% |
| Broadband Home | 692 | 65.8% |
| Cellular Data Only | 109 | 10.4% |
| Satellite Internet | 197 | 18.7% |
| No Internet | 114 | 10.8% |
| Total | 1,051 | 100.0% |
Wayne County Summary
Wayne County is located in the southeastern corner of Utah, and is bordered by Garfield County to the north, Emery County to the east, and San Juan County to the south and west. The county seat is Loa, and the largest city is Hanksville. The county was named after General Anthony Wayne, a Revolutionary War hero.
Geography
Wayne County covers an area of 4,890 square miles, making it the fourth largest county in Utah. The county is mostly mountainous, with the Henry Mountains to the north, the San Rafael Swell to the east, and the Circle Cliffs to the south. The county is also home to Capitol Reef National Park, which is located in the Waterpocket Fold, a geologic monocline that extends from Thousand Lake Mountain to the Colorado River. The county is also home to the Fremont River, which flows through the county from north to south.
The climate of Wayne County is semi-arid, with hot summers and cold winters. The average annual precipitation is 8.5 inches, with most of the precipitation occurring in the spring and summer months.
Demographics
As of the 2010 census, Wayne County had a population of 2,778, a decrease of 8.3% from the 2000 census. The population density was 0.6 people per square mile. The racial makeup of the county was 95.2% White, 0.2% African American, 0.7% Native American, 0.2% Asian, 0.1% Pacific Islander, 2.2% from other races, and 1.6% from two or more races. Hispanic or Latino of any race were 4.3% of the population.
The median income for a household in the county was $35,938, and the median income for a family was $41,250. The per capita income for the county was $17,845. About 11.2% of families and 14.2% of the population were below the poverty line, including 17.2% of those under age 18 and 8.2% of those age 65 or over.
Economy
The economy of Wayne County is largely based on agriculture and tourism. The county is home to several large cattle ranches, and the county is also home to several small farms that produce hay, alfalfa, and other crops. Tourism is also an important part of the economy, with visitors coming to the county to visit Capitol Reef National Park and other attractions.
The county is also home to several small businesses, including restaurants, gas stations, and convenience stores. The county is also home to several small manufacturing companies, including a furniture manufacturer and a metal fabrication company.
Conclusion
Wayne County is a rural county located in the southeastern corner of Utah. The county is mostly mountainous, and is home to Capitol Reef National Park. The county has a population of 2,778, and the economy is largely based on agriculture and tourism. The county is also home to several small businesses, and manufacturing companies.
Common Questions
What is the Total Population of Wayne County?
Total Population of Wayne County is 2,532.
What is the Total Male Population of Wayne County?
Total Male Population of Wayne County is 1,299.
What is the Total Female Population of Wayne County?
Total Female Population of Wayne County is 1,233.
What is the Ratio of Males per 100 Females in Wayne County?
There are 105.35 Males per 100 Females in Wayne County.
What is the Ratio of Females per 100 Males in Wayne County?
There are 94.92 Females per 100 Males in Wayne County.
What is the Median Population Age in Wayne County?
Median Population Age in Wayne County is 43.0 Years.
What is the Average Family Size in Wayne County
Average Family Size in Wayne County is 2.7 People.
What is the Average Household Size in Wayne County
Average Household Size in Wayne County is 2.4 People.
What is Per Capita Income in Wayne County?
Per Capita income in Wayne County is $32,605.
What is the Median Family Income in Wayne County?
Median Family Income in Wayne County is $86,010.
What is the Median Household income in Wayne County?
Median Household Income in Wayne County is $64,870.
What is Income or Wage Gap in Wayne County?
Income or Wage Gap in Wayne County is 5.2%.
Women in Wayne County earn 94.8 cents for every dollar earned by a man.
What is Inequality or Gini Index in Wayne County?
Inequality or Gini Index in Wayne County is 0.37.
How Large is the Labor Force in Wayne County?
There are 1,282 People in the Labor Forcein in Wayne County.
What is the Percentage of People in the Labor Force in Wayne County?
63.3% of People are in the Labor Force in Wayne County.
What is the Unemployment Rate in Wayne County?
Unemployment Rate in Wayne County is 0.6%.