Washington County, UT
Washington County Map
Washington County Overview
183,297
TOTAL POPULATION
91,287
MALE POPULATION
92,010
FEMALE POPULATION
99.21
MALES / 100 FEMALES
100.79
FEMALES / 100 MALES
38.6
MEDIAN AGE
3.3
AVG FAMILY SIZE
2.8
AVG HOUSEHOLD SIZE
$36,047
PER CAPITA INCOME
$89,507
AVG FAMILY INCOME
$71,976
AVG HOUSEHOLD INCOME
38.0%
WAGE / INCOME GAP [ % ]
62.0¢/ $1
WAGE / INCOME GAP [ $ ]
$9,952
FAMILY INCOME DEFICIT
0.45
INEQUALITY / GINI INDEX
80,822
LABOR FORCE [ PEOPLE ]
56.5%
PERCENT IN LABOR FORCE
3.1%
UNEMPLOYMENT RATE
Washington County Area Codes
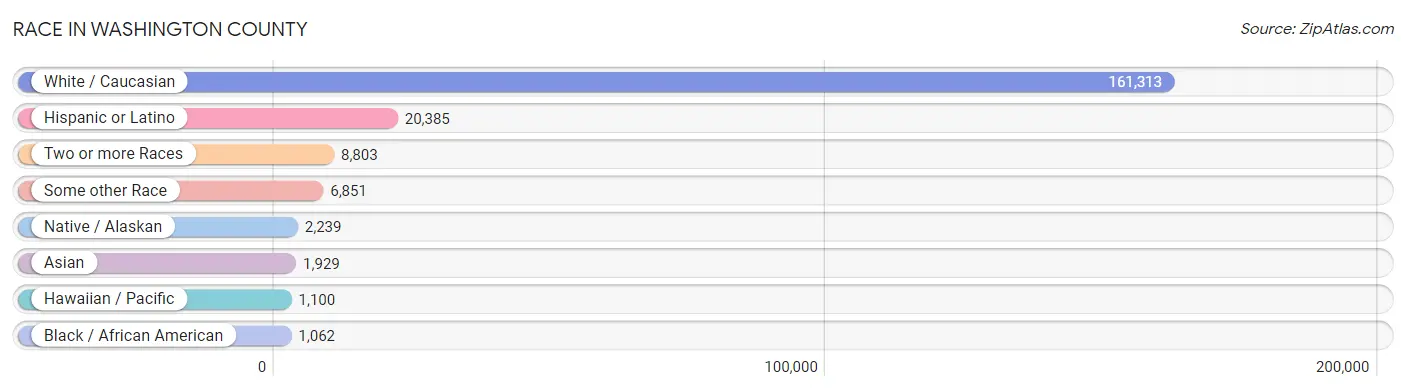
Race in Washington County
The most populous races in Washington County are White / Caucasian (161,313 | 88.0%), Hispanic or Latino (20,385 | 11.1%), and Two or more Races (8,803 | 4.8%).
| Race | # Population | % Population |
| Asian | 1,929 | 1.1% |
| Black / African American | 1,062 | 0.6% |
| Hawaiian / Pacific | 1,100 | 0.6% |
| Hispanic or Latino | 20,385 | 11.1% |
| Native / Alaskan | 2,239 | 1.2% |
| White / Caucasian | 161,313 | 88.0% |
| Two or more Races | 8,803 | 4.8% |
| Some other Race | 6,851 | 3.7% |
| Total | 183,297 | 100.0% |
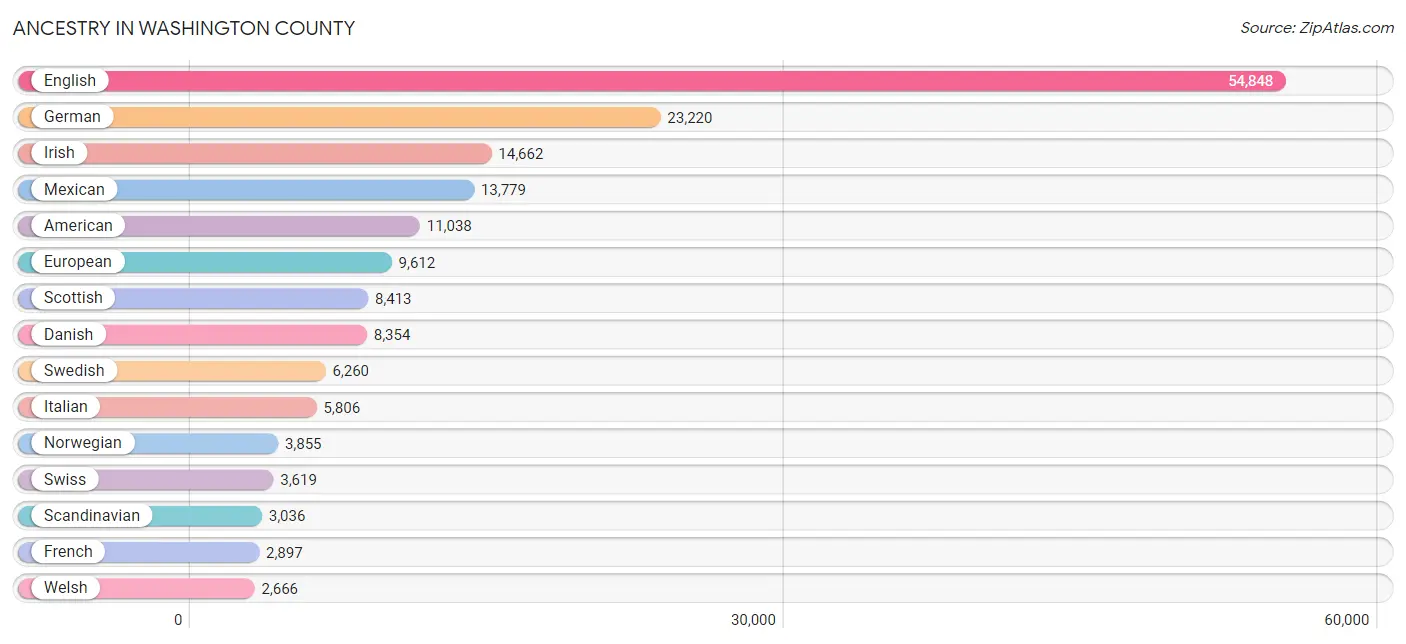
Ancestry in Washington County
The most populous ancestries reported in Washington County are English (54,848 | 29.9%), German (23,220 | 12.7%), Irish (14,662 | 8.0%), Mexican (13,779 | 7.5%), and American (11,038 | 6.0%), together accounting for 64.1% of all Washington County residents.
| Ancestry | # Population | % Population |
| African | 82 | 0.0% |
| Aleut | 27 | 0.0% |
| American | 11,038 | 6.0% |
| Apache | 115 | 0.1% |
| Arab | 307 | 0.2% |
| Argentinean | 116 | 0.1% |
| Armenian | 23 | 0.0% |
| Australian | 45 | 0.0% |
| Austrian | 205 | 0.1% |
| Bahamian | 24 | 0.0% |
| Basque | 136 | 0.1% |
| Belgian | 55 | 0.0% |
| Bhutanese | 396 | 0.2% |
| Blackfeet | 136 | 0.1% |
| Bolivian | 8 | 0.0% |
| Brazilian | 490 | 0.3% |
| British | 2,160 | 1.2% |
| Burmese | 164 | 0.1% |
| Cajun | 6 | 0.0% |
| Cambodian | 3 | 0.0% |
| Canadian | 747 | 0.4% |
| Central American | 1,889 | 1.0% |
| Central American Indian | 26 | 0.0% |
| Cherokee | 486 | 0.3% |
| Cheyenne | 21 | 0.0% |
| Chickasaw | 61 | 0.0% |
| Chilean | 39 | 0.0% |
| Chippewa | 31 | 0.0% |
| Choctaw | 59 | 0.0% |
| Colombian | 273 | 0.2% |
| Comanche | 51 | 0.0% |
| Costa Rican | 24 | 0.0% |
| Creek | 43 | 0.0% |
| Croatian | 135 | 0.1% |
| Cuban | 64 | 0.0% |
| Czech | 242 | 0.1% |
| Czechoslovakian | 34 | 0.0% |
| Danish | 8,354 | 4.6% |
| Dominican | 18 | 0.0% |
| Dutch | 2,631 | 1.4% |
| Eastern European | 301 | 0.2% |
| Ecuadorian | 11 | 0.0% |
| Egyptian | 171 | 0.1% |
| English | 54,848 | 29.9% |
| Estonian | 19 | 0.0% |
| Ethiopian | 71 | 0.0% |
| European | 9,612 | 5.2% |
| Fijian | 52 | 0.0% |
| Filipino | 16 | 0.0% |
| Finnish | 529 | 0.3% |
| French | 2,897 | 1.6% |
| French Canadian | 892 | 0.5% |
| German | 23,220 | 12.7% |
| Ghanaian | 65 | 0.0% |
| Greek | 360 | 0.2% |
| Guamanian / Chamorro | 11 | 0.0% |
| Guatemalan | 636 | 0.4% |
| Haitian | 12 | 0.0% |
| Honduran | 85 | 0.1% |
| Hungarian | 340 | 0.2% |
| Icelander | 304 | 0.2% |
| Indian (Asian) | 566 | 0.3% |
| Iranian | 7 | 0.0% |
| Irish | 14,662 | 8.0% |
| Italian | 5,806 | 3.2% |
| Jamaican | 41 | 0.0% |
| Korean | 992 | 0.5% |
| Laotian | 13 | 0.0% |
| Latvian | 15 | 0.0% |
| Lebanese | 66 | 0.0% |
| Lithuanian | 157 | 0.1% |
| Luxembourger | 5 | 0.0% |
| Maltese | 11 | 0.0% |
| Mexican | 13,779 | 7.5% |
| Mexican American Indian | 17 | 0.0% |
| Mongolian | 21 | 0.0% |
| Moroccan | 24 | 0.0% |
| Native Hawaiian | 627 | 0.3% |
| Navajo | 1,441 | 0.8% |
| Northern European | 528 | 0.3% |
| Norwegian | 3,855 | 2.1% |
| Osage | 21 | 0.0% |
| Paiute | 126 | 0.1% |
| Pakistani | 194 | 0.1% |
| Panamanian | 10 | 0.0% |
| Pennsylvania German | 65 | 0.0% |
| Peruvian | 138 | 0.1% |
| Polish | 1,972 | 1.1% |
| Portuguese | 448 | 0.2% |
| Puerto Rican | 861 | 0.5% |
| Romanian | 62 | 0.0% |
| Russian | 285 | 0.2% |
| Salvadoran | 1,134 | 0.6% |
| Samoan | 1,390 | 0.8% |
| Scandinavian | 3,036 | 1.7% |
| Scotch-Irish | 1,498 | 0.8% |
| Scottish | 8,413 | 4.6% |
| Serbian | 152 | 0.1% |
| Sioux | 30 | 0.0% |
| Slavic | 72 | 0.0% |
| Slovak | 113 | 0.1% |
| Slovene | 34 | 0.0% |
| Somali | 18 | 0.0% |
| South African | 8 | 0.0% |
| South American | 951 | 0.5% |
| Spaniard | 1,208 | 0.7% |
| Spanish | 499 | 0.3% |
| Spanish American | 73 | 0.0% |
| Spanish American Indian | 109 | 0.1% |
| Sri Lankan | 358 | 0.2% |
| Subsaharan African | 383 | 0.2% |
| Sudanese | 112 | 0.1% |
| Swedish | 6,260 | 3.4% |
| Swiss | 3,619 | 2.0% |
| Syrian | 46 | 0.0% |
| Thai | 365 | 0.2% |
| Tongan | 707 | 0.4% |
| Turkish | 244 | 0.1% |
| Ukrainian | 322 | 0.2% |
| Uruguayan | 43 | 0.0% |
| Ute | 42 | 0.0% |
| Venezuelan | 323 | 0.2% |
| Welsh | 2,666 | 1.5% |
| Yugoslavian | 56 | 0.0% |
| Yuman | 14 | 0.0% | View All 125 Rows |
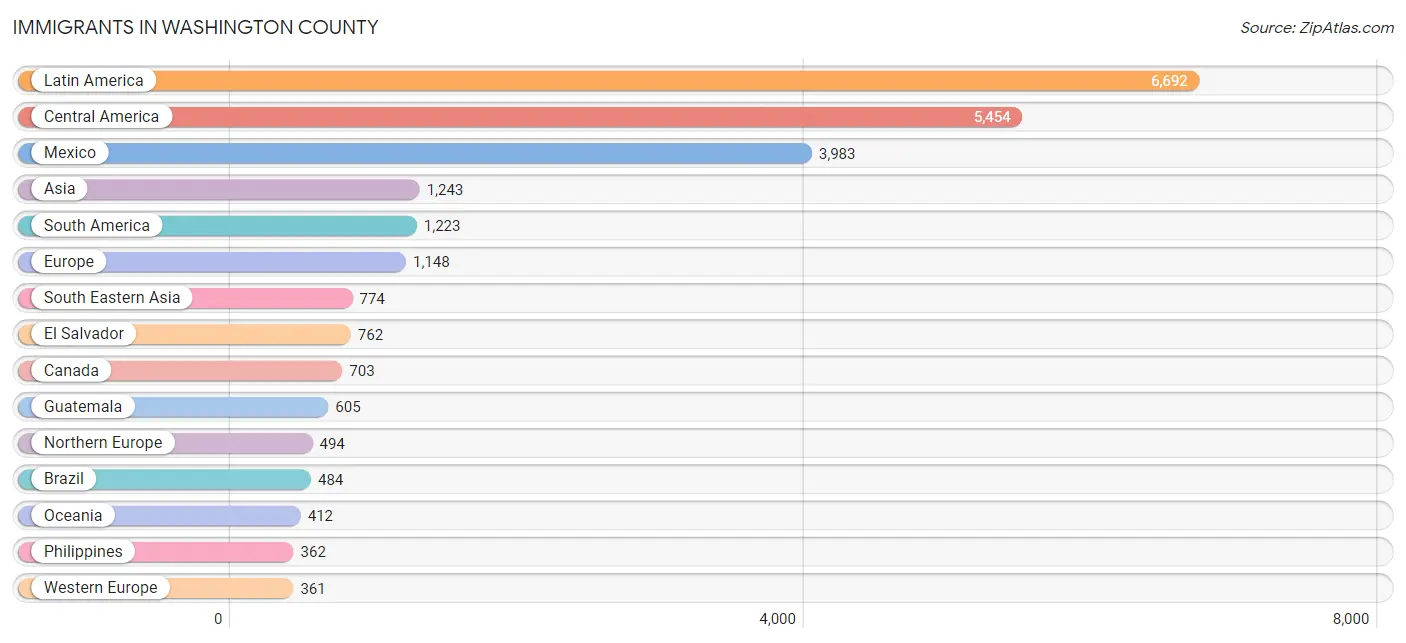
Immigrants in Washington County
The most numerous immigrant groups reported in Washington County came from Latin America (6,692 | 3.6%), Central America (5,454 | 3.0%), Mexico (3,983 | 2.2%), Asia (1,243 | 0.7%), and South America (1,223 | 0.7%), together accounting for 10.1% of all Washington County residents.
| Immigration Origin | # Population | % Population |
| Africa | 227 | 0.1% |
| Argentina | 139 | 0.1% |
| Asia | 1,243 | 0.7% |
| Australia | 44 | 0.0% |
| Austria | 30 | 0.0% |
| Belgium | 5 | 0.0% |
| Brazil | 484 | 0.3% |
| Canada | 703 | 0.4% |
| Caribbean | 15 | 0.0% |
| Central America | 5,454 | 3.0% |
| Chile | 39 | 0.0% |
| China | 185 | 0.1% |
| Colombia | 149 | 0.1% |
| Costa Rica | 5 | 0.0% |
| Cuba | 3 | 0.0% |
| Czechoslovakia | 18 | 0.0% |
| Denmark | 101 | 0.1% |
| Eastern Africa | 89 | 0.1% |
| Eastern Asia | 328 | 0.2% |
| Eastern Europe | 214 | 0.1% |
| Ecuador | 11 | 0.0% |
| El Salvador | 762 | 0.4% |
| England | 125 | 0.1% |
| Ethiopia | 71 | 0.0% |
| Europe | 1,148 | 0.6% |
| France | 67 | 0.0% |
| Germany | 196 | 0.1% |
| Ghana | 22 | 0.0% |
| Guatemala | 605 | 0.3% |
| Haiti | 12 | 0.0% |
| Honduras | 85 | 0.1% |
| Hong Kong | 27 | 0.0% |
| Hungary | 17 | 0.0% |
| India | 63 | 0.0% |
| Indonesia | 13 | 0.0% |
| Ireland | 31 | 0.0% |
| Italy | 9 | 0.0% |
| Japan | 58 | 0.0% |
| Korea | 82 | 0.0% |
| Latin America | 6,692 | 3.6% |
| Malaysia | 38 | 0.0% |
| Mexico | 3,983 | 2.2% |
| Middle Africa | 11 | 0.0% |
| Netherlands | 49 | 0.0% |
| Nigeria | 50 | 0.0% |
| Northern Africa | 39 | 0.0% |
| Northern Europe | 494 | 0.3% |
| Norway | 8 | 0.0% |
| Oceania | 412 | 0.2% |
| Panama | 14 | 0.0% |
| Peru | 36 | 0.0% |
| Philippines | 362 | 0.2% |
| Poland | 9 | 0.0% |
| Romania | 31 | 0.0% |
| Russia | 45 | 0.0% |
| Scotland | 44 | 0.0% |
| Somalia | 18 | 0.0% |
| South America | 1,223 | 0.7% |
| South Central Asia | 63 | 0.0% |
| South Eastern Asia | 774 | 0.4% |
| Southern Europe | 67 | 0.0% |
| Spain | 58 | 0.0% |
| Sudan | 39 | 0.0% |
| Sweden | 67 | 0.0% |
| Switzerland | 14 | 0.0% |
| Taiwan | 59 | 0.0% |
| Thailand | 74 | 0.0% |
| Turkey | 36 | 0.0% |
| Ukraine | 94 | 0.1% |
| Uruguay | 35 | 0.0% |
| Venezuela | 330 | 0.2% |
| Vietnam | 287 | 0.2% |
| Western Africa | 72 | 0.0% |
| Western Asia | 78 | 0.0% |
| Western Europe | 361 | 0.2% |
| Zaire | 11 | 0.0% | View All 76 Rows |
Sex and Age in Washington County
Sex and Age in Washington County
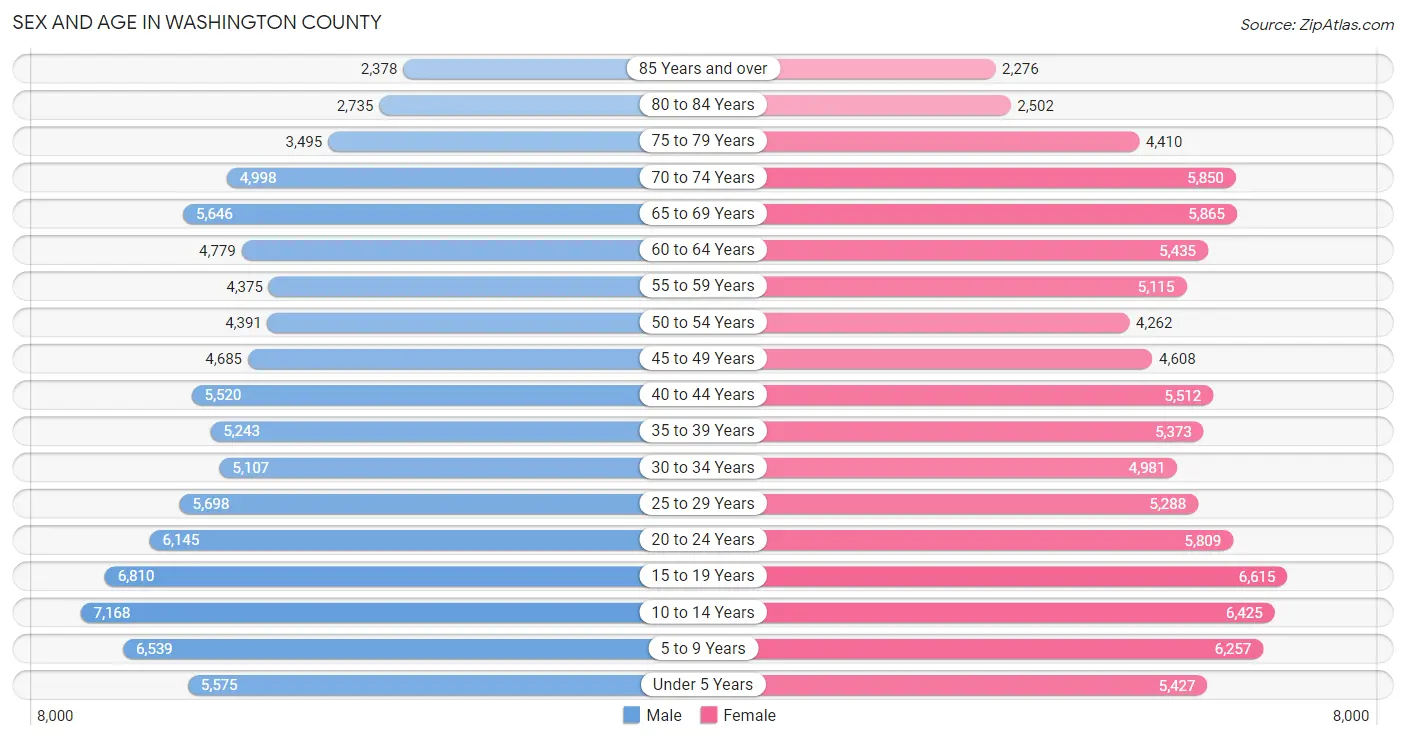
The most populous age groups in Washington County are 10 to 14 Years (7,168 | 7.9%) for men and 15 to 19 Years (6,615 | 7.2%) for women.
| Age Bracket | Male | Female |
| Under 5 Years | 5,575 (6.1%) | 5,427 (5.9%) |
| 5 to 9 Years | 6,539 (7.2%) | 6,257 (6.8%) |
| 10 to 14 Years | 7,168 (7.9%) | 6,425 (7.0%) |
| 15 to 19 Years | 6,810 (7.5%) | 6,615 (7.2%) |
| 20 to 24 Years | 6,145 (6.7%) | 5,809 (6.3%) |
| 25 to 29 Years | 5,698 (6.2%) | 5,288 (5.8%) |
| 30 to 34 Years | 5,107 (5.6%) | 4,981 (5.4%) |
| 35 to 39 Years | 5,243 (5.7%) | 5,373 (5.8%) |
| 40 to 44 Years | 5,520 (6.0%) | 5,512 (6.0%) |
| 45 to 49 Years | 4,685 (5.1%) | 4,608 (5.0%) |
| 50 to 54 Years | 4,391 (4.8%) | 4,262 (4.6%) |
| 55 to 59 Years | 4,375 (4.8%) | 5,115 (5.6%) |
| 60 to 64 Years | 4,779 (5.2%) | 5,435 (5.9%) |
| 65 to 69 Years | 5,646 (6.2%) | 5,865 (6.4%) |
| 70 to 74 Years | 4,998 (5.5%) | 5,850 (6.4%) |
| 75 to 79 Years | 3,495 (3.8%) | 4,410 (4.8%) |
| 80 to 84 Years | 2,735 (3.0%) | 2,502 (2.7%) |
| 85 Years and over | 2,378 (2.6%) | 2,276 (2.5%) |
| Total | 91,287 (100.0%) | 92,010 (100.0%) |
Families and Households in Washington County
Median Family Size in Washington County
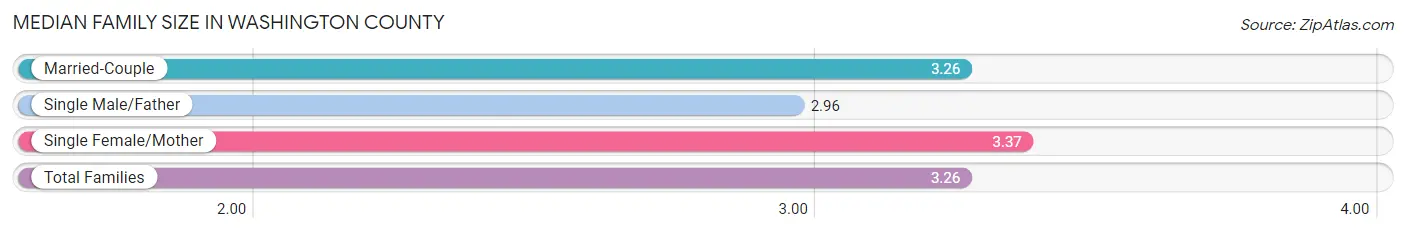
The median family size in Washington County is 3.26 persons per family, with single female/mother families (4,278 | 8.9%) accounting for the largest median family size of 3.37 persons per family. On the other hand, single male/father families (2,293 | 4.8%) represent the smallest median family size with 2.96 persons per family.
| Family Type | # Families | Family Size |
| Married-Couple | 41,366 (86.3%) | 3.26 |
| Single Male/Father | 2,293 (4.8%) | 2.96 |
| Single Female/Mother | 4,278 (8.9%) | 3.37 |
| Total Families | 47,937 (100.0%) | 3.26 |
Median Household Size in Washington County
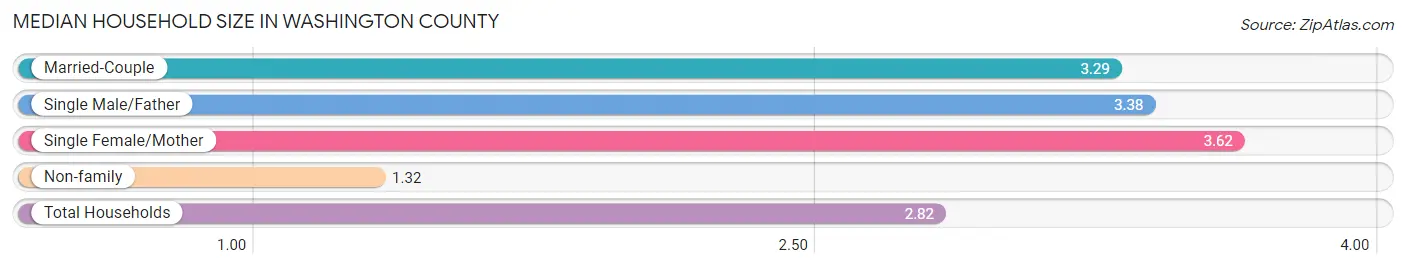
The median household size in Washington County is 2.82 persons per household, with single female/mother households (4,278 | 6.7%) accounting for the largest median household size of 3.62 persons per household. non-family households (16,214 | 25.3%) represent the smallest median household size with 1.32 persons per household.
| Household Type | # Households | Household Size |
| Married-Couple | 41,366 (64.5%) | 3.29 |
| Single Male/Father | 2,293 (3.6%) | 3.38 |
| Single Female/Mother | 4,278 (6.7%) | 3.62 |
| Non-family | 16,214 (25.3%) | 1.32 |
| Total Households | 64,151 (100.0%) | 2.82 |
Household Size by Marriage Status in Washington County
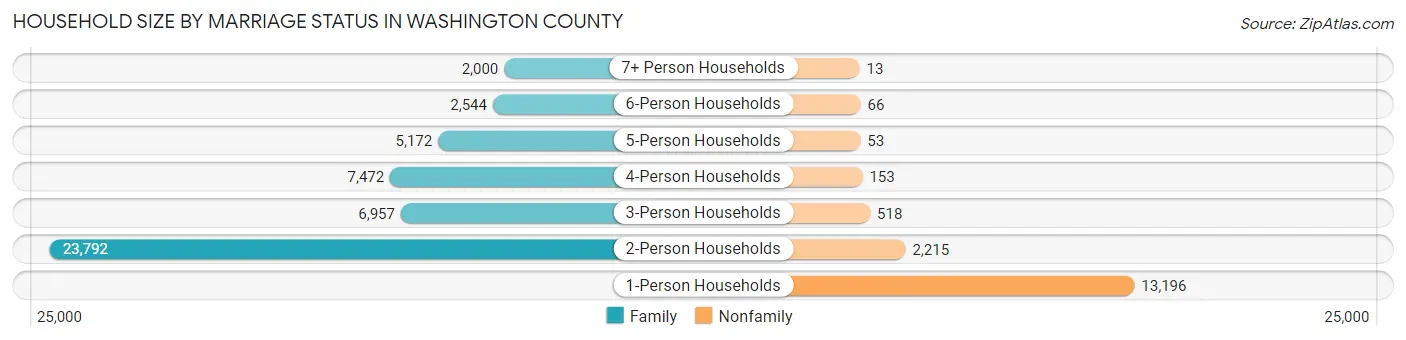
Out of a total of 64,151 households in Washington County, 47,937 (74.7%) are family households, while 16,214 (25.3%) are nonfamily households. The most numerous type of family households are 2-person households, comprising 23,792, and the most common type of nonfamily households are 1-person households, comprising 13,196.
| Household Size | Family Households | Nonfamily Households |
| 1-Person Households | - | 13,196 (20.6%) |
| 2-Person Households | 23,792 (37.1%) | 2,215 (3.5%) |
| 3-Person Households | 6,957 (10.8%) | 518 (0.8%) |
| 4-Person Households | 7,472 (11.7%) | 153 (0.2%) |
| 5-Person Households | 5,172 (8.1%) | 53 (0.1%) |
| 6-Person Households | 2,544 (4.0%) | 66 (0.1%) |
| 7+ Person Households | 2,000 (3.1%) | 13 (0.0%) |
| Total | 47,937 (74.7%) | 16,214 (25.3%) |
Female Fertility in Washington County
Fertility by Age in Washington County
Average fertility rate in Washington County is 57.0 births per 1,000 women. Women in the age bracket of 20 to 34 years have the highest fertility rate with 113.0 births per 1,000 women. Women in the age bracket of 20 to 34 years acount for 81.6% of all women with births.
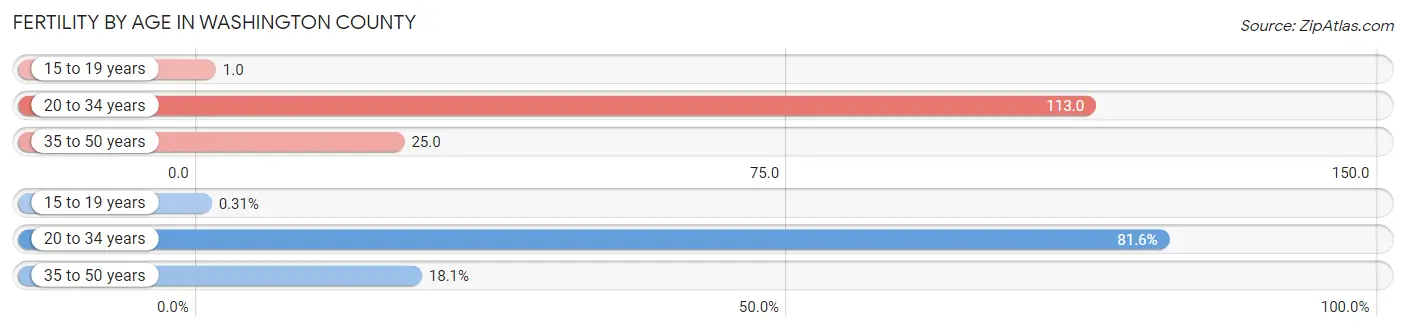
| Age Bracket | Women with Births | Births / 1,000 Women |
| 15 to 19 years | 7 (0.3%) | 1.0 |
| 20 to 34 years | 1,821 (81.6%) | 113.0 |
| 35 to 50 years | 405 (18.1%) | 25.0 |
| Total | 2,233 (100.0%) | 57.0 |
Fertility by Age by Marriage Status in Washington County
87.6% of women with births (2,233) in Washington County are married. The highest percentage of unmarried women with births falls into 15 to 19 years age bracket with 42.9% of them unmarried at the time of birth, while the lowest percentage of unmarried women with births belong to 35 to 50 years age bracket with 0.0% of them unmarried.
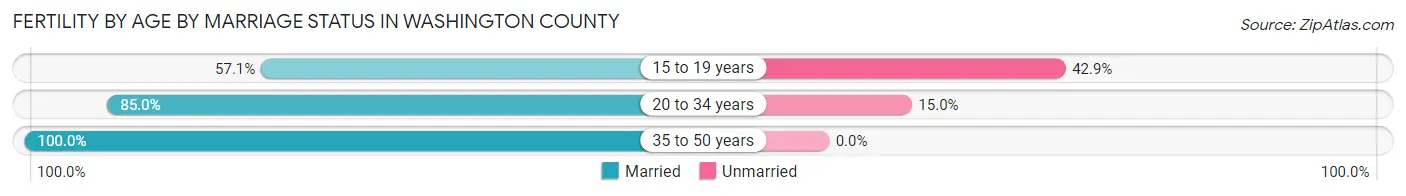
| Age Bracket | Married | Unmarried |
| 15 to 19 years | 4 (57.1%) | 3 (42.9%) |
| 20 to 34 years | 1,548 (85.0%) | 273 (15.0%) |
| 35 to 50 years | 405 (100.0%) | 0 (0.0%) |
| Total | 1,956 (87.6%) | 277 (12.4%) |
Fertility by Education in Washington County
Average fertility rate in Washington County is 57.0 births per 1,000 women. Women with the education attainment of bachelor's degree have the highest fertility rate of 93.0 births per 1,000 women, while women with the education attainment of less than high school have the lowest fertility at 19.0 births per 1,000 women. Women with the education attainment of college or associate's degree represent 42.9% of all women with births.
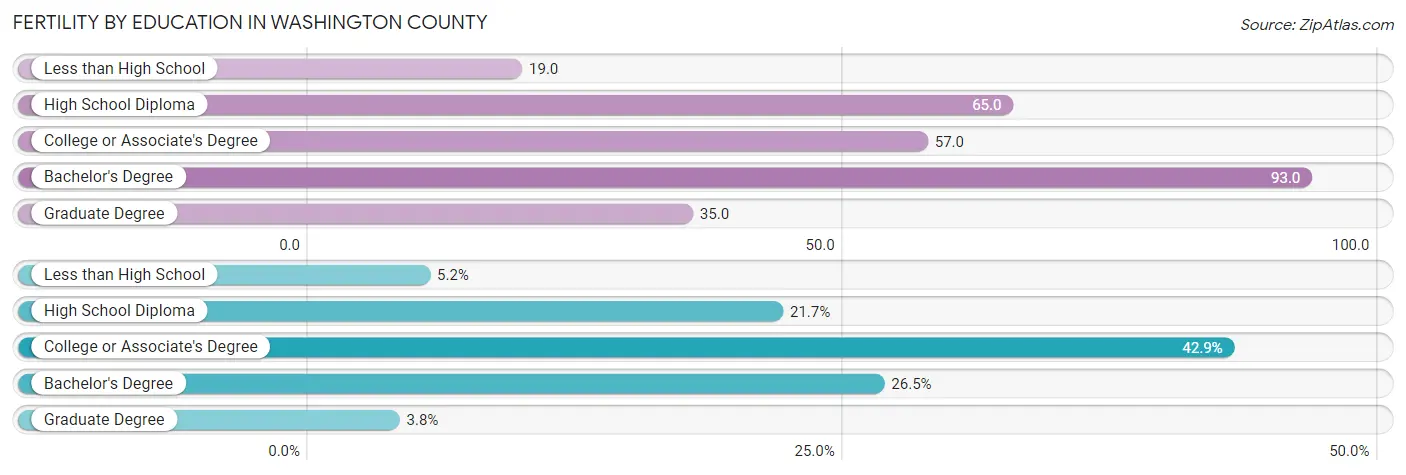
| Educational Attainment | Women with Births | Births / 1,000 Women |
| Less than High School | 116 (5.2%) | 19.0 |
| High School Diploma | 485 (21.7%) | 65.0 |
| College or Associate's Degree | 957 (42.9%) | 57.0 |
| Bachelor's Degree | 591 (26.5%) | 93.0 |
| Graduate Degree | 84 (3.8%) | 35.0 |
| Total | 2,233 (100.0%) | 57.0 |
Fertility by Education by Marriage Status in Washington County
12.4% of women with births in Washington County are unmarried. Women with the educational attainment of graduate degree are most likely to be married with 100.0% of them married at childbirth, while women with the educational attainment of less than high school are least likely to be married with 28.4% of them unmarried at childbirth.
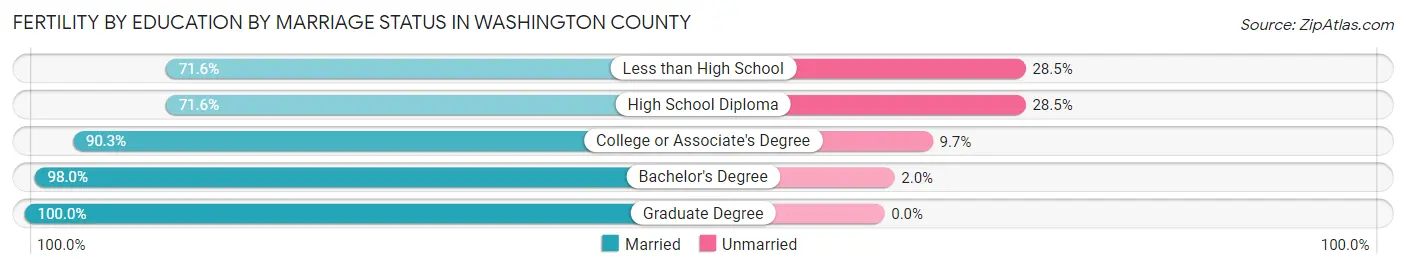
| Educational Attainment | Married | Unmarried |
| Less than High School | 83 (71.6%) | 33 (28.4%) |
| High School Diploma | 347 (71.6%) | 138 (28.4%) |
| College or Associate's Degree | 864 (90.3%) | 93 (9.7%) |
| Bachelor's Degree | 579 (98.0%) | 12 (2.0%) |
| Graduate Degree | 84 (100.0%) | 0 (0.0%) |
| Total | 1,956 (87.6%) | 277 (12.4%) |
Income in Washington County
Income Overview in Washington County
Per Capita Income in Washington County is $36,047, while median incomes of families and households are $89,507 and $71,976 respectively.
| Characteristic | Number | Measure |
| Per Capita Income | 183,297 | $36,047 |
| Median Family Income | 47,937 | $89,507 |
| Mean Family Income | 47,937 | $113,185 |
| Median Household Income | 64,151 | $71,976 |
| Mean Household Income | 64,151 | $99,534 |
| Income Deficit | 47,937 | $9,952 |
| Wage / Income Gap (%) | 183,297 | 37.98% |
| Wage / Income Gap ($) | 183,297 | 62.02¢ per $1 |
| Gini / Inequality Index | 183,297 | 0.45 |
Earnings by Sex in Washington County
Average Earnings in Washington County are $34,305, $42,605 for men and $26,425 for women, a difference of 38.0%.
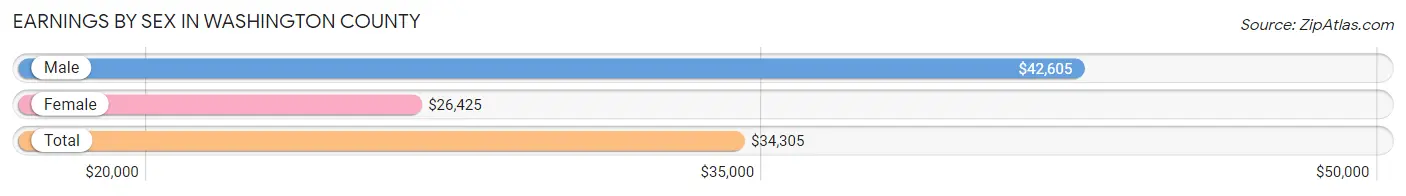
| Sex | Number | Average Earnings |
| Male | 48,021 (55.0%) | $42,605 |
| Female | 39,204 (45.0%) | $26,425 |
| Total | 87,225 (100.0%) | $34,305 |
Earnings by Sex by Income Bracket in Washington County
The most common earnings brackets in Washington County are $100,000+ for men (9,172 | 19.1%) and $25,000 to $29,999 for women (3,421 | 8.7%).
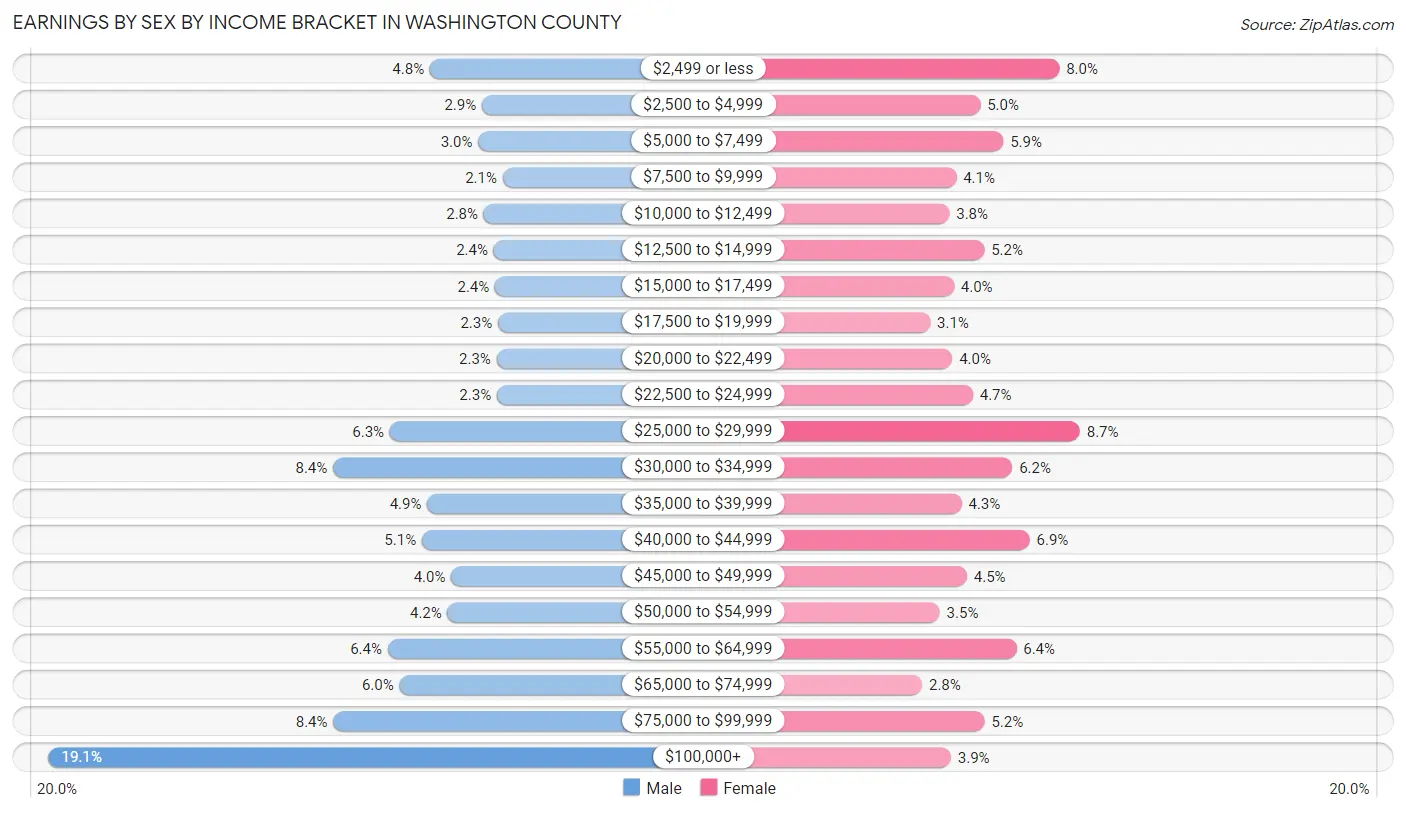
| Income | Male | Female |
| $2,499 or less | 2,308 (4.8%) | 3,122 (8.0%) |
| $2,500 to $4,999 | 1,371 (2.9%) | 1,960 (5.0%) |
| $5,000 to $7,499 | 1,443 (3.0%) | 2,299 (5.9%) |
| $7,500 to $9,999 | 999 (2.1%) | 1,608 (4.1%) |
| $10,000 to $12,499 | 1,339 (2.8%) | 1,505 (3.8%) |
| $12,500 to $14,999 | 1,163 (2.4%) | 2,018 (5.1%) |
| $15,000 to $17,499 | 1,136 (2.4%) | 1,573 (4.0%) |
| $17,500 to $19,999 | 1,085 (2.3%) | 1,225 (3.1%) |
| $20,000 to $22,499 | 1,111 (2.3%) | 1,547 (4.0%) |
| $22,500 to $24,999 | 1,106 (2.3%) | 1,852 (4.7%) |
| $25,000 to $29,999 | 3,028 (6.3%) | 3,421 (8.7%) |
| $30,000 to $34,999 | 4,051 (8.4%) | 2,431 (6.2%) |
| $35,000 to $39,999 | 2,359 (4.9%) | 1,684 (4.3%) |
| $40,000 to $44,999 | 2,456 (5.1%) | 2,686 (6.9%) |
| $45,000 to $49,999 | 1,927 (4.0%) | 1,763 (4.5%) |
| $50,000 to $54,999 | 1,994 (4.2%) | 1,364 (3.5%) |
| $55,000 to $64,999 | 3,069 (6.4%) | 2,490 (6.4%) |
| $65,000 to $74,999 | 2,856 (5.9%) | 1,105 (2.8%) |
| $75,000 to $99,999 | 4,048 (8.4%) | 2,024 (5.2%) |
| $100,000+ | 9,172 (19.1%) | 1,527 (3.9%) |
| Total | 48,021 (100.0%) | 39,204 (100.0%) |
Earnings by Sex by Educational Attainment in Washington County
Average earnings in Washington County are $53,188 for men and $30,581 for women, a difference of 42.5%. Men with an educational attainment of graduate degree enjoy the highest average annual earnings of $106,596, while those with less than high school education earn the least with $39,600. Women with an educational attainment of graduate degree earn the most with the average annual earnings of $58,532, while those with high school diploma education have the smallest earnings of $26,350.
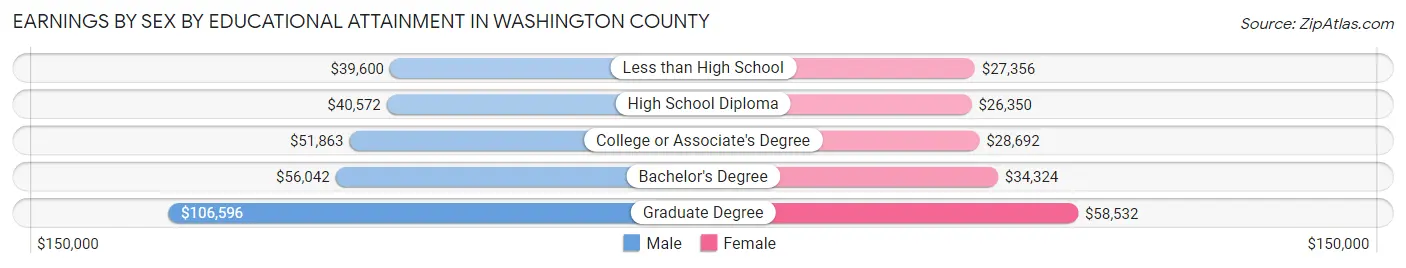
| Educational Attainment | Male Income | Female Income |
| Less than High School | $39,600 | $27,356 |
| High School Diploma | $40,572 | $26,350 |
| College or Associate's Degree | $51,863 | $28,692 |
| Bachelor's Degree | $56,042 | $34,324 |
| Graduate Degree | $106,596 | $58,532 |
| Total | $53,188 | $30,581 |
Family Income in Washington County
Family Income Brackets in Washington County
According to the Washington County family income data, there are 11,601 families falling into the $100,000 to $149,999 income range, which is the most common income bracket and makes up 24.2% of all families. Conversely, the less than $10,000 income bracket is the least frequent group with only 671 families (1.4%) belonging to this category.
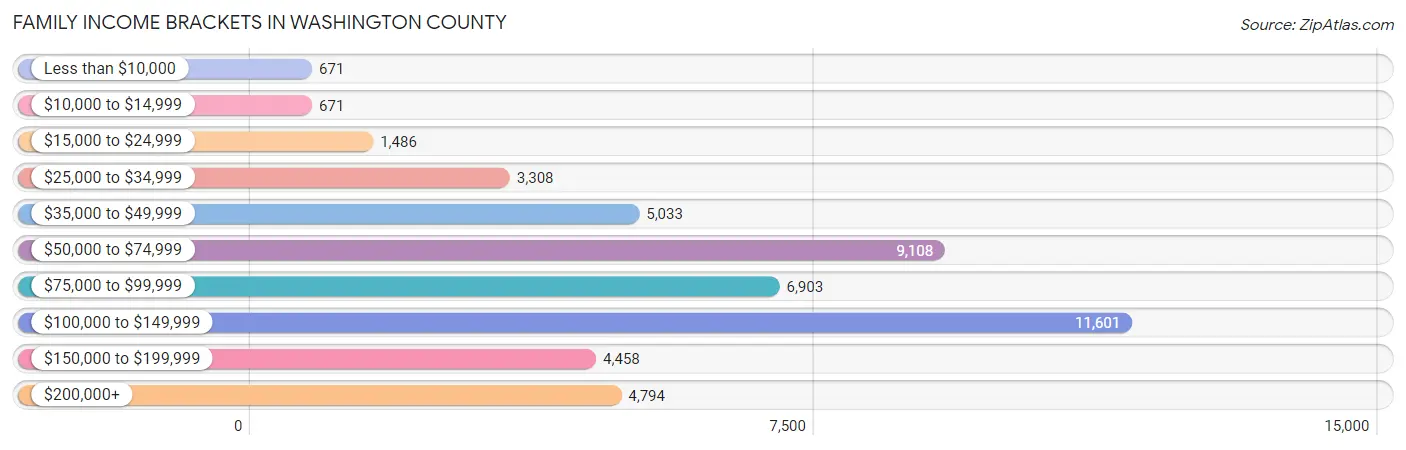
| Income Bracket | # Families | % Families |
| Less than $10,000 | 671 | 1.4% |
| $10,000 to $14,999 | 671 | 1.4% |
| $15,000 to $24,999 | 1,486 | 3.1% |
| $25,000 to $34,999 | 3,308 | 6.9% |
| $35,000 to $49,999 | 5,033 | 10.5% |
| $50,000 to $74,999 | 9,108 | 19.0% |
| $75,000 to $99,999 | 6,903 | 14.4% |
| $100,000 to $149,999 | 11,601 | 24.2% |
| $150,000 to $199,999 | 4,458 | 9.3% |
| $200,000+ | 4,794 | 10.0% |
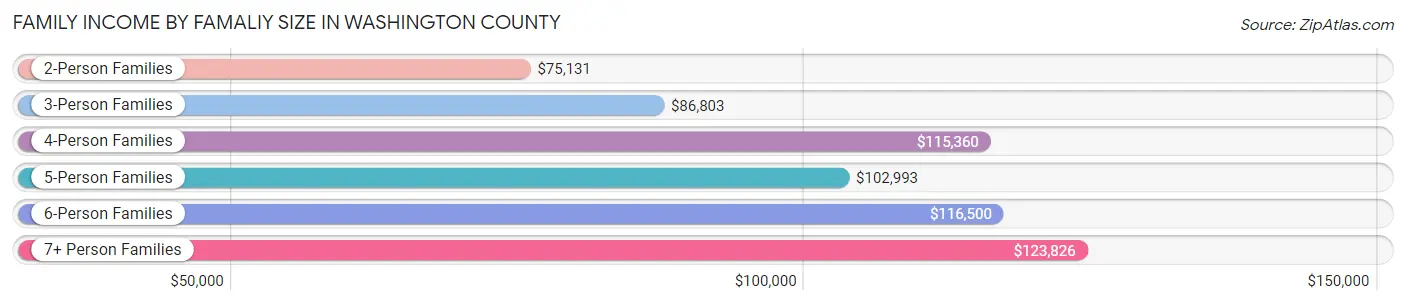
Family Income by Famaliy Size in Washington County
7+ person families (1,932 | 4.0%) account for the highest median family income in Washington County with $123,826 per family, while 2-person families (24,650 | 51.4%) have the highest median income of $37,566 per family member.
| Income Bracket | # Families | Median Income |
| 2-Person Families | 24,650 (51.4%) | $75,131 |
| 3-Person Families | 6,854 (14.3%) | $86,803 |
| 4-Person Families | 7,458 (15.6%) | $115,360 |
| 5-Person Families | 4,575 (9.5%) | $102,993 |
| 6-Person Families | 2,468 (5.1%) | $116,500 |
| 7+ Person Families | 1,932 (4.0%) | $123,826 |
| Total | 47,937 (100.0%) | $89,507 |
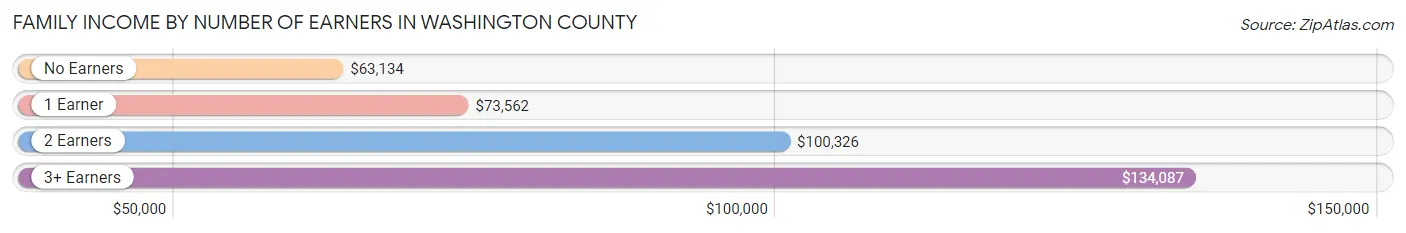
Family Income by Number of Earners in Washington County
The median family income in Washington County is $89,507, with families comprising 3+ earners (6,354) having the highest median family income of $134,087, while families with no earners (11,366) have the lowest median family income of $63,134, accounting for 13.3% and 23.7% of families, respectively.
| Number of Earners | # Families | Median Income |
| No Earners | 11,366 (23.7%) | $63,134 |
| 1 Earner | 13,256 (27.7%) | $73,562 |
| 2 Earners | 16,961 (35.4%) | $100,326 |
| 3+ Earners | 6,354 (13.3%) | $134,087 |
| Total | 47,937 (100.0%) | $89,507 |
Household Income in Washington County
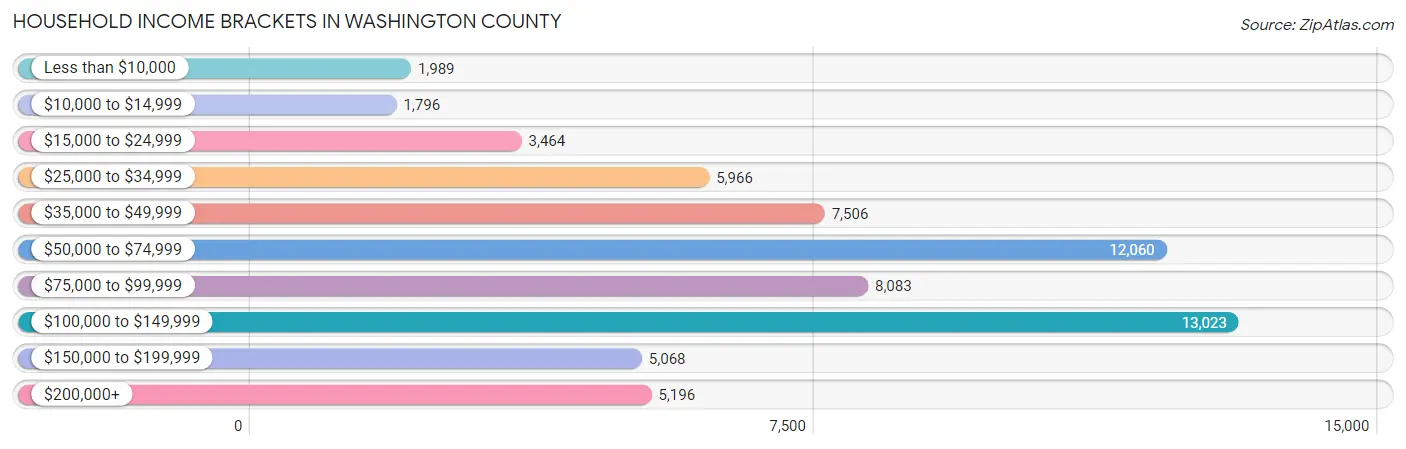
Household Income Brackets in Washington County
With 13,023 households falling in the category, the $100,000 to $149,999 income range is the most frequent in Washington County, accounting for 20.3% of all households. In contrast, only 1,796 households (2.8%) fall into the $10,000 to $14,999 income bracket, making it the least populous group.
| Income Bracket | # Households | % Households |
| Less than $10,000 | 1,989 | 3.1% |
| $10,000 to $14,999 | 1,796 | 2.8% |
| $15,000 to $24,999 | 3,464 | 5.4% |
| $25,000 to $34,999 | 5,966 | 9.3% |
| $35,000 to $49,999 | 7,506 | 11.7% |
| $50,000 to $74,999 | 12,060 | 18.8% |
| $75,000 to $99,999 | 8,083 | 12.6% |
| $100,000 to $149,999 | 13,023 | 20.3% |
| $150,000 to $199,999 | 5,068 | 7.9% |
| $200,000+ | 5,196 | 8.1% |
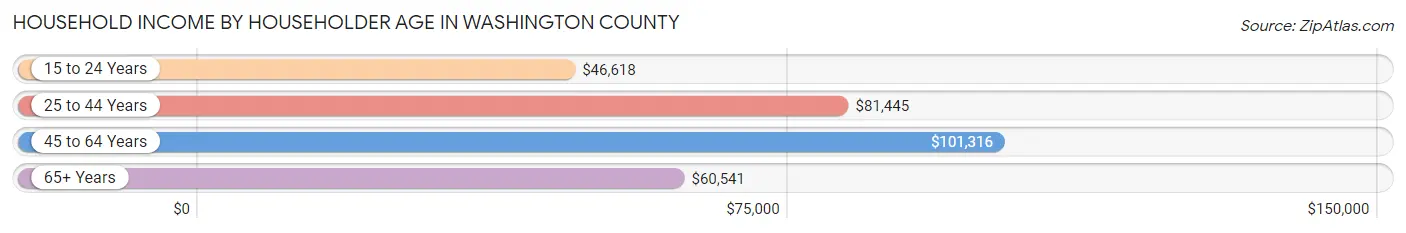
Household Income by Householder Age in Washington County
The median household income in Washington County is $71,976, with the highest median household income of $101,316 found in the 45 to 64 years age bracket for the primary householder. A total of 18,840 households (29.4%) fall into this category. Meanwhile, the 15 to 24 years age bracket for the primary householder has the lowest median household income of $46,618, with 2,960 households (4.6%) in this group.
| Income Bracket | # Households | Median Income |
| 15 to 24 Years | 2,960 (4.6%) | $46,618 |
| 25 to 44 Years | 18,654 (29.1%) | $81,445 |
| 45 to 64 Years | 18,840 (29.4%) | $101,316 |
| 65+ Years | 23,697 (36.9%) | $60,541 |
| Total | 64,151 (100.0%) | $71,976 |
Poverty in Washington County
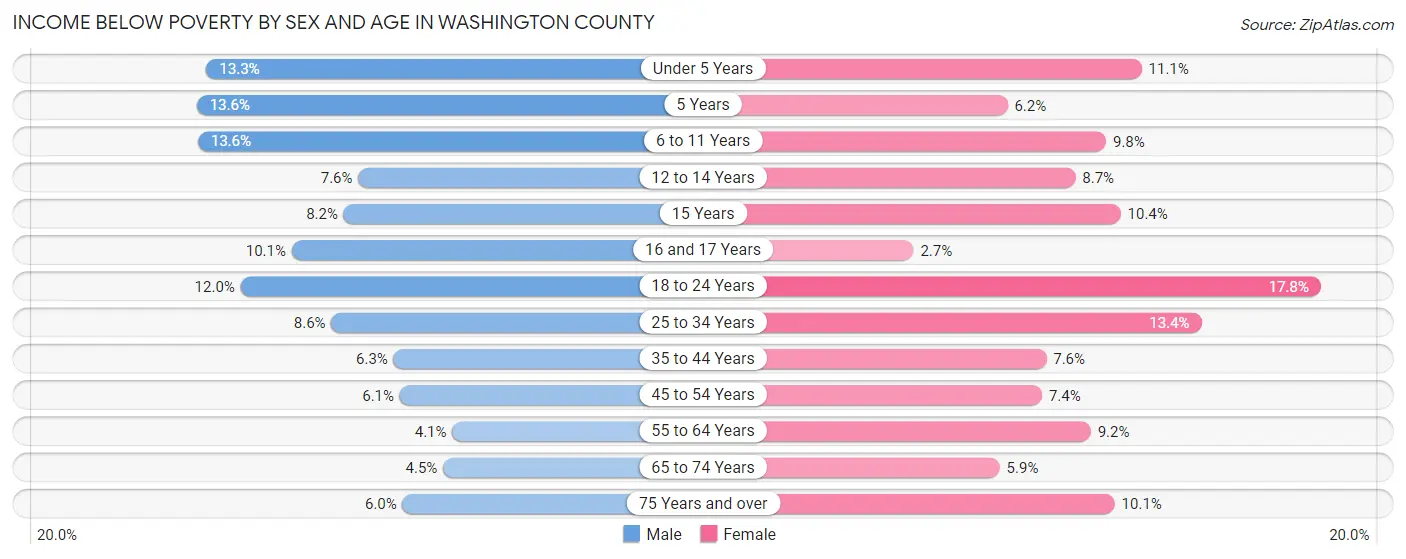
Income Below Poverty by Sex and Age in Washington County
With 8.0% poverty level for males and 9.7% for females among the residents of Washington County, 5 year old males and 18 to 24 year old females are the most vulnerable to poverty, with 165 males (13.6%) and 1,444 females (17.8%) in their respective age groups living below the poverty level.
| Age Bracket | Male | Female |
| Under 5 Years | 730 (13.3%) | 599 (11.1%) |
| 5 Years | 165 (13.6%) | 81 (6.1%) |
| 6 to 11 Years | 1,059 (13.6%) | 744 (9.8%) |
| 12 to 14 Years | 343 (7.6%) | 316 (8.7%) |
| 15 Years | 141 (8.2%) | 109 (10.3%) |
| 16 and 17 Years | 239 (10.1%) | 76 (2.7%) |
| 18 to 24 Years | 1,021 (12.0%) | 1,444 (17.8%) |
| 25 to 34 Years | 922 (8.6%) | 1,367 (13.4%) |
| 35 to 44 Years | 666 (6.3%) | 822 (7.6%) |
| 45 to 54 Years | 545 (6.1%) | 658 (7.4%) |
| 55 to 64 Years | 374 (4.1%) | 972 (9.2%) |
| 65 to 74 Years | 474 (4.5%) | 678 (5.9%) |
| 75 Years and over | 509 (6.0%) | 913 (10.1%) |
| Total | 7,188 (8.0%) | 8,779 (9.7%) |
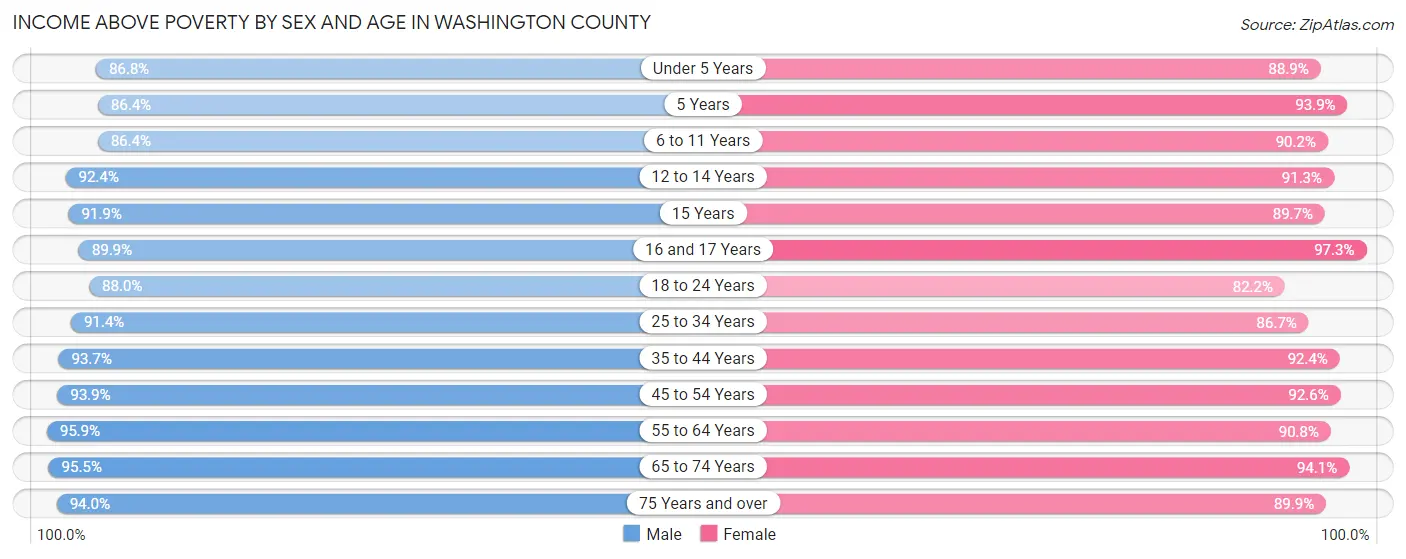
Income Above Poverty by Sex and Age in Washington County
According to the poverty statistics in Washington County, males aged 55 to 64 years and females aged 16 and 17 years are the age groups that are most secure financially, with 95.9% of males and 97.3% of females in these age groups living above the poverty line.
| Age Bracket | Male | Female |
| Under 5 Years | 4,778 (86.8%) | 4,785 (88.9%) |
| 5 Years | 1,047 (86.4%) | 1,236 (93.9%) |
| 6 to 11 Years | 6,746 (86.4%) | 6,842 (90.2%) |
| 12 to 14 Years | 4,165 (92.4%) | 3,327 (91.3%) |
| 15 Years | 1,589 (91.8%) | 944 (89.6%) |
| 16 and 17 Years | 2,133 (89.9%) | 2,777 (97.3%) |
| 18 to 24 Years | 7,503 (88.0%) | 6,676 (82.2%) |
| 25 to 34 Years | 9,786 (91.4%) | 8,873 (86.7%) |
| 35 to 44 Years | 9,908 (93.7%) | 10,011 (92.4%) |
| 45 to 54 Years | 8,428 (93.9%) | 8,198 (92.6%) |
| 55 to 64 Years | 8,694 (95.9%) | 9,550 (90.8%) |
| 65 to 74 Years | 10,149 (95.5%) | 10,884 (94.1%) |
| 75 Years and over | 8,012 (94.0%) | 8,103 (89.9%) |
| Total | 82,938 (92.0%) | 82,206 (90.3%) |
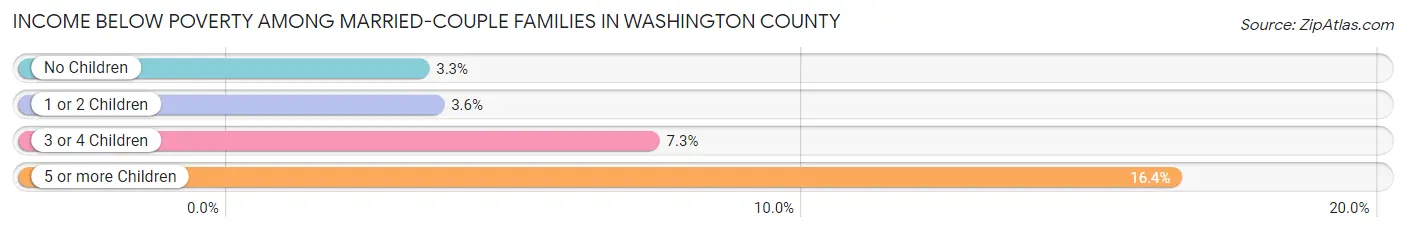
Income Below Poverty Among Married-Couple Families in Washington County
The poverty statistics for married-couple families in Washington County show that 4.3% or 1,762 of the total 41,366 families live below the poverty line. Families with 5 or more children have the highest poverty rate of 16.4%, comprising of 185 families. On the other hand, families with no children have the lowest poverty rate of 3.3%, which includes 809 families.
| Children | Above Poverty | Below Poverty |
| No Children | 23,489 (96.7%) | 809 (3.3%) |
| 1 or 2 Children | 10,355 (96.4%) | 386 (3.6%) |
| 3 or 4 Children | 4,820 (92.7%) | 382 (7.3%) |
| 5 or more Children | 940 (83.6%) | 185 (16.4%) |
| Total | 39,604 (95.7%) | 1,762 (4.3%) |
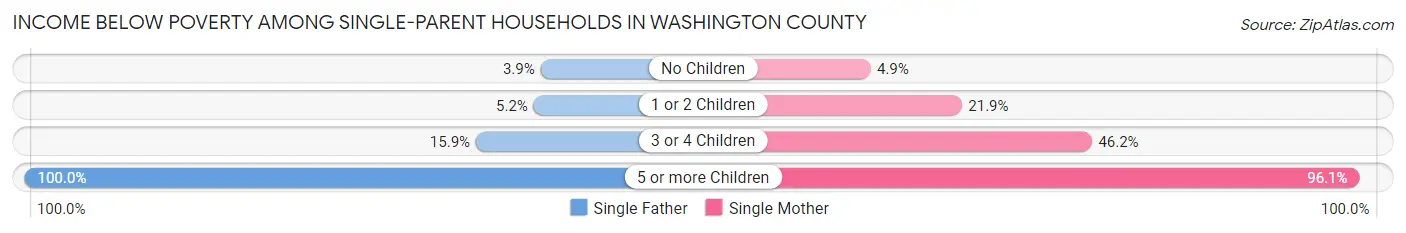
Income Below Poverty Among Single-Parent Households in Washington County
According to the poverty data in Washington County, 5.3% or 122 single-father households and 19.9% or 850 single-mother households are living below the poverty line. Among single-father households, those with 5 or more children have the highest poverty rate, with 3 households (100.0%) experiencing poverty. Likewise, among single-mother households, those with 5 or more children have the highest poverty rate, with 73 households (96.1%) falling below the poverty line.
| Children | Single Father | Single Mother |
| No Children | 44 (3.9%) | 78 (4.9%) |
| 1 or 2 Children | 53 (5.2%) | 459 (21.9%) |
| 3 or 4 Children | 22 (15.9%) | 240 (46.2%) |
| 5 or more Children | 3 (100.0%) | 73 (96.1%) |
| Total | 122 (5.3%) | 850 (19.9%) |
Income Below Poverty Among Married-Couple vs Single-Parent Households in Washington County
The poverty data for Washington County shows that 1,762 of the married-couple family households (4.3%) and 972 of the single-parent households (14.8%) are living below the poverty level. Within the married-couple family households, those with 5 or more children have the highest poverty rate, with 185 households (16.4%) falling below the poverty line. Among the single-parent households, those with 5 or more children have the highest poverty rate, with 76 household (96.2%) living below poverty.
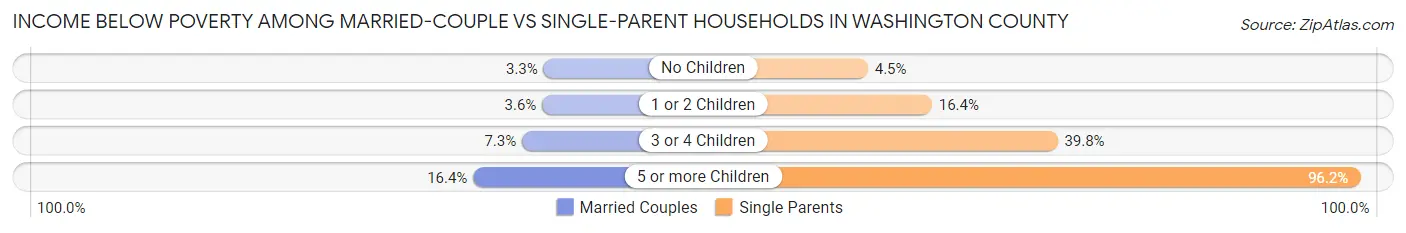
| Children | Married-Couple Families | Single-Parent Households |
| No Children | 809 (3.3%) | 122 (4.5%) |
| 1 or 2 Children | 386 (3.6%) | 512 (16.4%) |
| 3 or 4 Children | 382 (7.3%) | 262 (39.8%) |
| 5 or more Children | 185 (16.4%) | 76 (96.2%) |
| Total | 1,762 (4.3%) | 972 (14.8%) |
Employment Characteristics in Washington County
Employment by Class of Employer in Washington County
Among the 77,459 employed individuals in Washington County, private company employees (52,525 | 67.8%), self-employed (incorporated) (5,848 | 7.5%), and local government employees (5,116 | 6.6%) make up the most common classes of employment.
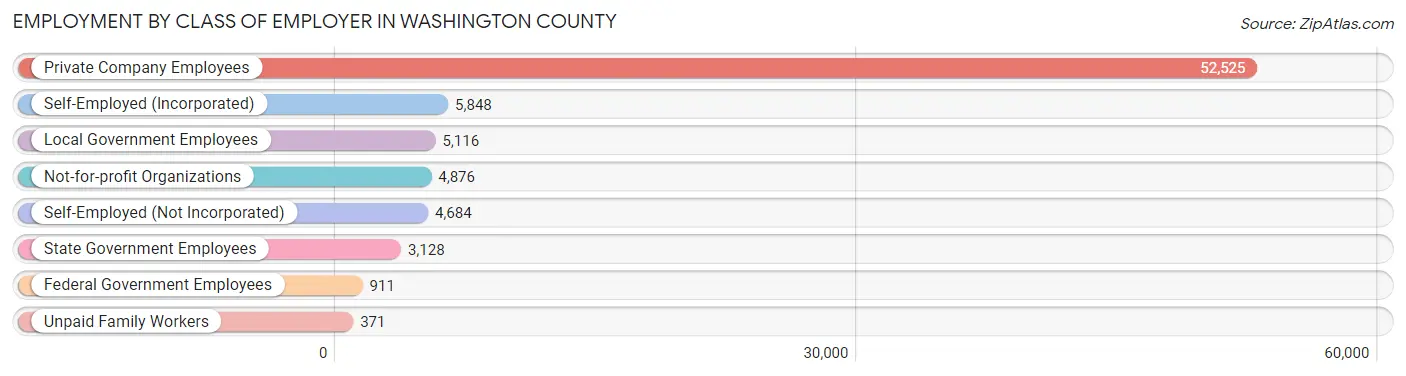
| Employer Class | # Employees | % Employees |
| Private Company Employees | 52,525 | 67.8% |
| Self-Employed (Incorporated) | 5,848 | 7.5% |
| Self-Employed (Not Incorporated) | 4,684 | 6.0% |
| Not-for-profit Organizations | 4,876 | 6.3% |
| Local Government Employees | 5,116 | 6.6% |
| State Government Employees | 3,128 | 4.0% |
| Federal Government Employees | 911 | 1.2% |
| Unpaid Family Workers | 371 | 0.5% |
| Total | 77,459 | 100.0% |
Employment Status by Age in Washington County
According to the labor force statistics for Washington County, out of the total population over 16 years of age (143,048), 56.5% or 80,822 individuals are in the labor force, with 3.1% or 2,505 of them unemployed. The age group with the highest labor force participation rate is 20 to 24 years, with 82.7% or 9,886 individuals in the labor force. Within the labor force, the 16 to 19 years age range has the highest percentage of unemployed individuals, with 9.9% or 558 of them being unemployed.
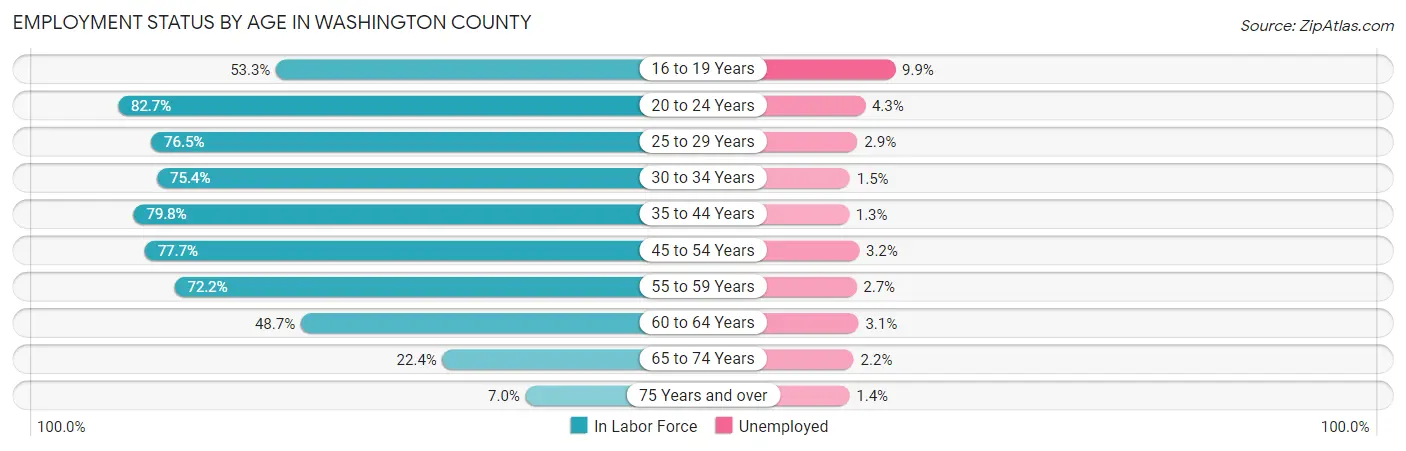
| Age Bracket | In Labor Force | Unemployed |
| 16 to 19 Years | 5,632 (53.3%) | 558 (9.9%) |
| 20 to 24 Years | 9,886 (82.7%) | 425 (4.3%) |
| 25 to 29 Years | 8,404 (76.5%) | 244 (2.9%) |
| 30 to 34 Years | 7,606 (75.4%) | 114 (1.5%) |
| 35 to 44 Years | 17,275 (79.8%) | 225 (1.3%) |
| 45 to 54 Years | 13,944 (77.7%) | 446 (3.2%) |
| 55 to 59 Years | 6,852 (72.2%) | 185 (2.7%) |
| 60 to 64 Years | 4,974 (48.7%) | 154 (3.1%) |
| 65 to 74 Years | 5,008 (22.4%) | 110 (2.2%) |
| 75 Years and over | 1,246 (7.0%) | 17 (1.4%) |
| Total | 80,822 (56.5%) | 2,505 (3.1%) |
Employment Status by Educational Attainment in Washington County
According to labor force statistics for Washington County, 73.5% of individuals (59,073) out of the total population between 25 and 64 years of age (80,372) are in the labor force, with 2.3% or 1,359 of them being unemployed. The group with the highest labor force participation rate are those with the educational attainment of bachelor's degree or higher, with 78.8% or 19,356 individuals in the labor force. Within the labor force, individuals with high school diploma education have the highest percentage of unemployment, with 5.1% or 612 of them being unemployed.
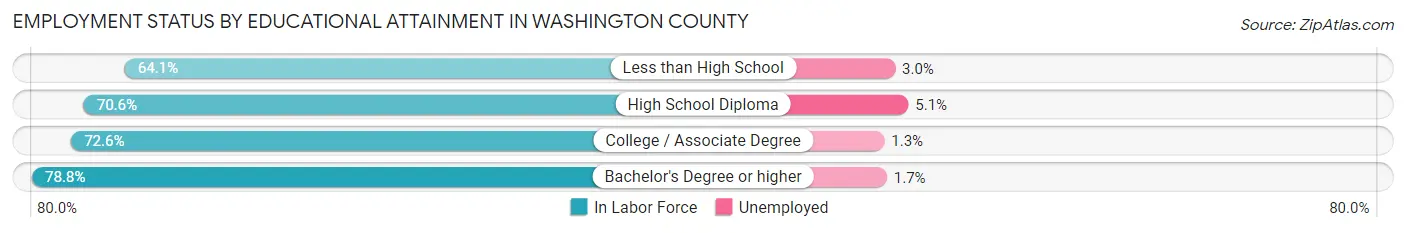
| Educational Attainment | In Labor Force | Unemployed |
| Less than High School | 3,387 (64.1%) | 159 (3.0%) |
| High School Diploma | 12,003 (70.6%) | 867 (5.1%) |
| College / Associate Degree | 24,338 (72.6%) | 436 (1.3%) |
| Bachelor's Degree or higher | 19,356 (78.8%) | 418 (1.7%) |
| Total | 59,073 (73.5%) | 1,849 (2.3%) |
Employment Occupations by Sex in Washington County
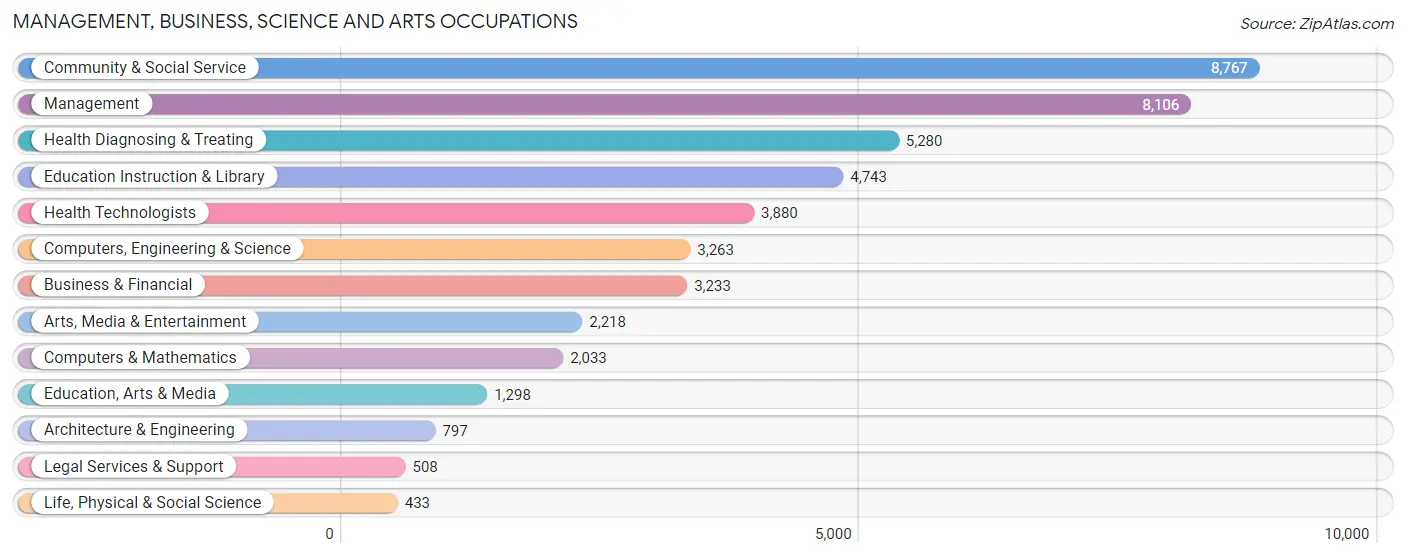
Management, Business, Science and Arts Occupations
The most common Management, Business, Science and Arts occupations in Washington County are Community & Social Service (8,767 | 11.2%), Management (8,106 | 10.3%), Health Diagnosing & Treating (5,280 | 6.7%), Education Instruction & Library (4,743 | 6.1%), and Health Technologists (3,880 | 5.0%).
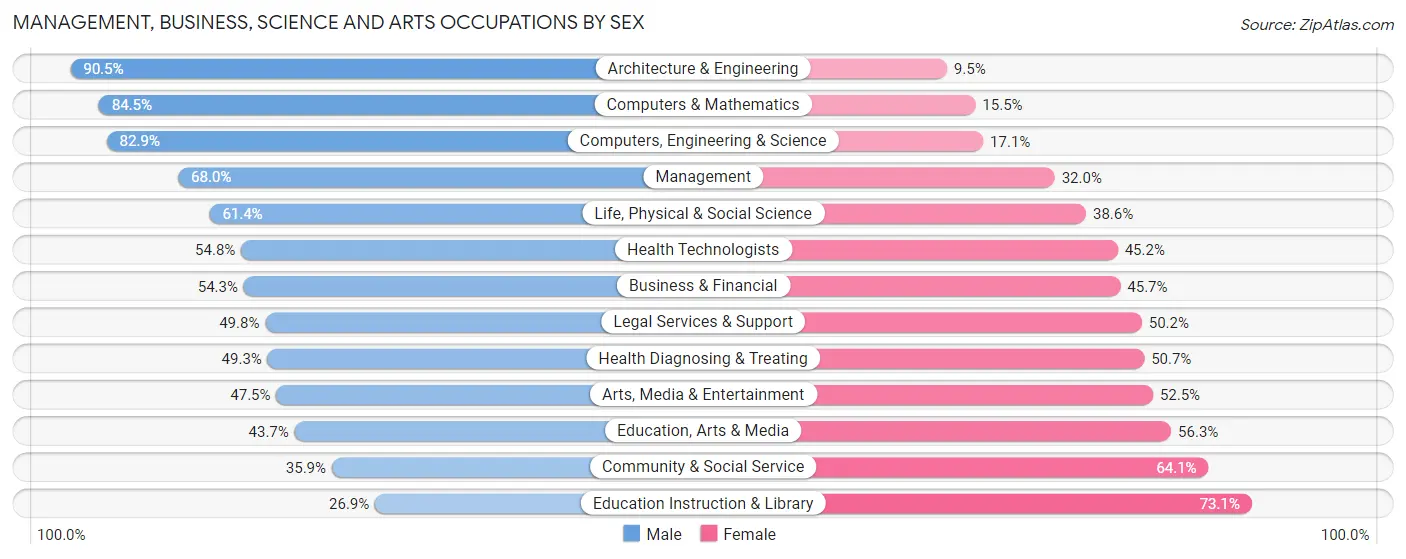
Management, Business, Science and Arts Occupations by Sex
Within the Management, Business, Science and Arts occupations in Washington County, the most male-oriented occupations are Architecture & Engineering (90.5%), Computers & Mathematics (84.5%), and Computers, Engineering & Science (82.9%), while the most female-oriented occupations are Education Instruction & Library (73.1%), Community & Social Service (64.1%), and Education, Arts & Media (56.3%).
| Occupation | Male | Female |
| Management | 5,510 (68.0%) | 2,596 (32.0%) |
| Business & Financial | 1,755 (54.3%) | 1,478 (45.7%) |
| Computers, Engineering & Science | 2,705 (82.9%) | 558 (17.1%) |
| Computers & Mathematics | 1,718 (84.5%) | 315 (15.5%) |
| Architecture & Engineering | 721 (90.5%) | 76 (9.5%) |
| Life, Physical & Social Science | 266 (61.4%) | 167 (38.6%) |
| Community & Social Service | 3,148 (35.9%) | 5,619 (64.1%) |
| Education, Arts & Media | 567 (43.7%) | 731 (56.3%) |
| Legal Services & Support | 253 (49.8%) | 255 (50.2%) |
| Education Instruction & Library | 1,275 (26.9%) | 3,468 (73.1%) |
| Arts, Media & Entertainment | 1,053 (47.5%) | 1,165 (52.5%) |
| Health Diagnosing & Treating | 2,603 (49.3%) | 2,677 (50.7%) |
| Health Technologists | 2,127 (54.8%) | 1,753 (45.2%) |
| Total (Category) | 15,721 (54.9%) | 12,928 (45.1%) |
| Total (Overall) | 43,213 (55.2%) | 35,084 (44.8%) |
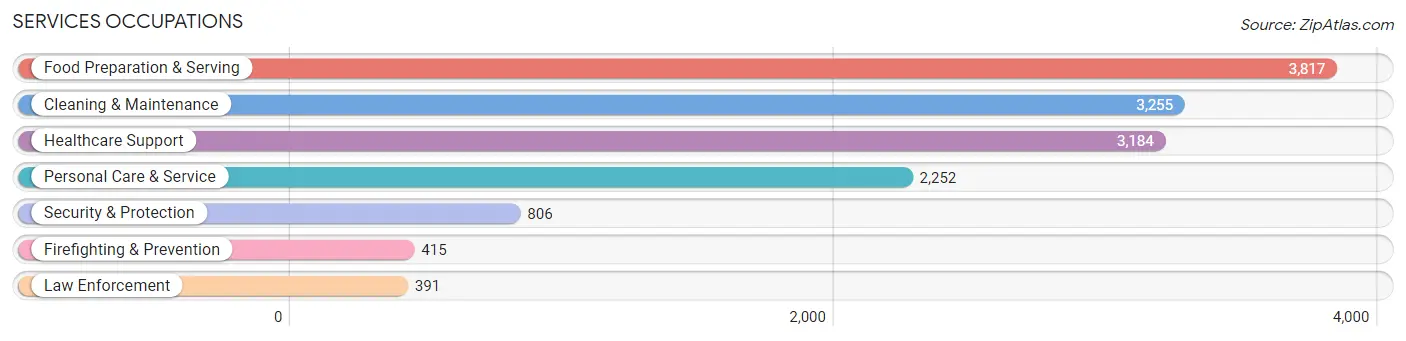
Services Occupations
The most common Services occupations in Washington County are Food Preparation & Serving (3,817 | 4.9%), Cleaning & Maintenance (3,255 | 4.2%), Healthcare Support (3,184 | 4.1%), Personal Care & Service (2,252 | 2.9%), and Security & Protection (806 | 1.0%).
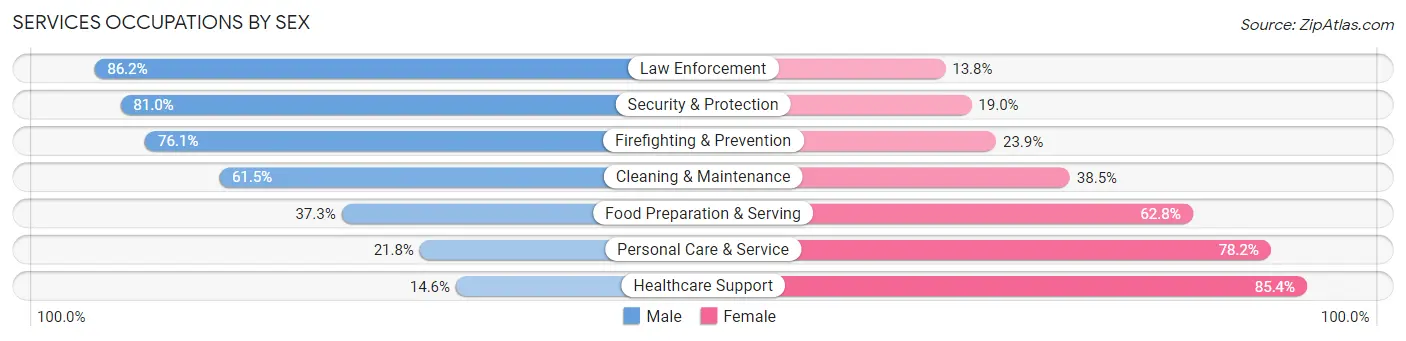
Services Occupations by Sex
Within the Services occupations in Washington County, the most male-oriented occupations are Law Enforcement (86.2%), Security & Protection (81.0%), and Firefighting & Prevention (76.1%), while the most female-oriented occupations are Healthcare Support (85.4%), Personal Care & Service (78.2%), and Food Preparation & Serving (62.7%).
| Occupation | Male | Female |
| Healthcare Support | 465 (14.6%) | 2,719 (85.4%) |
| Security & Protection | 653 (81.0%) | 153 (19.0%) |
| Firefighting & Prevention | 316 (76.1%) | 99 (23.9%) |
| Law Enforcement | 337 (86.2%) | 54 (13.8%) |
| Food Preparation & Serving | 1,422 (37.2%) | 2,395 (62.7%) |
| Cleaning & Maintenance | 2,002 (61.5%) | 1,253 (38.5%) |
| Personal Care & Service | 490 (21.8%) | 1,762 (78.2%) |
| Total (Category) | 5,032 (37.8%) | 8,282 (62.2%) |
| Total (Overall) | 43,213 (55.2%) | 35,084 (44.8%) |
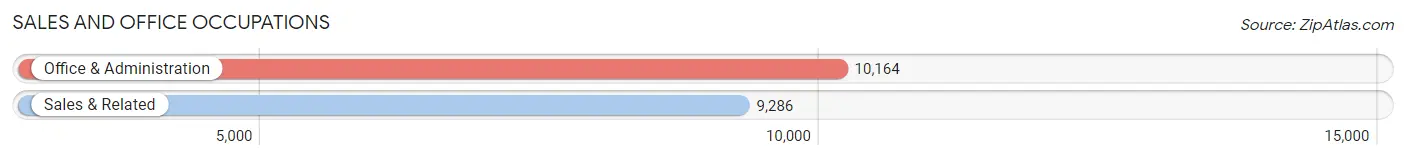
Sales and Office Occupations
The most common Sales and Office occupations in Washington County are Office & Administration (10,164 | 13.0%), and Sales & Related (9,286 | 11.9%).
Sales and Office Occupations by Sex
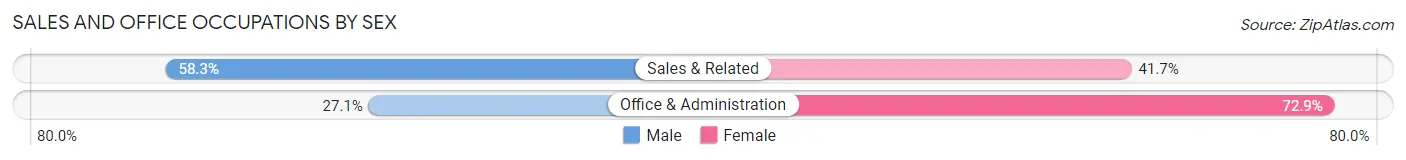
| Occupation | Male | Female |
| Sales & Related | 5,415 (58.3%) | 3,871 (41.7%) |
| Office & Administration | 2,751 (27.1%) | 7,413 (72.9%) |
| Total (Category) | 8,166 (42.0%) | 11,284 (58.0%) |
| Total (Overall) | 43,213 (55.2%) | 35,084 (44.8%) |
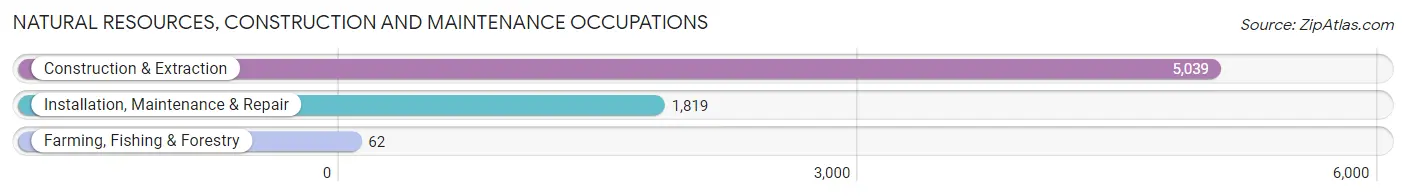
Natural Resources, Construction and Maintenance Occupations
The most common Natural Resources, Construction and Maintenance occupations in Washington County are Construction & Extraction (5,039 | 6.4%), Installation, Maintenance & Repair (1,819 | 2.3%), and Farming, Fishing & Forestry (62 | 0.1%).
Natural Resources, Construction and Maintenance Occupations by Sex
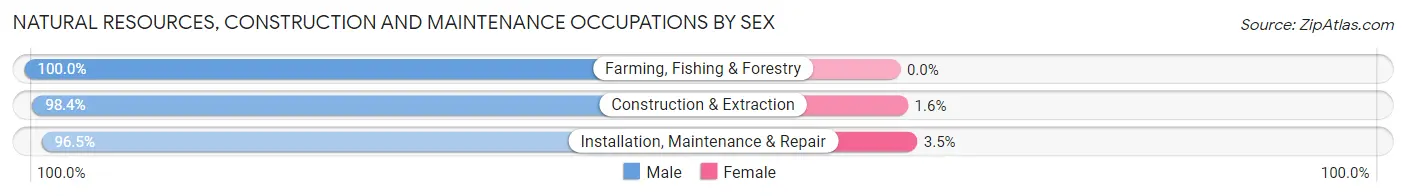
| Occupation | Male | Female |
| Farming, Fishing & Forestry | 62 (100.0%) | 0 (0.0%) |
| Construction & Extraction | 4,958 (98.4%) | 81 (1.6%) |
| Installation, Maintenance & Repair | 1,755 (96.5%) | 64 (3.5%) |
| Total (Category) | 6,775 (97.9%) | 145 (2.1%) |
| Total (Overall) | 43,213 (55.2%) | 35,084 (44.8%) |
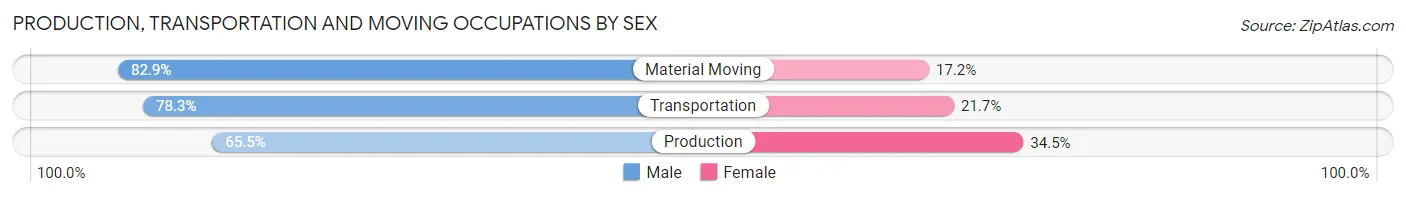
Production, Transportation and Moving Occupations
The most common Production, Transportation and Moving occupations in Washington County are Material Moving (3,563 | 4.5%), Production (3,475 | 4.4%), and Transportation (2,926 | 3.7%).

Production, Transportation and Moving Occupations by Sex
| Occupation | Male | Female |
| Production | 2,277 (65.5%) | 1,198 (34.5%) |
| Transportation | 2,290 (78.3%) | 636 (21.7%) |
| Material Moving | 2,952 (82.9%) | 611 (17.2%) |
| Total (Category) | 7,519 (75.5%) | 2,445 (24.5%) |
| Total (Overall) | 43,213 (55.2%) | 35,084 (44.8%) |
Employment Industries by Sex in Washington County
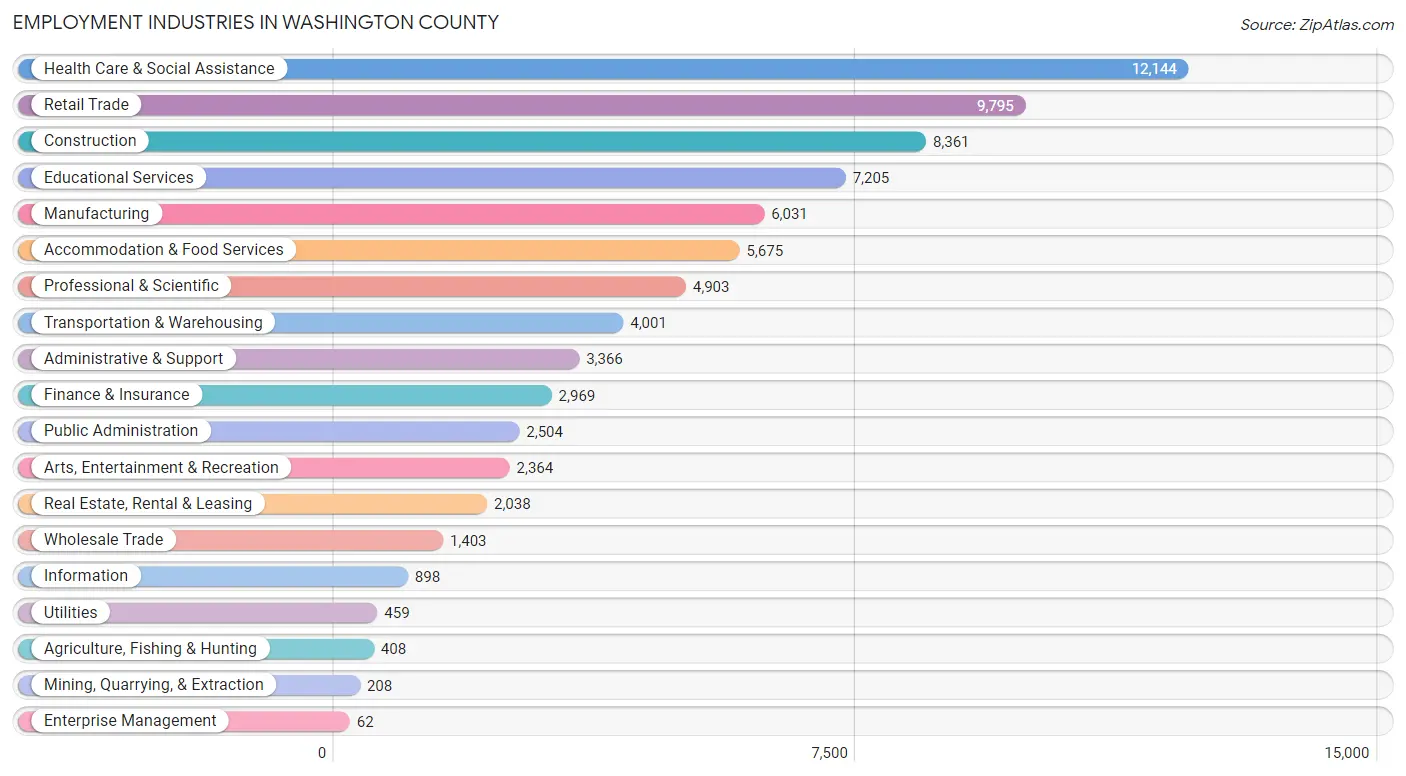
Employment Industries in Washington County
The major employment industries in Washington County include Health Care & Social Assistance (12,144 | 15.5%), Retail Trade (9,795 | 12.5%), Construction (8,361 | 10.7%), Educational Services (7,205 | 9.2%), and Manufacturing (6,031 | 7.7%).
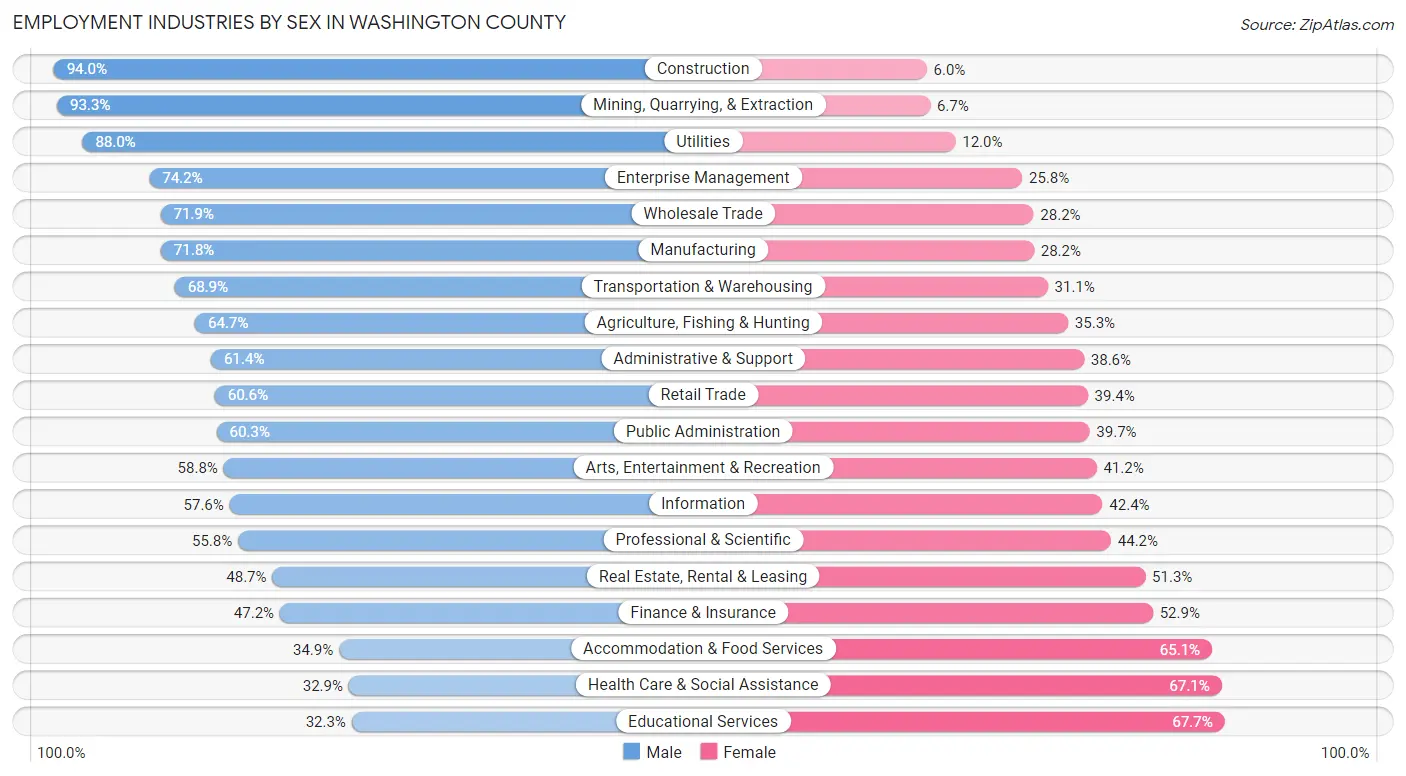
Employment Industries by Sex in Washington County
The Washington County industries that see more men than women are Construction (94.0%), Mining, Quarrying, & Extraction (93.3%), and Utilities (88.0%), whereas the industries that tend to have a higher number of women are Educational Services (67.7%), Health Care & Social Assistance (67.1%), and Accommodation & Food Services (65.1%).
| Industry | Male | Female |
| Agriculture, Fishing & Hunting | 264 (64.7%) | 144 (35.3%) |
| Mining, Quarrying, & Extraction | 194 (93.3%) | 14 (6.7%) |
| Construction | 7,856 (94.0%) | 505 (6.0%) |
| Manufacturing | 4,329 (71.8%) | 1,702 (28.2%) |
| Wholesale Trade | 1,008 (71.9%) | 395 (28.1%) |
| Retail Trade | 5,939 (60.6%) | 3,856 (39.4%) |
| Transportation & Warehousing | 2,757 (68.9%) | 1,244 (31.1%) |
| Utilities | 404 (88.0%) | 55 (12.0%) |
| Information | 517 (57.6%) | 381 (42.4%) |
| Finance & Insurance | 1,400 (47.1%) | 1,569 (52.8%) |
| Real Estate, Rental & Leasing | 993 (48.7%) | 1,045 (51.3%) |
| Professional & Scientific | 2,737 (55.8%) | 2,166 (44.2%) |
| Enterprise Management | 46 (74.2%) | 16 (25.8%) |
| Administrative & Support | 2,067 (61.4%) | 1,299 (38.6%) |
| Educational Services | 2,327 (32.3%) | 4,878 (67.7%) |
| Health Care & Social Assistance | 3,995 (32.9%) | 8,149 (67.1%) |
| Arts, Entertainment & Recreation | 1,390 (58.8%) | 974 (41.2%) |
| Accommodation & Food Services | 1,981 (34.9%) | 3,694 (65.1%) |
| Public Administration | 1,509 (60.3%) | 995 (39.7%) |
| Total | 43,213 (55.2%) | 35,084 (44.8%) |
Education in Washington County
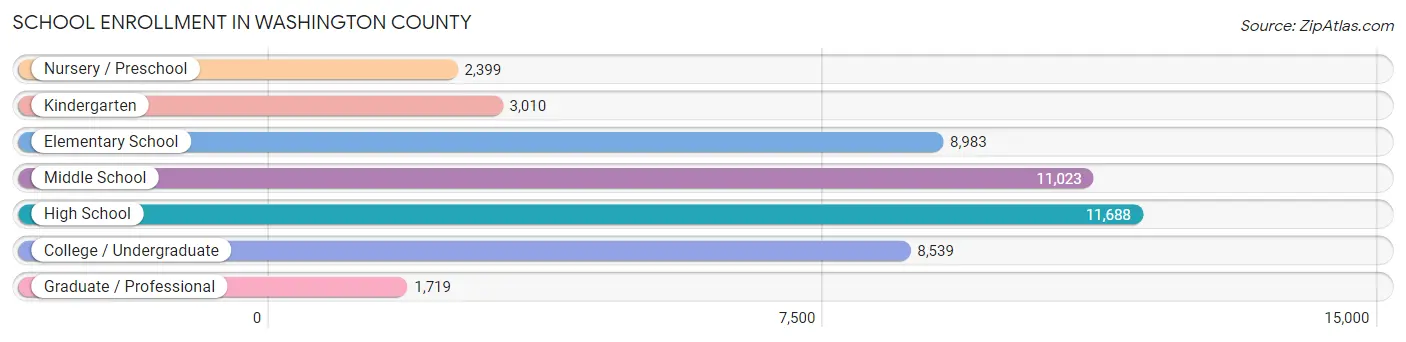
School Enrollment in Washington County
The most common levels of schooling among the 47,361 students in Washington County are high school (11,688 | 24.7%), middle school (11,023 | 23.3%), and elementary school (8,983 | 19.0%).
| School Level | # Students | % Students |
| Nursery / Preschool | 2,399 | 5.1% |
| Kindergarten | 3,010 | 6.4% |
| Elementary School | 8,983 | 19.0% |
| Middle School | 11,023 | 23.3% |
| High School | 11,688 | 24.7% |
| College / Undergraduate | 8,539 | 18.0% |
| Graduate / Professional | 1,719 | 3.6% |
| Total | 47,361 | 100.0% |
School Enrollment by Age by Funding Source in Washington County
Out of a total of 47,361 students who are enrolled in schools in Washington County, 5,162 (10.9%) attend a private institution, while the remaining 42,199 (89.1%) are enrolled in public schools. The age group of 3 to 4 year olds has the highest likelihood of being enrolled in private schools, with 651 (38.3% in the age bracket) enrolled. Conversely, the age group of 10 to 14 year olds has the lowest likelihood of being enrolled in a private school, with 12,730 (95.1% in the age bracket) attending a public institution.
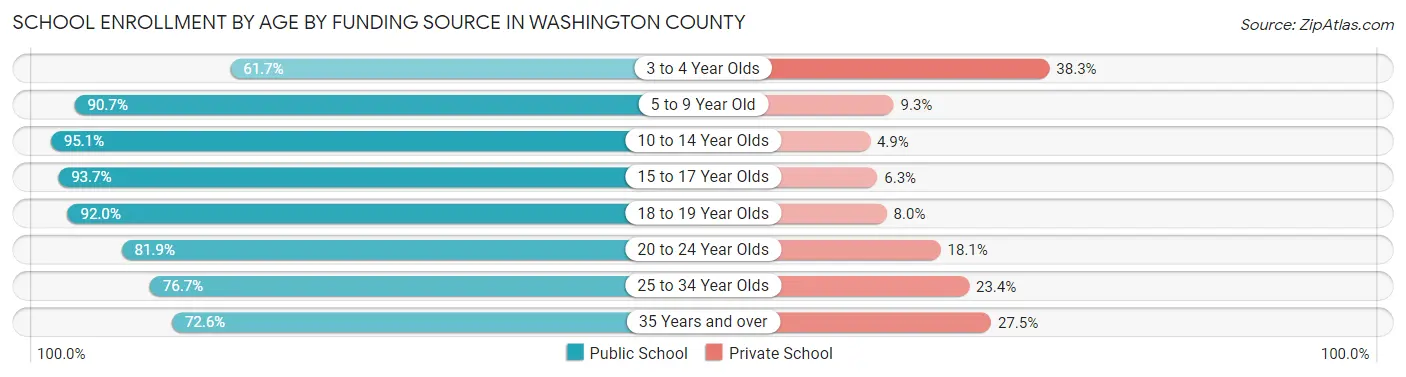
| Age Bracket | Public School | Private School |
| 3 to 4 Year Olds | 1,048 (61.7%) | 651 (38.3%) |
| 5 to 9 Year Old | 10,830 (90.7%) | 1,110 (9.3%) |
| 10 to 14 Year Olds | 12,730 (95.1%) | 654 (4.9%) |
| 15 to 17 Year Olds | 7,503 (93.7%) | 502 (6.3%) |
| 18 to 19 Year Olds | 3,263 (92.0%) | 284 (8.0%) |
| 20 to 24 Year Olds | 3,086 (81.9%) | 680 (18.1%) |
| 25 to 34 Year Olds | 1,907 (76.6%) | 581 (23.4%) |
| 35 Years and over | 1,837 (72.6%) | 695 (27.5%) |
| Total | 42,199 (89.1%) | 5,162 (10.9%) |
Educational Attainment by Field of Study in Washington County
Business (8,779 | 20.5%), education (7,141 | 16.7%), science & technology (4,436 | 10.4%), social sciences (3,073 | 7.2%), and arts & humanities (2,971 | 7.0%) are the most common fields of study among 42,774 individuals in Washington County who have obtained a bachelor's degree or higher.
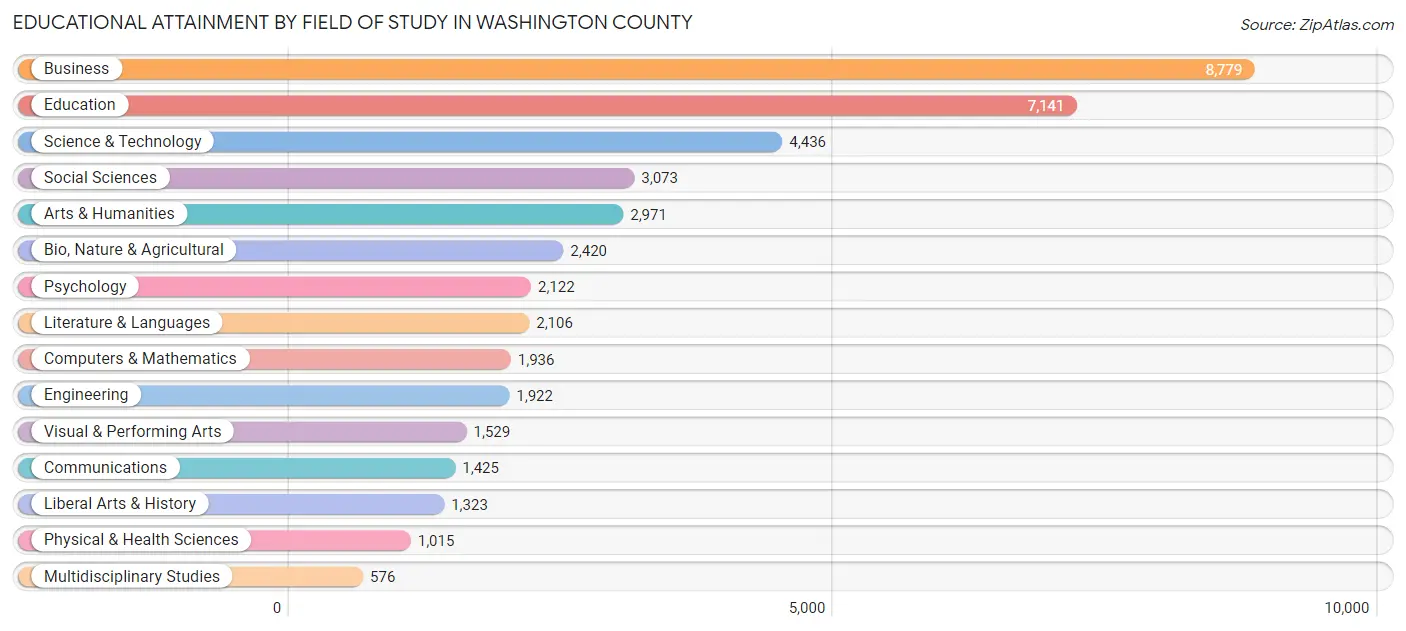
| Field of Study | # Graduates | % Graduates |
| Computers & Mathematics | 1,936 | 4.5% |
| Bio, Nature & Agricultural | 2,420 | 5.7% |
| Physical & Health Sciences | 1,015 | 2.4% |
| Psychology | 2,122 | 5.0% |
| Social Sciences | 3,073 | 7.2% |
| Engineering | 1,922 | 4.5% |
| Multidisciplinary Studies | 576 | 1.3% |
| Science & Technology | 4,436 | 10.4% |
| Business | 8,779 | 20.5% |
| Education | 7,141 | 16.7% |
| Literature & Languages | 2,106 | 4.9% |
| Liberal Arts & History | 1,323 | 3.1% |
| Visual & Performing Arts | 1,529 | 3.6% |
| Communications | 1,425 | 3.3% |
| Arts & Humanities | 2,971 | 7.0% |
| Total | 42,774 | 100.0% |
Transportation & Commute in Washington County
Vehicle Availability by Sex in Washington County
The most prevalent vehicle ownership categories in Washington County are males with 2 vehicles (16,324, accounting for 38.3%) and females with 2 vehicles (12,864, making up 47.2%).
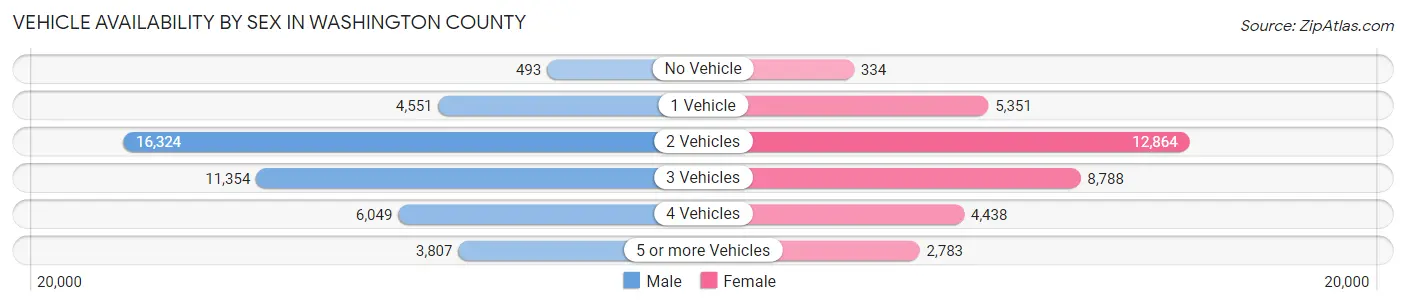
| Vehicles Available | Male | Female |
| No Vehicle | 493 (1.2%) | 334 (1.0%) |
| 1 Vehicle | 4,551 (10.7%) | 5,351 (15.5%) |
| 2 Vehicles | 16,324 (38.3%) | 12,864 (37.2%) |
| 3 Vehicles | 11,354 (26.7%) | 8,788 (25.4%) |
| 4 Vehicles | 6,049 (14.2%) | 4,438 (12.8%) |
| 5 or more Vehicles | 3,807 (8.9%) | 2,783 (8.1%) |
| Total | 42,578 (100.0%) | 34,558 (100.0%) |
Commute Time in Washington County
The most frequently occuring commute durations in Washington County are 10 to 14 minutes (15,165 commuters, 22.6%), 15 to 19 minutes (14,210 commuters, 21.2%), and 5 to 9 minutes (10,838 commuters, 16.2%).
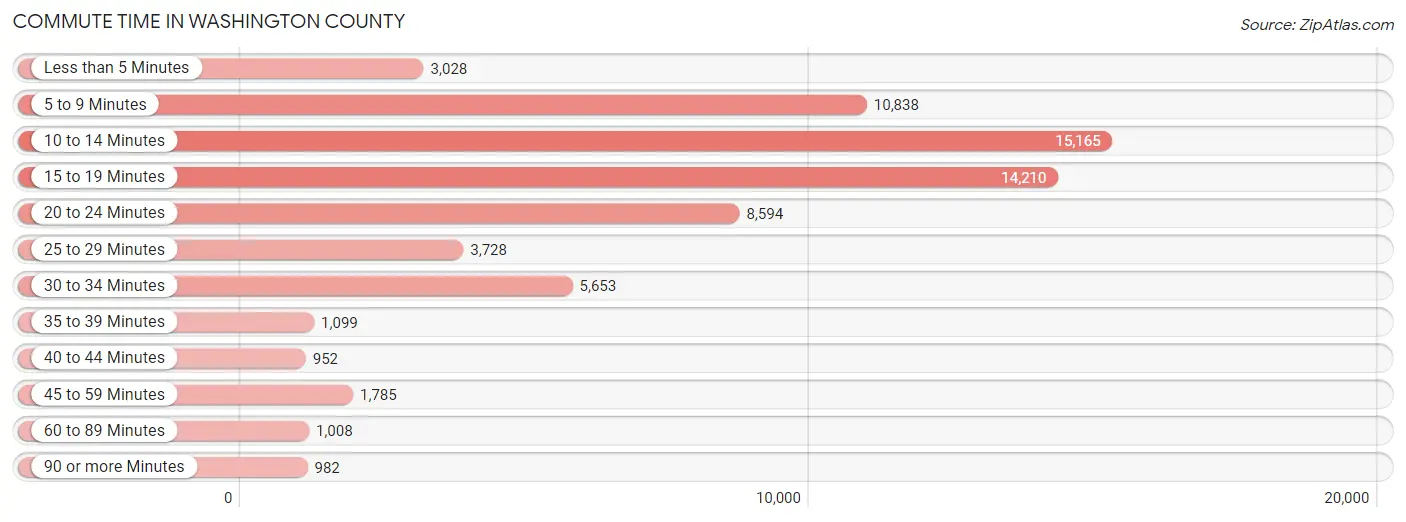
| Commute Time | # Commuters | % Commuters |
| Less than 5 Minutes | 3,028 | 4.5% |
| 5 to 9 Minutes | 10,838 | 16.2% |
| 10 to 14 Minutes | 15,165 | 22.6% |
| 15 to 19 Minutes | 14,210 | 21.2% |
| 20 to 24 Minutes | 8,594 | 12.8% |
| 25 to 29 Minutes | 3,728 | 5.6% |
| 30 to 34 Minutes | 5,653 | 8.4% |
| 35 to 39 Minutes | 1,099 | 1.6% |
| 40 to 44 Minutes | 952 | 1.4% |
| 45 to 59 Minutes | 1,785 | 2.7% |
| 60 to 89 Minutes | 1,008 | 1.5% |
| 90 or more Minutes | 982 | 1.5% |
Commute Time by Sex in Washington County
The most common commute times in Washington County are 15 to 19 minutes (8,473 commuters, 22.5%) for males and 10 to 14 minutes (7,310 commuters, 24.9%) for females.
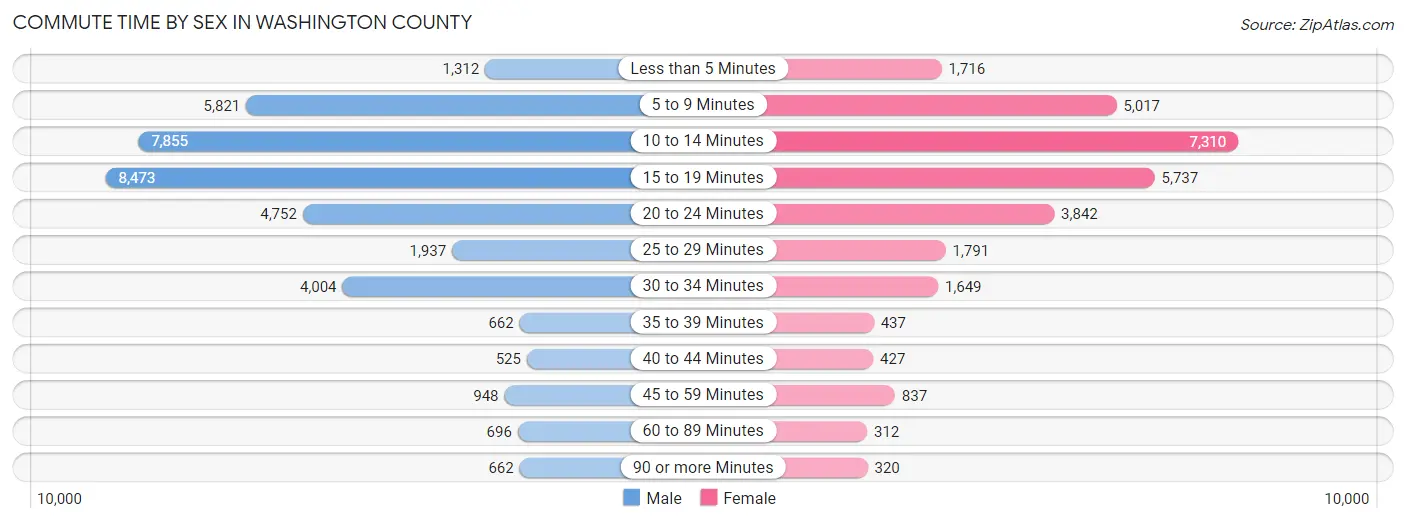
| Commute Time | Male | Female |
| Less than 5 Minutes | 1,312 (3.5%) | 1,716 (5.8%) |
| 5 to 9 Minutes | 5,821 (15.5%) | 5,017 (17.1%) |
| 10 to 14 Minutes | 7,855 (20.9%) | 7,310 (24.9%) |
| 15 to 19 Minutes | 8,473 (22.5%) | 5,737 (19.5%) |
| 20 to 24 Minutes | 4,752 (12.6%) | 3,842 (13.1%) |
| 25 to 29 Minutes | 1,937 (5.1%) | 1,791 (6.1%) |
| 30 to 34 Minutes | 4,004 (10.6%) | 1,649 (5.6%) |
| 35 to 39 Minutes | 662 (1.8%) | 437 (1.5%) |
| 40 to 44 Minutes | 525 (1.4%) | 427 (1.5%) |
| 45 to 59 Minutes | 948 (2.5%) | 837 (2.9%) |
| 60 to 89 Minutes | 696 (1.8%) | 312 (1.1%) |
| 90 or more Minutes | 662 (1.8%) | 320 (1.1%) |
Time of Departure to Work by Sex in Washington County
The most frequent times of departure to work in Washington County are 7:00 AM to 7:29 AM (5,431, 14.4%) for males and 8:00 AM to 8:29 AM (4,500, 15.3%) for females.
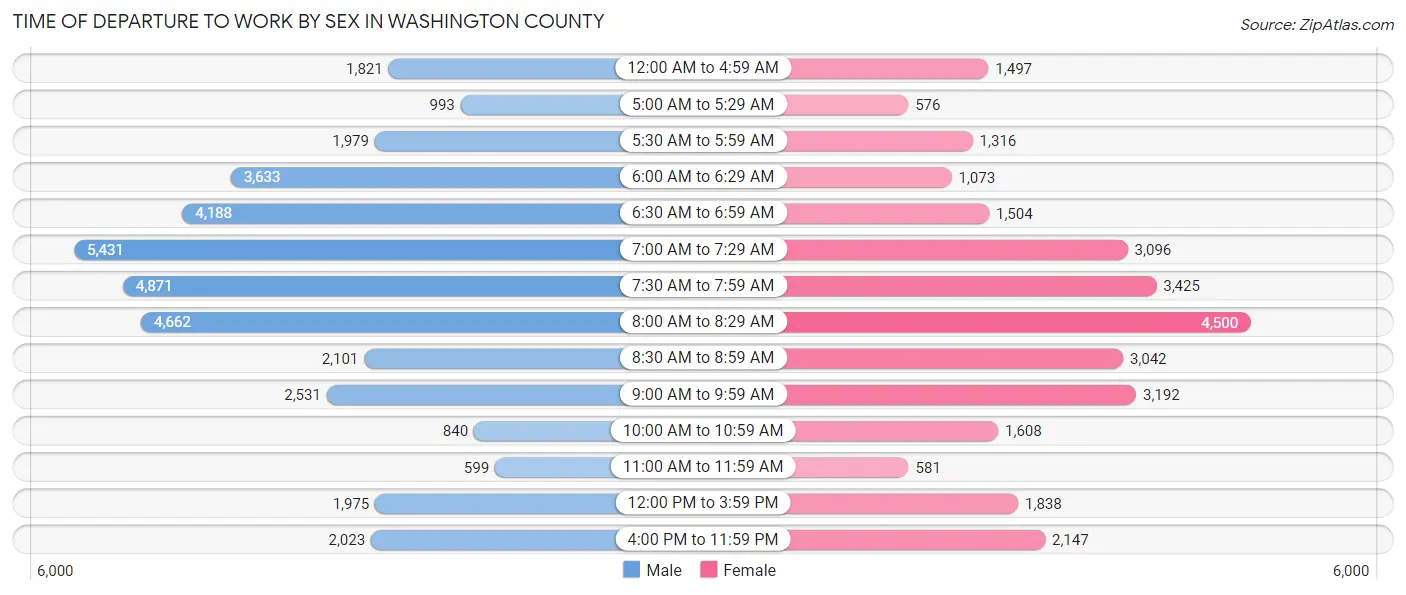
| Time of Departure | Male | Female |
| 12:00 AM to 4:59 AM | 1,821 (4.8%) | 1,497 (5.1%) |
| 5:00 AM to 5:29 AM | 993 (2.6%) | 576 (2.0%) |
| 5:30 AM to 5:59 AM | 1,979 (5.3%) | 1,316 (4.5%) |
| 6:00 AM to 6:29 AM | 3,633 (9.7%) | 1,073 (3.6%) |
| 6:30 AM to 6:59 AM | 4,188 (11.1%) | 1,504 (5.1%) |
| 7:00 AM to 7:29 AM | 5,431 (14.4%) | 3,096 (10.5%) |
| 7:30 AM to 7:59 AM | 4,871 (12.9%) | 3,425 (11.7%) |
| 8:00 AM to 8:29 AM | 4,662 (12.4%) | 4,500 (15.3%) |
| 8:30 AM to 8:59 AM | 2,101 (5.6%) | 3,042 (10.3%) |
| 9:00 AM to 9:59 AM | 2,531 (6.7%) | 3,192 (10.9%) |
| 10:00 AM to 10:59 AM | 840 (2.2%) | 1,608 (5.5%) |
| 11:00 AM to 11:59 AM | 599 (1.6%) | 581 (2.0%) |
| 12:00 PM to 3:59 PM | 1,975 (5.2%) | 1,838 (6.2%) |
| 4:00 PM to 11:59 PM | 2,023 (5.4%) | 2,147 (7.3%) |
| Total | 37,647 (100.0%) | 29,395 (100.0%) |
Housing Occupancy in Washington County
Occupancy by Ownership in Washington County
Of the total 64,151 dwellings in Washington County, owner-occupied units account for 46,477 (72.5%), while renter-occupied units make up 17,674 (27.6%).
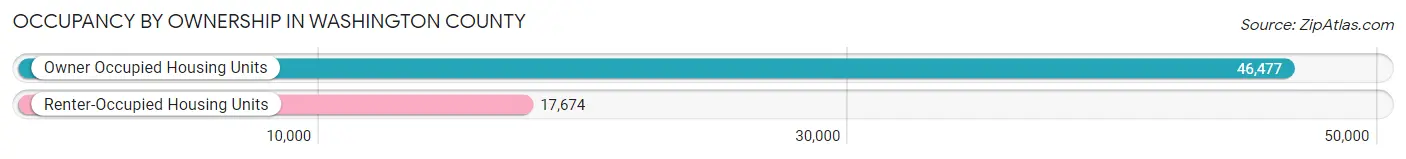
| Occupancy | # Housing Units | % Housing Units |
| Owner Occupied Housing Units | 46,477 | 72.5% |
| Renter-Occupied Housing Units | 17,674 | 27.6% |
| Total Occupied Housing Units | 64,151 | 100.0% |
Occupancy by Household Size in Washington County
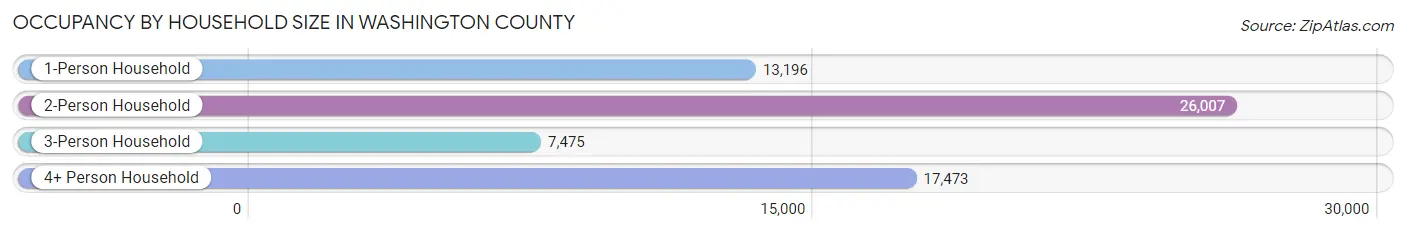
| Household Size | # Housing Units | % Housing Units |
| 1-Person Household | 13,196 | 20.6% |
| 2-Person Household | 26,007 | 40.5% |
| 3-Person Household | 7,475 | 11.7% |
| 4+ Person Household | 17,473 | 27.2% |
| Total Housing Units | 64,151 | 100.0% |
Occupancy by Ownership by Household Size in Washington County
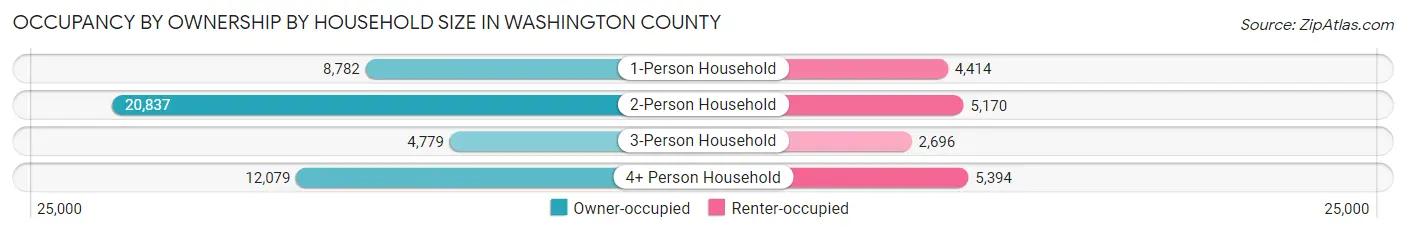
| Household Size | Owner-occupied | Renter-occupied |
| 1-Person Household | 8,782 (66.5%) | 4,414 (33.5%) |
| 2-Person Household | 20,837 (80.1%) | 5,170 (19.9%) |
| 3-Person Household | 4,779 (63.9%) | 2,696 (36.1%) |
| 4+ Person Household | 12,079 (69.1%) | 5,394 (30.9%) |
| Total Housing Units | 46,477 (72.5%) | 17,674 (27.6%) |
Occupancy by Educational Attainment in Washington County
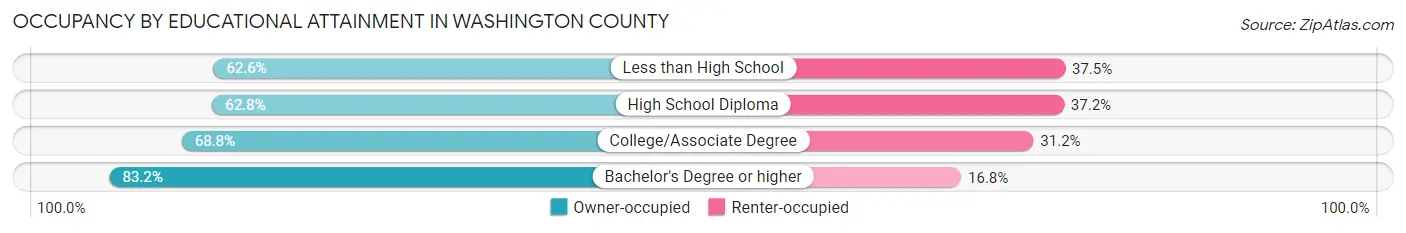
| Household Size | Owner-occupied | Renter-occupied |
| Less than High School | 1,625 (62.5%) | 973 (37.4%) |
| High School Diploma | 7,298 (62.8%) | 4,326 (37.2%) |
| College/Associate Degree | 19,032 (68.8%) | 8,623 (31.2%) |
| Bachelor's Degree or higher | 18,522 (83.2%) | 3,752 (16.8%) |
Occupancy by Age of Householder in Washington County
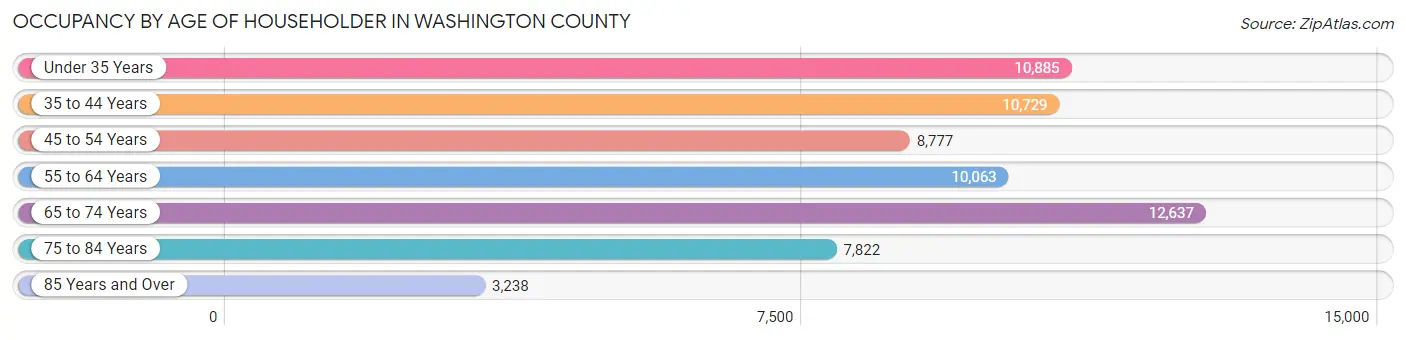
| Age Bracket | # Households | % Households |
| Under 35 Years | 10,885 | 17.0% |
| 35 to 44 Years | 10,729 | 16.7% |
| 45 to 54 Years | 8,777 | 13.7% |
| 55 to 64 Years | 10,063 | 15.7% |
| 65 to 74 Years | 12,637 | 19.7% |
| 75 to 84 Years | 7,822 | 12.2% |
| 85 Years and Over | 3,238 | 5.1% |
| Total | 64,151 | 100.0% |
Housing Finances in Washington County
Median Income by Occupancy in Washington County
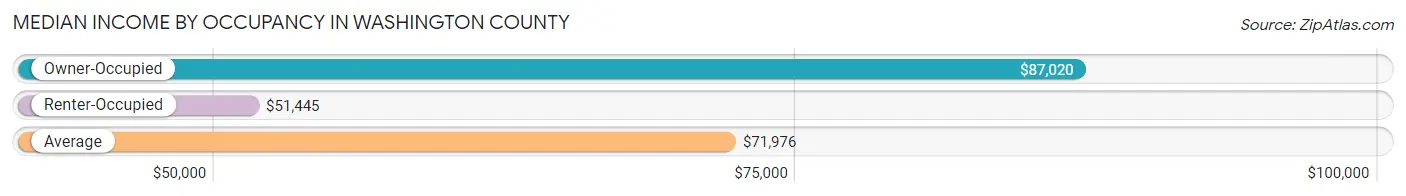
| Occupancy Type | # Households | Median Income |
| Owner-Occupied | 46,477 (72.5%) | $87,020 |
| Renter-Occupied | 17,674 (27.6%) | $51,445 |
| Average | 64,151 (100.0%) | $71,976 |
Occupancy by Householder Income Bracket in Washington County
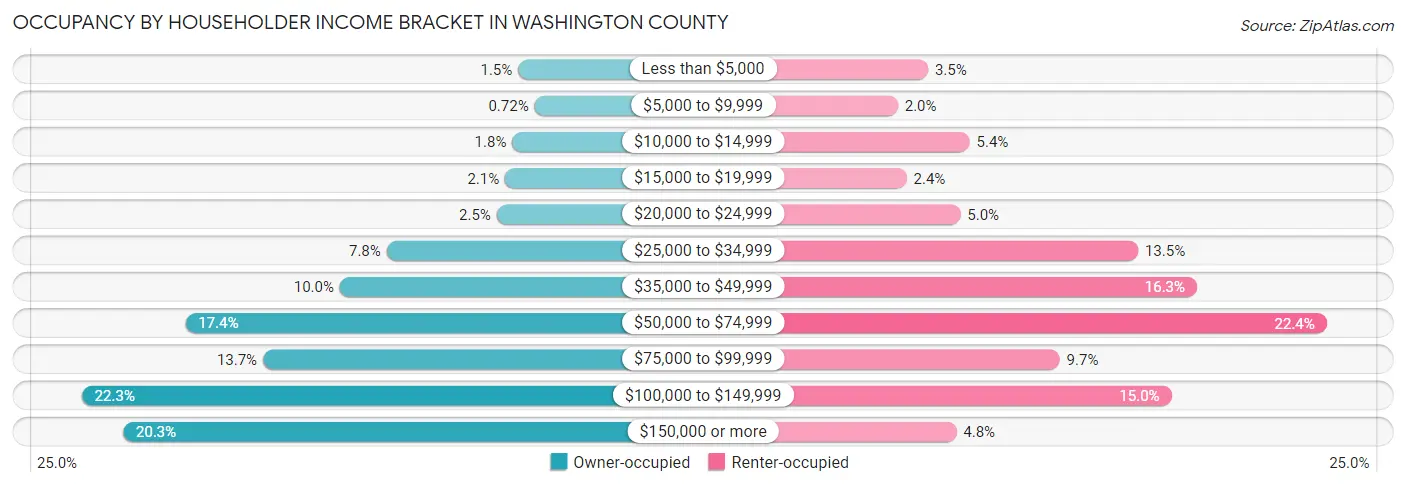
| Income Bracket | Owner-occupied | Renter-occupied |
| Less than $5,000 | 695 (1.5%) | 609 (3.5%) |
| $5,000 to $9,999 | 336 (0.7%) | 355 (2.0%) |
| $10,000 to $14,999 | 829 (1.8%) | 960 (5.4%) |
| $15,000 to $19,999 | 983 (2.1%) | 430 (2.4%) |
| $20,000 to $24,999 | 1,169 (2.5%) | 882 (5.0%) |
| $25,000 to $34,999 | 3,607 (7.8%) | 2,377 (13.5%) |
| $35,000 to $49,999 | 4,644 (10.0%) | 2,872 (16.3%) |
| $50,000 to $74,999 | 8,066 (17.3%) | 3,964 (22.4%) |
| $75,000 to $99,999 | 6,344 (13.7%) | 1,718 (9.7%) |
| $100,000 to $149,999 | 10,361 (22.3%) | 2,659 (15.0%) |
| $150,000 or more | 9,443 (20.3%) | 848 (4.8%) |
| Total | 46,477 (100.0%) | 17,674 (100.0%) |
Monthly Housing Cost Tiers in Washington County
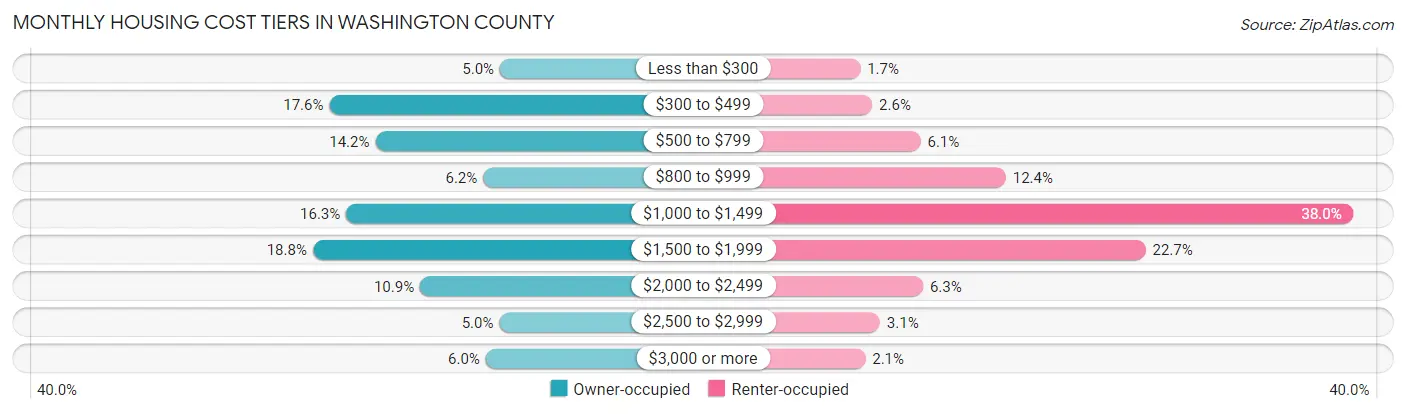
| Monthly Cost | Owner-occupied | Renter-occupied |
| Less than $300 | 2,318 (5.0%) | 297 (1.7%) |
| $300 to $499 | 8,163 (17.6%) | 452 (2.6%) |
| $500 to $799 | 6,587 (14.2%) | 1,082 (6.1%) |
| $800 to $999 | 2,896 (6.2%) | 2,192 (12.4%) |
| $1,000 to $1,499 | 7,583 (16.3%) | 6,718 (38.0%) |
| $1,500 to $1,999 | 8,727 (18.8%) | 4,010 (22.7%) |
| $2,000 to $2,499 | 5,056 (10.9%) | 1,114 (6.3%) |
| $2,500 to $2,999 | 2,342 (5.0%) | 553 (3.1%) |
| $3,000 or more | 2,805 (6.0%) | 363 (2.1%) |
| Total | 46,477 (100.0%) | 17,674 (100.0%) |
Physical Housing Characteristics in Washington County
Housing Structures in Washington County
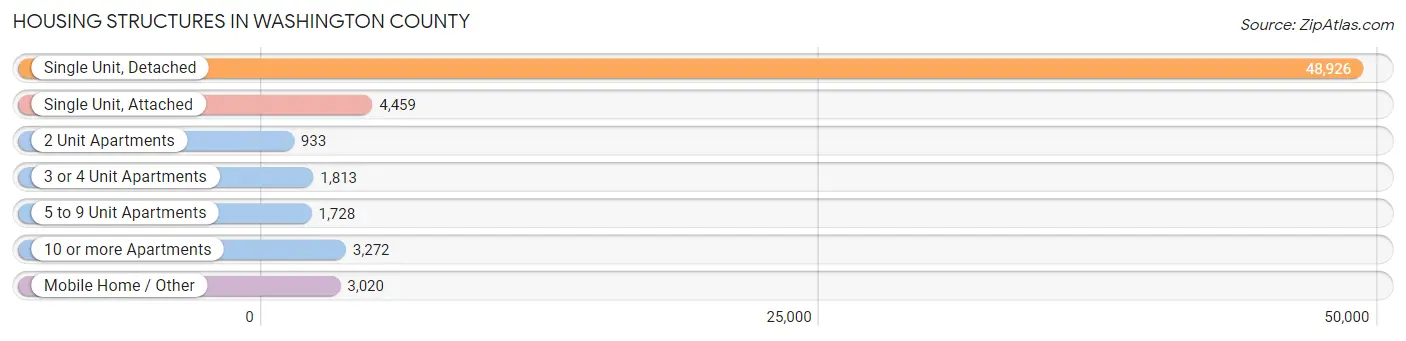
| Structure Type | # Housing Units | % Housing Units |
| Single Unit, Detached | 48,926 | 76.3% |
| Single Unit, Attached | 4,459 | 7.0% |
| 2 Unit Apartments | 933 | 1.5% |
| 3 or 4 Unit Apartments | 1,813 | 2.8% |
| 5 to 9 Unit Apartments | 1,728 | 2.7% |
| 10 or more Apartments | 3,272 | 5.1% |
| Mobile Home / Other | 3,020 | 4.7% |
| Total | 64,151 | 100.0% |
Housing Structures by Occupancy in Washington County
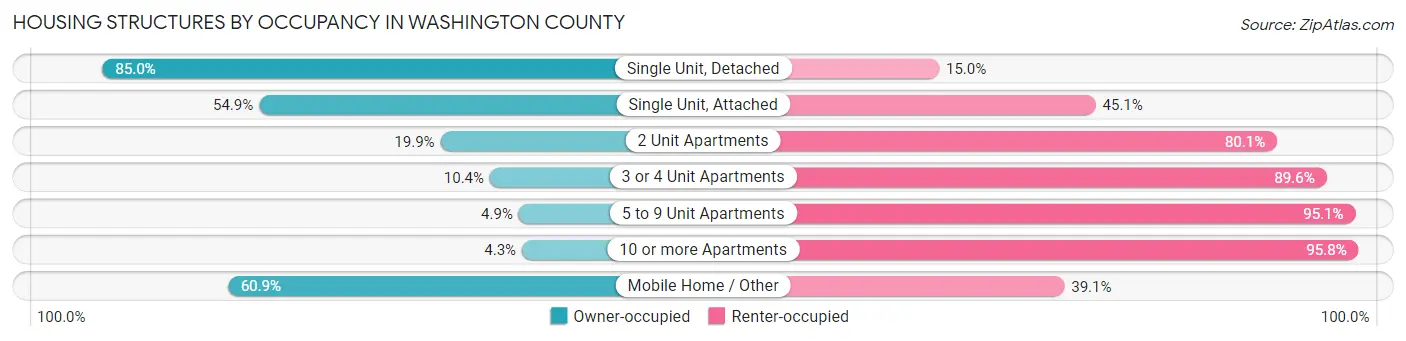
| Structure Type | Owner-occupied | Renter-occupied |
| Single Unit, Detached | 41,594 (85.0%) | 7,332 (15.0%) |
| Single Unit, Attached | 2,446 (54.9%) | 2,013 (45.1%) |
| 2 Unit Apartments | 186 (19.9%) | 747 (80.1%) |
| 3 or 4 Unit Apartments | 189 (10.4%) | 1,624 (89.6%) |
| 5 to 9 Unit Apartments | 84 (4.9%) | 1,644 (95.1%) |
| 10 or more Apartments | 139 (4.3%) | 3,133 (95.8%) |
| Mobile Home / Other | 1,839 (60.9%) | 1,181 (39.1%) |
| Total | 46,477 (72.5%) | 17,674 (27.6%) |
Housing Structures by Number of Rooms in Washington County
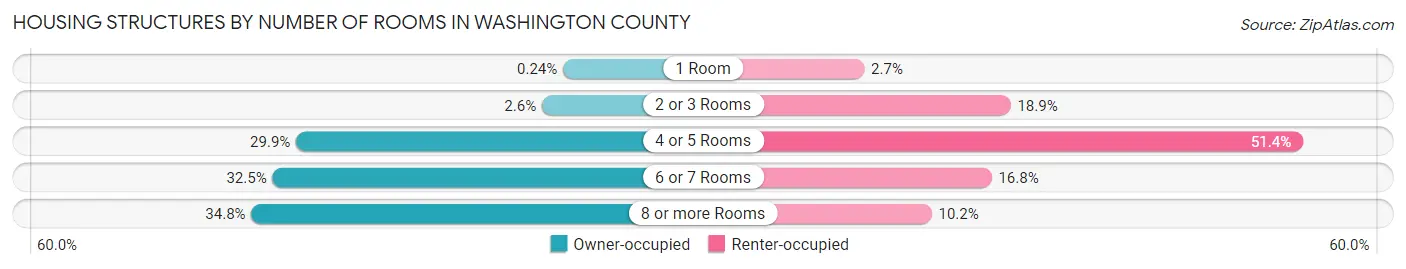
| Number of Rooms | Owner-occupied | Renter-occupied |
| 1 Room | 110 (0.2%) | 476 (2.7%) |
| 2 or 3 Rooms | 1,201 (2.6%) | 3,345 (18.9%) |
| 4 or 5 Rooms | 13,878 (29.9%) | 9,083 (51.4%) |
| 6 or 7 Rooms | 15,100 (32.5%) | 2,972 (16.8%) |
| 8 or more Rooms | 16,188 (34.8%) | 1,798 (10.2%) |
| Total | 46,477 (100.0%) | 17,674 (100.0%) |
Housing Structure by Heating Type in Washington County
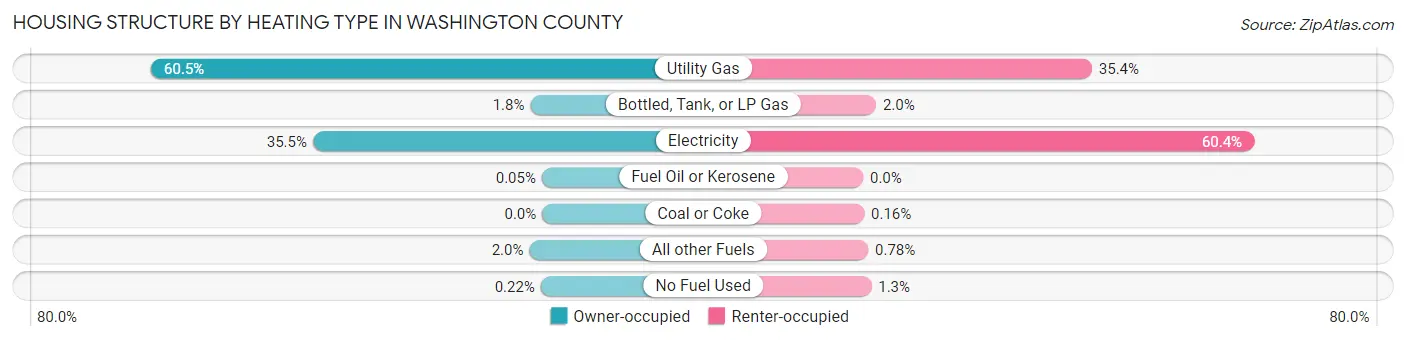
| Heating Type | Owner-occupied | Renter-occupied |
| Utility Gas | 28,105 (60.5%) | 6,252 (35.4%) |
| Bottled, Tank, or LP Gas | 847 (1.8%) | 353 (2.0%) |
| Electricity | 16,475 (35.4%) | 10,679 (60.4%) |
| Fuel Oil or Kerosene | 24 (0.1%) | 0 (0.0%) |
| Coal or Coke | 0 (0.0%) | 28 (0.2%) |
| All other Fuels | 922 (2.0%) | 138 (0.8%) |
| No Fuel Used | 104 (0.2%) | 224 (1.3%) |
| Total | 46,477 (100.0%) | 17,674 (100.0%) |
Household Vehicle Usage in Washington County
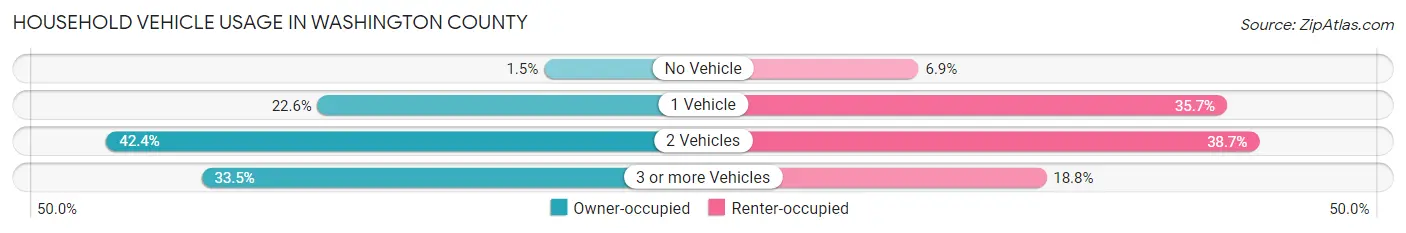
| Vehicles per Household | Owner-occupied | Renter-occupied |
| No Vehicle | 704 (1.5%) | 1,214 (6.9%) |
| 1 Vehicle | 10,522 (22.6%) | 6,303 (35.7%) |
| 2 Vehicles | 19,687 (42.4%) | 6,835 (38.7%) |
| 3 or more Vehicles | 15,564 (33.5%) | 3,322 (18.8%) |
| Total | 46,477 (100.0%) | 17,674 (100.0%) |
Real Estate & Mortgages in Washington County
Real Estate and Mortgage Overview in Washington County
| Characteristic | Without Mortgage | With Mortgage |
| Housing Units | 17,941 | 28,536 |
| Median Property Value | $415,000 | $418,900 |
| Median Household Income | $66,012 | $6,559 |
| Monthly Housing Costs | $471 | $2,777 |
| Real Estate Taxes | $1,952 | $926 |
Property Value by Mortgage Status in Washington County
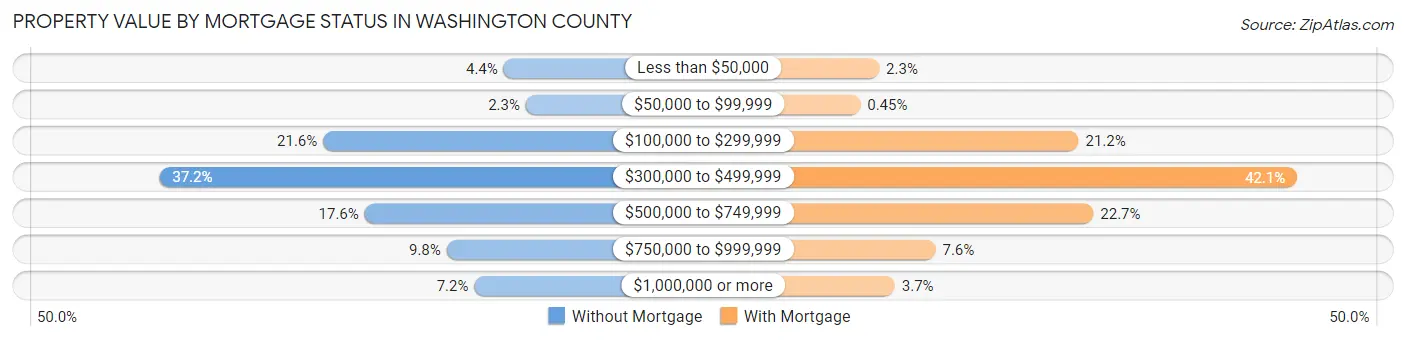
| Property Value | Without Mortgage | With Mortgage |
| Less than $50,000 | 786 (4.4%) | 641 (2.2%) |
| $50,000 to $99,999 | 408 (2.3%) | 127 (0.4%) |
| $100,000 to $299,999 | 3,870 (21.6%) | 6,062 (21.2%) |
| $300,000 to $499,999 | 6,668 (37.2%) | 12,003 (42.1%) |
| $500,000 to $749,999 | 3,162 (17.6%) | 6,462 (22.7%) |
| $750,000 to $999,999 | 1,760 (9.8%) | 2,174 (7.6%) |
| $1,000,000 or more | 1,287 (7.2%) | 1,067 (3.7%) |
| Total | 17,941 (100.0%) | 28,536 (100.0%) |
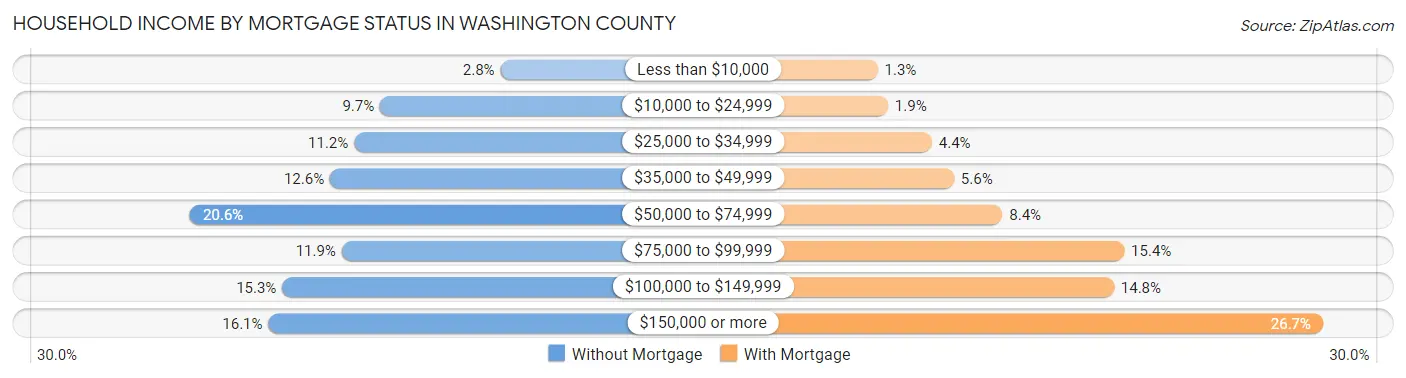
Household Income by Mortgage Status in Washington County
| Household Income | Without Mortgage | With Mortgage |
| Less than $10,000 | 504 (2.8%) | 359 (1.3%) |
| $10,000 to $24,999 | 1,738 (9.7%) | 527 (1.8%) |
| $25,000 to $34,999 | 2,004 (11.2%) | 1,243 (4.4%) |
| $35,000 to $49,999 | 2,251 (12.6%) | 1,603 (5.6%) |
| $50,000 to $74,999 | 3,687 (20.5%) | 2,393 (8.4%) |
| $75,000 to $99,999 | 2,132 (11.9%) | 4,379 (15.3%) |
| $100,000 to $149,999 | 2,741 (15.3%) | 4,212 (14.8%) |
| $150,000 or more | 2,884 (16.1%) | 7,620 (26.7%) |
| Total | 17,941 (100.0%) | 28,536 (100.0%) |
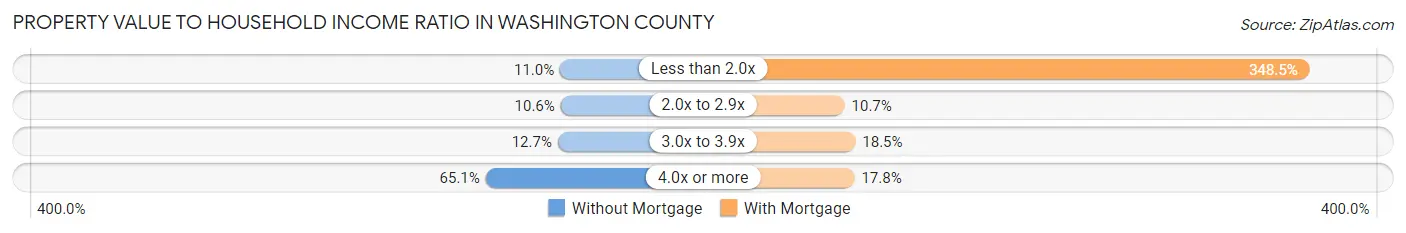
Property Value to Household Income Ratio in Washington County
| Value-to-Income Ratio | Without Mortgage | With Mortgage |
| Less than 2.0x | 1,977 (11.0%) | 99,438 (348.5%) |
| 2.0x to 2.9x | 1,901 (10.6%) | 3,045 (10.7%) |
| 3.0x to 3.9x | 2,276 (12.7%) | 5,278 (18.5%) |
| 4.0x or more | 11,679 (65.1%) | 5,091 (17.8%) |
| Total | 17,941 (100.0%) | 28,536 (100.0%) |
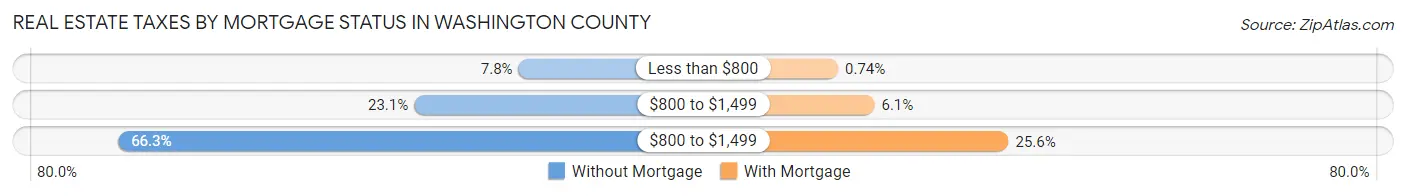
Real Estate Taxes by Mortgage Status in Washington County
| Property Taxes | Without Mortgage | With Mortgage |
| Less than $800 | 1,407 (7.8%) | 210 (0.7%) |
| $800 to $1,499 | 4,142 (23.1%) | 1,728 (6.1%) |
| $800 to $1,499 | 11,896 (66.3%) | 7,318 (25.6%) |
| Total | 17,941 (100.0%) | 28,536 (100.0%) |
Health & Disability in Washington County
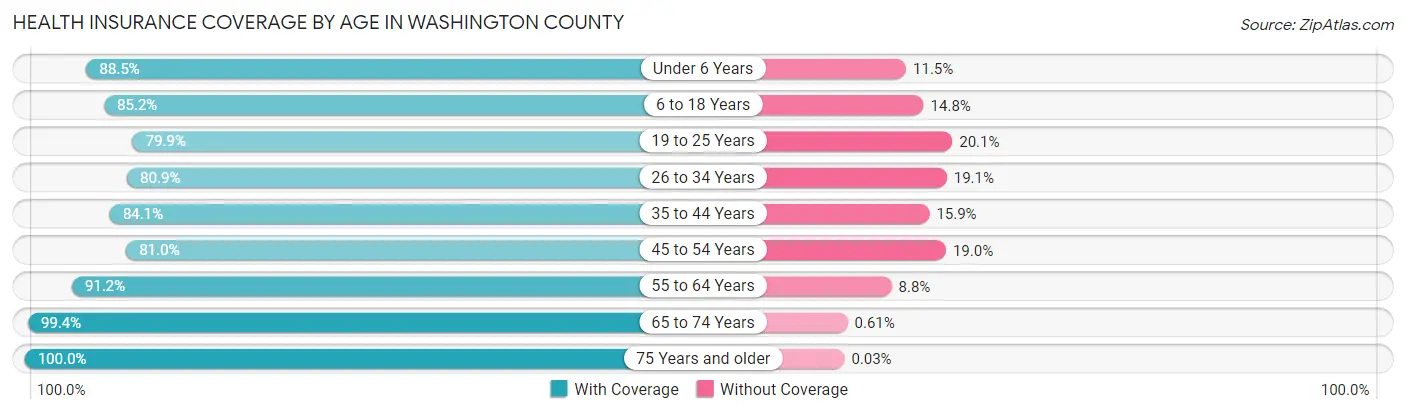
Health Insurance Coverage by Age in Washington County
| Age Bracket | With Coverage | Without Coverage |
| Under 6 Years | 11,988 (88.5%) | 1,562 (11.5%) |
| 6 to 18 Years | 29,849 (85.2%) | 5,187 (14.8%) |
| 19 to 25 Years | 12,648 (79.9%) | 3,189 (20.1%) |
| 26 to 34 Years | 15,206 (80.9%) | 3,594 (19.1%) |
| 35 to 44 Years | 17,997 (84.1%) | 3,397 (15.9%) |
| 45 to 54 Years | 14,448 (81.0%) | 3,381 (19.0%) |
| 55 to 64 Years | 17,863 (91.2%) | 1,727 (8.8%) |
| 65 to 74 Years | 22,049 (99.4%) | 136 (0.6%) |
| 75 Years and older | 17,531 (100.0%) | 6 (0.0%) |
| Total | 159,579 (87.8%) | 22,179 (12.2%) |
Health Insurance Coverage by Citizenship Status in Washington County
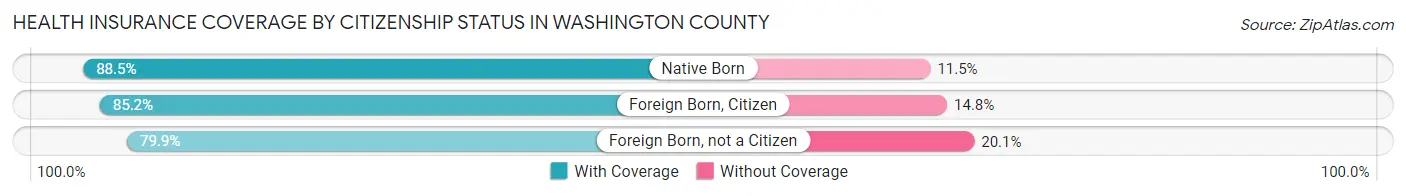
| Citizenship Status | With Coverage | Without Coverage |
| Native Born | 11,988 (88.5%) | 1,562 (11.5%) |
| Foreign Born, Citizen | 29,849 (85.2%) | 5,187 (14.8%) |
| Foreign Born, not a Citizen | 12,648 (79.9%) | 3,189 (20.1%) |
Health Insurance Coverage by Household Income in Washington County
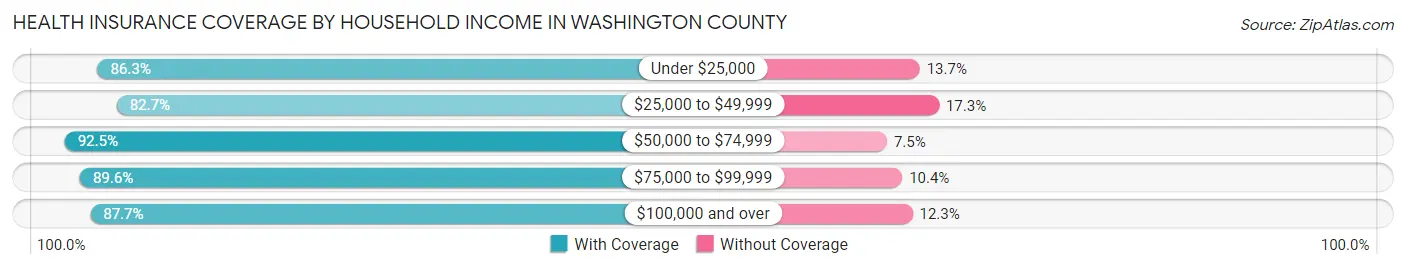
| Household Income | With Coverage | Without Coverage |
| Under $25,000 | 10,749 (86.3%) | 1,700 (13.7%) |
| $25,000 to $49,999 | 25,135 (82.7%) | 5,247 (17.3%) |
| $50,000 to $74,999 | 29,064 (92.5%) | 2,366 (7.5%) |
| $75,000 to $99,999 | 20,556 (89.6%) | 2,381 (10.4%) |
| $100,000 and over | 73,359 (87.7%) | 10,311 (12.3%) |
Public vs Private Health Insurance Coverage by Age in Washington County
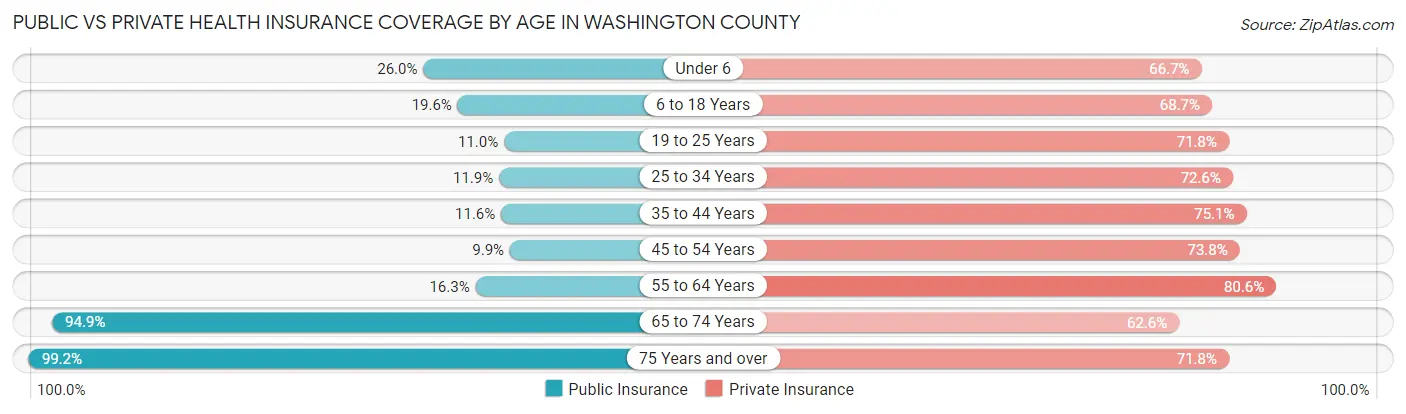
| Age Bracket | Public Insurance | Private Insurance |
| Under 6 | 3,522 (26.0%) | 9,043 (66.7%) |
| 6 to 18 Years | 6,872 (19.6%) | 24,061 (68.7%) |
| 19 to 25 Years | 1,745 (11.0%) | 11,376 (71.8%) |
| 25 to 34 Years | 2,242 (11.9%) | 13,642 (72.6%) |
| 35 to 44 Years | 2,470 (11.6%) | 16,063 (75.1%) |
| 45 to 54 Years | 1,768 (9.9%) | 13,161 (73.8%) |
| 55 to 64 Years | 3,196 (16.3%) | 15,792 (80.6%) |
| 65 to 74 Years | 21,052 (94.9%) | 13,885 (62.6%) |
| 75 Years and over | 17,398 (99.2%) | 12,596 (71.8%) |
| Total | 60,265 (33.2%) | 129,619 (71.3%) |
Disability Status by Sex by Age in Washington County
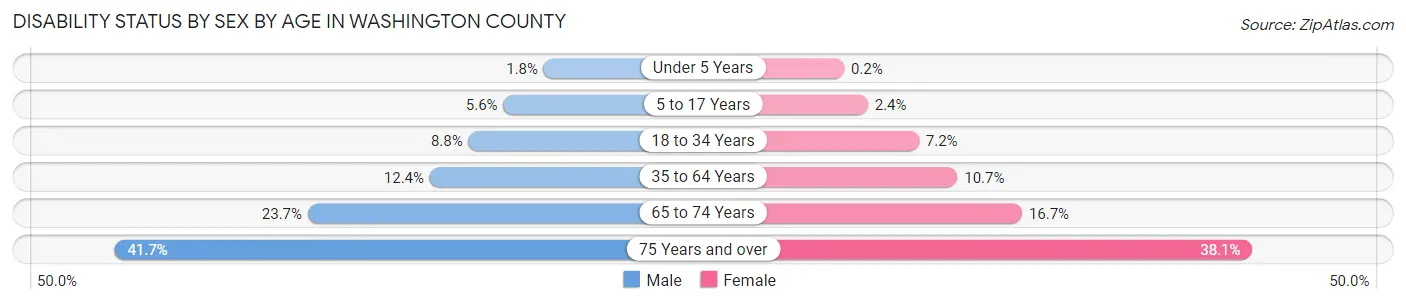
| Age Bracket | Male | Female |
| Under 5 Years | 101 (1.8%) | 11 (0.2%) |
| 5 to 17 Years | 989 (5.6%) | 398 (2.4%) |
| 18 to 34 Years | 1,699 (8.8%) | 1,328 (7.1%) |
| 35 to 64 Years | 3,545 (12.4%) | 3,239 (10.7%) |
| 65 to 74 Years | 2,519 (23.7%) | 1,933 (16.7%) |
| 75 Years and over | 3,550 (41.7%) | 3,435 (38.1%) |
Disability Class by Sex by Age in Washington County
Disability Class: Hearing Difficulty
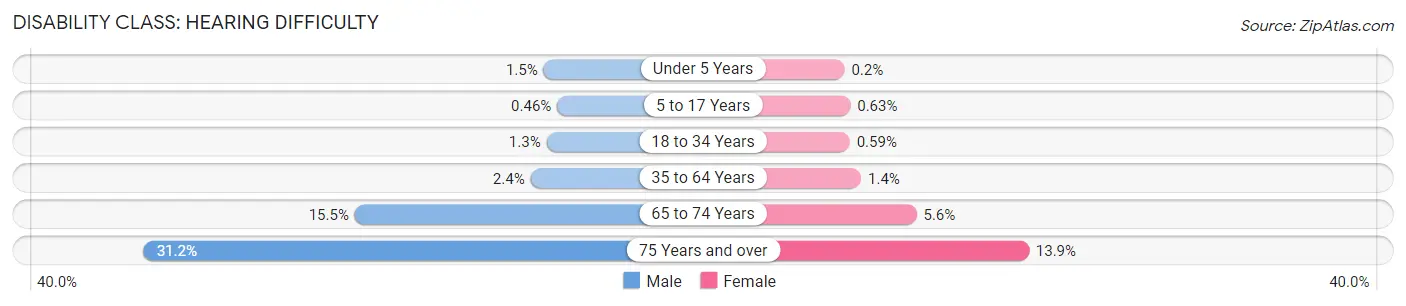
| Age Bracket | Male | Female |
| Under 5 Years | 82 (1.5%) | 11 (0.2%) |
| 5 to 17 Years | 81 (0.5%) | 104 (0.6%) |
| 18 to 34 Years | 241 (1.3%) | 110 (0.6%) |
| 35 to 64 Years | 698 (2.4%) | 432 (1.4%) |
| 65 to 74 Years | 1,645 (15.5%) | 642 (5.6%) |
| 75 Years and over | 2,654 (31.1%) | 1,252 (13.9%) |
Disability Class: Vision Difficulty
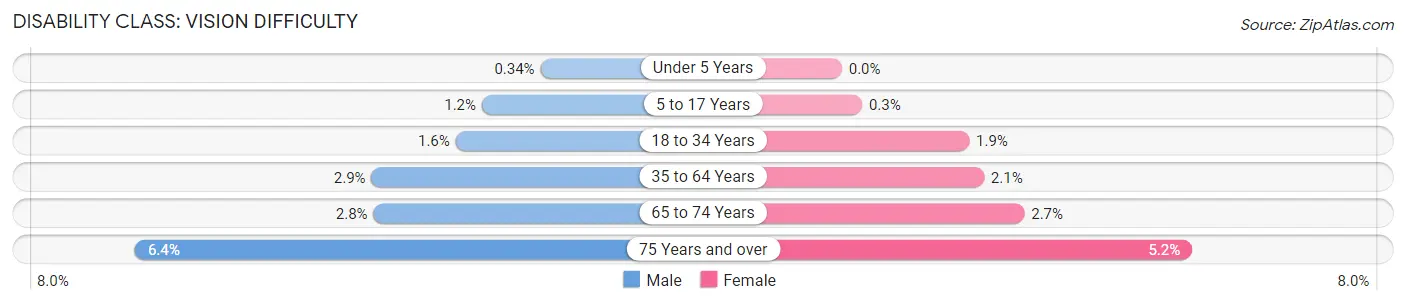
| Age Bracket | Male | Female |
| Under 5 Years | 19 (0.3%) | 0 (0.0%) |
| 5 to 17 Years | 215 (1.2%) | 49 (0.3%) |
| 18 to 34 Years | 308 (1.6%) | 351 (1.9%) |
| 35 to 64 Years | 816 (2.9%) | 636 (2.1%) |
| 65 to 74 Years | 300 (2.8%) | 313 (2.7%) |
| 75 Years and over | 542 (6.4%) | 469 (5.2%) |
Disability Class: Cognitive Difficulty
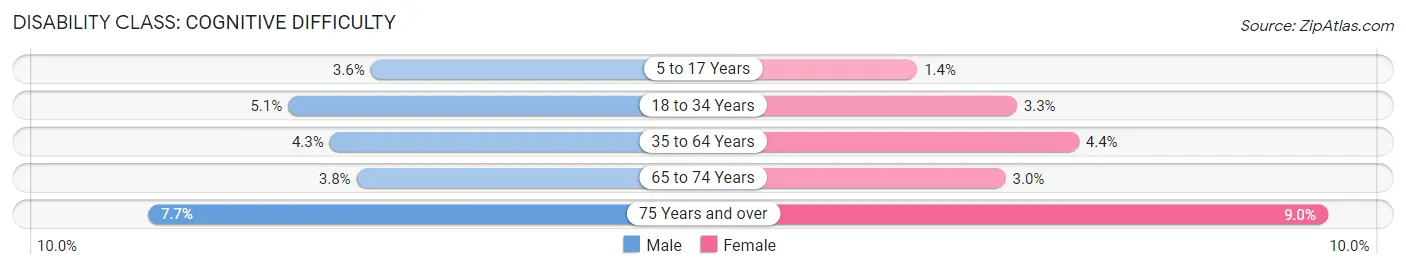
| Age Bracket | Male | Female |
| 5 to 17 Years | 637 (3.6%) | 232 (1.4%) |
| 18 to 34 Years | 987 (5.1%) | 604 (3.3%) |
| 35 to 64 Years | 1,241 (4.3%) | 1,329 (4.4%) |
| 65 to 74 Years | 408 (3.8%) | 351 (3.0%) |
| 75 Years and over | 657 (7.7%) | 813 (9.0%) |
Disability Class: Ambulatory Difficulty
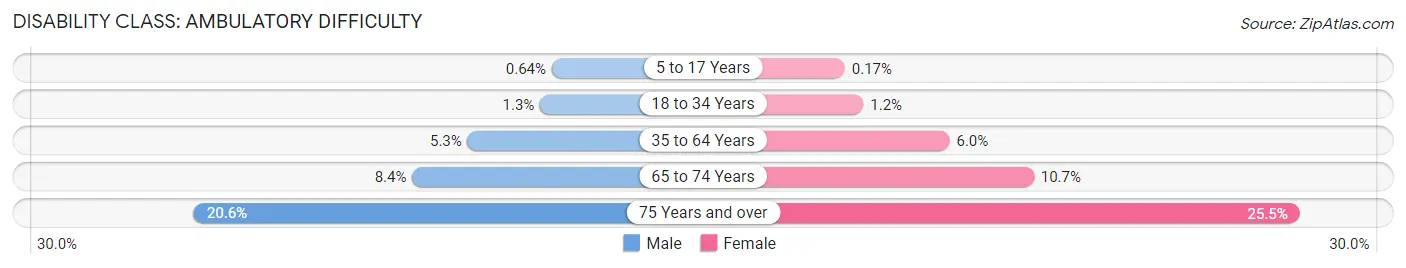
| Age Bracket | Male | Female |
| 5 to 17 Years | 114 (0.6%) | 28 (0.2%) |
| 18 to 34 Years | 250 (1.3%) | 223 (1.2%) |
| 35 to 64 Years | 1,525 (5.3%) | 1,812 (6.0%) |
| 65 to 74 Years | 893 (8.4%) | 1,236 (10.7%) |
| 75 Years and over | 1,753 (20.6%) | 2,298 (25.5%) |
Disability Class: Self-Care Difficulty
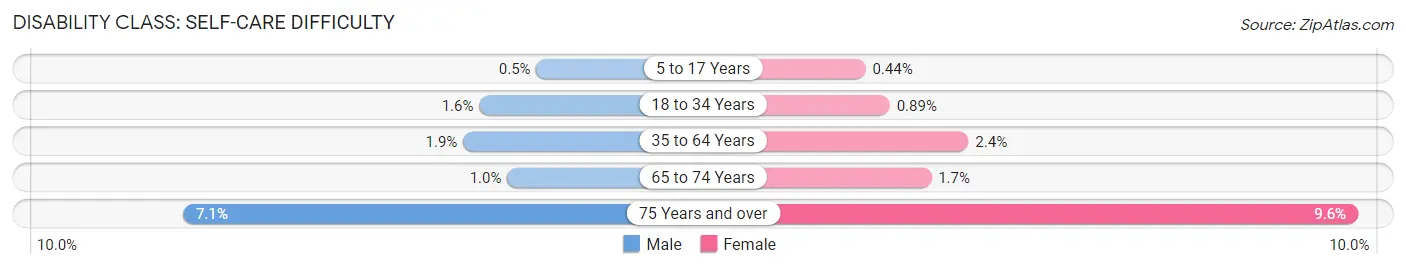
| Age Bracket | Male | Female |
| 5 to 17 Years | 89 (0.5%) | 73 (0.4%) |
| 18 to 34 Years | 302 (1.6%) | 166 (0.9%) |
| 35 to 64 Years | 532 (1.9%) | 710 (2.4%) |
| 65 to 74 Years | 111 (1.0%) | 192 (1.7%) |
| 75 Years and over | 602 (7.1%) | 864 (9.6%) |
Technology Access in Washington County
Computing Device Access in Washington County
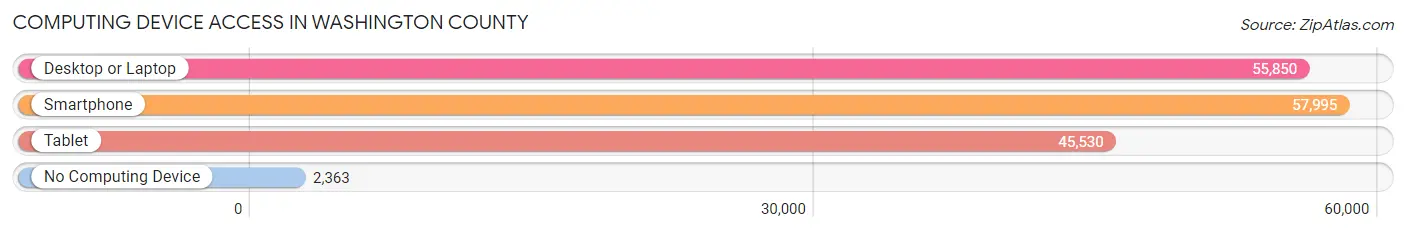
| Device Type | # Households | % Households |
| Desktop or Laptop | 55,850 | 87.1% |
| Smartphone | 57,995 | 90.4% |
| Tablet | 45,530 | 71.0% |
| No Computing Device | 2,363 | 3.7% |
| Total | 64,151 | 100.0% |
Internet Access in Washington County
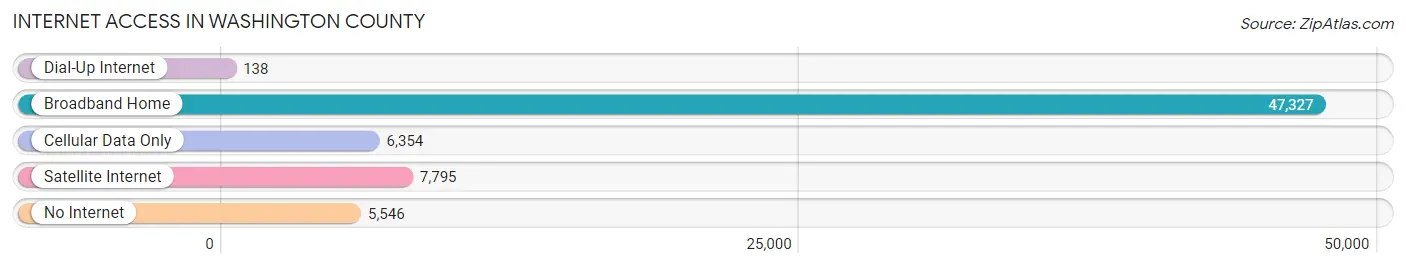
| Internet Type | # Households | % Households |
| Dial-Up Internet | 138 | 0.2% |
| Broadband Home | 47,327 | 73.8% |
| Cellular Data Only | 6,354 | 9.9% |
| Satellite Internet | 7,795 | 12.1% |
| No Internet | 5,546 | 8.6% |
| Total | 64,151 | 100.0% |
Washington County Summary
Introduction
Washington County, Utah is located in the southwestern corner of the state and is the fifth-most populous county in Utah. It is bordered by Iron County to the north, Kane County to the east, and Arizona and Nevada to the south and west. The county seat is St. George, and the largest city is St. George. The county was named after George Washington, the first president of the United States.
History
The area that is now Washington County was first inhabited by the Southern Paiute and the Virgin Anasazi people. The first Europeans to explore the area were members of the Dominguez-Escalante Expedition in 1776. The area was later explored by John C. Fremont in 1844.
In 1854, the Utah Territorial Legislature created Washington County, which included the area that is now Iron County. The county was named after George Washington, the first president of the United States.
In 1862, the county seat was moved from Harmony to St. George. The city was named after George A. Smith, an apostle of The Church of Jesus Christ of Latter-day Saints.
In 1877 the St George Temple was completed and in 1878 the St George Tabernacle was completed
In 1891, the St. George Electric Light and Power Company was established, and in 1895, the St. George Telephone Company was established.
In the early 1900s, the area experienced a population boom due to the construction of the St. George Dam and the opening of the Zion National Park.
In the 1950s, the area experienced another population boom due to the construction of the Glen Canyon Dam and the opening of the nearby Bryce Canyon National Park.
Geography
Washington County is located in the southwestern corner of Utah and is bordered by Iron County to the north, Kane County to the east, and Arizona and Nevada to the south and west. The county covers an area of 2,430 square miles and has a population of over 160,000 people.
The county is located in the Great Basin Desert and is characterized by hot summers and mild winters. The average annual temperature is 64°F, and the average annual precipitation is 8.5 inches.
The county is home to several mountain ranges, including the Pine Valley Mountains, the Red Cliffs, and the Beaver Dam Mountains. The county is also home to several rivers, including the Virgin River, the Santa Clara River, and the East Fork of the Virgin River.
Economy
Washington County is home to a diverse economy. The county is home to several industries, including tourism, manufacturing, agriculture, and mining.
Tourism is a major industry in the county, and the county is home to several popular tourist attractions, including Zion National Park, Bryce Canyon National Park, and the St. George Temple.
Manufacturing is also a major industry in the county, and the county is home to several manufacturing companies, including Intermountain Electronics, Inc., and St. George Iron Works.
Agriculture is also an important industry in the county, and the county is home to several farms and ranches, including the Red Hills Ranch and the Santa Clara Ranch.
Mining is also an important industry in the county, and the county is home to several mines, including the Iron Mountain Mine and the Santa Clara Mine.
Demographics
As of the 2010 census, the population of Washington County was 147,932, and the population density was 61.2 people per square mile. The racial makeup of the county was 87.3% White, 1.3% Black or African American, 0.7% Native American, 1.3% Asian, 0.2% Pacific Islander, 6.7% from other races, and 2.7% from two or more races.
The median income for a household in the county was $45,945, and the median income for a family was $51,837. The per capita income for the county was $21,945.
Conclusion
Washington County, Utah is located in the southwestern corner of the state and is the fifth-most populous county in Utah. The county was named after George Washington, the first president of the United States. The county is home to a diverse economy, and the population of the county is 147,932. The county is home to several popular tourist attractions, including Zion National Park, Bryce Canyon National Park, and the St. George Temple. The median income for a household in the county was $45,945, and the median income for a family was $51,837.
Common Questions
What is the Total Population of Washington County?
Total Population of Washington County is 183,297.
What is the Total Male Population of Washington County?
Total Male Population of Washington County is 91,287.
What is the Total Female Population of Washington County?
Total Female Population of Washington County is 92,010.
What is the Ratio of Males per 100 Females in Washington County?
There are 99.21 Males per 100 Females in Washington County.
What is the Ratio of Females per 100 Males in Washington County?
There are 100.79 Females per 100 Males in Washington County.
What is the Median Population Age in Washington County?
Median Population Age in Washington County is 38.6 Years.
What is the Average Family Size in Washington County
Average Family Size in Washington County is 3.3 People.
What is the Average Household Size in Washington County
Average Household Size in Washington County is 2.8 People.
What is Per Capita Income in Washington County?
Per Capita income in Washington County is $36,047.
What is the Median Family Income in Washington County?
Median Family Income in Washington County is $89,507.
What is the Median Household income in Washington County?
Median Household Income in Washington County is $71,976.
What is Income or Wage Gap in Washington County?
Income or Wage Gap in Washington County is 38.0%.
Women in Washington County earn 62.0 cents for every dollar earned by a man.
What is Family Income Deficit in Washington County?
Family Income Deficit in Washington County is $9,952.
Families that are below poverty line in Washington County earn $9,952 less on average than the poverty threshold level.
What is Inequality or Gini Index in Washington County?
Inequality or Gini Index in Washington County is 0.45.
How Large is the Labor Force in Washington County?
There are 80,822 People in the Labor Forcein in Washington County.
What is the Percentage of People in the Labor Force in Washington County?
56.5% of People are in the Labor Force in Washington County.
What is the Unemployment Rate in Washington County?
Unemployment Rate in Washington County is 3.1%.