Wasatch County, UT
Wasatch County Map
Wasatch County Overview
35,009
TOTAL POPULATION
17,880
MALE POPULATION
17,129
FEMALE POPULATION
104.38
MALES / 100 FEMALES
95.80
FEMALES / 100 MALES
35.5
MEDIAN AGE
3.5
AVG FAMILY SIZE
3.0
AVG HOUSEHOLD SIZE
$51,178
PER CAPITA INCOME
$119,919
AVG FAMILY INCOME
$104,855
AVG HOUSEHOLD INCOME
56.8%
WAGE / INCOME GAP [ % ]
43.2¢/ $1
WAGE / INCOME GAP [ $ ]
0.48
INEQUALITY / GINI INDEX
17,672
LABOR FORCE [ PEOPLE ]
68.3%
PERCENT IN LABOR FORCE
2.4%
UNEMPLOYMENT RATE
Wasatch County Area Codes
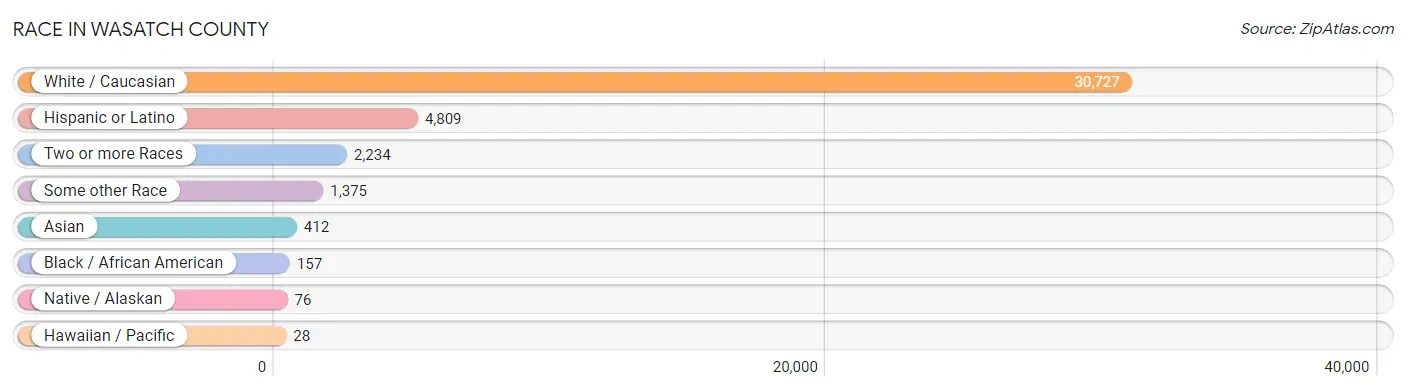
Race in Wasatch County
The most populous races in Wasatch County are White / Caucasian (30,727 | 87.8%), Hispanic or Latino (4,809 | 13.7%), and Two or more Races (2,234 | 6.4%).
| Race | # Population | % Population |
| Asian | 412 | 1.2% |
| Black / African American | 157 | 0.4% |
| Hawaiian / Pacific | 28 | 0.1% |
| Hispanic or Latino | 4,809 | 13.7% |
| Native / Alaskan | 76 | 0.2% |
| White / Caucasian | 30,727 | 87.8% |
| Two or more Races | 2,234 | 6.4% |
| Some other Race | 1,375 | 3.9% |
| Total | 35,009 | 100.0% |
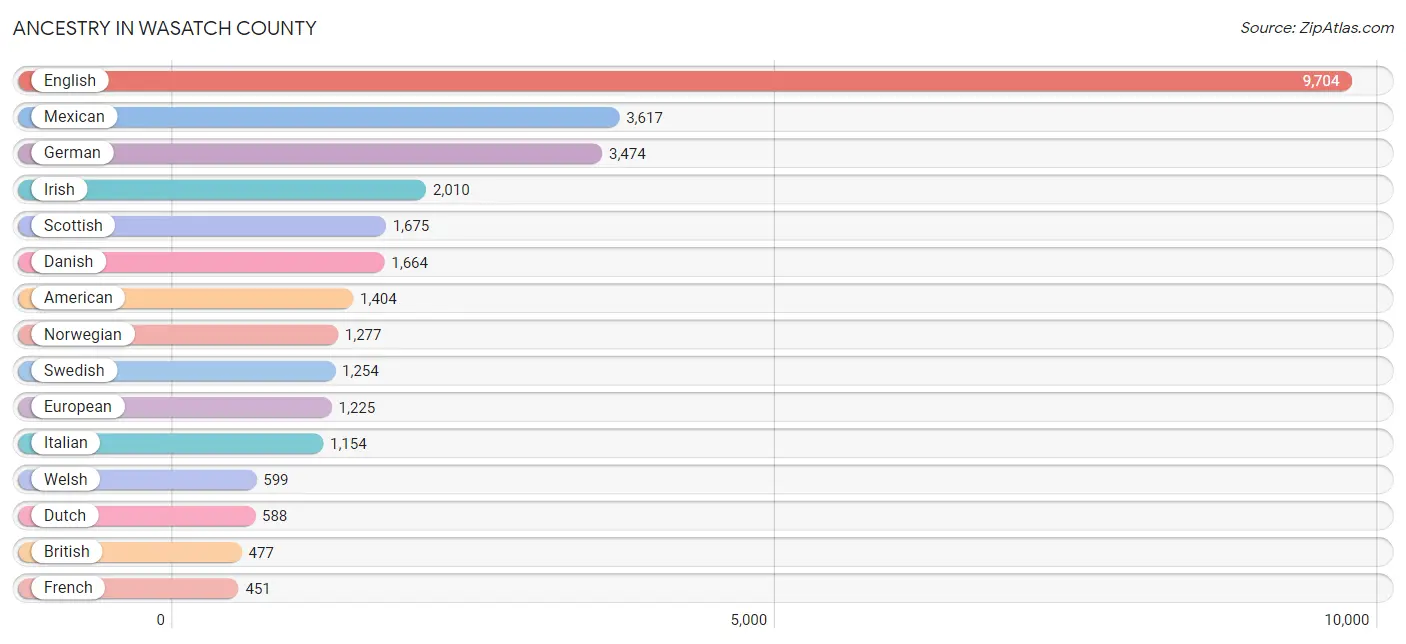
Ancestry in Wasatch County
The most populous ancestries reported in Wasatch County are English (9,704 | 27.7%), Mexican (3,617 | 10.3%), German (3,474 | 9.9%), Irish (2,010 | 5.7%), and Scottish (1,675 | 4.8%), together accounting for 58.5% of all Wasatch County residents.
| Ancestry | # Population | % Population |
| African | 37 | 0.1% |
| American | 1,404 | 4.0% |
| Arab | 76 | 0.2% |
| Armenian | 21 | 0.1% |
| Australian | 47 | 0.1% |
| Austrian | 92 | 0.3% |
| Basque | 19 | 0.1% |
| Belgian | 7 | 0.0% |
| Bhutanese | 102 | 0.3% |
| Brazilian | 56 | 0.2% |
| British | 477 | 1.4% |
| Bulgarian | 10 | 0.0% |
| Burmese | 30 | 0.1% |
| Canadian | 100 | 0.3% |
| Central American | 48 | 0.1% |
| Central American Indian | 70 | 0.2% |
| Cherokee | 2 | 0.0% |
| Chilean | 100 | 0.3% |
| Choctaw | 36 | 0.1% |
| Colombian | 122 | 0.4% |
| Croatian | 28 | 0.1% |
| Cuban | 15 | 0.0% |
| Czech | 167 | 0.5% |
| Czechoslovakian | 3 | 0.0% |
| Danish | 1,664 | 4.8% |
| Dutch | 588 | 1.7% |
| Eastern European | 40 | 0.1% |
| Ecuadorian | 44 | 0.1% |
| English | 9,704 | 27.7% |
| European | 1,225 | 3.5% |
| Fijian | 22 | 0.1% |
| Finnish | 80 | 0.2% |
| French | 451 | 1.3% |
| French Canadian | 70 | 0.2% |
| German | 3,474 | 9.9% |
| Greek | 81 | 0.2% |
| Guatemalan | 24 | 0.1% |
| Hungarian | 21 | 0.1% |
| Icelander | 26 | 0.1% |
| Indian (Asian) | 218 | 0.6% |
| Irish | 2,010 | 5.7% |
| Israeli | 30 | 0.1% |
| Italian | 1,154 | 3.3% |
| Jamaican | 11 | 0.0% |
| Japanese | 77 | 0.2% |
| Korean | 320 | 0.9% |
| Laotian | 7 | 0.0% |
| Lebanese | 44 | 0.1% |
| Lithuanian | 5 | 0.0% |
| Mexican | 3,617 | 10.3% |
| Nigerian | 5 | 0.0% |
| Northern European | 83 | 0.2% |
| Norwegian | 1,277 | 3.6% |
| Paraguayan | 4 | 0.0% |
| Pennsylvania German | 2 | 0.0% |
| Peruvian | 35 | 0.1% |
| Polish | 188 | 0.5% |
| Portuguese | 2 | 0.0% |
| Puerto Rican | 138 | 0.4% |
| Romanian | 92 | 0.3% |
| Russian | 66 | 0.2% |
| Salvadoran | 24 | 0.1% |
| Samoan | 3 | 0.0% |
| Scandinavian | 371 | 1.1% |
| Scotch-Irish | 230 | 0.7% |
| Scottish | 1,675 | 4.8% |
| Shoshone | 4 | 0.0% |
| Sioux | 58 | 0.2% |
| Slavic | 18 | 0.1% |
| Slovak | 70 | 0.2% |
| South American | 365 | 1.0% |
| Spaniard | 31 | 0.1% |
| Spanish | 425 | 1.2% |
| Subsaharan African | 42 | 0.1% |
| Swedish | 1,254 | 3.6% |
| Swiss | 414 | 1.2% |
| Syrian | 2 | 0.0% |
| Thai | 25 | 0.1% |
| Ukrainian | 29 | 0.1% |
| Ute | 6 | 0.0% |
| Venezuelan | 60 | 0.2% |
| Welsh | 599 | 1.7% |
| Yugoslavian | 41 | 0.1% | View All 83 Rows |
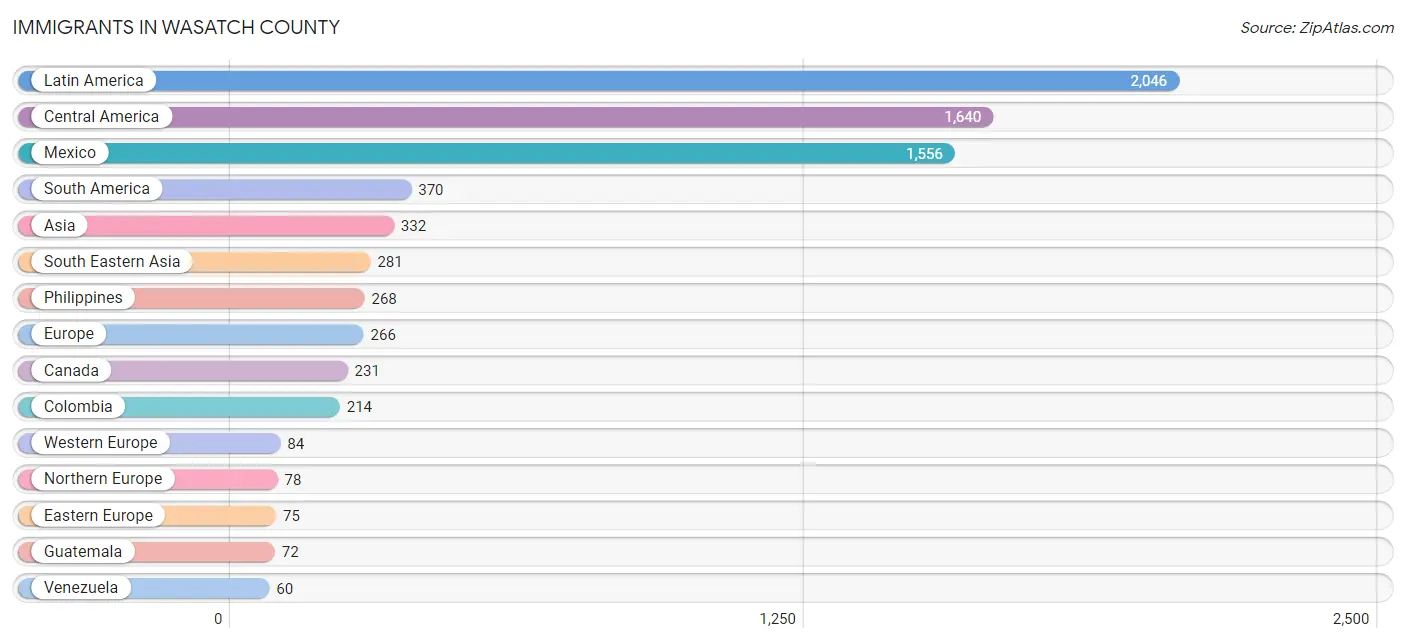
Immigrants in Wasatch County
The most numerous immigrant groups reported in Wasatch County came from Latin America (2,046 | 5.8%), Central America (1,640 | 4.7%), Mexico (1,556 | 4.4%), South America (370 | 1.1%), and Asia (332 | 0.9%), together accounting for 17.0% of all Wasatch County residents.
| Immigration Origin | # Population | % Population |
| Africa | 6 | 0.0% |
| Asia | 332 | 0.9% |
| Australia | 23 | 0.1% |
| Bosnia and Herzegovina | 41 | 0.1% |
| Brazil | 58 | 0.2% |
| Cambodia | 13 | 0.0% |
| Canada | 231 | 0.7% |
| Caribbean | 36 | 0.1% |
| Central America | 1,640 | 4.7% |
| Chile | 11 | 0.0% |
| China | 27 | 0.1% |
| Colombia | 214 | 0.6% |
| Czechoslovakia | 13 | 0.0% |
| Denmark | 33 | 0.1% |
| Eastern Africa | 5 | 0.0% |
| Eastern Asia | 30 | 0.1% |
| Eastern Europe | 75 | 0.2% |
| El Salvador | 12 | 0.0% |
| England | 23 | 0.1% |
| Europe | 266 | 0.8% |
| Germany | 58 | 0.2% |
| Guatemala | 72 | 0.2% |
| Hong Kong | 22 | 0.1% |
| Ireland | 20 | 0.1% |
| Italy | 29 | 0.1% |
| Jamaica | 36 | 0.1% |
| Japan | 3 | 0.0% |
| Kenya | 3 | 0.0% |
| Latin America | 2,046 | 5.8% |
| Mexico | 1,556 | 4.4% |
| Netherlands | 26 | 0.1% |
| Northern Europe | 78 | 0.2% |
| Oceania | 23 | 0.1% |
| Peru | 23 | 0.1% |
| Philippines | 268 | 0.8% |
| Russia | 21 | 0.1% |
| Saudi Arabia | 14 | 0.0% |
| South America | 370 | 1.1% |
| South Eastern Asia | 281 | 0.8% |
| Southern Europe | 29 | 0.1% |
| Turkey | 7 | 0.0% |
| Venezuela | 60 | 0.2% |
| Western Asia | 21 | 0.1% |
| Western Europe | 84 | 0.2% |
| Zimbabwe | 2 | 0.0% | View All 45 Rows |
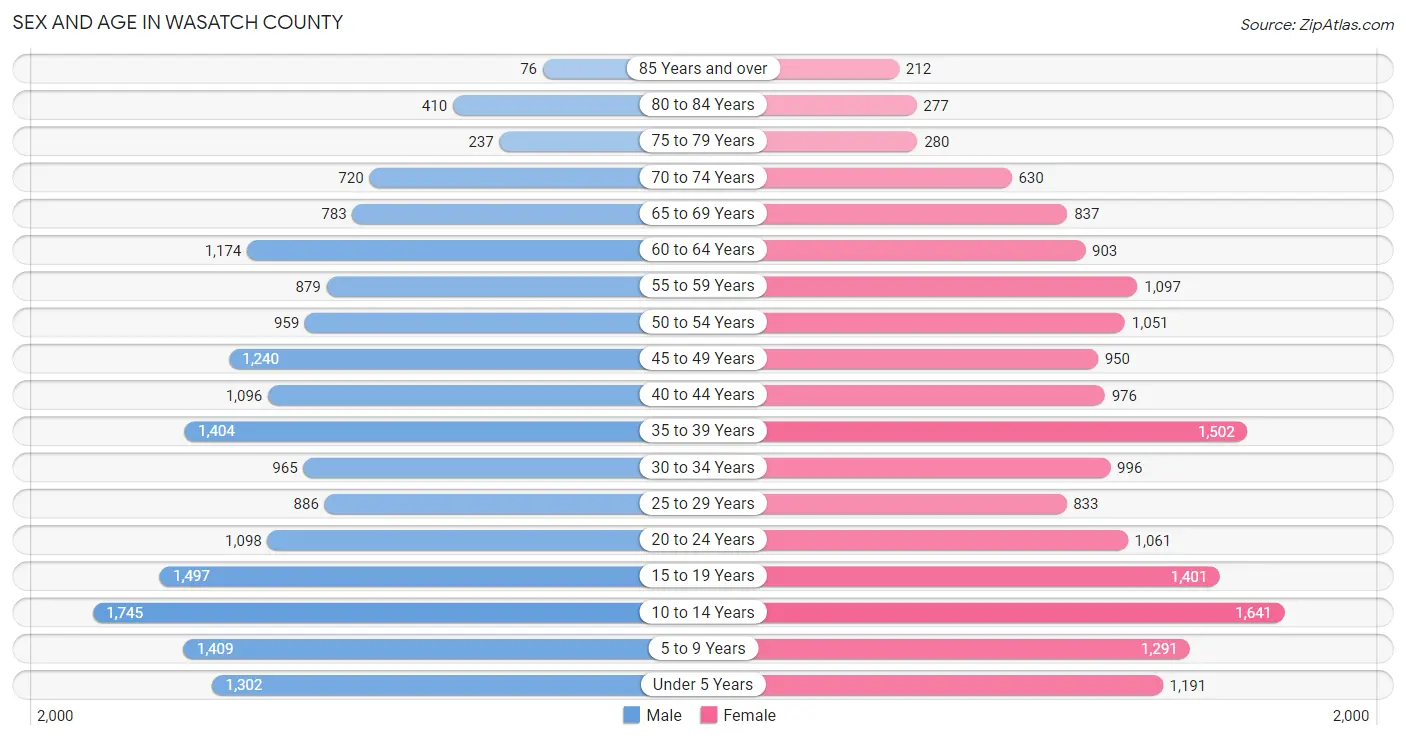
Sex and Age in Wasatch County
Sex and Age in Wasatch County
The most populous age groups in Wasatch County are 10 to 14 Years (1,745 | 9.8%) for men and 10 to 14 Years (1,641 | 9.6%) for women.
| Age Bracket | Male | Female |
| Under 5 Years | 1,302 (7.3%) | 1,191 (7.0%) |
| 5 to 9 Years | 1,409 (7.9%) | 1,291 (7.5%) |
| 10 to 14 Years | 1,745 (9.8%) | 1,641 (9.6%) |
| 15 to 19 Years | 1,497 (8.4%) | 1,401 (8.2%) |
| 20 to 24 Years | 1,098 (6.1%) | 1,061 (6.2%) |
| 25 to 29 Years | 886 (5.0%) | 833 (4.9%) |
| 30 to 34 Years | 965 (5.4%) | 996 (5.8%) |
| 35 to 39 Years | 1,404 (7.9%) | 1,502 (8.8%) |
| 40 to 44 Years | 1,096 (6.1%) | 976 (5.7%) |
| 45 to 49 Years | 1,240 (6.9%) | 950 (5.6%) |
| 50 to 54 Years | 959 (5.4%) | 1,051 (6.1%) |
| 55 to 59 Years | 879 (4.9%) | 1,097 (6.4%) |
| 60 to 64 Years | 1,174 (6.6%) | 903 (5.3%) |
| 65 to 69 Years | 783 (4.4%) | 837 (4.9%) |
| 70 to 74 Years | 720 (4.0%) | 630 (3.7%) |
| 75 to 79 Years | 237 (1.3%) | 280 (1.6%) |
| 80 to 84 Years | 410 (2.3%) | 277 (1.6%) |
| 85 Years and over | 76 (0.4%) | 212 (1.2%) |
| Total | 17,880 (100.0%) | 17,129 (100.0%) |
Families and Households in Wasatch County
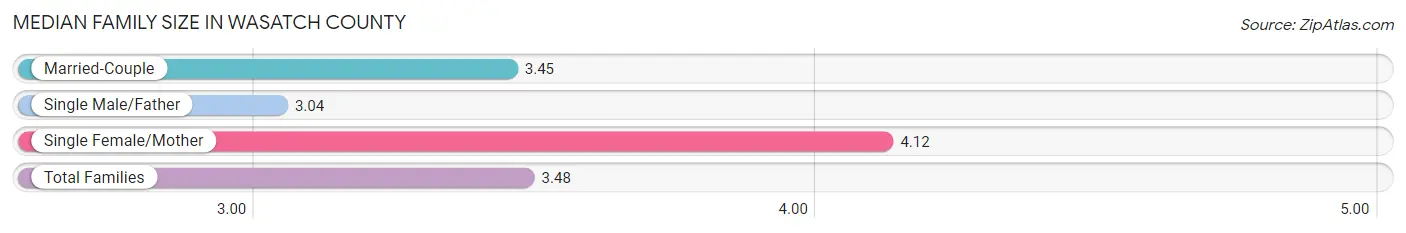
Median Family Size in Wasatch County
The median family size in Wasatch County is 3.48 persons per family, with single female/mother families (595 | 6.7%) accounting for the largest median family size of 4.12 persons per family. On the other hand, single male/father families (410 | 4.6%) represent the smallest median family size with 3.04 persons per family.
| Family Type | # Families | Family Size |
| Married-Couple | 7,946 (88.8%) | 3.45 |
| Single Male/Father | 410 (4.6%) | 3.04 |
| Single Female/Mother | 595 (6.7%) | 4.12 |
| Total Families | 8,951 (100.0%) | 3.48 |
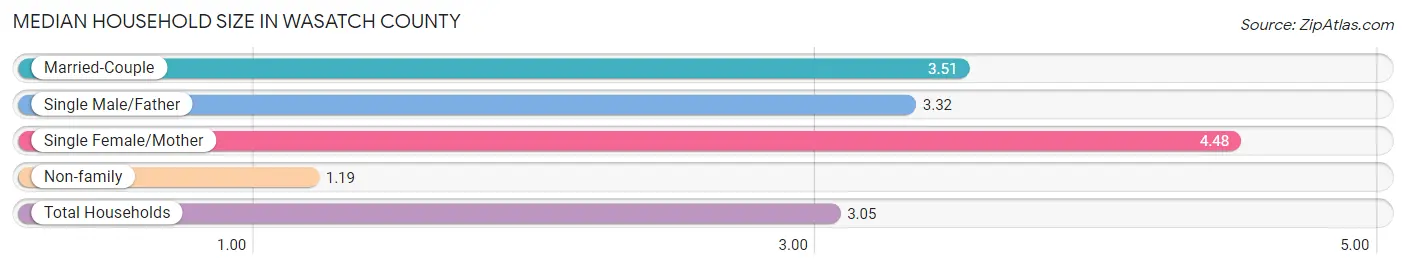
Median Household Size in Wasatch County
The median household size in Wasatch County is 3.05 persons per household, with single female/mother households (595 | 5.2%) accounting for the largest median household size of 4.48 persons per household. non-family households (2,456 | 21.5%) represent the smallest median household size with 1.19 persons per household.
| Household Type | # Households | Household Size |
| Married-Couple | 7,946 (69.7%) | 3.51 |
| Single Male/Father | 410 (3.6%) | 3.32 |
| Single Female/Mother | 595 (5.2%) | 4.48 |
| Non-family | 2,456 (21.5%) | 1.19 |
| Total Households | 11,407 (100.0%) | 3.05 |
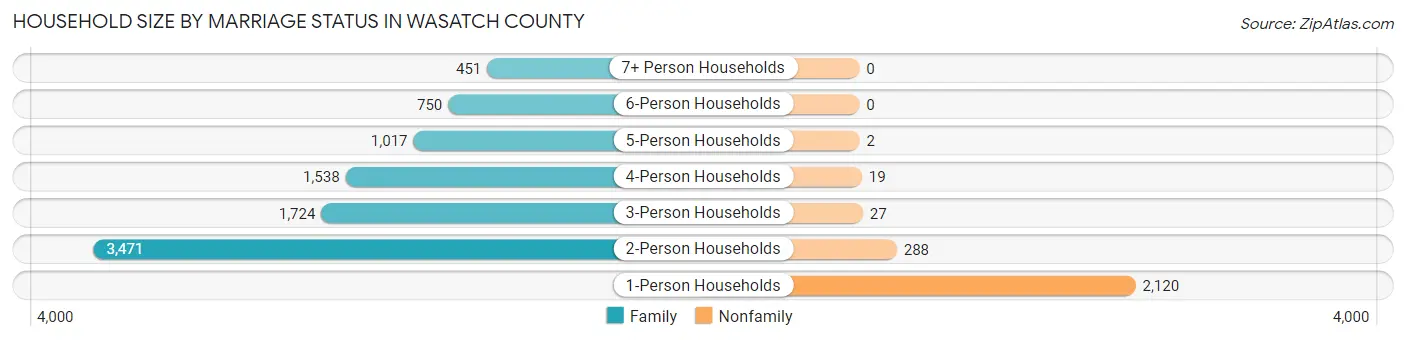
Household Size by Marriage Status in Wasatch County
Out of a total of 11,407 households in Wasatch County, 8,951 (78.5%) are family households, while 2,456 (21.5%) are nonfamily households. The most numerous type of family households are 2-person households, comprising 3,471, and the most common type of nonfamily households are 1-person households, comprising 2,120.
| Household Size | Family Households | Nonfamily Households |
| 1-Person Households | - | 2,120 (18.6%) |
| 2-Person Households | 3,471 (30.4%) | 288 (2.5%) |
| 3-Person Households | 1,724 (15.1%) | 27 (0.2%) |
| 4-Person Households | 1,538 (13.5%) | 19 (0.2%) |
| 5-Person Households | 1,017 (8.9%) | 2 (0.0%) |
| 6-Person Households | 750 (6.6%) | 0 (0.0%) |
| 7+ Person Households | 451 (4.0%) | 0 (0.0%) |
| Total | 8,951 (78.5%) | 2,456 (21.5%) |
Female Fertility in Wasatch County
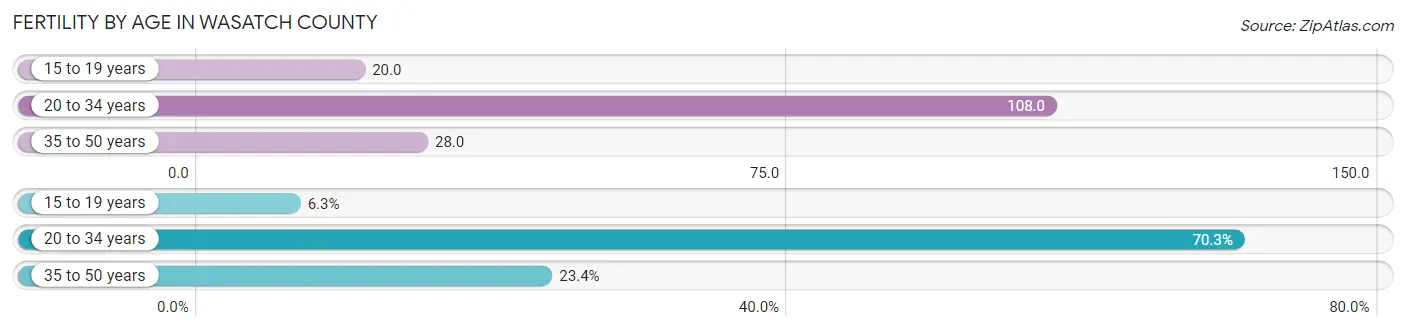
Fertility by Age in Wasatch County
Average fertility rate in Wasatch County is 56.0 births per 1,000 women. Women in the age bracket of 20 to 34 years have the highest fertility rate with 108.0 births per 1,000 women. Women in the age bracket of 20 to 34 years acount for 70.3% of all women with births.
| Age Bracket | Women with Births | Births / 1,000 Women |
| 15 to 19 years | 28 (6.3%) | 20.0 |
| 20 to 34 years | 313 (70.3%) | 108.0 |
| 35 to 50 years | 104 (23.4%) | 28.0 |
| Total | 445 (100.0%) | 56.0 |
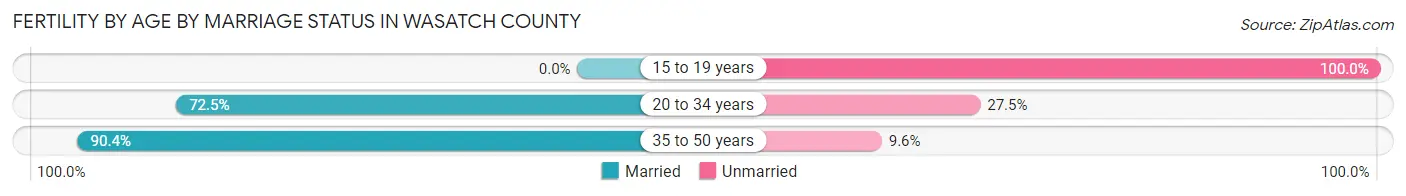
Fertility by Age by Marriage Status in Wasatch County
72.1% of women with births (445) in Wasatch County are married. The highest percentage of unmarried women with births falls into 15 to 19 years age bracket with 100.0% of them unmarried at the time of birth, while the lowest percentage of unmarried women with births belong to 35 to 50 years age bracket with 9.6% of them unmarried.
| Age Bracket | Married | Unmarried |
| 15 to 19 years | 0 (0.0%) | 28 (100.0%) |
| 20 to 34 years | 227 (72.5%) | 86 (27.5%) |
| 35 to 50 years | 94 (90.4%) | 10 (9.6%) |
| Total | 321 (72.1%) | 124 (27.9%) |
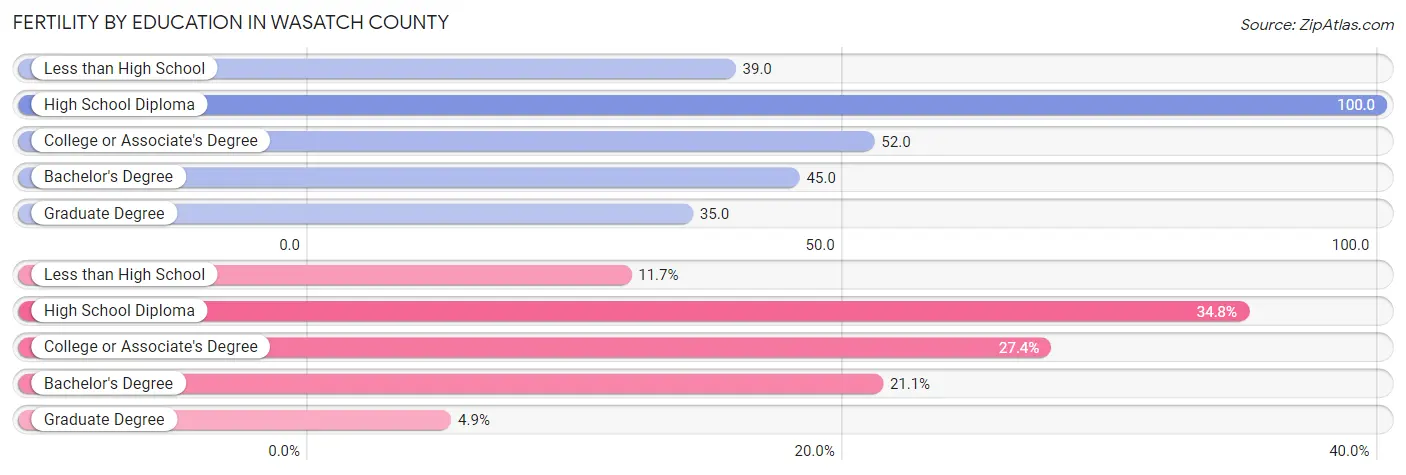
Fertility by Education in Wasatch County
Average fertility rate in Wasatch County is 56.0 births per 1,000 women. Women with the education attainment of high school diploma have the highest fertility rate of 100.0 births per 1,000 women, while women with the education attainment of graduate degree have the lowest fertility at 35.0 births per 1,000 women. Women with the education attainment of high school diploma represent 34.8% of all women with births.
| Educational Attainment | Women with Births | Births / 1,000 Women |
| Less than High School | 52 (11.7%) | 39.0 |
| High School Diploma | 155 (34.8%) | 100.0 |
| College or Associate's Degree | 122 (27.4%) | 52.0 |
| Bachelor's Degree | 94 (21.1%) | 45.0 |
| Graduate Degree | 22 (4.9%) | 35.0 |
| Total | 445 (100.0%) | 56.0 |
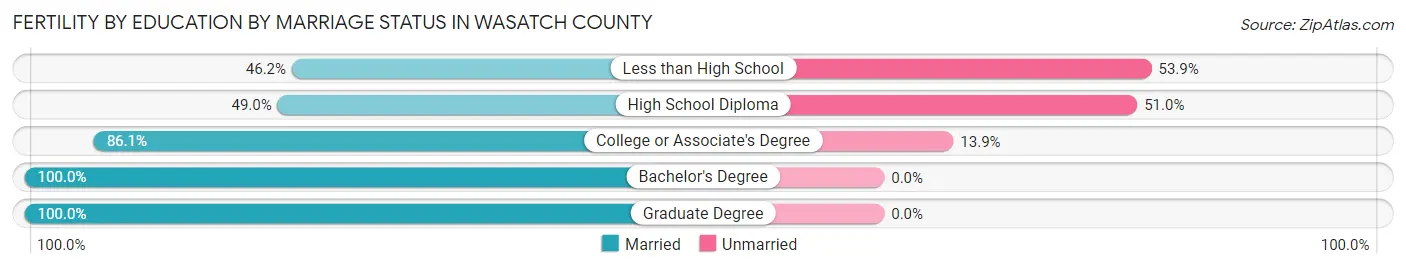
Fertility by Education by Marriage Status in Wasatch County
27.9% of women with births in Wasatch County are unmarried. Women with the educational attainment of bachelor's degree are most likely to be married with 100.0% of them married at childbirth, while women with the educational attainment of less than high school are least likely to be married with 53.8% of them unmarried at childbirth.
| Educational Attainment | Married | Unmarried |
| Less than High School | 24 (46.2%) | 28 (53.8%) |
| High School Diploma | 76 (49.0%) | 79 (51.0%) |
| College or Associate's Degree | 105 (86.1%) | 17 (13.9%) |
| Bachelor's Degree | 94 (100.0%) | 0 (0.0%) |
| Graduate Degree | 22 (100.0%) | 0 (0.0%) |
| Total | 321 (72.1%) | 124 (27.9%) |
Income in Wasatch County
Income Overview in Wasatch County
Per Capita Income in Wasatch County is $51,178, while median incomes of families and households are $119,919 and $104,855 respectively.
| Characteristic | Number | Measure |
| Per Capita Income | 35,009 | $51,178 |
| Median Family Income | 8,951 | $119,919 |
| Mean Family Income | 8,951 | $173,491 |
| Median Household Income | 11,407 | $104,855 |
| Mean Household Income | 11,407 | $152,417 |
| Income Deficit | 8,951 | $0 |
| Wage / Income Gap (%) | 35,009 | 56.82% |
| Wage / Income Gap ($) | 35,009 | 43.18¢ per $1 |
| Gini / Inequality Index | 35,009 | 0.48 |
Earnings by Sex in Wasatch County
Average Earnings in Wasatch County are $44,145, $58,262 for men and $25,160 for women, a difference of 56.8%.
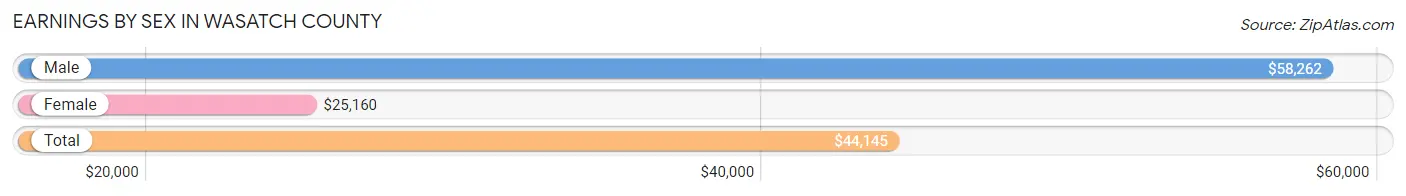
| Sex | Number | Average Earnings |
| Male | 10,661 (56.8%) | $58,262 |
| Female | 8,100 (43.2%) | $25,160 |
| Total | 18,761 (100.0%) | $44,145 |
Earnings by Sex by Income Bracket in Wasatch County
The most common earnings brackets in Wasatch County are $100,000+ for men (3,095 | 29.0%) and $2,499 or less for women (692 | 8.5%).
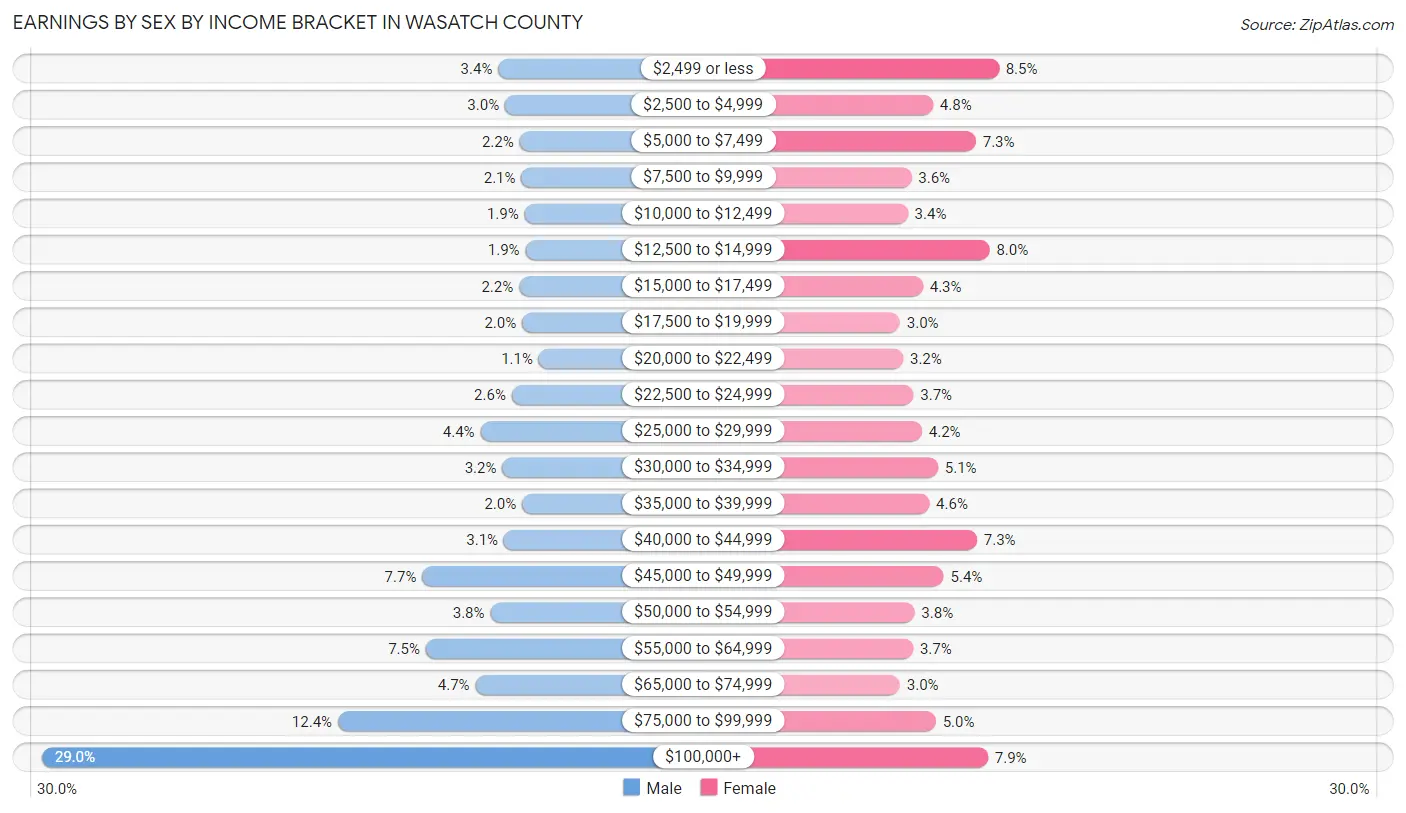
| Income | Male | Female |
| $2,499 or less | 360 (3.4%) | 692 (8.5%) |
| $2,500 to $4,999 | 320 (3.0%) | 392 (4.8%) |
| $5,000 to $7,499 | 232 (2.2%) | 587 (7.2%) |
| $7,500 to $9,999 | 222 (2.1%) | 294 (3.6%) |
| $10,000 to $12,499 | 203 (1.9%) | 277 (3.4%) |
| $12,500 to $14,999 | 197 (1.8%) | 650 (8.0%) |
| $15,000 to $17,499 | 236 (2.2%) | 346 (4.3%) |
| $17,500 to $19,999 | 218 (2.0%) | 241 (3.0%) |
| $20,000 to $22,499 | 117 (1.1%) | 256 (3.2%) |
| $22,500 to $24,999 | 279 (2.6%) | 303 (3.7%) |
| $25,000 to $29,999 | 467 (4.4%) | 342 (4.2%) |
| $30,000 to $34,999 | 336 (3.2%) | 415 (5.1%) |
| $35,000 to $39,999 | 218 (2.0%) | 375 (4.6%) |
| $40,000 to $44,999 | 326 (3.1%) | 592 (7.3%) |
| $45,000 to $49,999 | 816 (7.6%) | 441 (5.4%) |
| $50,000 to $54,999 | 407 (3.8%) | 308 (3.8%) |
| $55,000 to $64,999 | 794 (7.4%) | 301 (3.7%) |
| $65,000 to $74,999 | 497 (4.7%) | 241 (3.0%) |
| $75,000 to $99,999 | 1,321 (12.4%) | 405 (5.0%) |
| $100,000+ | 3,095 (29.0%) | 642 (7.9%) |
| Total | 10,661 (100.0%) | 8,100 (100.0%) |
Earnings by Sex by Educational Attainment in Wasatch County
Average earnings in Wasatch County are $73,372 for men and $32,009 for women, a difference of 56.4%. Men with an educational attainment of graduate degree enjoy the highest average annual earnings of $128,023, while those with high school diploma education earn the least with $41,788. Women with an educational attainment of graduate degree earn the most with the average annual earnings of $52,599, while those with college or associate's degree education have the smallest earnings of $25,060.
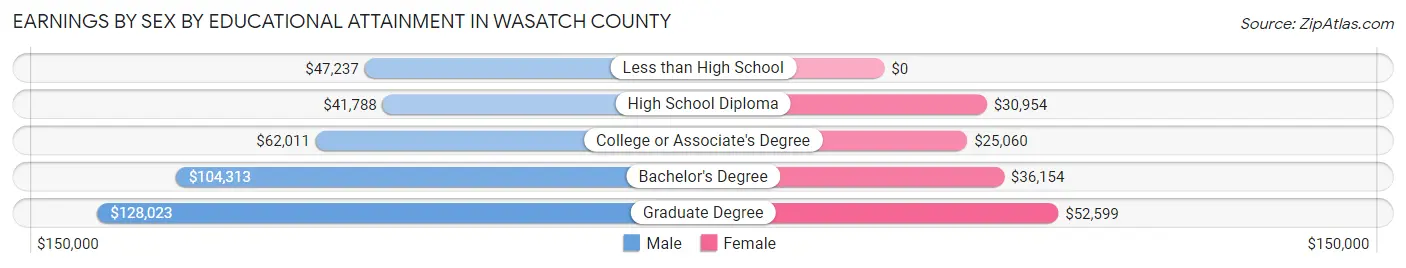
| Educational Attainment | Male Income | Female Income |
| Less than High School | $47,237 | $0 |
| High School Diploma | $41,788 | $30,954 |
| College or Associate's Degree | $62,011 | $25,060 |
| Bachelor's Degree | $104,313 | $36,154 |
| Graduate Degree | $128,023 | $52,599 |
| Total | $73,372 | $32,009 |
Family Income in Wasatch County
Family Income Brackets in Wasatch County
According to the Wasatch County family income data, there are 2,086 families falling into the $100,000 to $149,999 income range, which is the most common income bracket and makes up 23.3% of all families. Conversely, the $10,000 to $14,999 income bracket is the least frequent group with only 81 families (0.9%) belonging to this category.
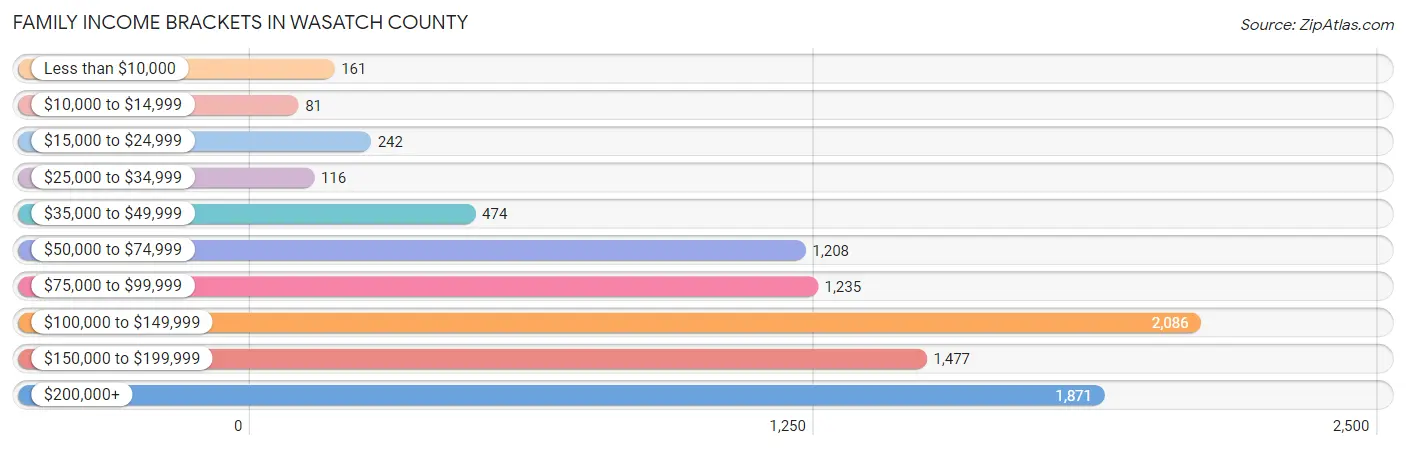
| Income Bracket | # Families | % Families |
| Less than $10,000 | 161 | 1.8% |
| $10,000 to $14,999 | 81 | 0.9% |
| $15,000 to $24,999 | 242 | 2.7% |
| $25,000 to $34,999 | 116 | 1.3% |
| $35,000 to $49,999 | 474 | 5.3% |
| $50,000 to $74,999 | 1,208 | 13.5% |
| $75,000 to $99,999 | 1,235 | 13.8% |
| $100,000 to $149,999 | 2,086 | 23.3% |
| $150,000 to $199,999 | 1,477 | 16.5% |
| $200,000+ | 1,871 | 20.9% |
Family Income by Famaliy Size in Wasatch County
4-person families (1,531 | 17.1%) account for the highest median family income in Wasatch County with $145,699 per family, while 2-person families (3,680 | 41.1%) have the highest median income of $57,026 per family member.
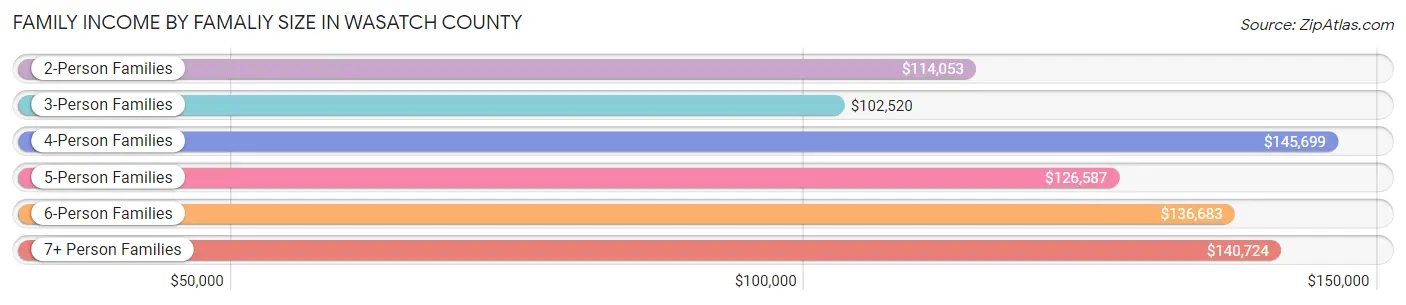
| Income Bracket | # Families | Median Income |
| 2-Person Families | 3,680 (41.1%) | $114,053 |
| 3-Person Families | 1,703 (19.0%) | $102,520 |
| 4-Person Families | 1,531 (17.1%) | $145,699 |
| 5-Person Families | 871 (9.7%) | $126,587 |
| 6-Person Families | 735 (8.2%) | $136,683 |
| 7+ Person Families | 431 (4.8%) | $140,724 |
| Total | 8,951 (100.0%) | $119,919 |
Family Income by Number of Earners in Wasatch County
The median family income in Wasatch County is $119,919, with families comprising 3+ earners (1,293) having the highest median family income of $137,356, while families with no earners (976) have the lowest median family income of $84,722, accounting for 14.4% and 10.9% of families, respectively.
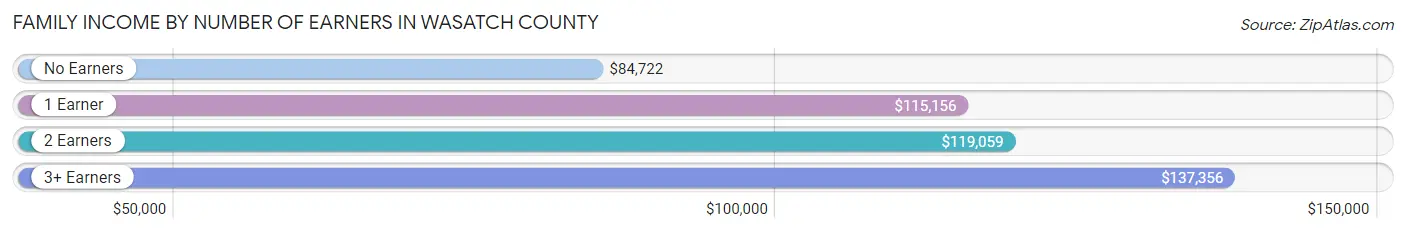
| Number of Earners | # Families | Median Income |
| No Earners | 976 (10.9%) | $84,722 |
| 1 Earner | 2,491 (27.8%) | $115,156 |
| 2 Earners | 4,191 (46.8%) | $119,059 |
| 3+ Earners | 1,293 (14.4%) | $137,356 |
| Total | 8,951 (100.0%) | $119,919 |
Household Income in Wasatch County
Household Income Brackets in Wasatch County
With 2,361 households falling in the category, the $100,000 to $149,999 income range is the most frequent in Wasatch County, accounting for 20.7% of all households. In contrast, only 194 households (1.7%) fall into the less than $10,000 income bracket, making it the least populous group.
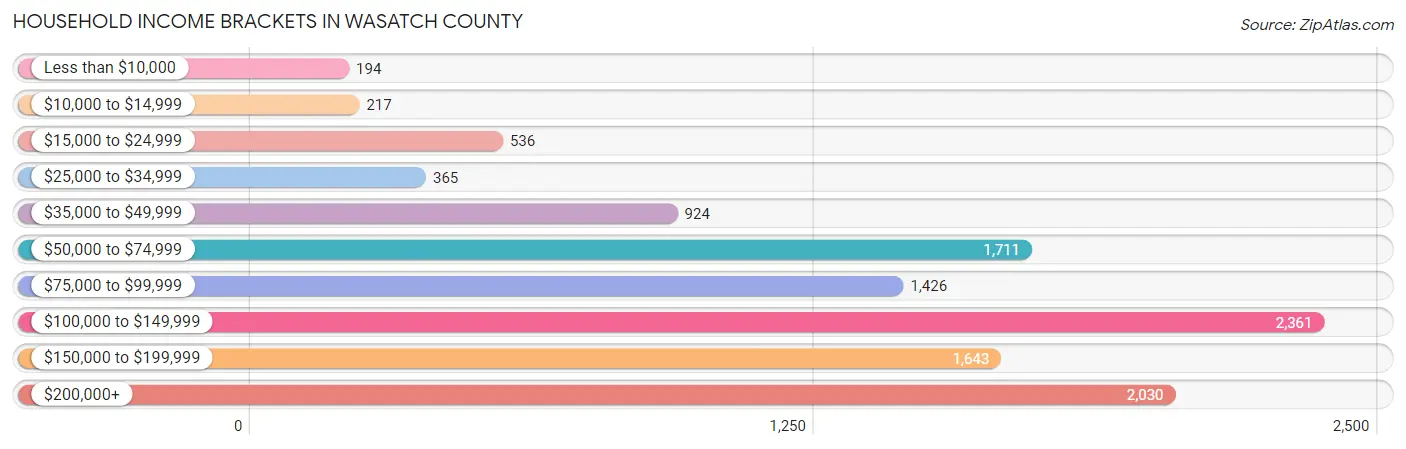
| Income Bracket | # Households | % Households |
| Less than $10,000 | 194 | 1.7% |
| $10,000 to $14,999 | 217 | 1.9% |
| $15,000 to $24,999 | 536 | 4.7% |
| $25,000 to $34,999 | 365 | 3.2% |
| $35,000 to $49,999 | 924 | 8.1% |
| $50,000 to $74,999 | 1,711 | 15.0% |
| $75,000 to $99,999 | 1,426 | 12.5% |
| $100,000 to $149,999 | 2,361 | 20.7% |
| $150,000 to $199,999 | 1,643 | 14.4% |
| $200,000+ | 2,030 | 17.8% |
Household Income by Householder Age in Wasatch County
The median household income in Wasatch County is $104,855, with the highest median household income of $117,703 found in the 25 to 44 years age bracket for the primary householder. A total of 3,727 households (32.7%) fall into this category. Meanwhile, the 15 to 24 years age bracket for the primary householder has the lowest median household income of $58,910, with 629 households (5.5%) in this group.
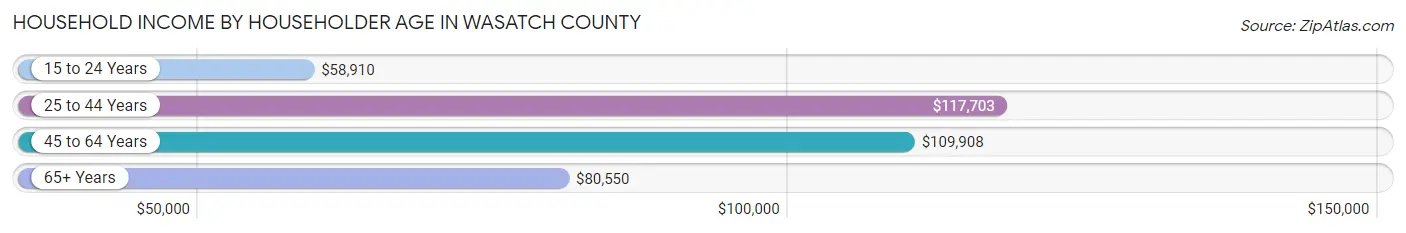
| Income Bracket | # Households | Median Income |
| 15 to 24 Years | 629 (5.5%) | $58,910 |
| 25 to 44 Years | 3,727 (32.7%) | $117,703 |
| 45 to 64 Years | 4,443 (39.0%) | $109,908 |
| 65+ Years | 2,608 (22.9%) | $80,550 |
| Total | 11,407 (100.0%) | $104,855 |
Poverty in Wasatch County
Income Below Poverty by Sex and Age in Wasatch County
With 5.3% poverty level for males and 5.4% for females among the residents of Wasatch County, 5 year old males and under 5 year old females are the most vulnerable to poverty, with 34 males (16.5%) and 127 females (10.7%) in their respective age groups living below the poverty level.
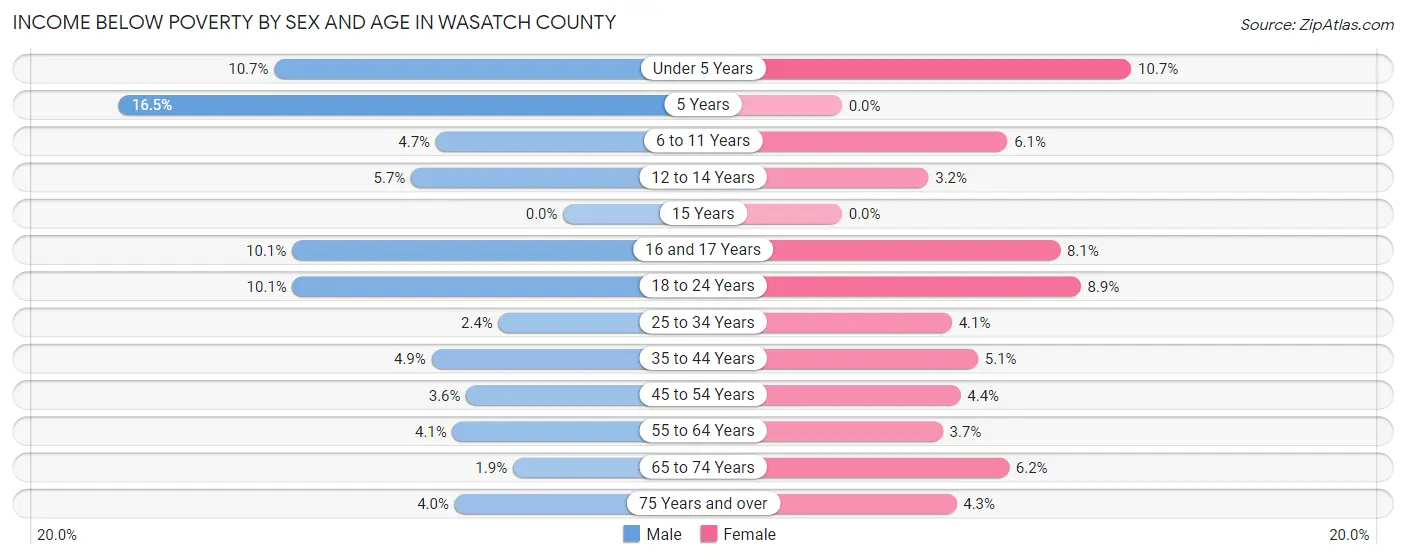
| Age Bracket | Male | Female |
| Under 5 Years | 133 (10.7%) | 127 (10.7%) |
| 5 Years | 34 (16.5%) | 0 (0.0%) |
| 6 to 11 Years | 100 (4.7%) | 99 (6.1%) |
| 12 to 14 Years | 47 (5.7%) | 34 (3.2%) |
| 15 Years | 0 (0.0%) | 0 (0.0%) |
| 16 and 17 Years | 76 (10.1%) | 49 (8.1%) |
| 18 to 24 Years | 162 (10.1%) | 135 (8.9%) |
| 25 to 34 Years | 44 (2.4%) | 74 (4.1%) |
| 35 to 44 Years | 122 (4.9%) | 125 (5.1%) |
| 45 to 54 Years | 79 (3.6%) | 88 (4.4%) |
| 55 to 64 Years | 84 (4.1%) | 74 (3.7%) |
| 65 to 74 Years | 28 (1.9%) | 90 (6.2%) |
| 75 Years and over | 29 (4.0%) | 31 (4.3%) |
| Total | 938 (5.3%) | 926 (5.4%) |
Income Above Poverty by Sex and Age in Wasatch County
According to the poverty statistics in Wasatch County, males aged 15 years and females aged 5 years are the age groups that are most secure financially, with 100.0% of males and 100.0% of females in these age groups living above the poverty line.
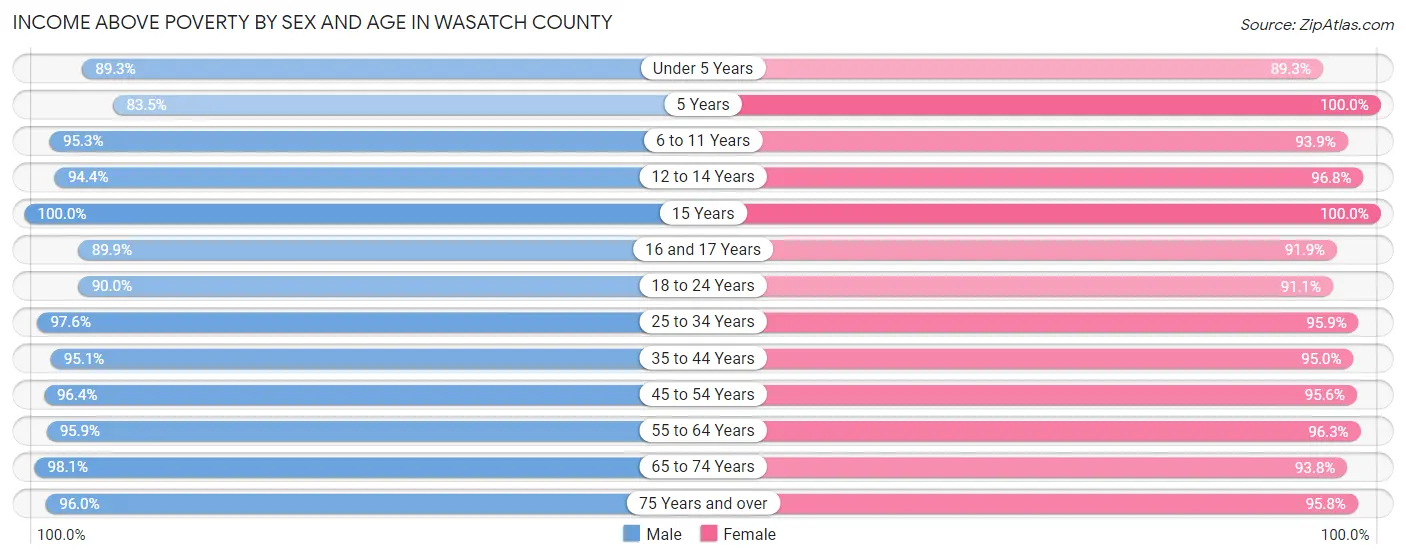
| Age Bracket | Male | Female |
| Under 5 Years | 1,107 (89.3%) | 1,055 (89.3%) |
| 5 Years | 172 (83.5%) | 248 (100.0%) |
| 6 to 11 Years | 2,015 (95.3%) | 1,513 (93.9%) |
| 12 to 14 Years | 785 (94.4%) | 1,026 (96.8%) |
| 15 Years | 228 (100.0%) | 328 (100.0%) |
| 16 and 17 Years | 679 (89.9%) | 556 (91.9%) |
| 18 to 24 Years | 1,450 (89.9%) | 1,389 (91.1%) |
| 25 to 34 Years | 1,788 (97.6%) | 1,741 (95.9%) |
| 35 to 44 Years | 2,372 (95.1%) | 2,350 (95.0%) |
| 45 to 54 Years | 2,113 (96.4%) | 1,913 (95.6%) |
| 55 to 64 Years | 1,961 (95.9%) | 1,906 (96.3%) |
| 65 to 74 Years | 1,467 (98.1%) | 1,362 (93.8%) |
| 75 Years and over | 691 (96.0%) | 698 (95.8%) |
| Total | 16,828 (94.7%) | 16,085 (94.6%) |
Income Below Poverty Among Married-Couple Families in Wasatch County
The poverty statistics for married-couple families in Wasatch County show that 1.9% or 148 of the total 7,946 families live below the poverty line. Families with 3 or 4 children have the highest poverty rate of 4.1%, comprising of 62 families. On the other hand, families with 5 or more children have the lowest poverty rate of 0.0%, which includes 0 families.
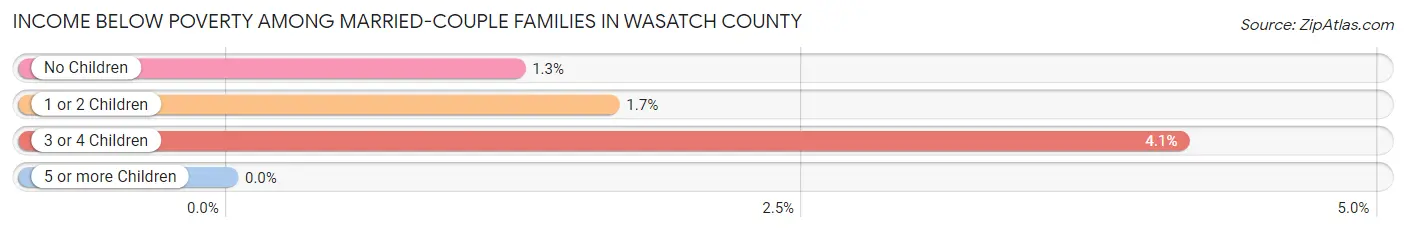
| Children | Above Poverty | Below Poverty |
| No Children | 4,112 (98.8%) | 52 (1.3%) |
| 1 or 2 Children | 2,019 (98.3%) | 34 (1.7%) |
| 3 or 4 Children | 1,434 (95.9%) | 62 (4.1%) |
| 5 or more Children | 233 (100.0%) | 0 (0.0%) |
| Total | 7,798 (98.1%) | 148 (1.9%) |
Income Below Poverty Among Single-Parent Households in Wasatch County
According to the poverty data in Wasatch County, 17.1% or 70 single-father households and 16.6% or 99 single-mother households are living below the poverty line. Among single-father households, those with no children have the highest poverty rate, with 66 households (44.3%) experiencing poverty. Likewise, among single-mother households, those with 3 or 4 children have the highest poverty rate, with 26 households (46.4%) falling below the poverty line.
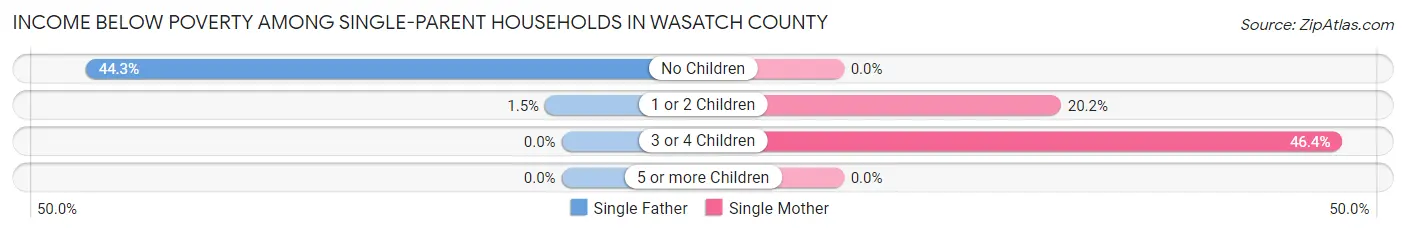
| Children | Single Father | Single Mother |
| No Children | 66 (44.3%) | 0 (0.0%) |
| 1 or 2 Children | 4 (1.5%) | 73 (20.2%) |
| 3 or 4 Children | 0 (0.0%) | 26 (46.4%) |
| 5 or more Children | 0 (0.0%) | 0 (0.0%) |
| Total | 70 (17.1%) | 99 (16.6%) |
Income Below Poverty Among Married-Couple vs Single-Parent Households in Wasatch County
The poverty data for Wasatch County shows that 148 of the married-couple family households (1.9%) and 169 of the single-parent households (16.8%) are living below the poverty level. Within the married-couple family households, those with 3 or 4 children have the highest poverty rate, with 62 households (4.1%) falling below the poverty line. Among the single-parent households, those with 3 or 4 children have the highest poverty rate, with 26 household (45.6%) living below poverty.
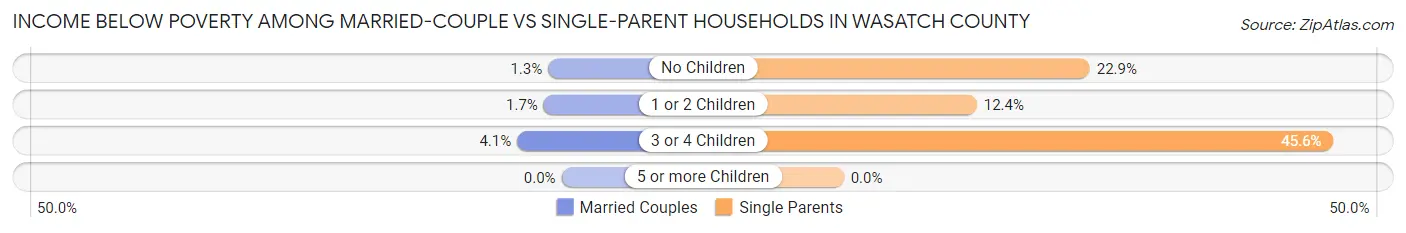
| Children | Married-Couple Families | Single-Parent Households |
| No Children | 52 (1.3%) | 66 (22.9%) |
| 1 or 2 Children | 34 (1.7%) | 77 (12.4%) |
| 3 or 4 Children | 62 (4.1%) | 26 (45.6%) |
| 5 or more Children | 0 (0.0%) | 0 (0.0%) |
| Total | 148 (1.9%) | 169 (16.8%) |
Employment Characteristics in Wasatch County
Employment by Class of Employer in Wasatch County
Among the 16,948 employed individuals in Wasatch County, private company employees (10,520 | 62.1%), local government employees (1,744 | 10.3%), and self-employed (incorporated) (1,427 | 8.4%) make up the most common classes of employment.
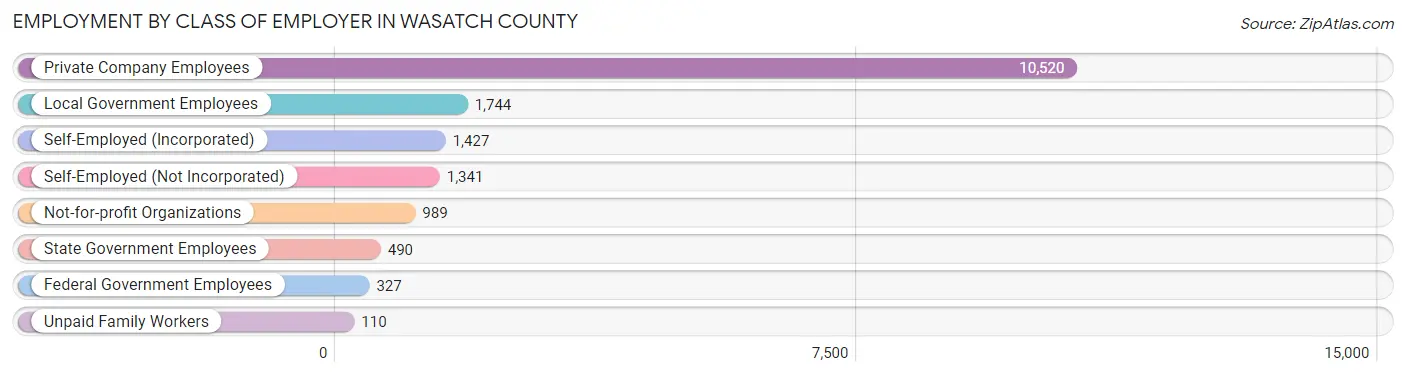
| Employer Class | # Employees | % Employees |
| Private Company Employees | 10,520 | 62.1% |
| Self-Employed (Incorporated) | 1,427 | 8.4% |
| Self-Employed (Not Incorporated) | 1,341 | 7.9% |
| Not-for-profit Organizations | 989 | 5.8% |
| Local Government Employees | 1,744 | 10.3% |
| State Government Employees | 490 | 2.9% |
| Federal Government Employees | 327 | 1.9% |
| Unpaid Family Workers | 110 | 0.6% |
| Total | 16,948 | 100.0% |
Employment Status by Age in Wasatch County
According to the labor force statistics for Wasatch County, out of the total population over 16 years of age (25,874), 68.3% or 17,672 individuals are in the labor force, with 2.4% or 424 of them unemployed. The age group with the highest labor force participation rate is 45 to 54 years, with 89.7% or 3,767 individuals in the labor force. Within the labor force, the 16 to 19 years age range has the highest percentage of unemployed individuals, with 14.8% or 179 of them being unemployed.
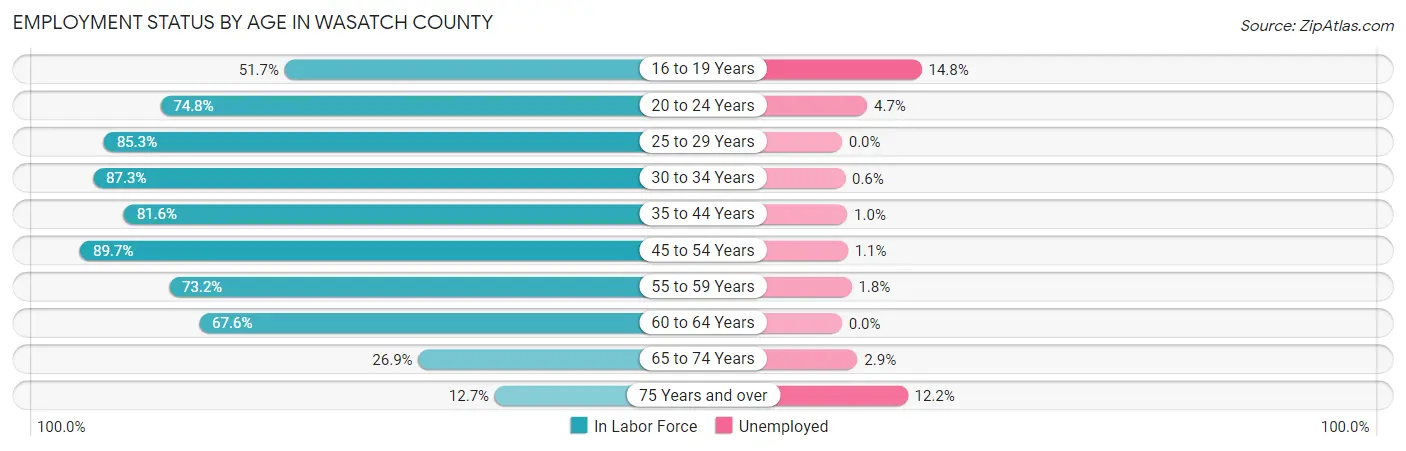
| Age Bracket | In Labor Force | Unemployed |
| 16 to 19 Years | 1,211 (51.7%) | 179 (14.8%) |
| 20 to 24 Years | 1,615 (74.8%) | 76 (4.7%) |
| 25 to 29 Years | 1,466 (85.3%) | 0 (0.0%) |
| 30 to 34 Years | 1,712 (87.3%) | 10 (0.6%) |
| 35 to 44 Years | 4,062 (81.6%) | 41 (1.0%) |
| 45 to 54 Years | 3,767 (89.7%) | 41 (1.1%) |
| 55 to 59 Years | 1,446 (73.2%) | 26 (1.8%) |
| 60 to 64 Years | 1,404 (67.6%) | 0 (0.0%) |
| 65 to 74 Years | 799 (26.9%) | 23 (2.9%) |
| 75 Years and over | 189 (12.7%) | 23 (12.2%) |
| Total | 17,672 (68.3%) | 424 (2.4%) |
Employment Status by Educational Attainment in Wasatch County
According to labor force statistics for Wasatch County, 82.0% of individuals (13,867) out of the total population between 25 and 64 years of age (16,911) are in the labor force, with 0.9% or 125 of them being unemployed. The group with the highest labor force participation rate are those with the educational attainment of less than high school, with 84.1% or 665 individuals in the labor force. Within the labor force, individuals with less than high school education have the highest percentage of unemployment, with 4.1% or 27 of them being unemployed.
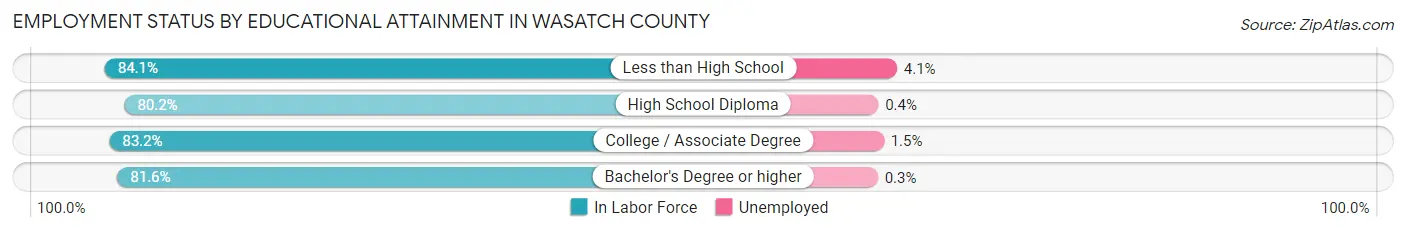
| Educational Attainment | In Labor Force | Unemployed |
| Less than High School | 665 (84.1%) | 32 (4.1%) |
| High School Diploma | 2,478 (80.2%) | 12 (0.4%) |
| College / Associate Degree | 4,117 (83.2%) | 74 (1.5%) |
| Bachelor's Degree or higher | 6,595 (81.6%) | 24 (0.3%) |
| Total | 13,867 (82.0%) | 152 (0.9%) |
Employment Occupations by Sex in Wasatch County
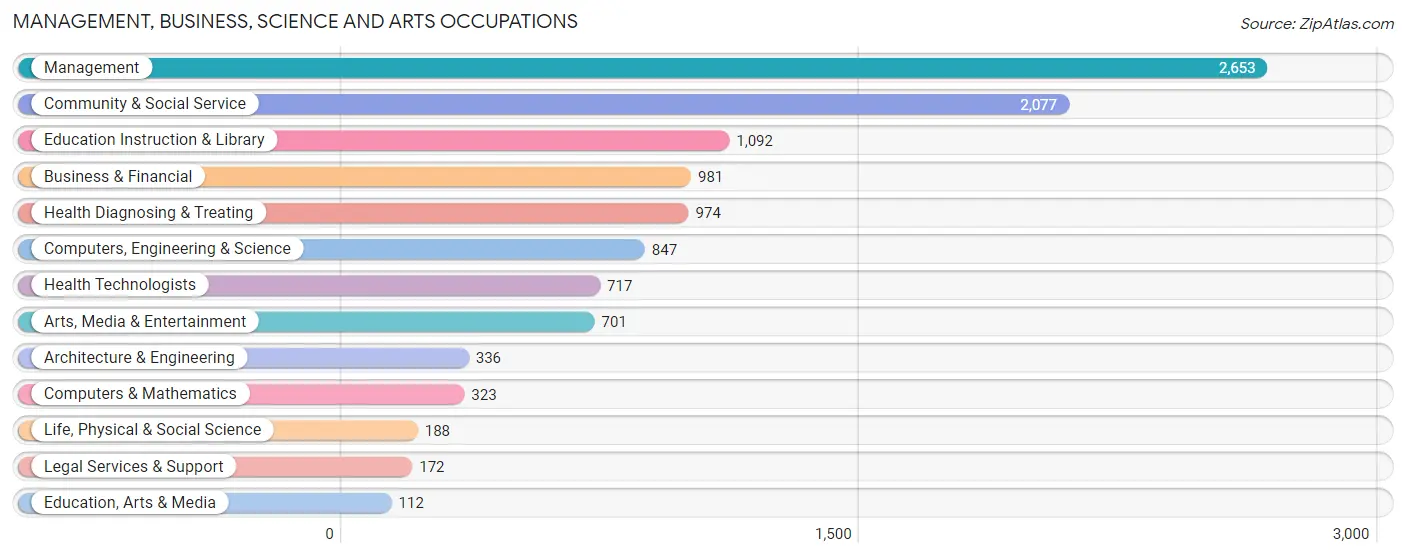
Management, Business, Science and Arts Occupations
The most common Management, Business, Science and Arts occupations in Wasatch County are Management (2,653 | 15.4%), Community & Social Service (2,077 | 12.1%), Education Instruction & Library (1,092 | 6.4%), Business & Financial (981 | 5.7%), and Health Diagnosing & Treating (974 | 5.7%).
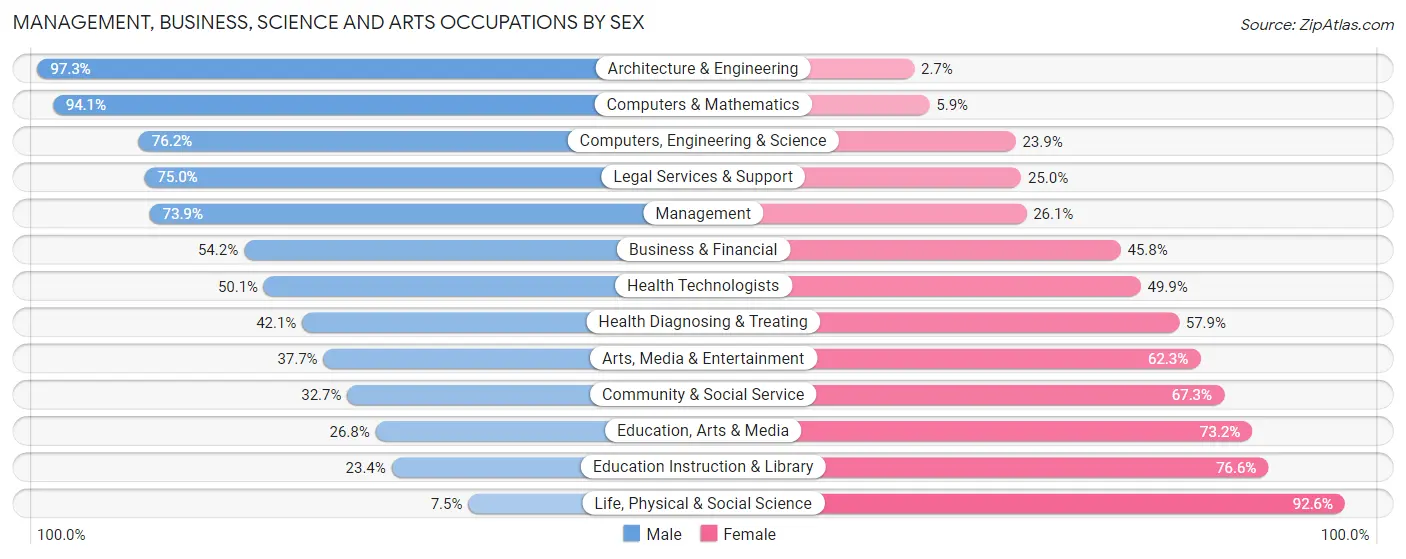
Management, Business, Science and Arts Occupations by Sex
Within the Management, Business, Science and Arts occupations in Wasatch County, the most male-oriented occupations are Architecture & Engineering (97.3%), Computers & Mathematics (94.1%), and Computers, Engineering & Science (76.1%), while the most female-oriented occupations are Life, Physical & Social Science (92.5%), Education Instruction & Library (76.6%), and Education, Arts & Media (73.2%).
| Occupation | Male | Female |
| Management | 1,961 (73.9%) | 692 (26.1%) |
| Business & Financial | 532 (54.2%) | 449 (45.8%) |
| Computers, Engineering & Science | 645 (76.1%) | 202 (23.8%) |
| Computers & Mathematics | 304 (94.1%) | 19 (5.9%) |
| Architecture & Engineering | 327 (97.3%) | 9 (2.7%) |
| Life, Physical & Social Science | 14 (7.4%) | 174 (92.5%) |
| Community & Social Service | 679 (32.7%) | 1,398 (67.3%) |
| Education, Arts & Media | 30 (26.8%) | 82 (73.2%) |
| Legal Services & Support | 129 (75.0%) | 43 (25.0%) |
| Education Instruction & Library | 256 (23.4%) | 836 (76.6%) |
| Arts, Media & Entertainment | 264 (37.7%) | 437 (62.3%) |
| Health Diagnosing & Treating | 410 (42.1%) | 564 (57.9%) |
| Health Technologists | 359 (50.1%) | 358 (49.9%) |
| Total (Category) | 4,227 (56.1%) | 3,305 (43.9%) |
| Total (Overall) | 9,801 (57.0%) | 7,404 (43.0%) |
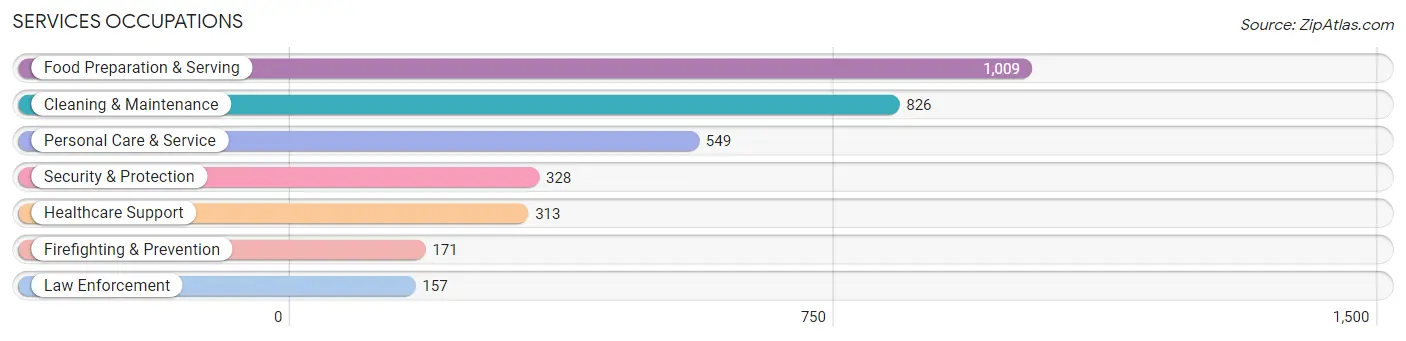
Services Occupations
The most common Services occupations in Wasatch County are Food Preparation & Serving (1,009 | 5.9%), Cleaning & Maintenance (826 | 4.8%), Personal Care & Service (549 | 3.2%), Security & Protection (328 | 1.9%), and Healthcare Support (313 | 1.8%).
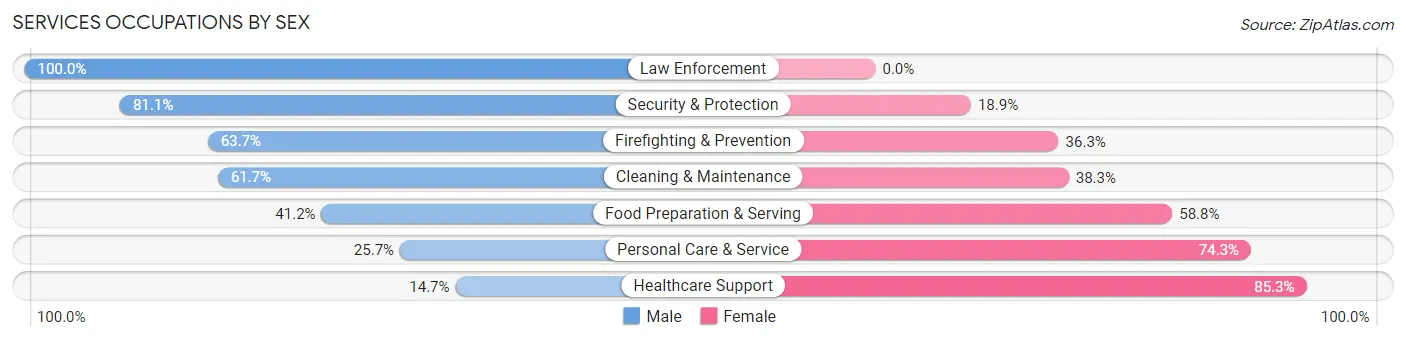
Services Occupations by Sex
Within the Services occupations in Wasatch County, the most male-oriented occupations are Law Enforcement (100.0%), Security & Protection (81.1%), and Firefighting & Prevention (63.7%), while the most female-oriented occupations are Healthcare Support (85.3%), Personal Care & Service (74.3%), and Food Preparation & Serving (58.8%).
| Occupation | Male | Female |
| Healthcare Support | 46 (14.7%) | 267 (85.3%) |
| Security & Protection | 266 (81.1%) | 62 (18.9%) |
| Firefighting & Prevention | 109 (63.7%) | 62 (36.3%) |
| Law Enforcement | 157 (100.0%) | 0 (0.0%) |
| Food Preparation & Serving | 416 (41.2%) | 593 (58.8%) |
| Cleaning & Maintenance | 510 (61.7%) | 316 (38.3%) |
| Personal Care & Service | 141 (25.7%) | 408 (74.3%) |
| Total (Category) | 1,379 (45.6%) | 1,646 (54.4%) |
| Total (Overall) | 9,801 (57.0%) | 7,404 (43.0%) |
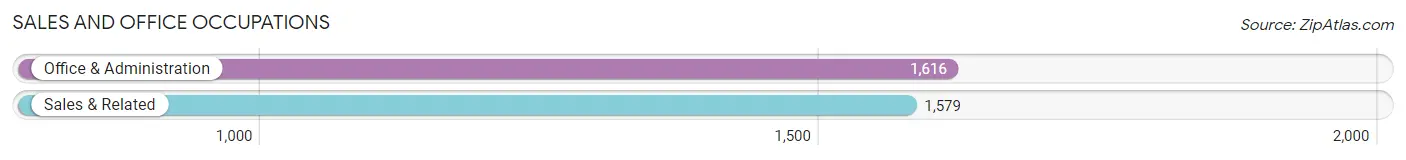
Sales and Office Occupations
The most common Sales and Office occupations in Wasatch County are Office & Administration (1,616 | 9.4%), and Sales & Related (1,579 | 9.2%).
Sales and Office Occupations by Sex
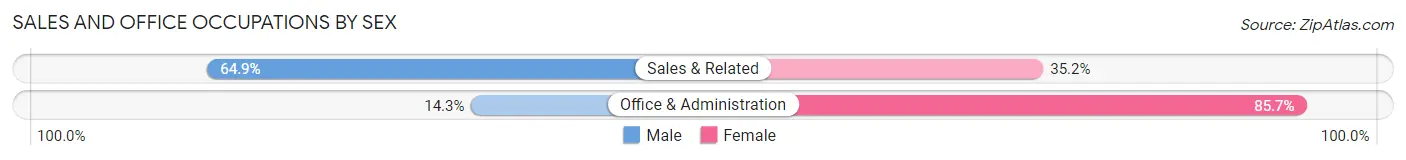
| Occupation | Male | Female |
| Sales & Related | 1,024 (64.8%) | 555 (35.1%) |
| Office & Administration | 231 (14.3%) | 1,385 (85.7%) |
| Total (Category) | 1,255 (39.3%) | 1,940 (60.7%) |
| Total (Overall) | 9,801 (57.0%) | 7,404 (43.0%) |
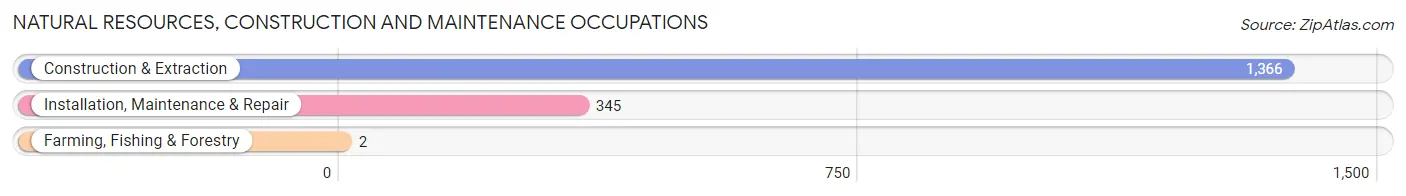
Natural Resources, Construction and Maintenance Occupations
The most common Natural Resources, Construction and Maintenance occupations in Wasatch County are Construction & Extraction (1,366 | 7.9%), Installation, Maintenance & Repair (345 | 2.0%), and Farming, Fishing & Forestry (2 | 0.0%).
Natural Resources, Construction and Maintenance Occupations by Sex
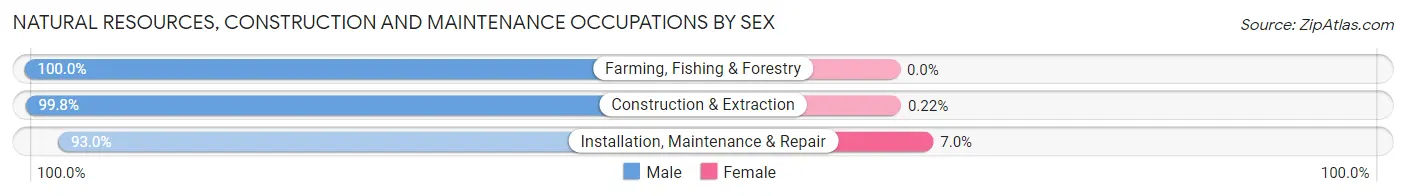
| Occupation | Male | Female |
| Farming, Fishing & Forestry | 2 (100.0%) | 0 (0.0%) |
| Construction & Extraction | 1,363 (99.8%) | 3 (0.2%) |
| Installation, Maintenance & Repair | 321 (93.0%) | 24 (7.0%) |
| Total (Category) | 1,686 (98.4%) | 27 (1.6%) |
| Total (Overall) | 9,801 (57.0%) | 7,404 (43.0%) |
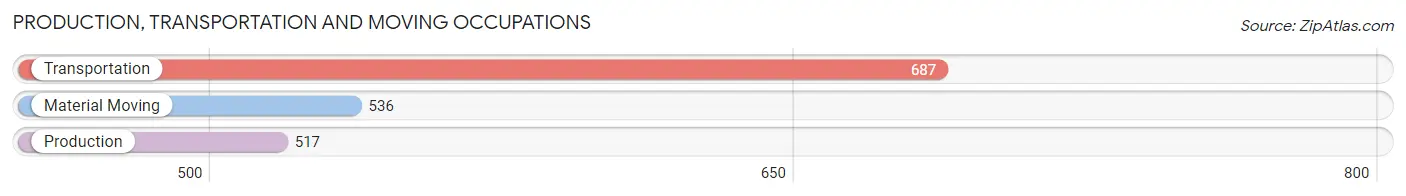
Production, Transportation and Moving Occupations
The most common Production, Transportation and Moving occupations in Wasatch County are Transportation (687 | 4.0%), Material Moving (536 | 3.1%), and Production (517 | 3.0%).
Production, Transportation and Moving Occupations by Sex
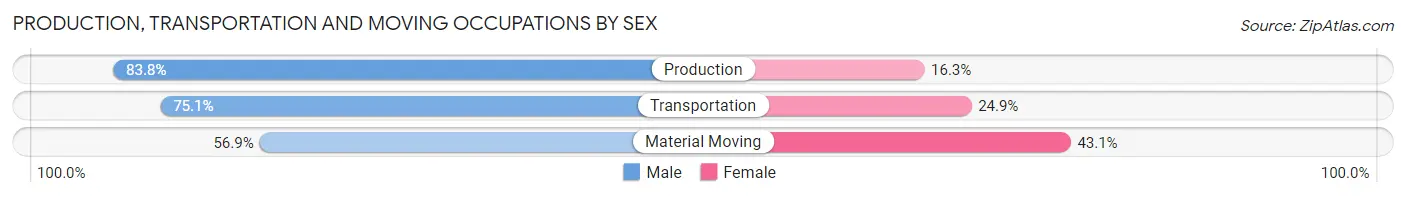
| Occupation | Male | Female |
| Production | 433 (83.8%) | 84 (16.3%) |
| Transportation | 516 (75.1%) | 171 (24.9%) |
| Material Moving | 305 (56.9%) | 231 (43.1%) |
| Total (Category) | 1,254 (72.1%) | 486 (27.9%) |
| Total (Overall) | 9,801 (57.0%) | 7,404 (43.0%) |
Employment Industries by Sex in Wasatch County
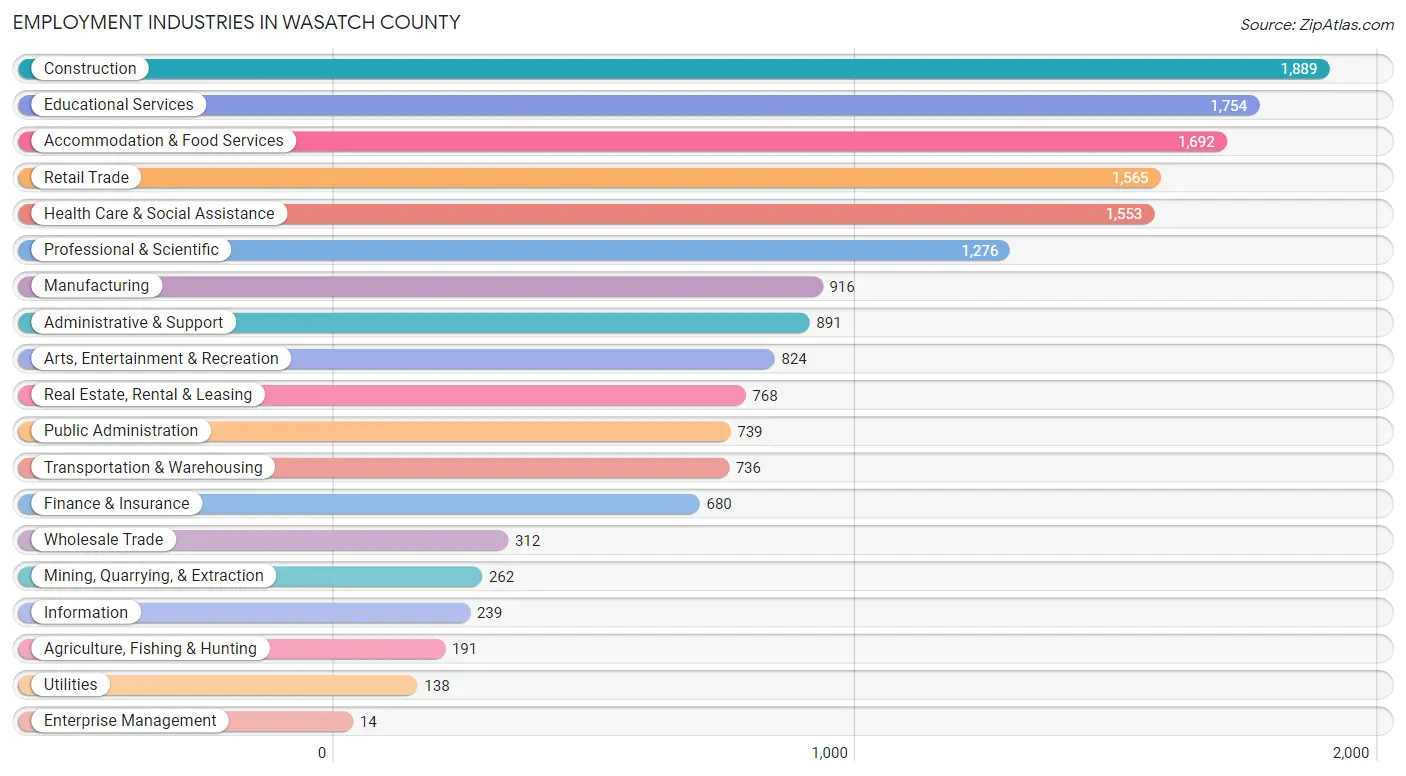
Employment Industries in Wasatch County
The major employment industries in Wasatch County include Construction (1,889 | 11.0%), Educational Services (1,754 | 10.2%), Accommodation & Food Services (1,692 | 9.8%), Retail Trade (1,565 | 9.1%), and Health Care & Social Assistance (1,553 | 9.0%).
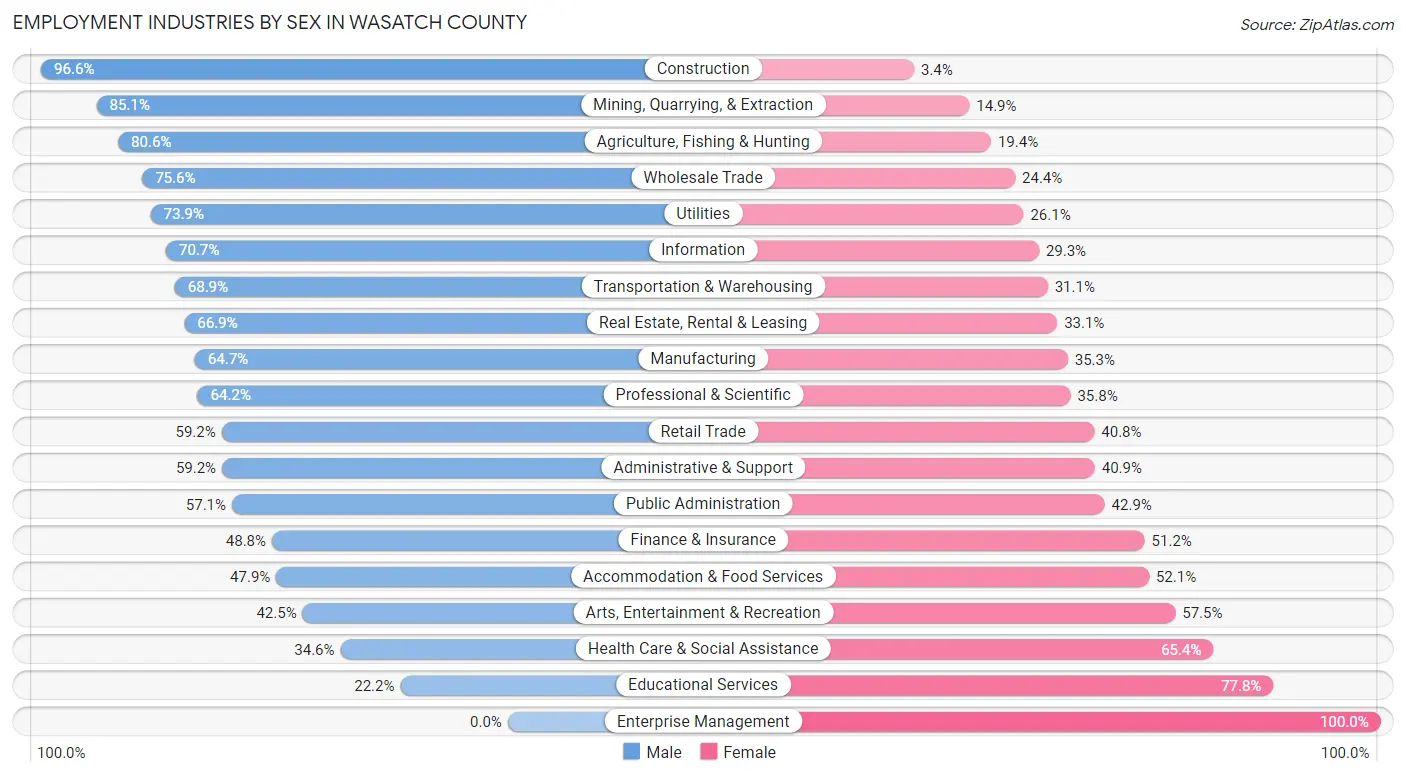
Employment Industries by Sex in Wasatch County
The Wasatch County industries that see more men than women are Construction (96.6%), Mining, Quarrying, & Extraction (85.1%), and Agriculture, Fishing & Hunting (80.6%), whereas the industries that tend to have a higher number of women are Enterprise Management (100.0%), Educational Services (77.8%), and Health Care & Social Assistance (65.4%).
| Industry | Male | Female |
| Agriculture, Fishing & Hunting | 154 (80.6%) | 37 (19.4%) |
| Mining, Quarrying, & Extraction | 223 (85.1%) | 39 (14.9%) |
| Construction | 1,824 (96.6%) | 65 (3.4%) |
| Manufacturing | 593 (64.7%) | 323 (35.3%) |
| Wholesale Trade | 236 (75.6%) | 76 (24.4%) |
| Retail Trade | 927 (59.2%) | 638 (40.8%) |
| Transportation & Warehousing | 507 (68.9%) | 229 (31.1%) |
| Utilities | 102 (73.9%) | 36 (26.1%) |
| Information | 169 (70.7%) | 70 (29.3%) |
| Finance & Insurance | 332 (48.8%) | 348 (51.2%) |
| Real Estate, Rental & Leasing | 514 (66.9%) | 254 (33.1%) |
| Professional & Scientific | 819 (64.2%) | 457 (35.8%) |
| Enterprise Management | 0 (0.0%) | 14 (100.0%) |
| Administrative & Support | 527 (59.2%) | 364 (40.8%) |
| Educational Services | 390 (22.2%) | 1,364 (77.8%) |
| Health Care & Social Assistance | 538 (34.6%) | 1,015 (65.4%) |
| Arts, Entertainment & Recreation | 350 (42.5%) | 474 (57.5%) |
| Accommodation & Food Services | 811 (47.9%) | 881 (52.1%) |
| Public Administration | 422 (57.1%) | 317 (42.9%) |
| Total | 9,801 (57.0%) | 7,404 (43.0%) |
Education in Wasatch County
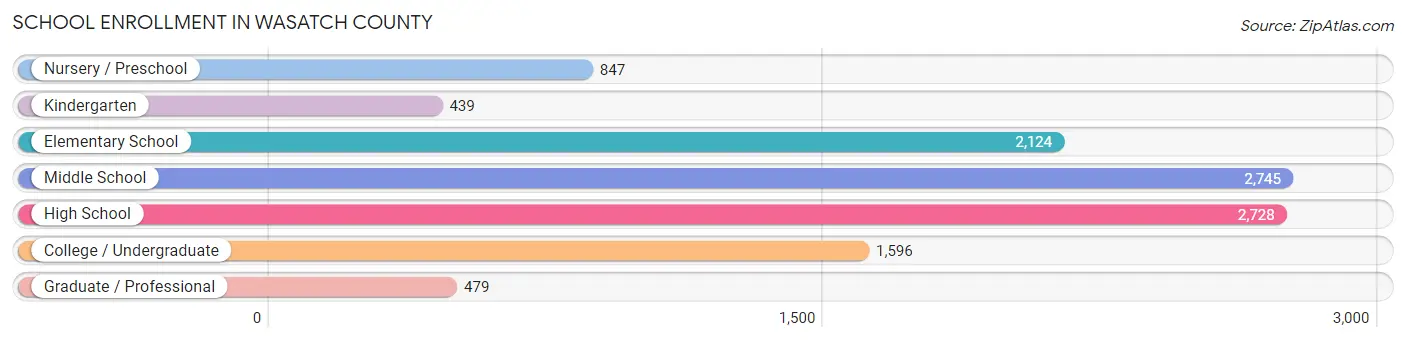
School Enrollment in Wasatch County
The most common levels of schooling among the 10,958 students in Wasatch County are middle school (2,745 | 25.1%), high school (2,728 | 24.9%), and elementary school (2,124 | 19.4%).
| School Level | # Students | % Students |
| Nursery / Preschool | 847 | 7.7% |
| Kindergarten | 439 | 4.0% |
| Elementary School | 2,124 | 19.4% |
| Middle School | 2,745 | 25.1% |
| High School | 2,728 | 24.9% |
| College / Undergraduate | 1,596 | 14.6% |
| Graduate / Professional | 479 | 4.4% |
| Total | 10,958 | 100.0% |
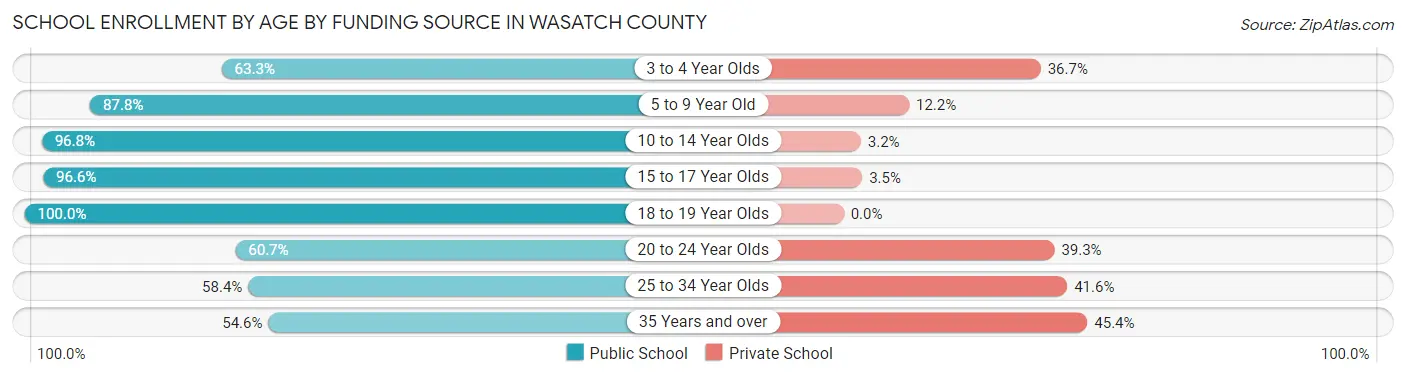
School Enrollment by Age by Funding Source in Wasatch County
Out of a total of 10,958 students who are enrolled in schools in Wasatch County, 1,534 (14.0%) attend a private institution, while the remaining 9,424 (86.0%) are enrolled in public schools. The age group of 35 years and over has the highest likelihood of being enrolled in private schools, with 197 (45.4% in the age bracket) enrolled. Conversely, the age group of 18 to 19 year olds has the lowest likelihood of being enrolled in a private school, with 619 (100.0% in the age bracket) attending a public institution.
| Age Bracket | Public School | Private School |
| 3 to 4 Year Olds | 469 (63.3%) | 272 (36.7%) |
| 5 to 9 Year Old | 2,177 (87.8%) | 302 (12.2%) |
| 10 to 14 Year Olds | 3,263 (96.8%) | 108 (3.2%) |
| 15 to 17 Year Olds | 1,791 (96.6%) | 64 (3.5%) |
| 18 to 19 Year Olds | 619 (100.0%) | 0 (0.0%) |
| 20 to 24 Year Olds | 523 (60.7%) | 338 (39.3%) |
| 25 to 34 Year Olds | 349 (58.4%) | 249 (41.6%) |
| 35 Years and over | 237 (54.6%) | 197 (45.4%) |
| Total | 9,424 (86.0%) | 1,534 (14.0%) |
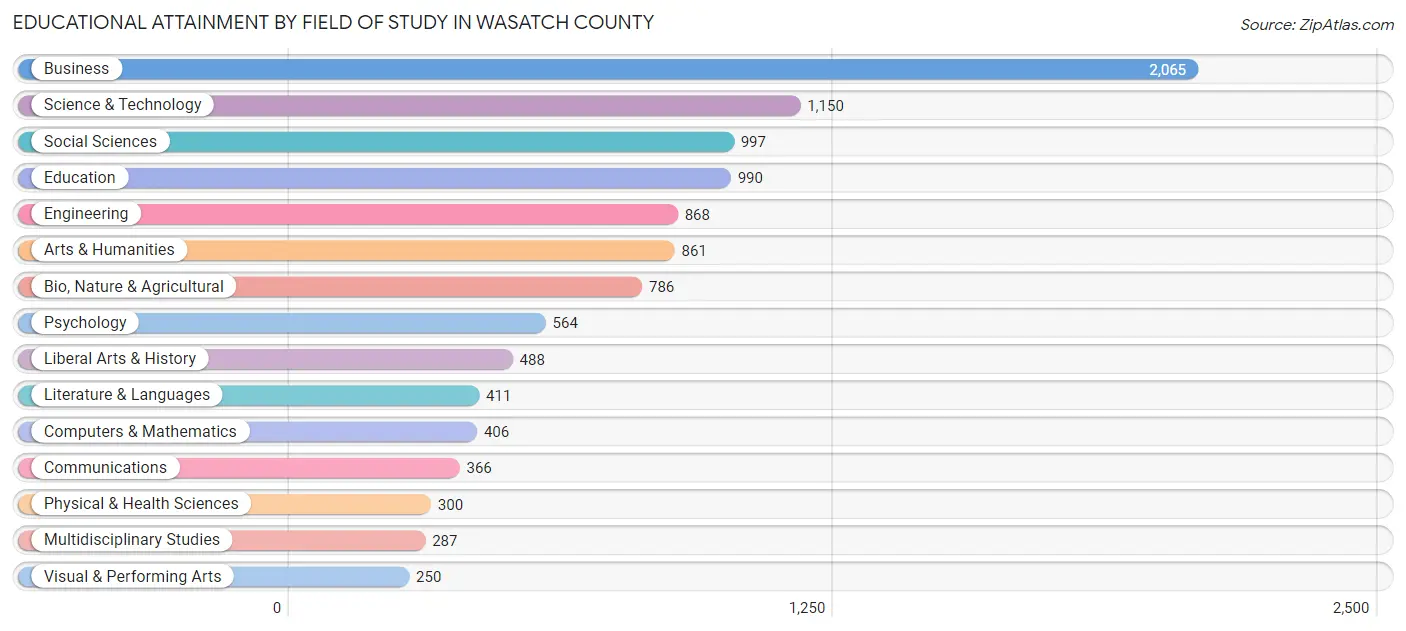
Educational Attainment by Field of Study in Wasatch County
Business (2,065 | 19.1%), science & technology (1,150 | 10.7%), social sciences (997 | 9.2%), education (990 | 9.2%), and engineering (868 | 8.1%) are the most common fields of study among 10,789 individuals in Wasatch County who have obtained a bachelor's degree or higher.
| Field of Study | # Graduates | % Graduates |
| Computers & Mathematics | 406 | 3.8% |
| Bio, Nature & Agricultural | 786 | 7.3% |
| Physical & Health Sciences | 300 | 2.8% |
| Psychology | 564 | 5.2% |
| Social Sciences | 997 | 9.2% |
| Engineering | 868 | 8.1% |
| Multidisciplinary Studies | 287 | 2.7% |
| Science & Technology | 1,150 | 10.7% |
| Business | 2,065 | 19.1% |
| Education | 990 | 9.2% |
| Literature & Languages | 411 | 3.8% |
| Liberal Arts & History | 488 | 4.5% |
| Visual & Performing Arts | 250 | 2.3% |
| Communications | 366 | 3.4% |
| Arts & Humanities | 861 | 8.0% |
| Total | 10,789 | 100.0% |
Transportation & Commute in Wasatch County
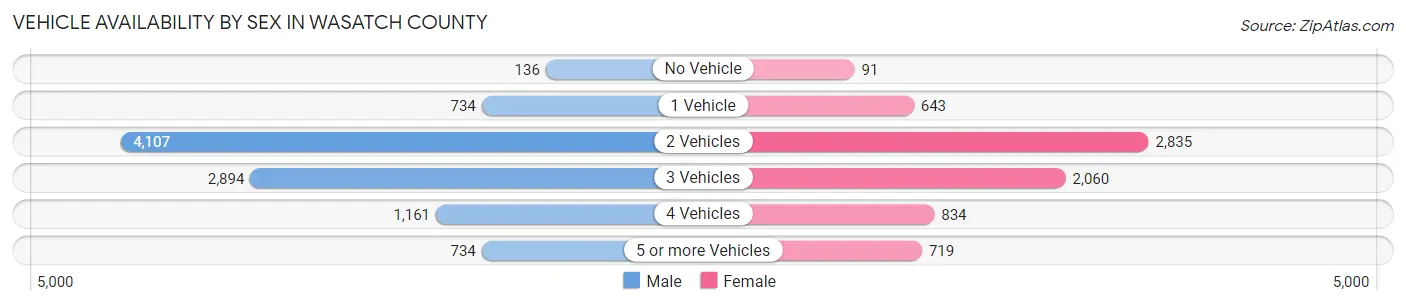
Vehicle Availability by Sex in Wasatch County
The most prevalent vehicle ownership categories in Wasatch County are males with 2 vehicles (4,107, accounting for 42.0%) and females with 2 vehicles (2,835, making up 57.2%).
| Vehicles Available | Male | Female |
| No Vehicle | 136 (1.4%) | 91 (1.3%) |
| 1 Vehicle | 734 (7.5%) | 643 (8.9%) |
| 2 Vehicles | 4,107 (42.0%) | 2,835 (39.5%) |
| 3 Vehicles | 2,894 (29.6%) | 2,060 (28.7%) |
| 4 Vehicles | 1,161 (11.9%) | 834 (11.6%) |
| 5 or more Vehicles | 734 (7.5%) | 719 (10.0%) |
| Total | 9,766 (100.0%) | 7,182 (100.0%) |
Commute Time in Wasatch County
The most frequently occuring commute durations in Wasatch County are 5 to 9 minutes (2,410 commuters, 17.0%), 10 to 14 minutes (1,969 commuters, 13.9%), and 30 to 34 minutes (1,876 commuters, 13.2%).
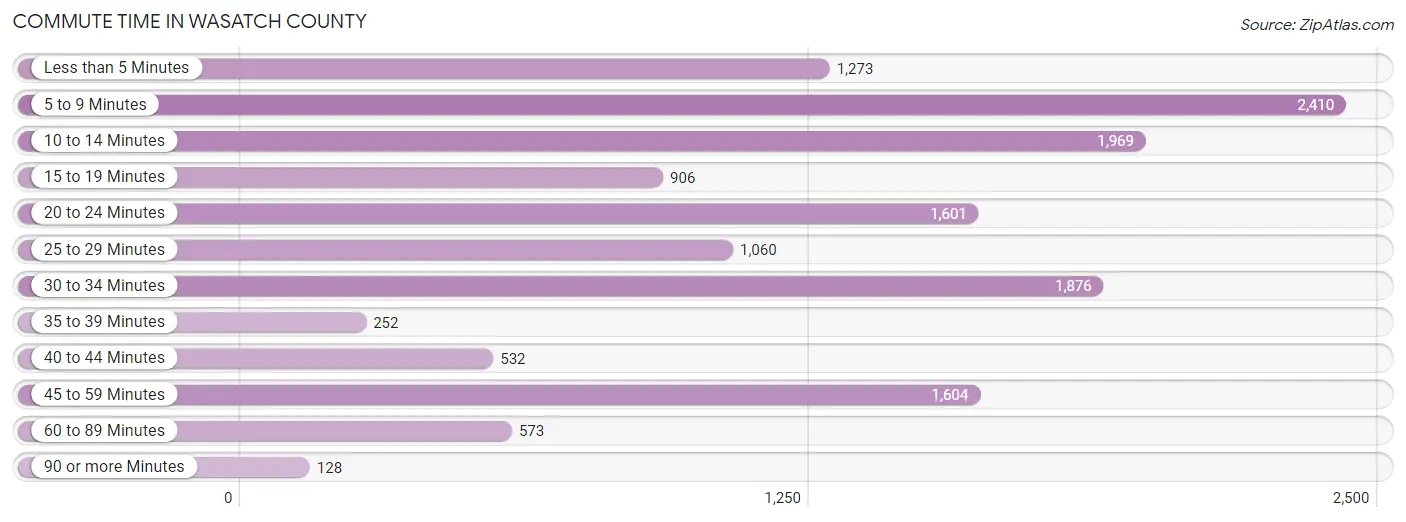
| Commute Time | # Commuters | % Commuters |
| Less than 5 Minutes | 1,273 | 9.0% |
| 5 to 9 Minutes | 2,410 | 17.0% |
| 10 to 14 Minutes | 1,969 | 13.9% |
| 15 to 19 Minutes | 906 | 6.4% |
| 20 to 24 Minutes | 1,601 | 11.3% |
| 25 to 29 Minutes | 1,060 | 7.5% |
| 30 to 34 Minutes | 1,876 | 13.2% |
| 35 to 39 Minutes | 252 | 1.8% |
| 40 to 44 Minutes | 532 | 3.7% |
| 45 to 59 Minutes | 1,604 | 11.3% |
| 60 to 89 Minutes | 573 | 4.0% |
| 90 or more Minutes | 128 | 0.9% |
Commute Time by Sex in Wasatch County
The most common commute times in Wasatch County are 30 to 34 minutes (1,316 commuters, 16.1%) for males and 5 to 9 minutes (1,471 commuters, 24.5%) for females.
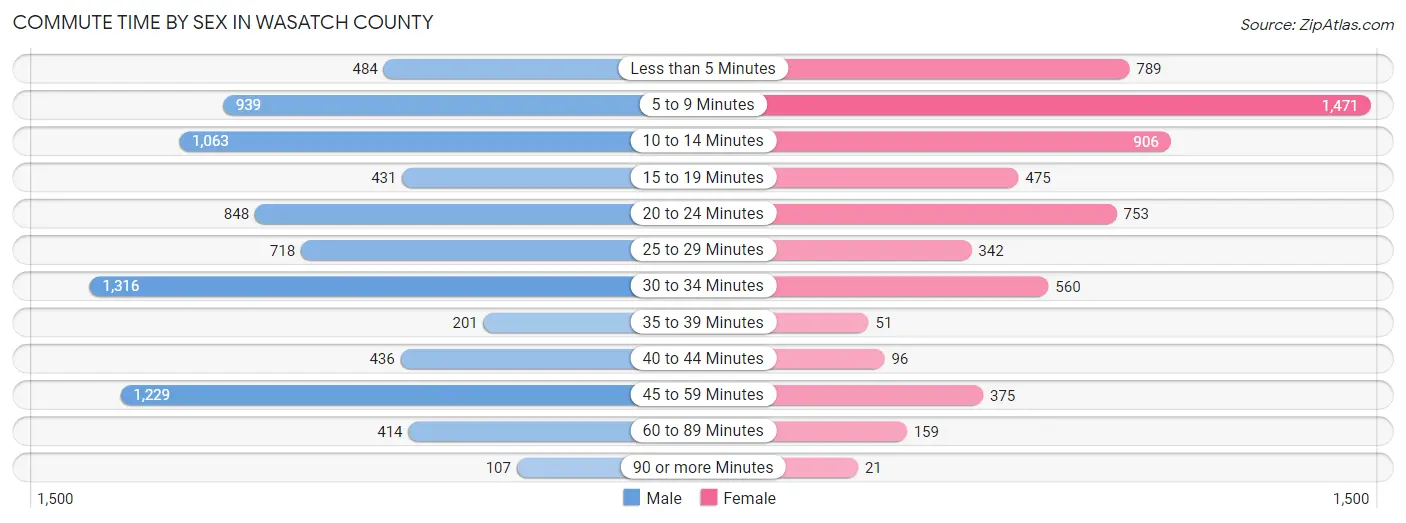
| Commute Time | Male | Female |
| Less than 5 Minutes | 484 (5.9%) | 789 (13.2%) |
| 5 to 9 Minutes | 939 (11.5%) | 1,471 (24.5%) |
| 10 to 14 Minutes | 1,063 (13.0%) | 906 (15.1%) |
| 15 to 19 Minutes | 431 (5.3%) | 475 (7.9%) |
| 20 to 24 Minutes | 848 (10.4%) | 753 (12.6%) |
| 25 to 29 Minutes | 718 (8.8%) | 342 (5.7%) |
| 30 to 34 Minutes | 1,316 (16.1%) | 560 (9.3%) |
| 35 to 39 Minutes | 201 (2.5%) | 51 (0.9%) |
| 40 to 44 Minutes | 436 (5.3%) | 96 (1.6%) |
| 45 to 59 Minutes | 1,229 (15.0%) | 375 (6.2%) |
| 60 to 89 Minutes | 414 (5.1%) | 159 (2.6%) |
| 90 or more Minutes | 107 (1.3%) | 21 (0.4%) |
Time of Departure to Work by Sex in Wasatch County
The most frequent times of departure to work in Wasatch County are 7:00 AM to 7:29 AM (1,359, 16.6%) for males and 8:00 AM to 8:29 AM (1,411, 23.5%) for females.
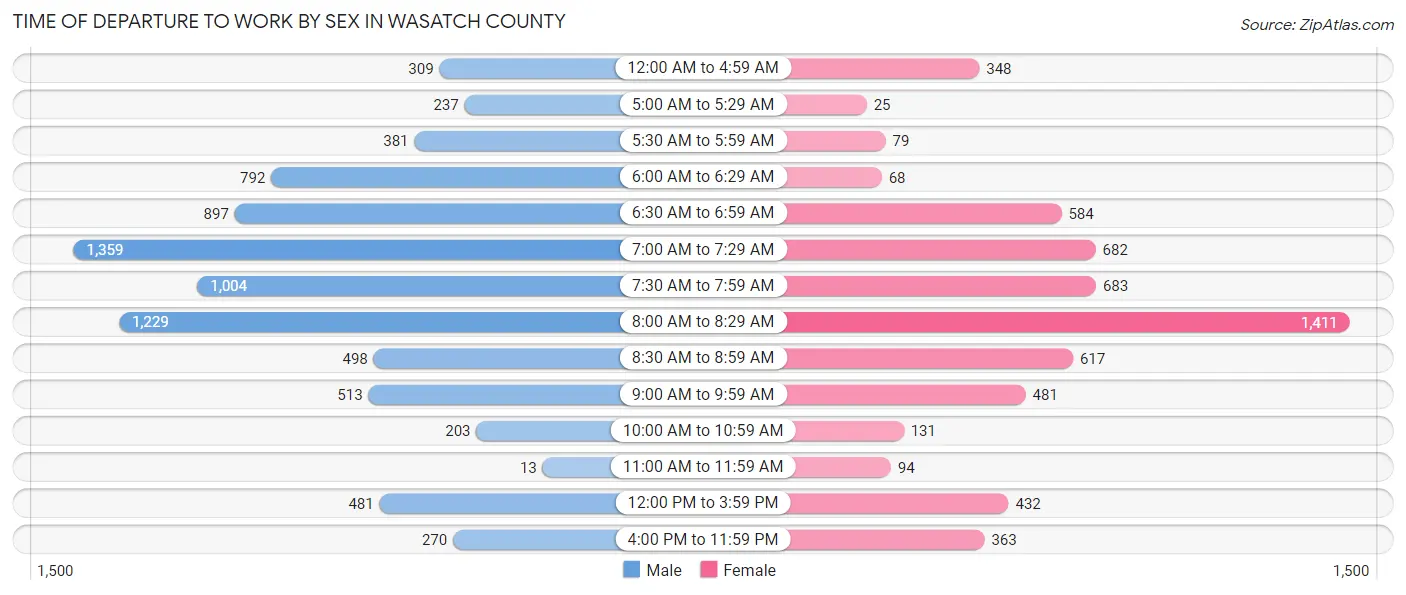
| Time of Departure | Male | Female |
| 12:00 AM to 4:59 AM | 309 (3.8%) | 348 (5.8%) |
| 5:00 AM to 5:29 AM | 237 (2.9%) | 25 (0.4%) |
| 5:30 AM to 5:59 AM | 381 (4.6%) | 79 (1.3%) |
| 6:00 AM to 6:29 AM | 792 (9.7%) | 68 (1.1%) |
| 6:30 AM to 6:59 AM | 897 (11.0%) | 584 (9.7%) |
| 7:00 AM to 7:29 AM | 1,359 (16.6%) | 682 (11.4%) |
| 7:30 AM to 7:59 AM | 1,004 (12.3%) | 683 (11.4%) |
| 8:00 AM to 8:29 AM | 1,229 (15.0%) | 1,411 (23.5%) |
| 8:30 AM to 8:59 AM | 498 (6.1%) | 617 (10.3%) |
| 9:00 AM to 9:59 AM | 513 (6.3%) | 481 (8.0%) |
| 10:00 AM to 10:59 AM | 203 (2.5%) | 131 (2.2%) |
| 11:00 AM to 11:59 AM | 13 (0.2%) | 94 (1.6%) |
| 12:00 PM to 3:59 PM | 481 (5.9%) | 432 (7.2%) |
| 4:00 PM to 11:59 PM | 270 (3.3%) | 363 (6.0%) |
| Total | 8,186 (100.0%) | 5,998 (100.0%) |
Housing Occupancy in Wasatch County
Occupancy by Ownership in Wasatch County
Of the total 11,407 dwellings in Wasatch County, owner-occupied units account for 8,829 (77.4%), while renter-occupied units make up 2,578 (22.6%).
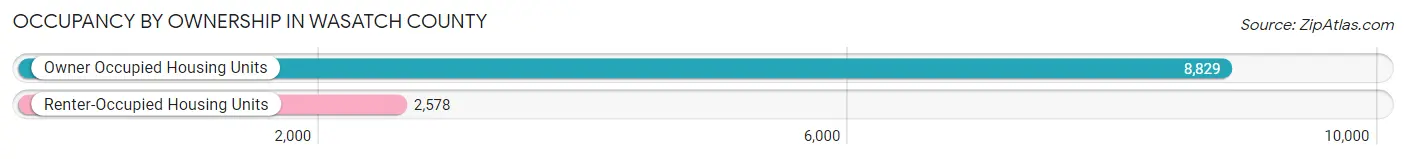
| Occupancy | # Housing Units | % Housing Units |
| Owner Occupied Housing Units | 8,829 | 77.4% |
| Renter-Occupied Housing Units | 2,578 | 22.6% |
| Total Occupied Housing Units | 11,407 | 100.0% |
Occupancy by Household Size in Wasatch County
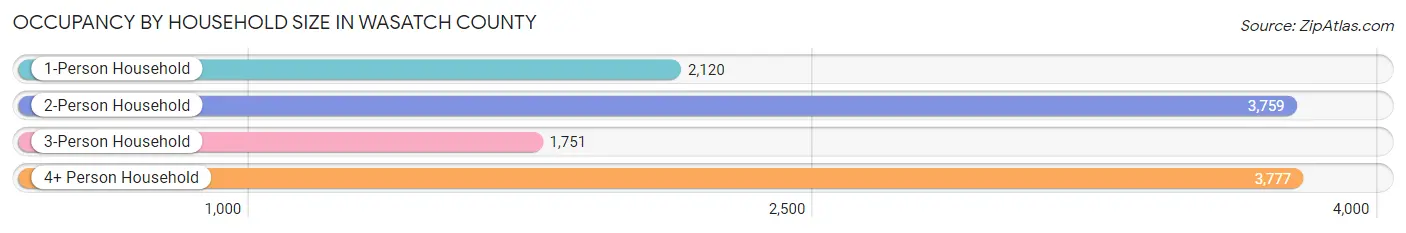
| Household Size | # Housing Units | % Housing Units |
| 1-Person Household | 2,120 | 18.6% |
| 2-Person Household | 3,759 | 33.0% |
| 3-Person Household | 1,751 | 15.3% |
| 4+ Person Household | 3,777 | 33.1% |
| Total Housing Units | 11,407 | 100.0% |
Occupancy by Ownership by Household Size in Wasatch County
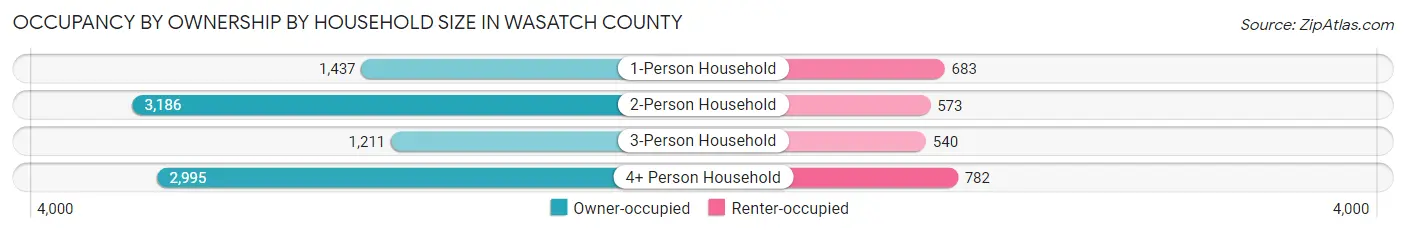
| Household Size | Owner-occupied | Renter-occupied |
| 1-Person Household | 1,437 (67.8%) | 683 (32.2%) |
| 2-Person Household | 3,186 (84.8%) | 573 (15.2%) |
| 3-Person Household | 1,211 (69.2%) | 540 (30.8%) |
| 4+ Person Household | 2,995 (79.3%) | 782 (20.7%) |
| Total Housing Units | 8,829 (77.4%) | 2,578 (22.6%) |
Occupancy by Educational Attainment in Wasatch County
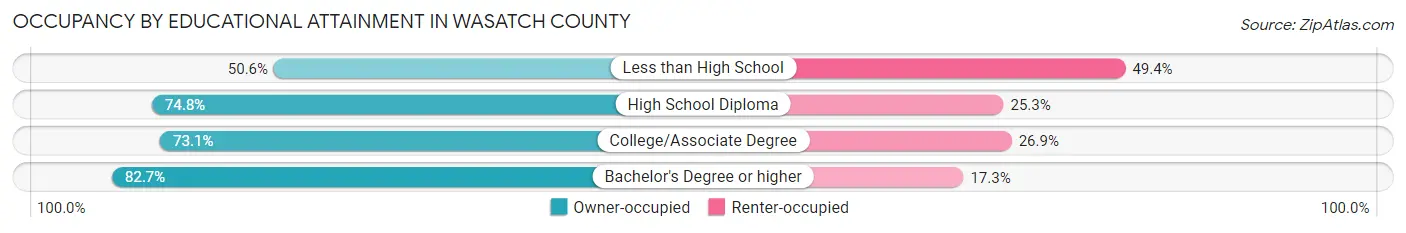
| Household Size | Owner-occupied | Renter-occupied |
| Less than High School | 218 (50.6%) | 213 (49.4%) |
| High School Diploma | 1,291 (74.8%) | 436 (25.3%) |
| College/Associate Degree | 2,508 (73.1%) | 922 (26.9%) |
| Bachelor's Degree or higher | 4,812 (82.7%) | 1,007 (17.3%) |
Occupancy by Age of Householder in Wasatch County
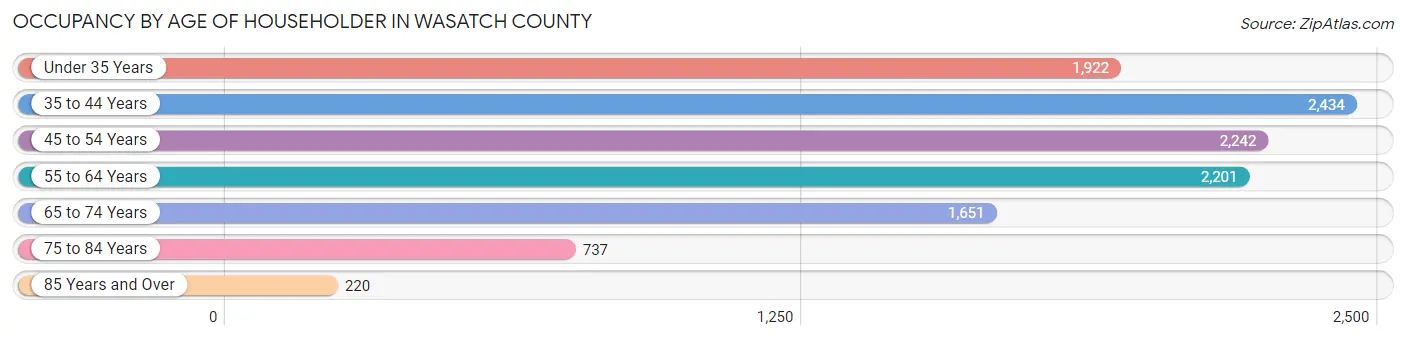
| Age Bracket | # Households | % Households |
| Under 35 Years | 1,922 | 16.9% |
| 35 to 44 Years | 2,434 | 21.3% |
| 45 to 54 Years | 2,242 | 19.7% |
| 55 to 64 Years | 2,201 | 19.3% |
| 65 to 74 Years | 1,651 | 14.5% |
| 75 to 84 Years | 737 | 6.5% |
| 85 Years and Over | 220 | 1.9% |
| Total | 11,407 | 100.0% |
Housing Finances in Wasatch County
Median Income by Occupancy in Wasatch County
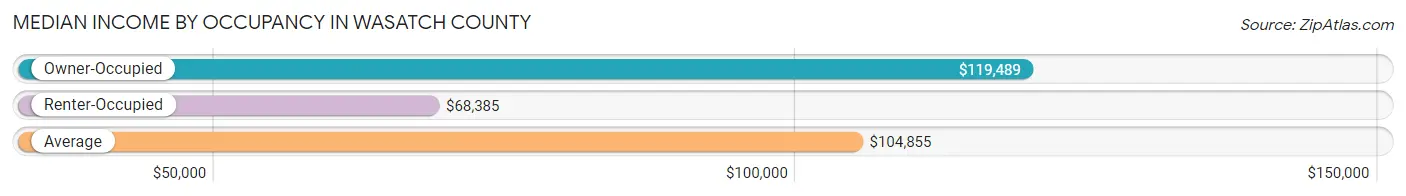
| Occupancy Type | # Households | Median Income |
| Owner-Occupied | 8,829 (77.4%) | $119,489 |
| Renter-Occupied | 2,578 (22.6%) | $68,385 |
| Average | 11,407 (100.0%) | $104,855 |
Occupancy by Householder Income Bracket in Wasatch County
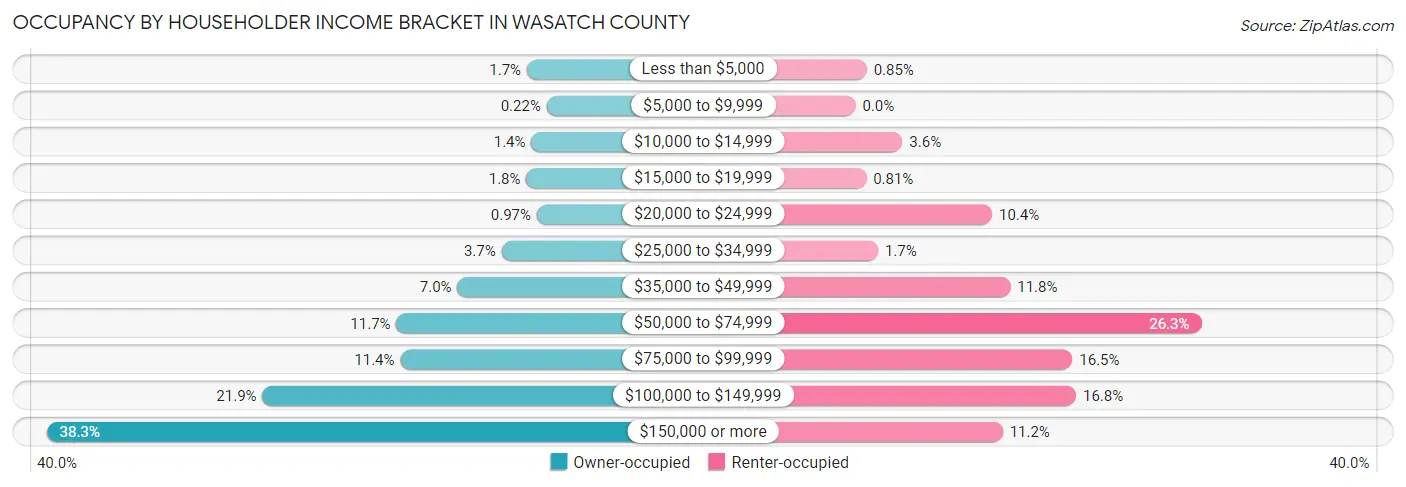
| Income Bracket | Owner-occupied | Renter-occupied |
| Less than $5,000 | 153 (1.7%) | 22 (0.9%) |
| $5,000 to $9,999 | 19 (0.2%) | 0 (0.0%) |
| $10,000 to $14,999 | 123 (1.4%) | 92 (3.6%) |
| $15,000 to $19,999 | 156 (1.8%) | 21 (0.8%) |
| $20,000 to $24,999 | 86 (1.0%) | 268 (10.4%) |
| $25,000 to $34,999 | 323 (3.7%) | 44 (1.7%) |
| $35,000 to $49,999 | 620 (7.0%) | 304 (11.8%) |
| $50,000 to $74,999 | 1,030 (11.7%) | 679 (26.3%) |
| $75,000 to $99,999 | 1,004 (11.4%) | 426 (16.5%) |
| $100,000 to $149,999 | 1,932 (21.9%) | 433 (16.8%) |
| $150,000 or more | 3,383 (38.3%) | 289 (11.2%) |
| Total | 8,829 (100.0%) | 2,578 (100.0%) |
Monthly Housing Cost Tiers in Wasatch County
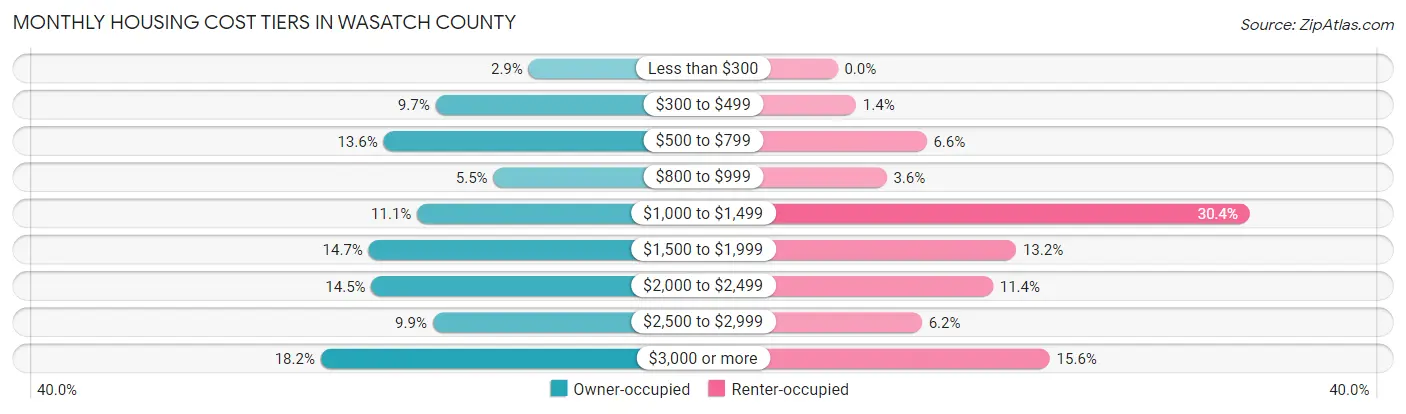
| Monthly Cost | Owner-occupied | Renter-occupied |
| Less than $300 | 254 (2.9%) | 0 (0.0%) |
| $300 to $499 | 860 (9.7%) | 35 (1.4%) |
| $500 to $799 | 1,198 (13.6%) | 169 (6.6%) |
| $800 to $999 | 483 (5.5%) | 93 (3.6%) |
| $1,000 to $1,499 | 979 (11.1%) | 783 (30.4%) |
| $1,500 to $1,999 | 1,294 (14.7%) | 339 (13.2%) |
| $2,000 to $2,499 | 1,277 (14.5%) | 295 (11.4%) |
| $2,500 to $2,999 | 878 (9.9%) | 160 (6.2%) |
| $3,000 or more | 1,606 (18.2%) | 403 (15.6%) |
| Total | 8,829 (100.0%) | 2,578 (100.0%) |
Physical Housing Characteristics in Wasatch County
Housing Structures in Wasatch County
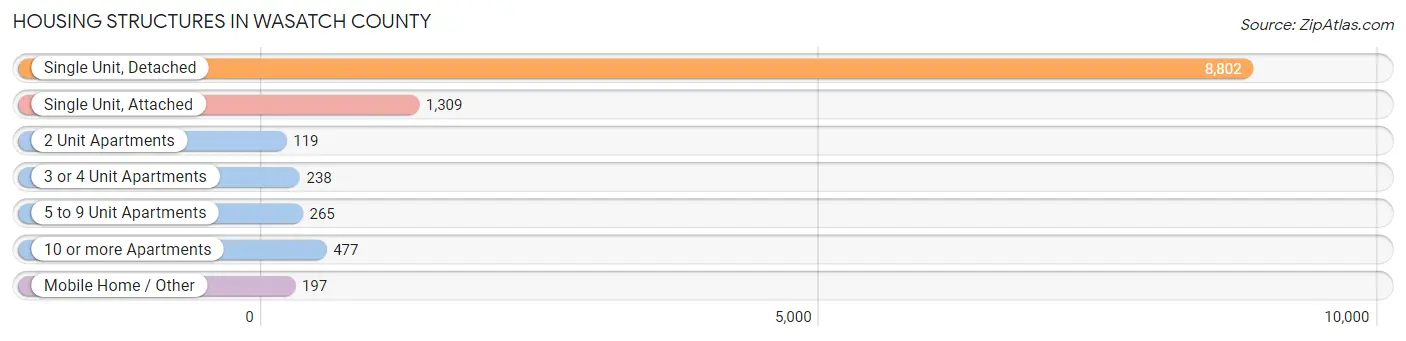
| Structure Type | # Housing Units | % Housing Units |
| Single Unit, Detached | 8,802 | 77.2% |
| Single Unit, Attached | 1,309 | 11.5% |
| 2 Unit Apartments | 119 | 1.0% |
| 3 or 4 Unit Apartments | 238 | 2.1% |
| 5 to 9 Unit Apartments | 265 | 2.3% |
| 10 or more Apartments | 477 | 4.2% |
| Mobile Home / Other | 197 | 1.7% |
| Total | 11,407 | 100.0% |
Housing Structures by Occupancy in Wasatch County
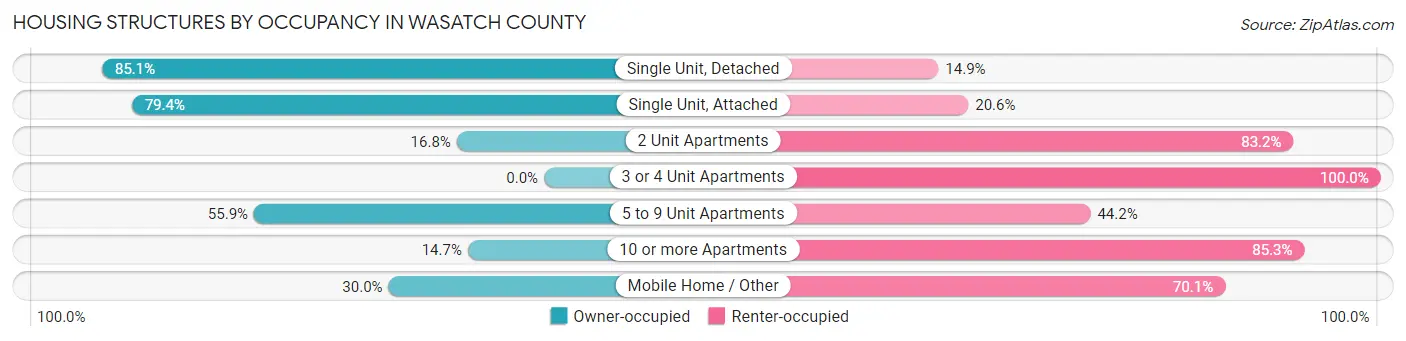
| Structure Type | Owner-occupied | Renter-occupied |
| Single Unit, Detached | 7,493 (85.1%) | 1,309 (14.9%) |
| Single Unit, Attached | 1,039 (79.4%) | 270 (20.6%) |
| 2 Unit Apartments | 20 (16.8%) | 99 (83.2%) |
| 3 or 4 Unit Apartments | 0 (0.0%) | 238 (100.0%) |
| 5 to 9 Unit Apartments | 148 (55.8%) | 117 (44.2%) |
| 10 or more Apartments | 70 (14.7%) | 407 (85.3%) |
| Mobile Home / Other | 59 (29.9%) | 138 (70.1%) |
| Total | 8,829 (77.4%) | 2,578 (22.6%) |
Housing Structures by Number of Rooms in Wasatch County
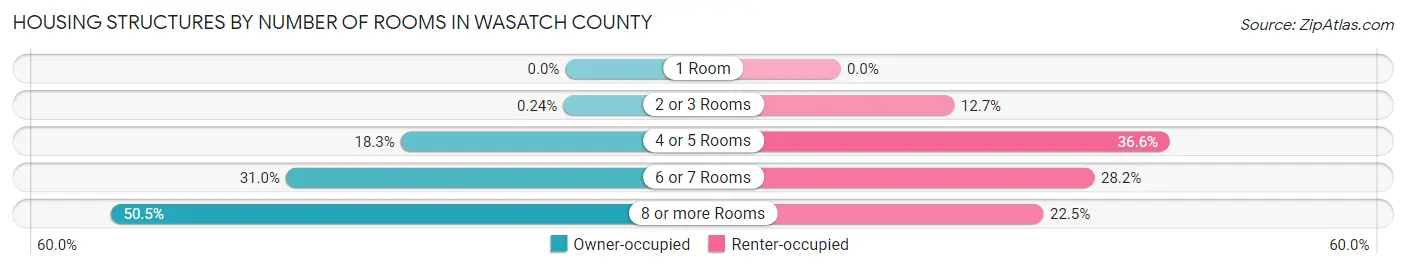
| Number of Rooms | Owner-occupied | Renter-occupied |
| 1 Room | 0 (0.0%) | 0 (0.0%) |
| 2 or 3 Rooms | 21 (0.2%) | 326 (12.7%) |
| 4 or 5 Rooms | 1,614 (18.3%) | 944 (36.6%) |
| 6 or 7 Rooms | 2,739 (31.0%) | 727 (28.2%) |
| 8 or more Rooms | 4,455 (50.5%) | 581 (22.5%) |
| Total | 8,829 (100.0%) | 2,578 (100.0%) |
Housing Structure by Heating Type in Wasatch County
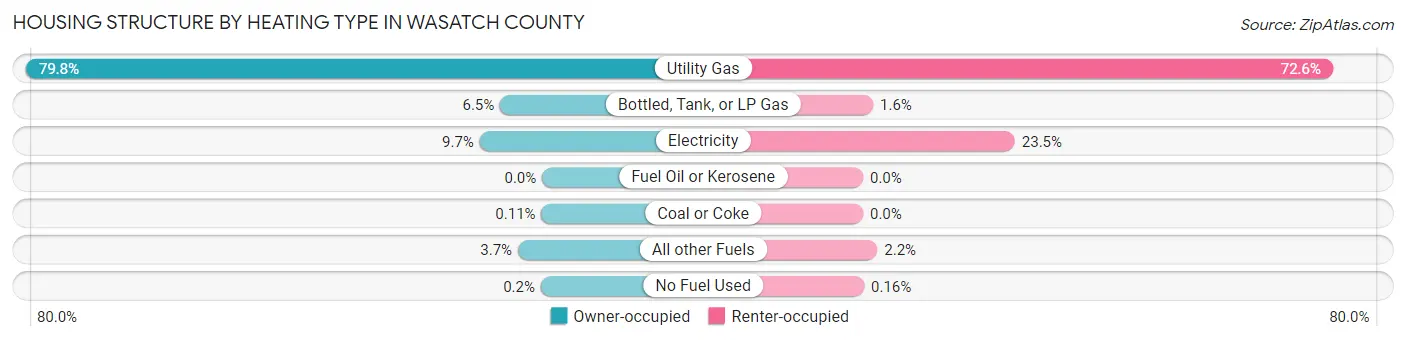
| Heating Type | Owner-occupied | Renter-occupied |
| Utility Gas | 7,046 (79.8%) | 1,872 (72.6%) |
| Bottled, Tank, or LP Gas | 573 (6.5%) | 40 (1.5%) |
| Electricity | 852 (9.7%) | 605 (23.5%) |
| Fuel Oil or Kerosene | 0 (0.0%) | 0 (0.0%) |
| Coal or Coke | 10 (0.1%) | 0 (0.0%) |
| All other Fuels | 330 (3.7%) | 57 (2.2%) |
| No Fuel Used | 18 (0.2%) | 4 (0.2%) |
| Total | 8,829 (100.0%) | 2,578 (100.0%) |
Household Vehicle Usage in Wasatch County
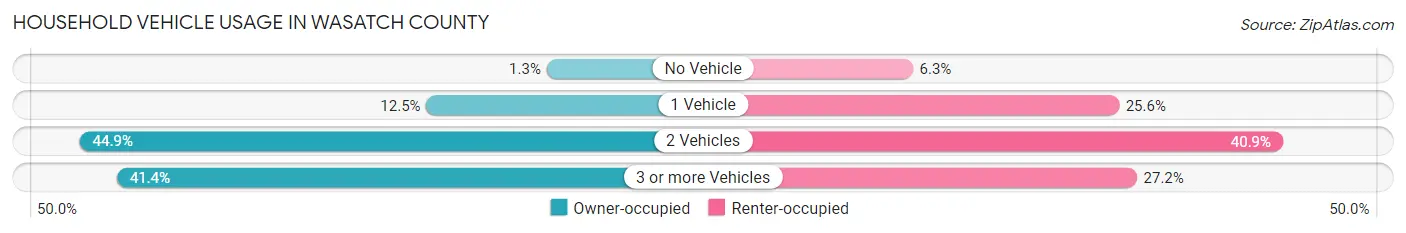
| Vehicles per Household | Owner-occupied | Renter-occupied |
| No Vehicle | 111 (1.3%) | 163 (6.3%) |
| 1 Vehicle | 1,103 (12.5%) | 659 (25.6%) |
| 2 Vehicles | 3,961 (44.9%) | 1,054 (40.9%) |
| 3 or more Vehicles | 3,654 (41.4%) | 702 (27.2%) |
| Total | 8,829 (100.0%) | 2,578 (100.0%) |
Real Estate & Mortgages in Wasatch County
Real Estate and Mortgage Overview in Wasatch County
| Characteristic | Without Mortgage | With Mortgage |
| Housing Units | 2,932 | 5,897 |
| Median Property Value | $591,900 | $631,600 |
| Median Household Income | $102,629 | $2,398 |
| Monthly Housing Costs | $608 | $1,600 |
| Real Estate Taxes | $2,991 | $129 |
Property Value by Mortgage Status in Wasatch County
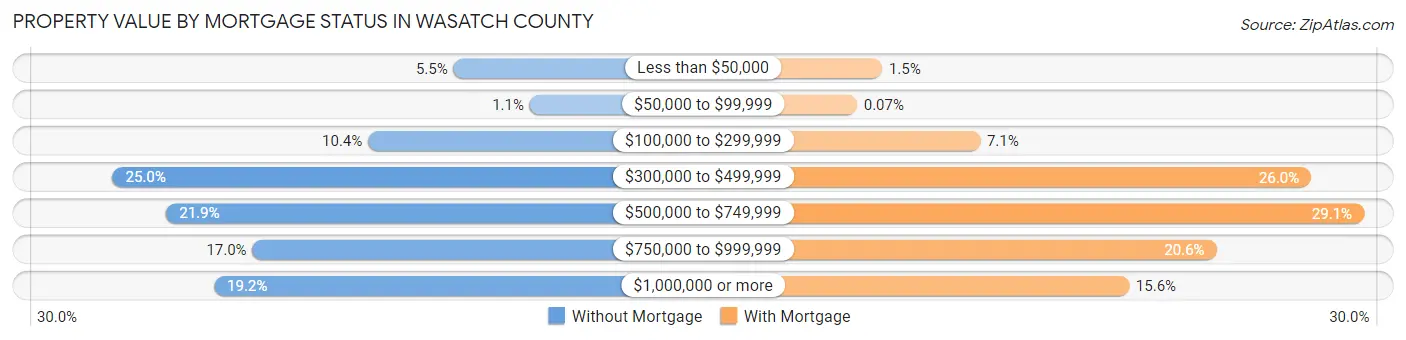
| Property Value | Without Mortgage | With Mortgage |
| Less than $50,000 | 161 (5.5%) | 89 (1.5%) |
| $50,000 to $99,999 | 33 (1.1%) | 4 (0.1%) |
| $100,000 to $299,999 | 304 (10.4%) | 419 (7.1%) |
| $300,000 to $499,999 | 732 (25.0%) | 1,535 (26.0%) |
| $500,000 to $749,999 | 642 (21.9%) | 1,713 (29.0%) |
| $750,000 to $999,999 | 498 (17.0%) | 1,216 (20.6%) |
| $1,000,000 or more | 562 (19.2%) | 921 (15.6%) |
| Total | 2,932 (100.0%) | 5,897 (100.0%) |
Household Income by Mortgage Status in Wasatch County
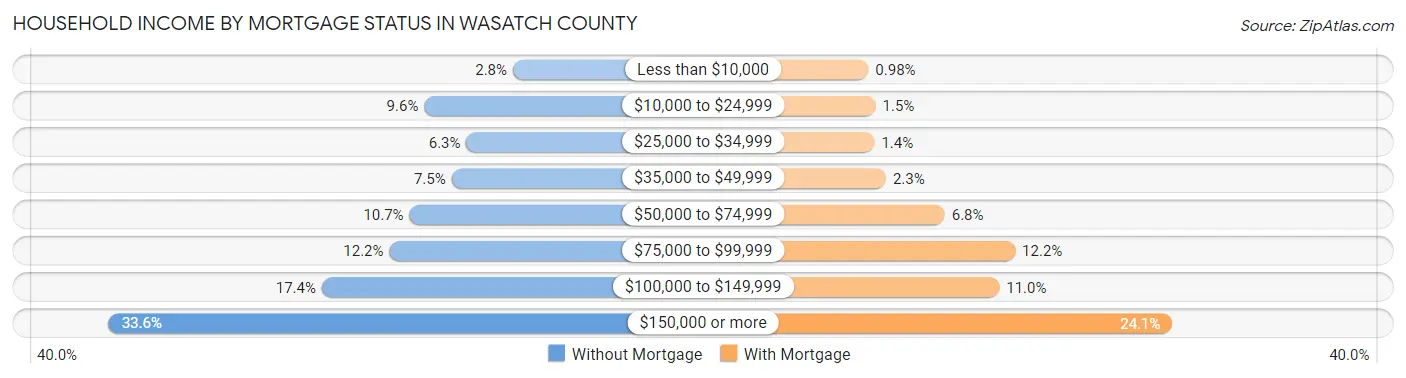
| Household Income | Without Mortgage | With Mortgage |
| Less than $10,000 | 82 (2.8%) | 58 (1.0%) |
| $10,000 to $24,999 | 280 (9.6%) | 90 (1.5%) |
| $25,000 to $34,999 | 186 (6.3%) | 85 (1.4%) |
| $35,000 to $49,999 | 219 (7.5%) | 137 (2.3%) |
| $50,000 to $74,999 | 313 (10.7%) | 401 (6.8%) |
| $75,000 to $99,999 | 358 (12.2%) | 717 (12.2%) |
| $100,000 to $149,999 | 509 (17.4%) | 646 (11.0%) |
| $150,000 or more | 985 (33.6%) | 1,423 (24.1%) |
| Total | 2,932 (100.0%) | 5,897 (100.0%) |
Property Value to Household Income Ratio in Wasatch County
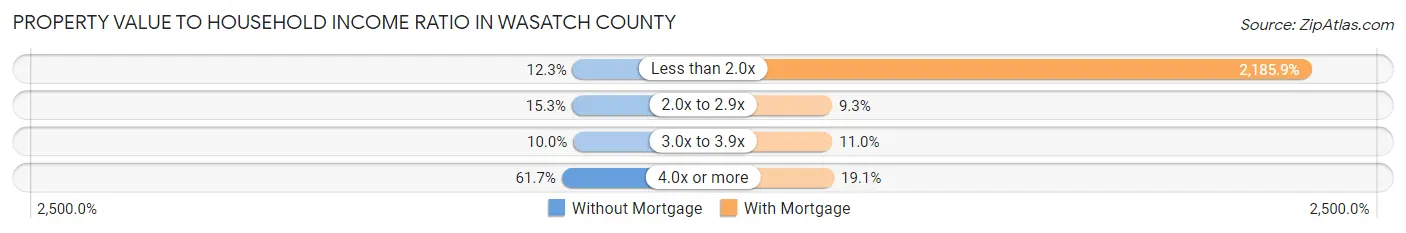
| Value-to-Income Ratio | Without Mortgage | With Mortgage |
| Less than 2.0x | 361 (12.3%) | 128,904 (2,185.9%) |
| 2.0x to 2.9x | 449 (15.3%) | 551 (9.3%) |
| 3.0x to 3.9x | 292 (10.0%) | 649 (11.0%) |
| 4.0x or more | 1,808 (61.7%) | 1,124 (19.1%) |
| Total | 2,932 (100.0%) | 5,897 (100.0%) |
Real Estate Taxes by Mortgage Status in Wasatch County
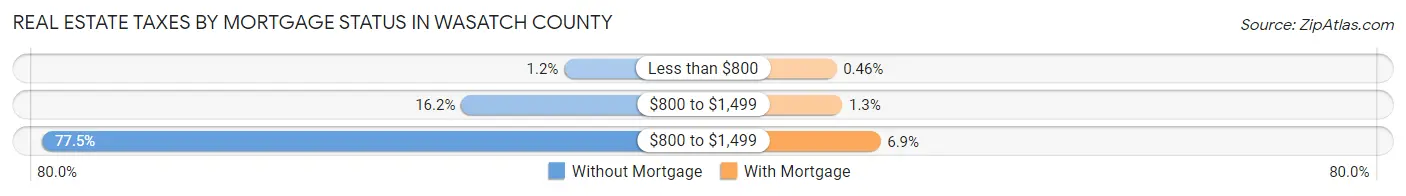
| Property Taxes | Without Mortgage | With Mortgage |
| Less than $800 | 34 (1.2%) | 27 (0.5%) |
| $800 to $1,499 | 475 (16.2%) | 77 (1.3%) |
| $800 to $1,499 | 2,271 (77.5%) | 407 (6.9%) |
| Total | 2,932 (100.0%) | 5,897 (100.0%) |
Health & Disability in Wasatch County
Health Insurance Coverage by Age in Wasatch County
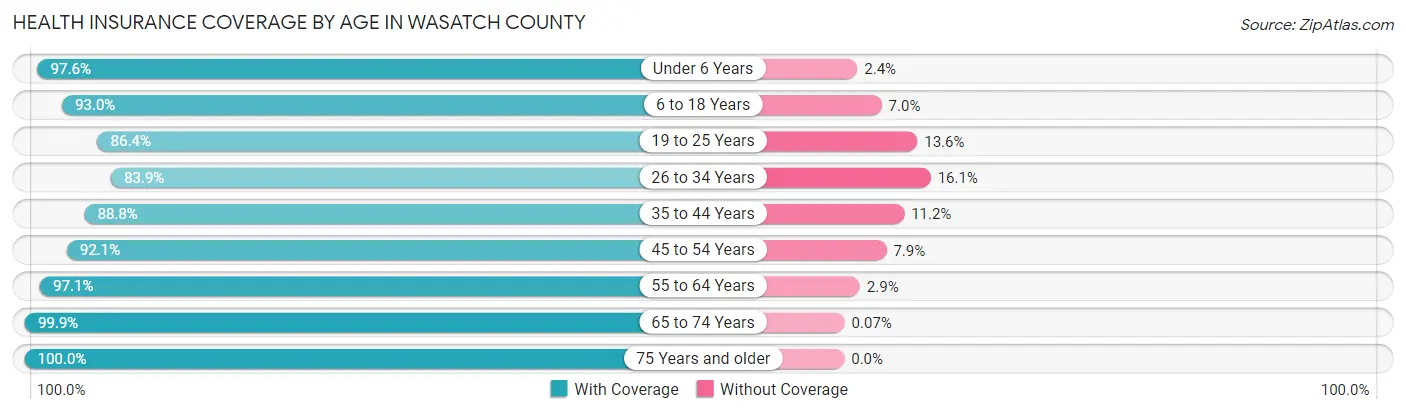
| Age Bracket | With Coverage | Without Coverage |
| Under 6 Years | 2,875 (97.6%) | 72 (2.4%) |
| 6 to 18 Years | 7,649 (93.0%) | 573 (7.0%) |
| 19 to 25 Years | 2,277 (86.4%) | 359 (13.6%) |
| 26 to 34 Years | 2,870 (83.9%) | 551 (16.1%) |
| 35 to 44 Years | 4,414 (88.8%) | 555 (11.2%) |
| 45 to 54 Years | 3,863 (92.1%) | 330 (7.9%) |
| 55 to 64 Years | 3,908 (97.1%) | 117 (2.9%) |
| 65 to 74 Years | 2,945 (99.9%) | 2 (0.1%) |
| 75 Years and older | 1,449 (100.0%) | 0 (0.0%) |
| Total | 32,250 (92.6%) | 2,559 (7.3%) |
Health Insurance Coverage by Citizenship Status in Wasatch County
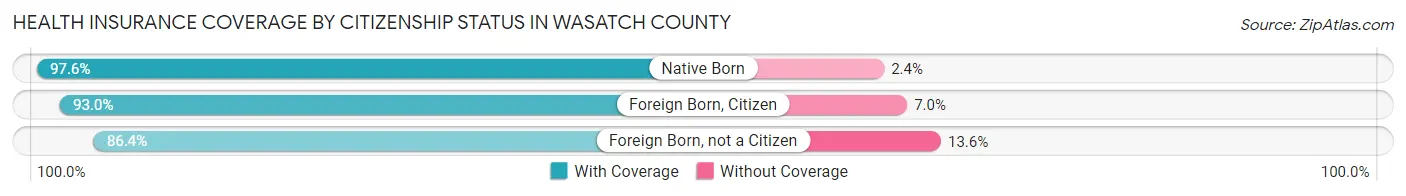
| Citizenship Status | With Coverage | Without Coverage |
| Native Born | 2,875 (97.6%) | 72 (2.4%) |
| Foreign Born, Citizen | 7,649 (93.0%) | 573 (7.0%) |
| Foreign Born, not a Citizen | 2,277 (86.4%) | 359 (13.6%) |
Health Insurance Coverage by Household Income in Wasatch County
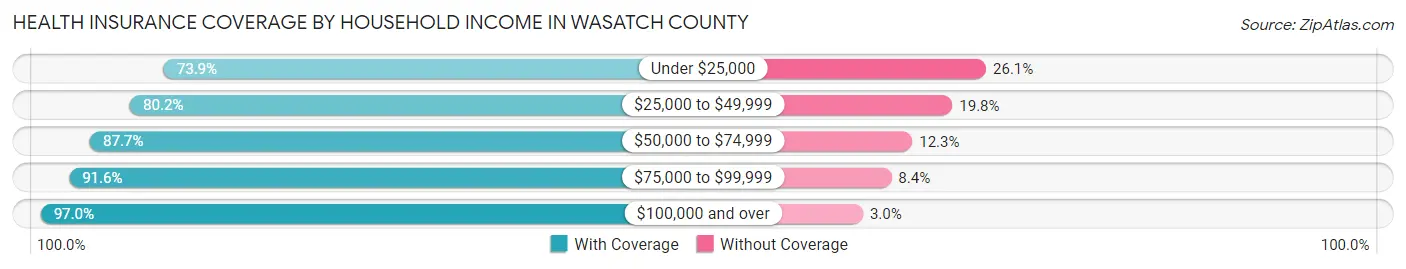
| Household Income | With Coverage | Without Coverage |
| Under $25,000 | 1,288 (73.9%) | 455 (26.1%) |
| $25,000 to $49,999 | 2,129 (80.2%) | 525 (19.8%) |
| $50,000 to $74,999 | 3,771 (87.7%) | 528 (12.3%) |
| $75,000 to $99,999 | 4,473 (91.6%) | 408 (8.4%) |
| $100,000 and over | 20,544 (97.0%) | 642 (3.0%) |
Public vs Private Health Insurance Coverage by Age in Wasatch County
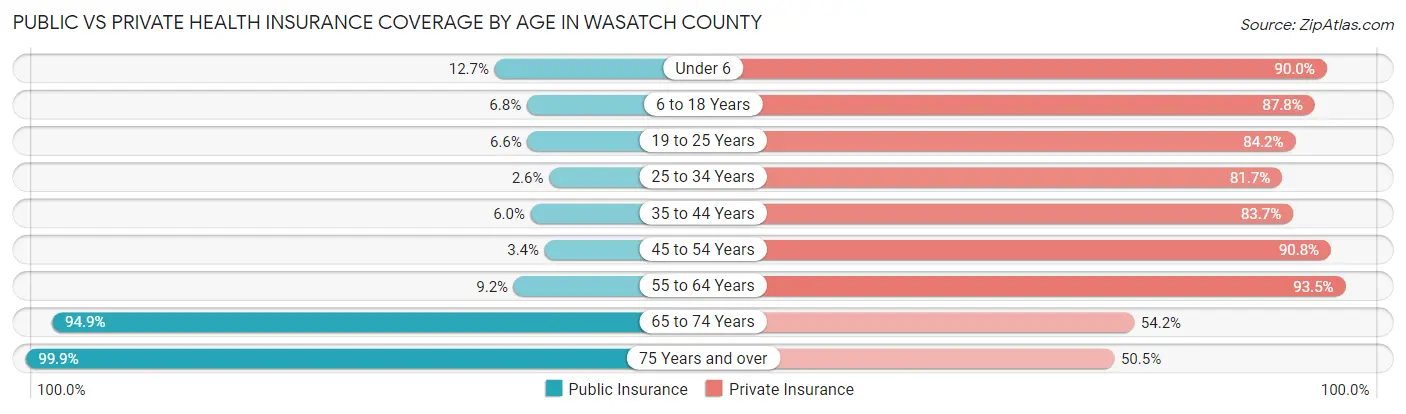
| Age Bracket | Public Insurance | Private Insurance |
| Under 6 | 375 (12.7%) | 2,652 (90.0%) |
| 6 to 18 Years | 555 (6.8%) | 7,216 (87.8%) |
| 19 to 25 Years | 175 (6.6%) | 2,219 (84.2%) |
| 25 to 34 Years | 89 (2.6%) | 2,795 (81.7%) |
| 35 to 44 Years | 300 (6.0%) | 4,161 (83.7%) |
| 45 to 54 Years | 144 (3.4%) | 3,807 (90.8%) |
| 55 to 64 Years | 369 (9.2%) | 3,762 (93.5%) |
| 65 to 74 Years | 2,796 (94.9%) | 1,598 (54.2%) |
| 75 Years and over | 1,447 (99.9%) | 732 (50.5%) |
| Total | 6,250 (18.0%) | 28,942 (83.2%) |
Disability Status by Sex by Age in Wasatch County
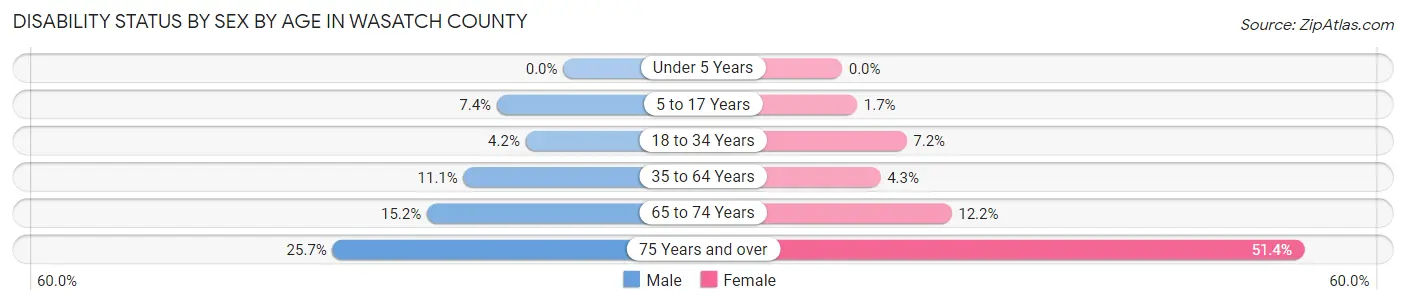
| Age Bracket | Male | Female |
| Under 5 Years | 0 (0.0%) | 0 (0.0%) |
| 5 to 17 Years | 306 (7.4%) | 65 (1.7%) |
| 18 to 34 Years | 142 (4.2%) | 240 (7.2%) |
| 35 to 64 Years | 748 (11.1%) | 276 (4.3%) |
| 65 to 74 Years | 227 (15.2%) | 177 (12.2%) |
| 75 Years and over | 185 (25.7%) | 375 (51.4%) |
Disability Class by Sex by Age in Wasatch County
Disability Class: Hearing Difficulty
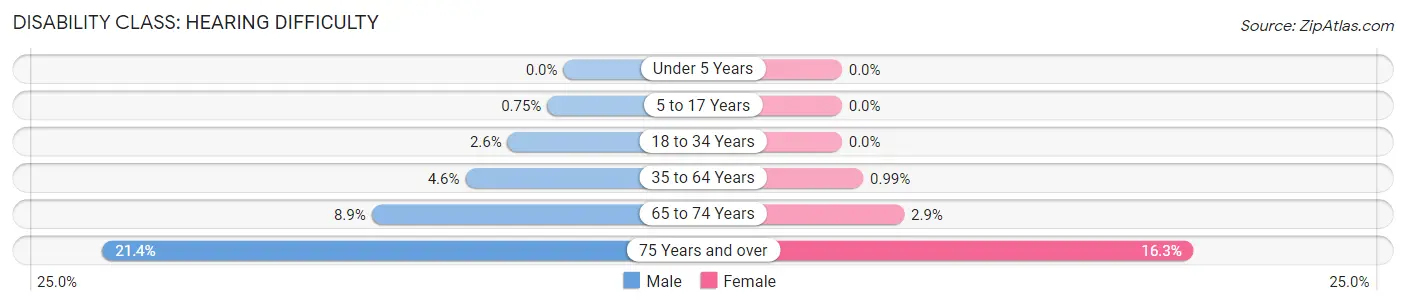
| Age Bracket | Male | Female |
| Under 5 Years | 0 (0.0%) | 0 (0.0%) |
| 5 to 17 Years | 31 (0.7%) | 0 (0.0%) |
| 18 to 34 Years | 88 (2.6%) | 0 (0.0%) |
| 35 to 64 Years | 306 (4.5%) | 64 (1.0%) |
| 65 to 74 Years | 133 (8.9%) | 42 (2.9%) |
| 75 Years and over | 154 (21.4%) | 119 (16.3%) |
Disability Class: Vision Difficulty
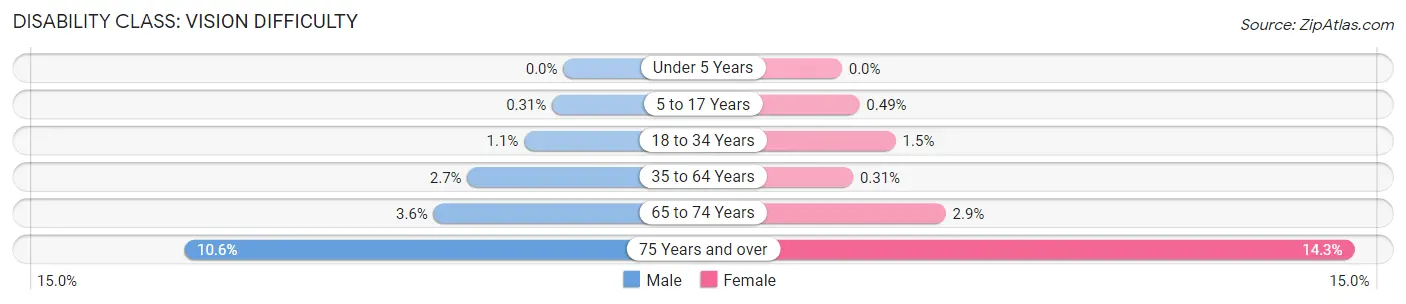
| Age Bracket | Male | Female |
| Under 5 Years | 0 (0.0%) | 0 (0.0%) |
| 5 to 17 Years | 13 (0.3%) | 19 (0.5%) |
| 18 to 34 Years | 37 (1.1%) | 50 (1.5%) |
| 35 to 64 Years | 180 (2.7%) | 20 (0.3%) |
| 65 to 74 Years | 54 (3.6%) | 42 (2.9%) |
| 75 Years and over | 76 (10.6%) | 104 (14.3%) |
Disability Class: Cognitive Difficulty
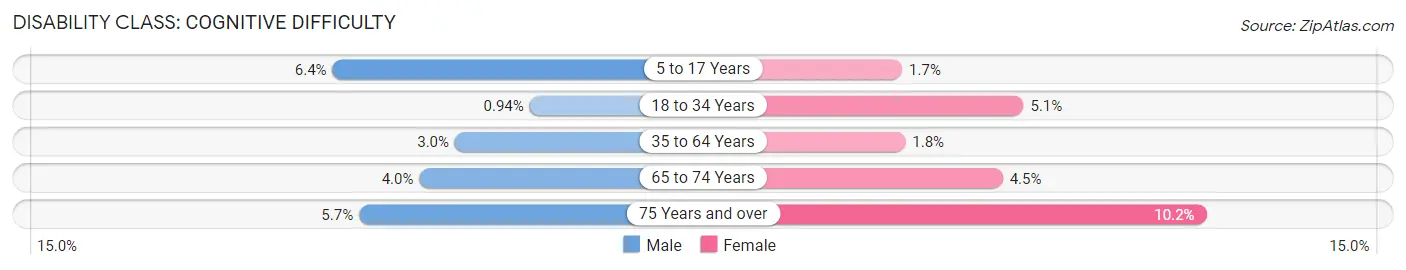
| Age Bracket | Male | Female |
| 5 to 17 Years | 266 (6.4%) | 65 (1.7%) |
| 18 to 34 Years | 32 (0.9%) | 169 (5.1%) |
| 35 to 64 Years | 203 (3.0%) | 114 (1.8%) |
| 65 to 74 Years | 60 (4.0%) | 65 (4.5%) |
| 75 Years and over | 41 (5.7%) | 74 (10.2%) |
Disability Class: Ambulatory Difficulty
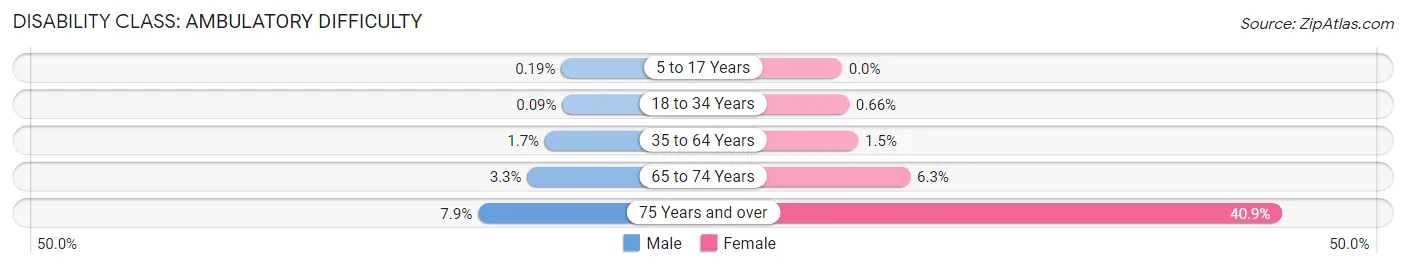
| Age Bracket | Male | Female |
| 5 to 17 Years | 8 (0.2%) | 0 (0.0%) |
| 18 to 34 Years | 3 (0.1%) | 22 (0.7%) |
| 35 to 64 Years | 115 (1.7%) | 98 (1.5%) |
| 65 to 74 Years | 50 (3.3%) | 92 (6.3%) |
| 75 Years and over | 57 (7.9%) | 298 (40.9%) |
Disability Class: Self-Care Difficulty
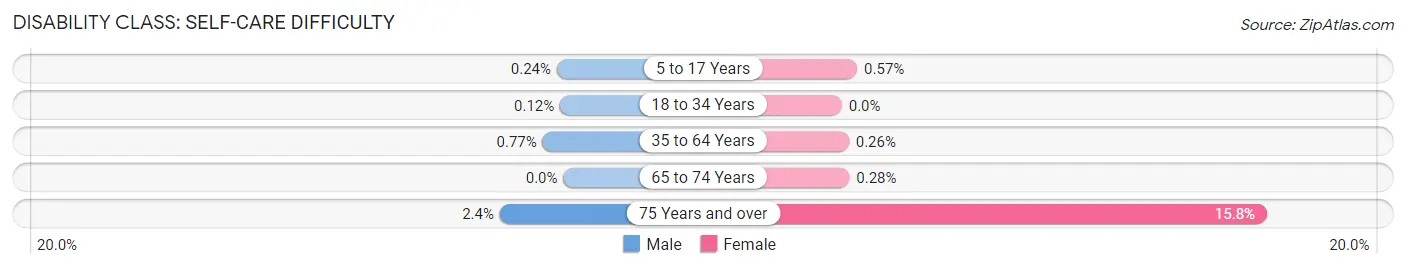
| Age Bracket | Male | Female |
| 5 to 17 Years | 10 (0.2%) | 22 (0.6%) |
| 18 to 34 Years | 4 (0.1%) | 0 (0.0%) |
| 35 to 64 Years | 52 (0.8%) | 17 (0.3%) |
| 65 to 74 Years | 0 (0.0%) | 4 (0.3%) |
| 75 Years and over | 17 (2.4%) | 115 (15.8%) |
Technology Access in Wasatch County
Computing Device Access in Wasatch County
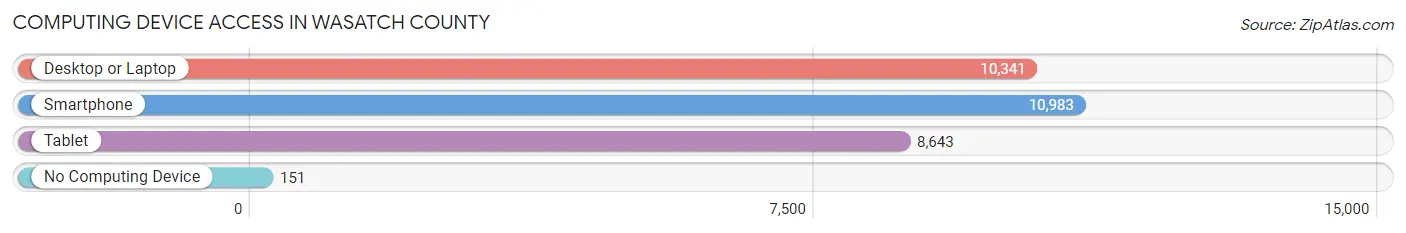
| Device Type | # Households | % Households |
| Desktop or Laptop | 10,341 | 90.6% |
| Smartphone | 10,983 | 96.3% |
| Tablet | 8,643 | 75.8% |
| No Computing Device | 151 | 1.3% |
| Total | 11,407 | 100.0% |
Internet Access in Wasatch County
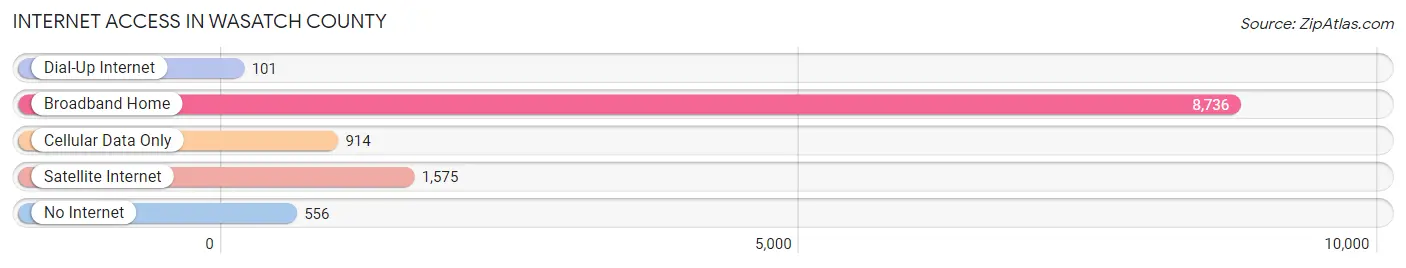
| Internet Type | # Households | % Households |
| Dial-Up Internet | 101 | 0.9% |
| Broadband Home | 8,736 | 76.6% |
| Cellular Data Only | 914 | 8.0% |
| Satellite Internet | 1,575 | 13.8% |
| No Internet | 556 | 4.9% |
| Total | 11,407 | 100.0% |
Wasatch County Summary
Wasatch County is located in the central part of Utah, and is part of the Wasatch Front region. It is bordered by Summit County to the east, Utah County to the south, and Duchesne County to the west. The county seat is Heber City, and the largest city is Midway. Wasatch County covers an area of 1,206 square miles, and has a population of 33,890 as of the 2020 census.
History
The area that is now Wasatch County was originally inhabited by the Ute and Shoshone Native American tribes. The first European settlers arrived in the area in the mid-1800s, and the county was officially established in 1850. The county was named after the Wasatch Mountains, which are located in the area.
In the late 1800s, the area experienced a population boom due to the arrival of Mormon settlers. The county was largely agricultural, and the main crops were wheat, oats, and hay. The county also had a thriving dairy industry.
In the early 1900s, the county experienced a population decline due to the Great Depression. However, the population began to rebound in the 1940s, and the county experienced a period of growth and development.
Geography
Wasatch County is located in the central part of Utah, and is part of the Wasatch Front region. It is bordered by Summit County to the east, Utah County to the south, and Duchesne County to the west. The county covers an area of 1,206 square miles, and has an elevation of 5,902 feet.
The county is located in the Wasatch Range, and is home to several mountain peaks, including Mount Timpanogos, Mount Nebo, and Mount Baldy. The county is also home to several rivers and streams, including the Provo River, the Weber River, and the Jordan River.
The county has a semi-arid climate, with hot summers and cold winters. The average annual precipitation is 16.5 inches, and the average annual temperature is 48.3 degrees Fahrenheit.
Economy
The economy of Wasatch County is largely based on tourism, agriculture, and manufacturing. The county is home to several ski resorts, including Deer Valley Resort, Park City Mountain Resort, and The Canyons. The county is also home to several golf courses, and is a popular destination for outdoor recreation.
Agriculture is also an important part of the county’s economy. The main crops are hay, wheat, and oats, and the county also has a thriving dairy industry.
Manufacturing is also an important part of the county’s economy. The county is home to several manufacturing companies, including Wasatch Plastics, Wasatch Steel, and Wasatch Textiles.
Demographics
As of the 2020 census, Wasatch County had a population of 33,890. The racial makeup of the county was 91.2% White, 1.2% Black or African American, 0.7% Native American, 1.7% Asian, 0.2% Pacific Islander, 3.2% from other races, and 2.0% from two or more races. Hispanic or Latino of any race were 8.2% of the population.
The median household income in Wasatch County was $68,945, and the median family income was $76,945. The per capita income was $30,945. About 8.2% of the population was below the poverty line.
Common Questions
What is the Total Population of Wasatch County?
Total Population of Wasatch County is 35,009.
What is the Total Male Population of Wasatch County?
Total Male Population of Wasatch County is 17,880.
What is the Total Female Population of Wasatch County?
Total Female Population of Wasatch County is 17,129.
What is the Ratio of Males per 100 Females in Wasatch County?
There are 104.38 Males per 100 Females in Wasatch County.
What is the Ratio of Females per 100 Males in Wasatch County?
There are 95.80 Females per 100 Males in Wasatch County.
What is the Median Population Age in Wasatch County?
Median Population Age in Wasatch County is 35.5 Years.
What is the Average Family Size in Wasatch County
Average Family Size in Wasatch County is 3.5 People.
What is the Average Household Size in Wasatch County
Average Household Size in Wasatch County is 3.0 People.
What is Per Capita Income in Wasatch County?
Per Capita income in Wasatch County is $51,178.
What is the Median Family Income in Wasatch County?
Median Family Income in Wasatch County is $119,919.
What is the Median Household income in Wasatch County?
Median Household Income in Wasatch County is $104,855.
What is Income or Wage Gap in Wasatch County?
Income or Wage Gap in Wasatch County is 56.8%.
Women in Wasatch County earn 43.2 cents for every dollar earned by a man.
What is Inequality or Gini Index in Wasatch County?
Inequality or Gini Index in Wasatch County is 0.48.
How Large is the Labor Force in Wasatch County?
There are 17,672 People in the Labor Forcein in Wasatch County.
What is the Percentage of People in the Labor Force in Wasatch County?
68.3% of People are in the Labor Force in Wasatch County.
What is the Unemployment Rate in Wasatch County?
Unemployment Rate in Wasatch County is 2.4%.