Utah County, UT
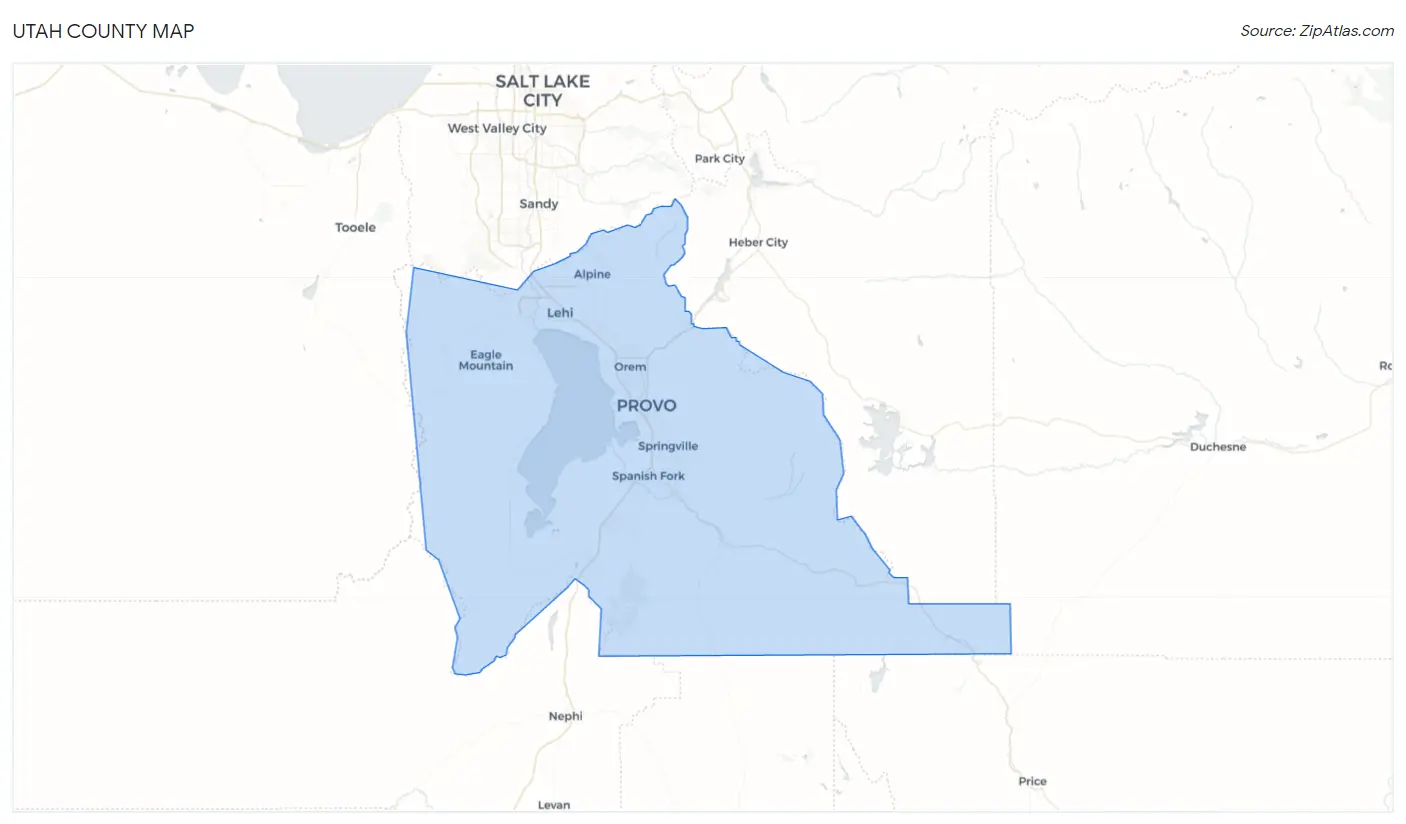
Utah County Map
Utah County Overview
666,021
TOTAL POPULATION
338,404
MALE POPULATION
327,617
FEMALE POPULATION
103.29
MALES / 100 FEMALES
96.81
FEMALES / 100 MALES
25.2
MEDIAN AGE
3.8
AVG FAMILY SIZE
3.5
AVG HOUSEHOLD SIZE
$33,251
PER CAPITA INCOME
$100,128
AVG FAMILY INCOME
$91,263
AVG HOUSEHOLD INCOME
53.0%
WAGE / INCOME GAP [ % ]
47.0¢/ $1
WAGE / INCOME GAP [ $ ]
$10,837
FAMILY INCOME DEFICIT
0.42
INEQUALITY / GINI INDEX
338,477
LABOR FORCE [ PEOPLE ]
71.3%
PERCENT IN LABOR FORCE
3.4%
UNEMPLOYMENT RATE
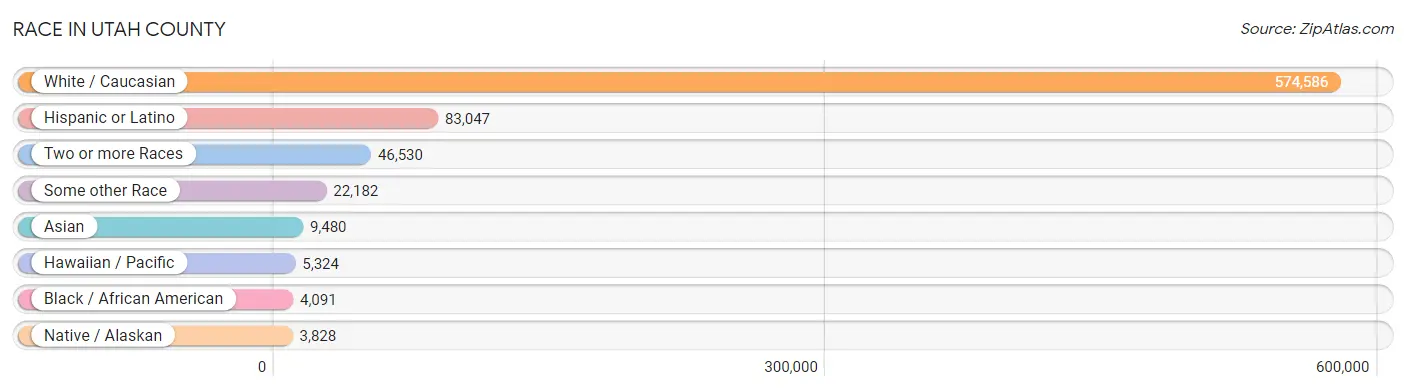
Race in Utah County
The most populous races in Utah County are White / Caucasian (574,586 | 86.3%), Hispanic or Latino (83,047 | 12.5%), and Two or more Races (46,530 | 7.0%).
| Race | # Population | % Population |
| Asian | 9,480 | 1.4% |
| Black / African American | 4,091 | 0.6% |
| Hawaiian / Pacific | 5,324 | 0.8% |
| Hispanic or Latino | 83,047 | 12.5% |
| Native / Alaskan | 3,828 | 0.6% |
| White / Caucasian | 574,586 | 86.3% |
| Two or more Races | 46,530 | 7.0% |
| Some other Race | 22,182 | 3.3% |
| Total | 666,021 | 100.0% |
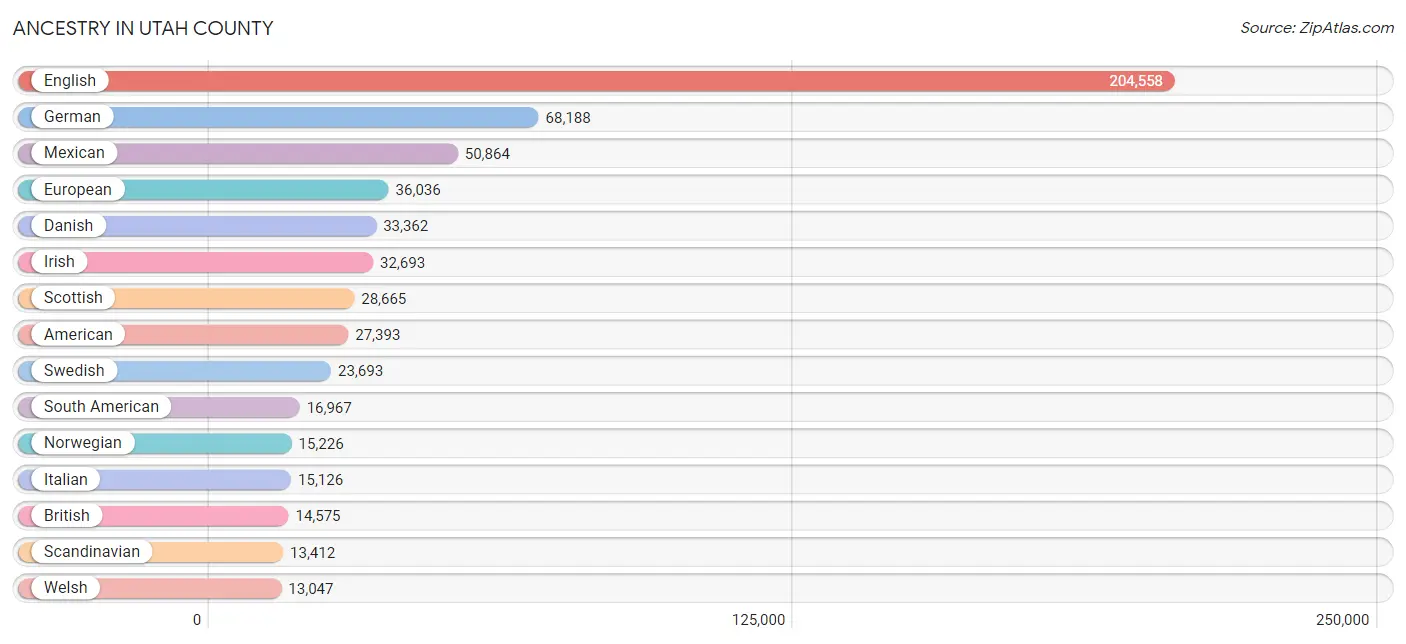
Ancestry in Utah County
The most populous ancestries reported in Utah County are English (204,558 | 30.7%), German (68,188 | 10.2%), Mexican (50,864 | 7.6%), European (36,036 | 5.4%), and Danish (33,362 | 5.0%), together accounting for 59.0% of all Utah County residents.
| Ancestry | # Population | % Population |
| Afghan | 8 | 0.0% |
| African | 1,074 | 0.2% |
| Alaska Native | 14 | 0.0% |
| Albanian | 98 | 0.0% |
| Aleut | 21 | 0.0% |
| American | 27,393 | 4.1% |
| Apache | 199 | 0.0% |
| Arab | 1,323 | 0.2% |
| Arapaho | 1 | 0.0% |
| Argentinean | 2,971 | 0.4% |
| Armenian | 343 | 0.1% |
| Assyrian / Chaldean / Syriac | 19 | 0.0% |
| Australian | 386 | 0.1% |
| Austrian | 600 | 0.1% |
| Bangladeshi | 267 | 0.0% |
| Basque | 315 | 0.1% |
| Belgian | 443 | 0.1% |
| Belizean | 16 | 0.0% |
| Bermudan | 15 | 0.0% |
| Bhutanese | 5,073 | 0.8% |
| Blackfeet | 267 | 0.0% |
| Bolivian | 836 | 0.1% |
| Brazilian | 2,043 | 0.3% |
| British | 14,575 | 2.2% |
| British West Indian | 68 | 0.0% |
| Bulgarian | 9 | 0.0% |
| Burmese | 2,840 | 0.4% |
| Cajun | 21 | 0.0% |
| Cambodian | 277 | 0.0% |
| Canadian | 2,348 | 0.4% |
| Cape Verdean | 250 | 0.0% |
| Celtic | 101 | 0.0% |
| Central American | 5,998 | 0.9% |
| Central American Indian | 631 | 0.1% |
| Cherokee | 850 | 0.1% |
| Cheyenne | 36 | 0.0% |
| Chickasaw | 173 | 0.0% |
| Chilean | 2,415 | 0.4% |
| Chinese | 20 | 0.0% |
| Chippewa | 26 | 0.0% |
| Choctaw | 127 | 0.0% |
| Colombian | 1,473 | 0.2% |
| Comanche | 9 | 0.0% |
| Costa Rican | 397 | 0.1% |
| Cree | 10 | 0.0% |
| Creek | 13 | 0.0% |
| Croatian | 393 | 0.1% |
| Cuban | 771 | 0.1% |
| Czech | 1,162 | 0.2% |
| Czechoslovakian | 260 | 0.0% |
| Danish | 33,362 | 5.0% |
| Dominican | 1,257 | 0.2% |
| Dutch | 10,193 | 1.5% |
| Eastern European | 479 | 0.1% |
| Ecuadorian | 1,831 | 0.3% |
| Egyptian | 114 | 0.0% |
| English | 204,558 | 30.7% |
| Estonian | 26 | 0.0% |
| Ethiopian | 57 | 0.0% |
| European | 36,036 | 5.4% |
| Fijian | 108 | 0.0% |
| Filipino | 194 | 0.0% |
| Finnish | 1,326 | 0.2% |
| French | 10,232 | 1.5% |
| French American Indian | 54 | 0.0% |
| French Canadian | 1,509 | 0.2% |
| German | 68,188 | 10.2% |
| German Russian | 10 | 0.0% |
| Ghanaian | 120 | 0.0% |
| Greek | 2,071 | 0.3% |
| Guamanian / Chamorro | 269 | 0.0% |
| Guatemalan | 2,150 | 0.3% |
| Haitian | 279 | 0.0% |
| Honduran | 788 | 0.1% |
| Hopi | 125 | 0.0% |
| Hungarian | 862 | 0.1% |
| Icelander | 1,794 | 0.3% |
| Indian (Asian) | 6,373 | 1.0% |
| Indonesian | 53 | 0.0% |
| Inupiat | 46 | 0.0% |
| Iranian | 307 | 0.1% |
| Iraqi | 49 | 0.0% |
| Irish | 32,693 | 4.9% |
| Iroquois | 121 | 0.0% |
| Israeli | 251 | 0.0% |
| Italian | 15,126 | 2.3% |
| Jamaican | 166 | 0.0% |
| Japanese | 151 | 0.0% |
| Kenyan | 78 | 0.0% |
| Korean | 3,310 | 0.5% |
| Laotian | 183 | 0.0% |
| Latvian | 26 | 0.0% |
| Lebanese | 244 | 0.0% |
| Liberian | 50 | 0.0% |
| Lithuanian | 359 | 0.1% |
| Lumbee | 51 | 0.0% |
| Macedonian | 12 | 0.0% |
| Malaysian | 434 | 0.1% |
| Maltese | 7 | 0.0% |
| Marshallese | 161 | 0.0% |
| Mexican | 50,864 | 7.6% |
| Mexican American Indian | 1,240 | 0.2% |
| Mongolian | 35 | 0.0% |
| Moroccan | 37 | 0.0% |
| Native Hawaiian | 4,041 | 0.6% |
| Navajo | 2,020 | 0.3% |
| New Zealander | 112 | 0.0% |
| Nicaraguan | 202 | 0.0% |
| Nigerian | 375 | 0.1% |
| Northern European | 2,462 | 0.4% |
| Norwegian | 15,226 | 2.3% |
| Okinawan | 122 | 0.0% |
| Paiute | 29 | 0.0% |
| Pakistani | 433 | 0.1% |
| Palestinian | 137 | 0.0% |
| Panamanian | 120 | 0.0% |
| Paraguayan | 47 | 0.0% |
| Pennsylvania German | 26 | 0.0% |
| Peruvian | 4,414 | 0.7% |
| Pima | 67 | 0.0% |
| Polish | 3,427 | 0.5% |
| Portuguese | 1,725 | 0.3% |
| Potawatomi | 7 | 0.0% |
| Pueblo | 44 | 0.0% |
| Puerto Rican | 1,996 | 0.3% |
| Puget Sound Salish | 27 | 0.0% |
| Romanian | 254 | 0.0% |
| Russian | 1,929 | 0.3% |
| Salvadoran | 2,336 | 0.4% |
| Samoan | 3,945 | 0.6% |
| Scandinavian | 13,412 | 2.0% |
| Scotch-Irish | 5,407 | 0.8% |
| Scottish | 28,665 | 4.3% |
| Seminole | 15 | 0.0% |
| Serbian | 107 | 0.0% |
| Shoshone | 83 | 0.0% |
| Sioux | 374 | 0.1% |
| Slavic | 140 | 0.0% |
| Slovak | 326 | 0.1% |
| Slovene | 86 | 0.0% |
| South African | 143 | 0.0% |
| South American | 16,967 | 2.5% |
| South American Indian | 858 | 0.1% |
| Spaniard | 1,481 | 0.2% |
| Spanish | 2,088 | 0.3% |
| Spanish American | 16 | 0.0% |
| Spanish American Indian | 10 | 0.0% |
| Sri Lankan | 1,167 | 0.2% |
| Subsaharan African | 2,328 | 0.4% |
| Swedish | 23,693 | 3.6% |
| Swiss | 7,789 | 1.2% |
| Syrian | 116 | 0.0% |
| Thai | 1,761 | 0.3% |
| Tlingit-Haida | 136 | 0.0% |
| Tongan | 3,441 | 0.5% |
| Trinidadian and Tobagonian | 69 | 0.0% |
| Tsimshian | 21 | 0.0% |
| Turkish | 132 | 0.0% |
| Ukrainian | 530 | 0.1% |
| Uruguayan | 376 | 0.1% |
| Ute | 267 | 0.0% |
| Venezuelan | 2,533 | 0.4% |
| Vietnamese | 81 | 0.0% |
| Welsh | 13,047 | 2.0% |
| Yakama | 16 | 0.0% |
| Yaqui | 50 | 0.0% |
| Yugoslavian | 342 | 0.1% | View All 167 Rows |
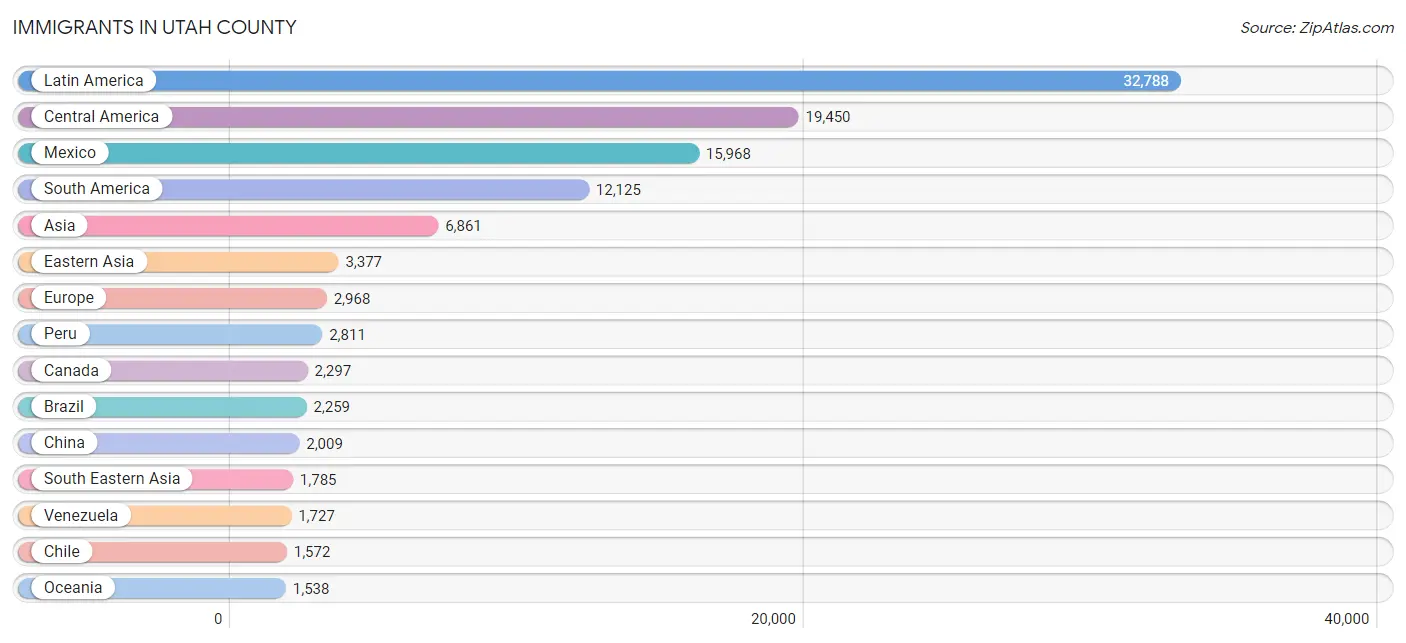
Immigrants in Utah County
The most numerous immigrant groups reported in Utah County came from Latin America (32,788 | 4.9%), Central America (19,450 | 2.9%), Mexico (15,968 | 2.4%), South America (12,125 | 1.8%), and Asia (6,861 | 1.0%), together accounting for 13.1% of all Utah County residents.
| Immigration Origin | # Population | % Population |
| Africa | 1,528 | 0.2% |
| Argentina | 1,437 | 0.2% |
| Armenia | 33 | 0.0% |
| Asia | 6,861 | 1.0% |
| Australia | 301 | 0.1% |
| Austria | 30 | 0.0% |
| Bangladesh | 46 | 0.0% |
| Belarus | 30 | 0.0% |
| Belgium | 48 | 0.0% |
| Bolivia | 435 | 0.1% |
| Bosnia and Herzegovina | 40 | 0.0% |
| Brazil | 2,259 | 0.3% |
| Bulgaria | 10 | 0.0% |
| Cabo Verde | 257 | 0.0% |
| Cambodia | 35 | 0.0% |
| Cameroon | 35 | 0.0% |
| Canada | 2,297 | 0.3% |
| Caribbean | 1,213 | 0.2% |
| Central America | 19,450 | 2.9% |
| Chile | 1,572 | 0.2% |
| China | 2,009 | 0.3% |
| Colombia | 916 | 0.1% |
| Congo | 42 | 0.0% |
| Costa Rica | 190 | 0.0% |
| Cuba | 36 | 0.0% |
| Czechoslovakia | 56 | 0.0% |
| Denmark | 48 | 0.0% |
| Dominican Republic | 977 | 0.2% |
| Eastern Africa | 141 | 0.0% |
| Eastern Asia | 3,377 | 0.5% |
| Eastern Europe | 808 | 0.1% |
| Ecuador | 790 | 0.1% |
| Egypt | 166 | 0.0% |
| El Salvador | 1,207 | 0.2% |
| England | 288 | 0.0% |
| Ethiopia | 41 | 0.0% |
| Europe | 2,968 | 0.4% |
| Fiji | 7 | 0.0% |
| France | 254 | 0.0% |
| Germany | 327 | 0.1% |
| Ghana | 92 | 0.0% |
| Greece | 7 | 0.0% |
| Guatemala | 1,150 | 0.2% |
| Haiti | 104 | 0.0% |
| Honduras | 586 | 0.1% |
| Hong Kong | 546 | 0.1% |
| Hungary | 18 | 0.0% |
| India | 1,038 | 0.2% |
| Indonesia | 35 | 0.0% |
| Iran | 160 | 0.0% |
| Iraq | 37 | 0.0% |
| Ireland | 16 | 0.0% |
| Israel | 68 | 0.0% |
| Italy | 134 | 0.0% |
| Jamaica | 58 | 0.0% |
| Japan | 367 | 0.1% |
| Jordan | 43 | 0.0% |
| Kazakhstan | 27 | 0.0% |
| Kenya | 7 | 0.0% |
| Korea | 843 | 0.1% |
| Kuwait | 20 | 0.0% |
| Laos | 182 | 0.0% |
| Latin America | 32,788 | 4.9% |
| Latvia | 4 | 0.0% |
| Lebanon | 4 | 0.0% |
| Liberia | 20 | 0.0% |
| Lithuania | 8 | 0.0% |
| Malaysia | 37 | 0.0% |
| Mexico | 15,968 | 2.4% |
| Micronesia | 220 | 0.0% |
| Middle Africa | 247 | 0.0% |
| Moldova | 8 | 0.0% |
| Morocco | 46 | 0.0% |
| Netherlands | 142 | 0.0% |
| Nicaragua | 226 | 0.0% |
| Nigeria | 208 | 0.0% |
| Northern Africa | 220 | 0.0% |
| Northern Europe | 850 | 0.1% |
| Norway | 20 | 0.0% |
| Oceania | 1,538 | 0.2% |
| Pakistan | 12 | 0.0% |
| Panama | 123 | 0.0% |
| Peru | 2,811 | 0.4% |
| Philippines | 676 | 0.1% |
| Poland | 80 | 0.0% |
| Portugal | 31 | 0.0% |
| Romania | 146 | 0.0% |
| Russia | 264 | 0.0% |
| Saudi Arabia | 107 | 0.0% |
| Scotland | 60 | 0.0% |
| Singapore | 214 | 0.0% |
| South Africa | 285 | 0.0% |
| South America | 12,125 | 1.8% |
| South Central Asia | 1,338 | 0.2% |
| South Eastern Asia | 1,785 | 0.3% |
| Southern Europe | 392 | 0.1% |
| Spain | 220 | 0.0% |
| Sri Lanka | 55 | 0.0% |
| Sweden | 51 | 0.0% |
| Switzerland | 63 | 0.0% |
| Taiwan | 245 | 0.0% |
| Thailand | 116 | 0.0% |
| Trinidad and Tobago | 16 | 0.0% |
| Turkey | 49 | 0.0% |
| Uganda | 2 | 0.0% |
| Ukraine | 109 | 0.0% |
| Uruguay | 119 | 0.0% |
| Venezuela | 1,727 | 0.3% |
| Vietnam | 451 | 0.1% |
| Western Africa | 577 | 0.1% |
| Western Asia | 361 | 0.1% |
| Western Europe | 864 | 0.1% |
| Zaire | 165 | 0.0% |
| Zimbabwe | 75 | 0.0% | View All 114 Rows |
Sex and Age in Utah County
Sex and Age in Utah County
The most populous age groups in Utah County are 20 to 24 Years (44,134 | 13.0%) for men and 20 to 24 Years (41,916 | 12.8%) for women.

| Age Bracket | Male | Female |
| Under 5 Years | 29,855 (8.8%) | 28,402 (8.7%) |
| 5 to 9 Years | 30,286 (8.9%) | 29,687 (9.1%) |
| 10 to 14 Years | 31,879 (9.4%) | 28,680 (8.7%) |
| 15 to 19 Years | 32,516 (9.6%) | 33,288 (10.2%) |
| 20 to 24 Years | 44,134 (13.0%) | 41,916 (12.8%) |
| 25 to 29 Years | 29,343 (8.7%) | 26,219 (8.0%) |
| 30 to 34 Years | 21,237 (6.3%) | 20,451 (6.2%) |
| 35 to 39 Years | 22,203 (6.6%) | 21,150 (6.5%) |
| 40 to 44 Years | 20,727 (6.1%) | 19,512 (6.0%) |
| 45 to 49 Years | 16,693 (4.9%) | 15,729 (4.8%) |
| 50 to 54 Years | 13,502 (4.0%) | 12,773 (3.9%) |
| 55 to 59 Years | 11,772 (3.5%) | 11,763 (3.6%) |
| 60 to 64 Years | 10,452 (3.1%) | 10,339 (3.2%) |
| 65 to 69 Years | 8,399 (2.5%) | 8,797 (2.7%) |
| 70 to 74 Years | 6,364 (1.9%) | 7,430 (2.3%) |
| 75 to 79 Years | 4,271 (1.3%) | 5,039 (1.5%) |
| 80 to 84 Years | 2,668 (0.8%) | 3,471 (1.1%) |
| 85 Years and over | 2,103 (0.6%) | 2,971 (0.9%) |
| Total | 338,404 (100.0%) | 327,617 (100.0%) |
Families and Households in Utah County
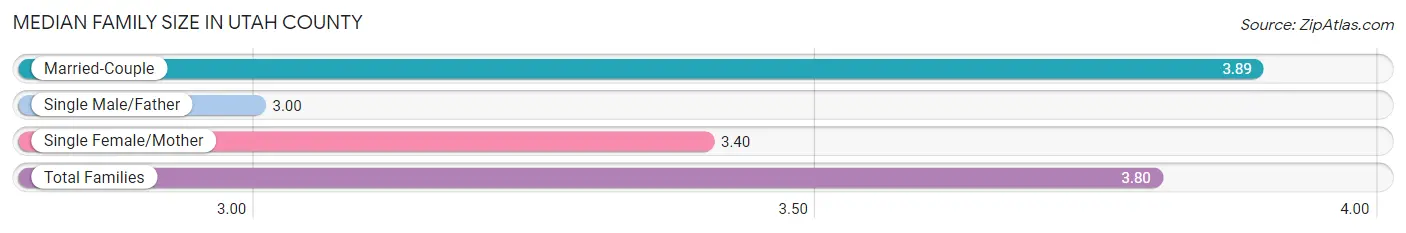
Median Family Size in Utah County
The median family size in Utah County is 3.80 persons per family, with married-couple families (130,297 | 86.0%) accounting for the largest median family size of 3.89 persons per family. On the other hand, single male/father families (7,638 | 5.0%) represent the smallest median family size with 3.00 persons per family.
| Family Type | # Families | Family Size |
| Married-Couple | 130,297 (86.0%) | 3.89 |
| Single Male/Father | 7,638 (5.0%) | 3.00 |
| Single Female/Mother | 13,567 (8.9%) | 3.40 |
| Total Families | 151,502 (100.0%) | 3.80 |
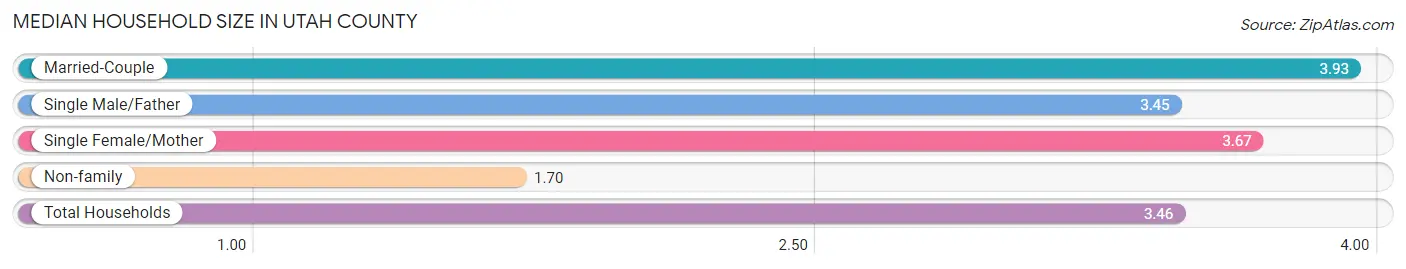
Median Household Size in Utah County
The median household size in Utah County is 3.46 persons per household, with married-couple households (130,297 | 69.6%) accounting for the largest median household size of 3.93 persons per household. non-family households (35,669 | 19.1%) represent the smallest median household size with 1.70 persons per household.
| Household Type | # Households | Household Size |
| Married-Couple | 130,297 (69.6%) | 3.93 |
| Single Male/Father | 7,638 (4.1%) | 3.45 |
| Single Female/Mother | 13,567 (7.2%) | 3.67 |
| Non-family | 35,669 (19.1%) | 1.70 |
| Total Households | 187,171 (100.0%) | 3.46 |
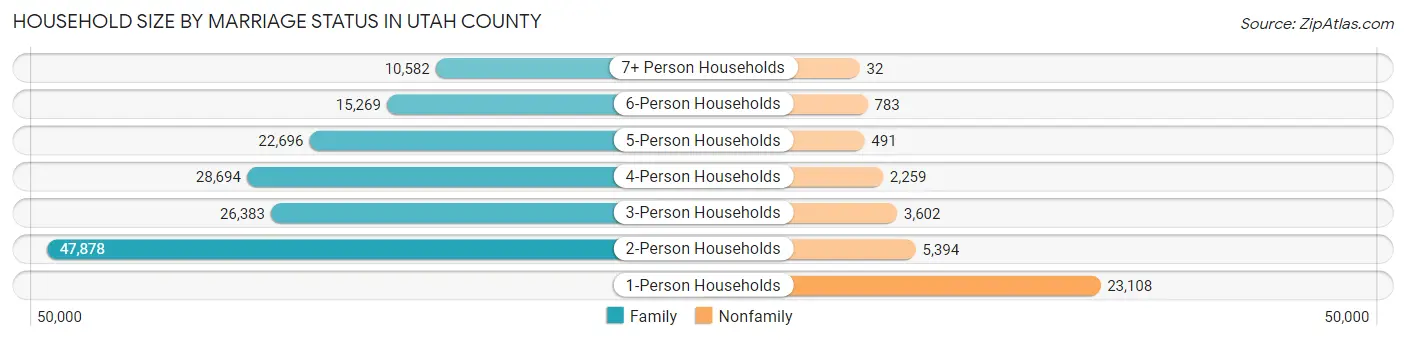
Household Size by Marriage Status in Utah County
Out of a total of 187,171 households in Utah County, 151,502 (80.9%) are family households, while 35,669 (19.1%) are nonfamily households. The most numerous type of family households are 2-person households, comprising 47,878, and the most common type of nonfamily households are 1-person households, comprising 23,108.
| Household Size | Family Households | Nonfamily Households |
| 1-Person Households | - | 23,108 (12.3%) |
| 2-Person Households | 47,878 (25.6%) | 5,394 (2.9%) |
| 3-Person Households | 26,383 (14.1%) | 3,602 (1.9%) |
| 4-Person Households | 28,694 (15.3%) | 2,259 (1.2%) |
| 5-Person Households | 22,696 (12.1%) | 491 (0.3%) |
| 6-Person Households | 15,269 (8.2%) | 783 (0.4%) |
| 7+ Person Households | 10,582 (5.7%) | 32 (0.0%) |
| Total | 151,502 (80.9%) | 35,669 (19.1%) |
Female Fertility in Utah County
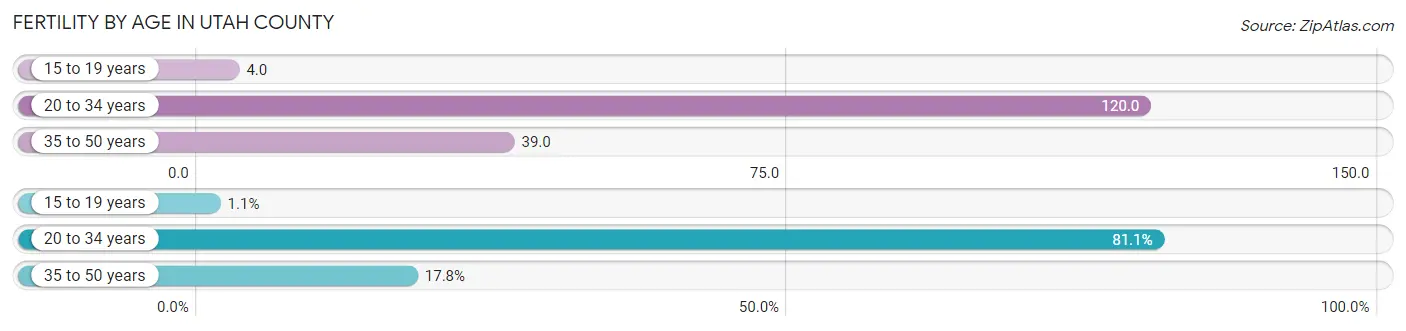
Fertility by Age in Utah County
Average fertility rate in Utah County is 72.0 births per 1,000 women. Women in the age bracket of 20 to 34 years have the highest fertility rate with 120.0 births per 1,000 women. Women in the age bracket of 20 to 34 years acount for 81.1% of all women with births.
| Age Bracket | Women with Births | Births / 1,000 Women |
| 15 to 19 years | 140 (1.1%) | 4.0 |
| 20 to 34 years | 10,598 (81.1%) | 120.0 |
| 35 to 50 years | 2,326 (17.8%) | 39.0 |
| Total | 13,064 (100.0%) | 72.0 |
Fertility by Age by Marriage Status in Utah County
92.1% of women with births (13,064) in Utah County are married. The highest percentage of unmarried women with births falls into 15 to 19 years age bracket with 65.0% of them unmarried at the time of birth, while the lowest percentage of unmarried women with births belong to 35 to 50 years age bracket with 2.5% of them unmarried.
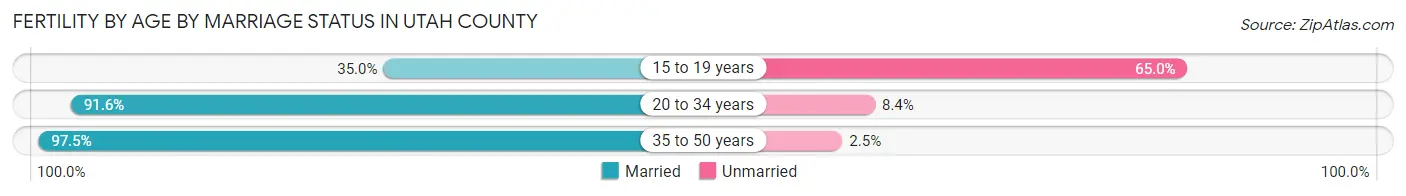
| Age Bracket | Married | Unmarried |
| 15 to 19 years | 49 (35.0%) | 91 (65.0%) |
| 20 to 34 years | 9,708 (91.6%) | 890 (8.4%) |
| 35 to 50 years | 2,268 (97.5%) | 58 (2.5%) |
| Total | 12,032 (92.1%) | 1,032 (7.9%) |
Fertility by Education in Utah County
Average fertility rate in Utah County is 72.0 births per 1,000 women. Women with the education attainment of bachelor's degree have the highest fertility rate of 114.0 births per 1,000 women, while women with the education attainment of less than high school have the lowest fertility at 12.0 births per 1,000 women. Women with the education attainment of bachelor's degree represent 37.4% of all women with births.
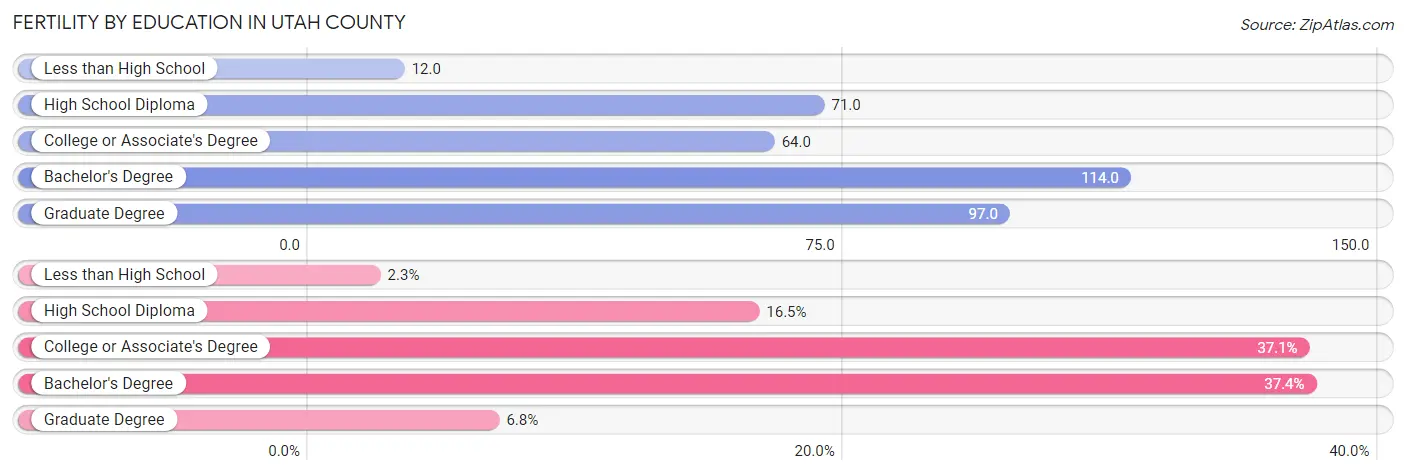
| Educational Attainment | Women with Births | Births / 1,000 Women |
| Less than High School | 300 (2.3%) | 12.0 |
| High School Diploma | 2,154 (16.5%) | 71.0 |
| College or Associate's Degree | 4,847 (37.1%) | 64.0 |
| Bachelor's Degree | 4,881 (37.4%) | 114.0 |
| Graduate Degree | 882 (6.8%) | 97.0 |
| Total | 13,064 (100.0%) | 72.0 |
Fertility by Education by Marriage Status in Utah County
7.9% of women with births in Utah County are unmarried. Women with the educational attainment of graduate degree are most likely to be married with 100.0% of them married at childbirth, while women with the educational attainment of less than high school are least likely to be married with 24.7% of them unmarried at childbirth.
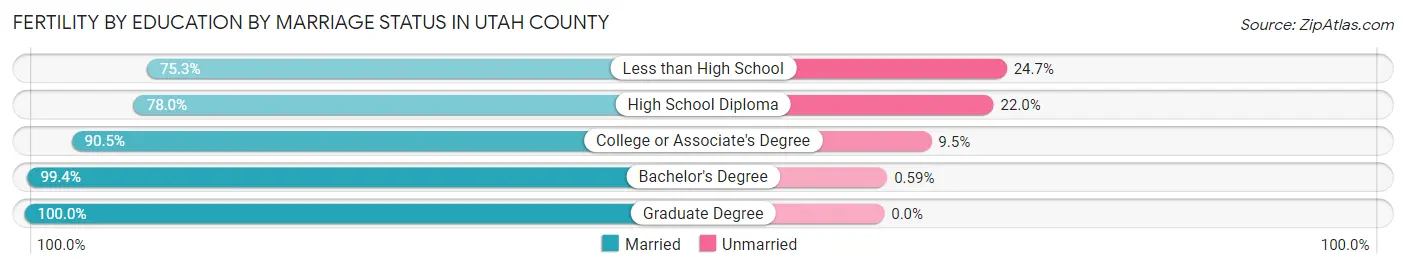
| Educational Attainment | Married | Unmarried |
| Less than High School | 226 (75.3%) | 74 (24.7%) |
| High School Diploma | 1,680 (78.0%) | 474 (22.0%) |
| College or Associate's Degree | 4,387 (90.5%) | 460 (9.5%) |
| Bachelor's Degree | 4,852 (99.4%) | 29 (0.6%) |
| Graduate Degree | 882 (100.0%) | 0 (0.0%) |
| Total | 12,032 (92.1%) | 1,032 (7.9%) |
Income in Utah County
Income Overview in Utah County
Per Capita Income in Utah County is $33,251, while median incomes of families and households are $100,128 and $91,263 respectively.
| Characteristic | Number | Measure |
| Per Capita Income | 666,021 | $33,251 |
| Median Family Income | 151,502 | $100,128 |
| Mean Family Income | 151,502 | $125,182 |
| Median Household Income | 187,171 | $91,263 |
| Mean Household Income | 187,171 | $116,214 |
| Income Deficit | 151,502 | $10,837 |
| Wage / Income Gap (%) | 666,021 | 53.03% |
| Wage / Income Gap ($) | 666,021 | 46.97¢ per $1 |
| Gini / Inequality Index | 666,021 | 0.42 |
Earnings by Sex in Utah County
Average Earnings in Utah County are $33,056, $46,671 for men and $21,923 for women, a difference of 53.0%.
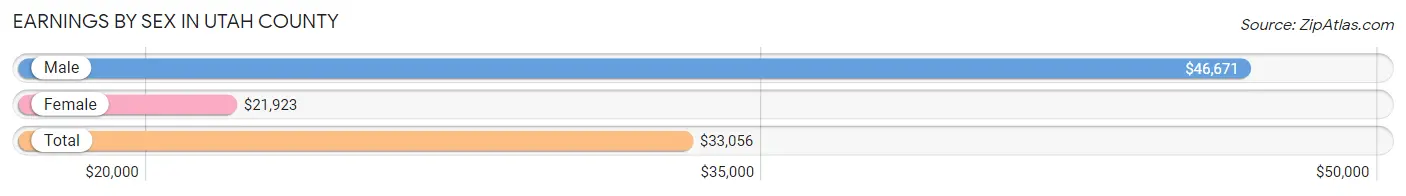
| Sex | Number | Average Earnings |
| Male | 203,311 (56.1%) | $46,671 |
| Female | 158,994 (43.9%) | $21,923 |
| Total | 362,305 (100.0%) | $33,056 |
Earnings by Sex by Income Bracket in Utah County
The most common earnings brackets in Utah County are $100,000+ for men (43,533 | 21.4%) and $2,499 or less for women (15,920 | 10.0%).
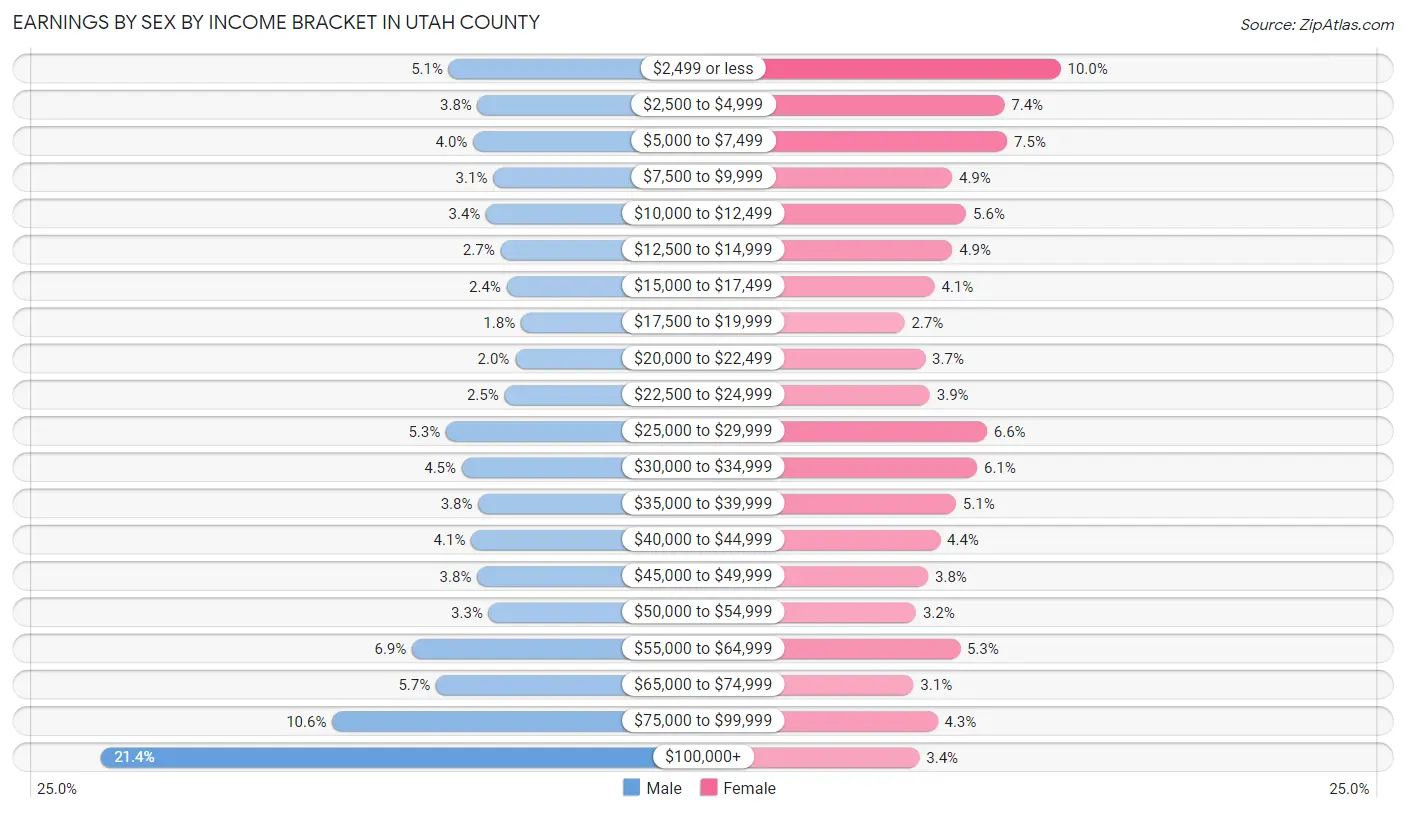
| Income | Male | Female |
| $2,499 or less | 10,436 (5.1%) | 15,920 (10.0%) |
| $2,500 to $4,999 | 7,688 (3.8%) | 11,741 (7.4%) |
| $5,000 to $7,499 | 8,109 (4.0%) | 11,946 (7.5%) |
| $7,500 to $9,999 | 6,201 (3.0%) | 7,837 (4.9%) |
| $10,000 to $12,499 | 6,880 (3.4%) | 8,883 (5.6%) |
| $12,500 to $14,999 | 5,511 (2.7%) | 7,851 (4.9%) |
| $15,000 to $17,499 | 4,914 (2.4%) | 6,541 (4.1%) |
| $17,500 to $19,999 | 3,554 (1.8%) | 4,286 (2.7%) |
| $20,000 to $22,499 | 4,104 (2.0%) | 5,839 (3.7%) |
| $22,500 to $24,999 | 5,123 (2.5%) | 6,179 (3.9%) |
| $25,000 to $29,999 | 10,689 (5.3%) | 10,427 (6.6%) |
| $30,000 to $34,999 | 9,182 (4.5%) | 9,704 (6.1%) |
| $35,000 to $39,999 | 7,627 (3.7%) | 8,128 (5.1%) |
| $40,000 to $44,999 | 8,293 (4.1%) | 6,950 (4.4%) |
| $45,000 to $49,999 | 7,729 (3.8%) | 6,052 (3.8%) |
| $50,000 to $54,999 | 6,626 (3.3%) | 5,154 (3.2%) |
| $55,000 to $64,999 | 13,923 (6.9%) | 8,419 (5.3%) |
| $65,000 to $74,999 | 11,656 (5.7%) | 4,966 (3.1%) |
| $75,000 to $99,999 | 21,533 (10.6%) | 6,764 (4.3%) |
| $100,000+ | 43,533 (21.4%) | 5,407 (3.4%) |
| Total | 203,311 (100.0%) | 158,994 (100.0%) |
Earnings by Sex by Educational Attainment in Utah County
Average earnings in Utah County are $68,293 for men and $32,592 for women, a difference of 52.3%. Men with an educational attainment of graduate degree enjoy the highest average annual earnings of $112,900, while those with less than high school education earn the least with $42,194. Women with an educational attainment of graduate degree earn the most with the average annual earnings of $60,876, while those with less than high school education have the smallest earnings of $25,236.
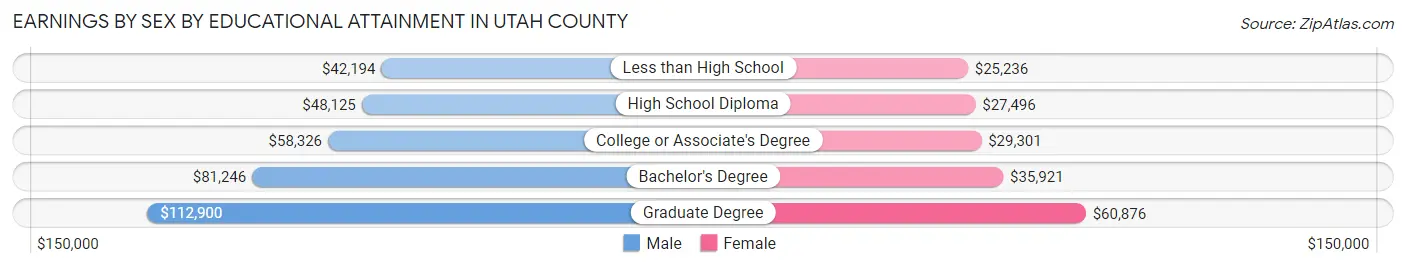
| Educational Attainment | Male Income | Female Income |
| Less than High School | $42,194 | $25,236 |
| High School Diploma | $48,125 | $27,496 |
| College or Associate's Degree | $58,326 | $29,301 |
| Bachelor's Degree | $81,246 | $35,921 |
| Graduate Degree | $112,900 | $60,876 |
| Total | $68,293 | $32,592 |
Family Income in Utah County
Family Income Brackets in Utah County
According to the Utah County family income data, there are 36,966 families falling into the $100,000 to $149,999 income range, which is the most common income bracket and makes up 24.4% of all families. Conversely, the $10,000 to $14,999 income bracket is the least frequent group with only 1,818 families (1.2%) belonging to this category.
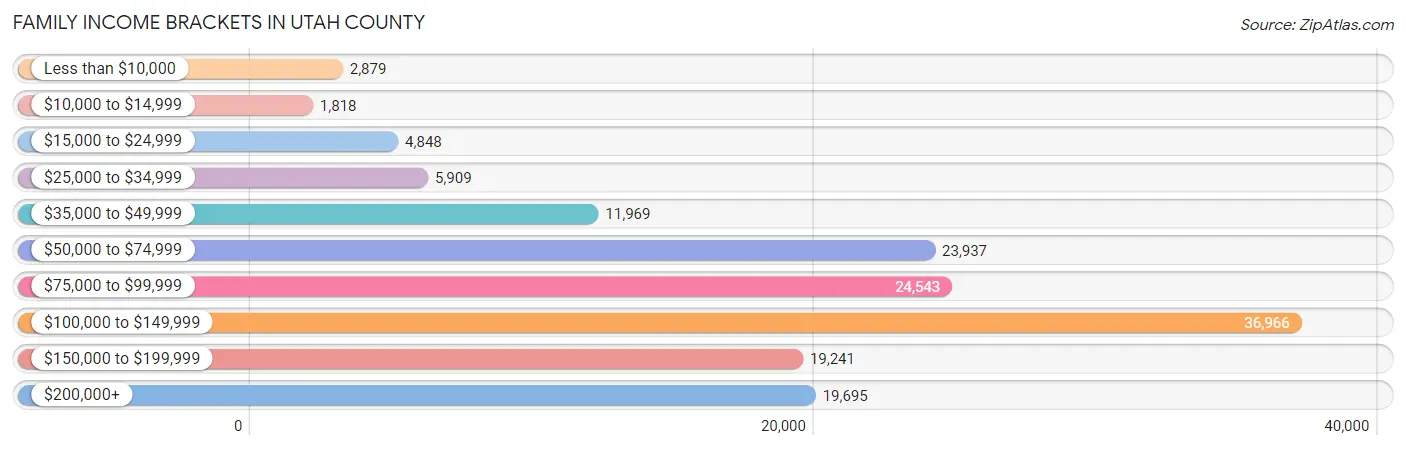
| Income Bracket | # Families | % Families |
| Less than $10,000 | 2,879 | 1.9% |
| $10,000 to $14,999 | 1,818 | 1.2% |
| $15,000 to $24,999 | 4,848 | 3.2% |
| $25,000 to $34,999 | 5,909 | 3.9% |
| $35,000 to $49,999 | 11,969 | 7.9% |
| $50,000 to $74,999 | 23,937 | 15.8% |
| $75,000 to $99,999 | 24,543 | 16.2% |
| $100,000 to $149,999 | 36,966 | 24.4% |
| $150,000 to $199,999 | 19,241 | 12.7% |
| $200,000+ | 19,695 | 13.0% |
Family Income by Famaliy Size in Utah County
7+ person families (9,774 | 6.5%) account for the highest median family income in Utah County with $137,599 per family, while 2-person families (51,097 | 33.7%) have the highest median income of $37,976 per family member.
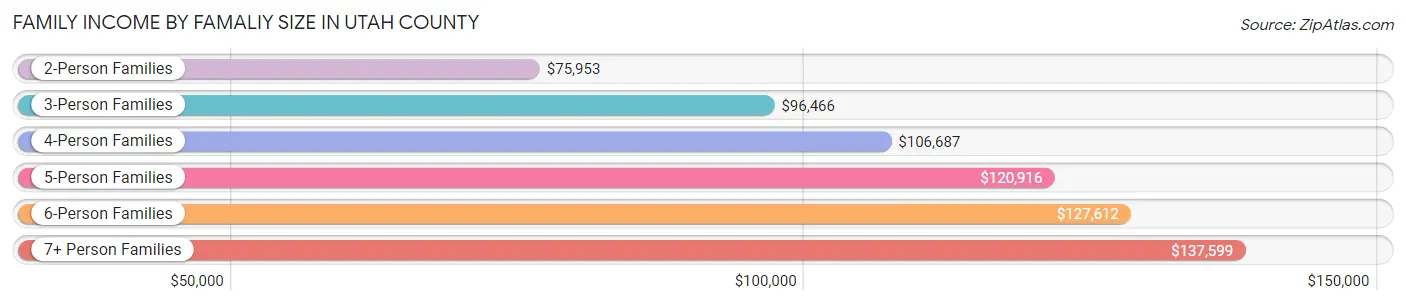
| Income Bracket | # Families | Median Income |
| 2-Person Families | 51,097 (33.7%) | $75,953 |
| 3-Person Families | 26,080 (17.2%) | $96,466 |
| 4-Person Families | 27,936 (18.4%) | $106,687 |
| 5-Person Families | 21,894 (14.4%) | $120,916 |
| 6-Person Families | 14,721 (9.7%) | $127,612 |
| 7+ Person Families | 9,774 (6.5%) | $137,599 |
| Total | 151,502 (100.0%) | $100,128 |
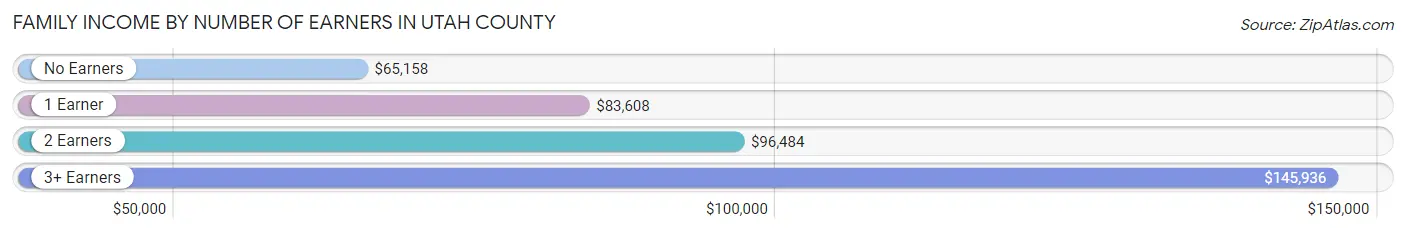
Family Income by Number of Earners in Utah County
The median family income in Utah County is $100,128, with families comprising 3+ earners (29,577) having the highest median family income of $145,936, while families with no earners (10,835) have the lowest median family income of $65,158, accounting for 19.5% and 7.1% of families, respectively.
| Number of Earners | # Families | Median Income |
| No Earners | 10,835 (7.1%) | $65,158 |
| 1 Earner | 42,104 (27.8%) | $83,608 |
| 2 Earners | 68,986 (45.5%) | $96,484 |
| 3+ Earners | 29,577 (19.5%) | $145,936 |
| Total | 151,502 (100.0%) | $100,128 |
Household Income in Utah County
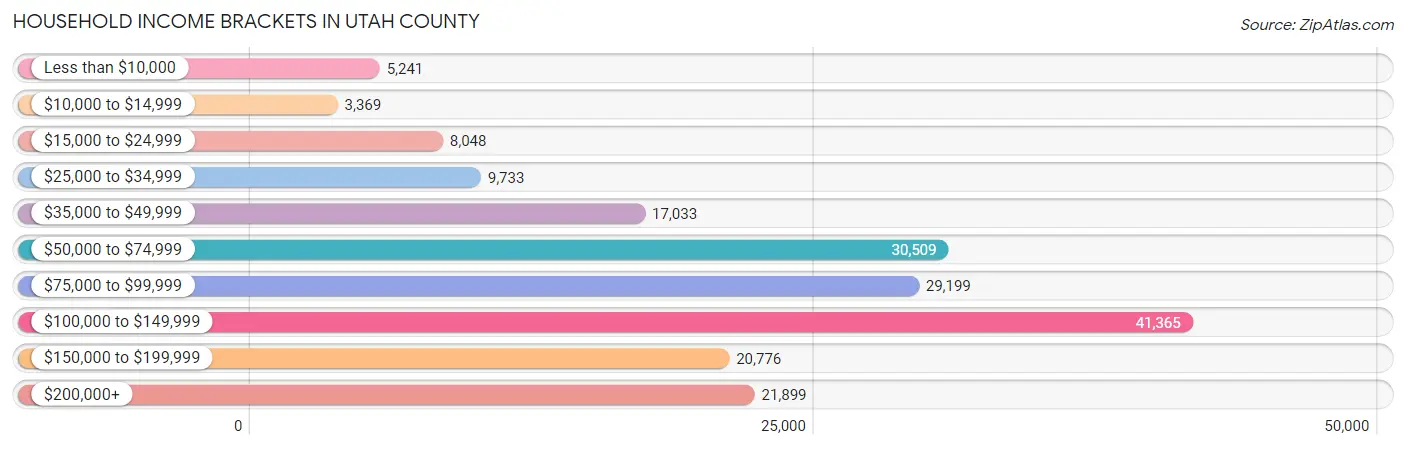
Household Income Brackets in Utah County
With 41,365 households falling in the category, the $100,000 to $149,999 income range is the most frequent in Utah County, accounting for 22.1% of all households. In contrast, only 3,369 households (1.8%) fall into the $10,000 to $14,999 income bracket, making it the least populous group.
| Income Bracket | # Households | % Households |
| Less than $10,000 | 5,241 | 2.8% |
| $10,000 to $14,999 | 3,369 | 1.8% |
| $15,000 to $24,999 | 8,048 | 4.3% |
| $25,000 to $34,999 | 9,733 | 5.2% |
| $35,000 to $49,999 | 17,033 | 9.1% |
| $50,000 to $74,999 | 30,509 | 16.3% |
| $75,000 to $99,999 | 29,199 | 15.6% |
| $100,000 to $149,999 | 41,365 | 22.1% |
| $150,000 to $199,999 | 20,776 | 11.1% |
| $200,000+ | 21,899 | 11.7% |
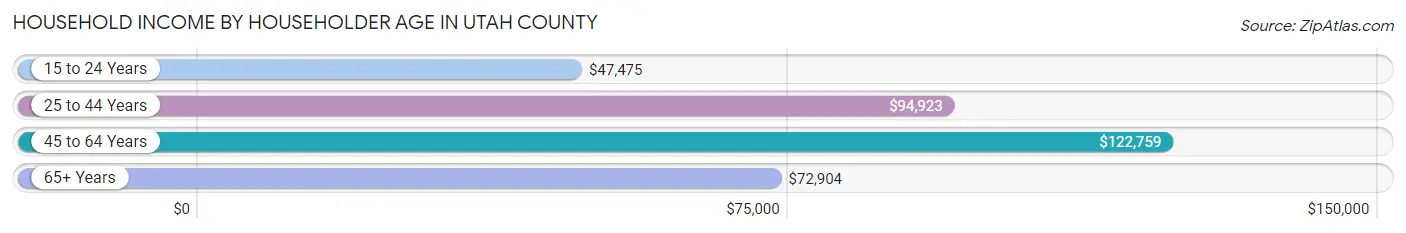
Household Income by Householder Age in Utah County
The median household income in Utah County is $91,263, with the highest median household income of $122,759 found in the 45 to 64 years age bracket for the primary householder. A total of 53,034 households (28.3%) fall into this category. Meanwhile, the 15 to 24 years age bracket for the primary householder has the lowest median household income of $47,475, with 21,428 households (11.5%) in this group.
| Income Bracket | # Households | Median Income |
| 15 to 24 Years | 21,428 (11.5%) | $47,475 |
| 25 to 44 Years | 82,490 (44.1%) | $94,923 |
| 45 to 64 Years | 53,034 (28.3%) | $122,759 |
| 65+ Years | 30,219 (16.2%) | $72,904 |
| Total | 187,171 (100.0%) | $91,263 |
Poverty in Utah County
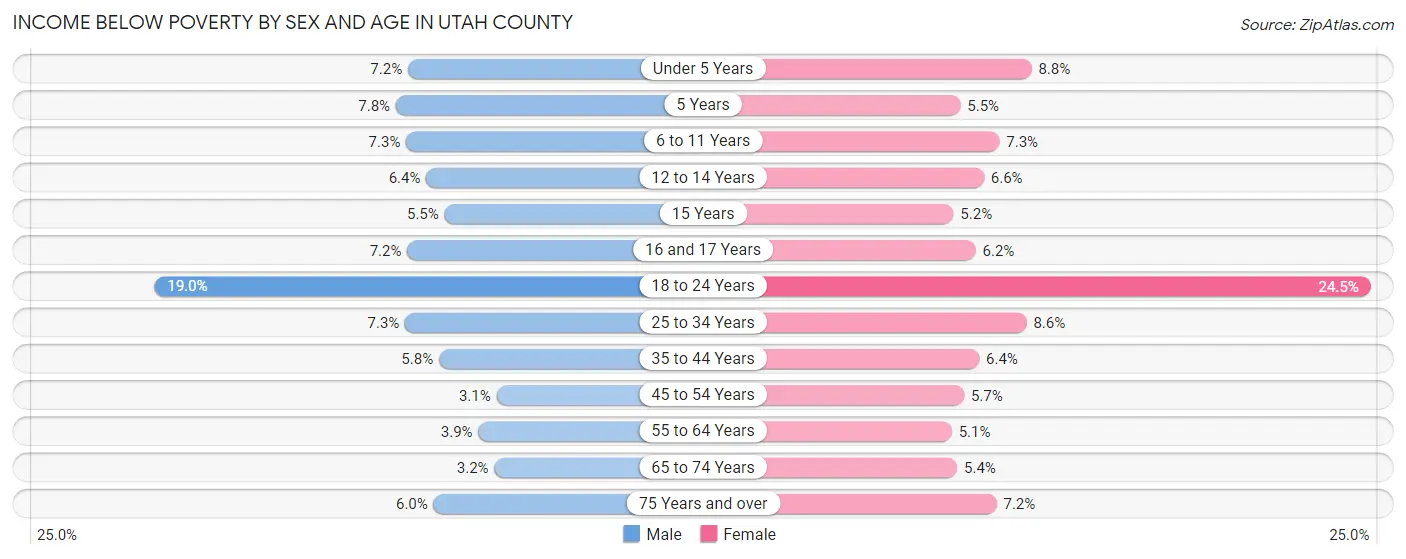
Income Below Poverty by Sex and Age in Utah County
With 8.1% poverty level for males and 9.7% for females among the residents of Utah County, 18 to 24 year old males and 18 to 24 year old females are the most vulnerable to poverty, with 9,958 males (19.0%) and 12,551 females (24.5%) in their respective age groups living below the poverty level.
| Age Bracket | Male | Female |
| Under 5 Years | 2,129 (7.2%) | 2,485 (8.8%) |
| 5 Years | 458 (7.8%) | 328 (5.5%) |
| 6 to 11 Years | 2,662 (7.3%) | 2,549 (7.3%) |
| 12 to 14 Years | 1,223 (6.4%) | 1,129 (6.6%) |
| 15 Years | 350 (5.5%) | 314 (5.2%) |
| 16 and 17 Years | 865 (7.2%) | 686 (6.2%) |
| 18 to 24 Years | 9,958 (19.0%) | 12,551 (24.5%) |
| 25 to 34 Years | 3,644 (7.3%) | 3,965 (8.6%) |
| 35 to 44 Years | 2,466 (5.8%) | 2,582 (6.4%) |
| 45 to 54 Years | 931 (3.1%) | 1,608 (5.7%) |
| 55 to 64 Years | 873 (3.9%) | 1,121 (5.1%) |
| 65 to 74 Years | 469 (3.2%) | 866 (5.3%) |
| 75 Years and over | 539 (6.0%) | 814 (7.2%) |
| Total | 26,567 (8.1%) | 30,998 (9.7%) |
Income Above Poverty by Sex and Age in Utah County
According to the poverty statistics in Utah County, males aged 45 to 54 years and females aged 55 to 64 years are the age groups that are most secure financially, with 96.9% of males and 94.9% of females in these age groups living above the poverty line.
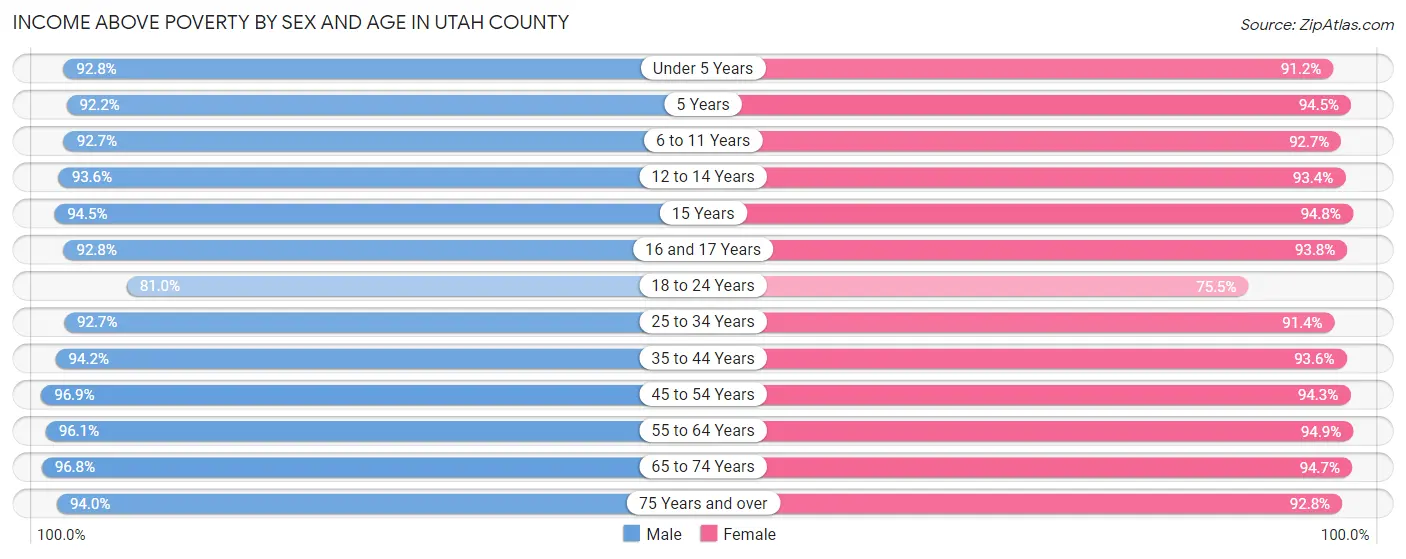
| Age Bracket | Male | Female |
| Under 5 Years | 27,414 (92.8%) | 25,745 (91.2%) |
| 5 Years | 5,440 (92.2%) | 5,641 (94.5%) |
| 6 to 11 Years | 33,863 (92.7%) | 32,311 (92.7%) |
| 12 to 14 Years | 18,007 (93.6%) | 15,996 (93.4%) |
| 15 Years | 5,999 (94.5%) | 5,742 (94.8%) |
| 16 and 17 Years | 11,084 (92.8%) | 10,363 (93.8%) |
| 18 to 24 Years | 42,508 (81.0%) | 38,600 (75.5%) |
| 25 to 34 Years | 46,025 (92.7%) | 42,311 (91.4%) |
| 35 to 44 Years | 40,281 (94.2%) | 37,930 (93.6%) |
| 45 to 54 Years | 29,082 (96.9%) | 26,771 (94.3%) |
| 55 to 64 Years | 21,261 (96.1%) | 20,856 (94.9%) |
| 65 to 74 Years | 14,169 (96.8%) | 15,308 (94.7%) |
| 75 Years and over | 8,410 (94.0%) | 10,518 (92.8%) |
| Total | 303,543 (91.9%) | 288,092 (90.3%) |
Income Below Poverty Among Married-Couple Families in Utah County
The poverty statistics for married-couple families in Utah County show that 4.4% or 5,687 of the total 130,297 families live below the poverty line. Families with 5 or more children have the highest poverty rate of 7.3%, comprising of 422 families. On the other hand, families with 1 or 2 children have the lowest poverty rate of 4.0%, which includes 1,701 families.
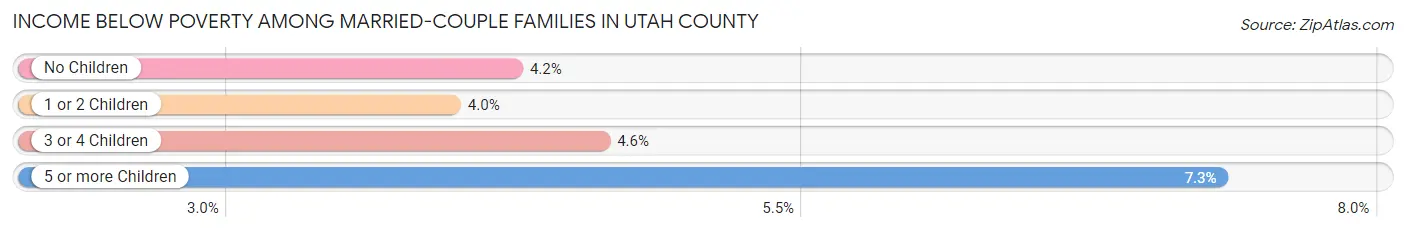
| Children | Above Poverty | Below Poverty |
| No Children | 53,030 (95.8%) | 2,347 (4.2%) |
| 1 or 2 Children | 41,123 (96.0%) | 1,701 (4.0%) |
| 3 or 4 Children | 25,110 (95.4%) | 1,217 (4.6%) |
| 5 or more Children | 5,347 (92.7%) | 422 (7.3%) |
| Total | 124,610 (95.6%) | 5,687 (4.4%) |
Income Below Poverty Among Single-Parent Households in Utah County
According to the poverty data in Utah County, 10.2% or 782 single-father households and 17.9% or 2,430 single-mother households are living below the poverty line. Among single-father households, those with 3 or 4 children have the highest poverty rate, with 151 households (15.4%) experiencing poverty. Likewise, among single-mother households, those with 5 or more children have the highest poverty rate, with 105 households (72.9%) falling below the poverty line.
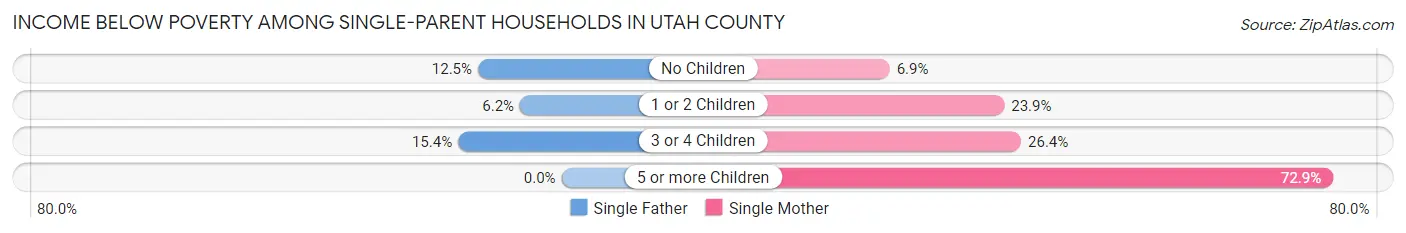
| Children | Single Father | Single Mother |
| No Children | 446 (12.5%) | 375 (6.9%) |
| 1 or 2 Children | 185 (6.2%) | 1,454 (23.9%) |
| 3 or 4 Children | 151 (15.4%) | 496 (26.4%) |
| 5 or more Children | 0 (0.0%) | 105 (72.9%) |
| Total | 782 (10.2%) | 2,430 (17.9%) |
Income Below Poverty Among Married-Couple vs Single-Parent Households in Utah County
The poverty data for Utah County shows that 5,687 of the married-couple family households (4.4%) and 3,212 of the single-parent households (15.1%) are living below the poverty level. Within the married-couple family households, those with 5 or more children have the highest poverty rate, with 422 households (7.3%) falling below the poverty line. Among the single-parent households, those with 5 or more children have the highest poverty rate, with 105 household (44.5%) living below poverty.
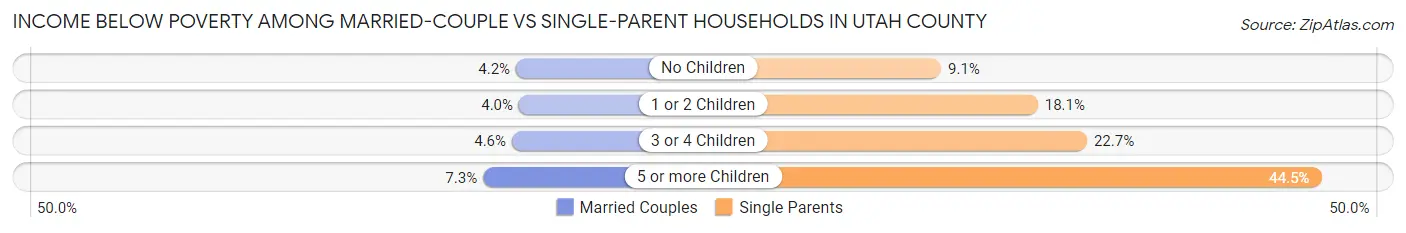
| Children | Married-Couple Families | Single-Parent Households |
| No Children | 2,347 (4.2%) | 821 (9.1%) |
| 1 or 2 Children | 1,701 (4.0%) | 1,639 (18.1%) |
| 3 or 4 Children | 1,217 (4.6%) | 647 (22.7%) |
| 5 or more Children | 422 (7.3%) | 105 (44.5%) |
| Total | 5,687 (4.4%) | 3,212 (15.1%) |
Employment Characteristics in Utah County
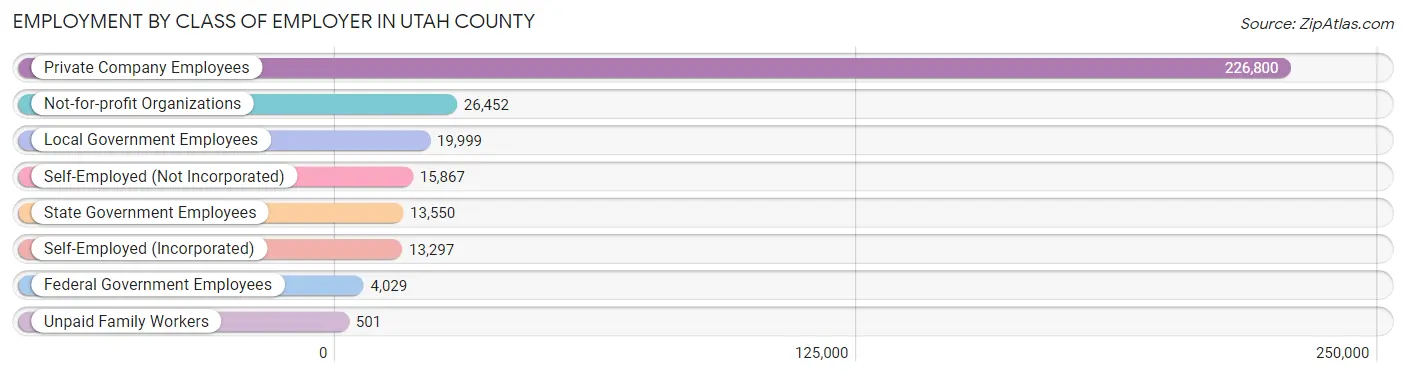
Employment by Class of Employer in Utah County
Among the 320,495 employed individuals in Utah County, private company employees (226,800 | 70.8%), not-for-profit organizations (26,452 | 8.3%), and local government employees (19,999 | 6.2%) make up the most common classes of employment.
| Employer Class | # Employees | % Employees |
| Private Company Employees | 226,800 | 70.8% |
| Self-Employed (Incorporated) | 13,297 | 4.2% |
| Self-Employed (Not Incorporated) | 15,867 | 5.0% |
| Not-for-profit Organizations | 26,452 | 8.3% |
| Local Government Employees | 19,999 | 6.2% |
| State Government Employees | 13,550 | 4.2% |
| Federal Government Employees | 4,029 | 1.3% |
| Unpaid Family Workers | 501 | 0.2% |
| Total | 320,495 | 100.0% |
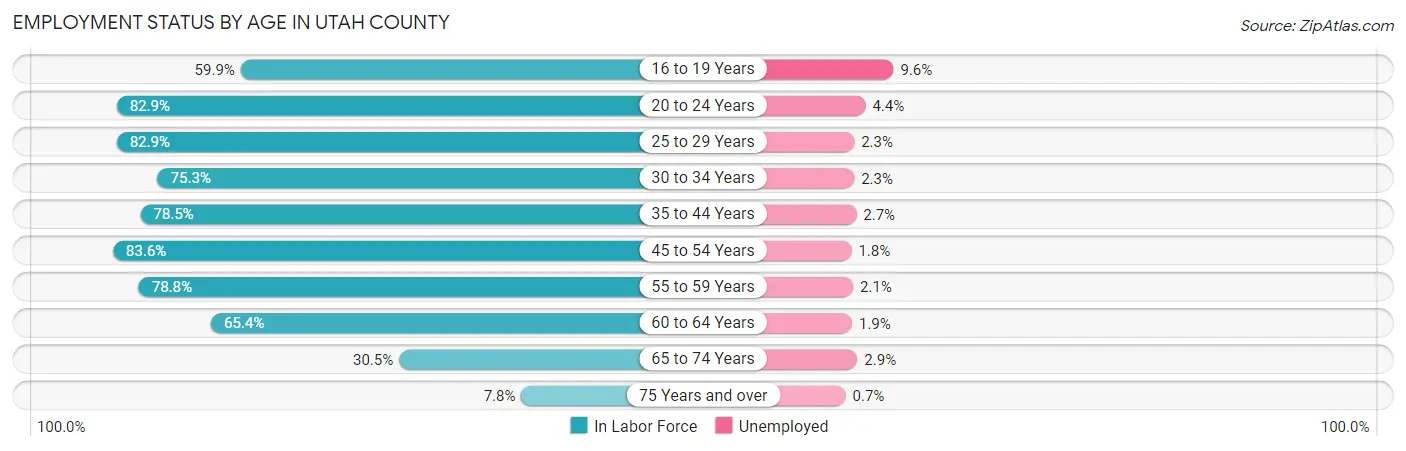
Employment Status by Age in Utah County
According to the labor force statistics for Utah County, out of the total population over 16 years of age (474,722), 71.3% or 338,477 individuals are in the labor force, with 3.4% or 11,508 of them unemployed. The age group with the highest labor force participation rate is 45 to 54 years, with 83.6% or 49,071 individuals in the labor force. Within the labor force, the 16 to 19 years age range has the highest percentage of unemployed individuals, with 9.6% or 3,065 of them being unemployed.
| Age Bracket | In Labor Force | Unemployed |
| 16 to 19 Years | 31,923 (59.9%) | 3,065 (9.6%) |
| 20 to 24 Years | 71,335 (82.9%) | 3,139 (4.4%) |
| 25 to 29 Years | 46,061 (82.9%) | 1,059 (2.3%) |
| 30 to 34 Years | 31,391 (75.3%) | 722 (2.3%) |
| 35 to 44 Years | 65,620 (78.5%) | 1,772 (2.7%) |
| 45 to 54 Years | 49,071 (83.6%) | 883 (1.8%) |
| 55 to 59 Years | 18,546 (78.8%) | 389 (2.1%) |
| 60 to 64 Years | 13,597 (65.4%) | 258 (1.9%) |
| 65 to 74 Years | 9,452 (30.5%) | 274 (2.9%) |
| 75 Years and over | 1,601 (7.8%) | 11 (0.7%) |
| Total | 338,477 (71.3%) | 11,508 (3.4%) |
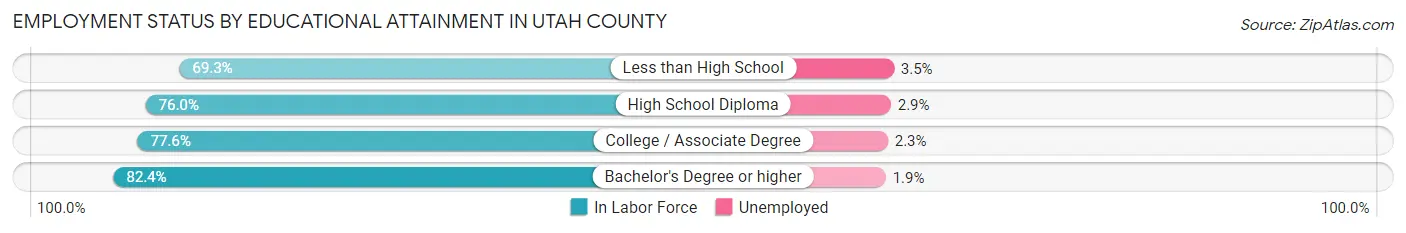
Employment Status by Educational Attainment in Utah County
According to labor force statistics for Utah County, 79.0% of individuals (224,253) out of the total population between 25 and 64 years of age (283,865) are in the labor force, with 2.3% or 5,158 of them being unemployed. The group with the highest labor force participation rate are those with the educational attainment of bachelor's degree or higher, with 82.4% or 101,123 individuals in the labor force. Within the labor force, individuals with less than high school education have the highest percentage of unemployment, with 3.5% or 316 of them being unemployed.
| Educational Attainment | In Labor Force | Unemployed |
| Less than High School | 9,037 (69.3%) | 456 (3.5%) |
| High School Diploma | 35,207 (76.0%) | 1,343 (2.9%) |
| College / Associate Degree | 78,980 (77.6%) | 2,341 (2.3%) |
| Bachelor's Degree or higher | 101,123 (82.4%) | 2,332 (1.9%) |
| Total | 224,253 (79.0%) | 6,529 (2.3%) |
Employment Occupations by Sex in Utah County
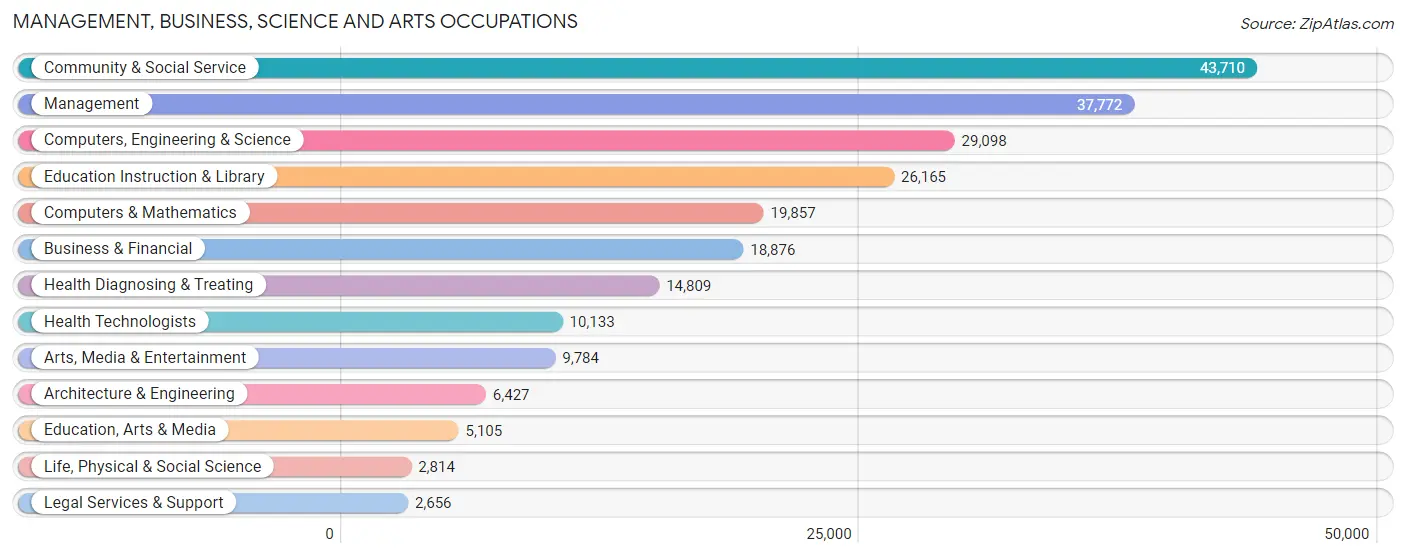
Management, Business, Science and Arts Occupations
The most common Management, Business, Science and Arts occupations in Utah County are Community & Social Service (43,710 | 13.4%), Management (37,772 | 11.6%), Computers, Engineering & Science (29,098 | 8.9%), Education Instruction & Library (26,165 | 8.0%), and Computers & Mathematics (19,857 | 6.1%).
Management, Business, Science and Arts Occupations by Sex
Within the Management, Business, Science and Arts occupations in Utah County, the most male-oriented occupations are Computers & Mathematics (87.6%), Architecture & Engineering (86.2%), and Computers, Engineering & Science (85.0%), while the most female-oriented occupations are Education Instruction & Library (68.0%), Health Diagnosing & Treating (64.1%), and Education, Arts & Media (63.3%).
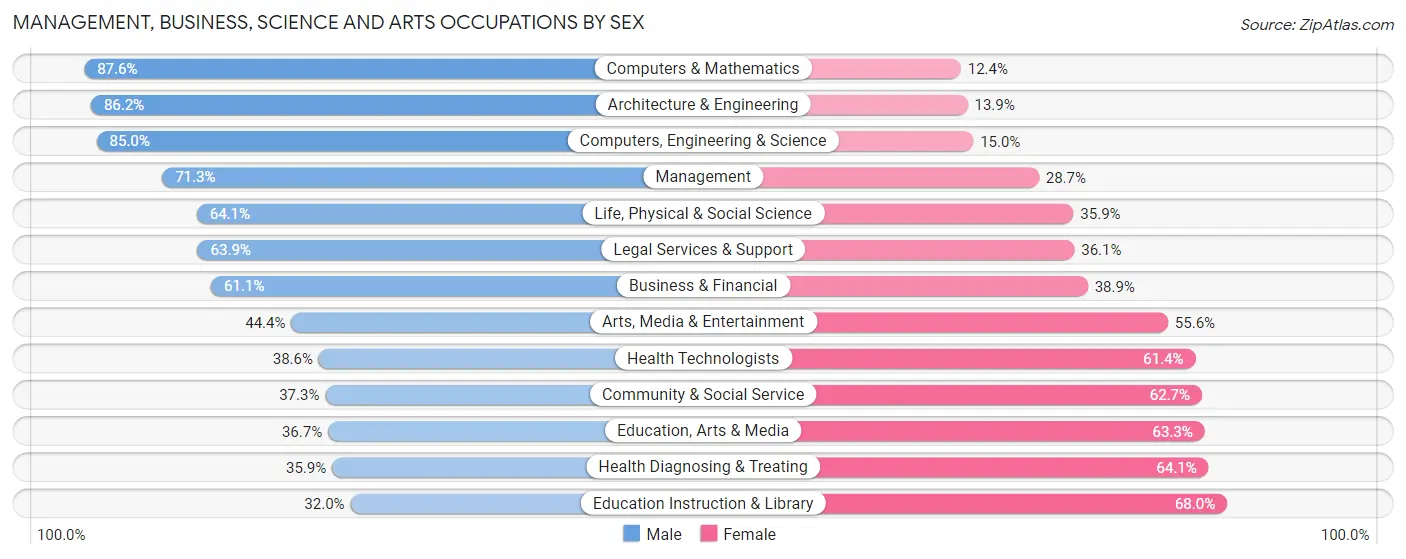
| Occupation | Male | Female |
| Management | 26,926 (71.3%) | 10,846 (28.7%) |
| Business & Financial | 11,531 (61.1%) | 7,345 (38.9%) |
| Computers, Engineering & Science | 24,726 (85.0%) | 4,372 (15.0%) |
| Computers & Mathematics | 17,386 (87.6%) | 2,471 (12.4%) |
| Architecture & Engineering | 5,537 (86.2%) | 890 (13.9%) |
| Life, Physical & Social Science | 1,803 (64.1%) | 1,011 (35.9%) |
| Community & Social Service | 16,294 (37.3%) | 27,416 (62.7%) |
| Education, Arts & Media | 1,874 (36.7%) | 3,231 (63.3%) |
| Legal Services & Support | 1,697 (63.9%) | 959 (36.1%) |
| Education Instruction & Library | 8,383 (32.0%) | 17,782 (68.0%) |
| Arts, Media & Entertainment | 4,340 (44.4%) | 5,444 (55.6%) |
| Health Diagnosing & Treating | 5,310 (35.9%) | 9,499 (64.1%) |
| Health Technologists | 3,914 (38.6%) | 6,219 (61.4%) |
| Total (Category) | 84,787 (58.8%) | 59,478 (41.2%) |
| Total (Overall) | 186,921 (57.3%) | 139,323 (42.7%) |
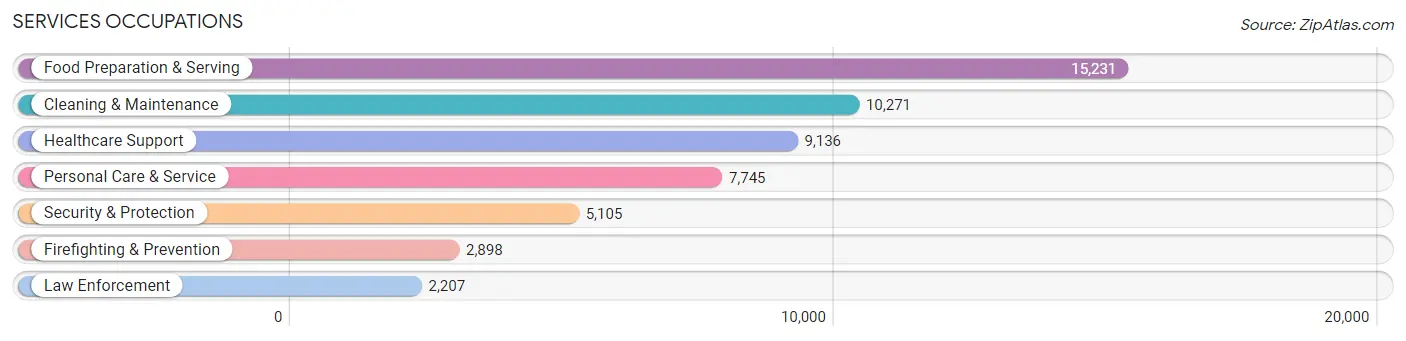
Services Occupations
The most common Services occupations in Utah County are Food Preparation & Serving (15,231 | 4.7%), Cleaning & Maintenance (10,271 | 3.2%), Healthcare Support (9,136 | 2.8%), Personal Care & Service (7,745 | 2.4%), and Security & Protection (5,105 | 1.6%).
Services Occupations by Sex
Within the Services occupations in Utah County, the most male-oriented occupations are Law Enforcement (92.0%), Security & Protection (77.6%), and Firefighting & Prevention (66.7%), while the most female-oriented occupations are Personal Care & Service (79.7%), Healthcare Support (79.1%), and Food Preparation & Serving (54.1%).
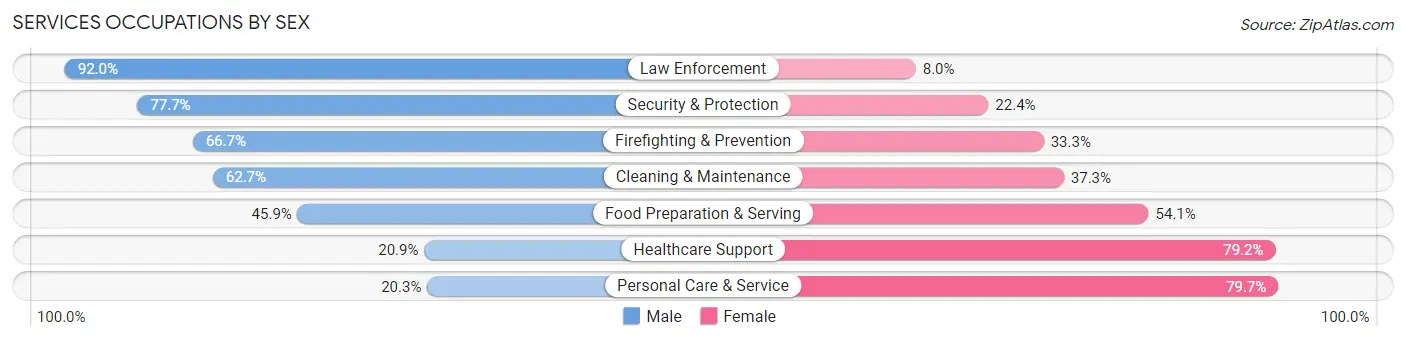
| Occupation | Male | Female |
| Healthcare Support | 1,905 (20.8%) | 7,231 (79.1%) |
| Security & Protection | 3,964 (77.6%) | 1,141 (22.4%) |
| Firefighting & Prevention | 1,933 (66.7%) | 965 (33.3%) |
| Law Enforcement | 2,031 (92.0%) | 176 (8.0%) |
| Food Preparation & Serving | 6,996 (45.9%) | 8,235 (54.1%) |
| Cleaning & Maintenance | 6,441 (62.7%) | 3,830 (37.3%) |
| Personal Care & Service | 1,570 (20.3%) | 6,175 (79.7%) |
| Total (Category) | 20,876 (44.0%) | 26,612 (56.0%) |
| Total (Overall) | 186,921 (57.3%) | 139,323 (42.7%) |
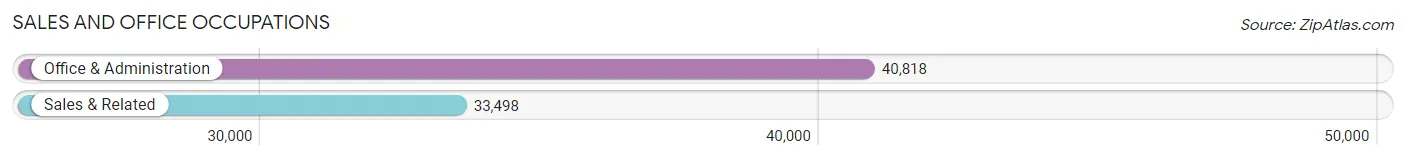
Sales and Office Occupations
The most common Sales and Office occupations in Utah County are Office & Administration (40,818 | 12.5%), and Sales & Related (33,498 | 10.3%).
Sales and Office Occupations by Sex
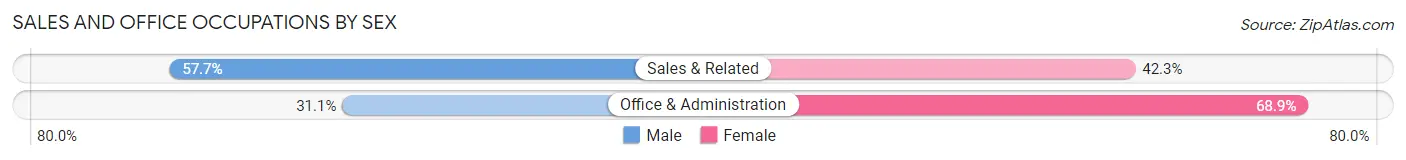
| Occupation | Male | Female |
| Sales & Related | 19,340 (57.7%) | 14,158 (42.3%) |
| Office & Administration | 12,708 (31.1%) | 28,110 (68.9%) |
| Total (Category) | 32,048 (43.1%) | 42,268 (56.9%) |
| Total (Overall) | 186,921 (57.3%) | 139,323 (42.7%) |
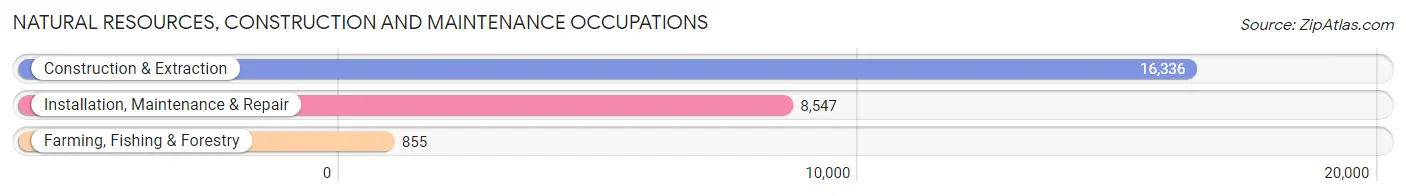
Natural Resources, Construction and Maintenance Occupations
The most common Natural Resources, Construction and Maintenance occupations in Utah County are Construction & Extraction (16,336 | 5.0%), Installation, Maintenance & Repair (8,547 | 2.6%), and Farming, Fishing & Forestry (855 | 0.3%).
Natural Resources, Construction and Maintenance Occupations by Sex
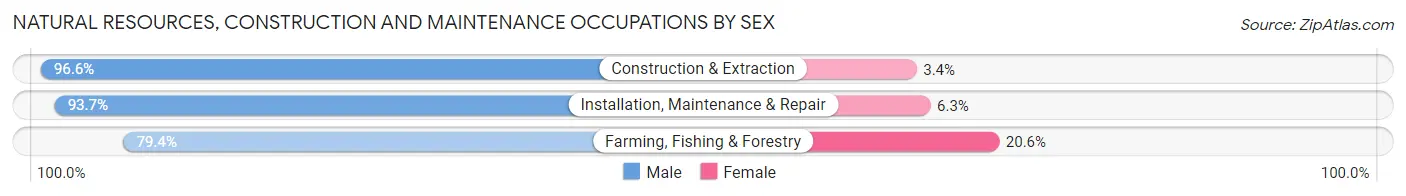
| Occupation | Male | Female |
| Farming, Fishing & Forestry | 679 (79.4%) | 176 (20.6%) |
| Construction & Extraction | 15,781 (96.6%) | 555 (3.4%) |
| Installation, Maintenance & Repair | 8,010 (93.7%) | 537 (6.3%) |
| Total (Category) | 24,470 (95.1%) | 1,268 (4.9%) |
| Total (Overall) | 186,921 (57.3%) | 139,323 (42.7%) |
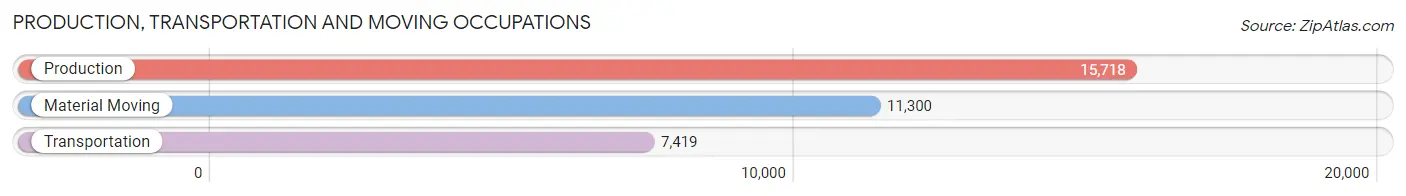
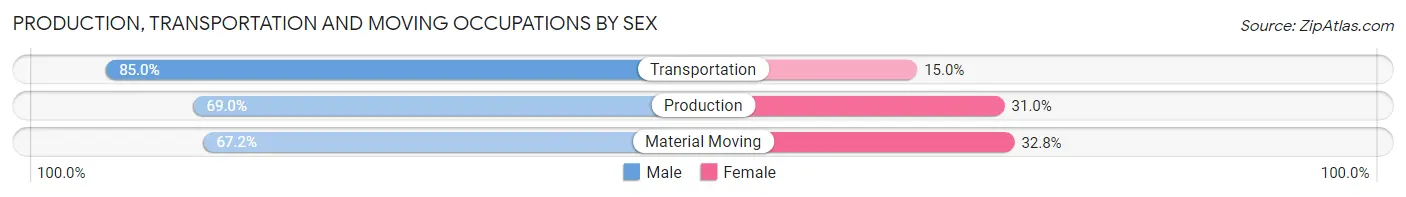
Production, Transportation and Moving Occupations
The most common Production, Transportation and Moving occupations in Utah County are Production (15,718 | 4.8%), Material Moving (11,300 | 3.5%), and Transportation (7,419 | 2.3%).
Production, Transportation and Moving Occupations by Sex
| Occupation | Male | Female |
| Production | 10,842 (69.0%) | 4,876 (31.0%) |
| Transportation | 6,308 (85.0%) | 1,111 (15.0%) |
| Material Moving | 7,590 (67.2%) | 3,710 (32.8%) |
| Total (Category) | 24,740 (71.8%) | 9,697 (28.2%) |
| Total (Overall) | 186,921 (57.3%) | 139,323 (42.7%) |
Employment Industries by Sex in Utah County
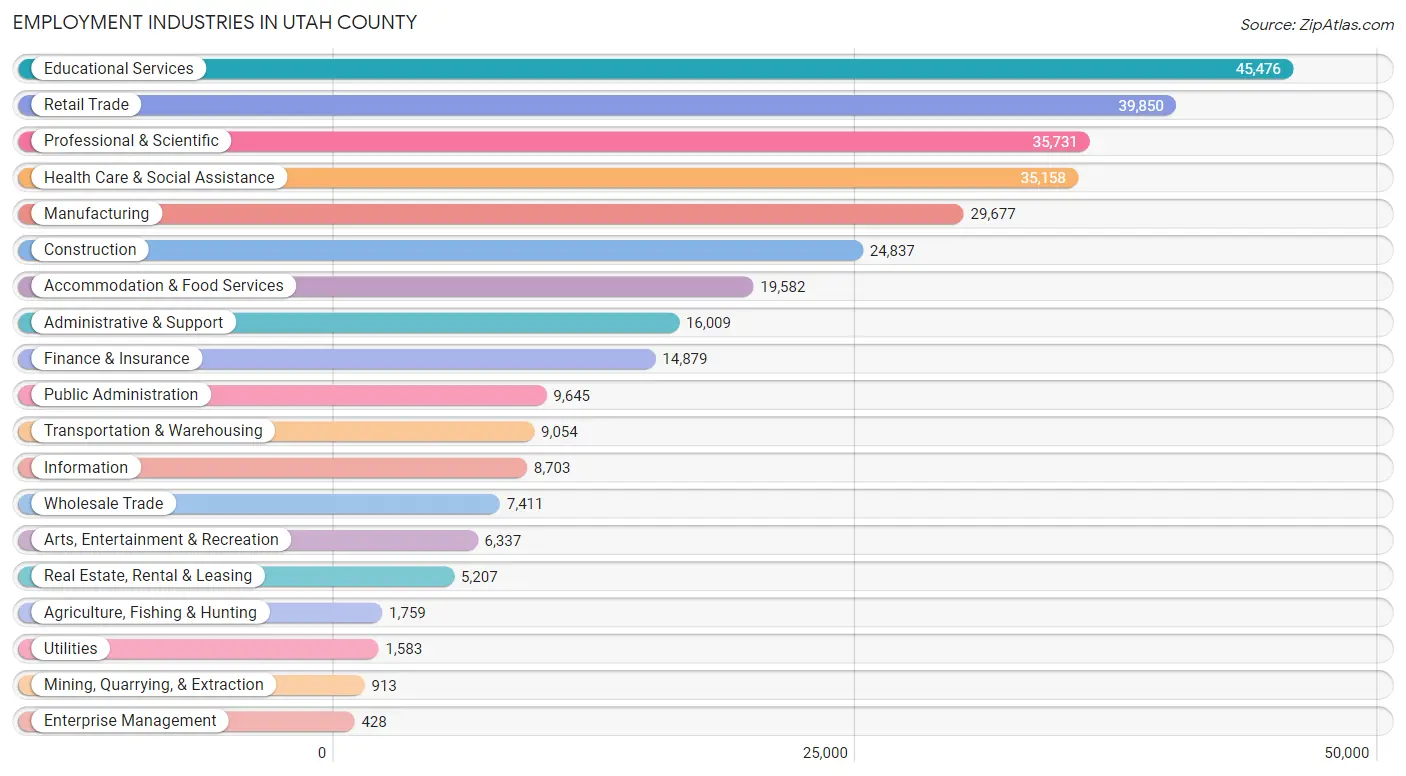
Employment Industries in Utah County
The major employment industries in Utah County include Educational Services (45,476 | 13.9%), Retail Trade (39,850 | 12.2%), Professional & Scientific (35,731 | 11.0%), Health Care & Social Assistance (35,158 | 10.8%), and Manufacturing (29,677 | 9.1%).
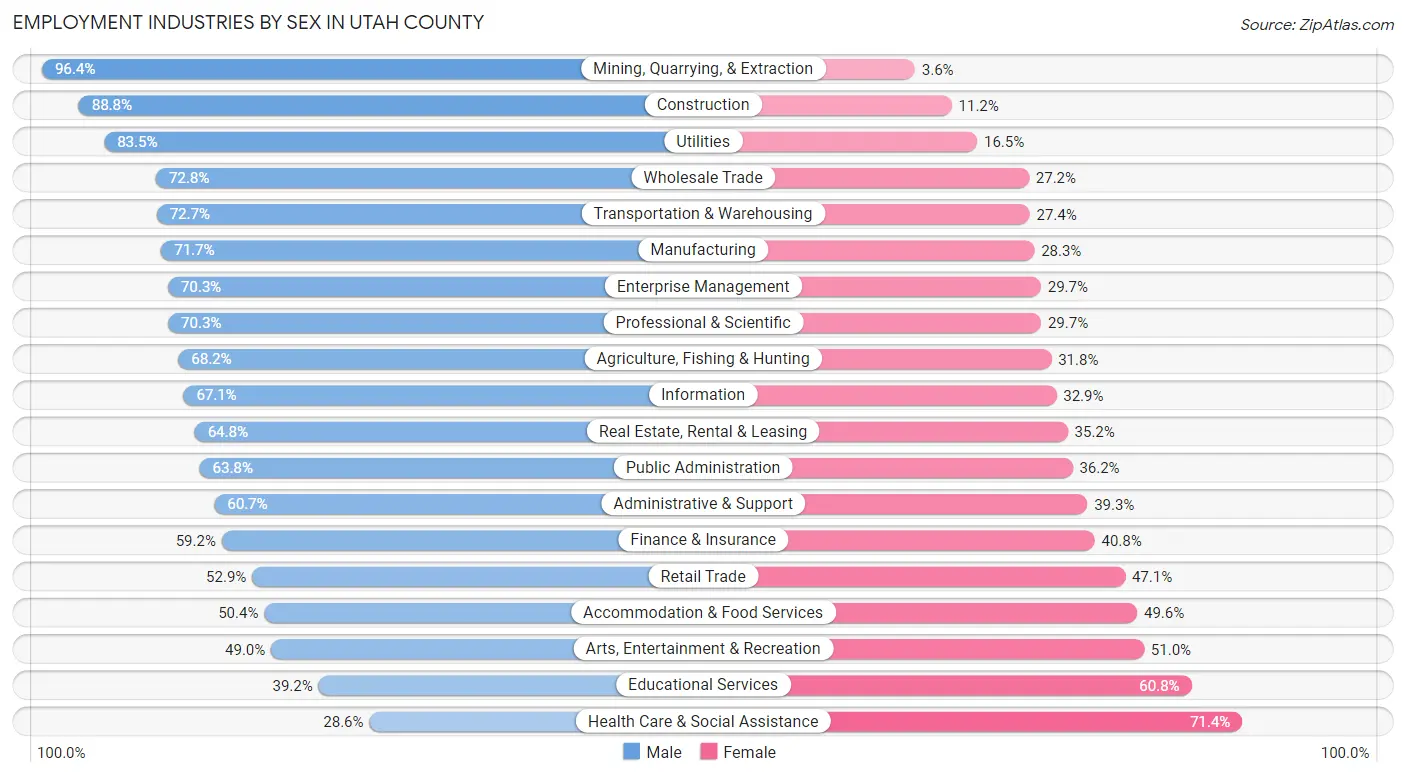
Employment Industries by Sex in Utah County
The Utah County industries that see more men than women are Mining, Quarrying, & Extraction (96.4%), Construction (88.8%), and Utilities (83.5%), whereas the industries that tend to have a higher number of women are Health Care & Social Assistance (71.4%), Educational Services (60.8%), and Arts, Entertainment & Recreation (51.0%).
| Industry | Male | Female |
| Agriculture, Fishing & Hunting | 1,199 (68.2%) | 560 (31.8%) |
| Mining, Quarrying, & Extraction | 880 (96.4%) | 33 (3.6%) |
| Construction | 22,051 (88.8%) | 2,786 (11.2%) |
| Manufacturing | 21,276 (71.7%) | 8,401 (28.3%) |
| Wholesale Trade | 5,395 (72.8%) | 2,016 (27.2%) |
| Retail Trade | 21,082 (52.9%) | 18,768 (47.1%) |
| Transportation & Warehousing | 6,578 (72.7%) | 2,476 (27.4%) |
| Utilities | 1,322 (83.5%) | 261 (16.5%) |
| Information | 5,841 (67.1%) | 2,862 (32.9%) |
| Finance & Insurance | 8,809 (59.2%) | 6,070 (40.8%) |
| Real Estate, Rental & Leasing | 3,373 (64.8%) | 1,834 (35.2%) |
| Professional & Scientific | 25,110 (70.3%) | 10,621 (29.7%) |
| Enterprise Management | 301 (70.3%) | 127 (29.7%) |
| Administrative & Support | 9,721 (60.7%) | 6,288 (39.3%) |
| Educational Services | 17,807 (39.2%) | 27,669 (60.8%) |
| Health Care & Social Assistance | 10,071 (28.6%) | 25,087 (71.4%) |
| Arts, Entertainment & Recreation | 3,104 (49.0%) | 3,233 (51.0%) |
| Accommodation & Food Services | 9,870 (50.4%) | 9,712 (49.6%) |
| Public Administration | 6,151 (63.8%) | 3,494 (36.2%) |
| Total | 186,921 (57.3%) | 139,323 (42.7%) |
Education in Utah County
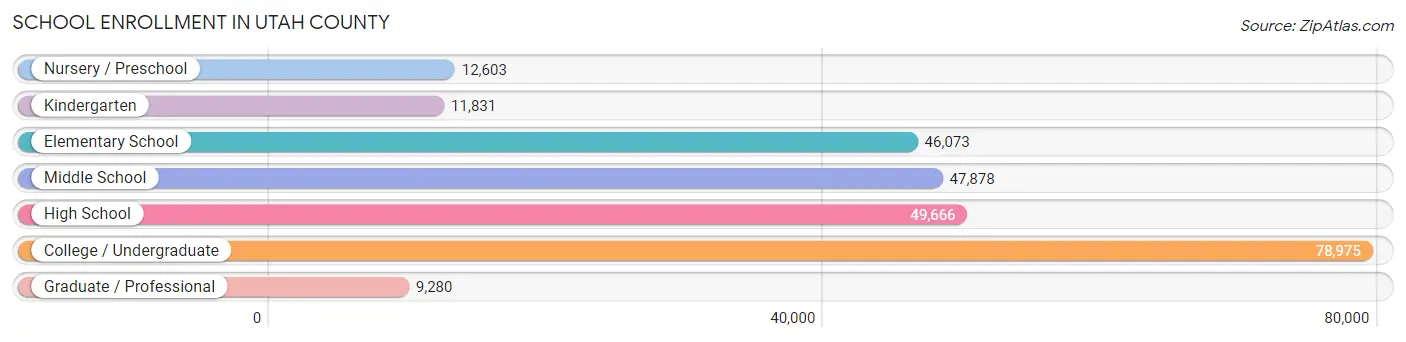
School Enrollment in Utah County
The most common levels of schooling among the 256,306 students in Utah County are college / undergraduate (78,975 | 30.8%), high school (49,666 | 19.4%), and middle school (47,878 | 18.7%).
| School Level | # Students | % Students |
| Nursery / Preschool | 12,603 | 4.9% |
| Kindergarten | 11,831 | 4.6% |
| Elementary School | 46,073 | 18.0% |
| Middle School | 47,878 | 18.7% |
| High School | 49,666 | 19.4% |
| College / Undergraduate | 78,975 | 30.8% |
| Graduate / Professional | 9,280 | 3.6% |
| Total | 256,306 | 100.0% |
School Enrollment by Age by Funding Source in Utah County
Out of a total of 256,306 students who are enrolled in schools in Utah County, 61,513 (24.0%) attend a private institution, while the remaining 194,793 (76.0%) are enrolled in public schools. The age group of 20 to 24 year olds has the highest likelihood of being enrolled in private schools, with 27,746 (56.8% in the age bracket) enrolled. Conversely, the age group of 15 to 17 year olds has the lowest likelihood of being enrolled in a private school, with 32,918 (94.0% in the age bracket) attending a public institution.
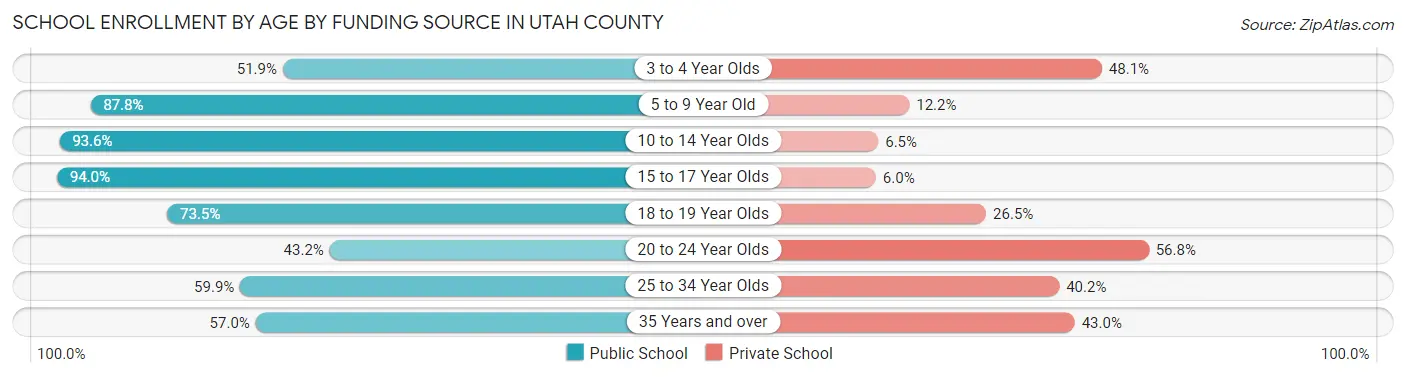
| Age Bracket | Public School | Private School |
| 3 to 4 Year Olds | 4,529 (51.9%) | 4,198 (48.1%) |
| 5 to 9 Year Old | 49,688 (87.8%) | 6,920 (12.2%) |
| 10 to 14 Year Olds | 55,447 (93.5%) | 3,824 (6.5%) |
| 15 to 17 Year Olds | 32,918 (94.0%) | 2,102 (6.0%) |
| 18 to 19 Year Olds | 14,978 (73.5%) | 5,411 (26.5%) |
| 20 to 24 Year Olds | 21,089 (43.2%) | 27,746 (56.8%) |
| 25 to 34 Year Olds | 11,006 (59.9%) | 7,383 (40.2%) |
| 35 Years and over | 5,165 (57.0%) | 3,902 (43.0%) |
| Total | 194,793 (76.0%) | 61,513 (24.0%) |
Educational Attainment by Field of Study in Utah County
Business (26,490 | 17.2%), education (21,837 | 14.2%), science & technology (15,362 | 10.0%), arts & humanities (14,048 | 9.1%), and computers & mathematics (10,440 | 6.8%) are the most common fields of study among 153,680 individuals in Utah County who have obtained a bachelor's degree or higher.
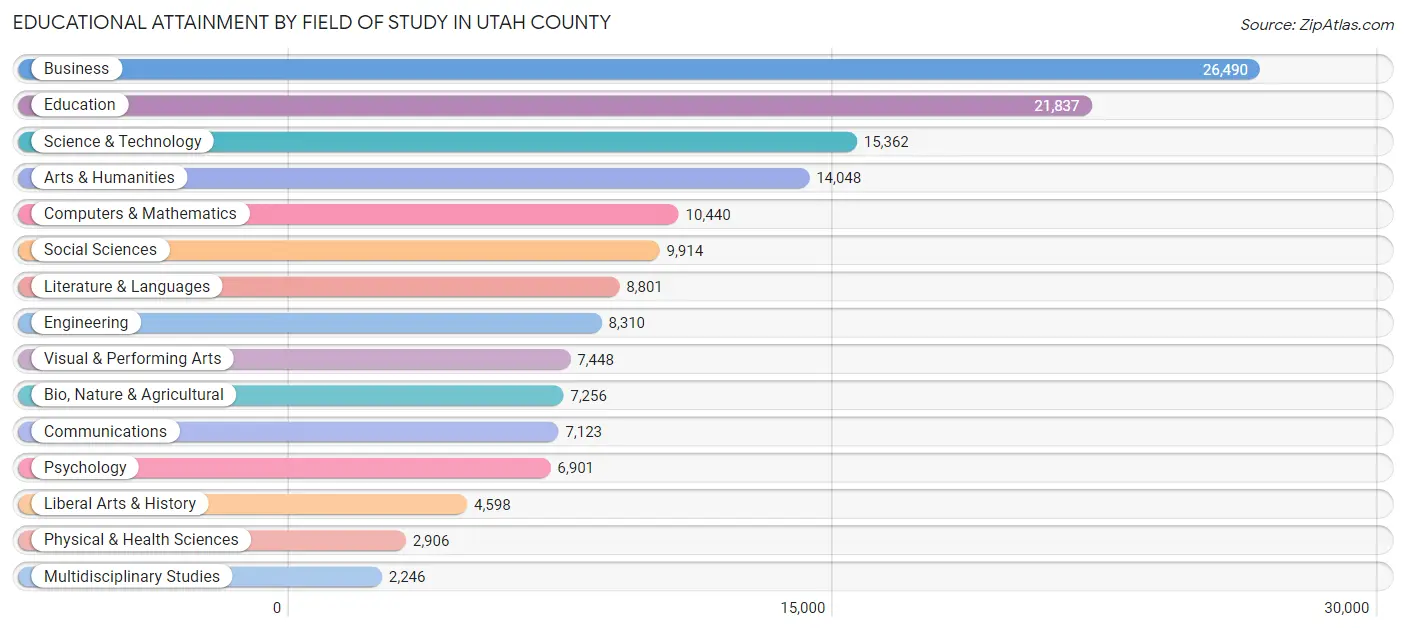
| Field of Study | # Graduates | % Graduates |
| Computers & Mathematics | 10,440 | 6.8% |
| Bio, Nature & Agricultural | 7,256 | 4.7% |
| Physical & Health Sciences | 2,906 | 1.9% |
| Psychology | 6,901 | 4.5% |
| Social Sciences | 9,914 | 6.5% |
| Engineering | 8,310 | 5.4% |
| Multidisciplinary Studies | 2,246 | 1.5% |
| Science & Technology | 15,362 | 10.0% |
| Business | 26,490 | 17.2% |
| Education | 21,837 | 14.2% |
| Literature & Languages | 8,801 | 5.7% |
| Liberal Arts & History | 4,598 | 3.0% |
| Visual & Performing Arts | 7,448 | 4.9% |
| Communications | 7,123 | 4.6% |
| Arts & Humanities | 14,048 | 9.1% |
| Total | 153,680 | 100.0% |
Transportation & Commute in Utah County
Vehicle Availability by Sex in Utah County
The most prevalent vehicle ownership categories in Utah County are males with 2 vehicles (67,719, accounting for 37.6%) and females with 2 vehicles (46,422, making up 51.6%).
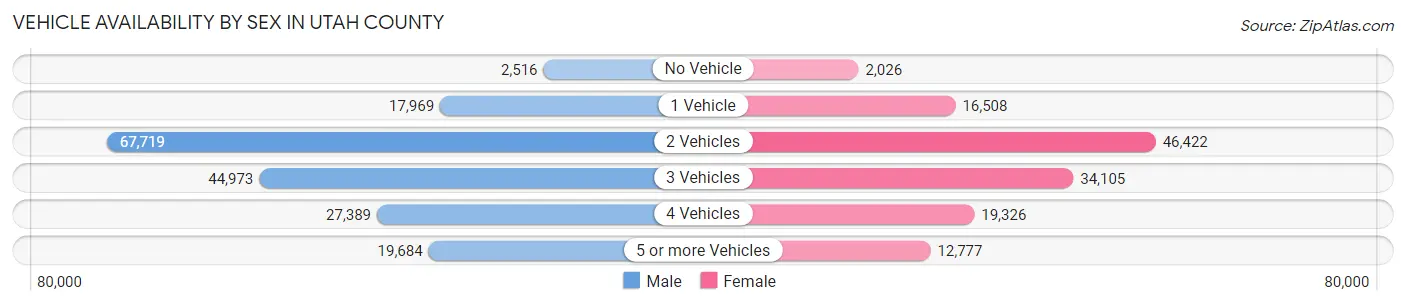
| Vehicles Available | Male | Female |
| No Vehicle | 2,516 (1.4%) | 2,026 (1.5%) |
| 1 Vehicle | 17,969 (10.0%) | 16,508 (12.6%) |
| 2 Vehicles | 67,719 (37.6%) | 46,422 (35.4%) |
| 3 Vehicles | 44,973 (24.9%) | 34,105 (26.0%) |
| 4 Vehicles | 27,389 (15.2%) | 19,326 (14.7%) |
| 5 or more Vehicles | 19,684 (10.9%) | 12,777 (9.7%) |
| Total | 180,250 (100.0%) | 131,164 (100.0%) |
Commute Time in Utah County
The most frequently occuring commute durations in Utah County are 10 to 14 minutes (48,344 commuters, 17.8%), 15 to 19 minutes (48,200 commuters, 17.7%), and 20 to 24 minutes (38,143 commuters, 14.0%).
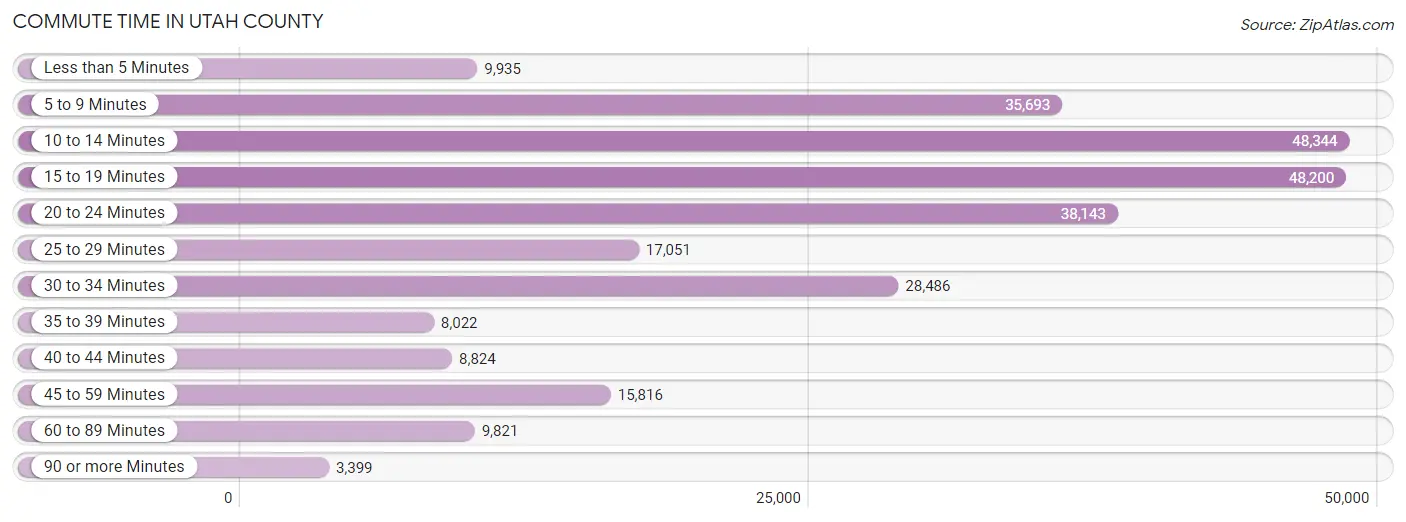
| Commute Time | # Commuters | % Commuters |
| Less than 5 Minutes | 9,935 | 3.7% |
| 5 to 9 Minutes | 35,693 | 13.1% |
| 10 to 14 Minutes | 48,344 | 17.8% |
| 15 to 19 Minutes | 48,200 | 17.7% |
| 20 to 24 Minutes | 38,143 | 14.0% |
| 25 to 29 Minutes | 17,051 | 6.3% |
| 30 to 34 Minutes | 28,486 | 10.5% |
| 35 to 39 Minutes | 8,022 | 2.9% |
| 40 to 44 Minutes | 8,824 | 3.3% |
| 45 to 59 Minutes | 15,816 | 5.8% |
| 60 to 89 Minutes | 9,821 | 3.6% |
| 90 or more Minutes | 3,399 | 1.3% |
Commute Time by Sex in Utah County
The most common commute times in Utah County are 15 to 19 minutes (27,398 commuters, 17.4%) for males and 10 to 14 minutes (22,404 commuters, 19.6%) for females.
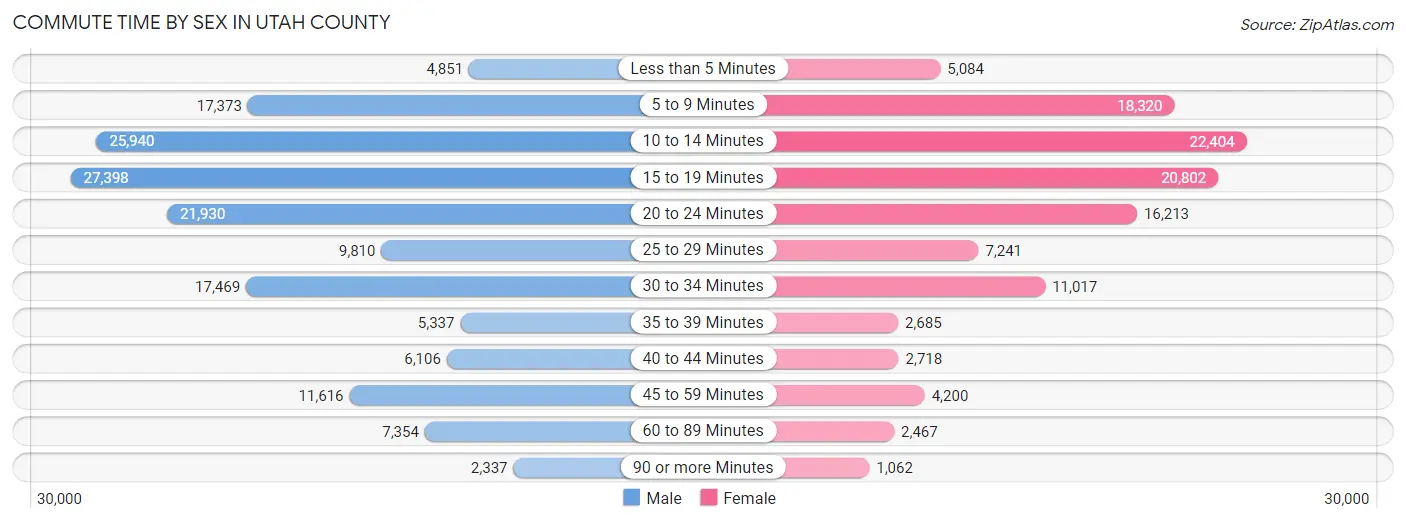
| Commute Time | Male | Female |
| Less than 5 Minutes | 4,851 (3.1%) | 5,084 (4.4%) |
| 5 to 9 Minutes | 17,373 (11.0%) | 18,320 (16.0%) |
| 10 to 14 Minutes | 25,940 (16.5%) | 22,404 (19.6%) |
| 15 to 19 Minutes | 27,398 (17.4%) | 20,802 (18.2%) |
| 20 to 24 Minutes | 21,930 (13.9%) | 16,213 (14.2%) |
| 25 to 29 Minutes | 9,810 (6.2%) | 7,241 (6.3%) |
| 30 to 34 Minutes | 17,469 (11.1%) | 11,017 (9.7%) |
| 35 to 39 Minutes | 5,337 (3.4%) | 2,685 (2.4%) |
| 40 to 44 Minutes | 6,106 (3.9%) | 2,718 (2.4%) |
| 45 to 59 Minutes | 11,616 (7.4%) | 4,200 (3.7%) |
| 60 to 89 Minutes | 7,354 (4.7%) | 2,467 (2.2%) |
| 90 or more Minutes | 2,337 (1.5%) | 1,062 (0.9%) |
Time of Departure to Work by Sex in Utah County
The most frequent times of departure to work in Utah County are 7:30 AM to 7:59 AM (20,765, 13.2%) for males and 7:30 AM to 7:59 AM (15,973, 14.0%) for females.
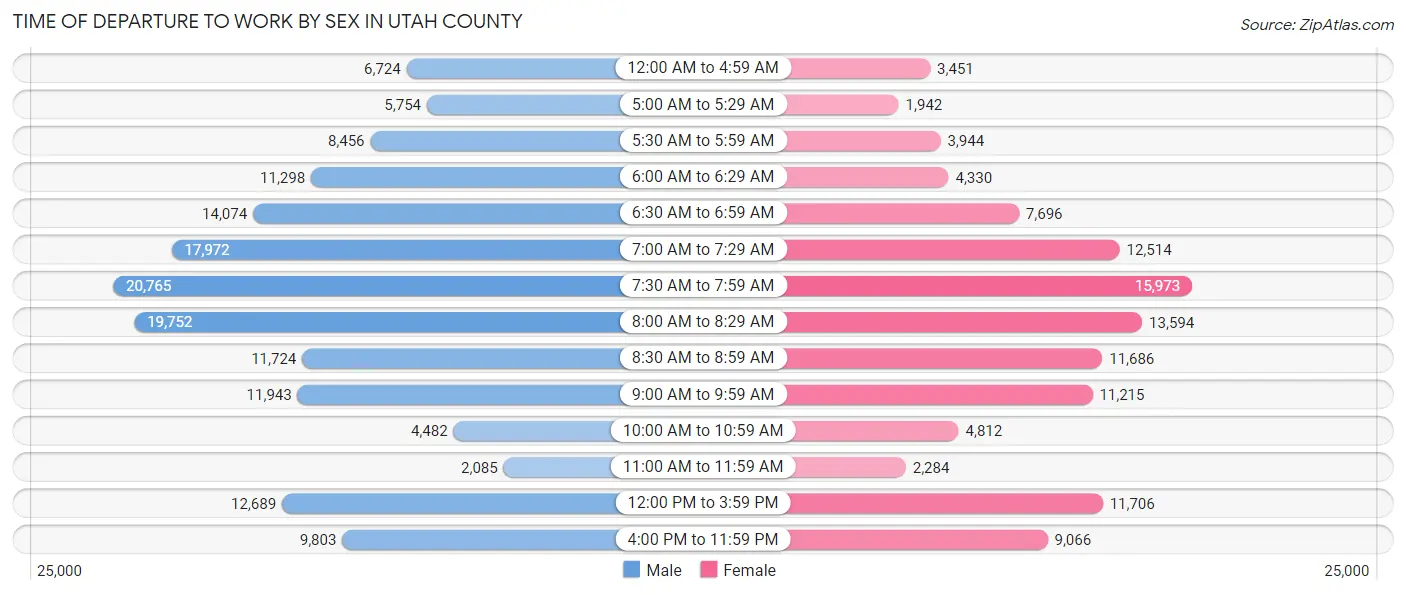
| Time of Departure | Male | Female |
| 12:00 AM to 4:59 AM | 6,724 (4.3%) | 3,451 (3.0%) |
| 5:00 AM to 5:29 AM | 5,754 (3.6%) | 1,942 (1.7%) |
| 5:30 AM to 5:59 AM | 8,456 (5.4%) | 3,944 (3.5%) |
| 6:00 AM to 6:29 AM | 11,298 (7.2%) | 4,330 (3.8%) |
| 6:30 AM to 6:59 AM | 14,074 (8.9%) | 7,696 (6.7%) |
| 7:00 AM to 7:29 AM | 17,972 (11.4%) | 12,514 (11.0%) |
| 7:30 AM to 7:59 AM | 20,765 (13.2%) | 15,973 (14.0%) |
| 8:00 AM to 8:29 AM | 19,752 (12.5%) | 13,594 (11.9%) |
| 8:30 AM to 8:59 AM | 11,724 (7.4%) | 11,686 (10.2%) |
| 9:00 AM to 9:59 AM | 11,943 (7.6%) | 11,215 (9.8%) |
| 10:00 AM to 10:59 AM | 4,482 (2.9%) | 4,812 (4.2%) |
| 11:00 AM to 11:59 AM | 2,085 (1.3%) | 2,284 (2.0%) |
| 12:00 PM to 3:59 PM | 12,689 (8.1%) | 11,706 (10.2%) |
| 4:00 PM to 11:59 PM | 9,803 (6.2%) | 9,066 (7.9%) |
| Total | 157,521 (100.0%) | 114,213 (100.0%) |
Housing Occupancy in Utah County
Occupancy by Ownership in Utah County
Of the total 187,171 dwellings in Utah County, owner-occupied units account for 128,368 (68.6%), while renter-occupied units make up 58,803 (31.4%).
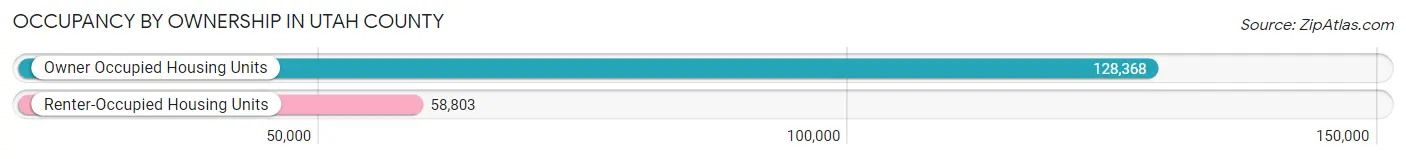
| Occupancy | # Housing Units | % Housing Units |
| Owner Occupied Housing Units | 128,368 | 68.6% |
| Renter-Occupied Housing Units | 58,803 | 31.4% |
| Total Occupied Housing Units | 187,171 | 100.0% |
Occupancy by Household Size in Utah County
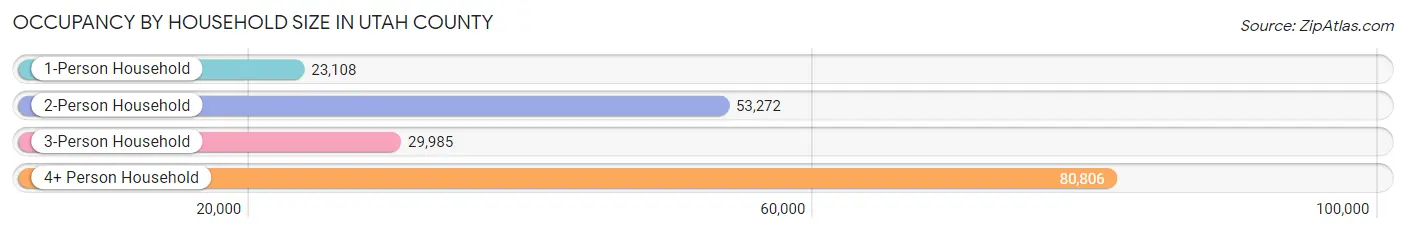
| Household Size | # Housing Units | % Housing Units |
| 1-Person Household | 23,108 | 12.3% |
| 2-Person Household | 53,272 | 28.5% |
| 3-Person Household | 29,985 | 16.0% |
| 4+ Person Household | 80,806 | 43.2% |
| Total Housing Units | 187,171 | 100.0% |
Occupancy by Ownership by Household Size in Utah County
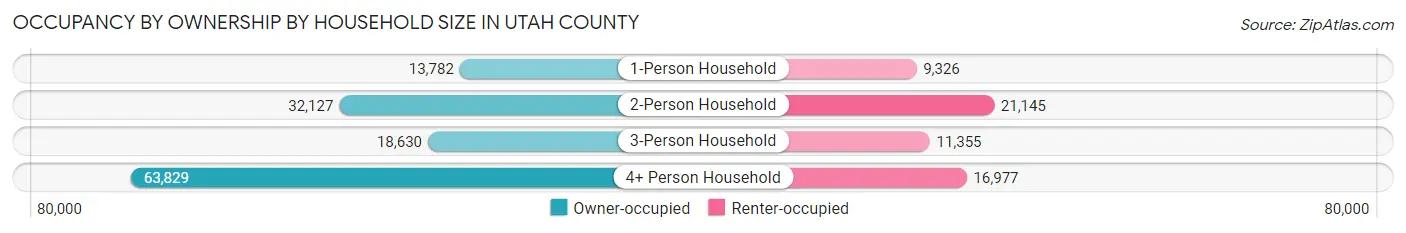
| Household Size | Owner-occupied | Renter-occupied |
| 1-Person Household | 13,782 (59.6%) | 9,326 (40.4%) |
| 2-Person Household | 32,127 (60.3%) | 21,145 (39.7%) |
| 3-Person Household | 18,630 (62.1%) | 11,355 (37.9%) |
| 4+ Person Household | 63,829 (79.0%) | 16,977 (21.0%) |
| Total Housing Units | 128,368 (68.6%) | 58,803 (31.4%) |
Occupancy by Educational Attainment in Utah County
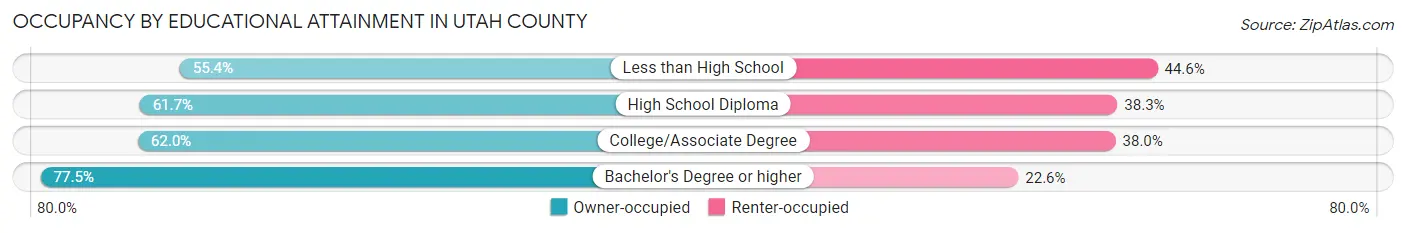
| Household Size | Owner-occupied | Renter-occupied |
| Less than High School | 3,540 (55.4%) | 2,853 (44.6%) |
| High School Diploma | 16,263 (61.7%) | 10,076 (38.3%) |
| College/Associate Degree | 44,405 (62.0%) | 27,195 (38.0%) |
| Bachelor's Degree or higher | 64,160 (77.4%) | 18,679 (22.6%) |
Occupancy by Age of Householder in Utah County
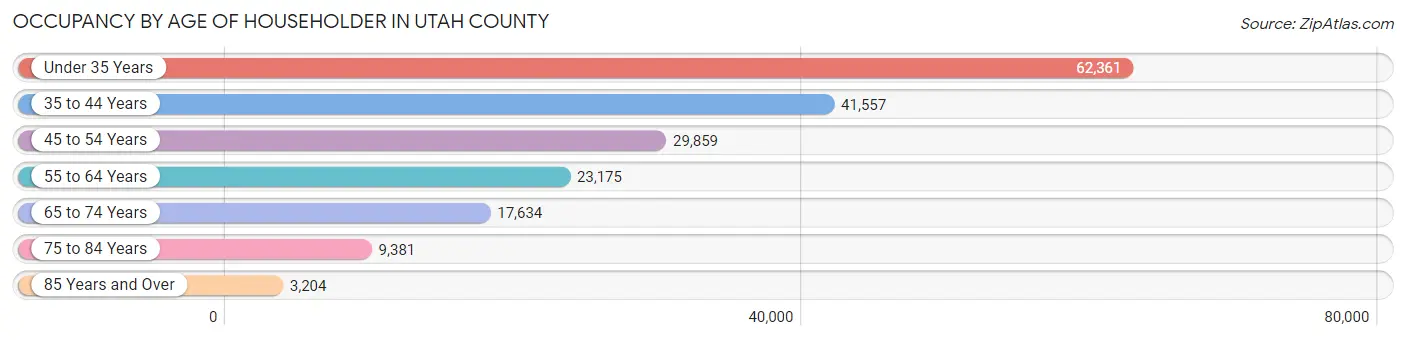
| Age Bracket | # Households | % Households |
| Under 35 Years | 62,361 | 33.3% |
| 35 to 44 Years | 41,557 | 22.2% |
| 45 to 54 Years | 29,859 | 16.0% |
| 55 to 64 Years | 23,175 | 12.4% |
| 65 to 74 Years | 17,634 | 9.4% |
| 75 to 84 Years | 9,381 | 5.0% |
| 85 Years and Over | 3,204 | 1.7% |
| Total | 187,171 | 100.0% |
Housing Finances in Utah County
Median Income by Occupancy in Utah County
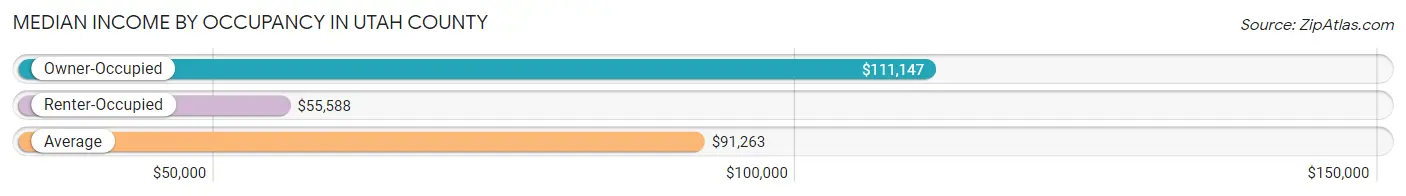
| Occupancy Type | # Households | Median Income |
| Owner-Occupied | 128,368 (68.6%) | $111,147 |
| Renter-Occupied | 58,803 (31.4%) | $55,588 |
| Average | 187,171 (100.0%) | $91,263 |
Occupancy by Householder Income Bracket in Utah County
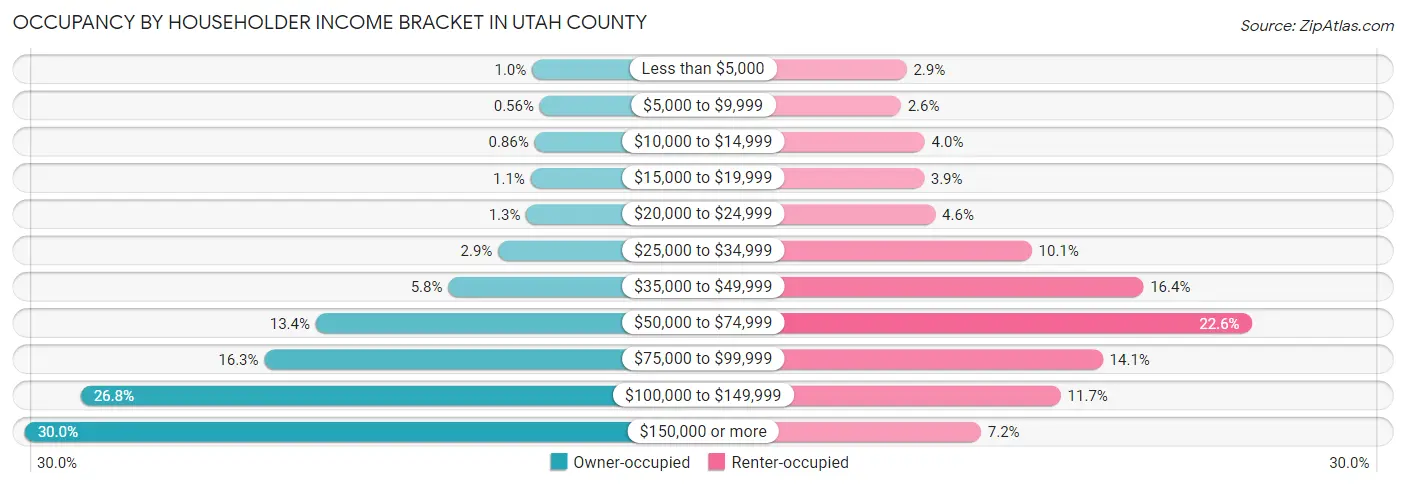
| Income Bracket | Owner-occupied | Renter-occupied |
| Less than $5,000 | 1,279 (1.0%) | 1,712 (2.9%) |
| $5,000 to $9,999 | 714 (0.6%) | 1,517 (2.6%) |
| $10,000 to $14,999 | 1,105 (0.9%) | 2,321 (4.0%) |
| $15,000 to $19,999 | 1,389 (1.1%) | 2,292 (3.9%) |
| $20,000 to $24,999 | 1,706 (1.3%) | 2,676 (4.5%) |
| $25,000 to $34,999 | 3,777 (2.9%) | 5,914 (10.1%) |
| $35,000 to $49,999 | 7,430 (5.8%) | 9,665 (16.4%) |
| $50,000 to $74,999 | 17,151 (13.4%) | 13,299 (22.6%) |
| $75,000 to $99,999 | 20,924 (16.3%) | 8,301 (14.1%) |
| $100,000 to $149,999 | 34,396 (26.8%) | 6,893 (11.7%) |
| $150,000 or more | 38,497 (30.0%) | 4,213 (7.2%) |
| Total | 128,368 (100.0%) | 58,803 (100.0%) |
Monthly Housing Cost Tiers in Utah County
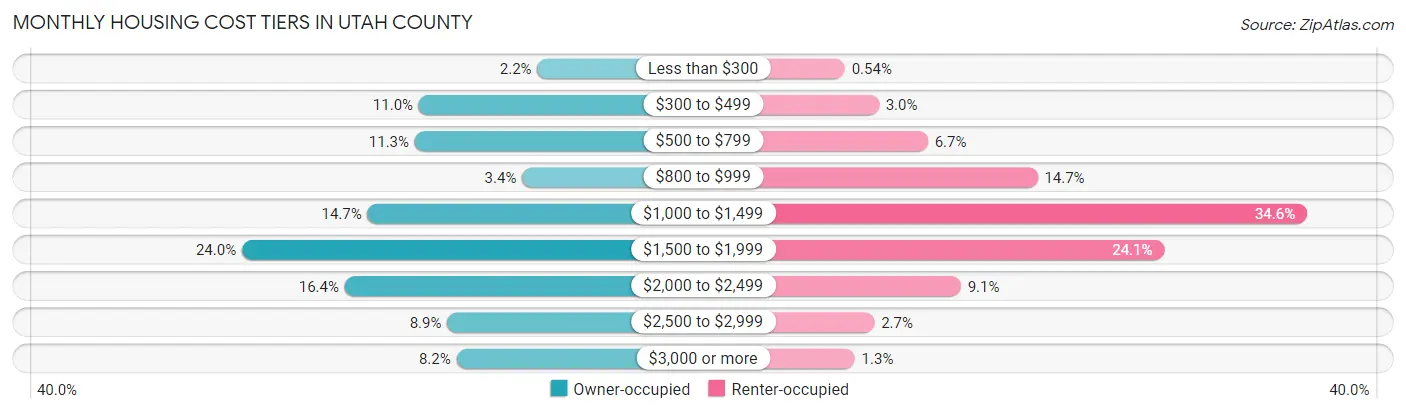
| Monthly Cost | Owner-occupied | Renter-occupied |
| Less than $300 | 2,860 (2.2%) | 316 (0.5%) |
| $300 to $499 | 14,066 (11.0%) | 1,787 (3.0%) |
| $500 to $799 | 14,450 (11.3%) | 3,913 (6.7%) |
| $800 to $999 | 4,294 (3.4%) | 8,664 (14.7%) |
| $1,000 to $1,499 | 18,925 (14.7%) | 20,336 (34.6%) |
| $1,500 to $1,999 | 30,795 (24.0%) | 14,154 (24.1%) |
| $2,000 to $2,499 | 21,078 (16.4%) | 5,342 (9.1%) |
| $2,500 to $2,999 | 11,390 (8.9%) | 1,593 (2.7%) |
| $3,000 or more | 10,510 (8.2%) | 747 (1.3%) |
| Total | 128,368 (100.0%) | 58,803 (100.0%) |
Physical Housing Characteristics in Utah County
Housing Structures in Utah County
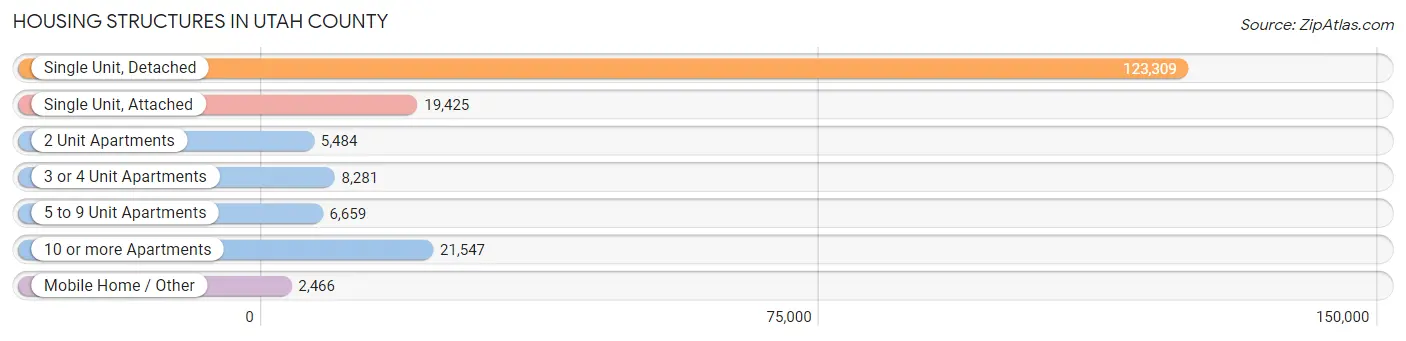
| Structure Type | # Housing Units | % Housing Units |
| Single Unit, Detached | 123,309 | 65.9% |
| Single Unit, Attached | 19,425 | 10.4% |
| 2 Unit Apartments | 5,484 | 2.9% |
| 3 or 4 Unit Apartments | 8,281 | 4.4% |
| 5 to 9 Unit Apartments | 6,659 | 3.6% |
| 10 or more Apartments | 21,547 | 11.5% |
| Mobile Home / Other | 2,466 | 1.3% |
| Total | 187,171 | 100.0% |
Housing Structures by Occupancy in Utah County
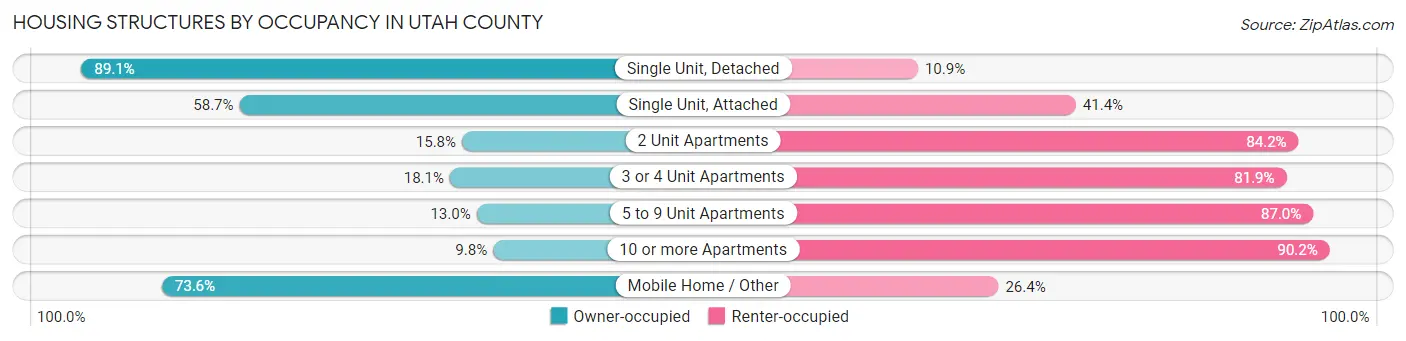
| Structure Type | Owner-occupied | Renter-occupied |
| Single Unit, Detached | 109,813 (89.1%) | 13,496 (10.9%) |
| Single Unit, Attached | 11,392 (58.7%) | 8,033 (41.3%) |
| 2 Unit Apartments | 867 (15.8%) | 4,617 (84.2%) |
| 3 or 4 Unit Apartments | 1,502 (18.1%) | 6,779 (81.9%) |
| 5 to 9 Unit Apartments | 865 (13.0%) | 5,794 (87.0%) |
| 10 or more Apartments | 2,115 (9.8%) | 19,432 (90.2%) |
| Mobile Home / Other | 1,814 (73.6%) | 652 (26.4%) |
| Total | 128,368 (68.6%) | 58,803 (31.4%) |
Housing Structures by Number of Rooms in Utah County
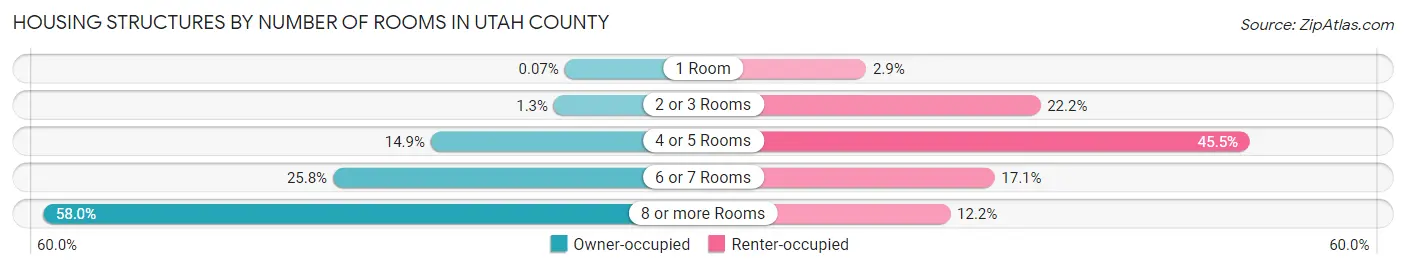
| Number of Rooms | Owner-occupied | Renter-occupied |
| 1 Room | 94 (0.1%) | 1,701 (2.9%) |
| 2 or 3 Rooms | 1,614 (1.3%) | 13,073 (22.2%) |
| 4 or 5 Rooms | 19,150 (14.9%) | 26,758 (45.5%) |
| 6 or 7 Rooms | 33,090 (25.8%) | 10,077 (17.1%) |
| 8 or more Rooms | 74,420 (58.0%) | 7,194 (12.2%) |
| Total | 128,368 (100.0%) | 58,803 (100.0%) |
Housing Structure by Heating Type in Utah County
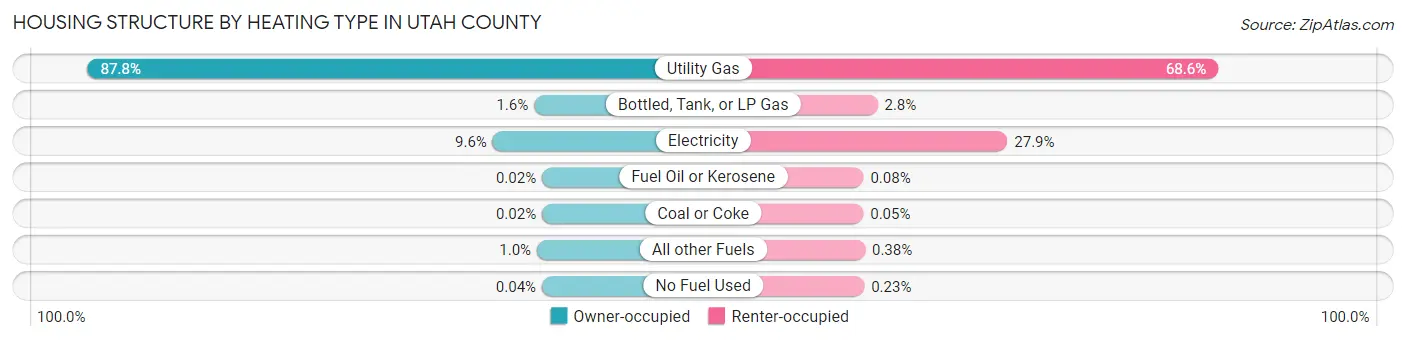
| Heating Type | Owner-occupied | Renter-occupied |
| Utility Gas | 112,749 (87.8%) | 40,327 (68.6%) |
| Bottled, Tank, or LP Gas | 1,984 (1.5%) | 1,647 (2.8%) |
| Electricity | 12,258 (9.6%) | 16,399 (27.9%) |
| Fuel Oil or Kerosene | 23 (0.0%) | 46 (0.1%) |
| Coal or Coke | 24 (0.0%) | 28 (0.1%) |
| All other Fuels | 1,282 (1.0%) | 223 (0.4%) |
| No Fuel Used | 48 (0.0%) | 133 (0.2%) |
| Total | 128,368 (100.0%) | 58,803 (100.0%) |
Household Vehicle Usage in Utah County
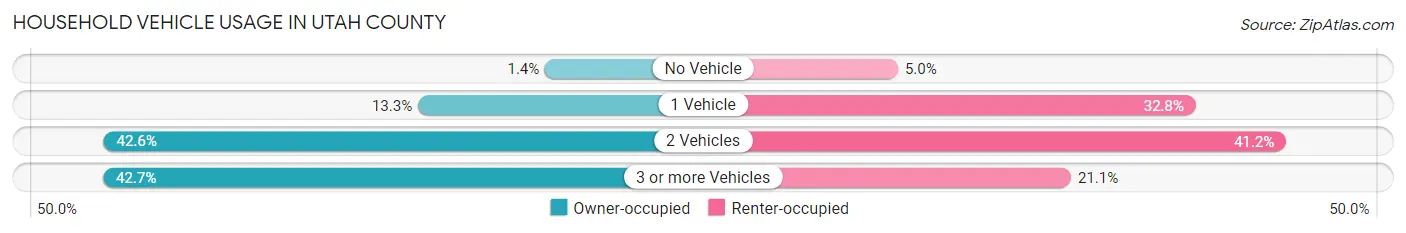
| Vehicles per Household | Owner-occupied | Renter-occupied |
| No Vehicle | 1,812 (1.4%) | 2,908 (5.0%) |
| 1 Vehicle | 17,051 (13.3%) | 19,259 (32.8%) |
| 2 Vehicles | 54,717 (42.6%) | 24,222 (41.2%) |
| 3 or more Vehicles | 54,788 (42.7%) | 12,414 (21.1%) |
| Total | 128,368 (100.0%) | 58,803 (100.0%) |
Real Estate & Mortgages in Utah County
Real Estate and Mortgage Overview in Utah County
| Characteristic | Without Mortgage | With Mortgage |
| Housing Units | 33,350 | 95,018 |
| Median Property Value | $425,000 | $448,600 |
| Median Household Income | $90,211 | $30,345 |
| Monthly Housing Costs | $507 | $10,448 |
| Real Estate Taxes | $2,035 | $2,158 |
Property Value by Mortgage Status in Utah County
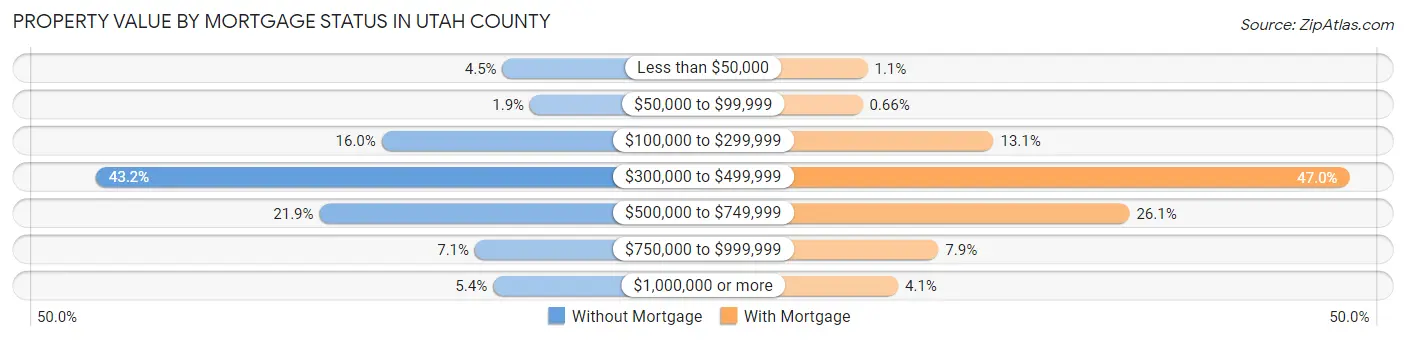
| Property Value | Without Mortgage | With Mortgage |
| Less than $50,000 | 1,497 (4.5%) | 1,082 (1.1%) |
| $50,000 to $99,999 | 623 (1.9%) | 626 (0.7%) |
| $100,000 to $299,999 | 5,336 (16.0%) | 12,483 (13.1%) |
| $300,000 to $499,999 | 14,409 (43.2%) | 44,691 (47.0%) |
| $500,000 to $749,999 | 7,314 (21.9%) | 24,792 (26.1%) |
| $750,000 to $999,999 | 2,375 (7.1%) | 7,494 (7.9%) |
| $1,000,000 or more | 1,796 (5.4%) | 3,850 (4.1%) |
| Total | 33,350 (100.0%) | 95,018 (100.0%) |
Household Income by Mortgage Status in Utah County
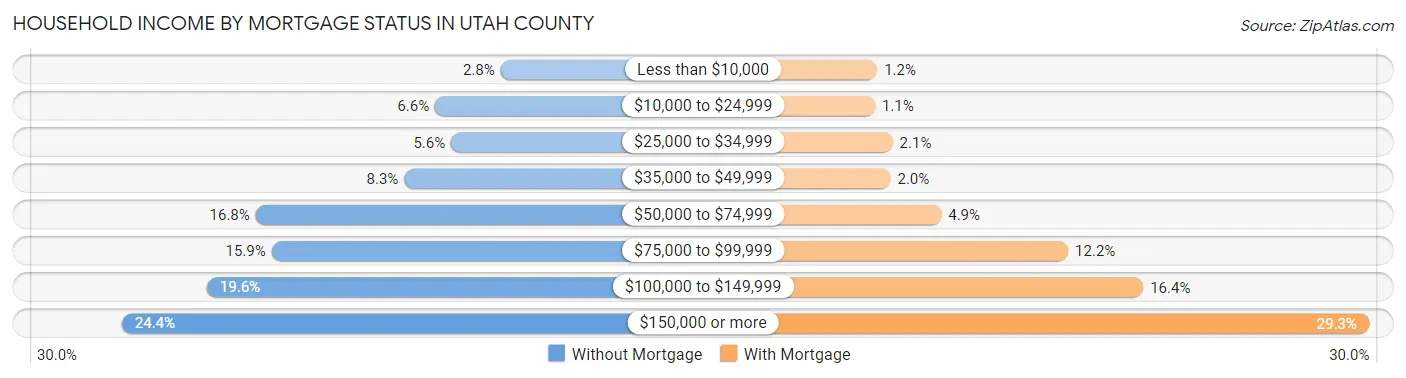
| Household Income | Without Mortgage | With Mortgage |
| Less than $10,000 | 934 (2.8%) | 1,182 (1.2%) |
| $10,000 to $24,999 | 2,184 (6.6%) | 1,059 (1.1%) |
| $25,000 to $34,999 | 1,877 (5.6%) | 2,016 (2.1%) |
| $35,000 to $49,999 | 2,772 (8.3%) | 1,900 (2.0%) |
| $50,000 to $74,999 | 5,602 (16.8%) | 4,658 (4.9%) |
| $75,000 to $99,999 | 5,300 (15.9%) | 11,549 (12.1%) |
| $100,000 to $149,999 | 6,529 (19.6%) | 15,624 (16.4%) |
| $150,000 or more | 8,152 (24.4%) | 27,867 (29.3%) |
| Total | 33,350 (100.0%) | 95,018 (100.0%) |
Property Value to Household Income Ratio in Utah County
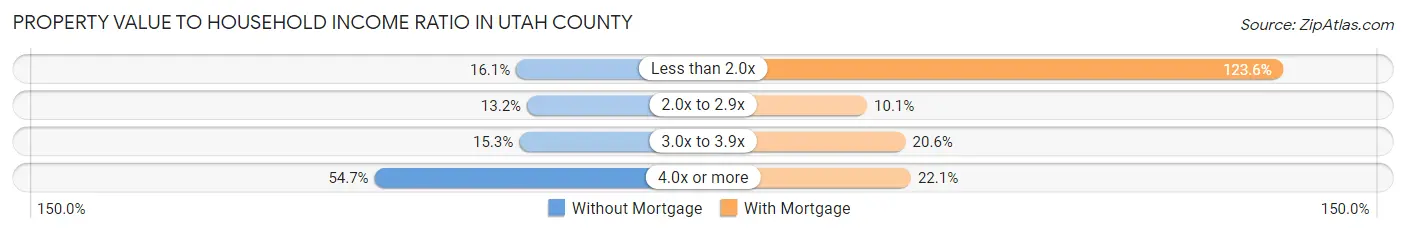
| Value-to-Income Ratio | Without Mortgage | With Mortgage |
| Less than 2.0x | 5,379 (16.1%) | 117,421 (123.6%) |
| 2.0x to 2.9x | 4,389 (13.2%) | 9,630 (10.1%) |
| 3.0x to 3.9x | 5,101 (15.3%) | 19,600 (20.6%) |
| 4.0x or more | 18,244 (54.7%) | 20,983 (22.1%) |
| Total | 33,350 (100.0%) | 95,018 (100.0%) |
Real Estate Taxes by Mortgage Status in Utah County
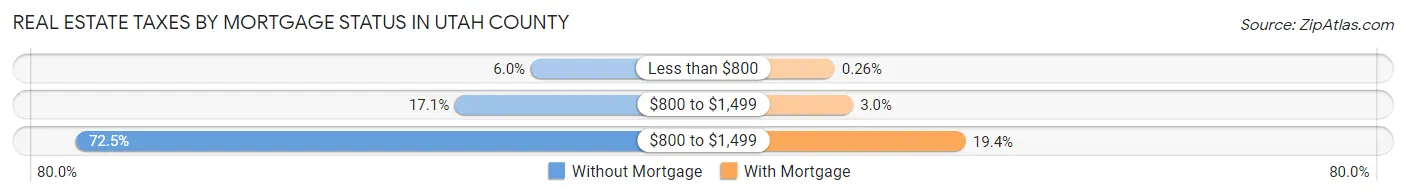
| Property Taxes | Without Mortgage | With Mortgage |
| Less than $800 | 2,009 (6.0%) | 251 (0.3%) |
| $800 to $1,499 | 5,707 (17.1%) | 2,809 (3.0%) |
| $800 to $1,499 | 24,176 (72.5%) | 18,440 (19.4%) |
| Total | 33,350 (100.0%) | 95,018 (100.0%) |
Health & Disability in Utah County
Health Insurance Coverage by Age in Utah County
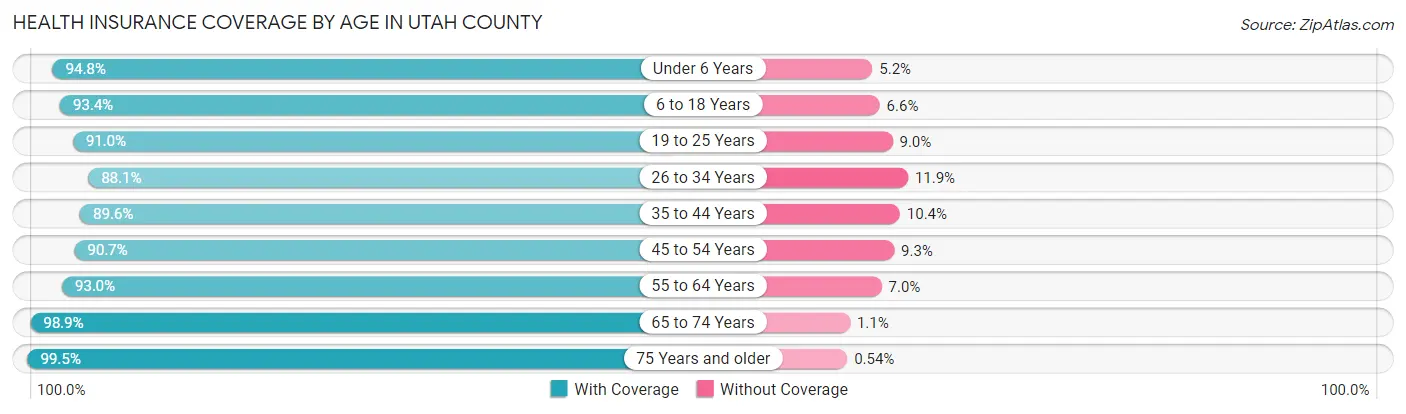
| Age Bracket | With Coverage | Without Coverage |
| Under 6 Years | 66,635 (94.8%) | 3,676 (5.2%) |
| 6 to 18 Years | 149,861 (93.4%) | 10,578 (6.6%) |
| 19 to 25 Years | 102,386 (91.0%) | 10,115 (9.0%) |
| 26 to 34 Years | 73,365 (88.1%) | 9,880 (11.9%) |
| 35 to 44 Years | 74,423 (89.6%) | 8,604 (10.4%) |
| 45 to 54 Years | 52,911 (90.7%) | 5,416 (9.3%) |
| 55 to 64 Years | 41,040 (93.0%) | 3,071 (7.0%) |
| 65 to 74 Years | 30,485 (98.9%) | 327 (1.1%) |
| 75 Years and older | 20,171 (99.5%) | 110 (0.5%) |
| Total | 611,277 (92.2%) | 51,777 (7.8%) |
Health Insurance Coverage by Citizenship Status in Utah County
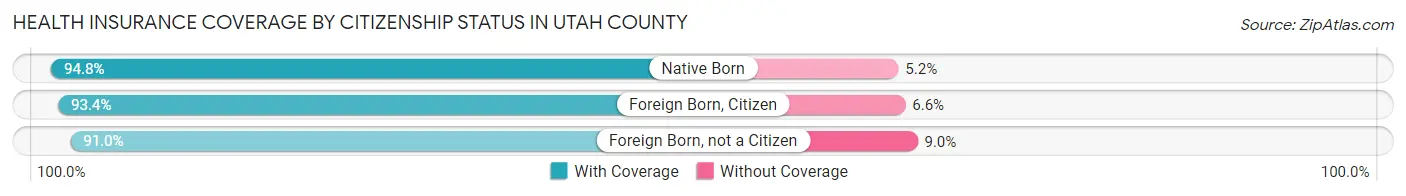
| Citizenship Status | With Coverage | Without Coverage |
| Native Born | 66,635 (94.8%) | 3,676 (5.2%) |
| Foreign Born, Citizen | 149,861 (93.4%) | 10,578 (6.6%) |
| Foreign Born, not a Citizen | 102,386 (91.0%) | 10,115 (9.0%) |
Health Insurance Coverage by Household Income in Utah County
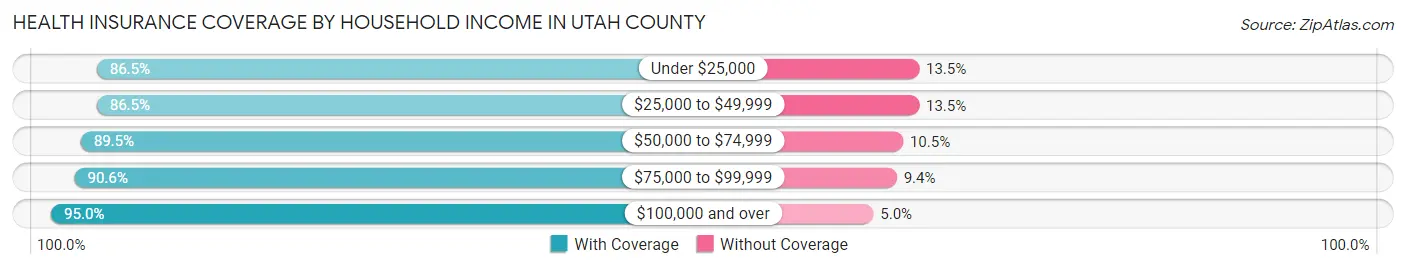
| Household Income | With Coverage | Without Coverage |
| Under $25,000 | 32,159 (86.5%) | 5,030 (13.5%) |
| $25,000 to $49,999 | 60,512 (86.5%) | 9,466 (13.5%) |
| $50,000 to $74,999 | 81,816 (89.5%) | 9,634 (10.5%) |
| $75,000 to $99,999 | 89,640 (90.6%) | 9,257 (9.4%) |
| $100,000 and over | 332,805 (95.0%) | 17,449 (5.0%) |
Public vs Private Health Insurance Coverage by Age in Utah County
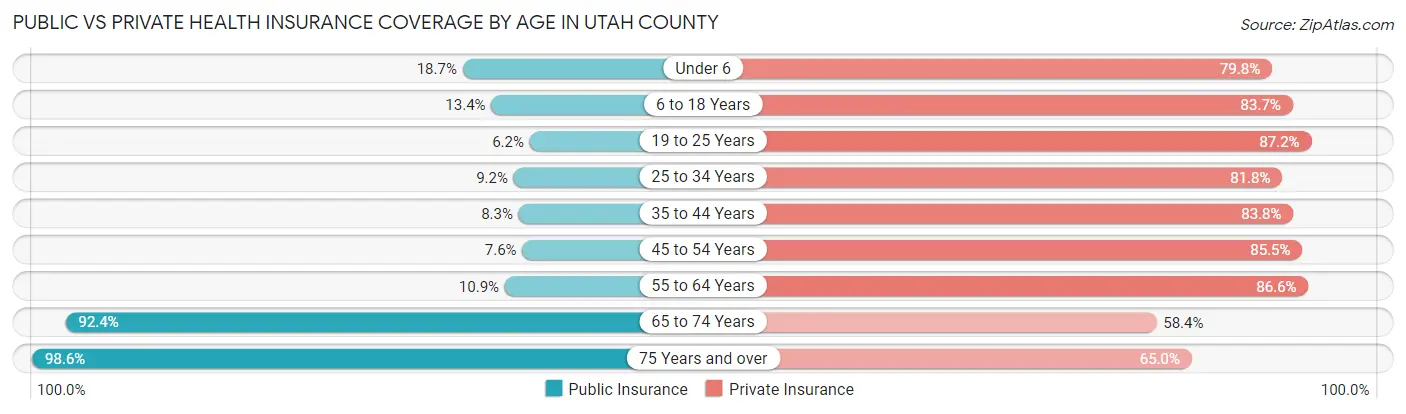
| Age Bracket | Public Insurance | Private Insurance |
| Under 6 | 13,133 (18.7%) | 56,137 (79.8%) |
| 6 to 18 Years | 21,424 (13.4%) | 134,252 (83.7%) |
| 19 to 25 Years | 7,013 (6.2%) | 98,062 (87.2%) |
| 25 to 34 Years | 7,655 (9.2%) | 68,064 (81.8%) |
| 35 to 44 Years | 6,870 (8.3%) | 69,587 (83.8%) |
| 45 to 54 Years | 4,430 (7.6%) | 49,860 (85.5%) |
| 55 to 64 Years | 4,785 (10.8%) | 38,206 (86.6%) |
| 65 to 74 Years | 28,477 (92.4%) | 17,987 (58.4%) |
| 75 Years and over | 20,005 (98.6%) | 13,174 (65.0%) |
| Total | 113,792 (17.2%) | 545,329 (82.3%) |
Disability Status by Sex by Age in Utah County
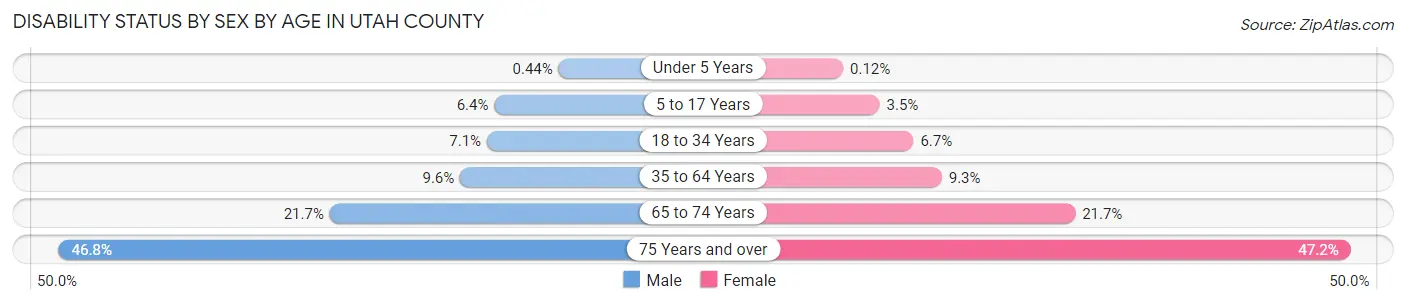
| Age Bracket | Male | Female |
| Under 5 Years | 132 (0.4%) | 35 (0.1%) |
| 5 to 17 Years | 5,156 (6.4%) | 2,649 (3.5%) |
| 18 to 34 Years | 7,663 (7.1%) | 6,933 (6.7%) |
| 35 to 64 Years | 9,058 (9.6%) | 8,432 (9.3%) |
| 65 to 74 Years | 3,174 (21.7%) | 3,503 (21.7%) |
| 75 Years and over | 4,192 (46.8%) | 5,351 (47.2%) |
Disability Class by Sex by Age in Utah County
Disability Class: Hearing Difficulty
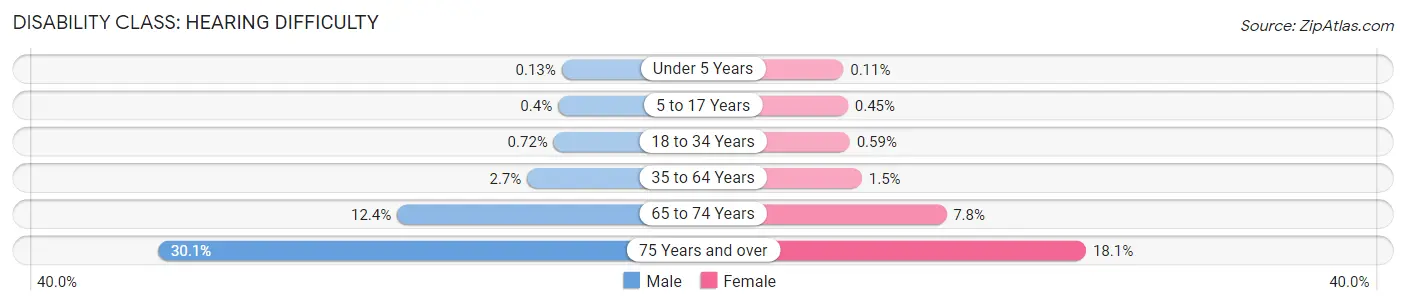
| Age Bracket | Male | Female |
| Under 5 Years | 38 (0.1%) | 30 (0.1%) |
| 5 to 17 Years | 325 (0.4%) | 338 (0.4%) |
| 18 to 34 Years | 779 (0.7%) | 620 (0.6%) |
| 35 to 64 Years | 2,541 (2.7%) | 1,358 (1.5%) |
| 65 to 74 Years | 1,808 (12.3%) | 1,254 (7.7%) |
| 75 Years and over | 2,694 (30.1%) | 2,055 (18.1%) |
Disability Class: Vision Difficulty
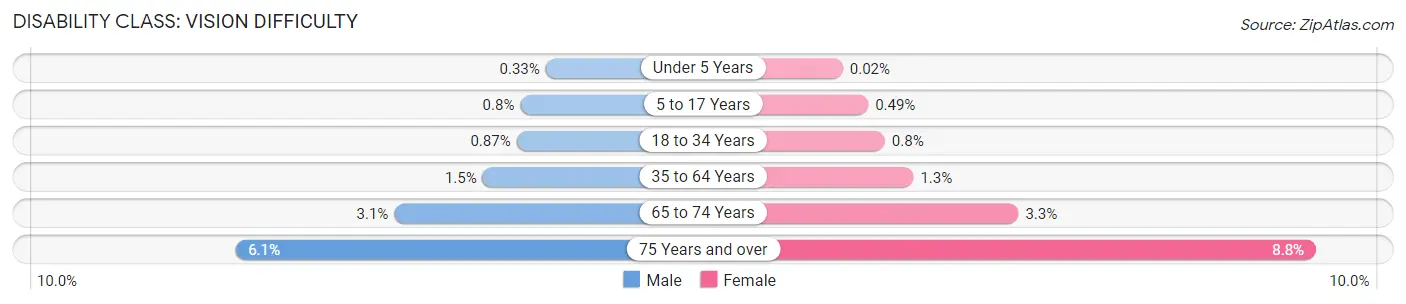
| Age Bracket | Male | Female |
| Under 5 Years | 98 (0.3%) | 5 (0.0%) |
| 5 to 17 Years | 642 (0.8%) | 372 (0.5%) |
| 18 to 34 Years | 944 (0.9%) | 835 (0.8%) |
| 35 to 64 Years | 1,422 (1.5%) | 1,212 (1.3%) |
| 65 to 74 Years | 459 (3.1%) | 530 (3.3%) |
| 75 Years and over | 545 (6.1%) | 997 (8.8%) |
Disability Class: Cognitive Difficulty
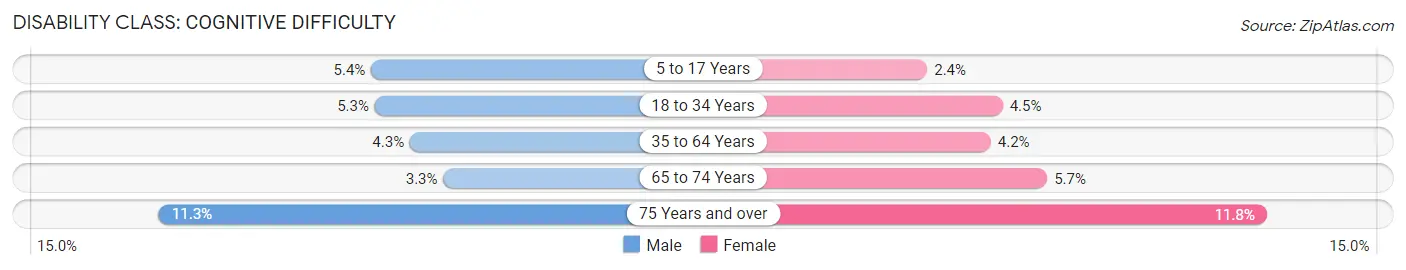
| Age Bracket | Male | Female |
| 5 to 17 Years | 4,302 (5.3%) | 1,798 (2.4%) |
| 18 to 34 Years | 5,676 (5.2%) | 4,669 (4.5%) |
| 35 to 64 Years | 4,040 (4.3%) | 3,775 (4.2%) |
| 65 to 74 Years | 489 (3.3%) | 925 (5.7%) |
| 75 Years and over | 1,008 (11.3%) | 1,341 (11.8%) |
Disability Class: Ambulatory Difficulty
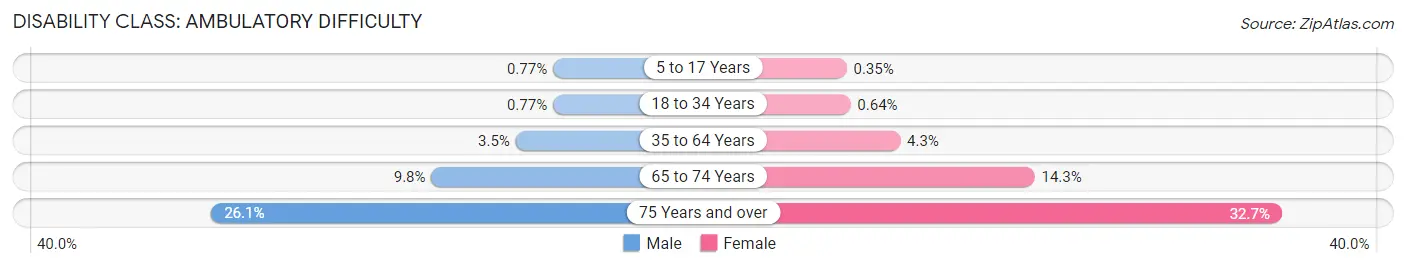
| Age Bracket | Male | Female |
| 5 to 17 Years | 620 (0.8%) | 264 (0.4%) |
| 18 to 34 Years | 830 (0.8%) | 669 (0.6%) |
| 35 to 64 Years | 3,345 (3.5%) | 3,937 (4.3%) |
| 65 to 74 Years | 1,435 (9.8%) | 2,314 (14.3%) |
| 75 Years and over | 2,339 (26.1%) | 3,701 (32.7%) |
Disability Class: Self-Care Difficulty
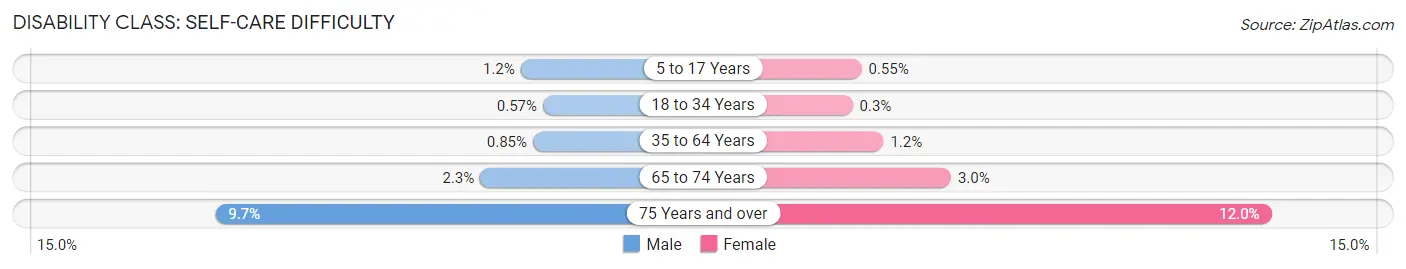
| Age Bracket | Male | Female |
| 5 to 17 Years | 954 (1.2%) | 412 (0.5%) |
| 18 to 34 Years | 619 (0.6%) | 313 (0.3%) |
| 35 to 64 Years | 808 (0.9%) | 1,053 (1.2%) |
| 65 to 74 Years | 340 (2.3%) | 492 (3.0%) |
| 75 Years and over | 867 (9.7%) | 1,355 (12.0%) |
Technology Access in Utah County
Computing Device Access in Utah County
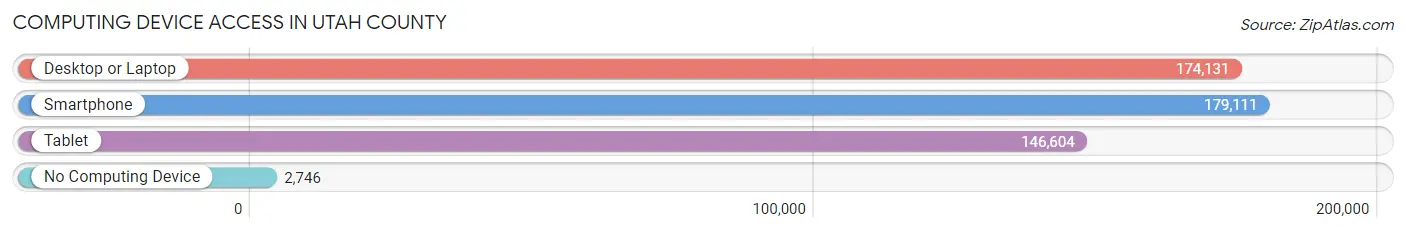
| Device Type | # Households | % Households |
| Desktop or Laptop | 174,131 | 93.0% |
| Smartphone | 179,111 | 95.7% |
| Tablet | 146,604 | 78.3% |
| No Computing Device | 2,746 | 1.5% |
| Total | 187,171 | 100.0% |
Internet Access in Utah County
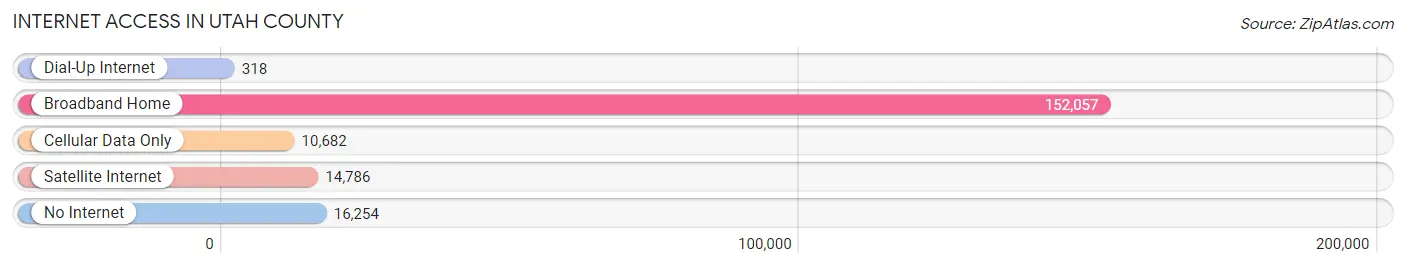
| Internet Type | # Households | % Households |
| Dial-Up Internet | 318 | 0.2% |
| Broadband Home | 152,057 | 81.2% |
| Cellular Data Only | 10,682 | 5.7% |
| Satellite Internet | 14,786 | 7.9% |
| No Internet | 16,254 | 8.7% |
| Total | 187,171 | 100.0% |
Utah County Summary
Utah County is located in the central part of the state of Utah and is part of the Provo-Orem metropolitan area. It is the second most populous county in the state, with an estimated population of 633,053 in 2019. The county seat is Provo, and the largest city is Orem.
Geography
Utah County is located in the Wasatch Front region of the state, and is bordered by Wasatch County to the north, Juab County to the west, Sanpete County to the south, and Utah and Salt Lake Counties to the east. The county covers an area of 2,144 square miles, and is home to the Wasatch Mountains, the Uinta Mountains, and the Wasatch Plateau. The highest point in the county is Mount Nebo, at 11,928 feet. The county is home to several rivers, including the Provo River, the Spanish Fork River, and the American Fork River.
History
Utah County was established in 1850 as part of the Utah Territory. The county was named after the Ute Native American tribe, which had inhabited the area for centuries prior to the arrival of European settlers. The county was initially populated by Mormon settlers, and the city of Provo was established in 1849. The county was an important center of the Mormon faith, and the city of Provo was the site of the first Mormon temple in the state.
Economy
Utah County is home to a diverse economy, with a variety of industries providing employment opportunities. The county is home to several large employers, including Brigham Young University, Utah Valley University, and the Utah Valley Regional Medical Center. The county is also home to several technology companies, including Adobe, Ancestry.com, and Vivint. The county is also home to several manufacturing companies, including Nu Skin Enterprises and ATK.
Demographics
As of the 2019 census, Utah County had an estimated population of 633,053. The population is predominantly white (90.2%), with smaller percentages of Hispanic or Latino (5.3%), Asian (2.2%), and African American (1.2%) residents. The median household income in the county is $68,945, and the median age is 28.7 years. The county is home to a large number of young families, with nearly one-third of the population under the age of 18.
Conclusion
Utah County is a vibrant and diverse county located in the central part of the state of Utah. The county is home to a variety of industries, providing employment opportunities for its residents. The county is also home to a large population of young families, with a median age of 28.7 years. Utah County is an important center of the Mormon faith, and is home to several large employers, including Brigham Young University and Utah Valley University.
Common Questions
What is the Total Population of Utah County?
Total Population of Utah County is 666,021.
What is the Total Male Population of Utah County?
Total Male Population of Utah County is 338,404.
What is the Total Female Population of Utah County?
Total Female Population of Utah County is 327,617.
What is the Ratio of Males per 100 Females in Utah County?
There are 103.29 Males per 100 Females in Utah County.
What is the Ratio of Females per 100 Males in Utah County?
There are 96.81 Females per 100 Males in Utah County.
What is the Median Population Age in Utah County?
Median Population Age in Utah County is 25.2 Years.
What is the Average Family Size in Utah County
Average Family Size in Utah County is 3.8 People.
What is the Average Household Size in Utah County
Average Household Size in Utah County is 3.5 People.
What is Per Capita Income in Utah County?
Per Capita income in Utah County is $33,251.
What is the Median Family Income in Utah County?
Median Family Income in Utah County is $100,128.
What is the Median Household income in Utah County?
Median Household Income in Utah County is $91,263.
What is Income or Wage Gap in Utah County?
Income or Wage Gap in Utah County is 53.0%.
Women in Utah County earn 47.0 cents for every dollar earned by a man.
What is Family Income Deficit in Utah County?
Family Income Deficit in Utah County is $10,837.
Families that are below poverty line in Utah County earn $10,837 less on average than the poverty threshold level.
What is Inequality or Gini Index in Utah County?
Inequality or Gini Index in Utah County is 0.42.
How Large is the Labor Force in Utah County?
There are 338,477 People in the Labor Forcein in Utah County.
What is the Percentage of People in the Labor Force in Utah County?
71.3% of People are in the Labor Force in Utah County.
What is the Unemployment Rate in Utah County?
Unemployment Rate in Utah County is 3.4%.