Summit County, UT
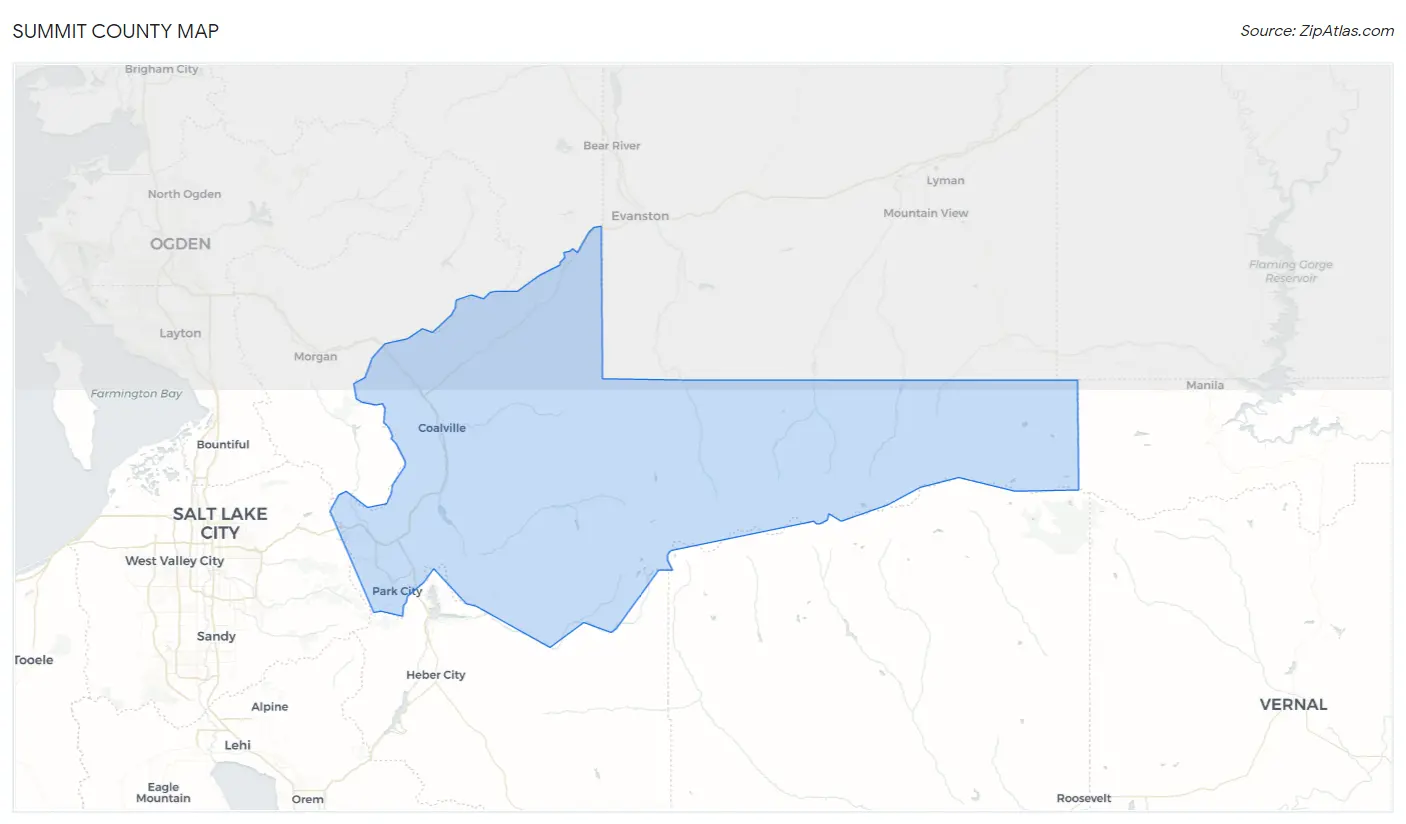
Summit County Map
Summit County Overview
42,524
TOTAL POPULATION
21,971
MALE POPULATION
20,553
FEMALE POPULATION
106.90
MALES / 100 FEMALES
93.55
FEMALES / 100 MALES
40.5
MEDIAN AGE
3.5
AVG FAMILY SIZE
3.1
AVG HOUSEHOLD SIZE
$67,602
PER CAPITA INCOME
$144,118
AVG FAMILY INCOME
$126,392
AVG HOUSEHOLD INCOME
28.0%
WAGE / INCOME GAP [ % ]
72.0¢/ $1
WAGE / INCOME GAP [ $ ]
$13,027
FAMILY INCOME DEFICIT
0.51
INEQUALITY / GINI INDEX
23,524
LABOR FORCE [ PEOPLE ]
69.5%
PERCENT IN LABOR FORCE
2.3%
UNEMPLOYMENT RATE
Race in Summit County
The most populous races in Summit County are White / Caucasian (37,348 | 87.8%), Hispanic or Latino (4,694 | 11.0%), and Two or more Races (2,439 | 5.7%).
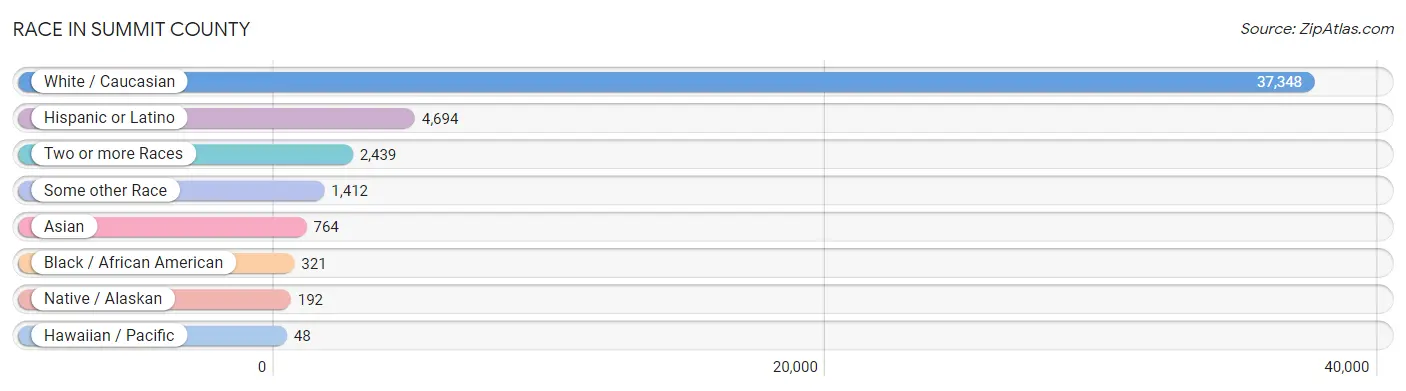
| Race | # Population | % Population |
| Asian | 764 | 1.8% |
| Black / African American | 321 | 0.7% |
| Hawaiian / Pacific | 48 | 0.1% |
| Hispanic or Latino | 4,694 | 11.0% |
| Native / Alaskan | 192 | 0.4% |
| White / Caucasian | 37,348 | 87.8% |
| Two or more Races | 2,439 | 5.7% |
| Some other Race | 1,412 | 3.3% |
| Total | 42,524 | 100.0% |
Ancestry in Summit County
The most populous ancestries reported in Summit County are English (9,165 | 21.5%), German (5,162 | 12.1%), Mexican (3,863 | 9.1%), Irish (3,488 | 8.2%), and Scottish (1,758 | 4.1%), together accounting for 55.1% of all Summit County residents.
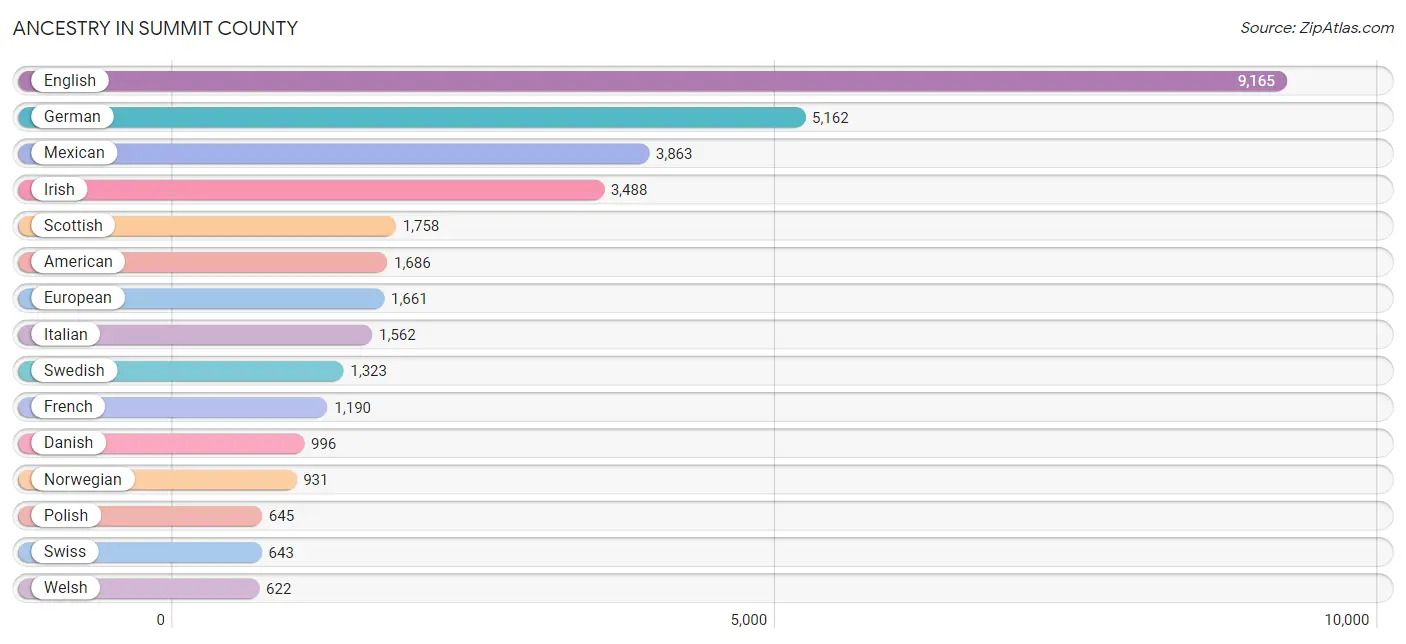
| Ancestry | # Population | % Population |
| Alsatian | 2 | 0.0% |
| American | 1,686 | 4.0% |
| Arab | 108 | 0.3% |
| Argentinean | 93 | 0.2% |
| Armenian | 43 | 0.1% |
| Australian | 111 | 0.3% |
| Austrian | 102 | 0.2% |
| Bahamian | 10 | 0.0% |
| Basque | 21 | 0.1% |
| Belgian | 69 | 0.2% |
| Bhutanese | 91 | 0.2% |
| Brazilian | 264 | 0.6% |
| British | 461 | 1.1% |
| Bulgarian | 15 | 0.0% |
| Burmese | 72 | 0.2% |
| Cambodian | 8 | 0.0% |
| Canadian | 211 | 0.5% |
| Central American | 69 | 0.2% |
| Central American Indian | 16 | 0.0% |
| Cherokee | 122 | 0.3% |
| Chilean | 75 | 0.2% |
| Choctaw | 24 | 0.1% |
| Colombian | 58 | 0.1% |
| Croatian | 29 | 0.1% |
| Cuban | 36 | 0.1% |
| Czech | 123 | 0.3% |
| Czechoslovakian | 41 | 0.1% |
| Danish | 996 | 2.3% |
| Dutch | 570 | 1.3% |
| Eastern European | 247 | 0.6% |
| English | 9,165 | 21.5% |
| Estonian | 48 | 0.1% |
| European | 1,661 | 3.9% |
| Fijian | 2 | 0.0% |
| Filipino | 17 | 0.0% |
| Finnish | 183 | 0.4% |
| French | 1,190 | 2.8% |
| French Canadian | 104 | 0.2% |
| German | 5,162 | 12.1% |
| Greek | 97 | 0.2% |
| Guamanian / Chamorro | 44 | 0.1% |
| Guatemalan | 27 | 0.1% |
| Haitian | 5 | 0.0% |
| Honduran | 21 | 0.1% |
| Hungarian | 120 | 0.3% |
| Icelander | 11 | 0.0% |
| Indian (Asian) | 254 | 0.6% |
| Inupiat | 3 | 0.0% |
| Iranian | 3 | 0.0% |
| Irish | 3,488 | 8.2% |
| Iroquois | 3 | 0.0% |
| Israeli | 73 | 0.2% |
| Italian | 1,562 | 3.7% |
| Jamaican | 65 | 0.2% |
| Korean | 441 | 1.0% |
| Laotian | 36 | 0.1% |
| Latvian | 5 | 0.0% |
| Lebanese | 21 | 0.1% |
| Lithuanian | 47 | 0.1% |
| Luxembourger | 7 | 0.0% |
| Mexican | 3,863 | 9.1% |
| Mexican American Indian | 119 | 0.3% |
| Mongolian | 36 | 0.1% |
| Moroccan | 2 | 0.0% |
| Navajo | 30 | 0.1% |
| New Zealander | 10 | 0.0% |
| Nicaraguan | 11 | 0.0% |
| Northern European | 185 | 0.4% |
| Norwegian | 931 | 2.2% |
| Pakistani | 79 | 0.2% |
| Palestinian | 32 | 0.1% |
| Peruvian | 24 | 0.1% |
| Polish | 645 | 1.5% |
| Portuguese | 49 | 0.1% |
| Puerto Rican | 48 | 0.1% |
| Romanian | 22 | 0.1% |
| Russian | 444 | 1.0% |
| Salvadoran | 10 | 0.0% |
| Samoan | 2 | 0.0% |
| Scandinavian | 462 | 1.1% |
| Scotch-Irish | 348 | 0.8% |
| Scottish | 1,758 | 4.1% |
| Serbian | 90 | 0.2% |
| Sioux | 31 | 0.1% |
| Slavic | 10 | 0.0% |
| Slovak | 16 | 0.0% |
| Slovene | 26 | 0.1% |
| South African | 6 | 0.0% |
| South American | 447 | 1.1% |
| Spaniard | 69 | 0.2% |
| Spanish | 21 | 0.1% |
| Spanish American | 3 | 0.0% |
| Sri Lankan | 68 | 0.2% |
| Subsaharan African | 22 | 0.1% |
| Swedish | 1,323 | 3.1% |
| Swiss | 643 | 1.5% |
| Syrian | 53 | 0.1% |
| Thai | 82 | 0.2% |
| Tongan | 2 | 0.0% |
| Ukrainian | 52 | 0.1% |
| Uruguayan | 26 | 0.1% |
| Ute | 42 | 0.1% |
| Venezuelan | 171 | 0.4% |
| Welsh | 622 | 1.5% |
| Yugoslavian | 36 | 0.1% | View All 105 Rows |
Immigrants in Summit County
The most numerous immigrant groups reported in Summit County came from Latin America (2,155 | 5.1%), Central America (1,590 | 3.7%), Mexico (1,548 | 3.6%), Europe (724 | 1.7%), and Asia (606 | 1.4%), together accounting for 15.6% of all Summit County residents.
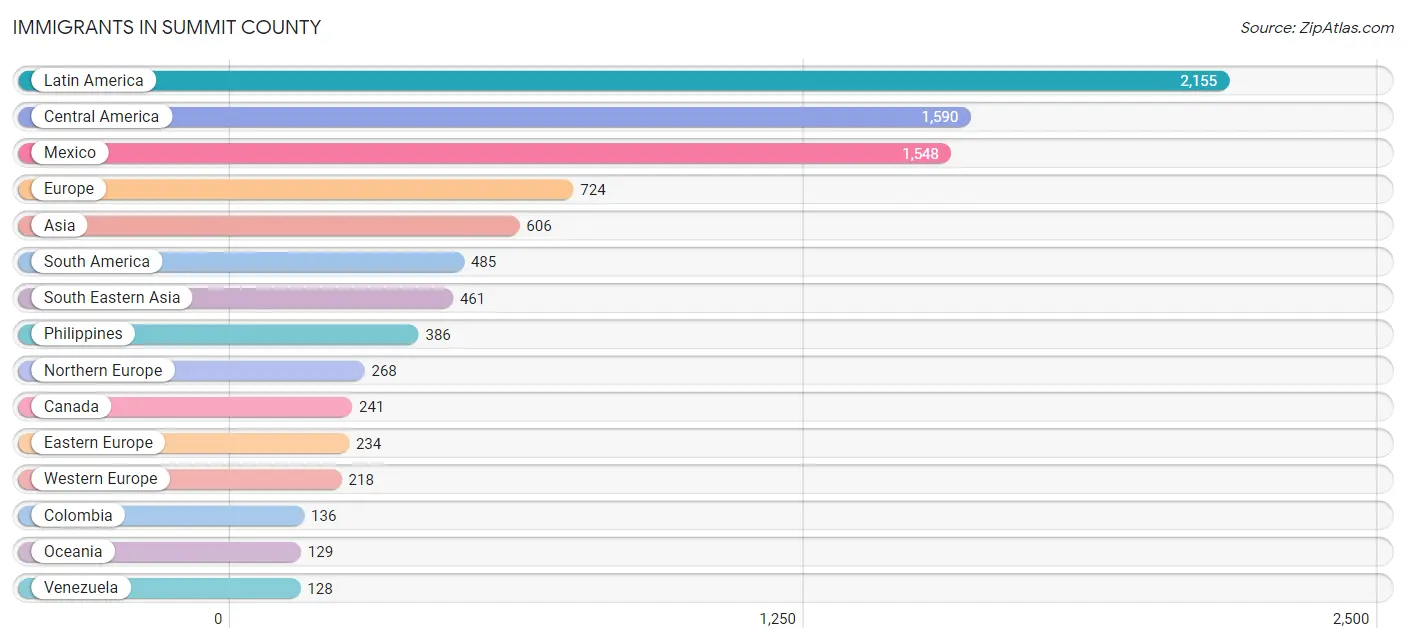
| Immigration Origin | # Population | % Population |
| Africa | 19 | 0.0% |
| Argentina | 13 | 0.0% |
| Asia | 606 | 1.4% |
| Australia | 103 | 0.2% |
| Austria | 2 | 0.0% |
| Bahamas | 10 | 0.0% |
| Bosnia and Herzegovina | 22 | 0.1% |
| Brazil | 87 | 0.2% |
| Bulgaria | 6 | 0.0% |
| Canada | 241 | 0.6% |
| Caribbean | 80 | 0.2% |
| Central America | 1,590 | 3.7% |
| Chile | 75 | 0.2% |
| China | 31 | 0.1% |
| Colombia | 136 | 0.3% |
| Czechoslovakia | 28 | 0.1% |
| Eastern Africa | 4 | 0.0% |
| Eastern Asia | 71 | 0.2% |
| Eastern Europe | 234 | 0.5% |
| El Salvador | 10 | 0.0% |
| England | 95 | 0.2% |
| Europe | 724 | 1.7% |
| France | 89 | 0.2% |
| Germany | 75 | 0.2% |
| Guatemala | 8 | 0.0% |
| Haiti | 5 | 0.0% |
| Honduras | 21 | 0.1% |
| Hong Kong | 6 | 0.0% |
| Hungary | 25 | 0.1% |
| India | 14 | 0.0% |
| Iran | 33 | 0.1% |
| Ireland | 17 | 0.0% |
| Italy | 2 | 0.0% |
| Jamaica | 65 | 0.2% |
| Japan | 7 | 0.0% |
| Kenya | 4 | 0.0% |
| Korea | 25 | 0.1% |
| Laos | 15 | 0.0% |
| Latin America | 2,155 | 5.1% |
| Malaysia | 13 | 0.0% |
| Mexico | 1,548 | 3.6% |
| Middle Africa | 8 | 0.0% |
| Netherlands | 35 | 0.1% |
| Nicaragua | 3 | 0.0% |
| Northern Europe | 268 | 0.6% |
| Norway | 17 | 0.0% |
| Oceania | 129 | 0.3% |
| Peru | 25 | 0.1% |
| Philippines | 386 | 0.9% |
| Poland | 54 | 0.1% |
| Romania | 14 | 0.0% |
| Russia | 60 | 0.1% |
| South Africa | 7 | 0.0% |
| South America | 485 | 1.1% |
| South Central Asia | 56 | 0.1% |
| South Eastern Asia | 461 | 1.1% |
| Southern Europe | 4 | 0.0% |
| Spain | 2 | 0.0% |
| Sweden | 27 | 0.1% |
| Switzerland | 17 | 0.0% |
| Thailand | 22 | 0.1% |
| Ukraine | 14 | 0.0% |
| Uruguay | 21 | 0.1% |
| Venezuela | 128 | 0.3% |
| Vietnam | 25 | 0.1% |
| Western Asia | 18 | 0.0% |
| Western Europe | 218 | 0.5% |
| Zaire | 8 | 0.0% | View All 68 Rows |
Sex and Age in Summit County
Sex and Age in Summit County
The most populous age groups in Summit County are 60 to 64 Years (1,896 | 8.6%) for men and 55 to 59 Years (1,622 | 7.9%) for women.
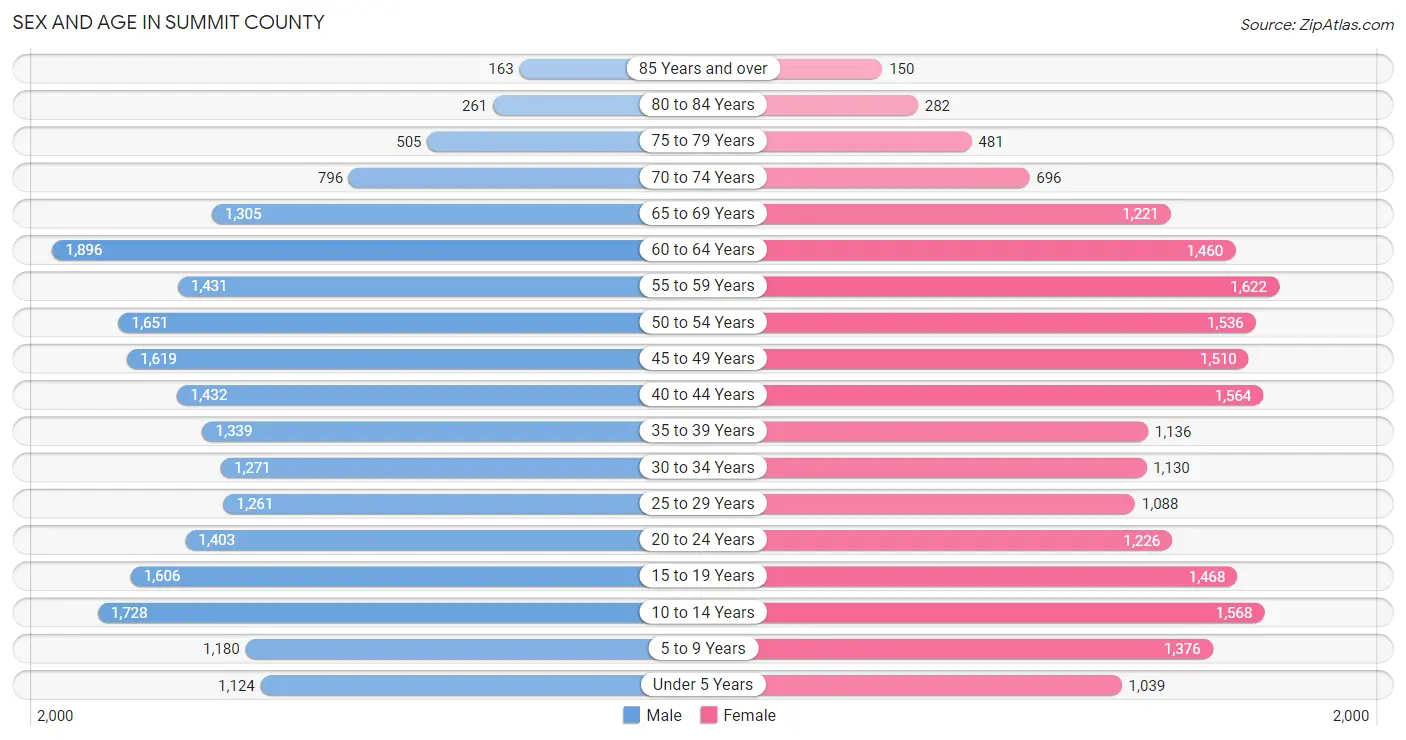
| Age Bracket | Male | Female |
| Under 5 Years | 1,124 (5.1%) | 1,039 (5.1%) |
| 5 to 9 Years | 1,180 (5.4%) | 1,376 (6.7%) |
| 10 to 14 Years | 1,728 (7.9%) | 1,568 (7.6%) |
| 15 to 19 Years | 1,606 (7.3%) | 1,468 (7.1%) |
| 20 to 24 Years | 1,403 (6.4%) | 1,226 (6.0%) |
| 25 to 29 Years | 1,261 (5.7%) | 1,088 (5.3%) |
| 30 to 34 Years | 1,271 (5.8%) | 1,130 (5.5%) |
| 35 to 39 Years | 1,339 (6.1%) | 1,136 (5.5%) |
| 40 to 44 Years | 1,432 (6.5%) | 1,564 (7.6%) |
| 45 to 49 Years | 1,619 (7.4%) | 1,510 (7.3%) |
| 50 to 54 Years | 1,651 (7.5%) | 1,536 (7.5%) |
| 55 to 59 Years | 1,431 (6.5%) | 1,622 (7.9%) |
| 60 to 64 Years | 1,896 (8.6%) | 1,460 (7.1%) |
| 65 to 69 Years | 1,305 (5.9%) | 1,221 (5.9%) |
| 70 to 74 Years | 796 (3.6%) | 696 (3.4%) |
| 75 to 79 Years | 505 (2.3%) | 481 (2.3%) |
| 80 to 84 Years | 261 (1.2%) | 282 (1.4%) |
| 85 Years and over | 163 (0.7%) | 150 (0.7%) |
| Total | 21,971 (100.0%) | 20,553 (100.0%) |
Families and Households in Summit County
Median Family Size in Summit County
The median family size in Summit County is 3.49 persons per family, with single female/mother families (1,058 | 10.4%) accounting for the largest median family size of 4.27 persons per family. On the other hand, married-couple families (8,738 | 85.6%) represent the smallest median family size with 3.38 persons per family.
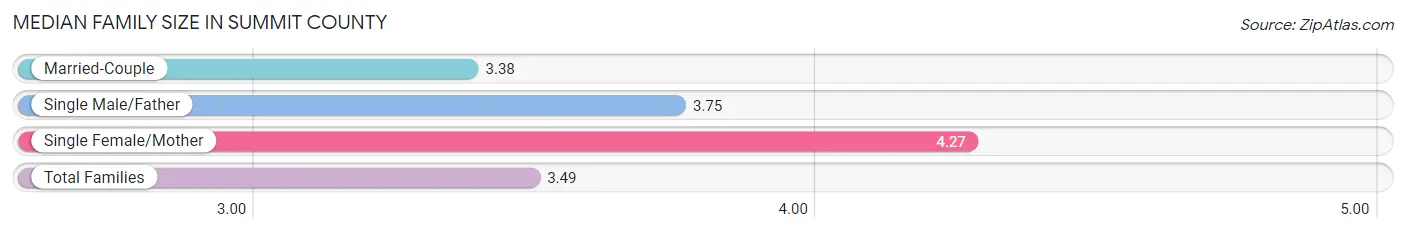
| Family Type | # Families | Family Size |
| Married-Couple | 8,738 (85.6%) | 3.38 |
| Single Male/Father | 418 (4.1%) | 3.75 |
| Single Female/Mother | 1,058 (10.4%) | 4.27 |
| Total Families | 10,214 (100.0%) | 3.49 |
Median Household Size in Summit County
The median household size in Summit County is 3.10 persons per household, with single female/mother households (1,058 | 7.7%) accounting for the largest median household size of 4.51 persons per household. non-family households (3,441 | 25.2%) represent the smallest median household size with 1.63 persons per household.
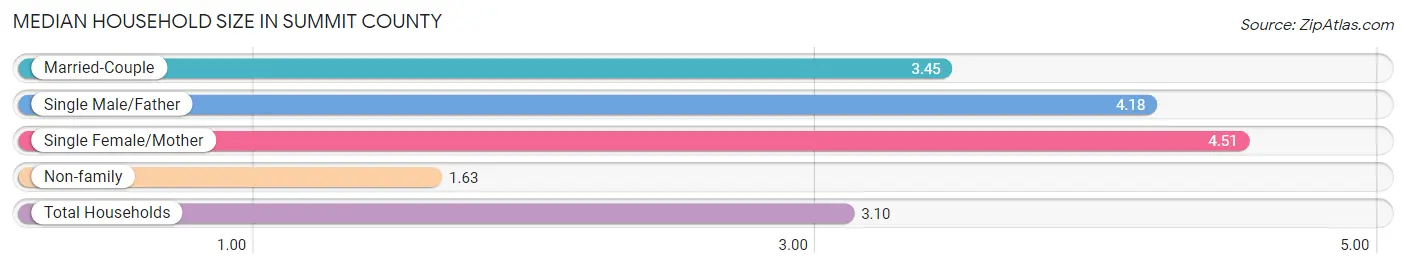
| Household Type | # Households | Household Size |
| Married-Couple | 8,738 (64.0%) | 3.45 |
| Single Male/Father | 418 (3.1%) | 4.18 |
| Single Female/Mother | 1,058 (7.7%) | 4.51 |
| Non-family | 3,441 (25.2%) | 1.63 |
| Total Households | 13,655 (100.0%) | 3.10 |
Household Size by Marriage Status in Summit County
Out of a total of 13,655 households in Summit County, 10,214 (74.8%) are family households, while 3,441 (25.2%) are nonfamily households. The most numerous type of family households are 2-person households, comprising 4,782, and the most common type of nonfamily households are 1-person households, comprising 2,687.
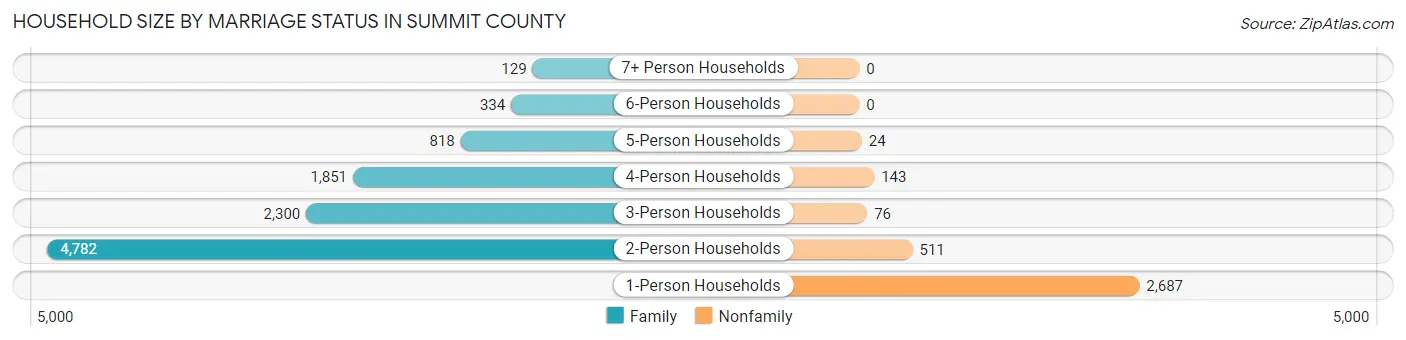
| Household Size | Family Households | Nonfamily Households |
| 1-Person Households | - | 2,687 (19.7%) |
| 2-Person Households | 4,782 (35.0%) | 511 (3.7%) |
| 3-Person Households | 2,300 (16.8%) | 76 (0.6%) |
| 4-Person Households | 1,851 (13.6%) | 143 (1.1%) |
| 5-Person Households | 818 (6.0%) | 24 (0.2%) |
| 6-Person Households | 334 (2.5%) | 0 (0.0%) |
| 7+ Person Households | 129 (0.9%) | 0 (0.0%) |
| Total | 10,214 (74.8%) | 3,441 (25.2%) |
Female Fertility in Summit County
Fertility by Age in Summit County
Average fertility rate in Summit County is 26.0 births per 1,000 women. Women in the age bracket of 20 to 34 years have the highest fertility rate with 56.0 births per 1,000 women. Women in the age bracket of 20 to 34 years acount for 79.5% of all women with births.
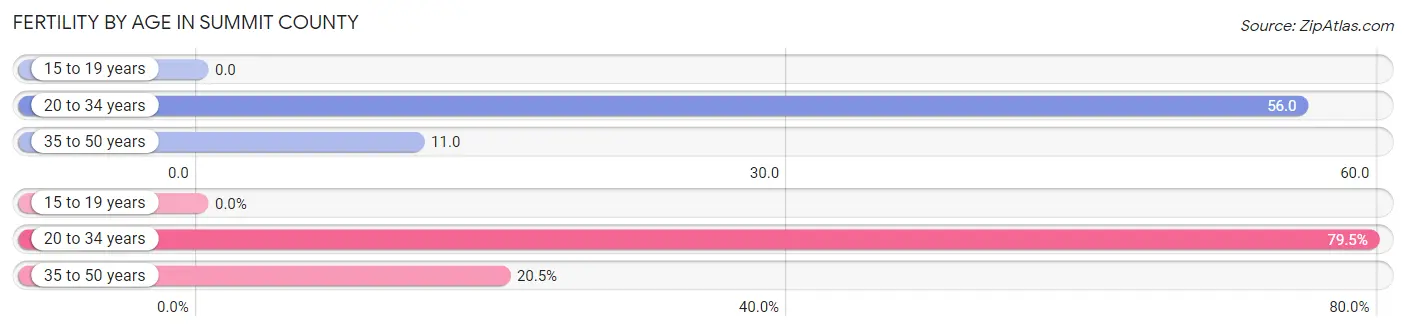
| Age Bracket | Women with Births | Births / 1,000 Women |
| 15 to 19 years | 0 (0.0%) | 0.0 |
| 20 to 34 years | 194 (79.5%) | 56.0 |
| 35 to 50 years | 50 (20.5%) | 11.0 |
| Total | 244 (100.0%) | 26.0 |
Fertility by Age by Marriage Status in Summit County
86.1% of women with births (244) in Summit County are married. The highest percentage of unmarried women with births falls into 20 to 34 years age bracket with 17.5% of them unmarried at the time of birth, while the lowest percentage of unmarried women with births belong to 35 to 50 years age bracket with 0.0% of them unmarried.
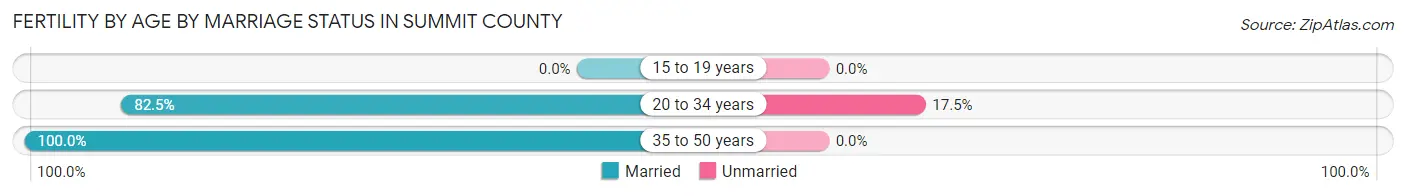
| Age Bracket | Married | Unmarried |
| 15 to 19 years | 0 (0.0%) | 0 (0.0%) |
| 20 to 34 years | 160 (82.5%) | 34 (17.5%) |
| 35 to 50 years | 50 (100.0%) | 0 (0.0%) |
| Total | 210 (86.1%) | 34 (13.9%) |
Fertility by Education in Summit County
Average fertility rate in Summit County is 26.0 births per 1,000 women. Women with the education attainment of bachelor's degree have the highest fertility rate of 49.0 births per 1,000 women, while women with the education attainment of less than high school have the lowest fertility at 7.0 births per 1,000 women. Women with the education attainment of bachelor's degree represent 59.0% of all women with births.
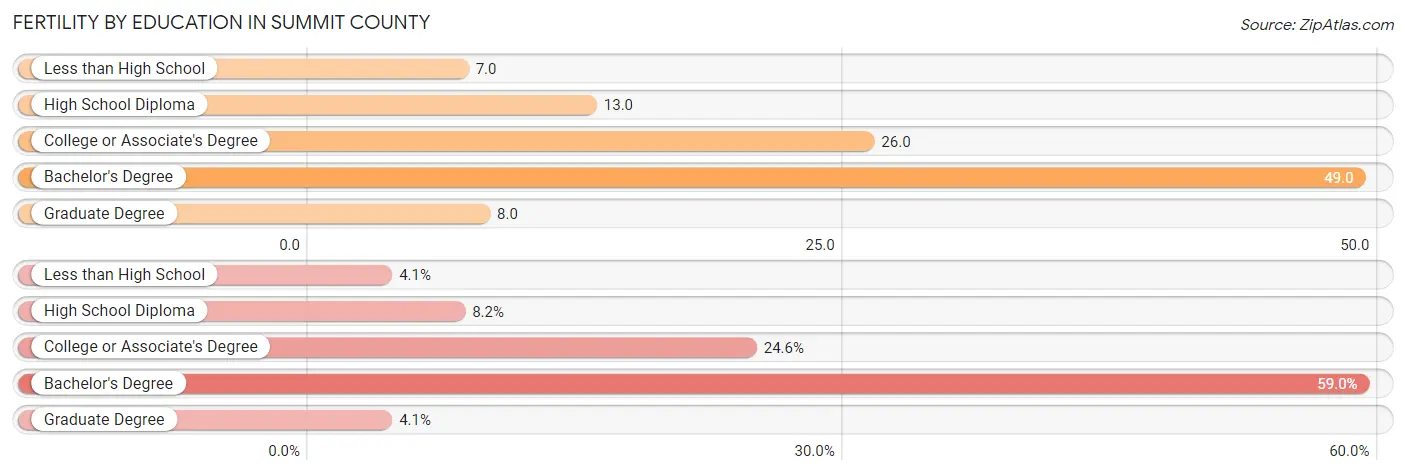
| Educational Attainment | Women with Births | Births / 1,000 Women |
| Less than High School | 10 (4.1%) | 7.0 |
| High School Diploma | 20 (8.2%) | 13.0 |
| College or Associate's Degree | 60 (24.6%) | 26.0 |
| Bachelor's Degree | 144 (59.0%) | 49.0 |
| Graduate Degree | 10 (4.1%) | 8.0 |
| Total | 244 (100.0%) | 26.0 |
Fertility by Education by Marriage Status in Summit County
13.9% of women with births in Summit County are unmarried. Women with the educational attainment of high school diploma are most likely to be married with 100.0% of them married at childbirth, while women with the educational attainment of less than high school are least likely to be married with 100.0% of them unmarried at childbirth.
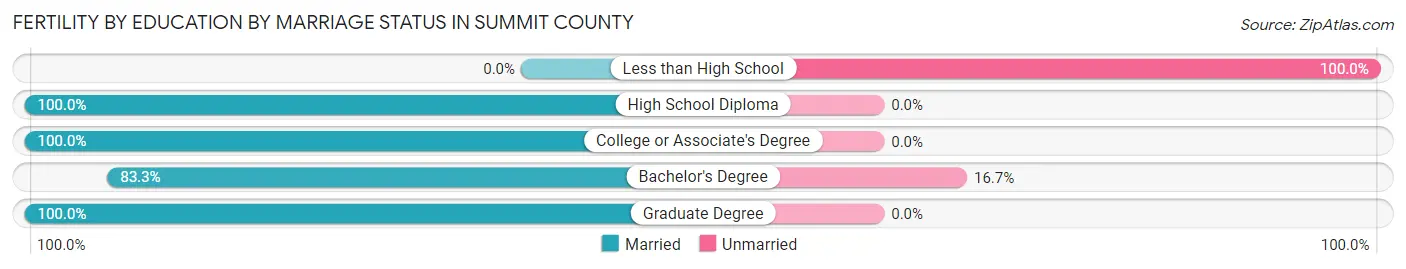
| Educational Attainment | Married | Unmarried |
| Less than High School | 0 (0.0%) | 10 (100.0%) |
| High School Diploma | 20 (100.0%) | 0 (0.0%) |
| College or Associate's Degree | 60 (100.0%) | 0 (0.0%) |
| Bachelor's Degree | 120 (83.3%) | 24 (16.7%) |
| Graduate Degree | 10 (100.0%) | 0 (0.0%) |
| Total | 210 (86.1%) | 34 (13.9%) |
Income in Summit County
Income Overview in Summit County
Per Capita Income in Summit County is $67,602, while median incomes of families and households are $144,118 and $126,392 respectively.
| Characteristic | Number | Measure |
| Per Capita Income | 42,524 | $67,602 |
| Median Family Income | 10,214 | $144,118 |
| Mean Family Income | 10,214 | $221,128 |
| Median Household Income | 13,655 | $126,392 |
| Mean Household Income | 13,655 | $194,835 |
| Income Deficit | 10,214 | $13,027 |
| Wage / Income Gap (%) | 42,524 | 27.97% |
| Wage / Income Gap ($) | 42,524 | 72.03¢ per $1 |
| Gini / Inequality Index | 42,524 | 0.51 |
Earnings by Sex in Summit County
Average Earnings in Summit County are $49,540, $57,339 for men and $41,300 for women, a difference of 28.0%.
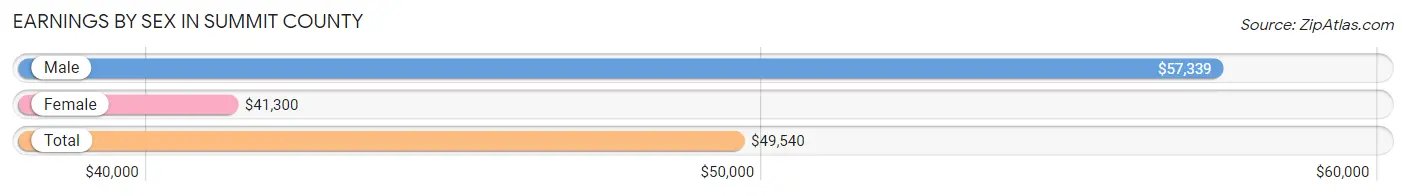
| Sex | Number | Average Earnings |
| Male | 14,101 (55.0%) | $57,339 |
| Female | 11,516 (45.0%) | $41,300 |
| Total | 25,617 (100.0%) | $49,540 |
Earnings by Sex by Income Bracket in Summit County
The most common earnings brackets in Summit County are $100,000+ for men (4,256 | 30.2%) and $100,000+ for women (1,766 | 15.3%).
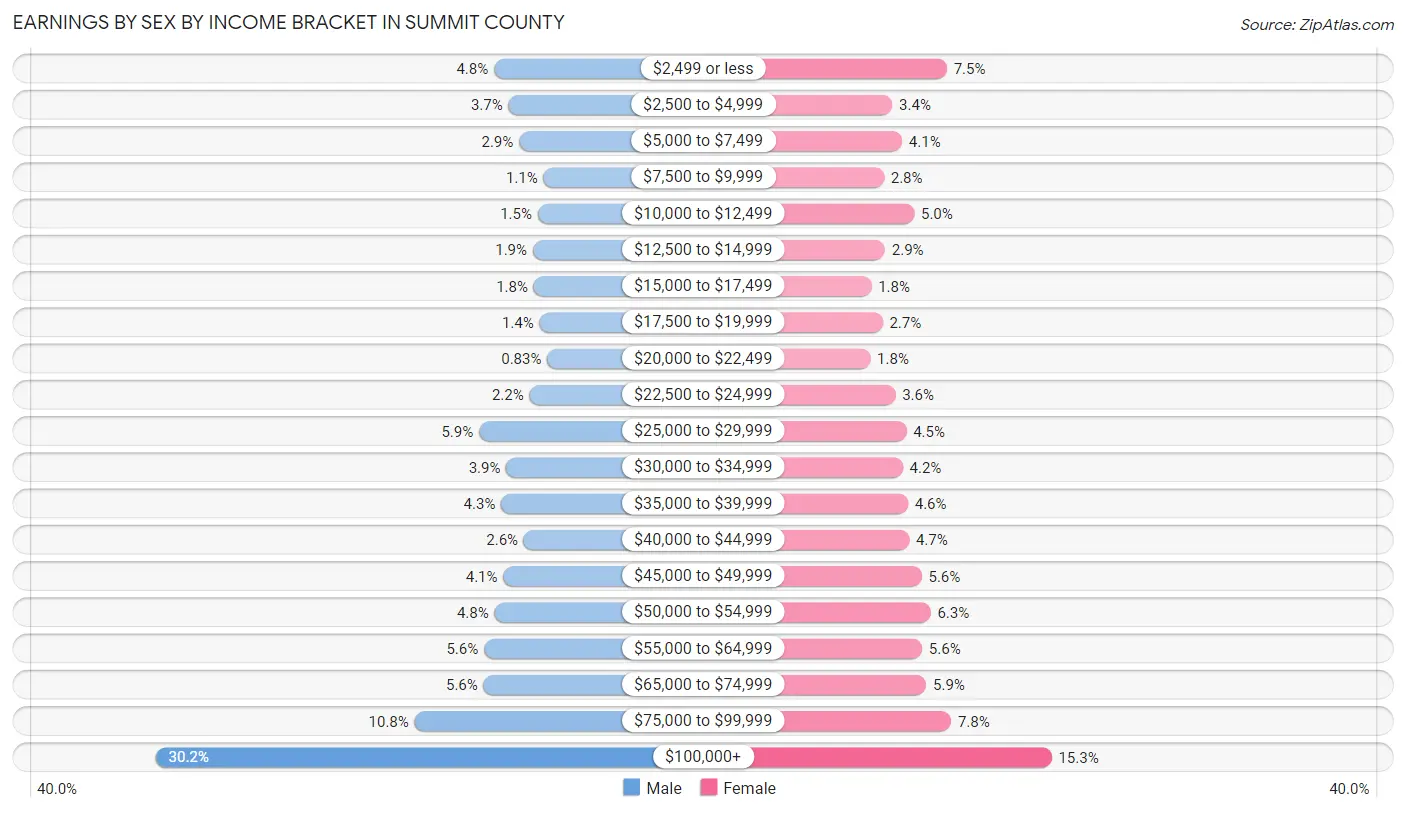
| Income | Male | Female |
| $2,499 or less | 679 (4.8%) | 862 (7.5%) |
| $2,500 to $4,999 | 526 (3.7%) | 392 (3.4%) |
| $5,000 to $7,499 | 415 (2.9%) | 476 (4.1%) |
| $7,500 to $9,999 | 157 (1.1%) | 319 (2.8%) |
| $10,000 to $12,499 | 217 (1.5%) | 580 (5.0%) |
| $12,500 to $14,999 | 269 (1.9%) | 328 (2.9%) |
| $15,000 to $17,499 | 260 (1.8%) | 211 (1.8%) |
| $17,500 to $19,999 | 199 (1.4%) | 307 (2.7%) |
| $20,000 to $22,499 | 117 (0.8%) | 202 (1.8%) |
| $22,500 to $24,999 | 304 (2.2%) | 418 (3.6%) |
| $25,000 to $29,999 | 837 (5.9%) | 513 (4.4%) |
| $30,000 to $34,999 | 550 (3.9%) | 481 (4.2%) |
| $35,000 to $39,999 | 604 (4.3%) | 526 (4.6%) |
| $40,000 to $44,999 | 364 (2.6%) | 537 (4.7%) |
| $45,000 to $49,999 | 581 (4.1%) | 645 (5.6%) |
| $50,000 to $54,999 | 674 (4.8%) | 722 (6.3%) |
| $55,000 to $64,999 | 785 (5.6%) | 648 (5.6%) |
| $65,000 to $74,999 | 789 (5.6%) | 684 (5.9%) |
| $75,000 to $99,999 | 1,518 (10.8%) | 899 (7.8%) |
| $100,000+ | 4,256 (30.2%) | 1,766 (15.3%) |
| Total | 14,101 (100.0%) | 11,516 (100.0%) |
Earnings by Sex by Educational Attainment in Summit County
Average earnings in Summit County are $69,036 for men and $48,989 for women, a difference of 29.0%. Men with an educational attainment of graduate degree enjoy the highest average annual earnings of $143,750, while those with less than high school education earn the least with $29,703. Women with an educational attainment of graduate degree earn the most with the average annual earnings of $72,386, while those with less than high school education have the smallest earnings of $30,278.
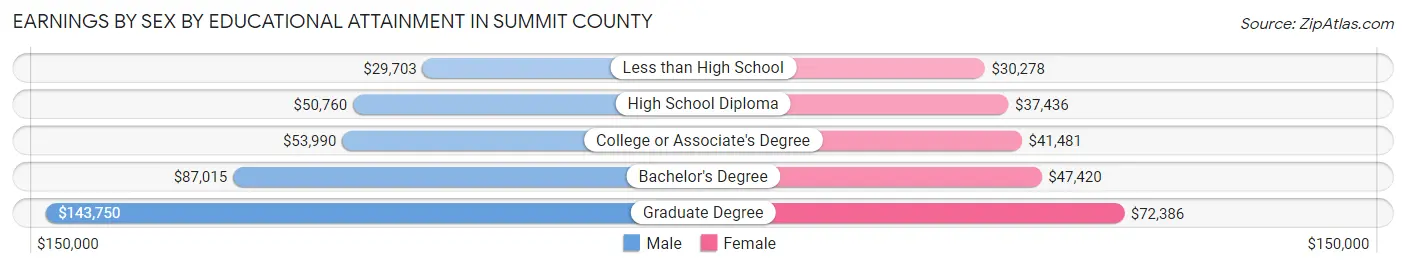
| Educational Attainment | Male Income | Female Income |
| Less than High School | $29,703 | $30,278 |
| High School Diploma | $50,760 | $37,436 |
| College or Associate's Degree | $53,990 | $41,481 |
| Bachelor's Degree | $87,015 | $47,420 |
| Graduate Degree | $143,750 | $72,386 |
| Total | $69,036 | $48,989 |
Family Income in Summit County
Family Income Brackets in Summit County
According to the Summit County family income data, there are 3,514 families falling into the $200,000+ income range, which is the most common income bracket and makes up 34.4% of all families. Conversely, the $10,000 to $14,999 income bracket is the least frequent group with only 51 families (0.5%) belonging to this category.
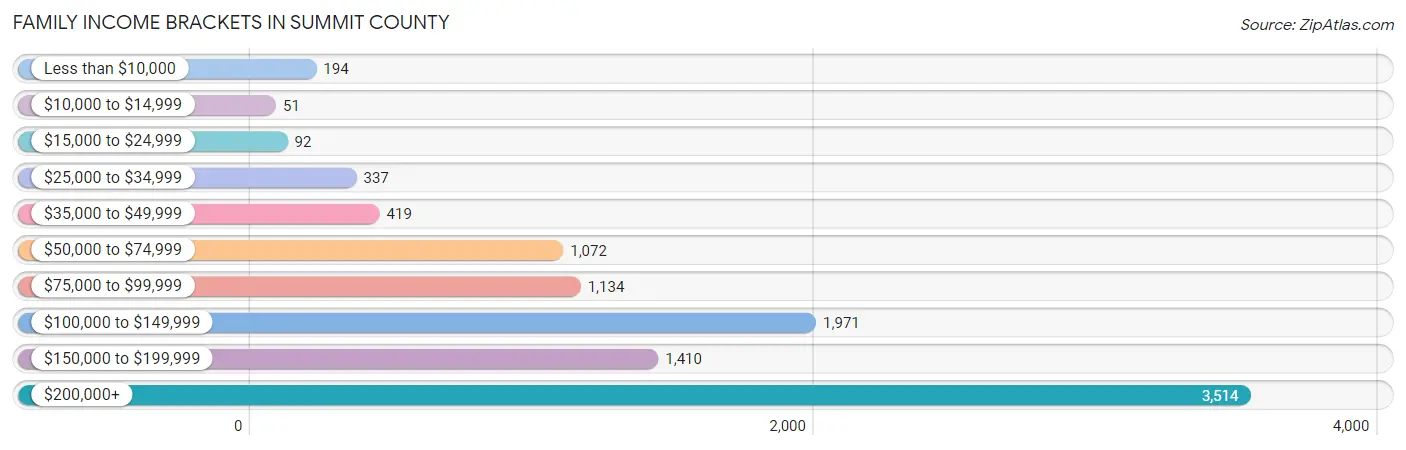
| Income Bracket | # Families | % Families |
| Less than $10,000 | 194 | 1.9% |
| $10,000 to $14,999 | 51 | 0.5% |
| $15,000 to $24,999 | 92 | 0.9% |
| $25,000 to $34,999 | 337 | 3.3% |
| $35,000 to $49,999 | 419 | 4.1% |
| $50,000 to $74,999 | 1,072 | 10.5% |
| $75,000 to $99,999 | 1,134 | 11.1% |
| $100,000 to $149,999 | 1,971 | 19.3% |
| $150,000 to $199,999 | 1,410 | 13.8% |
| $200,000+ | 3,514 | 34.4% |
Family Income by Famaliy Size in Summit County
4-person families (1,665 | 16.3%) account for the highest median family income in Summit County with $188,977 per family, while 2-person families (4,990 | 48.8%) have the highest median income of $68,070 per family member.
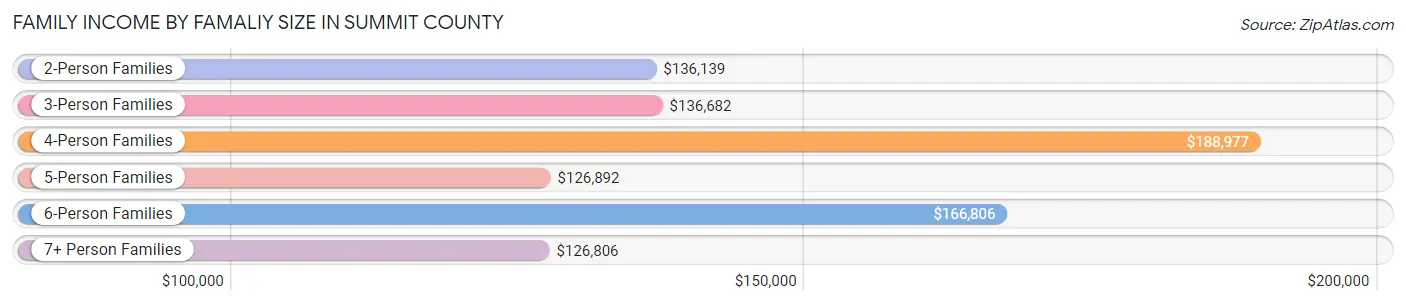
| Income Bracket | # Families | Median Income |
| 2-Person Families | 4,990 (48.8%) | $136,139 |
| 3-Person Families | 2,323 (22.7%) | $136,682 |
| 4-Person Families | 1,665 (16.3%) | $188,977 |
| 5-Person Families | 858 (8.4%) | $126,892 |
| 6-Person Families | 255 (2.5%) | $166,806 |
| 7+ Person Families | 123 (1.2%) | $126,806 |
| Total | 10,214 (100.0%) | $144,118 |
Family Income by Number of Earners in Summit County
The median family income in Summit County is $144,118, with families comprising 3+ earners (1,275) having the highest median family income of $174,083, while families with no earners (1,308) have the lowest median family income of $103,438, accounting for 12.5% and 12.8% of families, respectively.
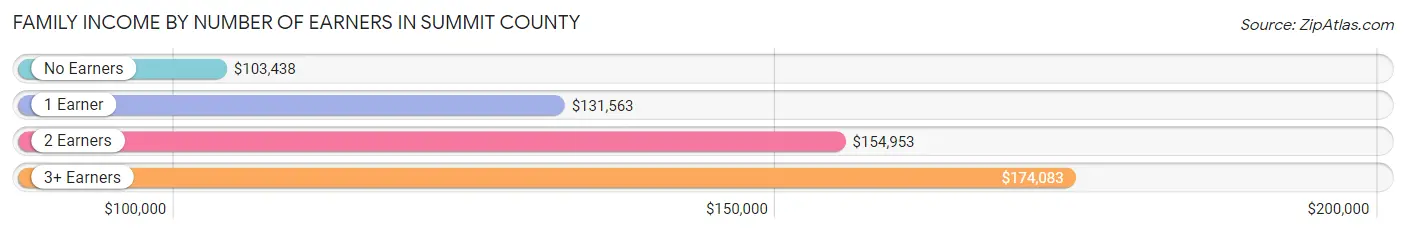
| Number of Earners | # Families | Median Income |
| No Earners | 1,308 (12.8%) | $103,438 |
| 1 Earner | 2,568 (25.1%) | $131,563 |
| 2 Earners | 5,063 (49.6%) | $154,953 |
| 3+ Earners | 1,275 (12.5%) | $174,083 |
| Total | 10,214 (100.0%) | $144,118 |
Household Income in Summit County
Household Income Brackets in Summit County
With 4,042 households falling in the category, the $200,000+ income range is the most frequent in Summit County, accounting for 29.6% of all households. In contrast, only 96 households (0.7%) fall into the $10,000 to $14,999 income bracket, making it the least populous group.
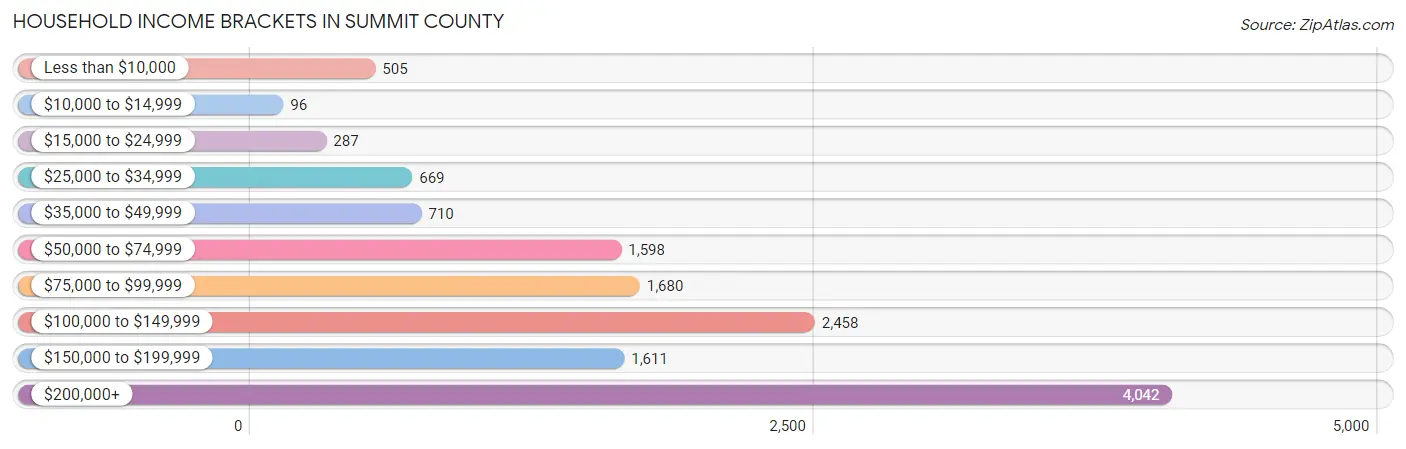
| Income Bracket | # Households | % Households |
| Less than $10,000 | 505 | 3.7% |
| $10,000 to $14,999 | 96 | 0.7% |
| $15,000 to $24,999 | 287 | 2.1% |
| $25,000 to $34,999 | 669 | 4.9% |
| $35,000 to $49,999 | 710 | 5.2% |
| $50,000 to $74,999 | 1,598 | 11.7% |
| $75,000 to $99,999 | 1,680 | 12.3% |
| $100,000 to $149,999 | 2,458 | 18.0% |
| $150,000 to $199,999 | 1,611 | 11.8% |
| $200,000+ | 4,042 | 29.6% |
Household Income by Householder Age in Summit County
The median household income in Summit County is $126,392, with the highest median household income of $145,458 found in the 45 to 64 years age bracket for the primary householder. A total of 6,861 households (50.2%) fall into this category. Meanwhile, the 15 to 24 years age bracket for the primary householder has the lowest median household income of $39,600, with 238 households (1.7%) in this group.
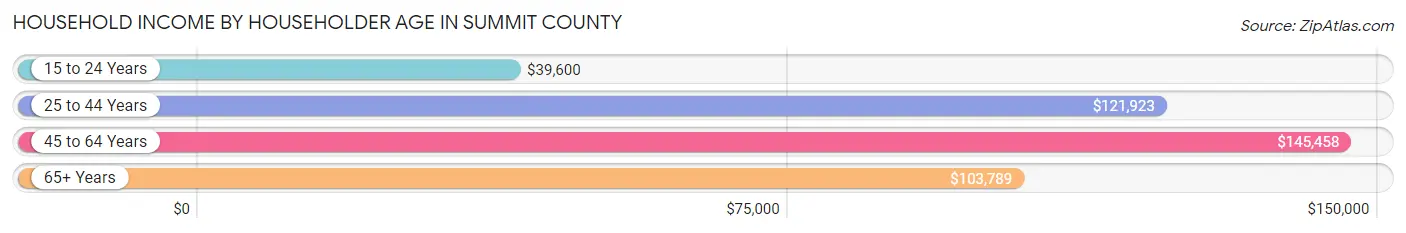
| Income Bracket | # Households | Median Income |
| 15 to 24 Years | 238 (1.7%) | $39,600 |
| 25 to 44 Years | 3,410 (25.0%) | $121,923 |
| 45 to 64 Years | 6,861 (50.2%) | $145,458 |
| 65+ Years | 3,146 (23.0%) | $103,789 |
| Total | 13,655 (100.0%) | $126,392 |
Poverty in Summit County
Income Below Poverty by Sex and Age in Summit County
With 4.9% poverty level for males and 5.6% for females among the residents of Summit County, 18 to 24 year old males and 15 year old females are the most vulnerable to poverty, with 277 males (14.2%) and 32 females (12.9%) in their respective age groups living below the poverty level.
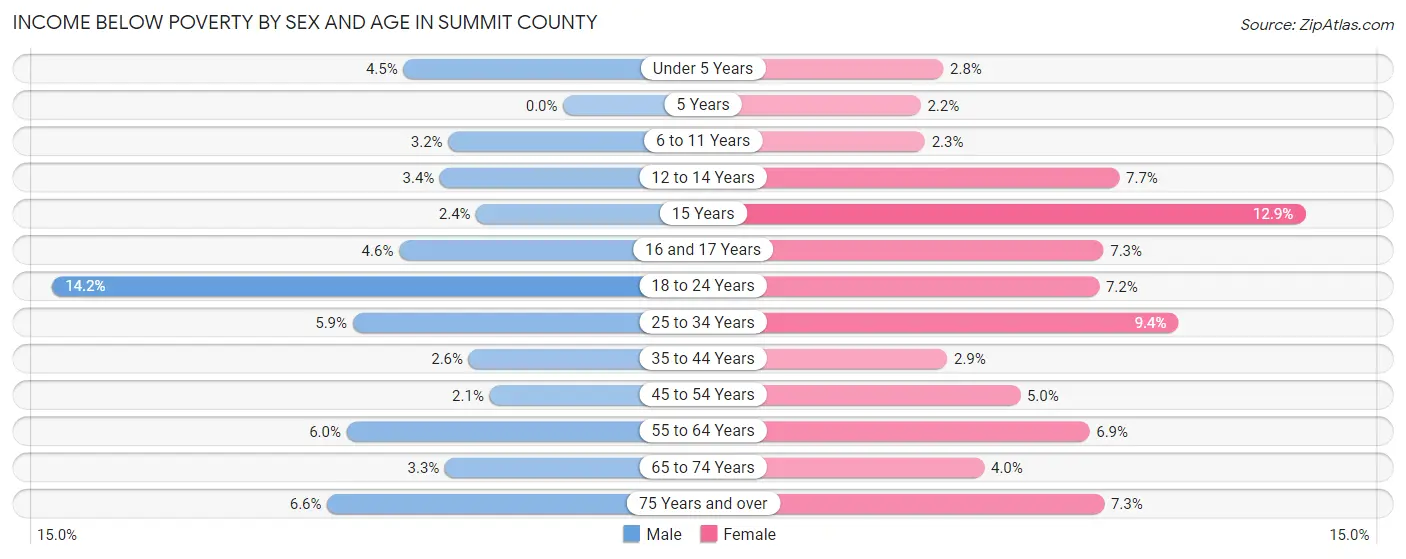
| Age Bracket | Male | Female |
| Under 5 Years | 50 (4.4%) | 29 (2.8%) |
| 5 Years | 0 (0.0%) | 5 (2.2%) |
| 6 to 11 Years | 55 (3.2%) | 41 (2.3%) |
| 12 to 14 Years | 37 (3.4%) | 70 (7.7%) |
| 15 Years | 10 (2.4%) | 32 (12.9%) |
| 16 and 17 Years | 29 (4.6%) | 51 (7.3%) |
| 18 to 24 Years | 277 (14.2%) | 125 (7.2%) |
| 25 to 34 Years | 148 (5.9%) | 207 (9.4%) |
| 35 to 44 Years | 72 (2.6%) | 79 (2.9%) |
| 45 to 54 Years | 67 (2.1%) | 150 (5.0%) |
| 55 to 64 Years | 200 (6.0%) | 212 (6.9%) |
| 65 to 74 Years | 69 (3.3%) | 76 (4.0%) |
| 75 Years and over | 61 (6.6%) | 66 (7.3%) |
| Total | 1,075 (4.9%) | 1,143 (5.6%) |
Income Above Poverty by Sex and Age in Summit County
According to the poverty statistics in Summit County, males aged 5 years and females aged 5 years are the age groups that are most secure financially, with 100.0% of males and 97.8% of females in these age groups living above the poverty line.
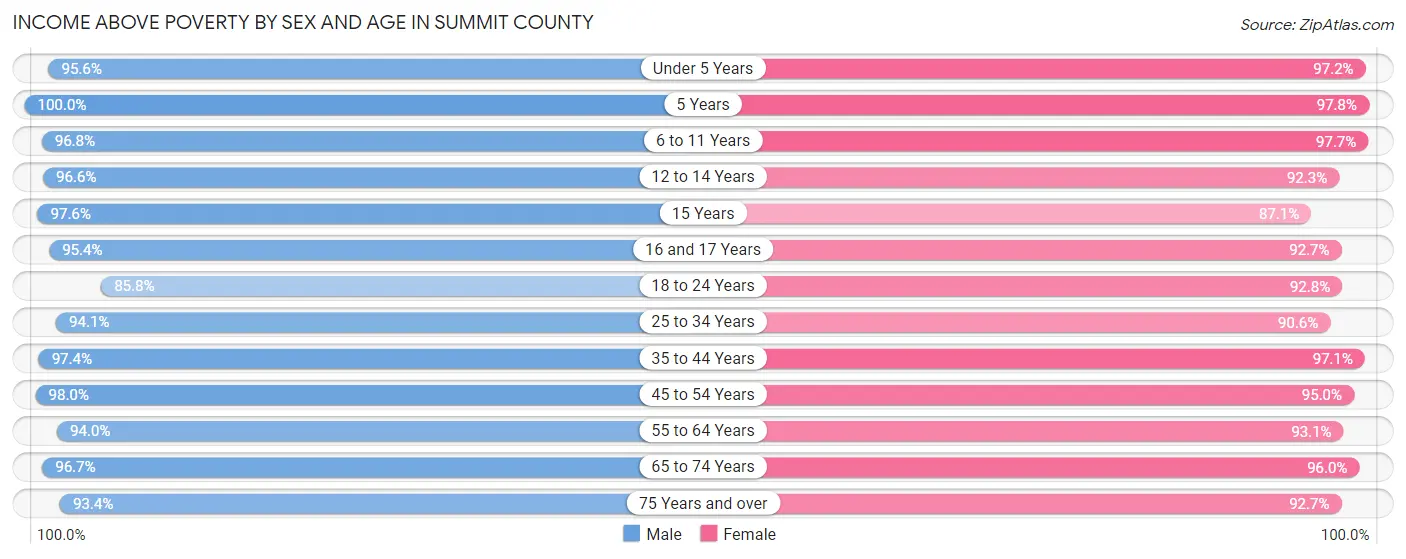
| Age Bracket | Male | Female |
| Under 5 Years | 1,074 (95.6%) | 999 (97.2%) |
| 5 Years | 104 (100.0%) | 223 (97.8%) |
| 6 to 11 Years | 1,662 (96.8%) | 1,736 (97.7%) |
| 12 to 14 Years | 1,041 (96.6%) | 837 (92.3%) |
| 15 Years | 403 (97.6%) | 216 (87.1%) |
| 16 and 17 Years | 606 (95.4%) | 650 (92.7%) |
| 18 to 24 Years | 1,670 (85.8%) | 1,620 (92.8%) |
| 25 to 34 Years | 2,379 (94.1%) | 2,002 (90.6%) |
| 35 to 44 Years | 2,662 (97.4%) | 2,621 (97.1%) |
| 45 to 54 Years | 3,203 (98.0%) | 2,876 (95.0%) |
| 55 to 64 Years | 3,118 (94.0%) | 2,867 (93.1%) |
| 65 to 74 Years | 2,028 (96.7%) | 1,841 (96.0%) |
| 75 Years and over | 868 (93.4%) | 838 (92.7%) |
| Total | 20,818 (95.1%) | 19,326 (94.4%) |
Income Below Poverty Among Married-Couple Families in Summit County
The poverty statistics for married-couple families in Summit County show that 2.6% or 229 of the total 8,738 families live below the poverty line. Families with 3 or 4 children have the highest poverty rate of 3.2%, comprising of 23 families. On the other hand, families with 5 or more children have the lowest poverty rate of 0.0%, which includes 0 families.
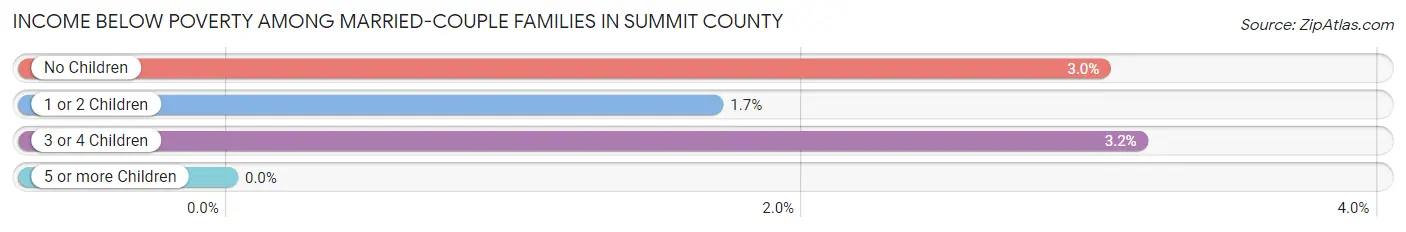
| Children | Above Poverty | Below Poverty |
| No Children | 5,169 (97.0%) | 162 (3.0%) |
| 1 or 2 Children | 2,556 (98.3%) | 44 (1.7%) |
| 3 or 4 Children | 702 (96.8%) | 23 (3.2%) |
| 5 or more Children | 82 (100.0%) | 0 (0.0%) |
| Total | 8,509 (97.4%) | 229 (2.6%) |
Income Below Poverty Among Single-Parent Households in Summit County
According to the poverty data in Summit County, 8.1% or 34 single-father households and 5.3% or 56 single-mother households are living below the poverty line. Among single-father households, those with 3 or 4 children have the highest poverty rate, with 5 households (20.8%) experiencing poverty. Likewise, among single-mother households, those with 5 or more children have the highest poverty rate, with 6 households (100.0%) falling below the poverty line.
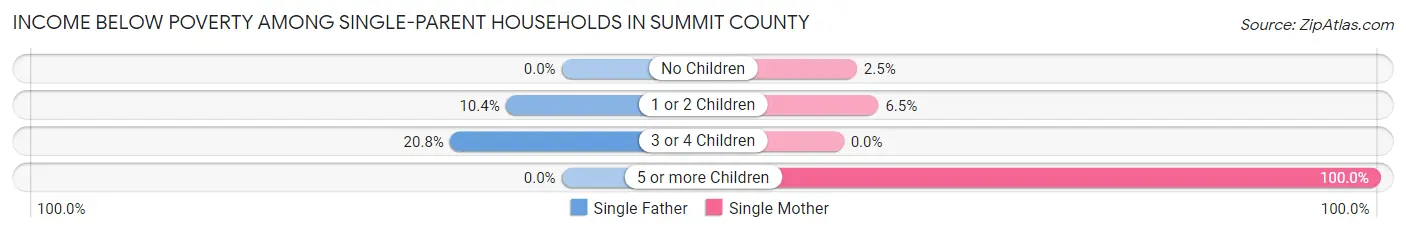
| Children | Single Father | Single Mother |
| No Children | 0 (0.0%) | 8 (2.5%) |
| 1 or 2 Children | 29 (10.4%) | 42 (6.5%) |
| 3 or 4 Children | 5 (20.8%) | 0 (0.0%) |
| 5 or more Children | 0 (0.0%) | 6 (100.0%) |
| Total | 34 (8.1%) | 56 (5.3%) |
Income Below Poverty Among Married-Couple vs Single-Parent Households in Summit County
The poverty data for Summit County shows that 229 of the married-couple family households (2.6%) and 90 of the single-parent households (6.1%) are living below the poverty level. Within the married-couple family households, those with 3 or 4 children have the highest poverty rate, with 23 households (3.2%) falling below the poverty line. Among the single-parent households, those with 5 or more children have the highest poverty rate, with 6 household (100.0%) living below poverty.
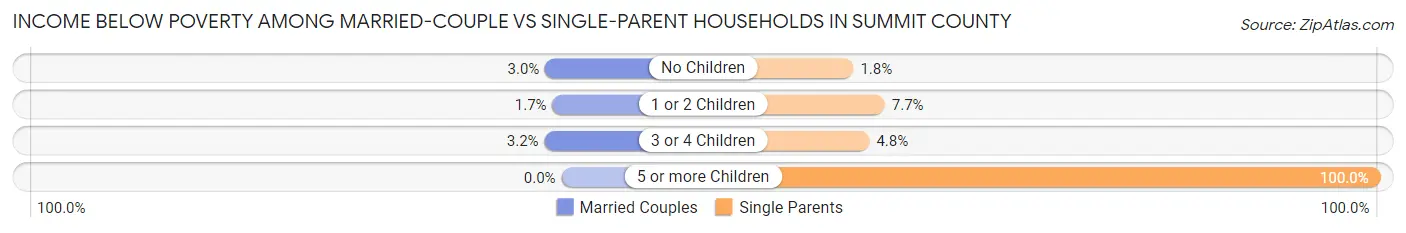
| Children | Married-Couple Families | Single-Parent Households |
| No Children | 162 (3.0%) | 8 (1.8%) |
| 1 or 2 Children | 44 (1.7%) | 71 (7.7%) |
| 3 or 4 Children | 23 (3.2%) | 5 (4.8%) |
| 5 or more Children | 0 (0.0%) | 6 (100.0%) |
| Total | 229 (2.6%) | 90 (6.1%) |
Employment Characteristics in Summit County
Employment by Class of Employer in Summit County
Among the 22,696 employed individuals in Summit County, private company employees (14,042 | 61.9%), self-employed (not incorporated) (2,106 | 9.3%), and not-for-profit organizations (1,940 | 8.6%) make up the most common classes of employment.
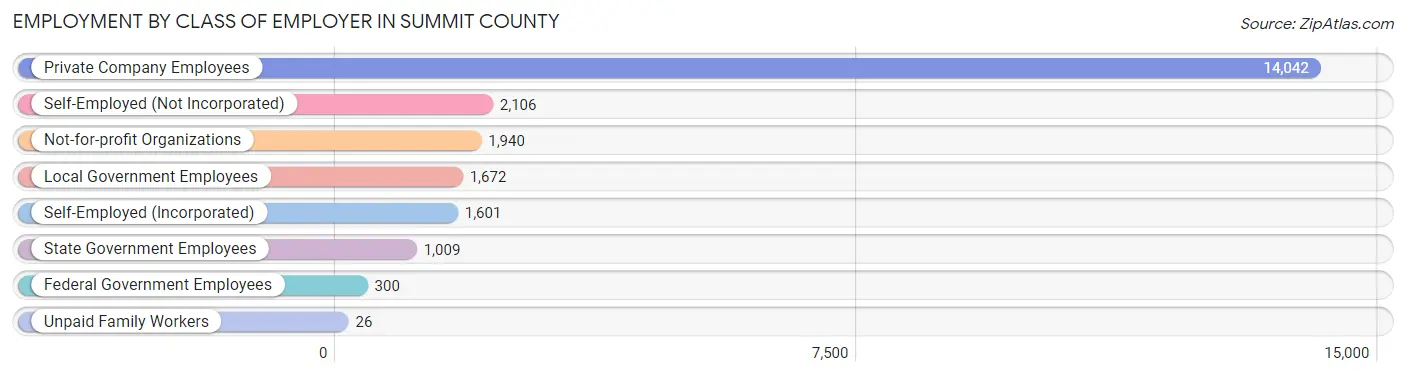
| Employer Class | # Employees | % Employees |
| Private Company Employees | 14,042 | 61.9% |
| Self-Employed (Incorporated) | 1,601 | 7.0% |
| Self-Employed (Not Incorporated) | 2,106 | 9.3% |
| Not-for-profit Organizations | 1,940 | 8.6% |
| Local Government Employees | 1,672 | 7.4% |
| State Government Employees | 1,009 | 4.4% |
| Federal Government Employees | 300 | 1.3% |
| Unpaid Family Workers | 26 | 0.1% |
| Total | 22,696 | 100.0% |
Employment Status by Age in Summit County
According to the labor force statistics for Summit County, out of the total population over 16 years of age (33,848), 69.5% or 23,524 individuals are in the labor force, with 2.3% or 541 of them unemployed. The age group with the highest labor force participation rate is 25 to 29 years, with 87.7% or 2,060 individuals in the labor force. Within the labor force, the 25 to 29 years age range has the highest percentage of unemployed individuals, with 6.1% or 126 of them being unemployed.
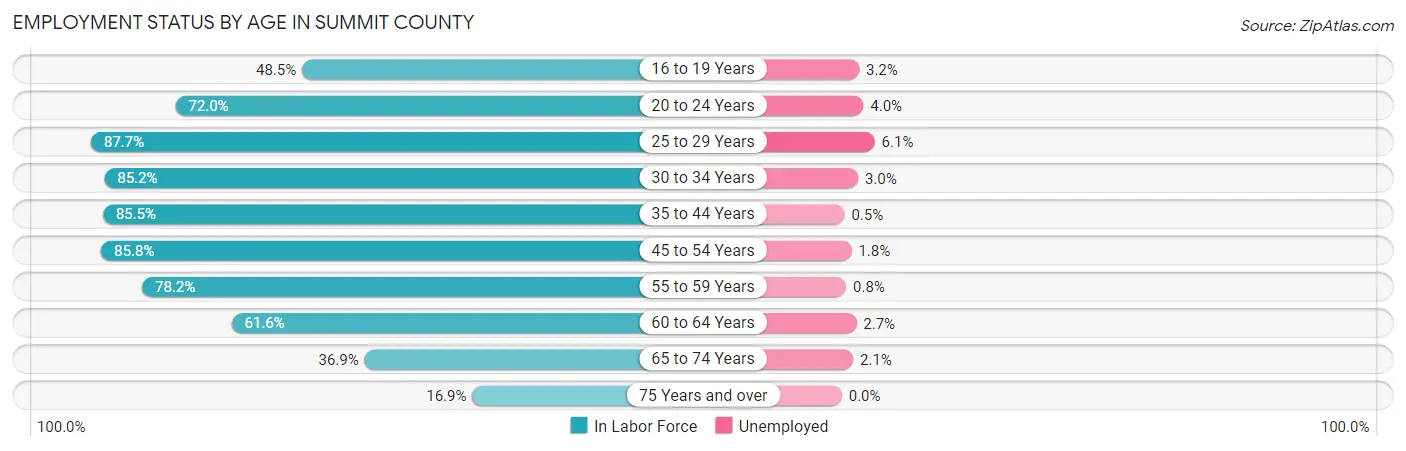
| Age Bracket | In Labor Force | Unemployed |
| 16 to 19 Years | 1,170 (48.5%) | 37 (3.2%) |
| 20 to 24 Years | 1,893 (72.0%) | 76 (4.0%) |
| 25 to 29 Years | 2,060 (87.7%) | 126 (6.1%) |
| 30 to 34 Years | 2,046 (85.2%) | 61 (3.0%) |
| 35 to 44 Years | 4,678 (85.5%) | 23 (0.5%) |
| 45 to 54 Years | 5,419 (85.8%) | 98 (1.8%) |
| 55 to 59 Years | 2,387 (78.2%) | 19 (0.8%) |
| 60 to 64 Years | 2,067 (61.6%) | 56 (2.7%) |
| 65 to 74 Years | 1,483 (36.9%) | 31 (2.1%) |
| 75 Years and over | 311 (16.9%) | 0 (0.0%) |
| Total | 23,524 (69.5%) | 541 (2.3%) |
Employment Status by Educational Attainment in Summit County
According to labor force statistics for Summit County, 81.3% of individuals (18,655) out of the total population between 25 and 64 years of age (22,946) are in the labor force, with 2.1% or 392 of them being unemployed. The group with the highest labor force participation rate are those with the educational attainment of bachelor's degree or higher, with 83.9% or 10,977 individuals in the labor force. Within the labor force, individuals with less than high school education have the highest percentage of unemployment, with 3.0% or 20 of them being unemployed.
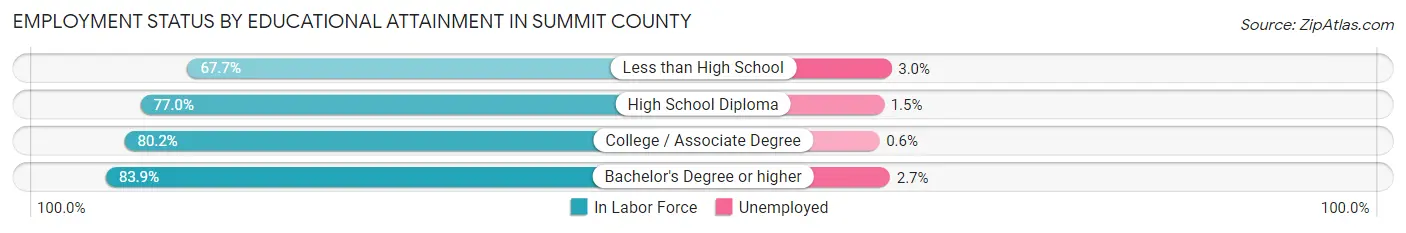
| Educational Attainment | In Labor Force | Unemployed |
| Less than High School | 670 (67.7%) | 30 (3.0%) |
| High School Diploma | 2,717 (77.0%) | 53 (1.5%) |
| College / Associate Degree | 4,287 (80.2%) | 32 (0.6%) |
| Bachelor's Degree or higher | 10,977 (83.9%) | 353 (2.7%) |
| Total | 18,655 (81.3%) | 482 (2.1%) |
Employment Occupations by Sex in Summit County
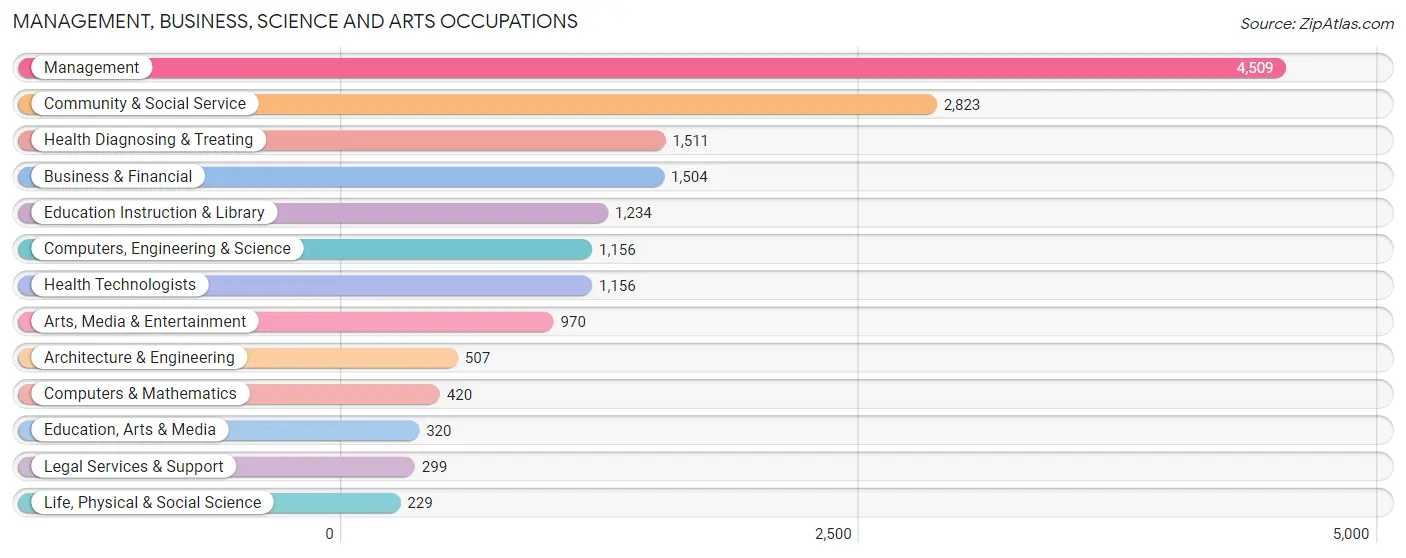
Management, Business, Science and Arts Occupations
The most common Management, Business, Science and Arts occupations in Summit County are Management (4,509 | 19.6%), Community & Social Service (2,823 | 12.3%), Health Diagnosing & Treating (1,511 | 6.6%), Business & Financial (1,504 | 6.6%), and Education Instruction & Library (1,234 | 5.4%).
Management, Business, Science and Arts Occupations by Sex
Within the Management, Business, Science and Arts occupations in Summit County, the most male-oriented occupations are Architecture & Engineering (91.7%), Computers, Engineering & Science (76.6%), and Computers & Mathematics (75.7%), while the most female-oriented occupations are Education Instruction & Library (77.2%), Health Diagnosing & Treating (65.2%), and Health Technologists (64.6%).
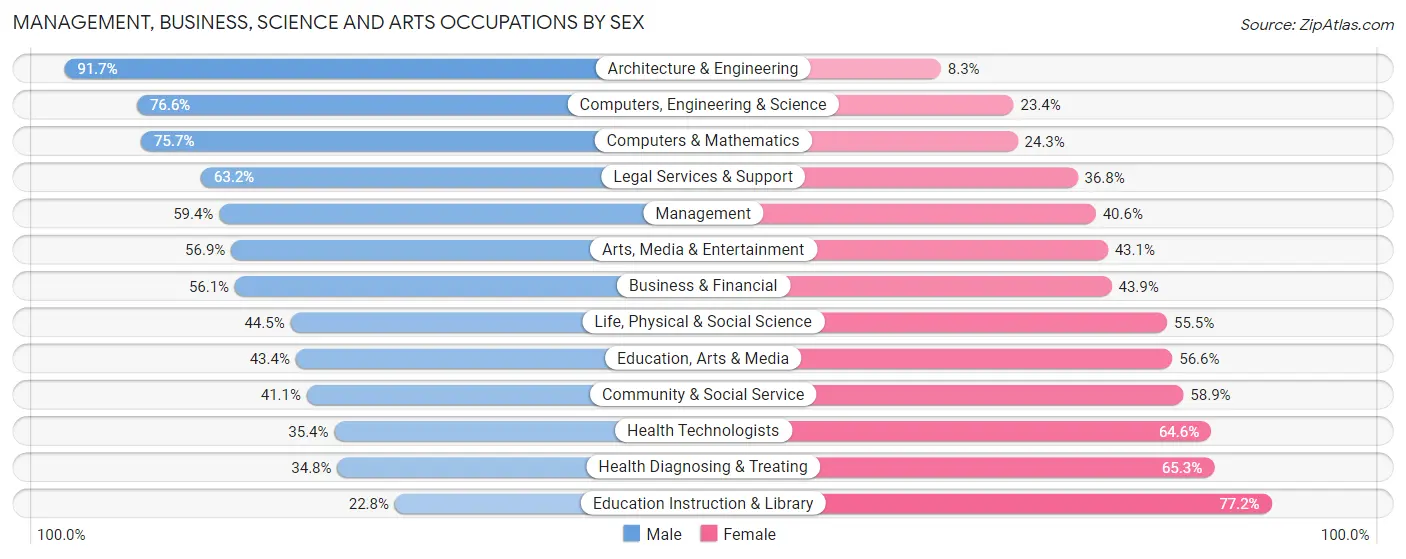
| Occupation | Male | Female |
| Management | 2,679 (59.4%) | 1,830 (40.6%) |
| Business & Financial | 844 (56.1%) | 660 (43.9%) |
| Computers, Engineering & Science | 885 (76.6%) | 271 (23.4%) |
| Computers & Mathematics | 318 (75.7%) | 102 (24.3%) |
| Architecture & Engineering | 465 (91.7%) | 42 (8.3%) |
| Life, Physical & Social Science | 102 (44.5%) | 127 (55.5%) |
| Community & Social Service | 1,161 (41.1%) | 1,662 (58.9%) |
| Education, Arts & Media | 139 (43.4%) | 181 (56.6%) |
| Legal Services & Support | 189 (63.2%) | 110 (36.8%) |
| Education Instruction & Library | 281 (22.8%) | 953 (77.2%) |
| Arts, Media & Entertainment | 552 (56.9%) | 418 (43.1%) |
| Health Diagnosing & Treating | 525 (34.7%) | 986 (65.2%) |
| Health Technologists | 409 (35.4%) | 747 (64.6%) |
| Total (Category) | 6,094 (53.0%) | 5,409 (47.0%) |
| Total (Overall) | 12,737 (55.5%) | 10,225 (44.5%) |
Services Occupations
The most common Services occupations in Summit County are Food Preparation & Serving (1,205 | 5.2%), Cleaning & Maintenance (1,020 | 4.4%), Personal Care & Service (737 | 3.2%), Security & Protection (456 | 2.0%), and Firefighting & Prevention (287 | 1.3%).
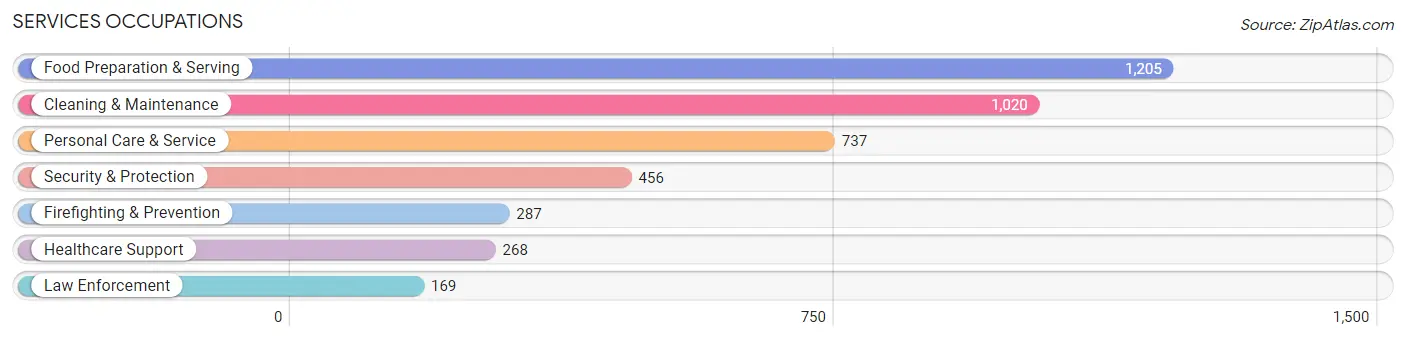
Services Occupations by Sex
Within the Services occupations in Summit County, the most male-oriented occupations are Law Enforcement (84.6%), Security & Protection (75.7%), and Firefighting & Prevention (70.4%), while the most female-oriented occupations are Healthcare Support (71.3%), Personal Care & Service (63.5%), and Food Preparation & Serving (52.0%).
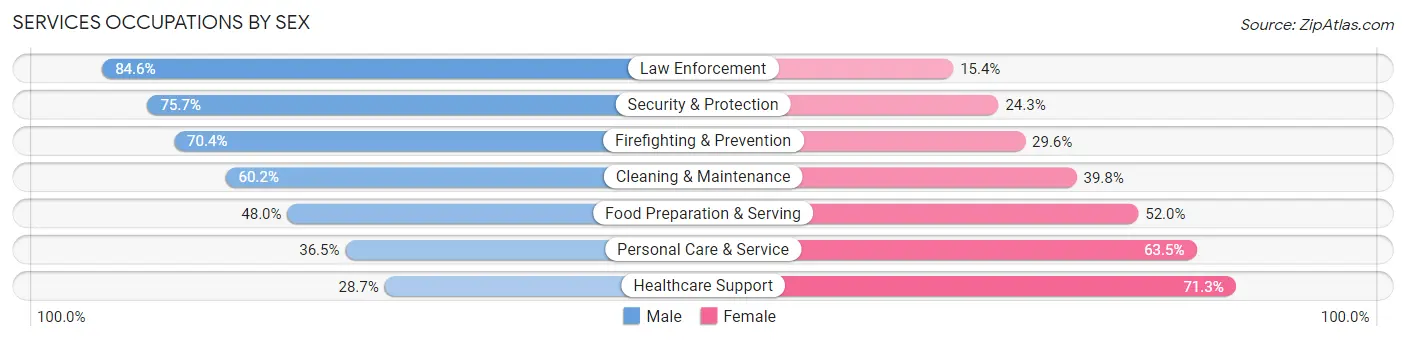
| Occupation | Male | Female |
| Healthcare Support | 77 (28.7%) | 191 (71.3%) |
| Security & Protection | 345 (75.7%) | 111 (24.3%) |
| Firefighting & Prevention | 202 (70.4%) | 85 (29.6%) |
| Law Enforcement | 143 (84.6%) | 26 (15.4%) |
| Food Preparation & Serving | 578 (48.0%) | 627 (52.0%) |
| Cleaning & Maintenance | 614 (60.2%) | 406 (39.8%) |
| Personal Care & Service | 269 (36.5%) | 468 (63.5%) |
| Total (Category) | 1,883 (51.1%) | 1,803 (48.9%) |
| Total (Overall) | 12,737 (55.5%) | 10,225 (44.5%) |
Sales and Office Occupations
The most common Sales and Office occupations in Summit County are Sales & Related (2,933 | 12.8%), and Office & Administration (1,951 | 8.5%).
Sales and Office Occupations by Sex
| Occupation | Male | Female |
| Sales & Related | 1,772 (60.4%) | 1,161 (39.6%) |
| Office & Administration | 467 (23.9%) | 1,484 (76.1%) |
| Total (Category) | 2,239 (45.8%) | 2,645 (54.2%) |
| Total (Overall) | 12,737 (55.5%) | 10,225 (44.5%) |
Natural Resources, Construction and Maintenance Occupations
The most common Natural Resources, Construction and Maintenance occupations in Summit County are Construction & Extraction (919 | 4.0%), Installation, Maintenance & Repair (468 | 2.0%), and Farming, Fishing & Forestry (62 | 0.3%).
Natural Resources, Construction and Maintenance Occupations by Sex
| Occupation | Male | Female |
| Farming, Fishing & Forestry | 44 (71.0%) | 18 (29.0%) |
| Construction & Extraction | 916 (99.7%) | 3 (0.3%) |
| Installation, Maintenance & Repair | 427 (91.2%) | 41 (8.8%) |
| Total (Category) | 1,387 (95.7%) | 62 (4.3%) |
| Total (Overall) | 12,737 (55.5%) | 10,225 (44.5%) |
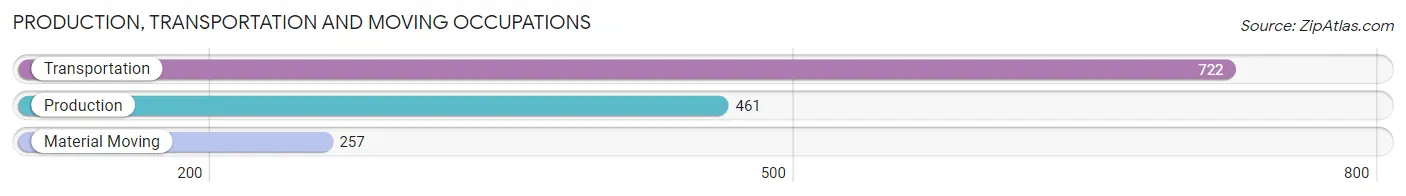
Production, Transportation and Moving Occupations
The most common Production, Transportation and Moving occupations in Summit County are Transportation (722 | 3.1%), Production (461 | 2.0%), and Material Moving (257 | 1.1%).
Production, Transportation and Moving Occupations by Sex
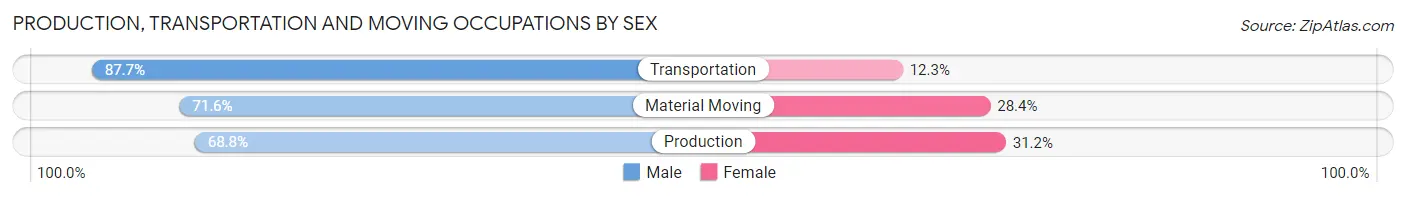
| Occupation | Male | Female |
| Production | 317 (68.8%) | 144 (31.2%) |
| Transportation | 633 (87.7%) | 89 (12.3%) |
| Material Moving | 184 (71.6%) | 73 (28.4%) |
| Total (Category) | 1,134 (78.7%) | 306 (21.2%) |
| Total (Overall) | 12,737 (55.5%) | 10,225 (44.5%) |
Employment Industries by Sex in Summit County
Employment Industries in Summit County
The major employment industries in Summit County include Educational Services (2,324 | 10.1%), Professional & Scientific (2,317 | 10.1%), Health Care & Social Assistance (2,226 | 9.7%), Retail Trade (2,210 | 9.6%), and Construction (1,769 | 7.7%).
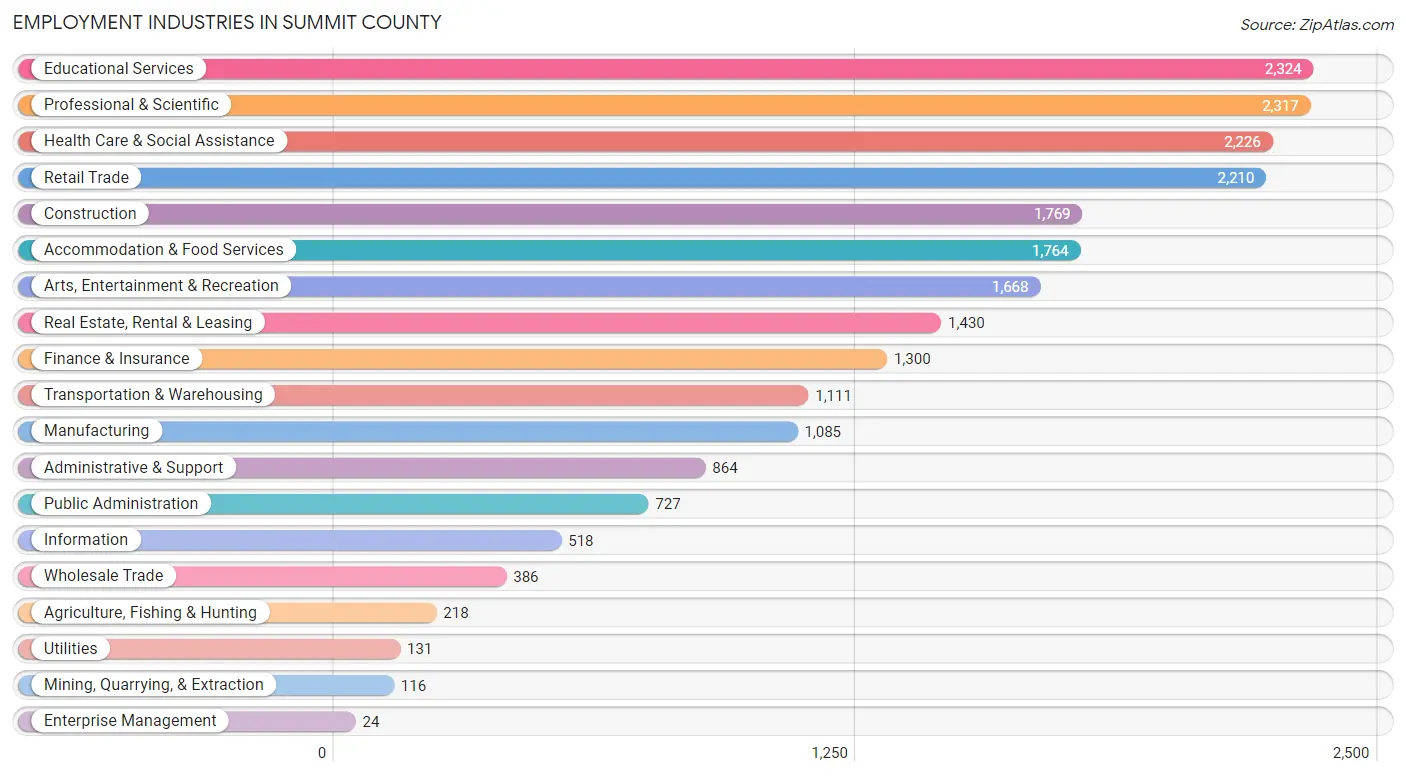
Employment Industries by Sex in Summit County
The Summit County industries that see more men than women are Wholesale Trade (91.7%), Construction (89.6%), and Agriculture, Fishing & Hunting (83.9%), whereas the industries that tend to have a higher number of women are Health Care & Social Assistance (73.1%), Educational Services (68.6%), and Mining, Quarrying, & Extraction (68.1%).
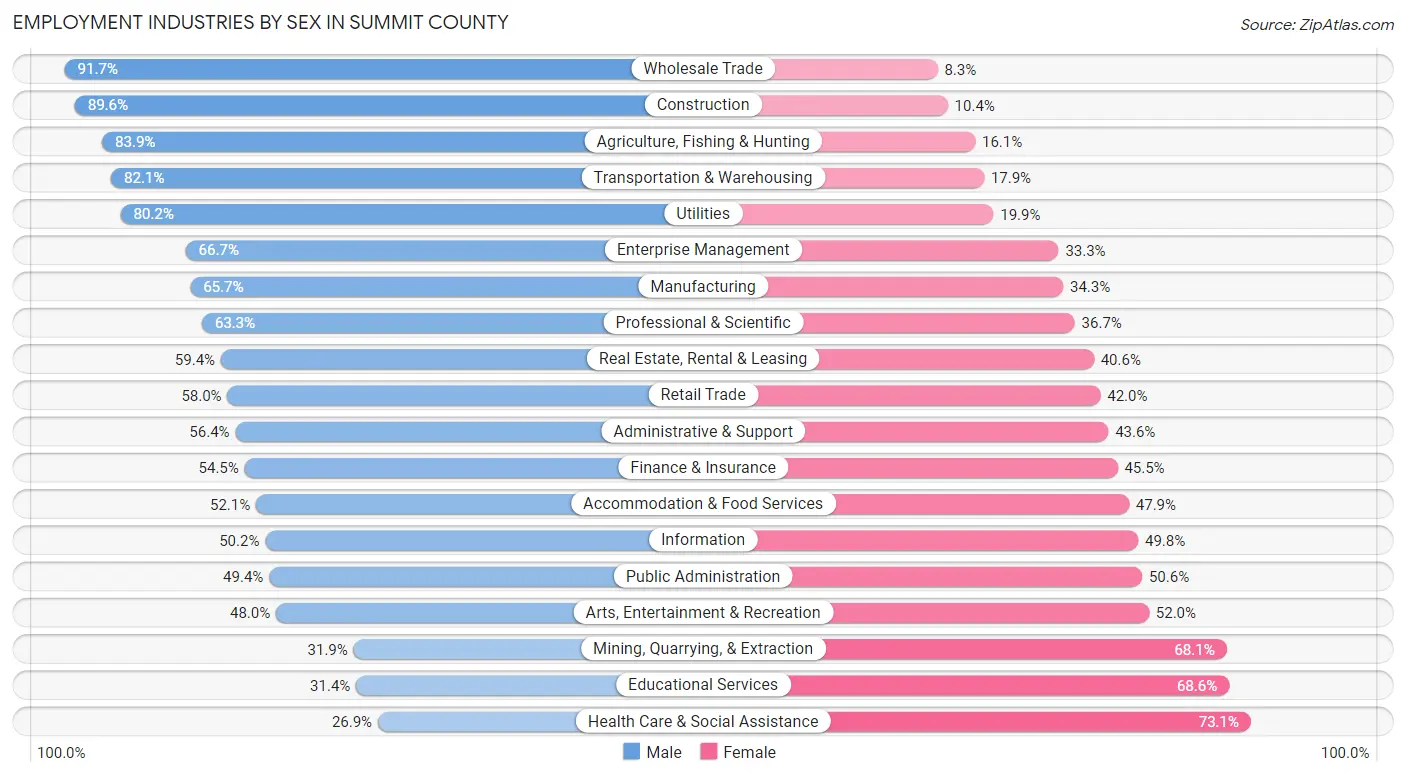
| Industry | Male | Female |
| Agriculture, Fishing & Hunting | 183 (83.9%) | 35 (16.1%) |
| Mining, Quarrying, & Extraction | 37 (31.9%) | 79 (68.1%) |
| Construction | 1,585 (89.6%) | 184 (10.4%) |
| Manufacturing | 713 (65.7%) | 372 (34.3%) |
| Wholesale Trade | 354 (91.7%) | 32 (8.3%) |
| Retail Trade | 1,282 (58.0%) | 928 (42.0%) |
| Transportation & Warehousing | 912 (82.1%) | 199 (17.9%) |
| Utilities | 105 (80.1%) | 26 (19.9%) |
| Information | 260 (50.2%) | 258 (49.8%) |
| Finance & Insurance | 708 (54.5%) | 592 (45.5%) |
| Real Estate, Rental & Leasing | 849 (59.4%) | 581 (40.6%) |
| Professional & Scientific | 1,467 (63.3%) | 850 (36.7%) |
| Enterprise Management | 16 (66.7%) | 8 (33.3%) |
| Administrative & Support | 487 (56.4%) | 377 (43.6%) |
| Educational Services | 729 (31.4%) | 1,595 (68.6%) |
| Health Care & Social Assistance | 598 (26.9%) | 1,628 (73.1%) |
| Arts, Entertainment & Recreation | 800 (48.0%) | 868 (52.0%) |
| Accommodation & Food Services | 919 (52.1%) | 845 (47.9%) |
| Public Administration | 359 (49.4%) | 368 (50.6%) |
| Total | 12,737 (55.5%) | 10,225 (44.5%) |
Education in Summit County
School Enrollment in Summit County
The most common levels of schooling among the 11,429 students in Summit County are high school (2,999 | 26.2%), middle school (2,530 | 22.1%), and college / undergraduate (2,248 | 19.7%).
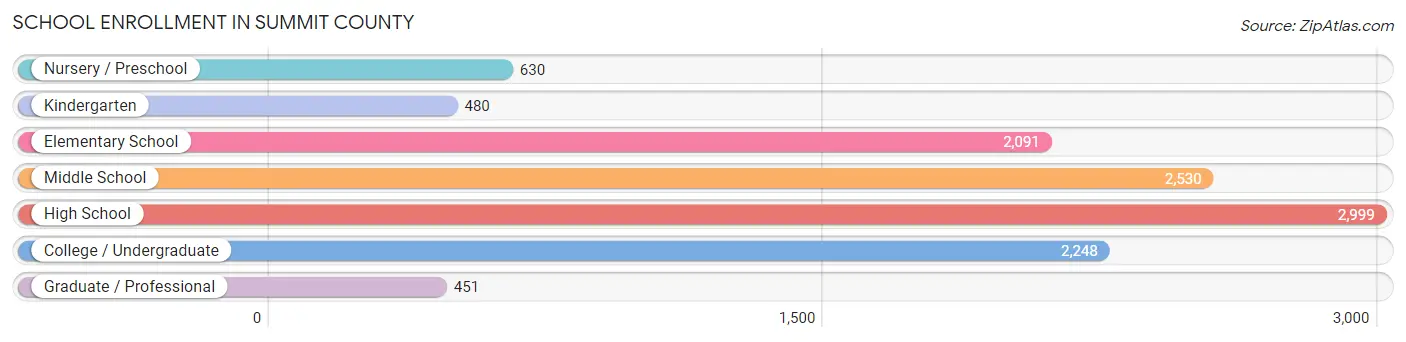
| School Level | # Students | % Students |
| Nursery / Preschool | 630 | 5.5% |
| Kindergarten | 480 | 4.2% |
| Elementary School | 2,091 | 18.3% |
| Middle School | 2,530 | 22.1% |
| High School | 2,999 | 26.2% |
| College / Undergraduate | 2,248 | 19.7% |
| Graduate / Professional | 451 | 4.0% |
| Total | 11,429 | 100.0% |
School Enrollment by Age by Funding Source in Summit County
Out of a total of 11,429 students who are enrolled in schools in Summit County, 1,566 (13.7%) attend a private institution, while the remaining 9,863 (86.3%) are enrolled in public schools. The age group of 3 to 4 year olds has the highest likelihood of being enrolled in private schools, with 204 (37.0% in the age bracket) enrolled. Conversely, the age group of 5 to 9 year old has the lowest likelihood of being enrolled in a private school, with 2,301 (95.1% in the age bracket) attending a public institution.
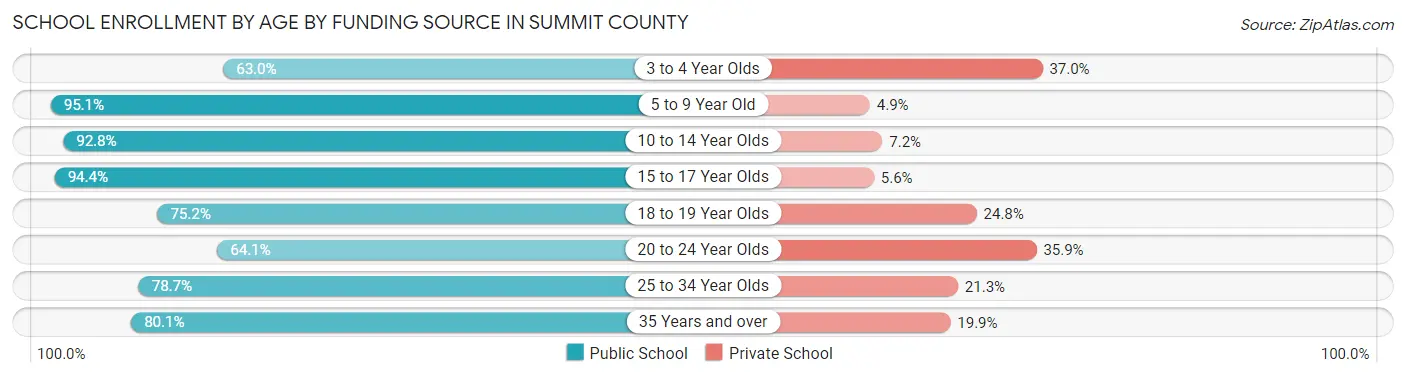
| Age Bracket | Public School | Private School |
| 3 to 4 Year Olds | 347 (63.0%) | 204 (37.0%) |
| 5 to 9 Year Old | 2,301 (95.1%) | 118 (4.9%) |
| 10 to 14 Year Olds | 3,026 (92.8%) | 235 (7.2%) |
| 15 to 17 Year Olds | 1,865 (94.4%) | 111 (5.6%) |
| 18 to 19 Year Olds | 626 (75.2%) | 206 (24.8%) |
| 20 to 24 Year Olds | 821 (64.1%) | 460 (35.9%) |
| 25 to 34 Year Olds | 370 (78.7%) | 100 (21.3%) |
| 35 Years and over | 512 (80.1%) | 127 (19.9%) |
| Total | 9,863 (86.3%) | 1,566 (13.7%) |
Educational Attainment by Field of Study in Summit County
Business (3,714 | 20.7%), social sciences (1,778 | 9.9%), science & technology (1,559 | 8.7%), education (1,530 | 8.5%), and bio, nature & agricultural (1,439 | 8.0%) are the most common fields of study among 17,958 individuals in Summit County who have obtained a bachelor's degree or higher.
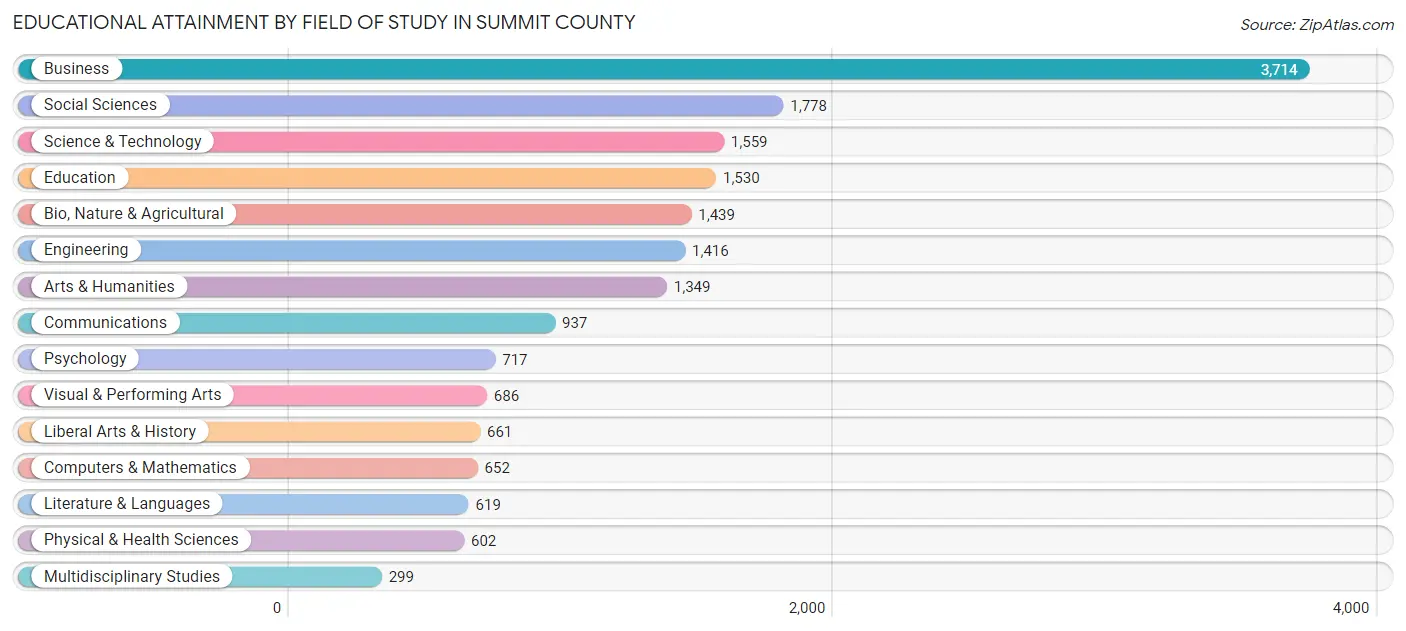
| Field of Study | # Graduates | % Graduates |
| Computers & Mathematics | 652 | 3.6% |
| Bio, Nature & Agricultural | 1,439 | 8.0% |
| Physical & Health Sciences | 602 | 3.4% |
| Psychology | 717 | 4.0% |
| Social Sciences | 1,778 | 9.9% |
| Engineering | 1,416 | 7.9% |
| Multidisciplinary Studies | 299 | 1.7% |
| Science & Technology | 1,559 | 8.7% |
| Business | 3,714 | 20.7% |
| Education | 1,530 | 8.5% |
| Literature & Languages | 619 | 3.5% |
| Liberal Arts & History | 661 | 3.7% |
| Visual & Performing Arts | 686 | 3.8% |
| Communications | 937 | 5.2% |
| Arts & Humanities | 1,349 | 7.5% |
| Total | 17,958 | 100.0% |
Transportation & Commute in Summit County
Vehicle Availability by Sex in Summit County
The most prevalent vehicle ownership categories in Summit County are males with 2 vehicles (4,747, accounting for 37.6%) and females with 2 vehicles (3,640, making up 47.6%).
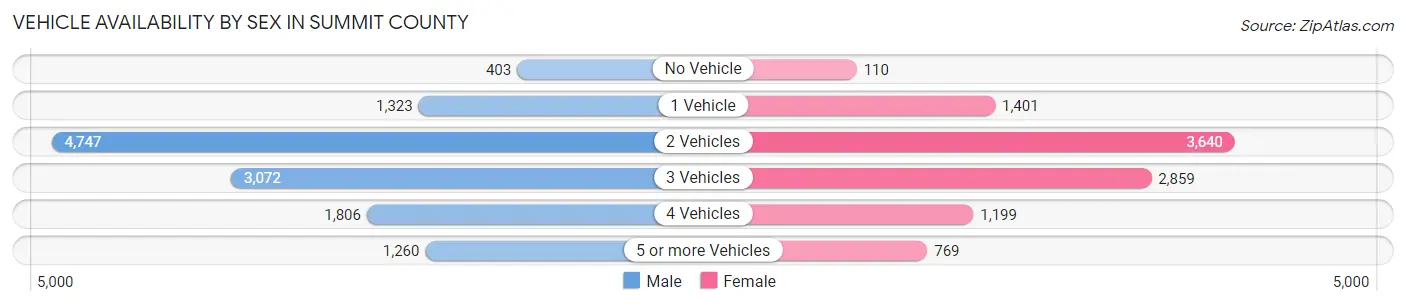
| Vehicles Available | Male | Female |
| No Vehicle | 403 (3.2%) | 110 (1.1%) |
| 1 Vehicle | 1,323 (10.5%) | 1,401 (14.0%) |
| 2 Vehicles | 4,747 (37.6%) | 3,640 (36.5%) |
| 3 Vehicles | 3,072 (24.4%) | 2,859 (28.6%) |
| 4 Vehicles | 1,806 (14.3%) | 1,199 (12.0%) |
| 5 or more Vehicles | 1,260 (10.0%) | 769 (7.7%) |
| Total | 12,611 (100.0%) | 9,978 (100.0%) |
Commute Time in Summit County
The most frequently occuring commute durations in Summit County are 30 to 34 minutes (2,742 commuters, 15.1%), 5 to 9 minutes (2,612 commuters, 14.4%), and 10 to 14 minutes (2,478 commuters, 13.7%).
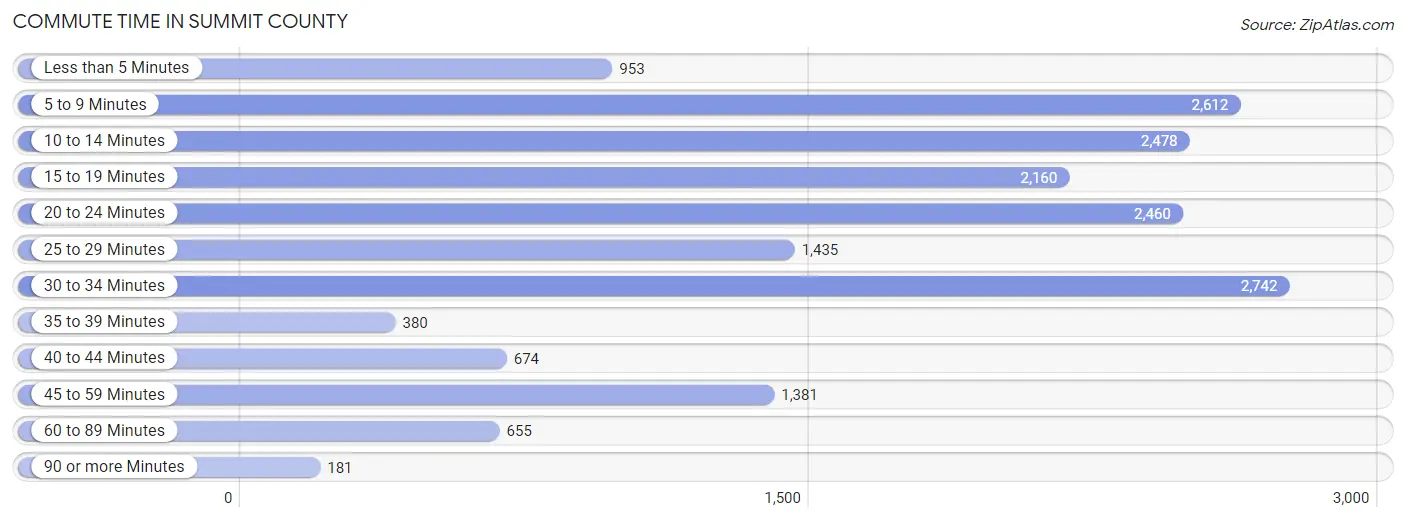
| Commute Time | # Commuters | % Commuters |
| Less than 5 Minutes | 953 | 5.3% |
| 5 to 9 Minutes | 2,612 | 14.4% |
| 10 to 14 Minutes | 2,478 | 13.7% |
| 15 to 19 Minutes | 2,160 | 11.9% |
| 20 to 24 Minutes | 2,460 | 13.6% |
| 25 to 29 Minutes | 1,435 | 7.9% |
| 30 to 34 Minutes | 2,742 | 15.1% |
| 35 to 39 Minutes | 380 | 2.1% |
| 40 to 44 Minutes | 674 | 3.7% |
| 45 to 59 Minutes | 1,381 | 7.6% |
| 60 to 89 Minutes | 655 | 3.6% |
| 90 or more Minutes | 181 | 1.0% |
Commute Time by Sex in Summit County
The most common commute times in Summit County are 30 to 34 minutes (1,815 commuters, 17.9%) for males and 5 to 9 minutes (1,376 commuters, 17.3%) for females.
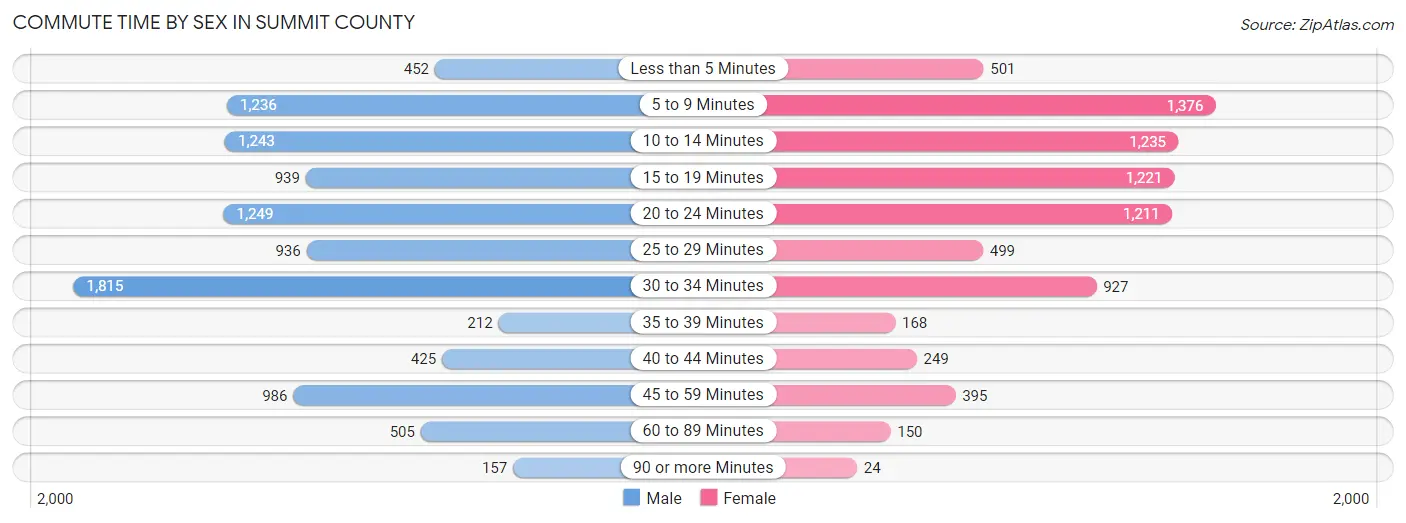
| Commute Time | Male | Female |
| Less than 5 Minutes | 452 (4.4%) | 501 (6.3%) |
| 5 to 9 Minutes | 1,236 (12.2%) | 1,376 (17.3%) |
| 10 to 14 Minutes | 1,243 (12.2%) | 1,235 (15.5%) |
| 15 to 19 Minutes | 939 (9.2%) | 1,221 (15.3%) |
| 20 to 24 Minutes | 1,249 (12.3%) | 1,211 (15.2%) |
| 25 to 29 Minutes | 936 (9.2%) | 499 (6.3%) |
| 30 to 34 Minutes | 1,815 (17.9%) | 927 (11.7%) |
| 35 to 39 Minutes | 212 (2.1%) | 168 (2.1%) |
| 40 to 44 Minutes | 425 (4.2%) | 249 (3.1%) |
| 45 to 59 Minutes | 986 (9.7%) | 395 (5.0%) |
| 60 to 89 Minutes | 505 (5.0%) | 150 (1.9%) |
| 90 or more Minutes | 157 (1.5%) | 24 (0.3%) |
Time of Departure to Work by Sex in Summit County
The most frequent times of departure to work in Summit County are 7:00 AM to 7:29 AM (1,779, 17.5%) for males and 7:30 AM to 7:59 AM (1,117, 14.0%) for females.
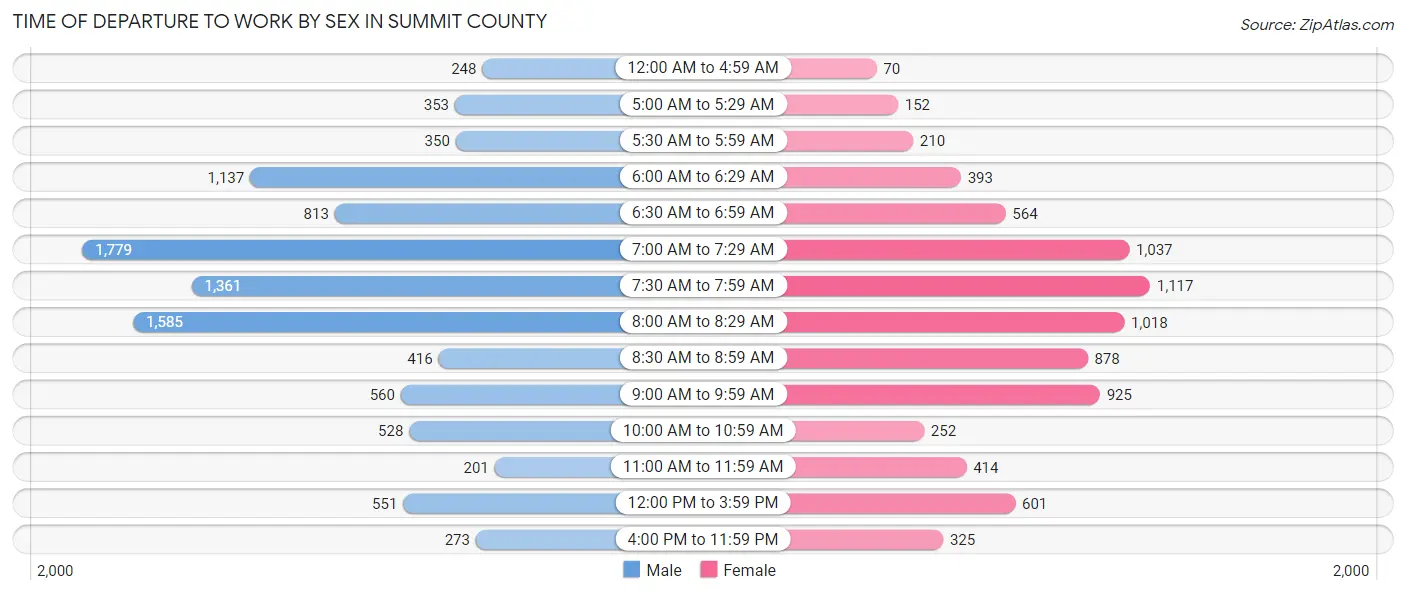
| Time of Departure | Male | Female |
| 12:00 AM to 4:59 AM | 248 (2.4%) | 70 (0.9%) |
| 5:00 AM to 5:29 AM | 353 (3.5%) | 152 (1.9%) |
| 5:30 AM to 5:59 AM | 350 (3.5%) | 210 (2.6%) |
| 6:00 AM to 6:29 AM | 1,137 (11.2%) | 393 (4.9%) |
| 6:30 AM to 6:59 AM | 813 (8.0%) | 564 (7.1%) |
| 7:00 AM to 7:29 AM | 1,779 (17.5%) | 1,037 (13.0%) |
| 7:30 AM to 7:59 AM | 1,361 (13.4%) | 1,117 (14.0%) |
| 8:00 AM to 8:29 AM | 1,585 (15.6%) | 1,018 (12.8%) |
| 8:30 AM to 8:59 AM | 416 (4.1%) | 878 (11.0%) |
| 9:00 AM to 9:59 AM | 560 (5.5%) | 925 (11.6%) |
| 10:00 AM to 10:59 AM | 528 (5.2%) | 252 (3.2%) |
| 11:00 AM to 11:59 AM | 201 (2.0%) | 414 (5.2%) |
| 12:00 PM to 3:59 PM | 551 (5.4%) | 601 (7.5%) |
| 4:00 PM to 11:59 PM | 273 (2.7%) | 325 (4.1%) |
| Total | 10,155 (100.0%) | 7,956 (100.0%) |
Housing Occupancy in Summit County
Occupancy by Ownership in Summit County
Of the total 13,655 dwellings in Summit County, owner-occupied units account for 11,058 (81.0%), while renter-occupied units make up 2,597 (19.0%).
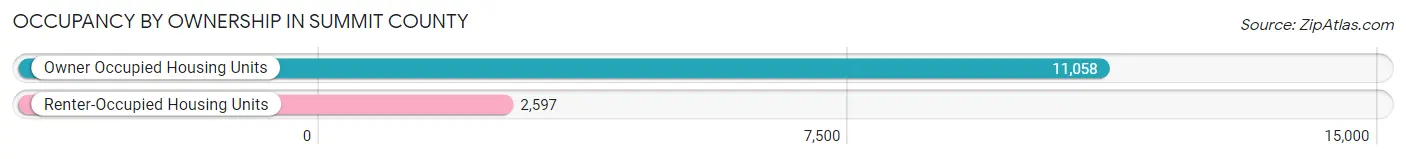
| Occupancy | # Housing Units | % Housing Units |
| Owner Occupied Housing Units | 11,058 | 81.0% |
| Renter-Occupied Housing Units | 2,597 | 19.0% |
| Total Occupied Housing Units | 13,655 | 100.0% |
Occupancy by Household Size in Summit County
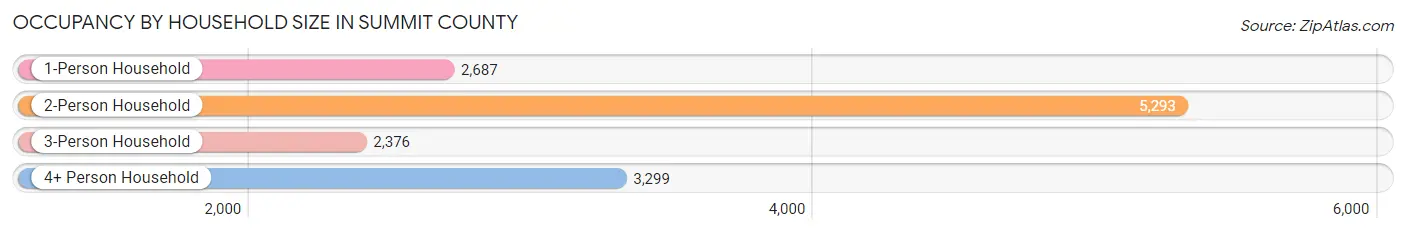
| Household Size | # Housing Units | % Housing Units |
| 1-Person Household | 2,687 | 19.7% |
| 2-Person Household | 5,293 | 38.8% |
| 3-Person Household | 2,376 | 17.4% |
| 4+ Person Household | 3,299 | 24.2% |
| Total Housing Units | 13,655 | 100.0% |
Occupancy by Ownership by Household Size in Summit County
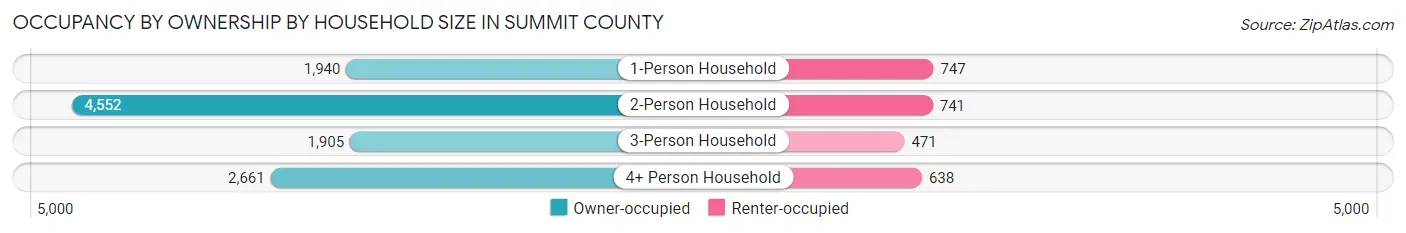
| Household Size | Owner-occupied | Renter-occupied |
| 1-Person Household | 1,940 (72.2%) | 747 (27.8%) |
| 2-Person Household | 4,552 (86.0%) | 741 (14.0%) |
| 3-Person Household | 1,905 (80.2%) | 471 (19.8%) |
| 4+ Person Household | 2,661 (80.7%) | 638 (19.3%) |
| Total Housing Units | 11,058 (81.0%) | 2,597 (19.0%) |
Occupancy by Educational Attainment in Summit County
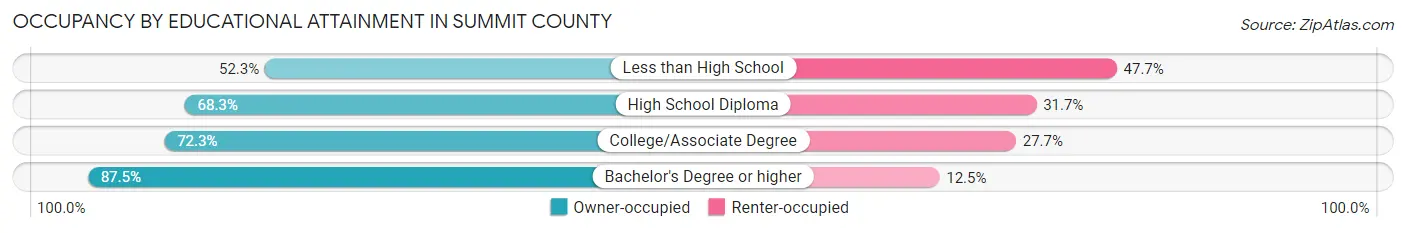
| Household Size | Owner-occupied | Renter-occupied |
| Less than High School | 191 (52.3%) | 174 (47.7%) |
| High School Diploma | 1,175 (68.3%) | 546 (31.7%) |
| College/Associate Degree | 2,043 (72.3%) | 782 (27.7%) |
| Bachelor's Degree or higher | 7,649 (87.5%) | 1,095 (12.5%) |
Occupancy by Age of Householder in Summit County
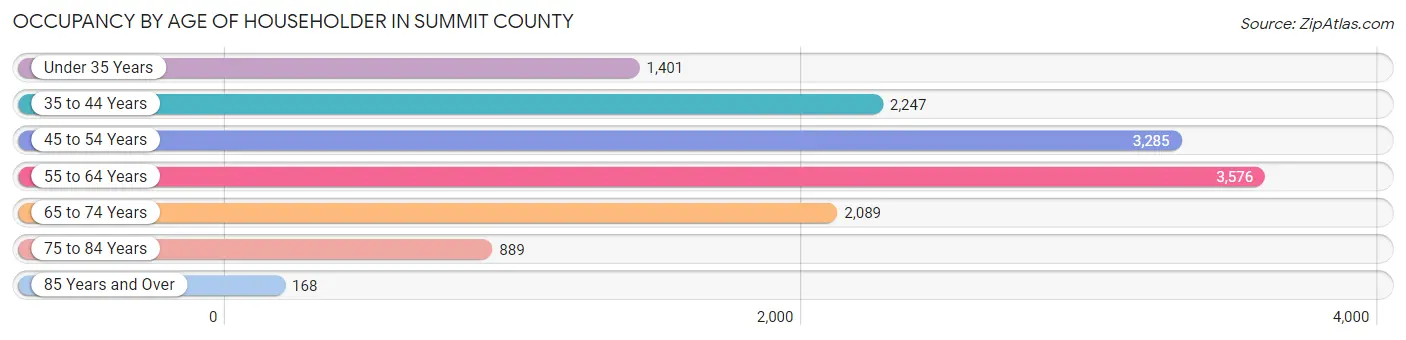
| Age Bracket | # Households | % Households |
| Under 35 Years | 1,401 | 10.3% |
| 35 to 44 Years | 2,247 | 16.5% |
| 45 to 54 Years | 3,285 | 24.1% |
| 55 to 64 Years | 3,576 | 26.2% |
| 65 to 74 Years | 2,089 | 15.3% |
| 75 to 84 Years | 889 | 6.5% |
| 85 Years and Over | 168 | 1.2% |
| Total | 13,655 | 100.0% |
Housing Finances in Summit County
Median Income by Occupancy in Summit County
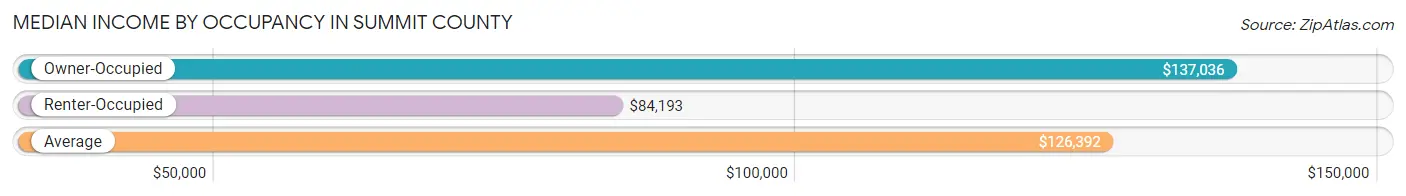
| Occupancy Type | # Households | Median Income |
| Owner-Occupied | 11,058 (81.0%) | $137,036 |
| Renter-Occupied | 2,597 (19.0%) | $84,193 |
| Average | 13,655 (100.0%) | $126,392 |
Occupancy by Householder Income Bracket in Summit County
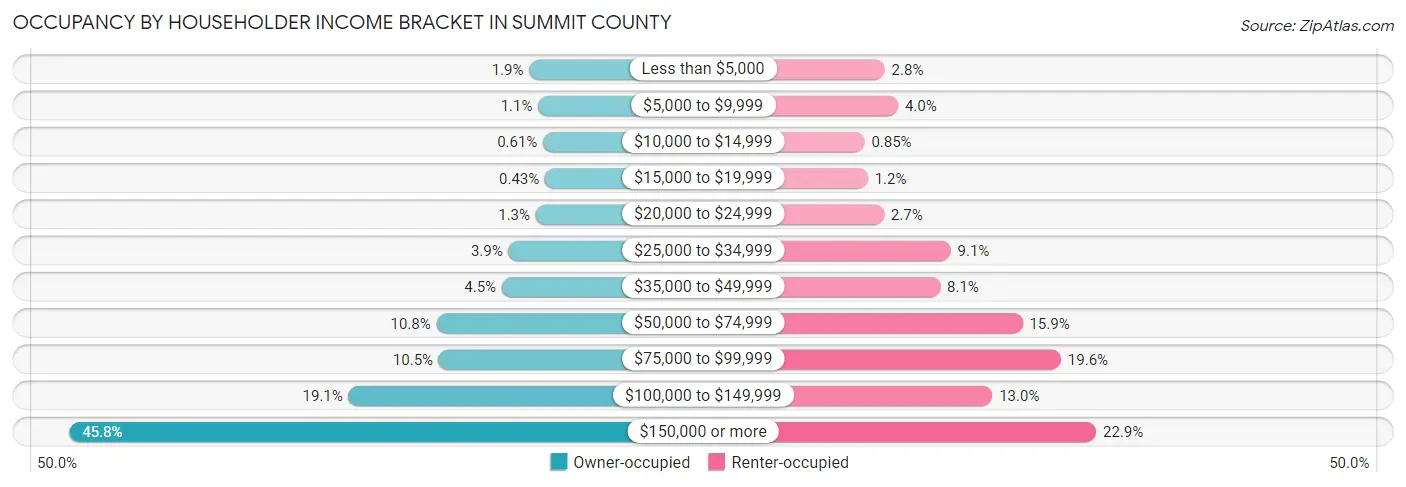
| Income Bracket | Owner-occupied | Renter-occupied |
| Less than $5,000 | 213 (1.9%) | 72 (2.8%) |
| $5,000 to $9,999 | 119 (1.1%) | 105 (4.0%) |
| $10,000 to $14,999 | 67 (0.6%) | 22 (0.9%) |
| $15,000 to $19,999 | 48 (0.4%) | 30 (1.2%) |
| $20,000 to $24,999 | 145 (1.3%) | 70 (2.7%) |
| $25,000 to $34,999 | 432 (3.9%) | 235 (9.0%) |
| $35,000 to $49,999 | 502 (4.5%) | 209 (8.1%) |
| $50,000 to $74,999 | 1,191 (10.8%) | 413 (15.9%) |
| $75,000 to $99,999 | 1,165 (10.5%) | 508 (19.6%) |
| $100,000 to $149,999 | 2,117 (19.1%) | 338 (13.0%) |
| $150,000 or more | 5,059 (45.8%) | 595 (22.9%) |
| Total | 11,058 (100.0%) | 2,597 (100.0%) |
Monthly Housing Cost Tiers in Summit County
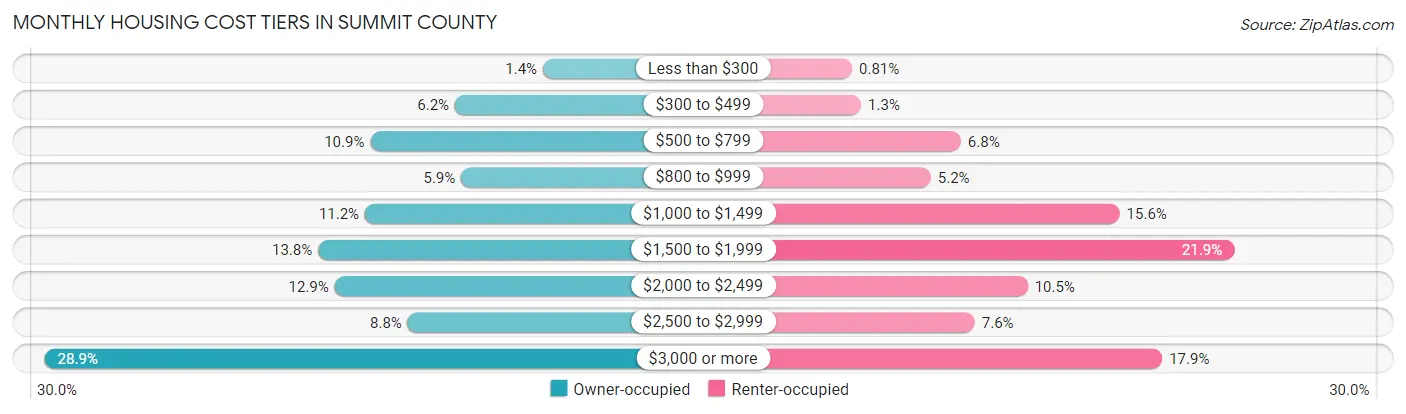
| Monthly Cost | Owner-occupied | Renter-occupied |
| Less than $300 | 151 (1.4%) | 21 (0.8%) |
| $300 to $499 | 689 (6.2%) | 34 (1.3%) |
| $500 to $799 | 1,206 (10.9%) | 177 (6.8%) |
| $800 to $999 | 651 (5.9%) | 134 (5.2%) |
| $1,000 to $1,499 | 1,239 (11.2%) | 405 (15.6%) |
| $1,500 to $1,999 | 1,525 (13.8%) | 569 (21.9%) |
| $2,000 to $2,499 | 1,424 (12.9%) | 273 (10.5%) |
| $2,500 to $2,999 | 978 (8.8%) | 197 (7.6%) |
| $3,000 or more | 3,195 (28.9%) | 466 (17.9%) |
| Total | 11,058 (100.0%) | 2,597 (100.0%) |
Physical Housing Characteristics in Summit County
Housing Structures in Summit County
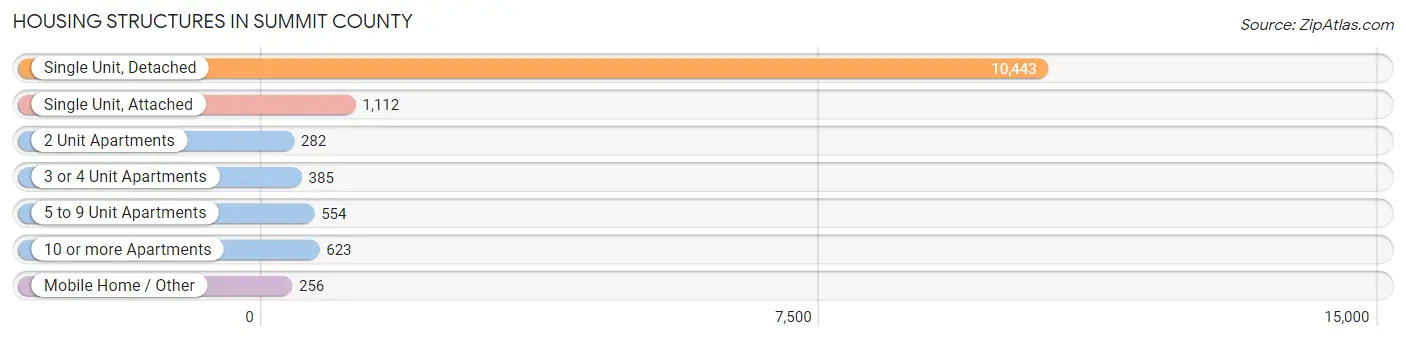
| Structure Type | # Housing Units | % Housing Units |
| Single Unit, Detached | 10,443 | 76.5% |
| Single Unit, Attached | 1,112 | 8.1% |
| 2 Unit Apartments | 282 | 2.1% |
| 3 or 4 Unit Apartments | 385 | 2.8% |
| 5 to 9 Unit Apartments | 554 | 4.1% |
| 10 or more Apartments | 623 | 4.6% |
| Mobile Home / Other | 256 | 1.9% |
| Total | 13,655 | 100.0% |
Housing Structures by Occupancy in Summit County
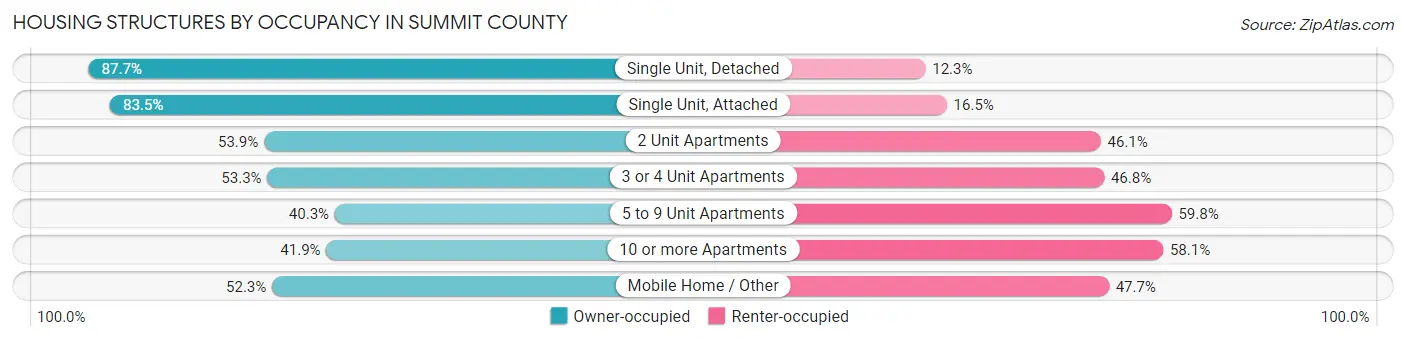
| Structure Type | Owner-occupied | Renter-occupied |
| Single Unit, Detached | 9,154 (87.7%) | 1,289 (12.3%) |
| Single Unit, Attached | 929 (83.5%) | 183 (16.5%) |
| 2 Unit Apartments | 152 (53.9%) | 130 (46.1%) |
| 3 or 4 Unit Apartments | 205 (53.2%) | 180 (46.8%) |
| 5 to 9 Unit Apartments | 223 (40.3%) | 331 (59.8%) |
| 10 or more Apartments | 261 (41.9%) | 362 (58.1%) |
| Mobile Home / Other | 134 (52.3%) | 122 (47.7%) |
| Total | 11,058 (81.0%) | 2,597 (19.0%) |
Housing Structures by Number of Rooms in Summit County
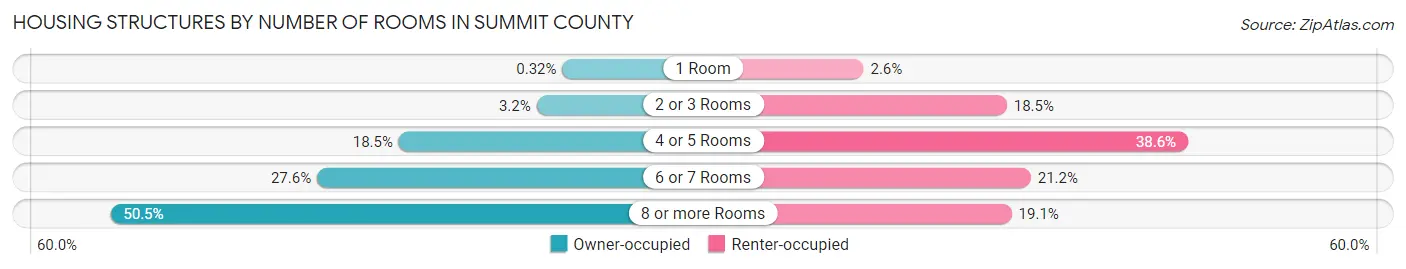
| Number of Rooms | Owner-occupied | Renter-occupied |
| 1 Room | 35 (0.3%) | 68 (2.6%) |
| 2 or 3 Rooms | 352 (3.2%) | 481 (18.5%) |
| 4 or 5 Rooms | 2,042 (18.5%) | 1,003 (38.6%) |
| 6 or 7 Rooms | 3,047 (27.6%) | 550 (21.2%) |
| 8 or more Rooms | 5,582 (50.5%) | 495 (19.1%) |
| Total | 11,058 (100.0%) | 2,597 (100.0%) |
Housing Structure by Heating Type in Summit County
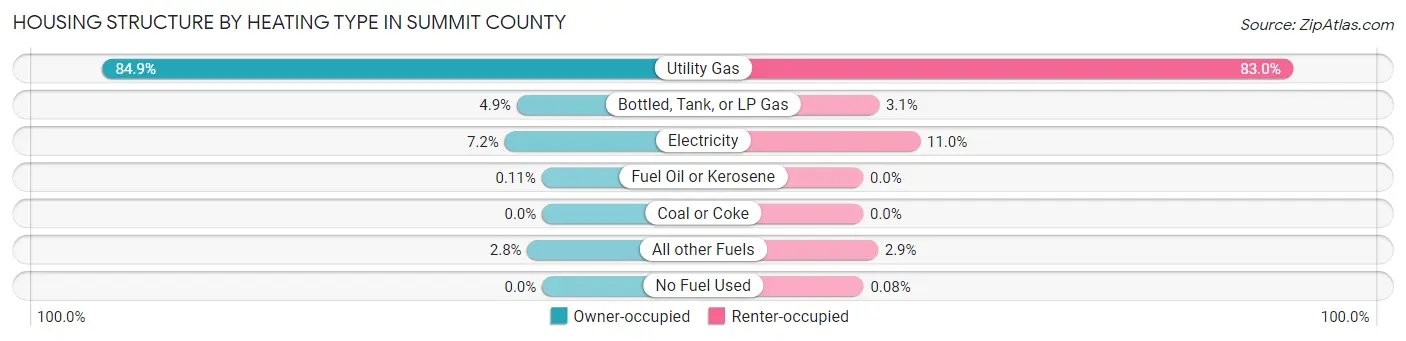
| Heating Type | Owner-occupied | Renter-occupied |
| Utility Gas | 9,393 (84.9%) | 2,155 (83.0%) |
| Bottled, Tank, or LP Gas | 538 (4.9%) | 80 (3.1%) |
| Electricity | 801 (7.2%) | 286 (11.0%) |
| Fuel Oil or Kerosene | 12 (0.1%) | 0 (0.0%) |
| Coal or Coke | 0 (0.0%) | 0 (0.0%) |
| All other Fuels | 314 (2.8%) | 74 (2.9%) |
| No Fuel Used | 0 (0.0%) | 2 (0.1%) |
| Total | 11,058 (100.0%) | 2,597 (100.0%) |
Household Vehicle Usage in Summit County
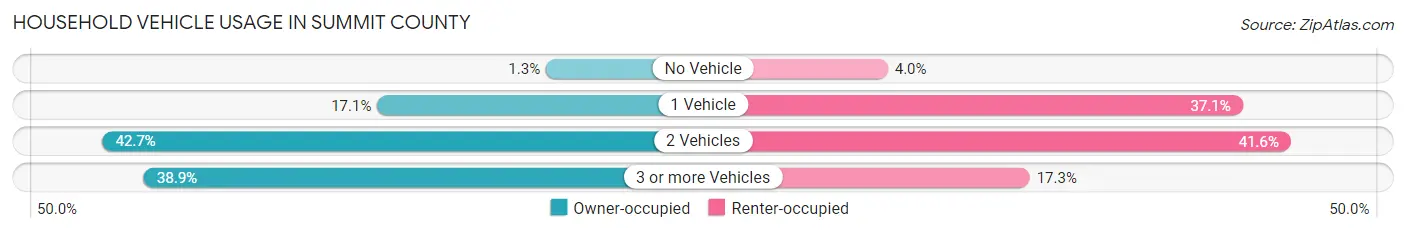
| Vehicles per Household | Owner-occupied | Renter-occupied |
| No Vehicle | 147 (1.3%) | 104 (4.0%) |
| 1 Vehicle | 1,889 (17.1%) | 964 (37.1%) |
| 2 Vehicles | 4,725 (42.7%) | 1,081 (41.6%) |
| 3 or more Vehicles | 4,297 (38.9%) | 448 (17.2%) |
| Total | 11,058 (100.0%) | 2,597 (100.0%) |
Real Estate & Mortgages in Summit County
Real Estate and Mortgage Overview in Summit County
| Characteristic | Without Mortgage | With Mortgage |
| Housing Units | 3,414 | 7,644 |
| Median Property Value | $892,000 | $896,100 |
| Median Household Income | $124,394 | $3,758 |
| Monthly Housing Costs | $708 | $3,138 |
| Real Estate Taxes | $3,286 | $35 |
Property Value by Mortgage Status in Summit County
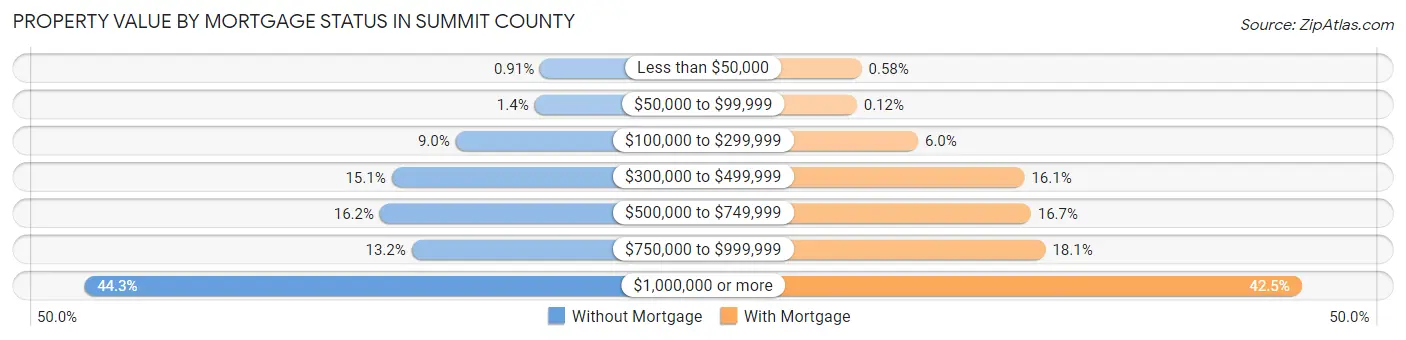
| Property Value | Without Mortgage | With Mortgage |
| Less than $50,000 | 31 (0.9%) | 44 (0.6%) |
| $50,000 to $99,999 | 49 (1.4%) | 9 (0.1%) |
| $100,000 to $299,999 | 306 (9.0%) | 455 (5.9%) |
| $300,000 to $499,999 | 514 (15.1%) | 1,230 (16.1%) |
| $500,000 to $749,999 | 552 (16.2%) | 1,276 (16.7%) |
| $750,000 to $999,999 | 449 (13.2%) | 1,383 (18.1%) |
| $1,000,000 or more | 1,513 (44.3%) | 3,247 (42.5%) |
| Total | 3,414 (100.0%) | 7,644 (100.0%) |
Household Income by Mortgage Status in Summit County
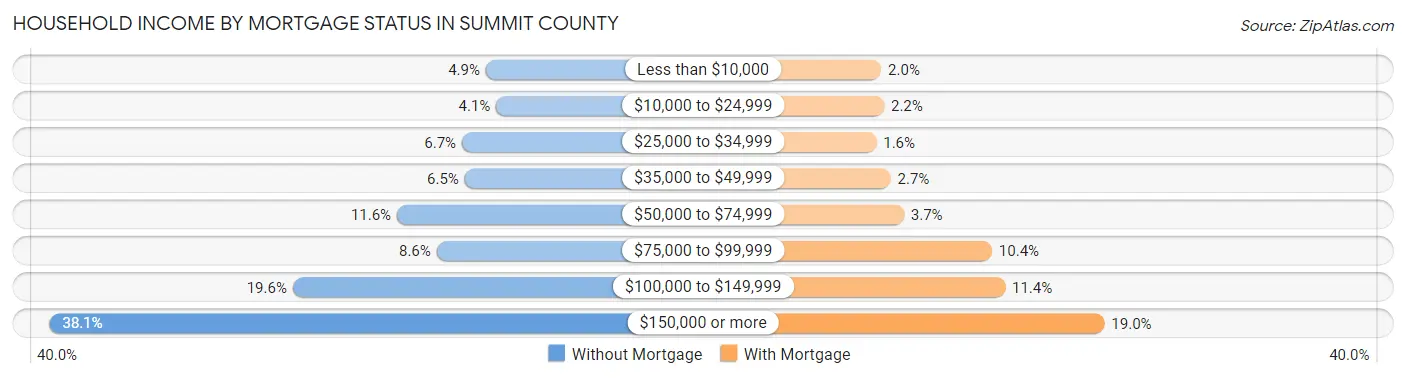
| Household Income | Without Mortgage | With Mortgage |
| Less than $10,000 | 166 (4.9%) | 149 (1.9%) |
| $10,000 to $24,999 | 139 (4.1%) | 166 (2.2%) |
| $25,000 to $34,999 | 228 (6.7%) | 121 (1.6%) |
| $35,000 to $49,999 | 221 (6.5%) | 204 (2.7%) |
| $50,000 to $74,999 | 397 (11.6%) | 281 (3.7%) |
| $75,000 to $99,999 | 294 (8.6%) | 794 (10.4%) |
| $100,000 to $149,999 | 668 (19.6%) | 871 (11.4%) |
| $150,000 or more | 1,301 (38.1%) | 1,449 (19.0%) |
| Total | 3,414 (100.0%) | 7,644 (100.0%) |
Property Value to Household Income Ratio in Summit County
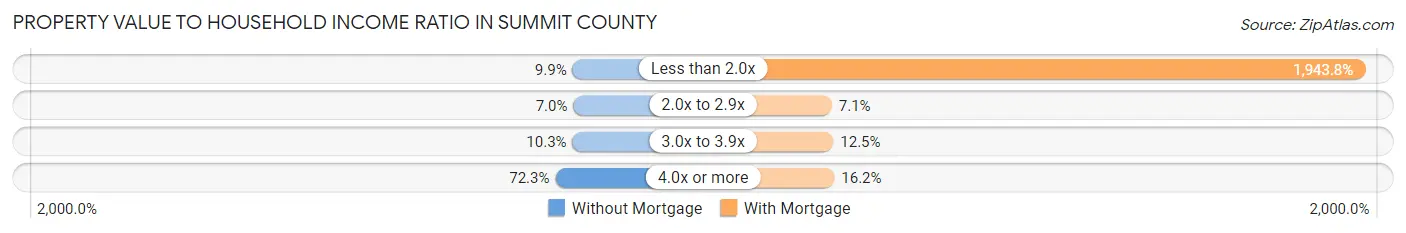
| Value-to-Income Ratio | Without Mortgage | With Mortgage |
| Less than 2.0x | 338 (9.9%) | 148,584 (1,943.8%) |
| 2.0x to 2.9x | 239 (7.0%) | 545 (7.1%) |
| 3.0x to 3.9x | 350 (10.2%) | 956 (12.5%) |
| 4.0x or more | 2,468 (72.3%) | 1,240 (16.2%) |
| Total | 3,414 (100.0%) | 7,644 (100.0%) |
Real Estate Taxes by Mortgage Status in Summit County
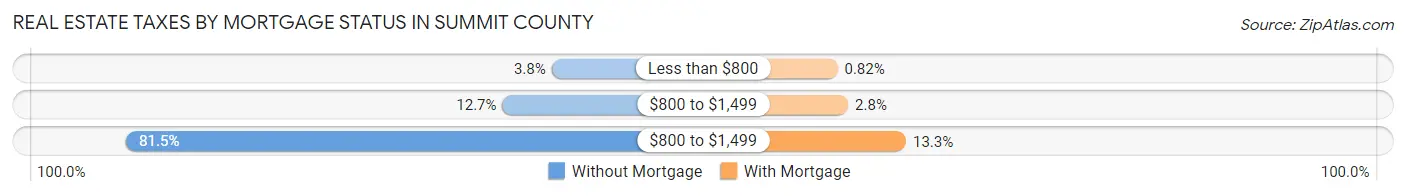
| Property Taxes | Without Mortgage | With Mortgage |
| Less than $800 | 128 (3.7%) | 63 (0.8%) |
| $800 to $1,499 | 435 (12.7%) | 211 (2.8%) |
| $800 to $1,499 | 2,781 (81.5%) | 1,020 (13.3%) |
| Total | 3,414 (100.0%) | 7,644 (100.0%) |
Health & Disability in Summit County
Health Insurance Coverage by Age in Summit County
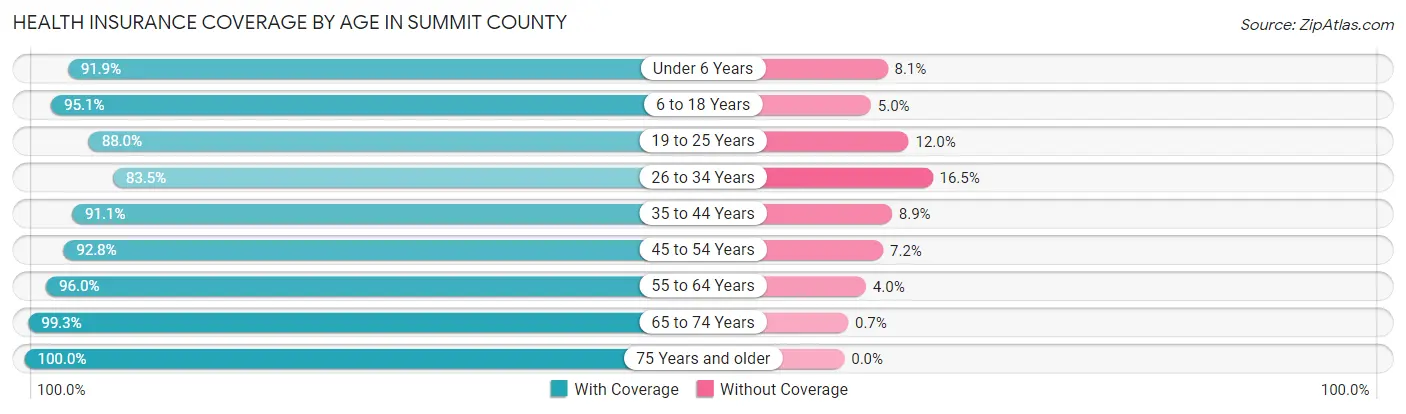
| Age Bracket | With Coverage | Without Coverage |
| Under 6 Years | 2,294 (91.9%) | 201 (8.1%) |
| 6 to 18 Years | 7,822 (95.1%) | 407 (5.0%) |
| 19 to 25 Years | 3,248 (88.0%) | 442 (12.0%) |
| 26 to 34 Years | 3,355 (83.5%) | 661 (16.5%) |
| 35 to 44 Years | 4,944 (91.1%) | 481 (8.9%) |
| 45 to 54 Years | 5,840 (92.8%) | 456 (7.2%) |
| 55 to 64 Years | 6,139 (96.0%) | 258 (4.0%) |
| 65 to 74 Years | 3,986 (99.3%) | 28 (0.7%) |
| 75 Years and older | 1,833 (100.0%) | 0 (0.0%) |
| Total | 39,461 (93.1%) | 2,934 (6.9%) |
Health Insurance Coverage by Citizenship Status in Summit County
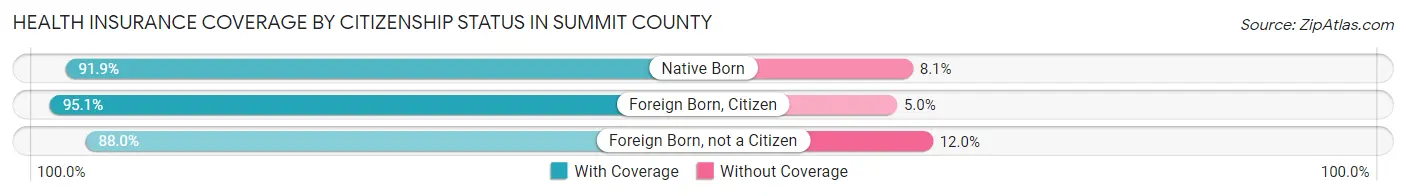
| Citizenship Status | With Coverage | Without Coverage |
| Native Born | 2,294 (91.9%) | 201 (8.1%) |
| Foreign Born, Citizen | 7,822 (95.1%) | 407 (5.0%) |
| Foreign Born, not a Citizen | 3,248 (88.0%) | 442 (12.0%) |
Health Insurance Coverage by Household Income in Summit County
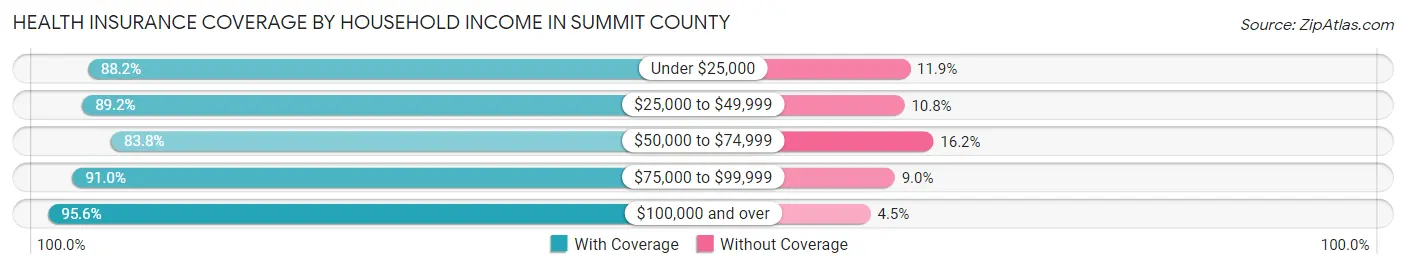
| Household Income | With Coverage | Without Coverage |
| Under $25,000 | 1,465 (88.1%) | 197 (11.8%) |
| $25,000 to $49,999 | 2,717 (89.2%) | 329 (10.8%) |
| $50,000 to $74,999 | 3,517 (83.8%) | 681 (16.2%) |
| $75,000 to $99,999 | 4,663 (91.0%) | 460 (9.0%) |
| $100,000 and over | 26,989 (95.6%) | 1,258 (4.4%) |
Public vs Private Health Insurance Coverage by Age in Summit County
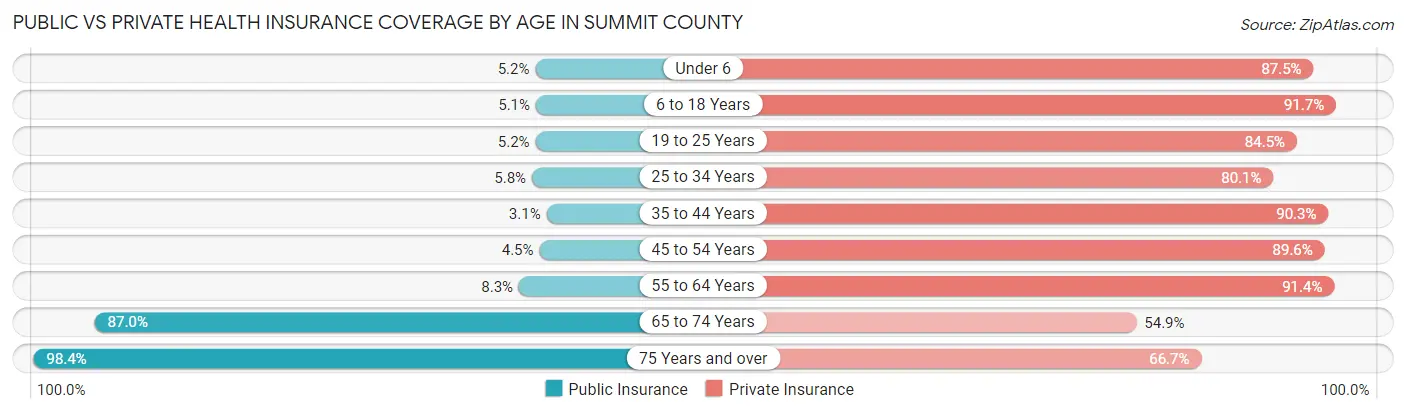
| Age Bracket | Public Insurance | Private Insurance |
| Under 6 | 130 (5.2%) | 2,184 (87.5%) |
| 6 to 18 Years | 420 (5.1%) | 7,549 (91.7%) |
| 19 to 25 Years | 191 (5.2%) | 3,117 (84.5%) |
| 25 to 34 Years | 234 (5.8%) | 3,217 (80.1%) |
| 35 to 44 Years | 170 (3.1%) | 4,899 (90.3%) |
| 45 to 54 Years | 280 (4.4%) | 5,642 (89.6%) |
| 55 to 64 Years | 528 (8.3%) | 5,847 (91.4%) |
| 65 to 74 Years | 3,492 (87.0%) | 2,202 (54.9%) |
| 75 Years and over | 1,803 (98.4%) | 1,223 (66.7%) |
| Total | 7,248 (17.1%) | 35,880 (84.6%) |
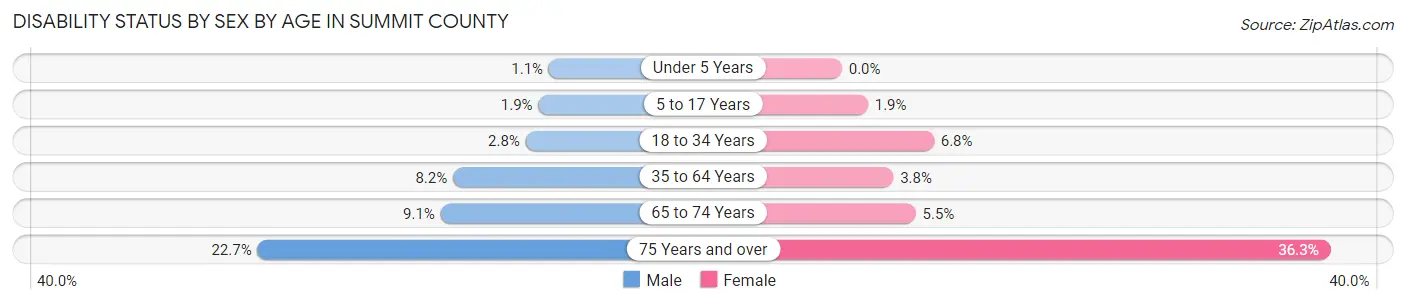
Disability Status by Sex by Age in Summit County
| Age Bracket | Male | Female |
| Under 5 Years | 12 (1.1%) | 0 (0.0%) |
| 5 to 17 Years | 73 (1.8%) | 75 (1.9%) |
| 18 to 34 Years | 125 (2.8%) | 270 (6.8%) |
| 35 to 64 Years | 763 (8.2%) | 336 (3.8%) |
| 65 to 74 Years | 191 (9.1%) | 105 (5.5%) |
| 75 Years and over | 211 (22.7%) | 328 (36.3%) |
Disability Class by Sex by Age in Summit County
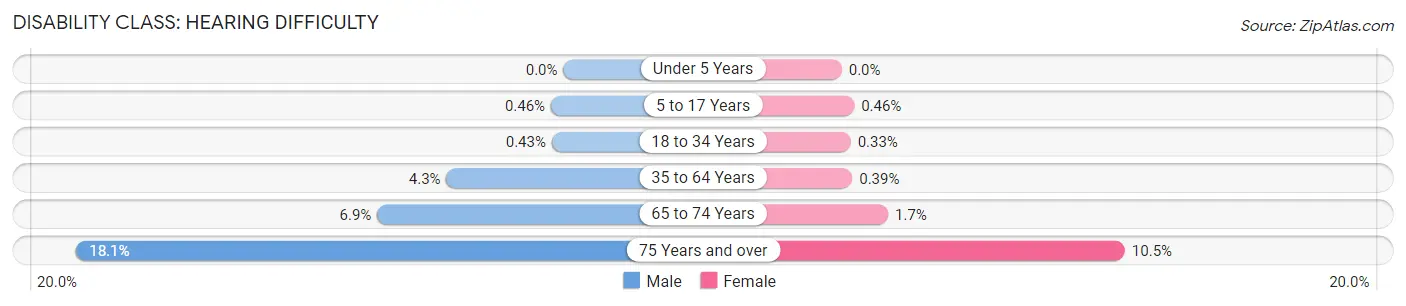
Disability Class: Hearing Difficulty
| Age Bracket | Male | Female |
| Under 5 Years | 0 (0.0%) | 0 (0.0%) |
| 5 to 17 Years | 18 (0.5%) | 18 (0.5%) |
| 18 to 34 Years | 19 (0.4%) | 13 (0.3%) |
| 35 to 64 Years | 404 (4.3%) | 34 (0.4%) |
| 65 to 74 Years | 145 (6.9%) | 33 (1.7%) |
| 75 Years and over | 168 (18.1%) | 95 (10.5%) |
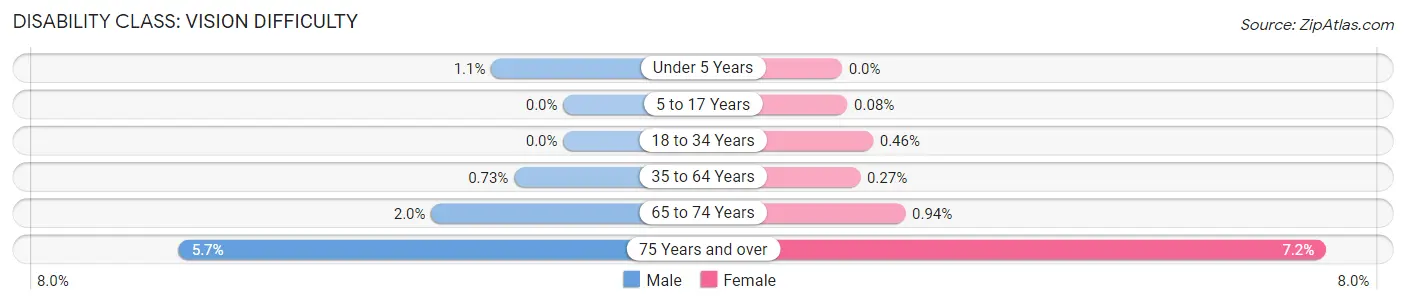
Disability Class: Vision Difficulty
| Age Bracket | Male | Female |
| Under 5 Years | 12 (1.1%) | 0 (0.0%) |
| 5 to 17 Years | 0 (0.0%) | 3 (0.1%) |
| 18 to 34 Years | 0 (0.0%) | 18 (0.5%) |
| 35 to 64 Years | 68 (0.7%) | 24 (0.3%) |
| 65 to 74 Years | 41 (2.0%) | 18 (0.9%) |
| 75 Years and over | 53 (5.7%) | 65 (7.2%) |
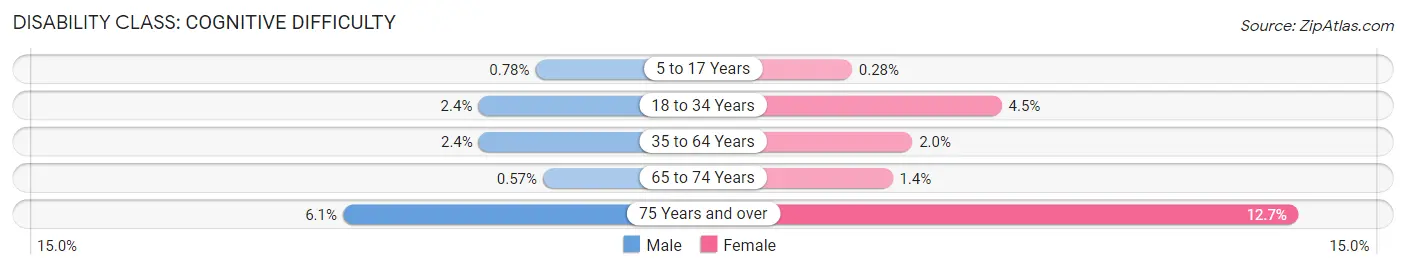
Disability Class: Cognitive Difficulty
| Age Bracket | Male | Female |
| 5 to 17 Years | 31 (0.8%) | 11 (0.3%) |
| 18 to 34 Years | 106 (2.4%) | 176 (4.4%) |
| 35 to 64 Years | 220 (2.4%) | 173 (2.0%) |
| 65 to 74 Years | 12 (0.6%) | 27 (1.4%) |
| 75 Years and over | 57 (6.1%) | 115 (12.7%) |
Disability Class: Ambulatory Difficulty
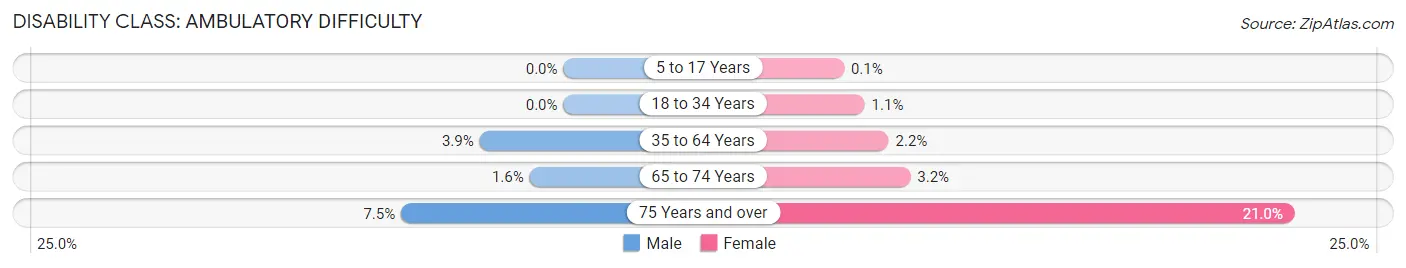
| Age Bracket | Male | Female |
| 5 to 17 Years | 0 (0.0%) | 4 (0.1%) |
| 18 to 34 Years | 0 (0.0%) | 42 (1.1%) |
| 35 to 64 Years | 362 (3.9%) | 191 (2.2%) |
| 65 to 74 Years | 33 (1.6%) | 61 (3.2%) |
| 75 Years and over | 70 (7.5%) | 190 (21.0%) |
Disability Class: Self-Care Difficulty
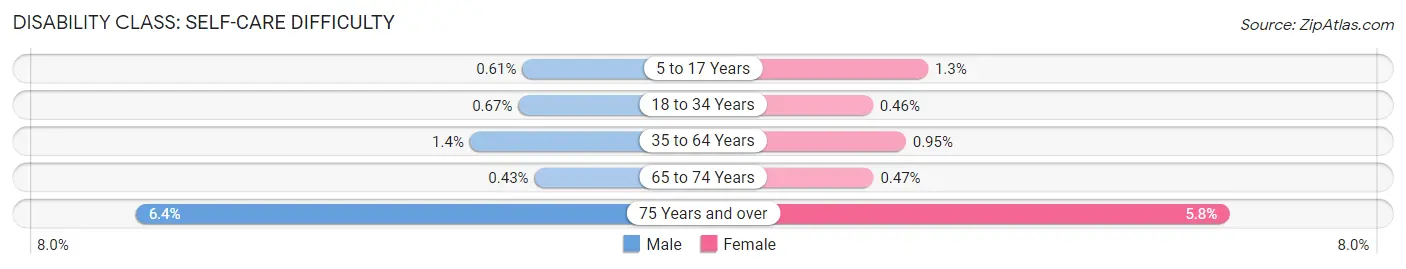
| Age Bracket | Male | Female |
| 5 to 17 Years | 24 (0.6%) | 50 (1.3%) |
| 18 to 34 Years | 30 (0.7%) | 18 (0.5%) |
| 35 to 64 Years | 129 (1.4%) | 84 (0.9%) |
| 65 to 74 Years | 9 (0.4%) | 9 (0.5%) |
| 75 Years and over | 59 (6.4%) | 52 (5.8%) |
Technology Access in Summit County
Computing Device Access in Summit County
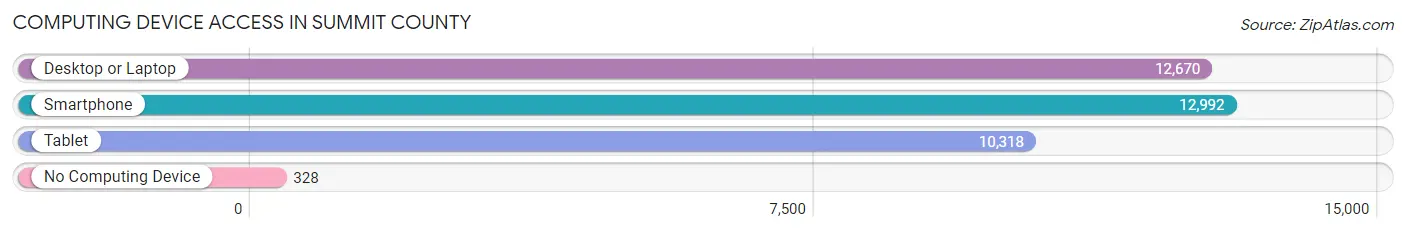
| Device Type | # Households | % Households |
| Desktop or Laptop | 12,670 | 92.8% |
| Smartphone | 12,992 | 95.1% |
| Tablet | 10,318 | 75.6% |
| No Computing Device | 328 | 2.4% |
| Total | 13,655 | 100.0% |
Internet Access in Summit County
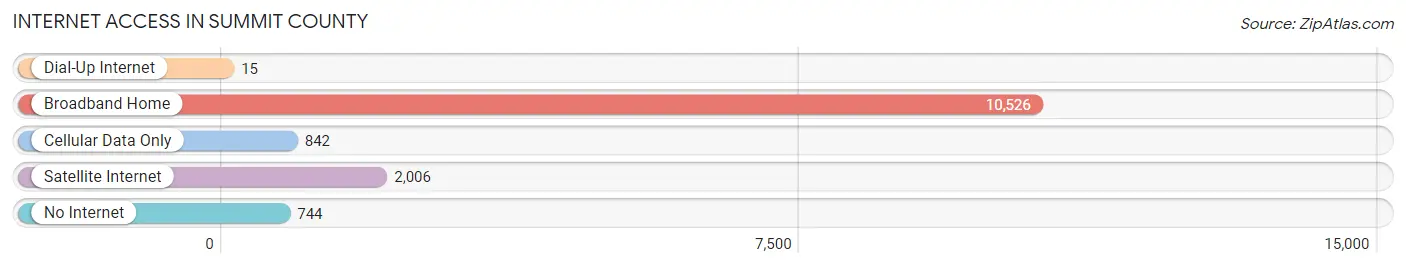
| Internet Type | # Households | % Households |
| Dial-Up Internet | 15 | 0.1% |
| Broadband Home | 10,526 | 77.1% |
| Cellular Data Only | 842 | 6.2% |
| Satellite Internet | 2,006 | 14.7% |
| No Internet | 744 | 5.4% |
| Total | 13,655 | 100.0% |
Summit County Summary
Summit County, Utah is located in the northern part of the state and is bordered by Wasatch County to the west, Duchesne County to the east, and Salt Lake County to the south. The county seat is Coalville, and the largest city is Park City. As of the 2010 census, the population was 36,324.
History
The area that is now Summit County was first inhabited by the Ute Indians, who lived in the area for centuries before the arrival of European settlers. The first white settlers arrived in the area in the early 1800s, and the county was officially established in 1854. The county was named for the many mountain peaks in the area, which are part of the Wasatch Range.
In the late 1800s, the area became a popular destination for miners, who were drawn to the area by the discovery of silver and lead. The mining industry was the primary source of income for the county until the early 1900s, when the area began to transition to a more tourism-based economy.
In the 1960s, the area became a popular destination for skiing, and the city of Park City was established as a ski resort. The area has since become a popular destination for winter sports, and is home to several world-class ski resorts.
Geography
Summit County is located in the northern part of Utah, and is bordered by Wasatch County to the west, Duchesne County to the east, and Salt Lake County to the south. The county covers an area of 1,882 square miles, and is home to several mountain peaks, including Mount Timpanogos, which is the highest peak in the county at 11,752 feet.
The county is home to several rivers and streams, including the Weber River, which flows through the county from east to west. The county is also home to several lakes, including Jordanelle Reservoir, which is the largest lake in the county.
Economy
The economy of Summit County is largely based on tourism, with the ski resorts in the area being the primary source of income. The county is also home to several manufacturing companies, including a paper mill in Coalville and a steel mill in Park City.
The county is also home to several technology companies, including a software development company in Park City and a medical device manufacturer in Coalville.
Demographics
As of the 2010 census, the population of Summit County was 36,324, with a population density of 19.3 people per square mile. The median household income was $68,845, and the median family income was $77,845.
The racial makeup of the county was 91.3% White, 0.7% African American, 0.4% Native American, 2.2% Asian, 0.1% Pacific Islander, 3.2% from other races, and 2.3% from two or more races. Hispanic or Latino of any race were 8.2% of the population.
The largest ancestry groups in the county were English (25.3%), German (17.2%), Irish (14.2%), and Norwegian (10.2%). The largest religious affiliations were LDS (45.2%), Catholic (14.2%), and Protestant (13.2%).
Common Questions
What is the Total Population of Summit County?
Total Population of Summit County is 42,524.
What is the Total Male Population of Summit County?
Total Male Population of Summit County is 21,971.
What is the Total Female Population of Summit County?
Total Female Population of Summit County is 20,553.
What is the Ratio of Males per 100 Females in Summit County?
There are 106.90 Males per 100 Females in Summit County.
What is the Ratio of Females per 100 Males in Summit County?
There are 93.55 Females per 100 Males in Summit County.
What is the Median Population Age in Summit County?
Median Population Age in Summit County is 40.5 Years.
What is the Average Family Size in Summit County
Average Family Size in Summit County is 3.5 People.
What is the Average Household Size in Summit County
Average Household Size in Summit County is 3.1 People.
What is Per Capita Income in Summit County?
Per Capita income in Summit County is $67,602.
What is the Median Family Income in Summit County?
Median Family Income in Summit County is $144,118.
What is the Median Household income in Summit County?
Median Household Income in Summit County is $126,392.
What is Income or Wage Gap in Summit County?
Income or Wage Gap in Summit County is 28.0%.
Women in Summit County earn 72.0 cents for every dollar earned by a man.
What is Family Income Deficit in Summit County?
Family Income Deficit in Summit County is $13,027.
Families that are below poverty line in Summit County earn $13,027 less on average than the poverty threshold level.
What is Inequality or Gini Index in Summit County?
Inequality or Gini Index in Summit County is 0.51.
How Large is the Labor Force in Summit County?
There are 23,524 People in the Labor Forcein in Summit County.
What is the Percentage of People in the Labor Force in Summit County?
69.5% of People are in the Labor Force in Summit County.
What is the Unemployment Rate in Summit County?
Unemployment Rate in Summit County is 2.3%.