Sevier County, UT
Sevier County Map
Sevier County Overview
21,667
TOTAL POPULATION
11,144
MALE POPULATION
10,523
FEMALE POPULATION
105.90
MALES / 100 FEMALES
94.43
FEMALES / 100 MALES
36.2
MEDIAN AGE
3.3
AVG FAMILY SIZE
2.9
AVG HOUSEHOLD SIZE
$28,859
PER CAPITA INCOME
$76,808
AVG FAMILY INCOME
$66,972
AVG HOUSEHOLD INCOME
52.6%
WAGE / INCOME GAP [ % ]
47.4¢/ $1
WAGE / INCOME GAP [ $ ]
$9,308
FAMILY INCOME DEFICIT
0.39
INEQUALITY / GINI INDEX
9,855
LABOR FORCE [ PEOPLE ]
60.6%
PERCENT IN LABOR FORCE
4.9%
UNEMPLOYMENT RATE
Sevier County Area Codes
Race in Sevier County
The most populous races in Sevier County are White / Caucasian (20,128 | 92.9%), Hispanic or Latino (1,224 | 5.7%), and Two or more Races (706 | 3.3%).
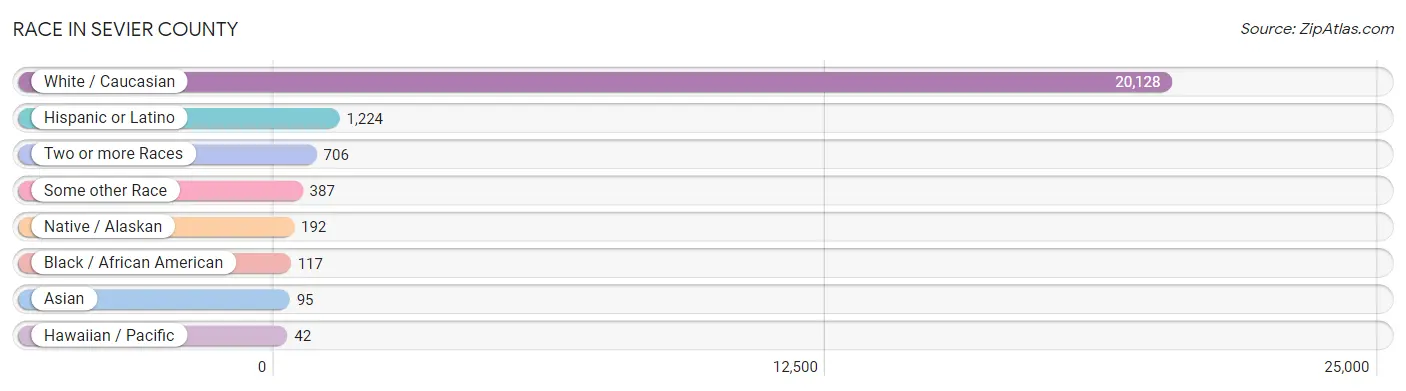
| Race | # Population | % Population |
| Asian | 95 | 0.4% |
| Black / African American | 117 | 0.5% |
| Hawaiian / Pacific | 42 | 0.2% |
| Hispanic or Latino | 1,224 | 5.7% |
| Native / Alaskan | 192 | 0.9% |
| White / Caucasian | 20,128 | 92.9% |
| Two or more Races | 706 | 3.3% |
| Some other Race | 387 | 1.8% |
| Total | 21,667 | 100.0% |
Ancestry in Sevier County
The most populous ancestries reported in Sevier County are English (6,632 | 30.6%), Danish (2,267 | 10.5%), German (1,673 | 7.7%), Irish (1,080 | 5.0%), and Mexican (889 | 4.1%), together accounting for 57.9% of all Sevier County residents.
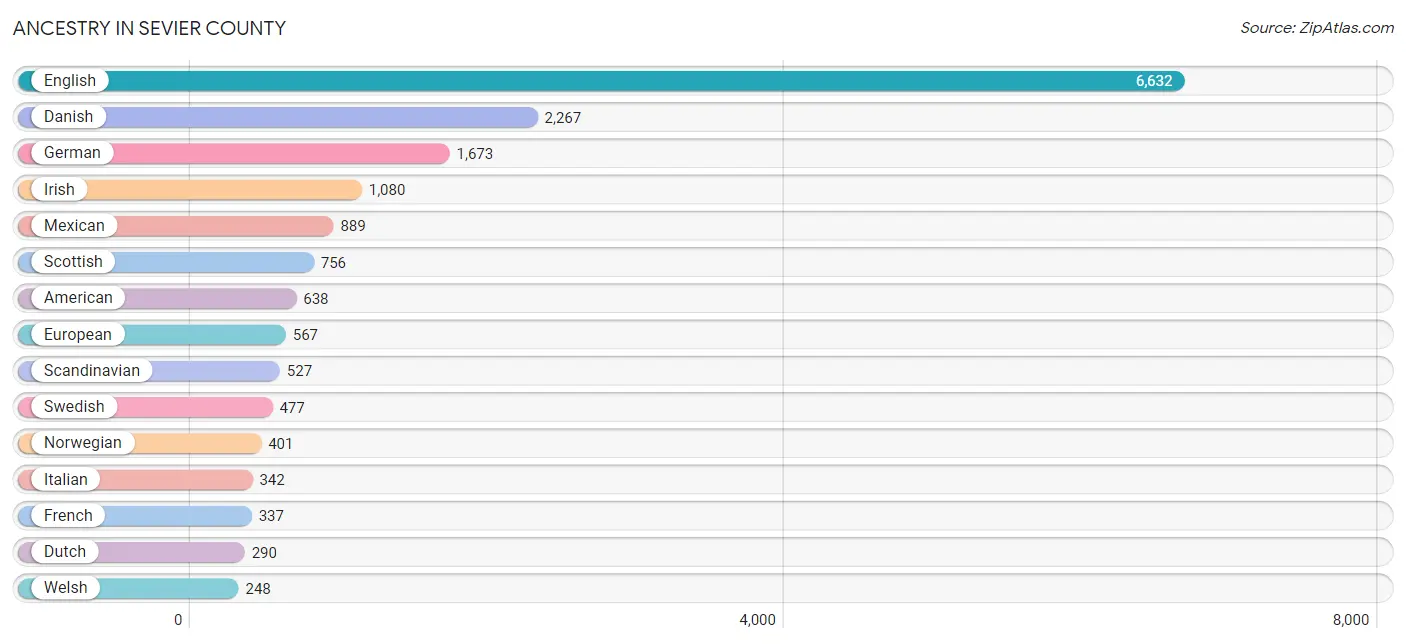
| Ancestry | # Population | % Population |
| American | 638 | 2.9% |
| Apache | 16 | 0.1% |
| Arab | 45 | 0.2% |
| Armenian | 2 | 0.0% |
| Austrian | 42 | 0.2% |
| Basque | 16 | 0.1% |
| Belgian | 13 | 0.1% |
| Bhutanese | 92 | 0.4% |
| British | 179 | 0.8% |
| Burmese | 7 | 0.0% |
| Canadian | 15 | 0.1% |
| Central American | 45 | 0.2% |
| Cherokee | 77 | 0.4% |
| Chickasaw | 1 | 0.0% |
| Creek | 13 | 0.1% |
| Cuban | 13 | 0.1% |
| Czechoslovakian | 4 | 0.0% |
| Danish | 2,267 | 10.5% |
| Dominican | 3 | 0.0% |
| Dutch | 290 | 1.3% |
| Eastern European | 30 | 0.1% |
| English | 6,632 | 30.6% |
| European | 567 | 2.6% |
| Finnish | 8 | 0.0% |
| French | 337 | 1.6% |
| French Canadian | 26 | 0.1% |
| German | 1,673 | 7.7% |
| German Russian | 10 | 0.1% |
| Greek | 15 | 0.1% |
| Guatemalan | 27 | 0.1% |
| Haitian | 7 | 0.0% |
| Honduran | 7 | 0.0% |
| Hopi | 29 | 0.1% |
| Hungarian | 8 | 0.0% |
| Icelander | 22 | 0.1% |
| Irish | 1,080 | 5.0% |
| Iroquois | 11 | 0.1% |
| Italian | 342 | 1.6% |
| Korean | 24 | 0.1% |
| Lebanese | 24 | 0.1% |
| Lithuanian | 40 | 0.2% |
| Mexican | 889 | 4.1% |
| Mexican American Indian | 34 | 0.2% |
| Native Hawaiian | 52 | 0.2% |
| Navajo | 153 | 0.7% |
| Nigerian | 92 | 0.4% |
| Northern European | 20 | 0.1% |
| Norwegian | 401 | 1.8% |
| Pakistani | 4 | 0.0% |
| Polish | 175 | 0.8% |
| Portuguese | 45 | 0.2% |
| Puerto Rican | 29 | 0.1% |
| Romanian | 5 | 0.0% |
| Russian | 128 | 0.6% |
| Salvadoran | 11 | 0.1% |
| Samoan | 24 | 0.1% |
| Scandinavian | 527 | 2.4% |
| Scotch-Irish | 117 | 0.5% |
| Scottish | 756 | 3.5% |
| Slovak | 5 | 0.0% |
| South African | 16 | 0.1% |
| Spaniard | 183 | 0.8% |
| Spanish | 19 | 0.1% |
| Sri Lankan | 20 | 0.1% |
| Subsaharan African | 108 | 0.5% |
| Swedish | 477 | 2.2% |
| Swiss | 97 | 0.4% |
| Tongan | 6 | 0.0% |
| Ute | 3 | 0.0% |
| Welsh | 248 | 1.1% | View All 70 Rows |
Immigrants in Sevier County
The most numerous immigrant groups reported in Sevier County came from Latin America (364 | 1.7%), Central America (357 | 1.7%), Mexico (321 | 1.5%), Asia (37 | 0.2%), and Eastern Asia (29 | 0.1%), together accounting for 5.1% of all Sevier County residents.
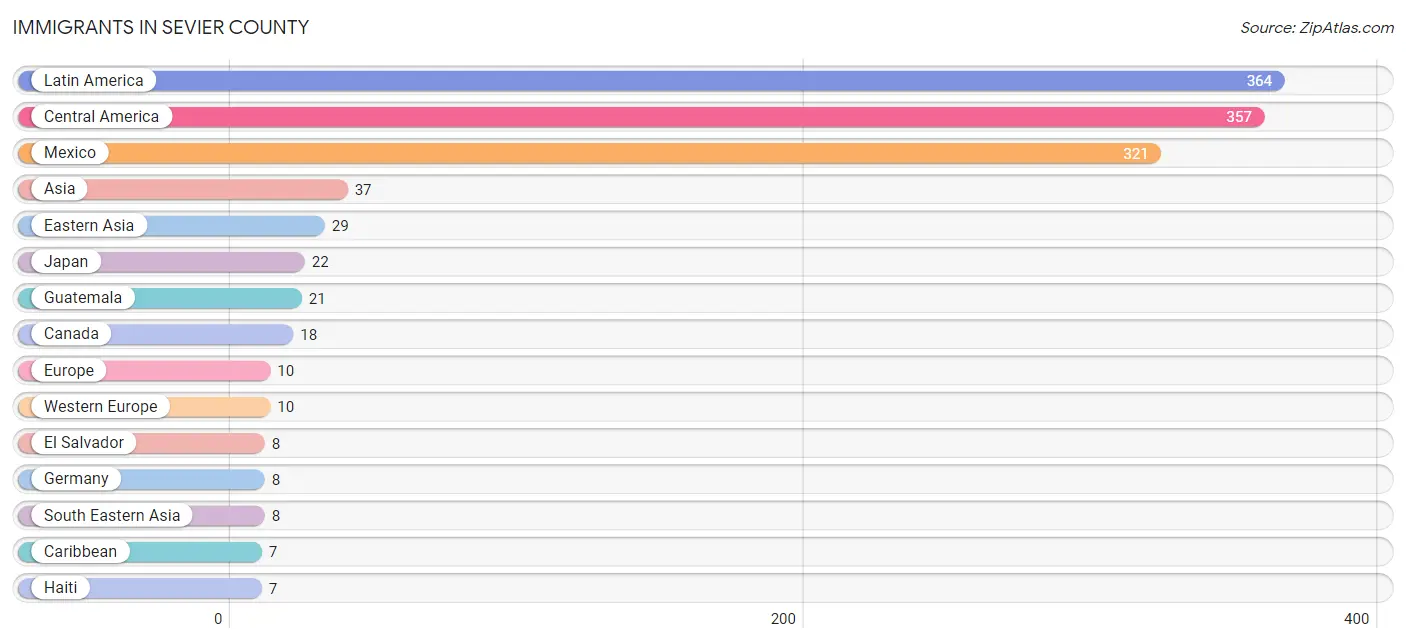
| Immigration Origin | # Population | % Population |
| Asia | 37 | 0.2% |
| Canada | 18 | 0.1% |
| Caribbean | 7 | 0.0% |
| Central America | 357 | 1.7% |
| Eastern Asia | 29 | 0.1% |
| El Salvador | 8 | 0.0% |
| Europe | 10 | 0.1% |
| Germany | 8 | 0.0% |
| Guatemala | 21 | 0.1% |
| Haiti | 7 | 0.0% |
| Honduras | 7 | 0.0% |
| Japan | 22 | 0.1% |
| Korea | 7 | 0.0% |
| Latin America | 364 | 1.7% |
| Mexico | 321 | 1.5% |
| Netherlands | 2 | 0.0% |
| Philippines | 6 | 0.0% |
| South Eastern Asia | 8 | 0.0% |
| Thailand | 2 | 0.0% |
| Western Europe | 10 | 0.1% | View All 20 Rows |
Sex and Age in Sevier County
Sex and Age in Sevier County
The most populous age groups in Sevier County are 10 to 14 Years (983 | 8.8%) for men and 10 to 14 Years (890 | 8.5%) for women.
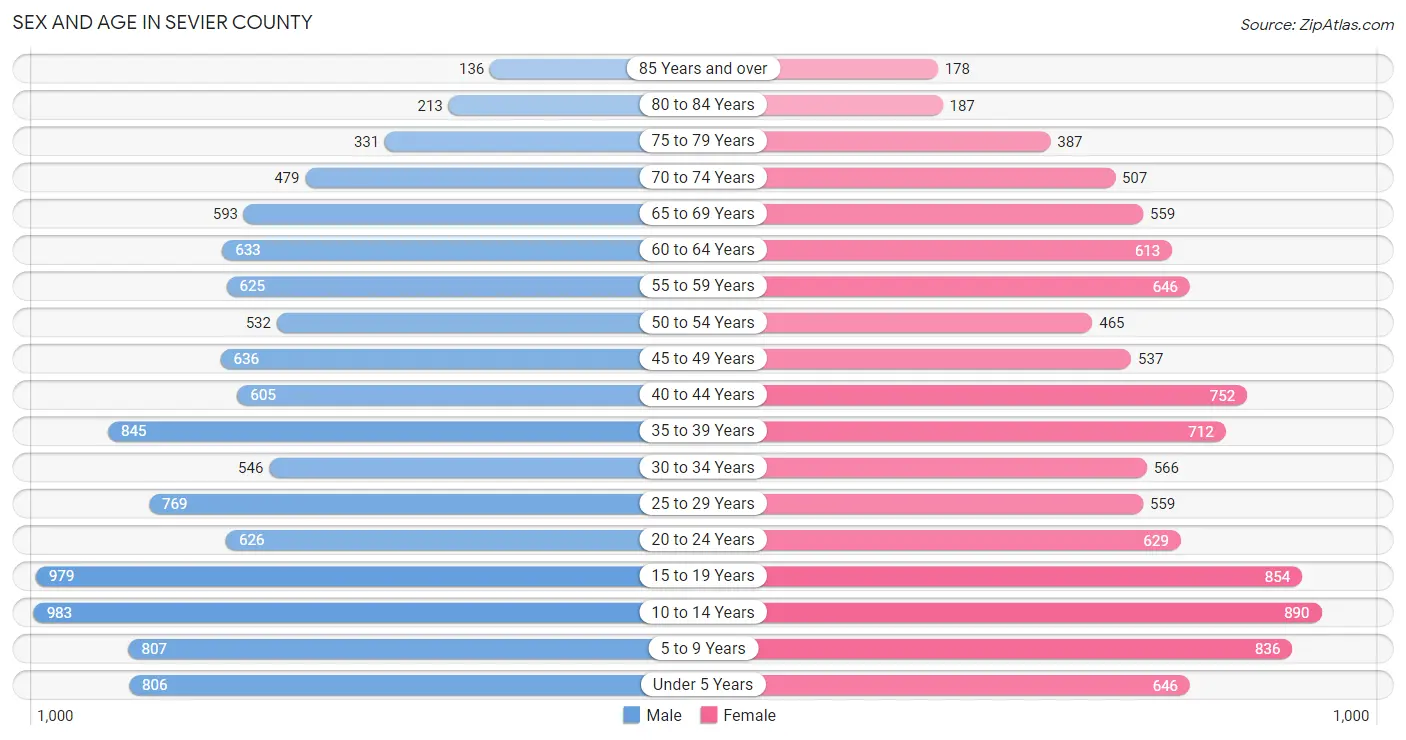
| Age Bracket | Male | Female |
| Under 5 Years | 806 (7.2%) | 646 (6.1%) |
| 5 to 9 Years | 807 (7.2%) | 836 (7.9%) |
| 10 to 14 Years | 983 (8.8%) | 890 (8.5%) |
| 15 to 19 Years | 979 (8.8%) | 854 (8.1%) |
| 20 to 24 Years | 626 (5.6%) | 629 (6.0%) |
| 25 to 29 Years | 769 (6.9%) | 559 (5.3%) |
| 30 to 34 Years | 546 (4.9%) | 566 (5.4%) |
| 35 to 39 Years | 845 (7.6%) | 712 (6.8%) |
| 40 to 44 Years | 605 (5.4%) | 752 (7.1%) |
| 45 to 49 Years | 636 (5.7%) | 537 (5.1%) |
| 50 to 54 Years | 532 (4.8%) | 465 (4.4%) |
| 55 to 59 Years | 625 (5.6%) | 646 (6.1%) |
| 60 to 64 Years | 633 (5.7%) | 613 (5.8%) |
| 65 to 69 Years | 593 (5.3%) | 559 (5.3%) |
| 70 to 74 Years | 479 (4.3%) | 507 (4.8%) |
| 75 to 79 Years | 331 (3.0%) | 387 (3.7%) |
| 80 to 84 Years | 213 (1.9%) | 187 (1.8%) |
| 85 Years and over | 136 (1.2%) | 178 (1.7%) |
| Total | 11,144 (100.0%) | 10,523 (100.0%) |
Families and Households in Sevier County
Median Family Size in Sevier County
The median family size in Sevier County is 3.33 persons per family, with married-couple families (4,871 | 86.1%) accounting for the largest median family size of 3.35 persons per family. On the other hand, single male/father families (236 | 4.2%) represent the smallest median family size with 3.10 persons per family.
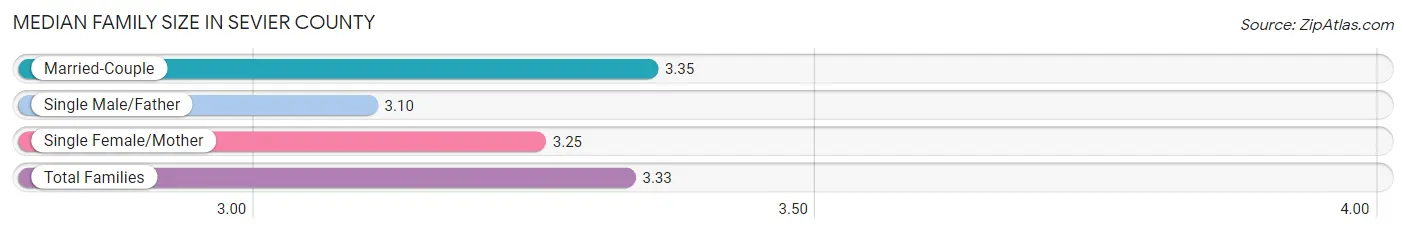
| Family Type | # Families | Family Size |
| Married-Couple | 4,871 (86.1%) | 3.35 |
| Single Male/Father | 236 (4.2%) | 3.10 |
| Single Female/Mother | 553 (9.8%) | 3.25 |
| Total Families | 5,660 (100.0%) | 3.33 |
Median Household Size in Sevier County
The median household size in Sevier County is 2.88 persons per household, with single male/father households (236 | 3.2%) accounting for the largest median household size of 3.72 persons per household. non-family households (1,736 | 23.5%) represent the smallest median household size with 1.19 persons per household.
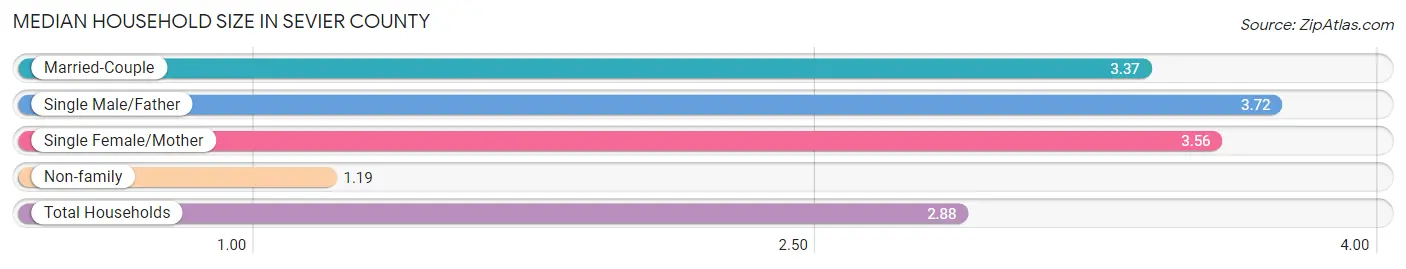
| Household Type | # Households | Household Size |
| Married-Couple | 4,871 (65.9%) | 3.37 |
| Single Male/Father | 236 (3.2%) | 3.72 |
| Single Female/Mother | 553 (7.5%) | 3.56 |
| Non-family | 1,736 (23.5%) | 1.19 |
| Total Households | 7,396 (100.0%) | 2.88 |
Household Size by Marriage Status in Sevier County
Out of a total of 7,396 households in Sevier County, 5,660 (76.5%) are family households, while 1,736 (23.5%) are nonfamily households. The most numerous type of family households are 2-person households, comprising 2,462, and the most common type of nonfamily households are 1-person households, comprising 1,509.
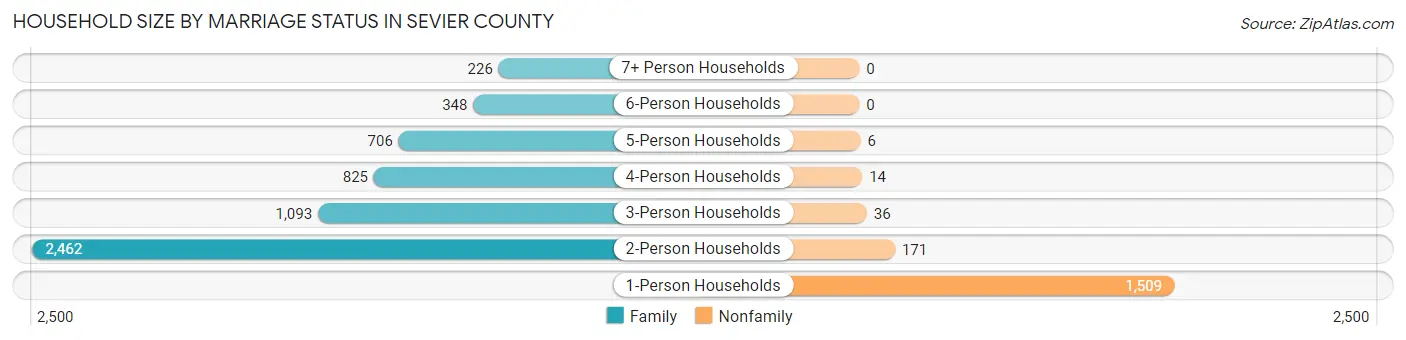
| Household Size | Family Households | Nonfamily Households |
| 1-Person Households | - | 1,509 (20.4%) |
| 2-Person Households | 2,462 (33.3%) | 171 (2.3%) |
| 3-Person Households | 1,093 (14.8%) | 36 (0.5%) |
| 4-Person Households | 825 (11.2%) | 14 (0.2%) |
| 5-Person Households | 706 (9.6%) | 6 (0.1%) |
| 6-Person Households | 348 (4.7%) | 0 (0.0%) |
| 7+ Person Households | 226 (3.1%) | 0 (0.0%) |
| Total | 5,660 (76.5%) | 1,736 (23.5%) |
Female Fertility in Sevier County
Fertility by Age in Sevier County
Average fertility rate in Sevier County is 75.0 births per 1,000 women. Women in the age bracket of 20 to 34 years have the highest fertility rate with 150.0 births per 1,000 women. Women in the age bracket of 20 to 34 years acount for 75.1% of all women with births.
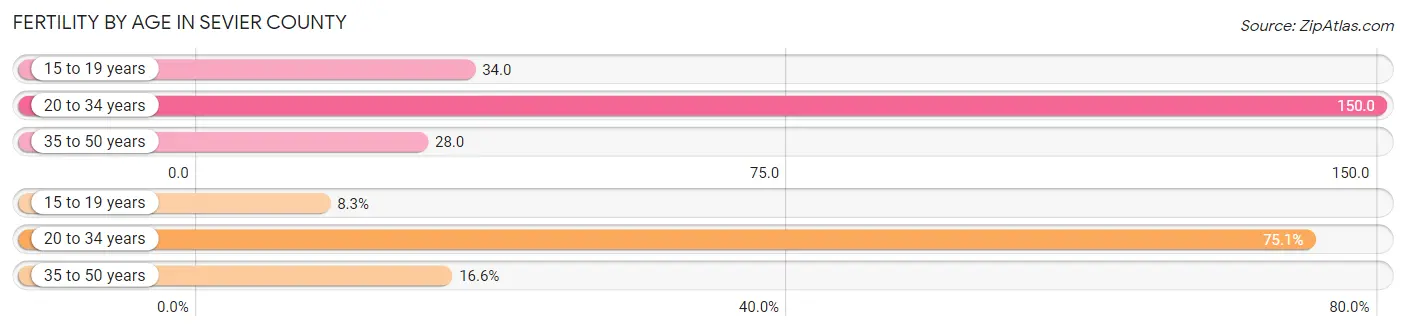
| Age Bracket | Women with Births | Births / 1,000 Women |
| 15 to 19 years | 29 (8.3%) | 34.0 |
| 20 to 34 years | 263 (75.1%) | 150.0 |
| 35 to 50 years | 58 (16.6%) | 28.0 |
| Total | 350 (100.0%) | 75.0 |
Fertility by Age by Marriage Status in Sevier County
84.3% of women with births (350) in Sevier County are married. The highest percentage of unmarried women with births falls into 20 to 34 years age bracket with 20.9% of them unmarried at the time of birth, while the lowest percentage of unmarried women with births belong to 15 to 19 years age bracket with 0.0% of them unmarried.
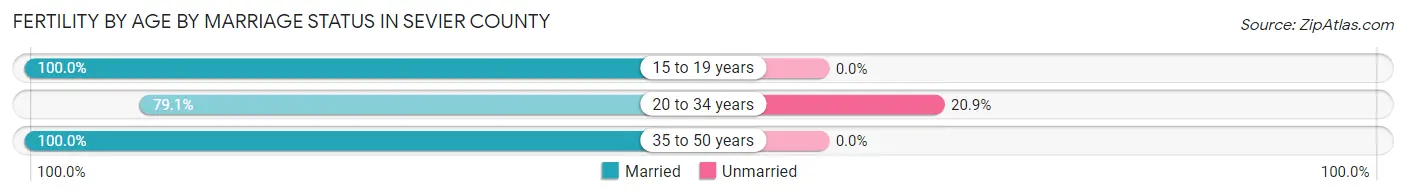
| Age Bracket | Married | Unmarried |
| 15 to 19 years | 29 (100.0%) | 0 (0.0%) |
| 20 to 34 years | 208 (79.1%) | 55 (20.9%) |
| 35 to 50 years | 58 (100.0%) | 0 (0.0%) |
| Total | 295 (84.3%) | 55 (15.7%) |
Fertility by Education in Sevier County
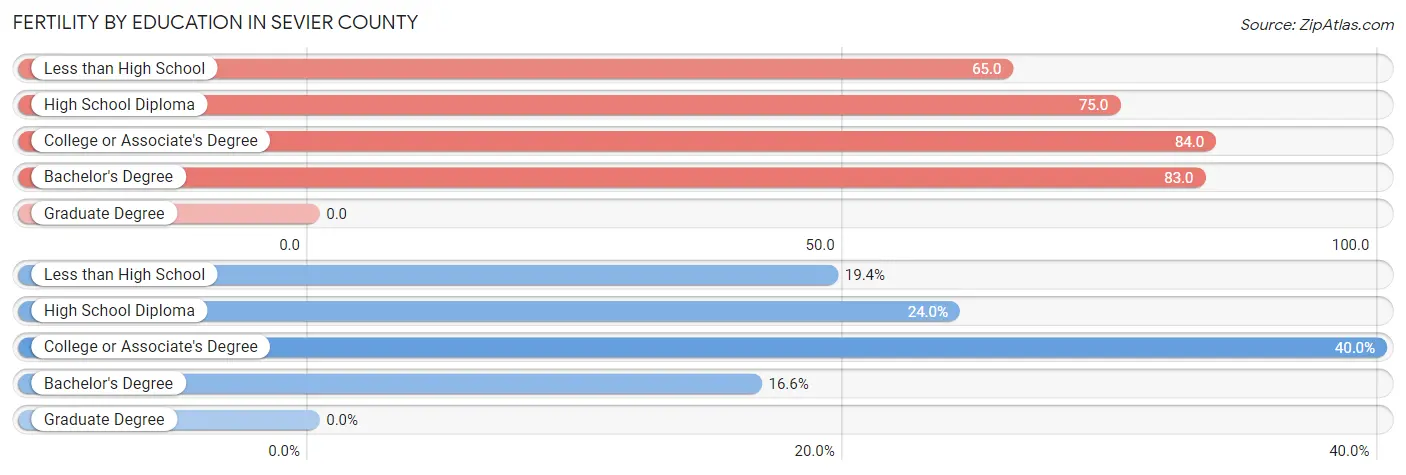
| Educational Attainment | Women with Births | Births / 1,000 Women |
| Less than High School | 68 (19.4%) | 65.0 |
| High School Diploma | 84 (24.0%) | 75.0 |
| College or Associate's Degree | 140 (40.0%) | 84.0 |
| Bachelor's Degree | 58 (16.6%) | 83.0 |
| Graduate Degree | 0 (0.0%) | 0.0 |
| Total | 350 (100.0%) | 75.0 |
Fertility by Education by Marriage Status in Sevier County
15.7% of women with births in Sevier County are unmarried. Women with the educational attainment of less than high school are most likely to be married with 100.0% of them married at childbirth, while women with the educational attainment of high school diploma are least likely to be married with 27.4% of them unmarried at childbirth.
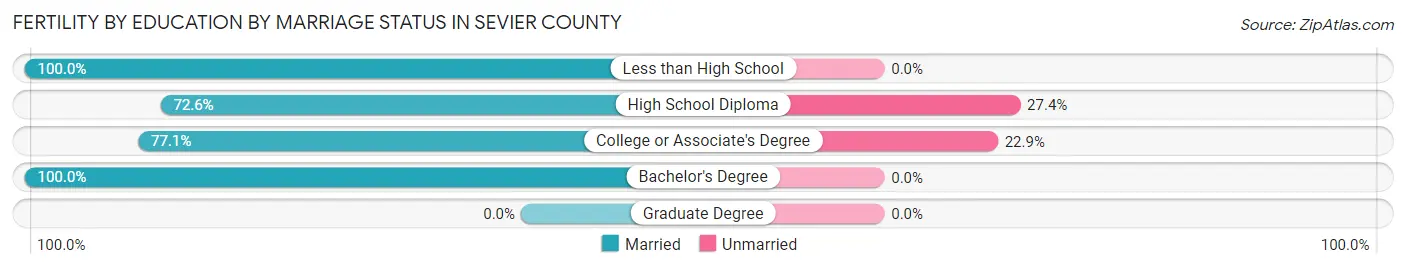
| Educational Attainment | Married | Unmarried |
| Less than High School | 68 (100.0%) | 0 (0.0%) |
| High School Diploma | 61 (72.6%) | 23 (27.4%) |
| College or Associate's Degree | 108 (77.1%) | 32 (22.9%) |
| Bachelor's Degree | 58 (100.0%) | 0 (0.0%) |
| Graduate Degree | 0 (0.0%) | 0 (0.0%) |
| Total | 295 (84.3%) | 55 (15.7%) |
Income in Sevier County
Income Overview in Sevier County
Per Capita Income in Sevier County is $28,859, while median incomes of families and households are $76,808 and $66,972 respectively.
| Characteristic | Number | Measure |
| Per Capita Income | 21,667 | $28,859 |
| Median Family Income | 5,660 | $76,808 |
| Mean Family Income | 5,660 | $90,038 |
| Median Household Income | 7,396 | $66,972 |
| Mean Household Income | 7,396 | $81,543 |
| Income Deficit | 5,660 | $9,308 |
| Wage / Income Gap (%) | 21,667 | 52.57% |
| Wage / Income Gap ($) | 21,667 | 47.43¢ per $1 |
| Gini / Inequality Index | 21,667 | 0.39 |
Earnings by Sex in Sevier County
Average Earnings in Sevier County are $34,085, $46,296 for men and $21,957 for women, a difference of 52.6%.
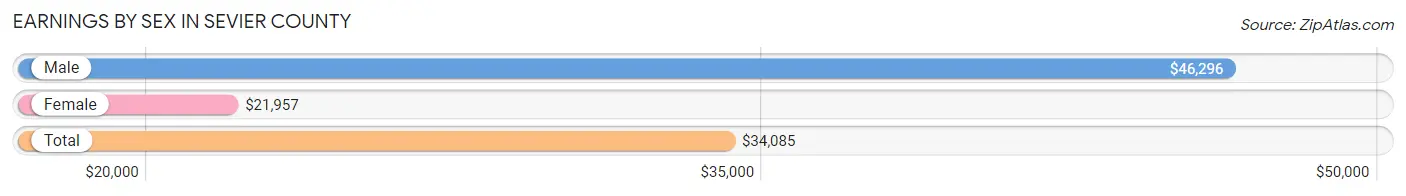
| Sex | Number | Average Earnings |
| Male | 6,034 (56.9%) | $46,296 |
| Female | 4,575 (43.1%) | $21,957 |
| Total | 10,609 (100.0%) | $34,085 |
Earnings by Sex by Income Bracket in Sevier County
The most common earnings brackets in Sevier County are $55,000 to $64,999 for men (740 | 12.3%) and $2,499 or less for women (431 | 9.4%).
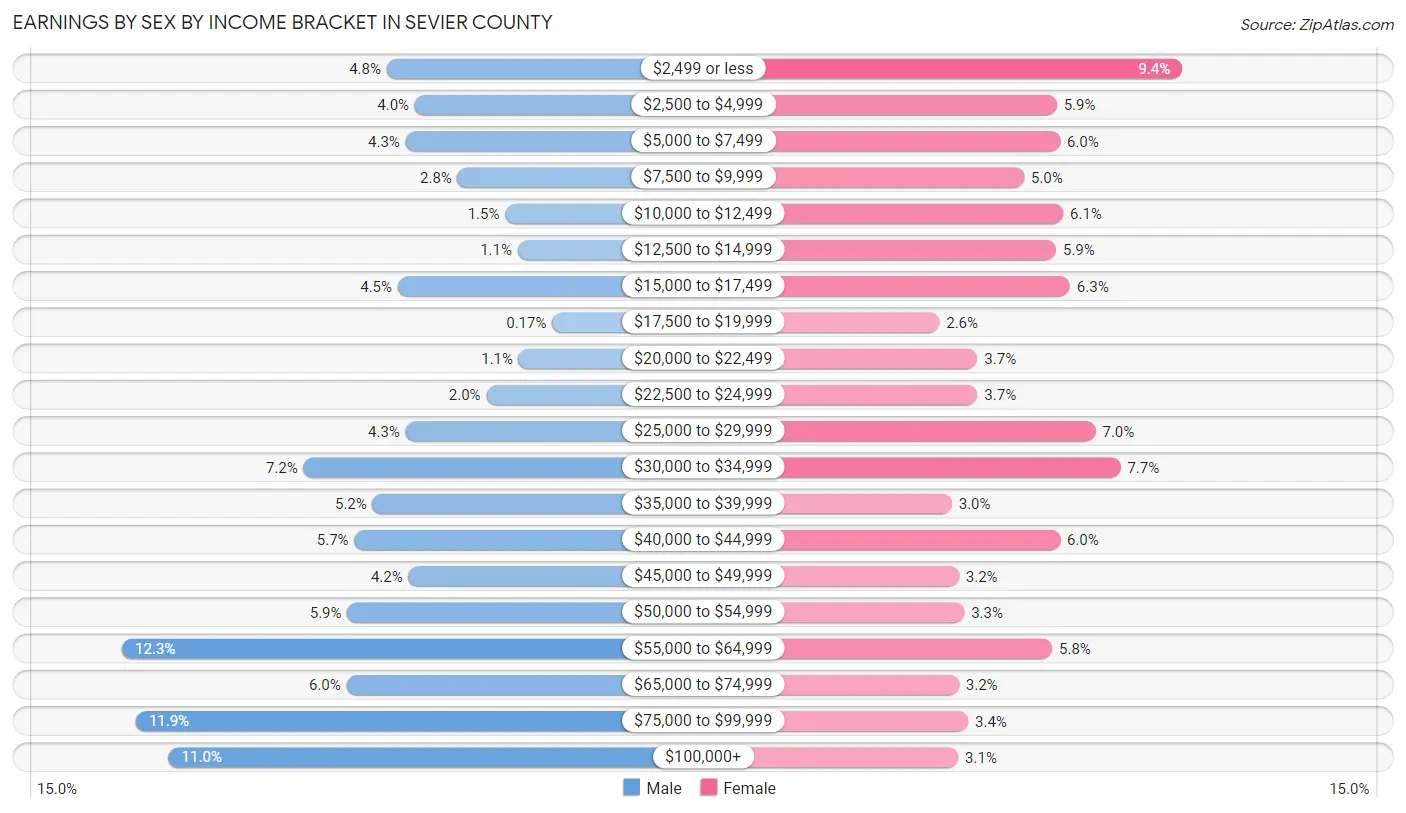
| Income | Male | Female |
| $2,499 or less | 291 (4.8%) | 431 (9.4%) |
| $2,500 to $4,999 | 243 (4.0%) | 270 (5.9%) |
| $5,000 to $7,499 | 259 (4.3%) | 274 (6.0%) |
| $7,500 to $9,999 | 171 (2.8%) | 228 (5.0%) |
| $10,000 to $12,499 | 90 (1.5%) | 278 (6.1%) |
| $12,500 to $14,999 | 69 (1.1%) | 269 (5.9%) |
| $15,000 to $17,499 | 272 (4.5%) | 287 (6.3%) |
| $17,500 to $19,999 | 10 (0.2%) | 119 (2.6%) |
| $20,000 to $22,499 | 67 (1.1%) | 168 (3.7%) |
| $22,500 to $24,999 | 122 (2.0%) | 168 (3.7%) |
| $25,000 to $29,999 | 259 (4.3%) | 320 (7.0%) |
| $30,000 to $34,999 | 432 (7.2%) | 352 (7.7%) |
| $35,000 to $39,999 | 315 (5.2%) | 135 (2.9%) |
| $40,000 to $44,999 | 346 (5.7%) | 274 (6.0%) |
| $45,000 to $49,999 | 254 (4.2%) | 144 (3.2%) |
| $50,000 to $54,999 | 358 (5.9%) | 151 (3.3%) |
| $55,000 to $64,999 | 740 (12.3%) | 264 (5.8%) |
| $65,000 to $74,999 | 359 (5.9%) | 144 (3.2%) |
| $75,000 to $99,999 | 716 (11.9%) | 156 (3.4%) |
| $100,000+ | 661 (11.0%) | 143 (3.1%) |
| Total | 6,034 (100.0%) | 4,575 (100.0%) |
Earnings by Sex by Educational Attainment in Sevier County
Average earnings in Sevier County are $55,686 for men and $26,807 for women, a difference of 51.9%. Men with an educational attainment of graduate degree enjoy the highest average annual earnings of $83,750, while those with less than high school education earn the least with $34,563. Women with an educational attainment of graduate degree earn the most with the average annual earnings of $59,150, while those with high school diploma education have the smallest earnings of $19,647.
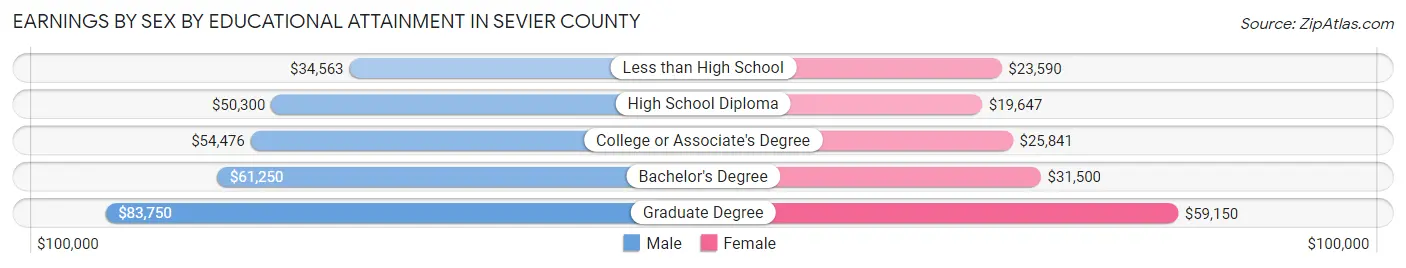
| Educational Attainment | Male Income | Female Income |
| Less than High School | $34,563 | $23,590 |
| High School Diploma | $50,300 | $19,647 |
| College or Associate's Degree | $54,476 | $25,841 |
| Bachelor's Degree | $61,250 | $31,500 |
| Graduate Degree | $83,750 | $59,150 |
| Total | $55,686 | $26,807 |
Family Income in Sevier County
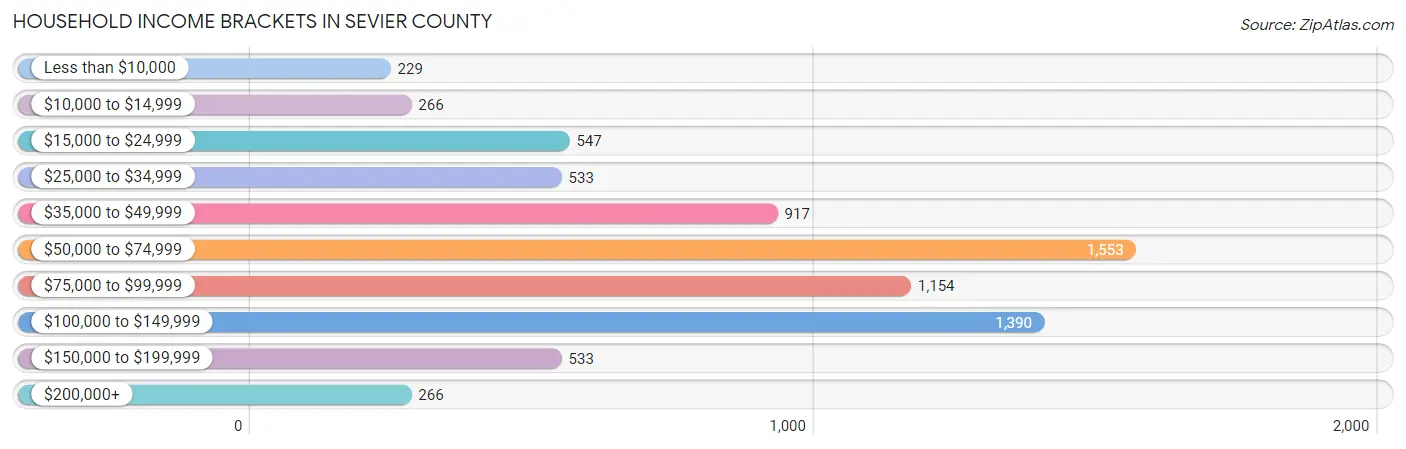
Family Income Brackets in Sevier County
According to the Sevier County family income data, there are 1,257 families falling into the $50,000 to $74,999 income range, which is the most common income bracket and makes up 22.2% of all families. Conversely, the less than $10,000 income bracket is the least frequent group with only 96 families (1.7%) belonging to this category.
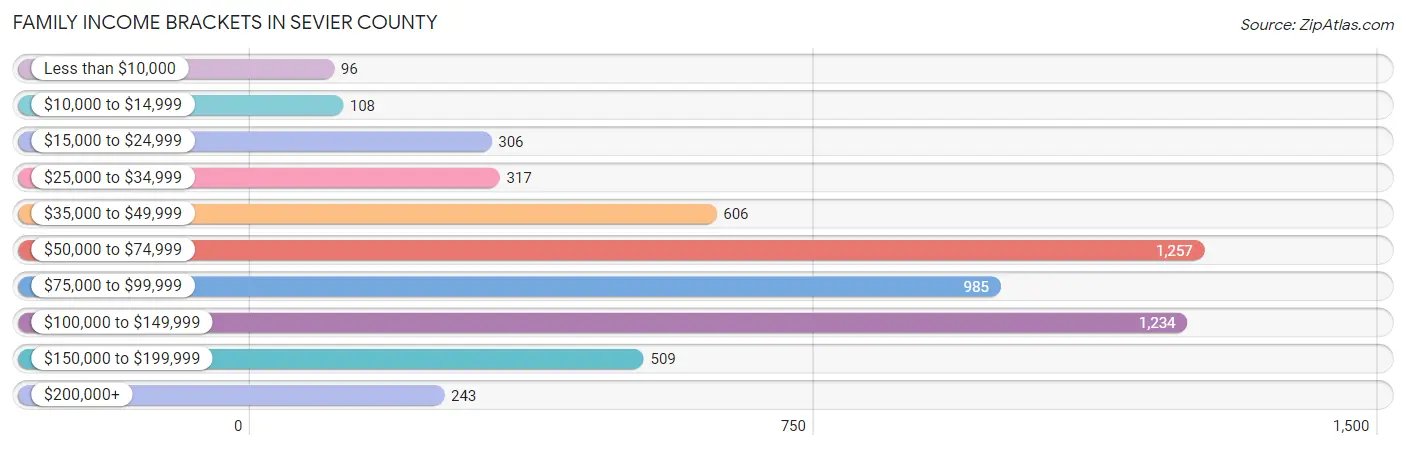
| Income Bracket | # Families | % Families |
| Less than $10,000 | 96 | 1.7% |
| $10,000 to $14,999 | 108 | 1.9% |
| $15,000 to $24,999 | 306 | 5.4% |
| $25,000 to $34,999 | 317 | 5.6% |
| $35,000 to $49,999 | 606 | 10.7% |
| $50,000 to $74,999 | 1,257 | 22.2% |
| $75,000 to $99,999 | 985 | 17.4% |
| $100,000 to $149,999 | 1,234 | 21.8% |
| $150,000 to $199,999 | 509 | 9.0% |
| $200,000+ | 243 | 4.3% |
Family Income by Famaliy Size in Sevier County
7+ person families (179 | 3.2%) account for the highest median family income in Sevier County with $101,719 per family, while 2-person families (2,590 | 45.8%) have the highest median income of $35,597 per family member.
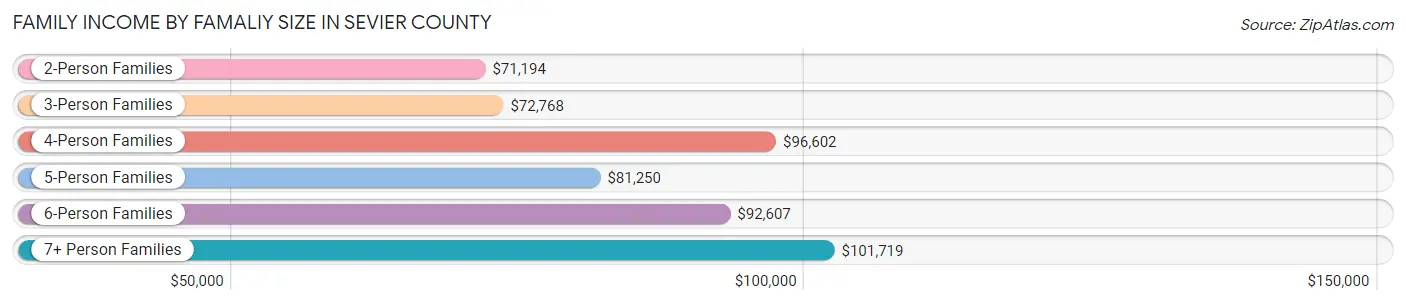
| Income Bracket | # Families | Median Income |
| 2-Person Families | 2,590 (45.8%) | $71,194 |
| 3-Person Families | 1,059 (18.7%) | $72,768 |
| 4-Person Families | 787 (13.9%) | $96,602 |
| 5-Person Families | 702 (12.4%) | $81,250 |
| 6-Person Families | 343 (6.1%) | $92,607 |
| 7+ Person Families | 179 (3.2%) | $101,719 |
| Total | 5,660 (100.0%) | $76,808 |
Family Income by Number of Earners in Sevier County
The median family income in Sevier County is $76,808, with families comprising 3+ earners (688) having the highest median family income of $129,286, while families with no earners (942) have the lowest median family income of $53,864, accounting for 12.2% and 16.6% of families, respectively.
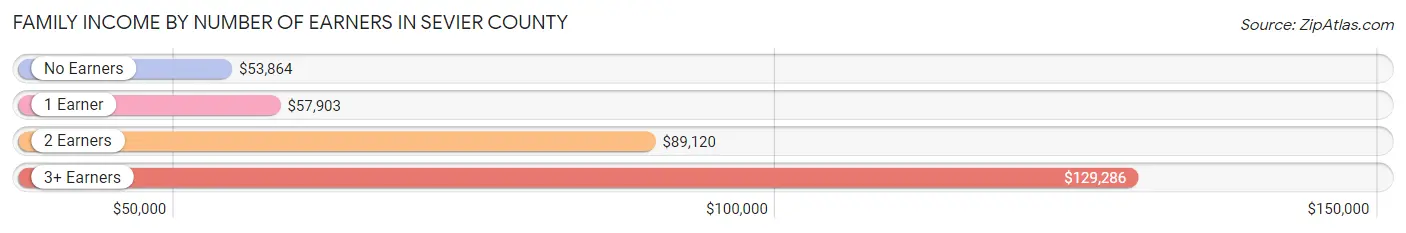
| Number of Earners | # Families | Median Income |
| No Earners | 942 (16.6%) | $53,864 |
| 1 Earner | 1,644 (29.0%) | $57,903 |
| 2 Earners | 2,386 (42.2%) | $89,120 |
| 3+ Earners | 688 (12.2%) | $129,286 |
| Total | 5,660 (100.0%) | $76,808 |
Household Income in Sevier County
Household Income Brackets in Sevier County
With 1,553 households falling in the category, the $50,000 to $74,999 income range is the most frequent in Sevier County, accounting for 21.0% of all households. In contrast, only 229 households (3.1%) fall into the less than $10,000 income bracket, making it the least populous group.
| Income Bracket | # Households | % Households |
| Less than $10,000 | 229 | 3.1% |
| $10,000 to $14,999 | 266 | 3.6% |
| $15,000 to $24,999 | 547 | 7.4% |
| $25,000 to $34,999 | 533 | 7.2% |
| $35,000 to $49,999 | 917 | 12.4% |
| $50,000 to $74,999 | 1,553 | 21.0% |
| $75,000 to $99,999 | 1,154 | 15.6% |
| $100,000 to $149,999 | 1,390 | 18.8% |
| $150,000 to $199,999 | 533 | 7.2% |
| $200,000+ | 266 | 3.6% |
Household Income by Householder Age in Sevier County
The median household income in Sevier County is $66,972, with the highest median household income of $83,074 found in the 45 to 64 years age bracket for the primary householder. A total of 2,582 households (34.9%) fall into this category. Meanwhile, the 65+ years age bracket for the primary householder has the lowest median household income of $53,894, with 2,045 households (27.7%) in this group.
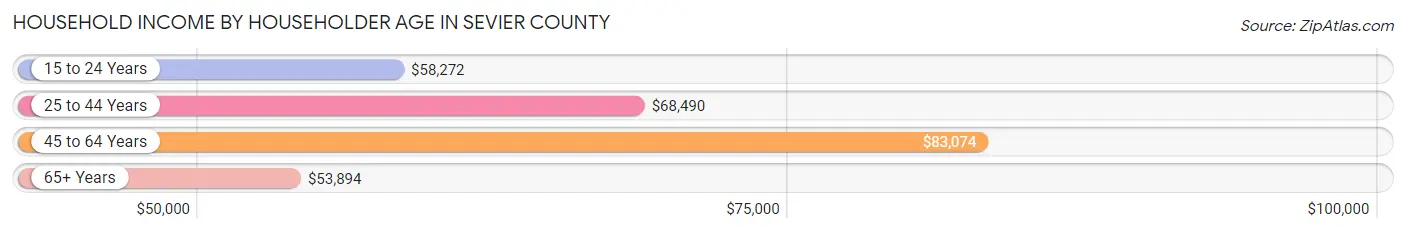
| Income Bracket | # Households | Median Income |
| 15 to 24 Years | 398 (5.4%) | $58,272 |
| 25 to 44 Years | 2,371 (32.1%) | $68,490 |
| 45 to 64 Years | 2,582 (34.9%) | $83,074 |
| 65+ Years | 2,045 (27.7%) | $53,894 |
| Total | 7,396 (100.0%) | $66,972 |
Poverty in Sevier County
Income Below Poverty by Sex and Age in Sevier County
With 9.6% poverty level for males and 14.0% for females among the residents of Sevier County, 5 year old males and under 5 year old females are the most vulnerable to poverty, with 11 males (15.7%) and 191 females (29.6%) in their respective age groups living below the poverty level.
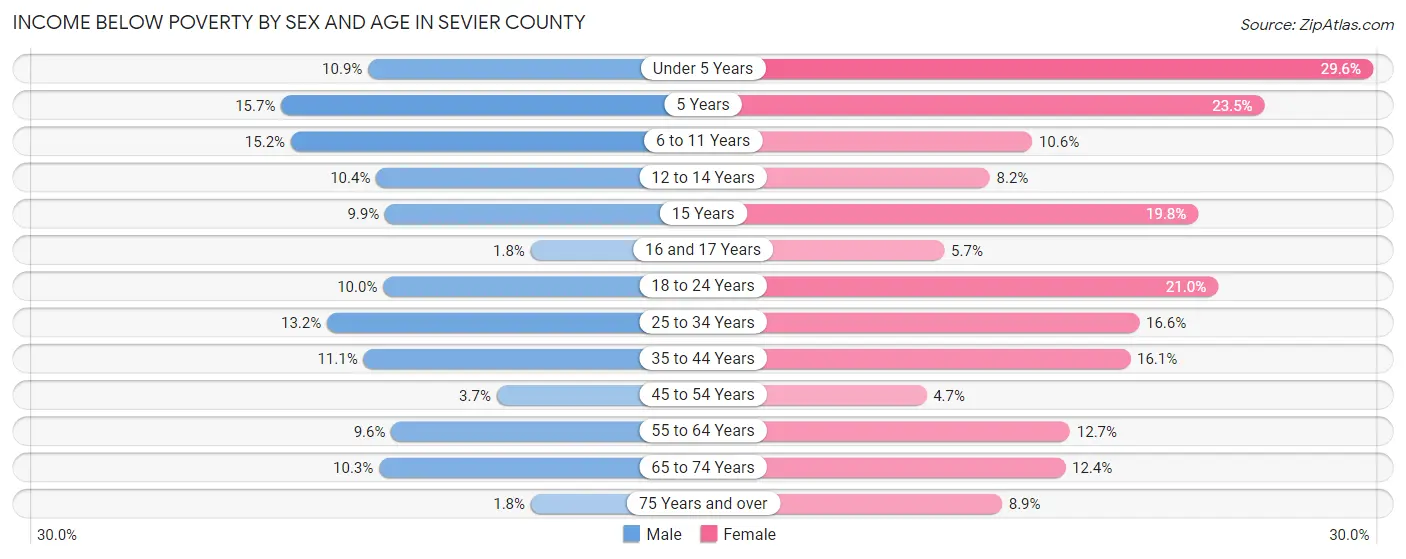
| Age Bracket | Male | Female |
| Under 5 Years | 85 (10.9%) | 191 (29.6%) |
| 5 Years | 11 (15.7%) | 36 (23.5%) |
| 6 to 11 Years | 165 (15.2%) | 113 (10.6%) |
| 12 to 14 Years | 62 (10.4%) | 38 (8.2%) |
| 15 Years | 14 (9.9%) | 51 (19.8%) |
| 16 and 17 Years | 9 (1.8%) | 18 (5.7%) |
| 18 to 24 Years | 92 (10.0%) | 186 (20.9%) |
| 25 to 34 Years | 170 (13.2%) | 186 (16.6%) |
| 35 to 44 Years | 159 (11.1%) | 235 (16.1%) |
| 45 to 54 Years | 43 (3.7%) | 47 (4.7%) |
| 55 to 64 Years | 118 (9.6%) | 158 (12.7%) |
| 65 to 74 Years | 106 (10.3%) | 130 (12.4%) |
| 75 Years and over | 12 (1.8%) | 66 (8.9%) |
| Total | 1,046 (9.6%) | 1,455 (14.0%) |
Income Above Poverty by Sex and Age in Sevier County
According to the poverty statistics in Sevier County, males aged 75 years and over and females aged 45 to 54 years are the age groups that are most secure financially, with 98.2% of males and 95.3% of females in these age groups living above the poverty line.
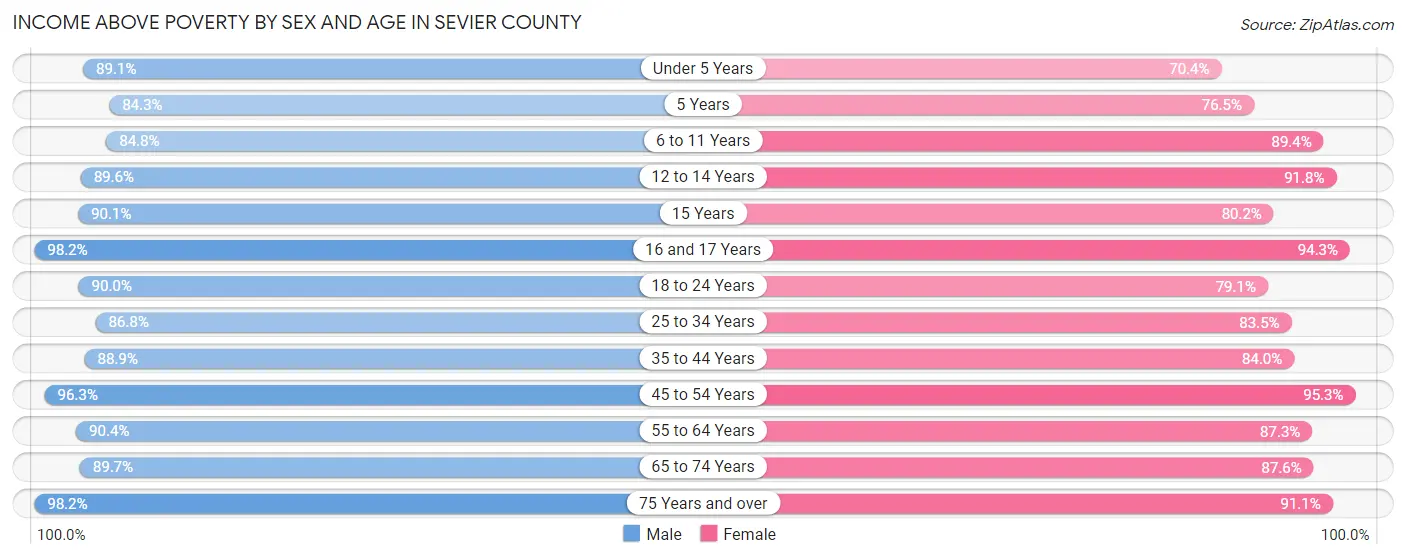
| Age Bracket | Male | Female |
| Under 5 Years | 697 (89.1%) | 455 (70.4%) |
| 5 Years | 59 (84.3%) | 117 (76.5%) |
| 6 to 11 Years | 923 (84.8%) | 954 (89.4%) |
| 12 to 14 Years | 533 (89.6%) | 424 (91.8%) |
| 15 Years | 127 (90.1%) | 206 (80.2%) |
| 16 and 17 Years | 486 (98.2%) | 298 (94.3%) |
| 18 to 24 Years | 825 (90.0%) | 702 (79.0%) |
| 25 to 34 Years | 1,122 (86.8%) | 938 (83.5%) |
| 35 to 44 Years | 1,270 (88.9%) | 1,229 (84.0%) |
| 45 to 54 Years | 1,115 (96.3%) | 953 (95.3%) |
| 55 to 64 Years | 1,114 (90.4%) | 1,086 (87.3%) |
| 65 to 74 Years | 927 (89.7%) | 916 (87.6%) |
| 75 Years and over | 651 (98.2%) | 675 (91.1%) |
| Total | 9,849 (90.4%) | 8,953 (86.0%) |
Income Below Poverty Among Married-Couple Families in Sevier County
The poverty statistics for married-couple families in Sevier County show that 8.2% or 398 of the total 4,871 families live below the poverty line. Families with 5 or more children have the highest poverty rate of 40.7%, comprising of 55 families. On the other hand, families with 3 or 4 children have the lowest poverty rate of 6.4%, which includes 51 families.
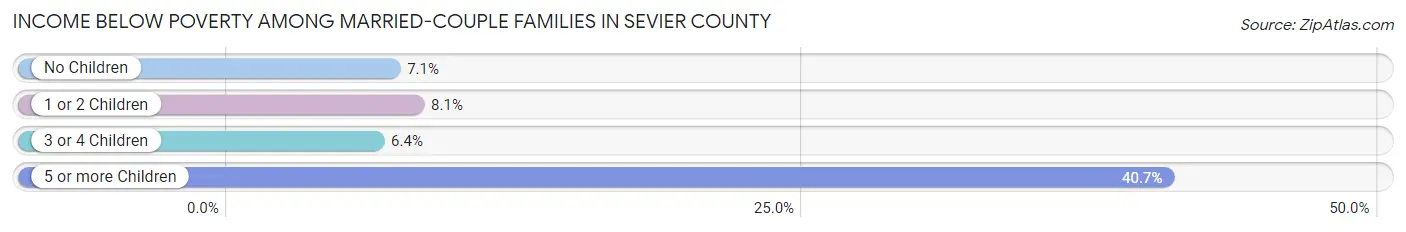
| Children | Above Poverty | Below Poverty |
| No Children | 2,371 (92.9%) | 180 (7.1%) |
| 1 or 2 Children | 1,271 (91.9%) | 112 (8.1%) |
| 3 or 4 Children | 751 (93.6%) | 51 (6.4%) |
| 5 or more Children | 80 (59.3%) | 55 (40.7%) |
| Total | 4,473 (91.8%) | 398 (8.2%) |
Income Below Poverty Among Single-Parent Households in Sevier County
According to the poverty data in Sevier County, 8.1% or 19 single-father households and 19.9% or 110 single-mother households are living below the poverty line. Among single-father households, those with 1 or 2 children have the highest poverty rate, with 12 households (9.9%) experiencing poverty. Likewise, among single-mother households, those with 3 or 4 children have the highest poverty rate, with 41 households (57.8%) falling below the poverty line.
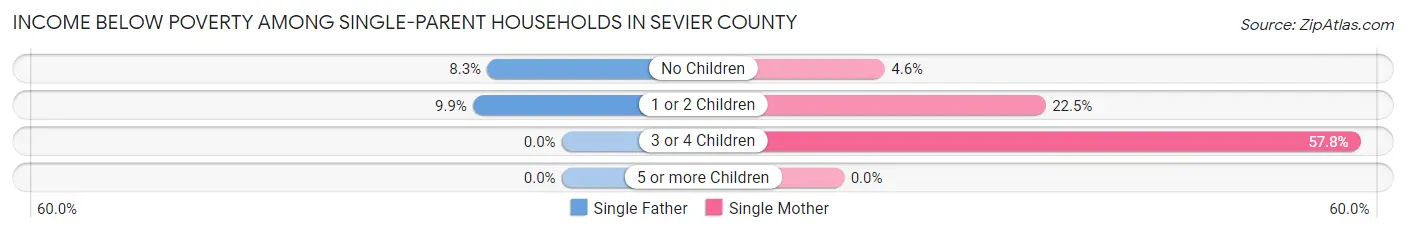
| Children | Single Father | Single Mother |
| No Children | 7 (8.3%) | 10 (4.5%) |
| 1 or 2 Children | 12 (9.9%) | 59 (22.5%) |
| 3 or 4 Children | 0 (0.0%) | 41 (57.8%) |
| 5 or more Children | 0 (0.0%) | 0 (0.0%) |
| Total | 19 (8.1%) | 110 (19.9%) |
Income Below Poverty Among Married-Couple vs Single-Parent Households in Sevier County
The poverty data for Sevier County shows that 398 of the married-couple family households (8.2%) and 129 of the single-parent households (16.4%) are living below the poverty level. Within the married-couple family households, those with 5 or more children have the highest poverty rate, with 55 households (40.7%) falling below the poverty line. Among the single-parent households, those with 3 or 4 children have the highest poverty rate, with 41 household (42.3%) living below poverty.
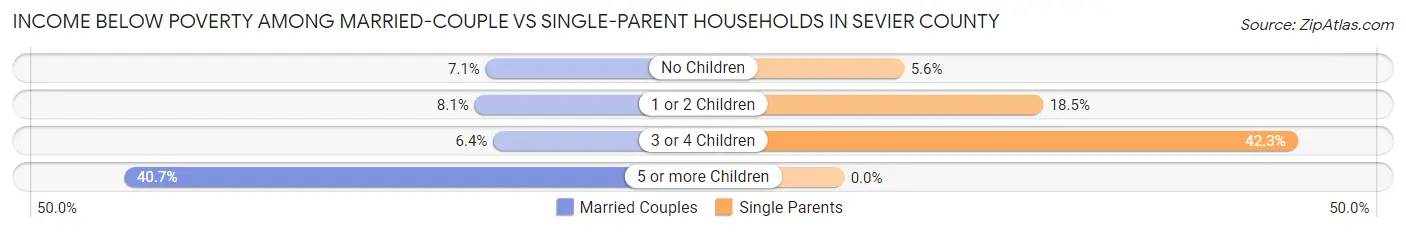
| Children | Married-Couple Families | Single-Parent Households |
| No Children | 180 (7.1%) | 17 (5.6%) |
| 1 or 2 Children | 112 (8.1%) | 71 (18.5%) |
| 3 or 4 Children | 51 (6.4%) | 41 (42.3%) |
| 5 or more Children | 55 (40.7%) | 0 (0.0%) |
| Total | 398 (8.2%) | 129 (16.4%) |
Employment Characteristics in Sevier County
Employment by Class of Employer in Sevier County
Among the 9,170 employed individuals in Sevier County, private company employees (5,854 | 63.8%), state government employees (969 | 10.6%), and local government employees (720 | 7.9%) make up the most common classes of employment.
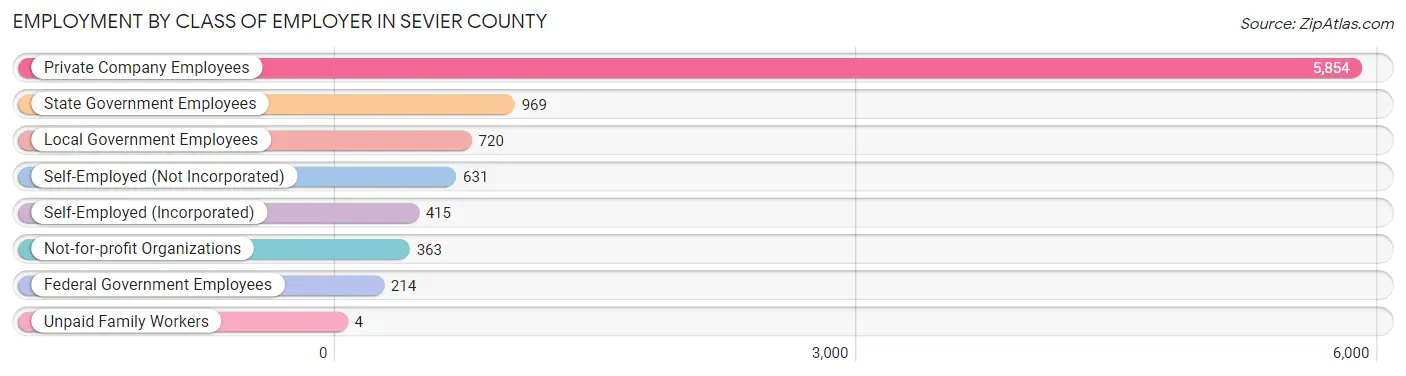
| Employer Class | # Employees | % Employees |
| Private Company Employees | 5,854 | 63.8% |
| Self-Employed (Incorporated) | 415 | 4.5% |
| Self-Employed (Not Incorporated) | 631 | 6.9% |
| Not-for-profit Organizations | 363 | 4.0% |
| Local Government Employees | 720 | 7.9% |
| State Government Employees | 969 | 10.6% |
| Federal Government Employees | 214 | 2.3% |
| Unpaid Family Workers | 4 | 0.0% |
| Total | 9,170 | 100.0% |
Employment Status by Age in Sevier County
According to the labor force statistics for Sevier County, out of the total population over 16 years of age (16,263), 60.6% or 9,855 individuals are in the labor force, with 4.9% or 483 of them unemployed. The age group with the highest labor force participation rate is 45 to 54 years, with 86.6% or 1,879 individuals in the labor force. Within the labor force, the 35 to 44 years age range has the highest percentage of unemployed individuals, with 9.4% or 219 of them being unemployed.
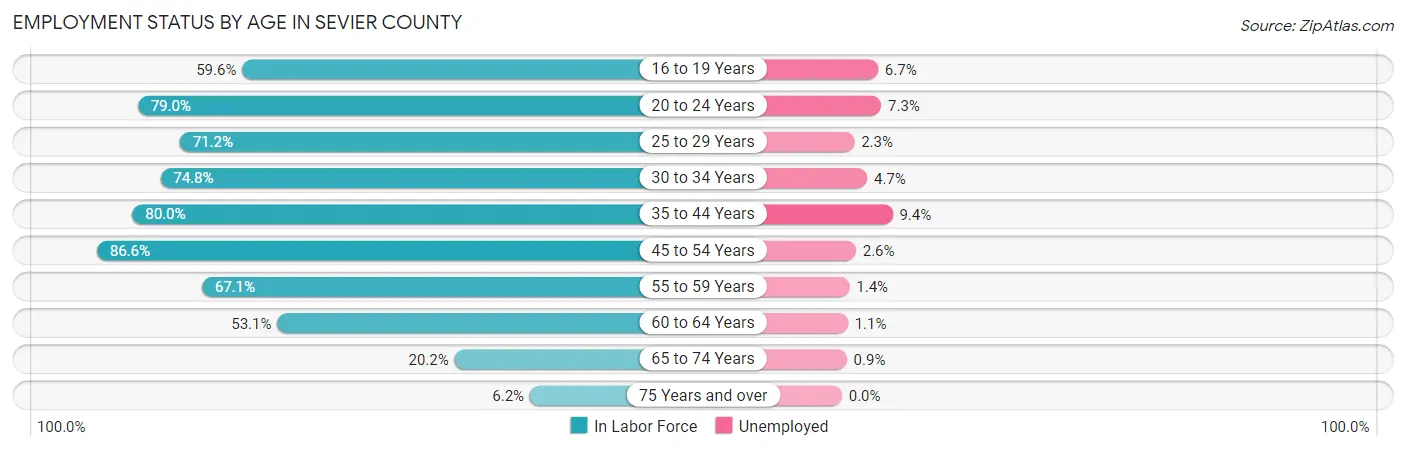
| Age Bracket | In Labor Force | Unemployed |
| 16 to 19 Years | 833 (59.6%) | 56 (6.7%) |
| 20 to 24 Years | 991 (79.0%) | 72 (7.3%) |
| 25 to 29 Years | 946 (71.2%) | 22 (2.3%) |
| 30 to 34 Years | 832 (74.8%) | 39 (4.7%) |
| 35 to 44 Years | 2,331 (80.0%) | 219 (9.4%) |
| 45 to 54 Years | 1,879 (86.6%) | 49 (2.6%) |
| 55 to 59 Years | 853 (67.1%) | 12 (1.4%) |
| 60 to 64 Years | 662 (53.1%) | 7 (1.1%) |
| 65 to 74 Years | 432 (20.2%) | 4 (0.9%) |
| 75 Years and over | 89 (6.2%) | 0 (0.0%) |
| Total | 9,855 (60.6%) | 483 (4.9%) |
Employment Status by Educational Attainment in Sevier County
According to labor force statistics for Sevier County, 74.7% of individuals (7,501) out of the total population between 25 and 64 years of age (10,041) are in the labor force, with 4.6% or 345 of them being unemployed. The group with the highest labor force participation rate are those with the educational attainment of bachelor's degree or higher, with 86.6% or 1,961 individuals in the labor force. Within the labor force, individuals with high school diploma education have the highest percentage of unemployment, with 11.0% or 241 of them being unemployed.
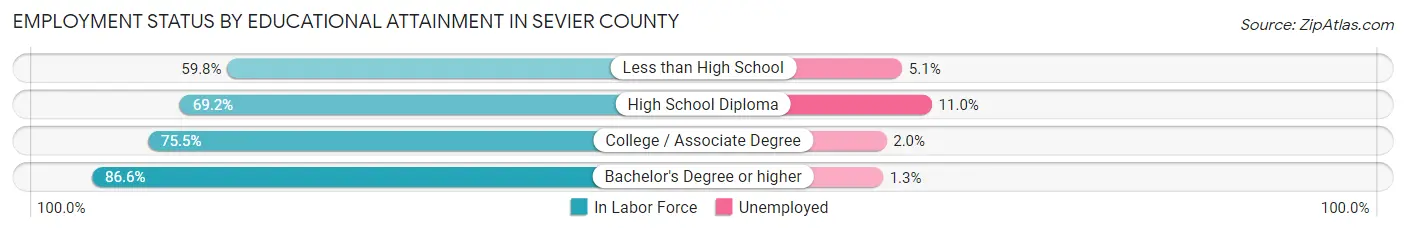
| Educational Attainment | In Labor Force | Unemployed |
| Less than High School | 487 (59.8%) | 42 (5.1%) |
| High School Diploma | 2,187 (69.2%) | 348 (11.0%) |
| College / Associate Degree | 2,871 (75.5%) | 76 (2.0%) |
| Bachelor's Degree or higher | 1,961 (86.6%) | 29 (1.3%) |
| Total | 7,501 (74.7%) | 462 (4.6%) |
Employment Occupations by Sex in Sevier County
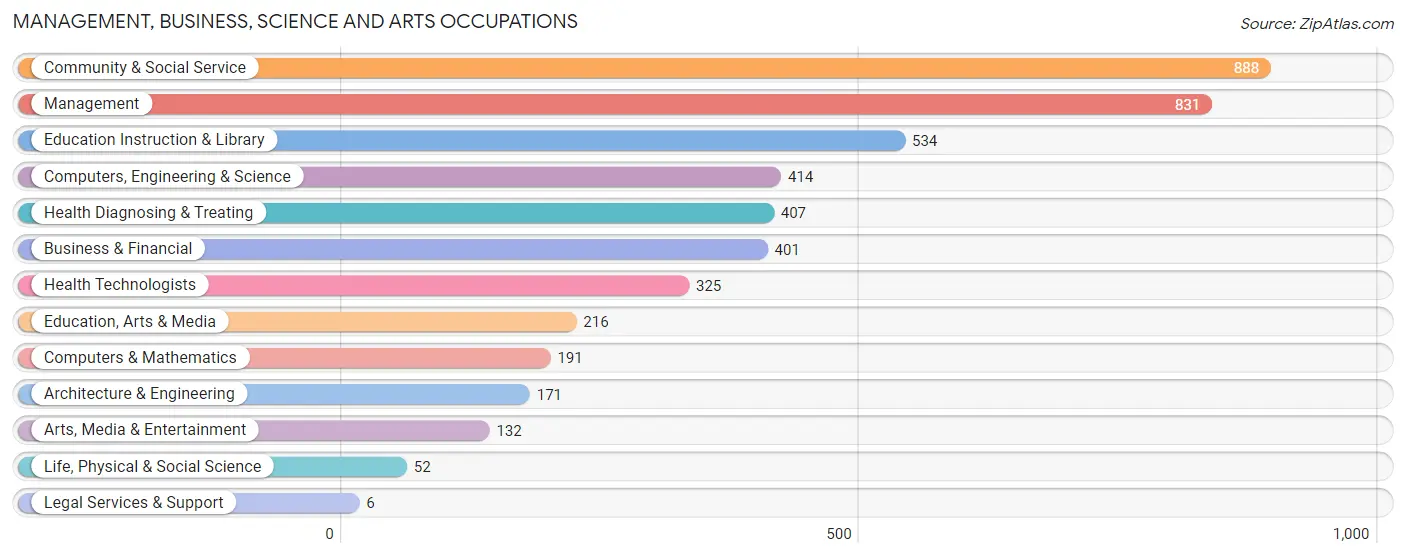
Management, Business, Science and Arts Occupations
The most common Management, Business, Science and Arts occupations in Sevier County are Community & Social Service (888 | 9.5%), Management (831 | 8.9%), Education Instruction & Library (534 | 5.7%), Computers, Engineering & Science (414 | 4.4%), and Health Diagnosing & Treating (407 | 4.3%).
Management, Business, Science and Arts Occupations by Sex
Within the Management, Business, Science and Arts occupations in Sevier County, the most male-oriented occupations are Computers & Mathematics (87.4%), Computers, Engineering & Science (80.2%), and Architecture & Engineering (75.4%), while the most female-oriented occupations are Legal Services & Support (83.3%), Education Instruction & Library (71.0%), and Community & Social Service (64.2%).
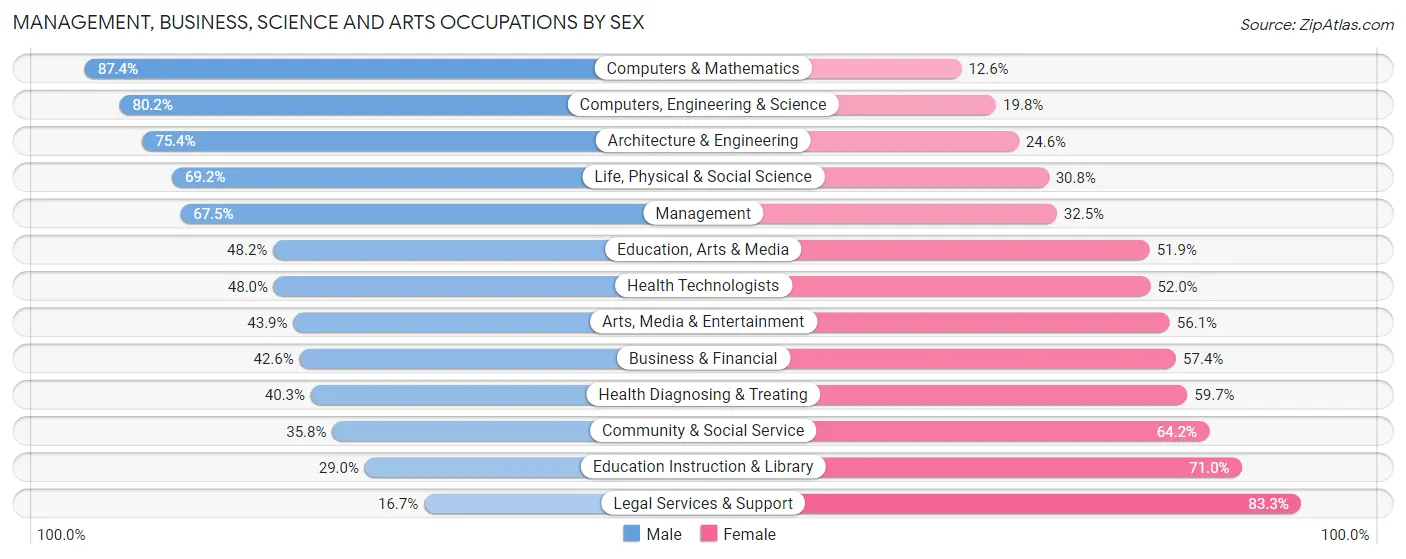
| Occupation | Male | Female |
| Management | 561 (67.5%) | 270 (32.5%) |
| Business & Financial | 171 (42.6%) | 230 (57.4%) |
| Computers, Engineering & Science | 332 (80.2%) | 82 (19.8%) |
| Computers & Mathematics | 167 (87.4%) | 24 (12.6%) |
| Architecture & Engineering | 129 (75.4%) | 42 (24.6%) |
| Life, Physical & Social Science | 36 (69.2%) | 16 (30.8%) |
| Community & Social Service | 318 (35.8%) | 570 (64.2%) |
| Education, Arts & Media | 104 (48.1%) | 112 (51.8%) |
| Legal Services & Support | 1 (16.7%) | 5 (83.3%) |
| Education Instruction & Library | 155 (29.0%) | 379 (71.0%) |
| Arts, Media & Entertainment | 58 (43.9%) | 74 (56.1%) |
| Health Diagnosing & Treating | 164 (40.3%) | 243 (59.7%) |
| Health Technologists | 156 (48.0%) | 169 (52.0%) |
| Total (Category) | 1,546 (52.6%) | 1,395 (47.4%) |
| Total (Overall) | 5,427 (58.0%) | 3,929 (42.0%) |
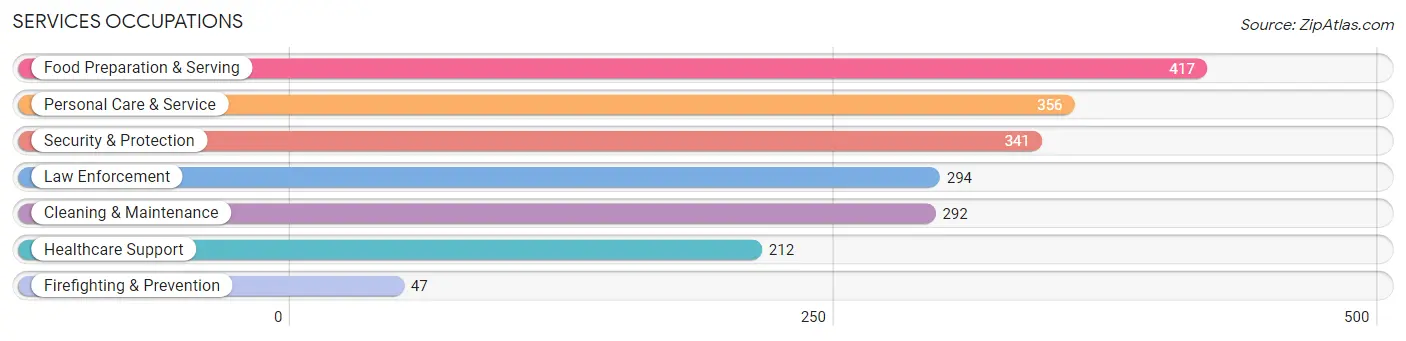
Services Occupations
The most common Services occupations in Sevier County are Food Preparation & Serving (417 | 4.5%), Personal Care & Service (356 | 3.8%), Security & Protection (341 | 3.6%), Law Enforcement (294 | 3.1%), and Cleaning & Maintenance (292 | 3.1%).
Services Occupations by Sex
Within the Services occupations in Sevier County, the most male-oriented occupations are Law Enforcement (96.9%), Security & Protection (93.3%), and Firefighting & Prevention (70.2%), while the most female-oriented occupations are Healthcare Support (87.7%), Personal Care & Service (81.7%), and Food Preparation & Serving (62.6%).
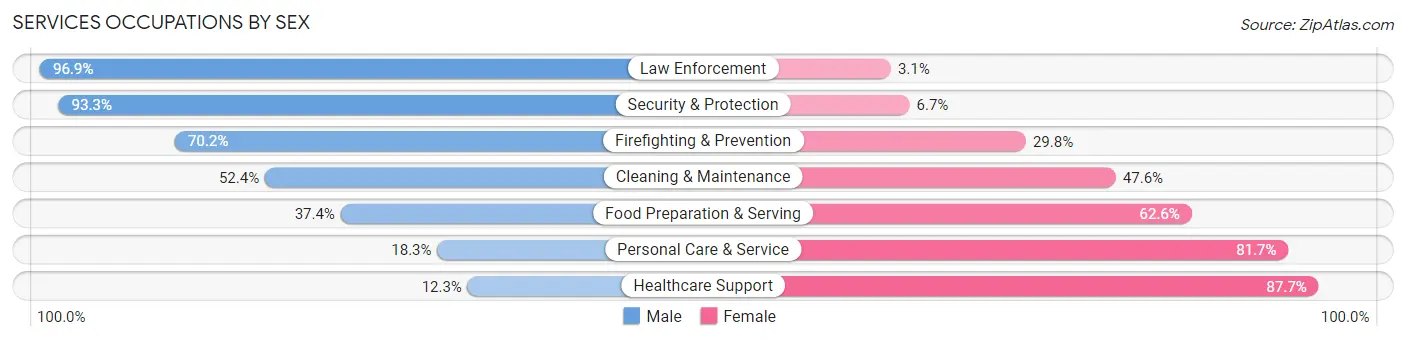
| Occupation | Male | Female |
| Healthcare Support | 26 (12.3%) | 186 (87.7%) |
| Security & Protection | 318 (93.3%) | 23 (6.7%) |
| Firefighting & Prevention | 33 (70.2%) | 14 (29.8%) |
| Law Enforcement | 285 (96.9%) | 9 (3.1%) |
| Food Preparation & Serving | 156 (37.4%) | 261 (62.6%) |
| Cleaning & Maintenance | 153 (52.4%) | 139 (47.6%) |
| Personal Care & Service | 65 (18.3%) | 291 (81.7%) |
| Total (Category) | 718 (44.4%) | 900 (55.6%) |
| Total (Overall) | 5,427 (58.0%) | 3,929 (42.0%) |
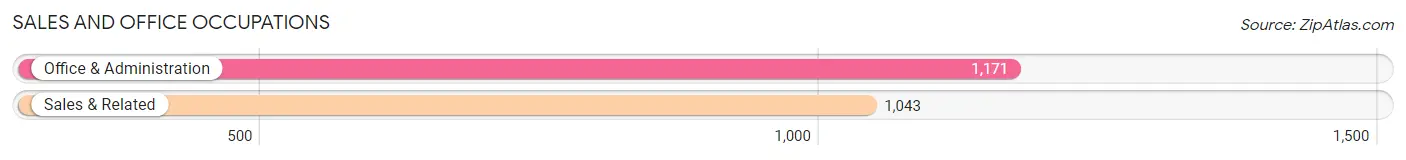
Sales and Office Occupations
The most common Sales and Office occupations in Sevier County are Office & Administration (1,171 | 12.5%), and Sales & Related (1,043 | 11.2%).
Sales and Office Occupations by Sex
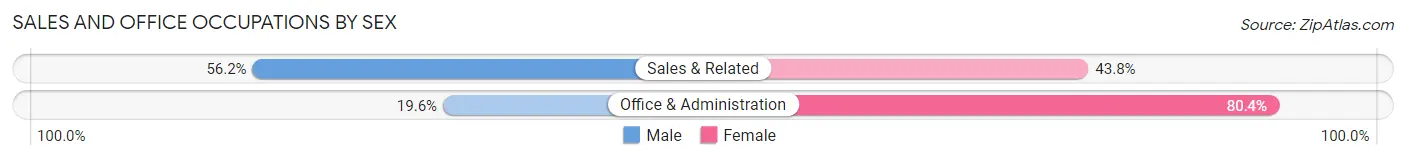
| Occupation | Male | Female |
| Sales & Related | 586 (56.2%) | 457 (43.8%) |
| Office & Administration | 229 (19.6%) | 942 (80.4%) |
| Total (Category) | 815 (36.8%) | 1,399 (63.2%) |
| Total (Overall) | 5,427 (58.0%) | 3,929 (42.0%) |
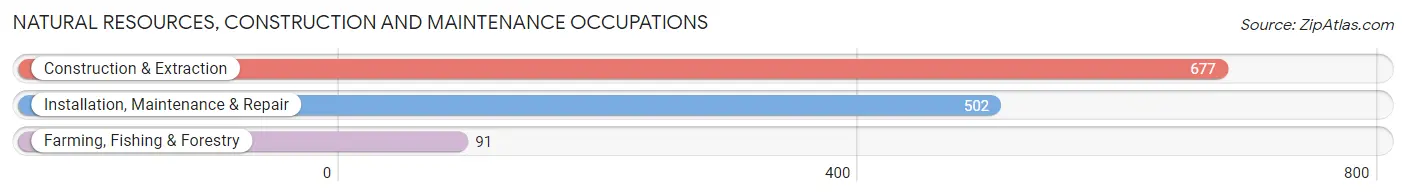
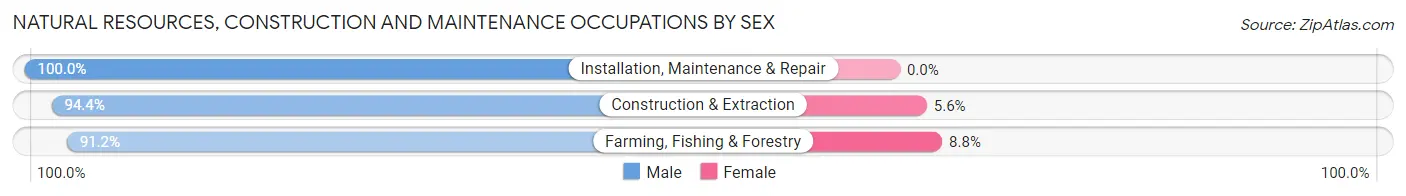
Natural Resources, Construction and Maintenance Occupations
The most common Natural Resources, Construction and Maintenance occupations in Sevier County are Construction & Extraction (677 | 7.2%), Installation, Maintenance & Repair (502 | 5.4%), and Farming, Fishing & Forestry (91 | 1.0%).
Natural Resources, Construction and Maintenance Occupations by Sex
| Occupation | Male | Female |
| Farming, Fishing & Forestry | 83 (91.2%) | 8 (8.8%) |
| Construction & Extraction | 639 (94.4%) | 38 (5.6%) |
| Installation, Maintenance & Repair | 502 (100.0%) | 0 (0.0%) |
| Total (Category) | 1,224 (96.4%) | 46 (3.6%) |
| Total (Overall) | 5,427 (58.0%) | 3,929 (42.0%) |
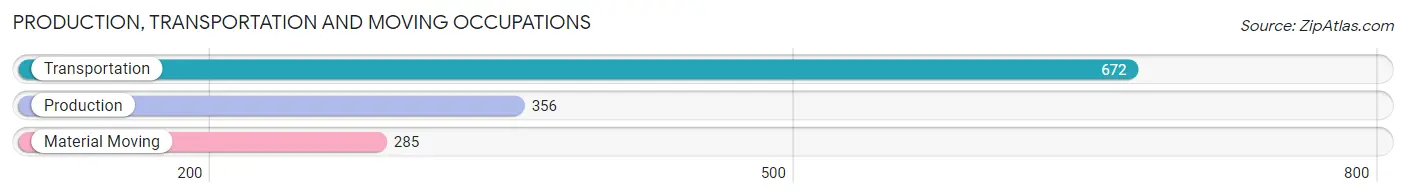
Production, Transportation and Moving Occupations
The most common Production, Transportation and Moving occupations in Sevier County are Transportation (672 | 7.2%), Production (356 | 3.8%), and Material Moving (285 | 3.0%).
Production, Transportation and Moving Occupations by Sex
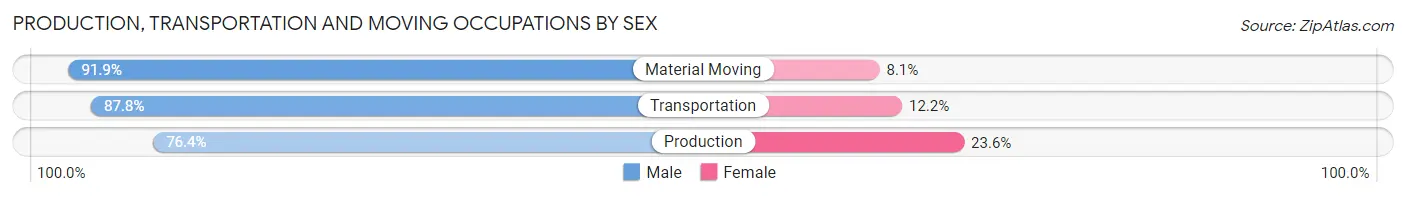
| Occupation | Male | Female |
| Production | 272 (76.4%) | 84 (23.6%) |
| Transportation | 590 (87.8%) | 82 (12.2%) |
| Material Moving | 262 (91.9%) | 23 (8.1%) |
| Total (Category) | 1,124 (85.6%) | 189 (14.4%) |
| Total (Overall) | 5,427 (58.0%) | 3,929 (42.0%) |
Employment Industries by Sex in Sevier County
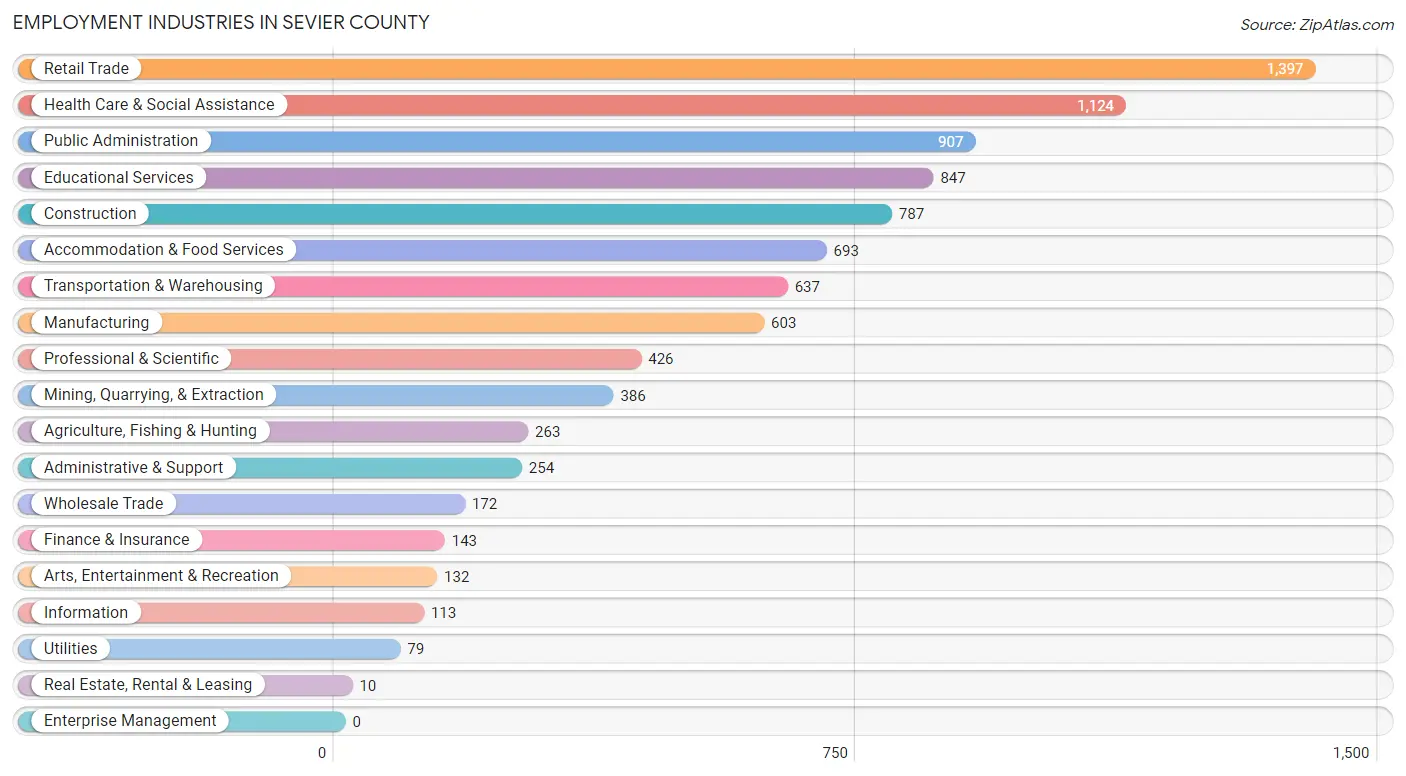
Employment Industries in Sevier County
The major employment industries in Sevier County include Retail Trade (1,397 | 14.9%), Health Care & Social Assistance (1,124 | 12.0%), Public Administration (907 | 9.7%), Educational Services (847 | 9.0%), and Construction (787 | 8.4%).
Employment Industries by Sex in Sevier County
The Sevier County industries that see more men than women are Mining, Quarrying, & Extraction (92.0%), Construction (86.5%), and Agriculture, Fishing & Hunting (81.8%), whereas the industries that tend to have a higher number of women are Real Estate, Rental & Leasing (100.0%), Health Care & Social Assistance (76.1%), and Information (66.4%).
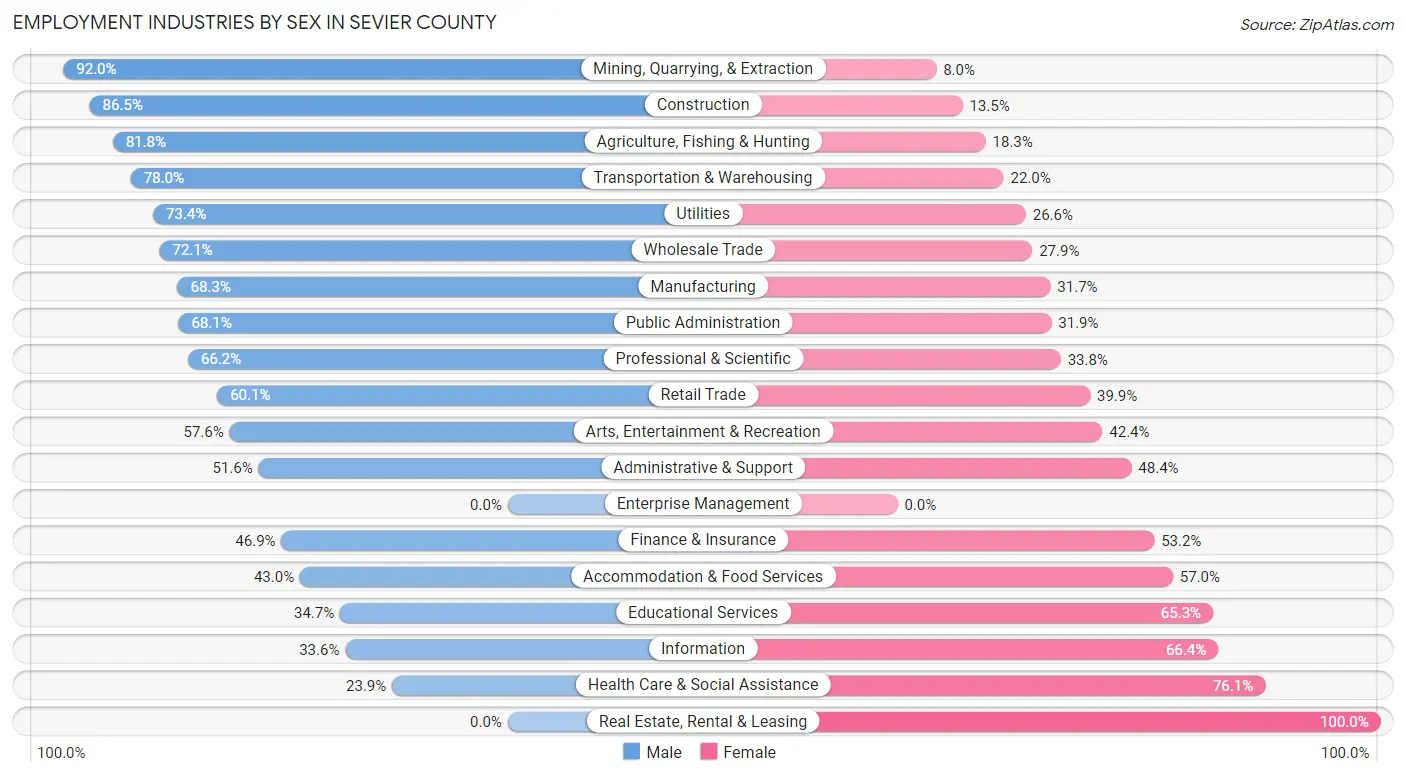
| Industry | Male | Female |
| Agriculture, Fishing & Hunting | 215 (81.8%) | 48 (18.2%) |
| Mining, Quarrying, & Extraction | 355 (92.0%) | 31 (8.0%) |
| Construction | 681 (86.5%) | 106 (13.5%) |
| Manufacturing | 412 (68.3%) | 191 (31.7%) |
| Wholesale Trade | 124 (72.1%) | 48 (27.9%) |
| Retail Trade | 840 (60.1%) | 557 (39.9%) |
| Transportation & Warehousing | 497 (78.0%) | 140 (22.0%) |
| Utilities | 58 (73.4%) | 21 (26.6%) |
| Information | 38 (33.6%) | 75 (66.4%) |
| Finance & Insurance | 67 (46.9%) | 76 (53.1%) |
| Real Estate, Rental & Leasing | 0 (0.0%) | 10 (100.0%) |
| Professional & Scientific | 282 (66.2%) | 144 (33.8%) |
| Enterprise Management | 0 (0.0%) | 0 (0.0%) |
| Administrative & Support | 131 (51.6%) | 123 (48.4%) |
| Educational Services | 294 (34.7%) | 553 (65.3%) |
| Health Care & Social Assistance | 269 (23.9%) | 855 (76.1%) |
| Arts, Entertainment & Recreation | 76 (57.6%) | 56 (42.4%) |
| Accommodation & Food Services | 298 (43.0%) | 395 (57.0%) |
| Public Administration | 618 (68.1%) | 289 (31.9%) |
| Total | 5,427 (58.0%) | 3,929 (42.0%) |
Education in Sevier County
School Enrollment in Sevier County
The most common levels of schooling among the 6,296 students in Sevier County are high school (1,762 | 28.0%), middle school (1,484 | 23.6%), and elementary school (1,352 | 21.5%).
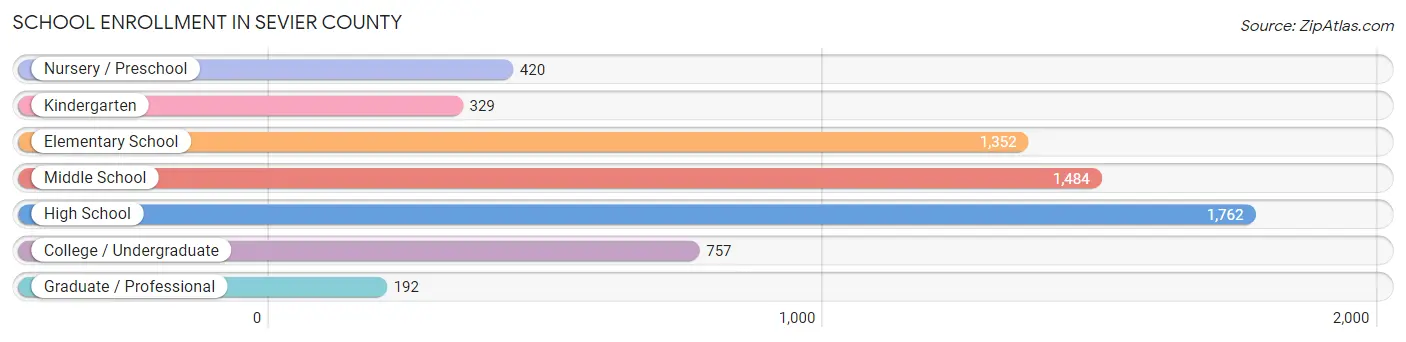
| School Level | # Students | % Students |
| Nursery / Preschool | 420 | 6.7% |
| Kindergarten | 329 | 5.2% |
| Elementary School | 1,352 | 21.5% |
| Middle School | 1,484 | 23.6% |
| High School | 1,762 | 28.0% |
| College / Undergraduate | 757 | 12.0% |
| Graduate / Professional | 192 | 3.0% |
| Total | 6,296 | 100.0% |
School Enrollment by Age by Funding Source in Sevier County
Out of a total of 6,296 students who are enrolled in schools in Sevier County, 491 (7.8%) attend a private institution, while the remaining 5,805 (92.2%) are enrolled in public schools. The age group of 35 years and over has the highest likelihood of being enrolled in private schools, with 86 (23.3% in the age bracket) enrolled. Conversely, the age group of 10 to 14 year olds has the lowest likelihood of being enrolled in a private school, with 1,792 (96.7% in the age bracket) attending a public institution.
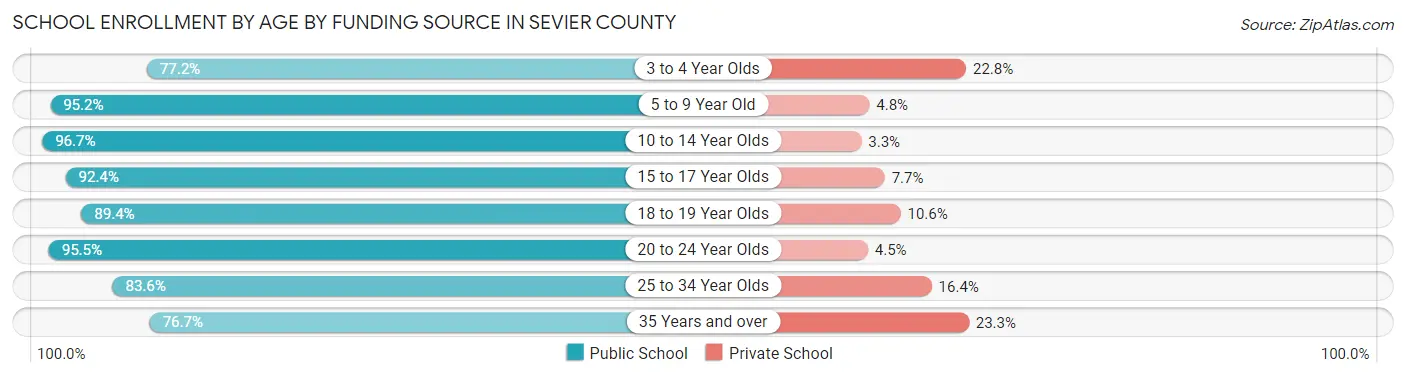
| Age Bracket | Public School | Private School |
| 3 to 4 Year Olds | 271 (77.2%) | 80 (22.8%) |
| 5 to 9 Year Old | 1,514 (95.2%) | 76 (4.8%) |
| 10 to 14 Year Olds | 1,792 (96.7%) | 61 (3.3%) |
| 15 to 17 Year Olds | 1,147 (92.3%) | 95 (7.6%) |
| 18 to 19 Year Olds | 346 (89.4%) | 41 (10.6%) |
| 20 to 24 Year Olds | 254 (95.5%) | 12 (4.5%) |
| 25 to 34 Year Olds | 199 (83.6%) | 39 (16.4%) |
| 35 Years and over | 283 (76.7%) | 86 (23.3%) |
| Total | 5,805 (92.2%) | 491 (7.8%) |
Educational Attainment by Field of Study in Sevier County
Education (865 | 26.5%), business (580 | 17.8%), bio, nature & agricultural (398 | 12.2%), science & technology (374 | 11.5%), and arts & humanities (220 | 6.8%) are the most common fields of study among 3,259 individuals in Sevier County who have obtained a bachelor's degree or higher.
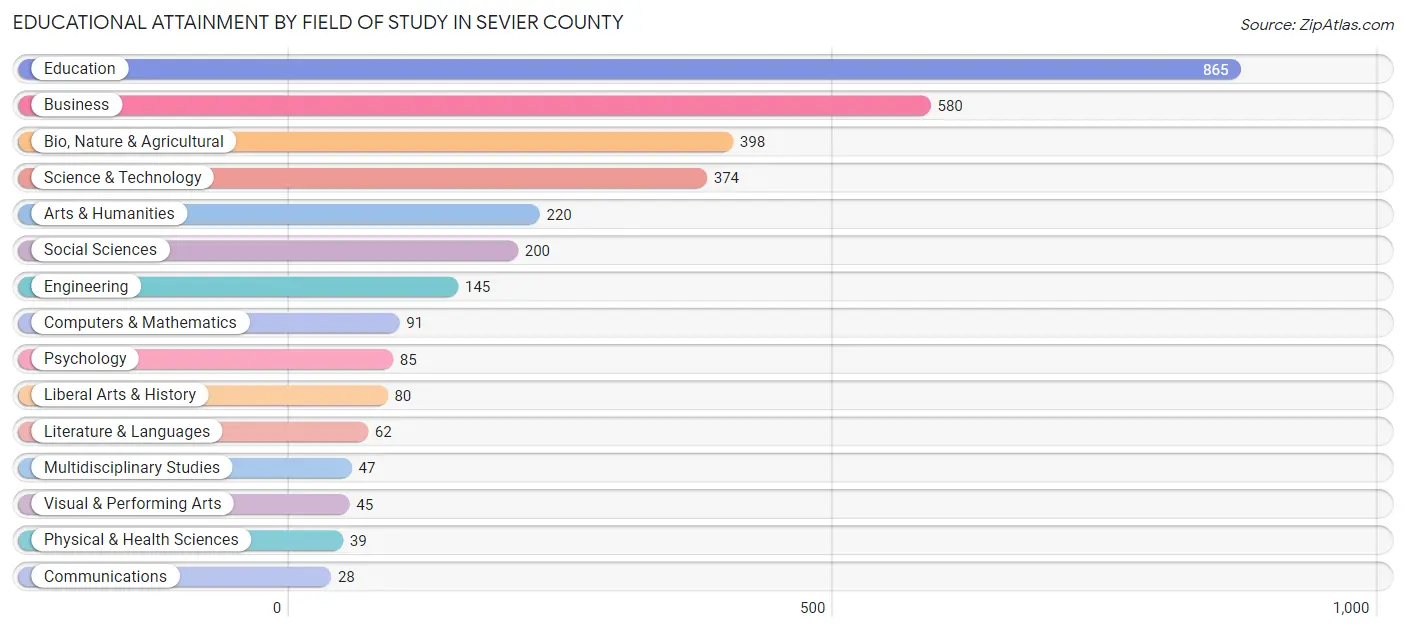
| Field of Study | # Graduates | % Graduates |
| Computers & Mathematics | 91 | 2.8% |
| Bio, Nature & Agricultural | 398 | 12.2% |
| Physical & Health Sciences | 39 | 1.2% |
| Psychology | 85 | 2.6% |
| Social Sciences | 200 | 6.1% |
| Engineering | 145 | 4.4% |
| Multidisciplinary Studies | 47 | 1.4% |
| Science & Technology | 374 | 11.5% |
| Business | 580 | 17.8% |
| Education | 865 | 26.5% |
| Literature & Languages | 62 | 1.9% |
| Liberal Arts & History | 80 | 2.5% |
| Visual & Performing Arts | 45 | 1.4% |
| Communications | 28 | 0.9% |
| Arts & Humanities | 220 | 6.8% |
| Total | 3,259 | 100.0% |
Transportation & Commute in Sevier County
Vehicle Availability by Sex in Sevier County
The most prevalent vehicle ownership categories in Sevier County are males with 2 vehicles (1,700, accounting for 32.0%) and females with 2 vehicles (1,315, making up 44.1%).
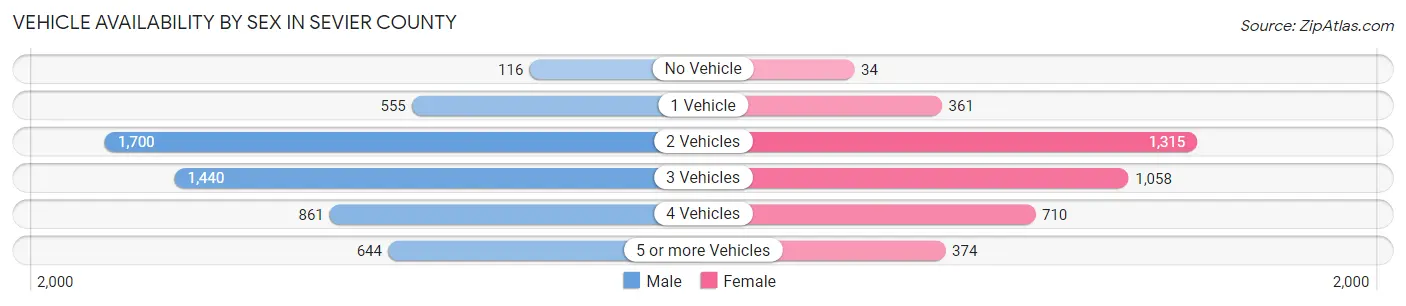
| Vehicles Available | Male | Female |
| No Vehicle | 116 (2.2%) | 34 (0.9%) |
| 1 Vehicle | 555 (10.4%) | 361 (9.4%) |
| 2 Vehicles | 1,700 (32.0%) | 1,315 (34.1%) |
| 3 Vehicles | 1,440 (27.1%) | 1,058 (27.5%) |
| 4 Vehicles | 861 (16.2%) | 710 (18.4%) |
| 5 or more Vehicles | 644 (12.1%) | 374 (9.7%) |
| Total | 5,316 (100.0%) | 3,852 (100.0%) |
Commute Time in Sevier County
The most frequently occuring commute durations in Sevier County are 5 to 9 minutes (1,917 commuters, 23.1%), 10 to 14 minutes (1,781 commuters, 21.4%), and less than 5 minutes (1,254 commuters, 15.1%).
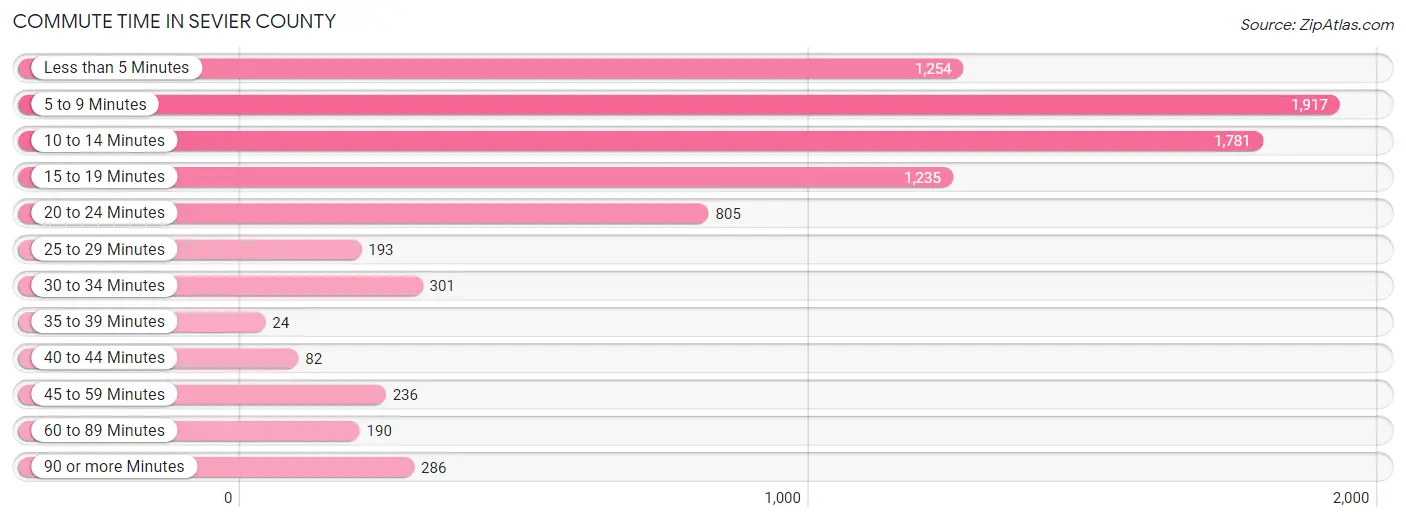
| Commute Time | # Commuters | % Commuters |
| Less than 5 Minutes | 1,254 | 15.1% |
| 5 to 9 Minutes | 1,917 | 23.1% |
| 10 to 14 Minutes | 1,781 | 21.4% |
| 15 to 19 Minutes | 1,235 | 14.9% |
| 20 to 24 Minutes | 805 | 9.7% |
| 25 to 29 Minutes | 193 | 2.3% |
| 30 to 34 Minutes | 301 | 3.6% |
| 35 to 39 Minutes | 24 | 0.3% |
| 40 to 44 Minutes | 82 | 1.0% |
| 45 to 59 Minutes | 236 | 2.8% |
| 60 to 89 Minutes | 190 | 2.3% |
| 90 or more Minutes | 286 | 3.4% |
Commute Time by Sex in Sevier County
The most common commute times in Sevier County are 5 to 9 minutes (1,166 commuters, 22.8%) for males and 5 to 9 minutes (751 commuters, 23.6%) for females.

| Commute Time | Male | Female |
| Less than 5 Minutes | 620 (12.1%) | 634 (19.9%) |
| 5 to 9 Minutes | 1,166 (22.8%) | 751 (23.6%) |
| 10 to 14 Minutes | 1,089 (21.3%) | 692 (21.7%) |
| 15 to 19 Minutes | 757 (14.8%) | 478 (15.0%) |
| 20 to 24 Minutes | 531 (10.4%) | 274 (8.6%) |
| 25 to 29 Minutes | 126 (2.5%) | 67 (2.1%) |
| 30 to 34 Minutes | 176 (3.4%) | 125 (3.9%) |
| 35 to 39 Minutes | 18 (0.4%) | 6 (0.2%) |
| 40 to 44 Minutes | 58 (1.1%) | 24 (0.7%) |
| 45 to 59 Minutes | 183 (3.6%) | 53 (1.7%) |
| 60 to 89 Minutes | 168 (3.3%) | 22 (0.7%) |
| 90 or more Minutes | 227 (4.4%) | 59 (1.8%) |
Time of Departure to Work by Sex in Sevier County
The most frequent times of departure to work in Sevier County are 7:30 AM to 7:59 AM (867, 16.9%) for males and 7:30 AM to 7:59 AM (634, 19.9%) for females.
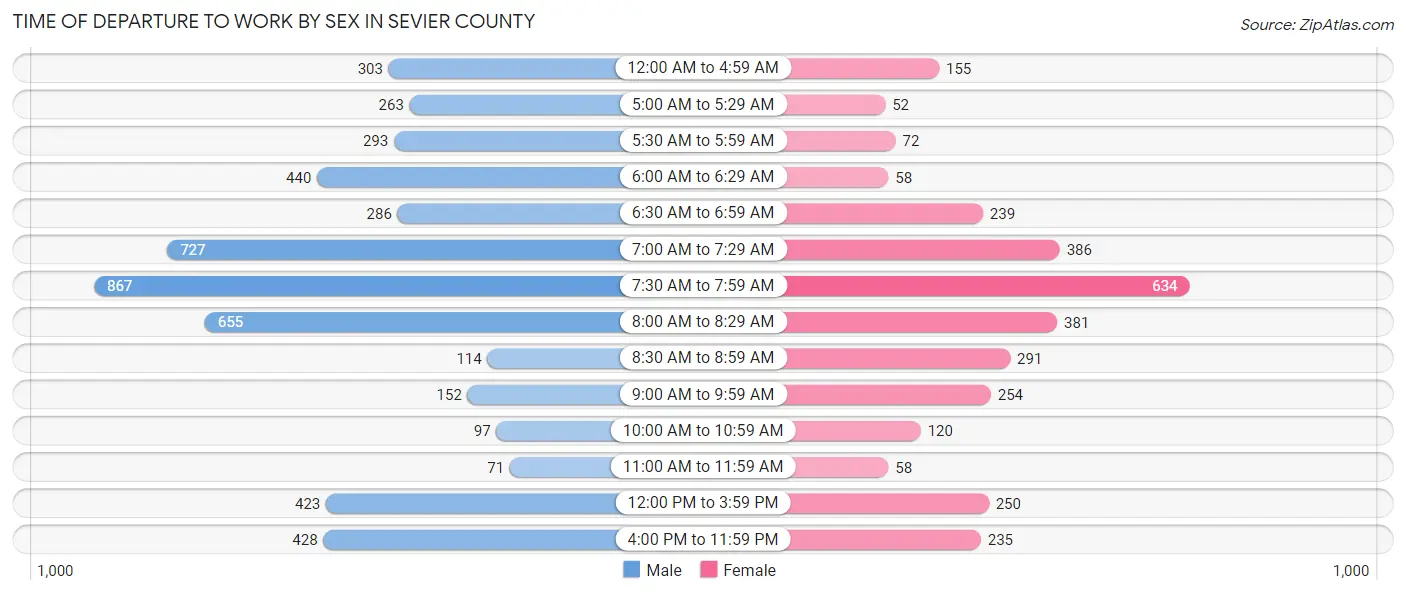
| Time of Departure | Male | Female |
| 12:00 AM to 4:59 AM | 303 (5.9%) | 155 (4.9%) |
| 5:00 AM to 5:29 AM | 263 (5.1%) | 52 (1.6%) |
| 5:30 AM to 5:59 AM | 293 (5.7%) | 72 (2.3%) |
| 6:00 AM to 6:29 AM | 440 (8.6%) | 58 (1.8%) |
| 6:30 AM to 6:59 AM | 286 (5.6%) | 239 (7.5%) |
| 7:00 AM to 7:29 AM | 727 (14.2%) | 386 (12.1%) |
| 7:30 AM to 7:59 AM | 867 (16.9%) | 634 (19.9%) |
| 8:00 AM to 8:29 AM | 655 (12.8%) | 381 (12.0%) |
| 8:30 AM to 8:59 AM | 114 (2.2%) | 291 (9.1%) |
| 9:00 AM to 9:59 AM | 152 (3.0%) | 254 (8.0%) |
| 10:00 AM to 10:59 AM | 97 (1.9%) | 120 (3.8%) |
| 11:00 AM to 11:59 AM | 71 (1.4%) | 58 (1.8%) |
| 12:00 PM to 3:59 PM | 423 (8.3%) | 250 (7.9%) |
| 4:00 PM to 11:59 PM | 428 (8.4%) | 235 (7.4%) |
| Total | 5,119 (100.0%) | 3,185 (100.0%) |
Housing Occupancy in Sevier County
Occupancy by Ownership in Sevier County
Of the total 7,396 dwellings in Sevier County, owner-occupied units account for 5,885 (79.6%), while renter-occupied units make up 1,511 (20.4%).
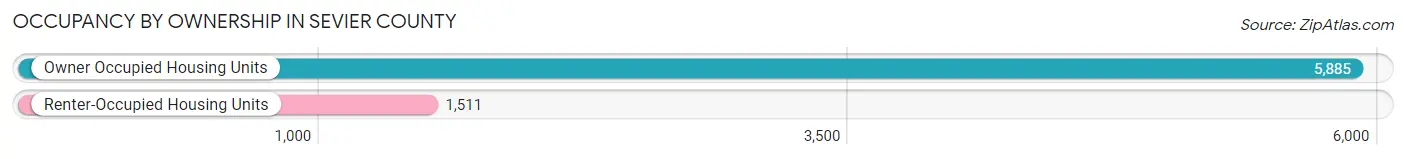
| Occupancy | # Housing Units | % Housing Units |
| Owner Occupied Housing Units | 5,885 | 79.6% |
| Renter-Occupied Housing Units | 1,511 | 20.4% |
| Total Occupied Housing Units | 7,396 | 100.0% |
Occupancy by Household Size in Sevier County
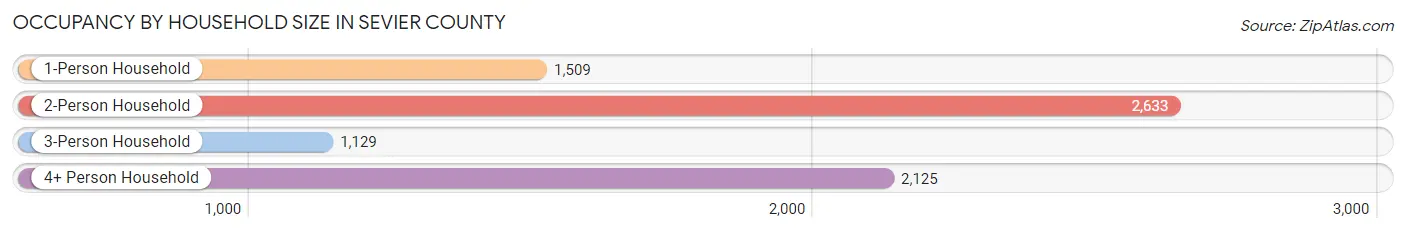
| Household Size | # Housing Units | % Housing Units |
| 1-Person Household | 1,509 | 20.4% |
| 2-Person Household | 2,633 | 35.6% |
| 3-Person Household | 1,129 | 15.3% |
| 4+ Person Household | 2,125 | 28.7% |
| Total Housing Units | 7,396 | 100.0% |
Occupancy by Ownership by Household Size in Sevier County
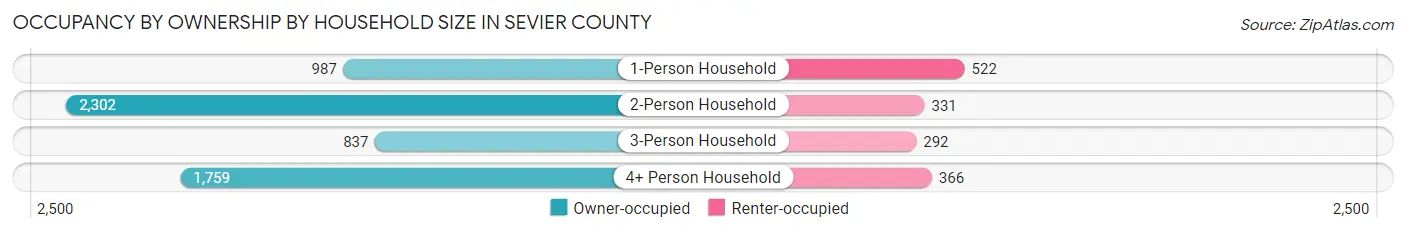
| Household Size | Owner-occupied | Renter-occupied |
| 1-Person Household | 987 (65.4%) | 522 (34.6%) |
| 2-Person Household | 2,302 (87.4%) | 331 (12.6%) |
| 3-Person Household | 837 (74.1%) | 292 (25.9%) |
| 4+ Person Household | 1,759 (82.8%) | 366 (17.2%) |
| Total Housing Units | 5,885 (79.6%) | 1,511 (20.4%) |
Occupancy by Educational Attainment in Sevier County
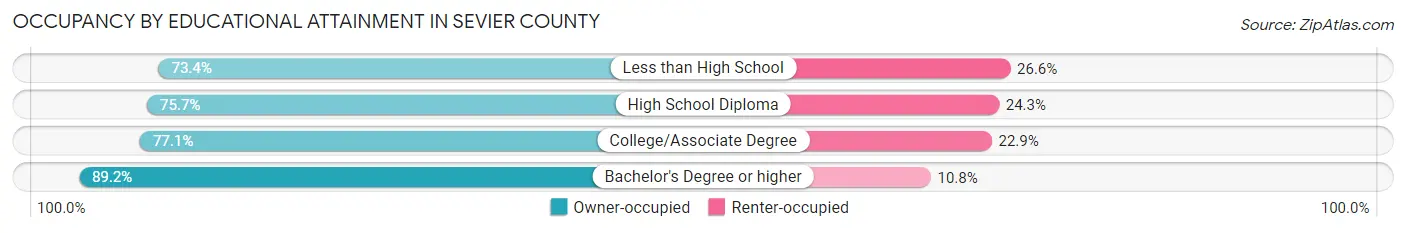
| Household Size | Owner-occupied | Renter-occupied |
| Less than High School | 354 (73.4%) | 128 (26.6%) |
| High School Diploma | 1,656 (75.7%) | 532 (24.3%) |
| College/Associate Degree | 2,178 (77.1%) | 646 (22.9%) |
| Bachelor's Degree or higher | 1,697 (89.2%) | 205 (10.8%) |
Occupancy by Age of Householder in Sevier County
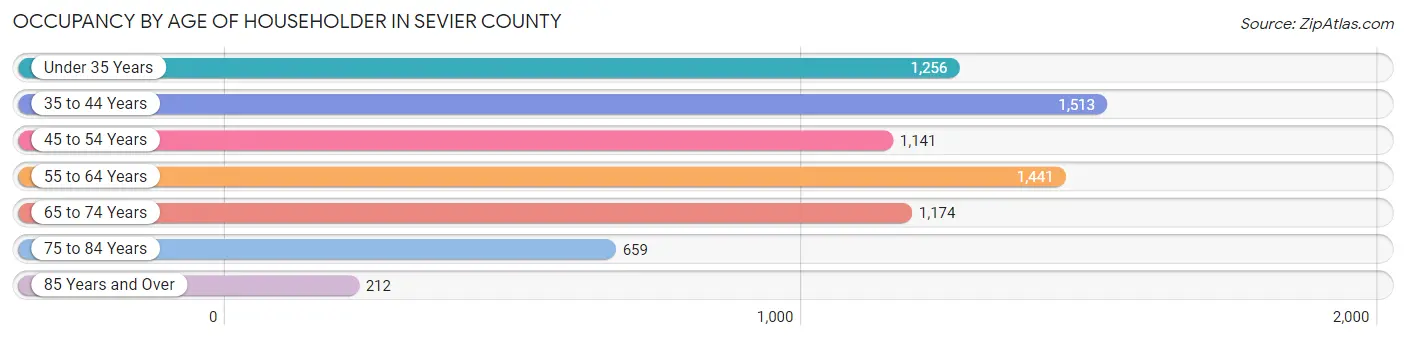
| Age Bracket | # Households | % Households |
| Under 35 Years | 1,256 | 17.0% |
| 35 to 44 Years | 1,513 | 20.5% |
| 45 to 54 Years | 1,141 | 15.4% |
| 55 to 64 Years | 1,441 | 19.5% |
| 65 to 74 Years | 1,174 | 15.9% |
| 75 to 84 Years | 659 | 8.9% |
| 85 Years and Over | 212 | 2.9% |
| Total | 7,396 | 100.0% |
Housing Finances in Sevier County
Median Income by Occupancy in Sevier County
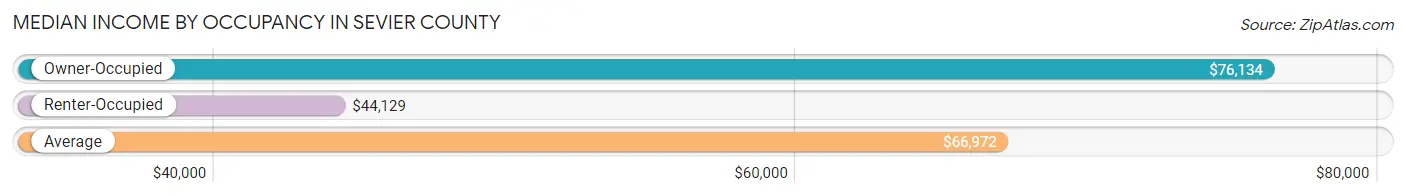
| Occupancy Type | # Households | Median Income |
| Owner-Occupied | 5,885 (79.6%) | $76,134 |
| Renter-Occupied | 1,511 (20.4%) | $44,129 |
| Average | 7,396 (100.0%) | $66,972 |
Occupancy by Householder Income Bracket in Sevier County
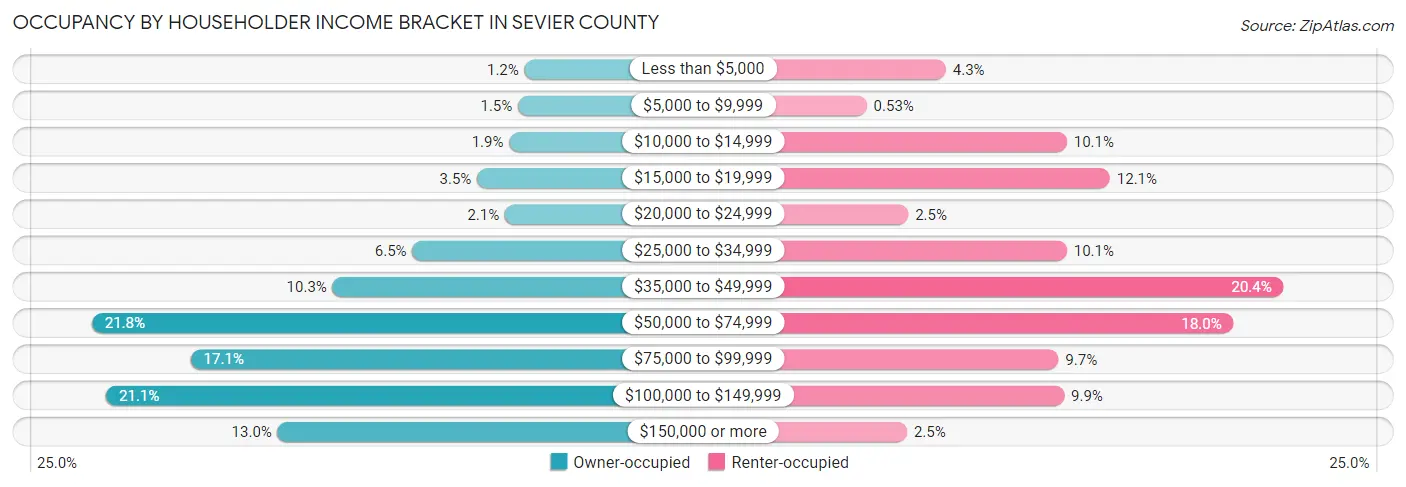
| Income Bracket | Owner-occupied | Renter-occupied |
| Less than $5,000 | 70 (1.2%) | 65 (4.3%) |
| $5,000 to $9,999 | 88 (1.5%) | 8 (0.5%) |
| $10,000 to $14,999 | 113 (1.9%) | 152 (10.1%) |
| $15,000 to $19,999 | 203 (3.5%) | 183 (12.1%) |
| $20,000 to $24,999 | 125 (2.1%) | 38 (2.5%) |
| $25,000 to $34,999 | 384 (6.5%) | 152 (10.1%) |
| $35,000 to $49,999 | 608 (10.3%) | 308 (20.4%) |
| $50,000 to $74,999 | 1,283 (21.8%) | 272 (18.0%) |
| $75,000 to $99,999 | 1,006 (17.1%) | 146 (9.7%) |
| $100,000 to $149,999 | 1,243 (21.1%) | 150 (9.9%) |
| $150,000 or more | 762 (13.0%) | 37 (2.5%) |
| Total | 5,885 (100.0%) | 1,511 (100.0%) |
Monthly Housing Cost Tiers in Sevier County
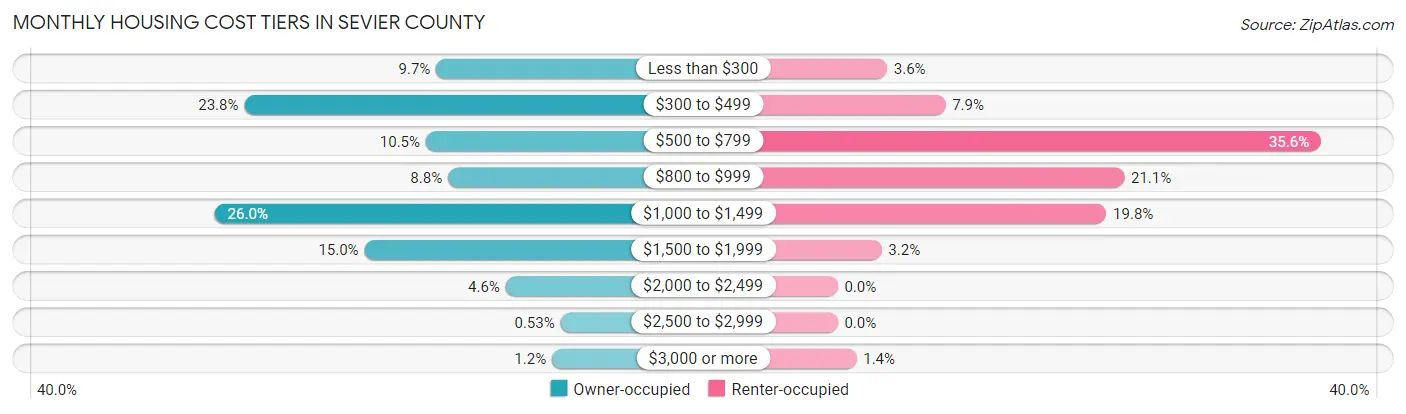
| Monthly Cost | Owner-occupied | Renter-occupied |
| Less than $300 | 570 (9.7%) | 55 (3.6%) |
| $300 to $499 | 1,402 (23.8%) | 120 (7.9%) |
| $500 to $799 | 615 (10.4%) | 538 (35.6%) |
| $800 to $999 | 519 (8.8%) | 319 (21.1%) |
| $1,000 to $1,499 | 1,530 (26.0%) | 299 (19.8%) |
| $1,500 to $1,999 | 881 (15.0%) | 49 (3.2%) |
| $2,000 to $2,499 | 269 (4.6%) | 0 (0.0%) |
| $2,500 to $2,999 | 31 (0.5%) | 0 (0.0%) |
| $3,000 or more | 68 (1.2%) | 21 (1.4%) |
| Total | 5,885 (100.0%) | 1,511 (100.0%) |
Physical Housing Characteristics in Sevier County
Housing Structures in Sevier County
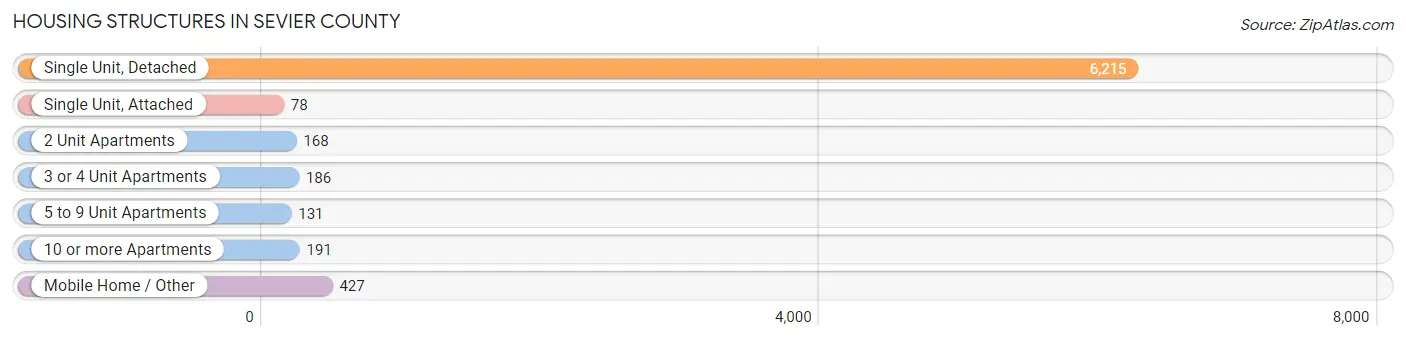
| Structure Type | # Housing Units | % Housing Units |
| Single Unit, Detached | 6,215 | 84.0% |
| Single Unit, Attached | 78 | 1.1% |
| 2 Unit Apartments | 168 | 2.3% |
| 3 or 4 Unit Apartments | 186 | 2.5% |
| 5 to 9 Unit Apartments | 131 | 1.8% |
| 10 or more Apartments | 191 | 2.6% |
| Mobile Home / Other | 427 | 5.8% |
| Total | 7,396 | 100.0% |
Housing Structures by Occupancy in Sevier County
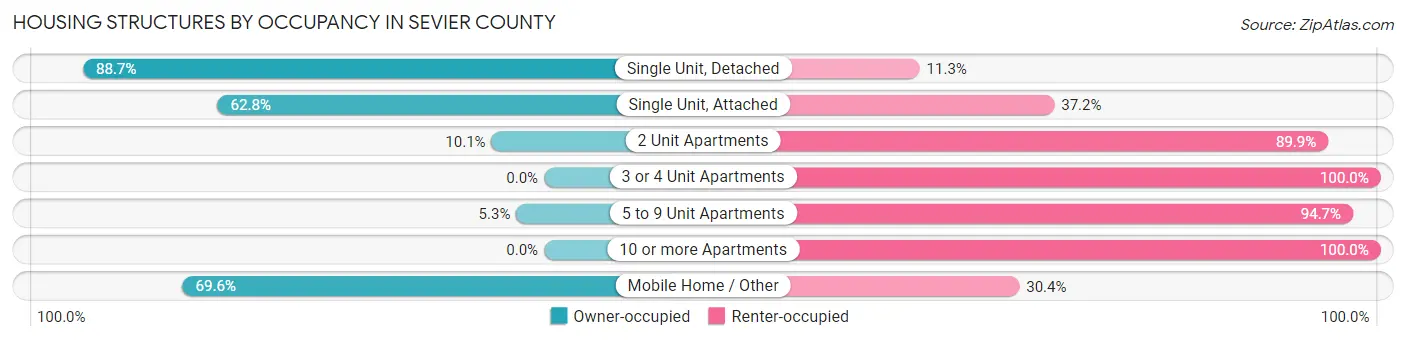
| Structure Type | Owner-occupied | Renter-occupied |
| Single Unit, Detached | 5,515 (88.7%) | 700 (11.3%) |
| Single Unit, Attached | 49 (62.8%) | 29 (37.2%) |
| 2 Unit Apartments | 17 (10.1%) | 151 (89.9%) |
| 3 or 4 Unit Apartments | 0 (0.0%) | 186 (100.0%) |
| 5 to 9 Unit Apartments | 7 (5.3%) | 124 (94.7%) |
| 10 or more Apartments | 0 (0.0%) | 191 (100.0%) |
| Mobile Home / Other | 297 (69.6%) | 130 (30.4%) |
| Total | 5,885 (79.6%) | 1,511 (20.4%) |
Housing Structures by Number of Rooms in Sevier County
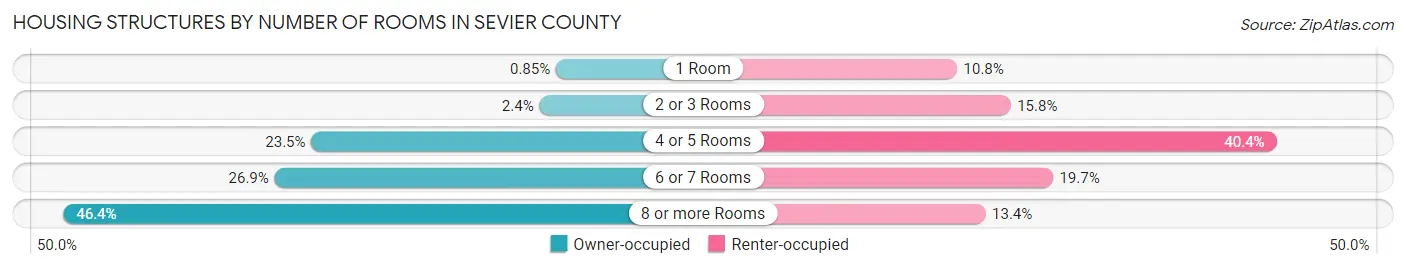
| Number of Rooms | Owner-occupied | Renter-occupied |
| 1 Room | 50 (0.9%) | 163 (10.8%) |
| 2 or 3 Rooms | 140 (2.4%) | 238 (15.8%) |
| 4 or 5 Rooms | 1,382 (23.5%) | 610 (40.4%) |
| 6 or 7 Rooms | 1,582 (26.9%) | 297 (19.7%) |
| 8 or more Rooms | 2,731 (46.4%) | 203 (13.4%) |
| Total | 5,885 (100.0%) | 1,511 (100.0%) |
Housing Structure by Heating Type in Sevier County
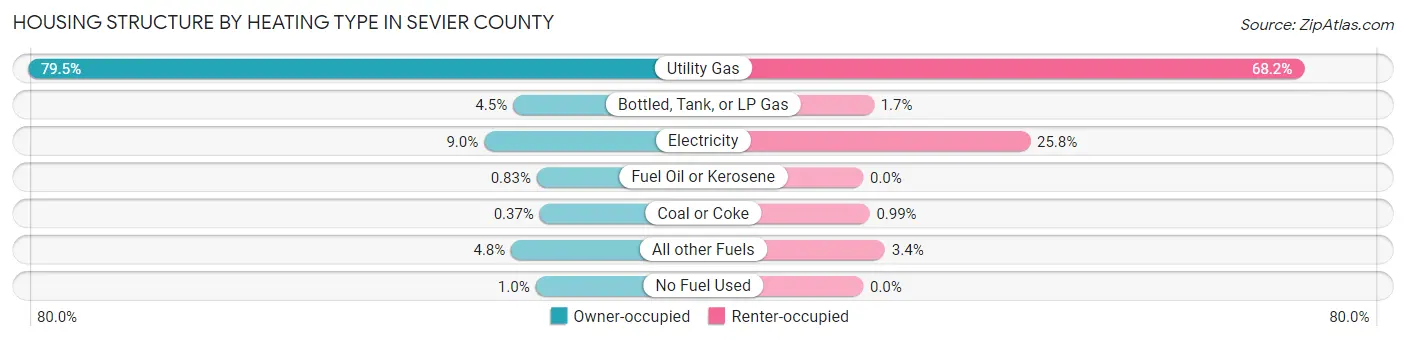
| Heating Type | Owner-occupied | Renter-occupied |
| Utility Gas | 4,679 (79.5%) | 1,030 (68.2%) |
| Bottled, Tank, or LP Gas | 265 (4.5%) | 25 (1.7%) |
| Electricity | 528 (9.0%) | 390 (25.8%) |
| Fuel Oil or Kerosene | 49 (0.8%) | 0 (0.0%) |
| Coal or Coke | 22 (0.4%) | 15 (1.0%) |
| All other Fuels | 282 (4.8%) | 51 (3.4%) |
| No Fuel Used | 60 (1.0%) | 0 (0.0%) |
| Total | 5,885 (100.0%) | 1,511 (100.0%) |
Household Vehicle Usage in Sevier County
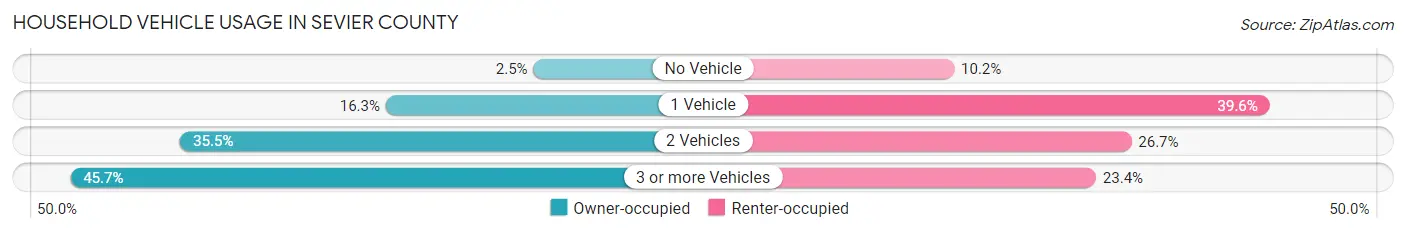
| Vehicles per Household | Owner-occupied | Renter-occupied |
| No Vehicle | 147 (2.5%) | 154 (10.2%) |
| 1 Vehicle | 958 (16.3%) | 599 (39.6%) |
| 2 Vehicles | 2,088 (35.5%) | 404 (26.7%) |
| 3 or more Vehicles | 2,692 (45.7%) | 354 (23.4%) |
| Total | 5,885 (100.0%) | 1,511 (100.0%) |
Real Estate & Mortgages in Sevier County
Real Estate and Mortgage Overview in Sevier County
| Characteristic | Without Mortgage | With Mortgage |
| Housing Units | 2,379 | 3,506 |
| Median Property Value | $233,300 | $244,000 |
| Median Household Income | $62,377 | $508 |
| Monthly Housing Costs | $369 | $68 |
| Real Estate Taxes | $1,357 | $71 |
Property Value by Mortgage Status in Sevier County
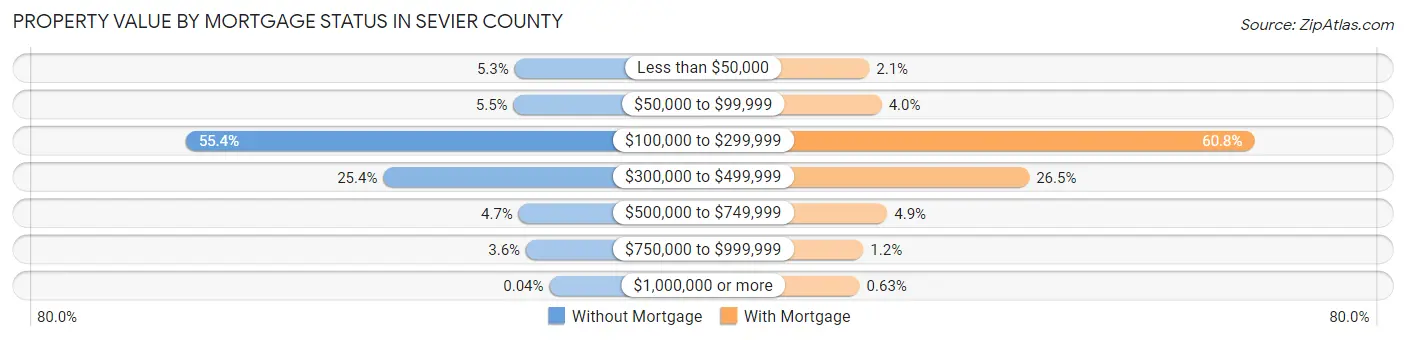
| Property Value | Without Mortgage | With Mortgage |
| Less than $50,000 | 127 (5.3%) | 74 (2.1%) |
| $50,000 to $99,999 | 131 (5.5%) | 140 (4.0%) |
| $100,000 to $299,999 | 1,319 (55.4%) | 2,130 (60.8%) |
| $300,000 to $499,999 | 603 (25.4%) | 928 (26.5%) |
| $500,000 to $749,999 | 112 (4.7%) | 170 (4.9%) |
| $750,000 to $999,999 | 86 (3.6%) | 42 (1.2%) |
| $1,000,000 or more | 1 (0.0%) | 22 (0.6%) |
| Total | 2,379 (100.0%) | 3,506 (100.0%) |
Household Income by Mortgage Status in Sevier County
| Household Income | Without Mortgage | With Mortgage |
| Less than $10,000 | 109 (4.6%) | 39 (1.1%) |
| $10,000 to $24,999 | 314 (13.2%) | 49 (1.4%) |
| $25,000 to $34,999 | 217 (9.1%) | 127 (3.6%) |
| $35,000 to $49,999 | 281 (11.8%) | 167 (4.8%) |
| $50,000 to $74,999 | 545 (22.9%) | 327 (9.3%) |
| $75,000 to $99,999 | 233 (9.8%) | 738 (21.0%) |
| $100,000 to $149,999 | 426 (17.9%) | 773 (22.1%) |
| $150,000 or more | 254 (10.7%) | 817 (23.3%) |
| Total | 2,379 (100.0%) | 3,506 (100.0%) |
Property Value to Household Income Ratio in Sevier County
| Value-to-Income Ratio | Without Mortgage | With Mortgage |
| Less than 2.0x | 527 (22.2%) | 86,809 (2,476.0%) |
| 2.0x to 2.9x | 401 (16.9%) | 866 (24.7%) |
| 3.0x to 3.9x | 347 (14.6%) | 949 (27.1%) |
| 4.0x or more | 1,094 (46.0%) | 760 (21.7%) |
| Total | 2,379 (100.0%) | 3,506 (100.0%) |
Real Estate Taxes by Mortgage Status in Sevier County
| Property Taxes | Without Mortgage | With Mortgage |
| Less than $800 | 400 (16.8%) | 7 (0.2%) |
| $800 to $1,499 | 914 (38.4%) | 389 (11.1%) |
| $800 to $1,499 | 928 (39.0%) | 1,427 (40.7%) |
| Total | 2,379 (100.0%) | 3,506 (100.0%) |
Health & Disability in Sevier County
Health Insurance Coverage by Age in Sevier County
| Age Bracket | With Coverage | Without Coverage |
| Under 6 Years | 1,613 (96.3%) | 62 (3.7%) |
| 6 to 18 Years | 4,526 (93.5%) | 314 (6.5%) |
| 19 to 25 Years | 1,411 (85.7%) | 235 (14.3%) |
| 26 to 34 Years | 1,781 (80.8%) | 422 (19.2%) |
| 35 to 44 Years | 2,443 (84.5%) | 450 (15.5%) |
| 45 to 54 Years | 1,902 (88.1%) | 256 (11.9%) |
| 55 to 64 Years | 2,217 (89.5%) | 259 (10.5%) |
| 65 to 74 Years | 2,079 (100.0%) | 0 (0.0%) |
| 75 Years and older | 1,403 (99.9%) | 1 (0.1%) |
| Total | 19,375 (90.6%) | 1,999 (9.3%) |
Health Insurance Coverage by Citizenship Status in Sevier County
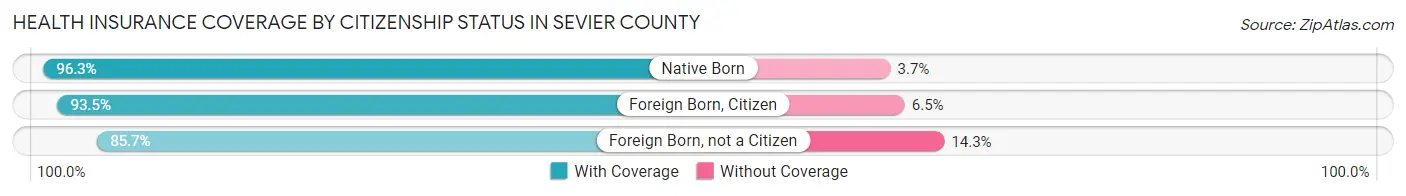
| Citizenship Status | With Coverage | Without Coverage |
| Native Born | 1,613 (96.3%) | 62 (3.7%) |
| Foreign Born, Citizen | 4,526 (93.5%) | 314 (6.5%) |
| Foreign Born, not a Citizen | 1,411 (85.7%) | 235 (14.3%) |
Health Insurance Coverage by Household Income in Sevier County
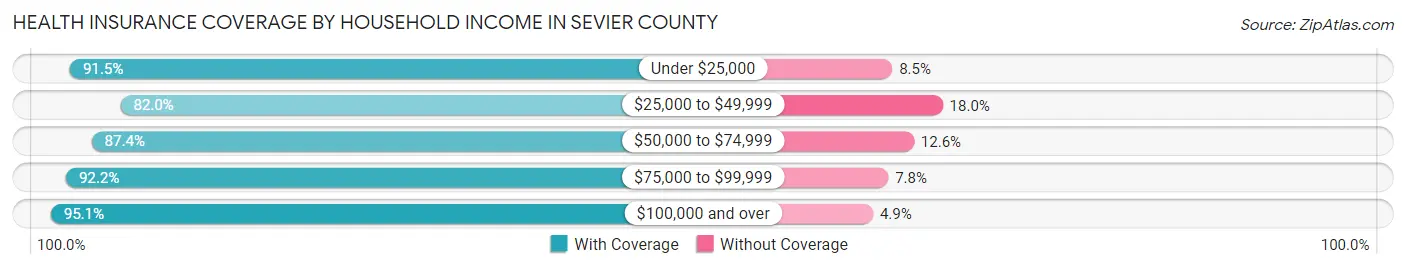
| Household Income | With Coverage | Without Coverage |
| Under $25,000 | 1,818 (91.5%) | 169 (8.5%) |
| $25,000 to $49,999 | 2,749 (82.0%) | 602 (18.0%) |
| $50,000 to $74,999 | 3,817 (87.4%) | 549 (12.6%) |
| $75,000 to $99,999 | 3,506 (92.2%) | 295 (7.8%) |
| $100,000 and over | 7,425 (95.1%) | 383 (4.9%) |
Public vs Private Health Insurance Coverage by Age in Sevier County
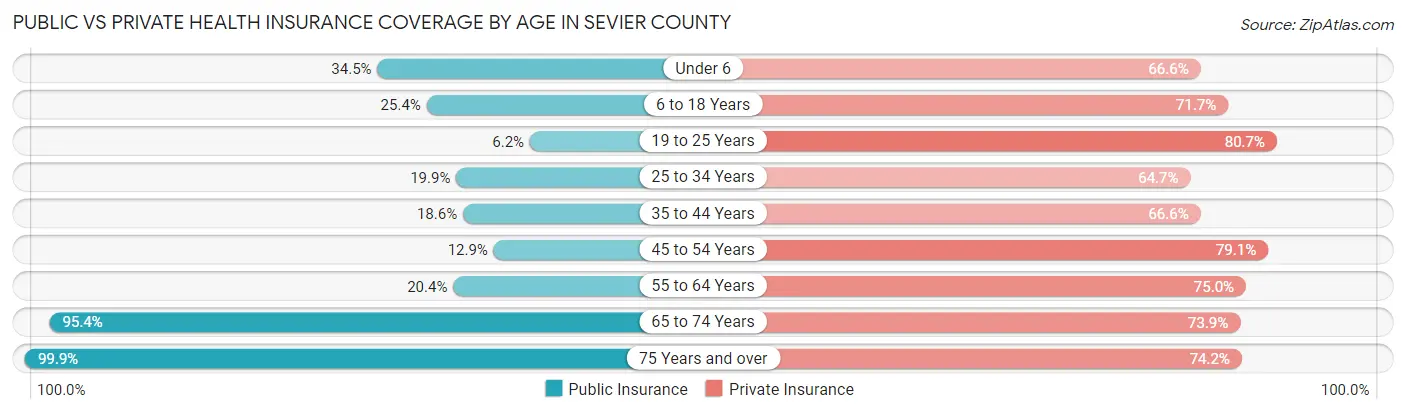
| Age Bracket | Public Insurance | Private Insurance |
| Under 6 | 578 (34.5%) | 1,115 (66.6%) |
| 6 to 18 Years | 1,228 (25.4%) | 3,471 (71.7%) |
| 19 to 25 Years | 102 (6.2%) | 1,329 (80.7%) |
| 25 to 34 Years | 438 (19.9%) | 1,425 (64.7%) |
| 35 to 44 Years | 539 (18.6%) | 1,926 (66.6%) |
| 45 to 54 Years | 279 (12.9%) | 1,707 (79.1%) |
| 55 to 64 Years | 506 (20.4%) | 1,857 (75.0%) |
| 65 to 74 Years | 1,983 (95.4%) | 1,537 (73.9%) |
| 75 Years and over | 1,403 (99.9%) | 1,042 (74.2%) |
| Total | 7,056 (33.0%) | 15,409 (72.1%) |
Disability Status by Sex by Age in Sevier County
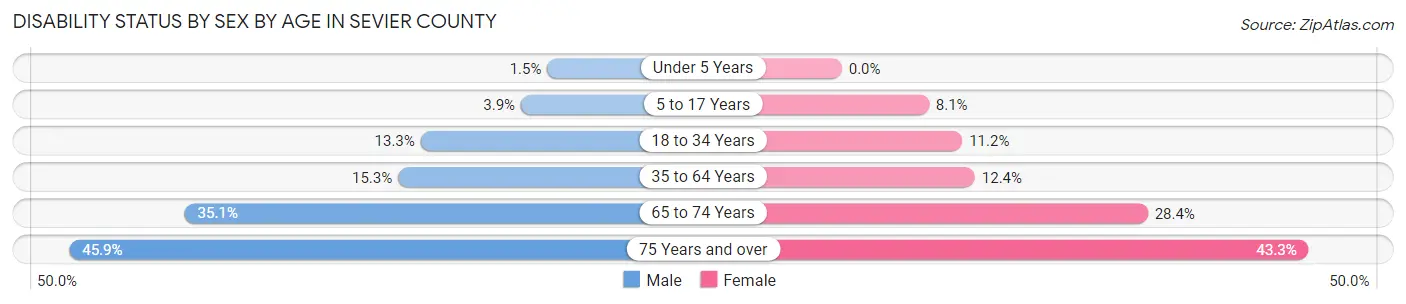
| Age Bracket | Male | Female |
| Under 5 Years | 12 (1.5%) | 0 (0.0%) |
| 5 to 17 Years | 95 (3.9%) | 185 (8.1%) |
| 18 to 34 Years | 291 (13.3%) | 225 (11.2%) |
| 35 to 64 Years | 586 (15.3%) | 458 (12.3%) |
| 65 to 74 Years | 363 (35.1%) | 297 (28.4%) |
| 75 Years and over | 304 (45.9%) | 321 (43.3%) |
Disability Class by Sex by Age in Sevier County
Disability Class: Hearing Difficulty
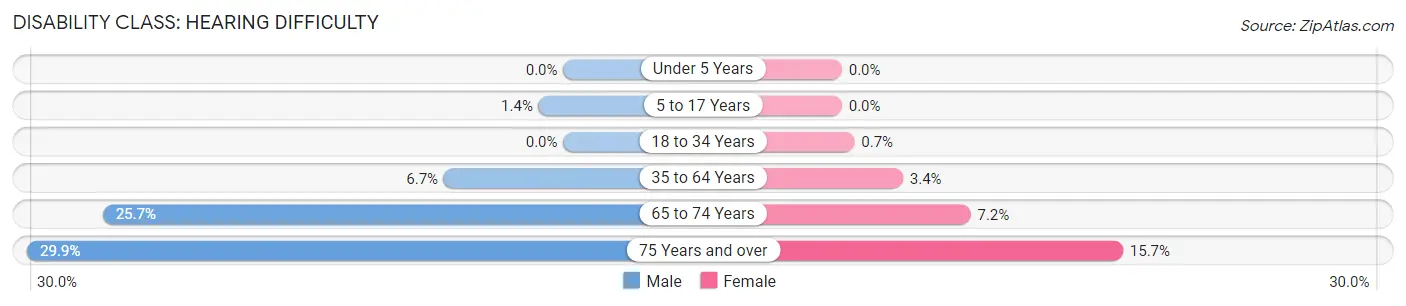
| Age Bracket | Male | Female |
| Under 5 Years | 0 (0.0%) | 0 (0.0%) |
| 5 to 17 Years | 33 (1.4%) | 0 (0.0%) |
| 18 to 34 Years | 0 (0.0%) | 14 (0.7%) |
| 35 to 64 Years | 254 (6.7%) | 126 (3.4%) |
| 65 to 74 Years | 265 (25.7%) | 75 (7.2%) |
| 75 Years and over | 198 (29.9%) | 116 (15.7%) |
Disability Class: Vision Difficulty
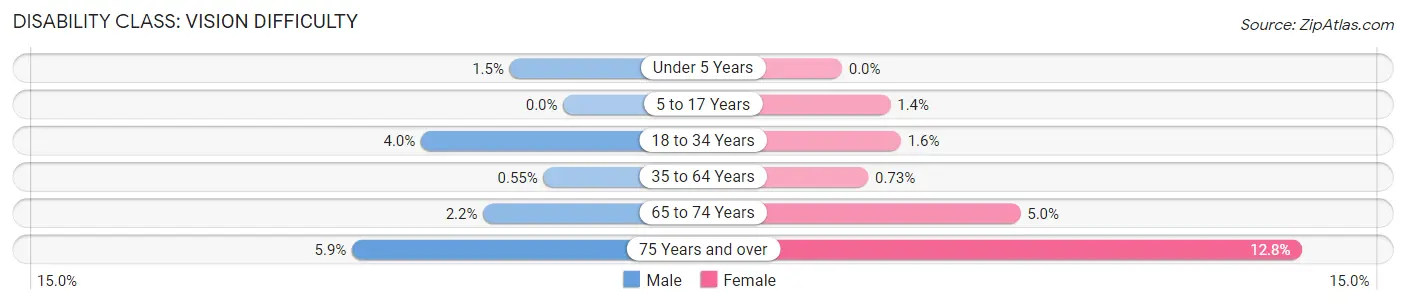
| Age Bracket | Male | Female |
| Under 5 Years | 12 (1.5%) | 0 (0.0%) |
| 5 to 17 Years | 0 (0.0%) | 31 (1.3%) |
| 18 to 34 Years | 87 (4.0%) | 33 (1.6%) |
| 35 to 64 Years | 21 (0.5%) | 27 (0.7%) |
| 65 to 74 Years | 23 (2.2%) | 52 (5.0%) |
| 75 Years and over | 39 (5.9%) | 95 (12.8%) |
Disability Class: Cognitive Difficulty
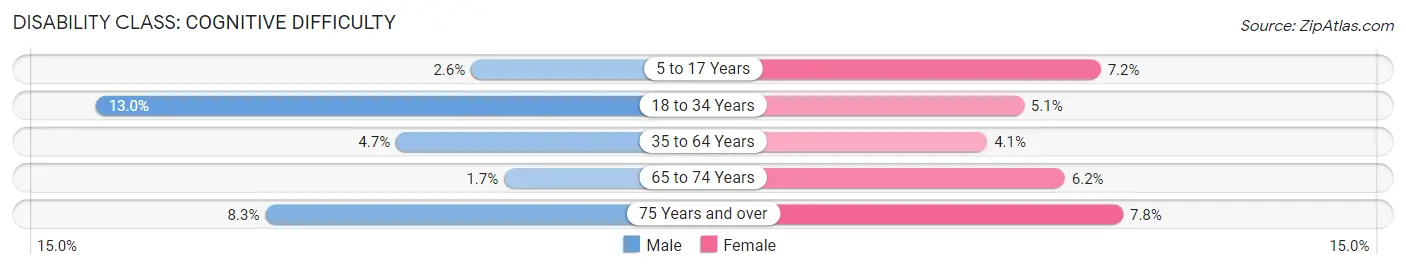
| Age Bracket | Male | Female |
| 5 to 17 Years | 62 (2.6%) | 165 (7.2%) |
| 18 to 34 Years | 286 (13.0%) | 102 (5.1%) |
| 35 to 64 Years | 178 (4.7%) | 150 (4.1%) |
| 65 to 74 Years | 17 (1.7%) | 65 (6.2%) |
| 75 Years and over | 55 (8.3%) | 58 (7.8%) |
Disability Class: Ambulatory Difficulty
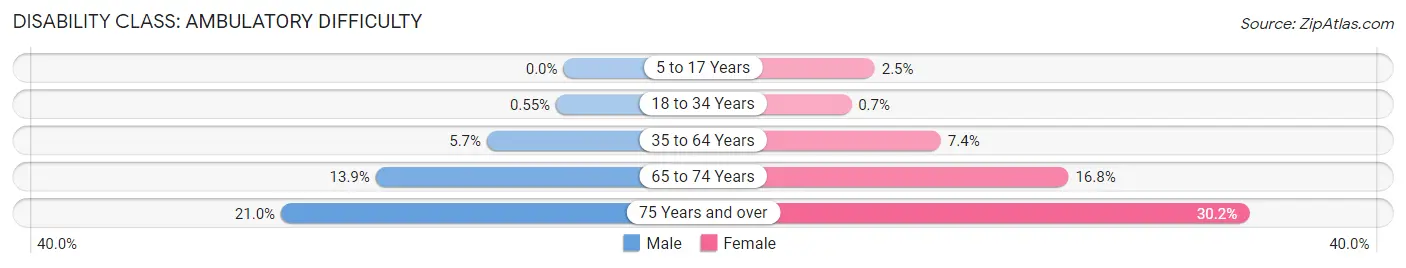
| Age Bracket | Male | Female |
| 5 to 17 Years | 0 (0.0%) | 56 (2.5%) |
| 18 to 34 Years | 12 (0.5%) | 14 (0.7%) |
| 35 to 64 Years | 217 (5.7%) | 273 (7.4%) |
| 65 to 74 Years | 144 (13.9%) | 176 (16.8%) |
| 75 Years and over | 139 (21.0%) | 224 (30.2%) |
Disability Class: Self-Care Difficulty
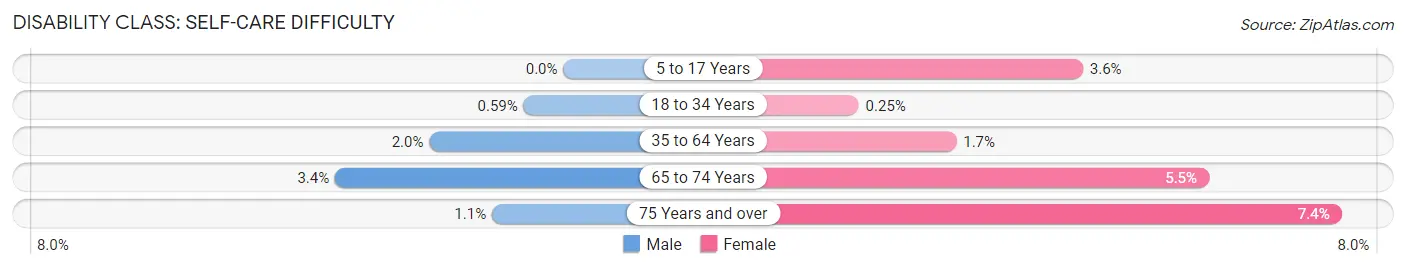
| Age Bracket | Male | Female |
| 5 to 17 Years | 0 (0.0%) | 82 (3.6%) |
| 18 to 34 Years | 13 (0.6%) | 5 (0.3%) |
| 35 to 64 Years | 76 (2.0%) | 63 (1.7%) |
| 65 to 74 Years | 35 (3.4%) | 57 (5.4%) |
| 75 Years and over | 7 (1.1%) | 55 (7.4%) |
Technology Access in Sevier County
Computing Device Access in Sevier County
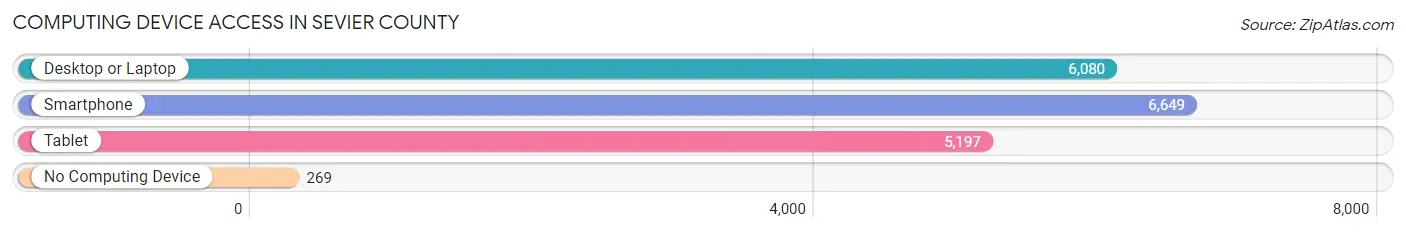
| Device Type | # Households | % Households |
| Desktop or Laptop | 6,080 | 82.2% |
| Smartphone | 6,649 | 89.9% |
| Tablet | 5,197 | 70.3% |
| No Computing Device | 269 | 3.6% |
| Total | 7,396 | 100.0% |
Internet Access in Sevier County
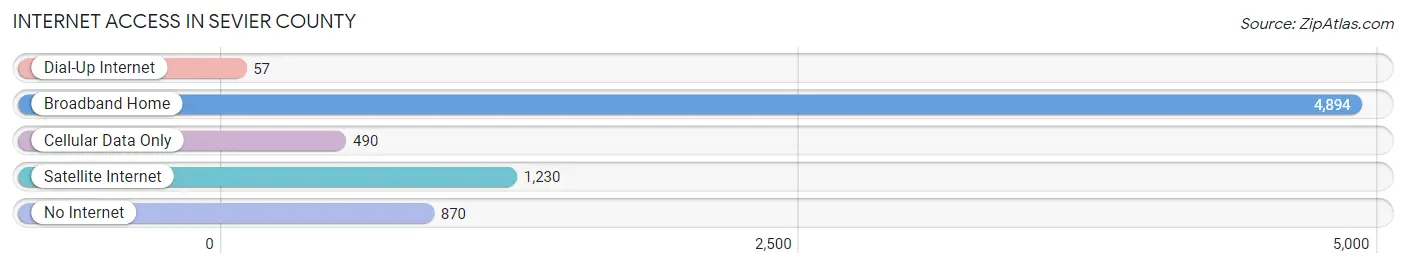
| Internet Type | # Households | % Households |
| Dial-Up Internet | 57 | 0.8% |
| Broadband Home | 4,894 | 66.2% |
| Cellular Data Only | 490 | 6.6% |
| Satellite Internet | 1,230 | 16.6% |
| No Internet | 870 | 11.8% |
| Total | 7,396 | 100.0% |
Sevier County Summary
Sevier County, Utah is located in the south-central part of the state and is bordered by Sanpete County to the north, Piute County to the east, Garfield County to the south, and Millard County to the west. The county seat is Richfield, and the largest city is Salina. The county was named after the Sevier River, which flows through the county.
Geography
Sevier County covers an area of 2,902 square miles and is the fourth-largest county in Utah. The county is located in the Basin and Range Province, and is characterized by a series of mountain ranges and valleys. The highest point in the county is the summit of Mount Baldy, which has an elevation of 11,943 feet. The lowest point is the Sevier River, which has an elevation of 4,400 feet. The county is home to several lakes, including Fish Lake, Otter Creek Reservoir, and Piute Reservoir.
The climate of Sevier County is semi-arid, with hot summers and cold winters. The average annual precipitation is 11.5 inches, and the average annual snowfall is 40 inches.
Economy
The economy of Sevier County is largely based on agriculture and tourism. The county is home to several large farms, which produce hay, wheat, corn, and other crops. Livestock production is also important, with cattle, sheep, and horses being raised in the county.
Tourism is an important part of the economy, with visitors coming to the county to enjoy its natural beauty and recreational opportunities. Fish Lake is a popular destination for fishing, boating, and camping. The county is also home to several ski resorts, including Brian Head Ski Resort and Eagle Point Ski Resort.
Demographics
As of the 2010 census, the population of Sevier County was 20,802. The population is predominantly white (94.3%), with small percentages of other races, including Native American (2.2%), Hispanic (1.7%), and African American (0.7%). The median household income is $41,945, and the median age is 33.
The county is served by the Sevier School District, which includes seven elementary schools, two middle schools, and two high schools. The county is also home to Snow College, a two-year college located in Richfield.
Conclusion
Sevier County, Utah is a rural county located in the south-central part of the state. The county is characterized by its mountainous terrain and semi-arid climate. The economy of the county is largely based on agriculture and tourism, and the population is predominantly white. The county is served by the Sevier School District and is home to Snow College.
Common Questions
What is the Total Population of Sevier County?
Total Population of Sevier County is 21,667.
What is the Total Male Population of Sevier County?
Total Male Population of Sevier County is 11,144.
What is the Total Female Population of Sevier County?
Total Female Population of Sevier County is 10,523.
What is the Ratio of Males per 100 Females in Sevier County?
There are 105.90 Males per 100 Females in Sevier County.
What is the Ratio of Females per 100 Males in Sevier County?
There are 94.43 Females per 100 Males in Sevier County.
What is the Median Population Age in Sevier County?
Median Population Age in Sevier County is 36.2 Years.
What is the Average Family Size in Sevier County
Average Family Size in Sevier County is 3.3 People.
What is the Average Household Size in Sevier County
Average Household Size in Sevier County is 2.9 People.
What is Per Capita Income in Sevier County?
Per Capita income in Sevier County is $28,859.
What is the Median Family Income in Sevier County?
Median Family Income in Sevier County is $76,808.
What is the Median Household income in Sevier County?
Median Household Income in Sevier County is $66,972.
What is Income or Wage Gap in Sevier County?
Income or Wage Gap in Sevier County is 52.6%.
Women in Sevier County earn 47.4 cents for every dollar earned by a man.
What is Family Income Deficit in Sevier County?
Family Income Deficit in Sevier County is $9,308.
Families that are below poverty line in Sevier County earn $9,308 less on average than the poverty threshold level.
What is Inequality or Gini Index in Sevier County?
Inequality or Gini Index in Sevier County is 0.39.
How Large is the Labor Force in Sevier County?
There are 9,855 People in the Labor Forcein in Sevier County.
What is the Percentage of People in the Labor Force in Sevier County?
60.6% of People are in the Labor Force in Sevier County.
What is the Unemployment Rate in Sevier County?
Unemployment Rate in Sevier County is 4.9%.