Sanpete County, UT
Sanpete County Map
Sanpete County Overview
28,816
TOTAL POPULATION
15,325
MALE POPULATION
13,491
FEMALE POPULATION
113.59
MALES / 100 FEMALES
88.03
FEMALES / 100 MALES
33.1
MEDIAN AGE
3.4
AVG FAMILY SIZE
3.0
AVG HOUSEHOLD SIZE
$25,257
PER CAPITA INCOME
$72,583
AVG FAMILY INCOME
$64,356
AVG HOUSEHOLD INCOME
55.3%
WAGE / INCOME GAP [ % ]
44.7¢/ $1
WAGE / INCOME GAP [ $ ]
$11,811
FAMILY INCOME DEFICIT
0.41
INEQUALITY / GINI INDEX
12,871
LABOR FORCE [ PEOPLE ]
56.8%
PERCENT IN LABOR FORCE
4.6%
UNEMPLOYMENT RATE
Sanpete County Area Codes
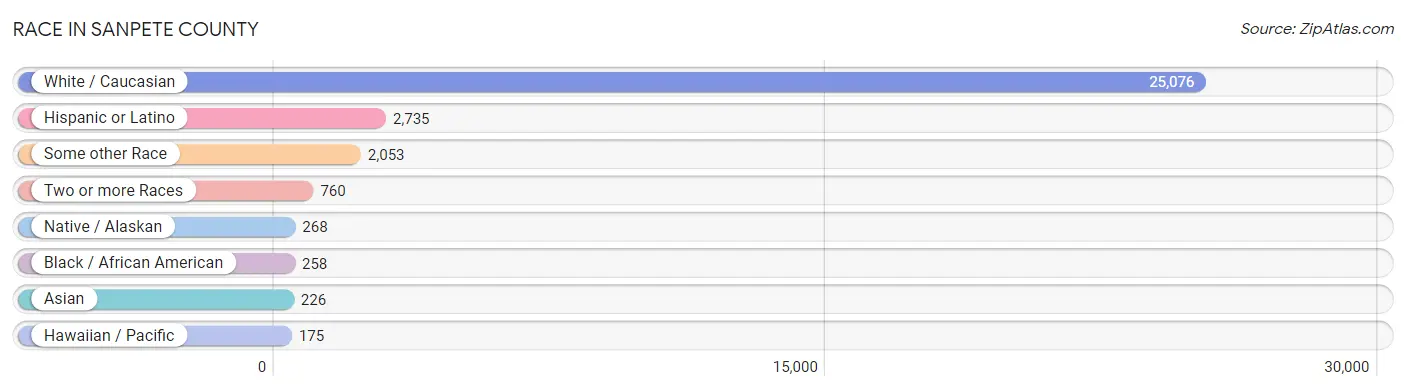
Race in Sanpete County
The most populous races in Sanpete County are White / Caucasian (25,076 | 87.0%), Hispanic or Latino (2,735 | 9.5%), and Some other Race (2,053 | 7.1%).
| Race | # Population | % Population |
| Asian | 226 | 0.8% |
| Black / African American | 258 | 0.9% |
| Hawaiian / Pacific | 175 | 0.6% |
| Hispanic or Latino | 2,735 | 9.5% |
| Native / Alaskan | 268 | 0.9% |
| White / Caucasian | 25,076 | 87.0% |
| Two or more Races | 760 | 2.6% |
| Some other Race | 2,053 | 7.1% |
| Total | 28,816 | 100.0% |
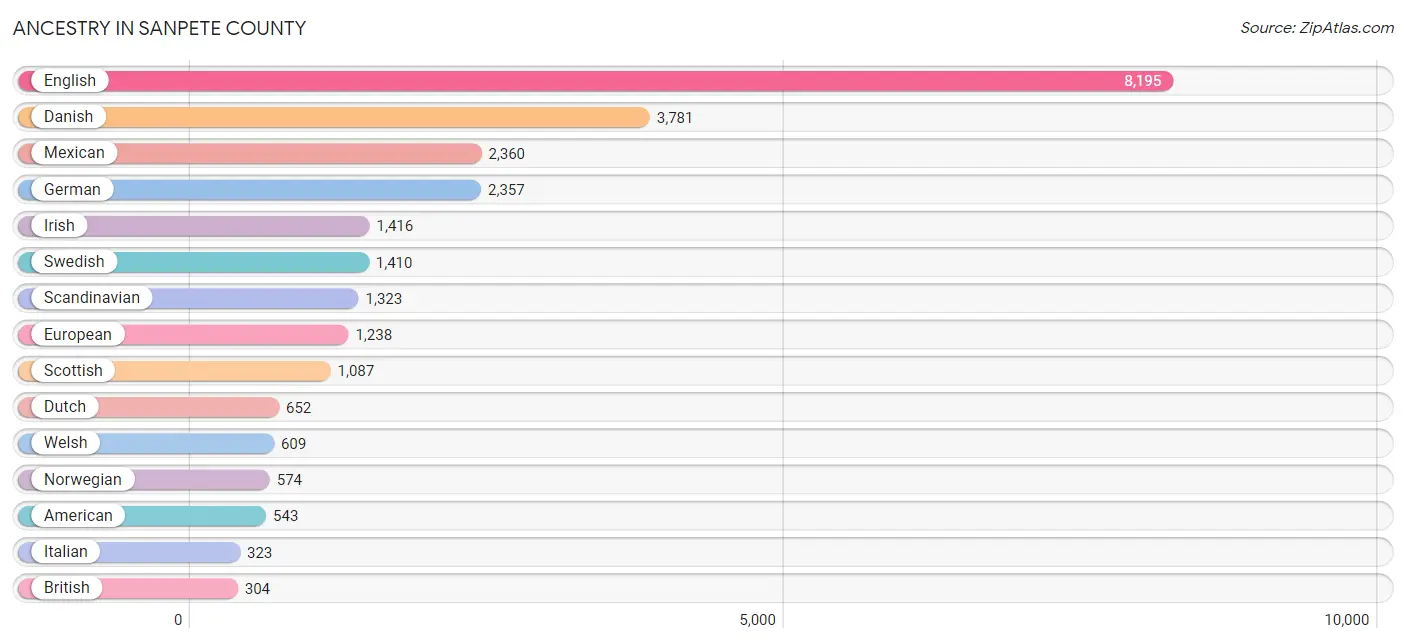
Ancestry in Sanpete County
The most populous ancestries reported in Sanpete County are English (8,195 | 28.4%), Danish (3,781 | 13.1%), Mexican (2,360 | 8.2%), German (2,357 | 8.2%), and Irish (1,416 | 4.9%), together accounting for 62.8% of all Sanpete County residents.
| Ancestry | # Population | % Population |
| African | 30 | 0.1% |
| Alaska Native | 24 | 0.1% |
| American | 543 | 1.9% |
| Argentinean | 115 | 0.4% |
| Armenian | 5 | 0.0% |
| Australian | 13 | 0.1% |
| Austrian | 43 | 0.2% |
| Basque | 16 | 0.1% |
| Belgian | 6 | 0.0% |
| Bhutanese | 80 | 0.3% |
| Brazilian | 34 | 0.1% |
| British | 304 | 1.1% |
| Burmese | 5 | 0.0% |
| Canadian | 89 | 0.3% |
| Central American | 39 | 0.1% |
| Central American Indian | 3 | 0.0% |
| Cherokee | 20 | 0.1% |
| Chilean | 1 | 0.0% |
| Costa Rican | 6 | 0.0% |
| Creek | 8 | 0.0% |
| Croatian | 41 | 0.1% |
| Cuban | 19 | 0.1% |
| Czech | 27 | 0.1% |
| Danish | 3,781 | 13.1% |
| Dominican | 2 | 0.0% |
| Dutch | 652 | 2.3% |
| Eastern European | 13 | 0.1% |
| English | 8,195 | 28.4% |
| European | 1,238 | 4.3% |
| Finnish | 12 | 0.0% |
| French | 241 | 0.8% |
| French Canadian | 13 | 0.1% |
| German | 2,357 | 8.2% |
| Greek | 65 | 0.2% |
| Guatemalan | 7 | 0.0% |
| Honduran | 1 | 0.0% |
| Hungarian | 74 | 0.3% |
| Icelander | 97 | 0.3% |
| Indian (Asian) | 165 | 0.6% |
| Inupiat | 3 | 0.0% |
| Irish | 1,416 | 4.9% |
| Israeli | 4 | 0.0% |
| Italian | 323 | 1.1% |
| Korean | 87 | 0.3% |
| Lithuanian | 4 | 0.0% |
| Malaysian | 37 | 0.1% |
| Mexican | 2,360 | 8.2% |
| Mexican American Indian | 25 | 0.1% |
| Native Hawaiian | 137 | 0.5% |
| Navajo | 266 | 0.9% |
| New Zealander | 18 | 0.1% |
| Northern European | 24 | 0.1% |
| Norwegian | 574 | 2.0% |
| Paiute | 64 | 0.2% |
| Pakistani | 20 | 0.1% |
| Paraguayan | 5 | 0.0% |
| Peruvian | 16 | 0.1% |
| Pima | 7 | 0.0% |
| Polish | 124 | 0.4% |
| Portuguese | 19 | 0.1% |
| Puerto Rican | 17 | 0.1% |
| Romanian | 23 | 0.1% |
| Russian | 61 | 0.2% |
| Salvadoran | 25 | 0.1% |
| Samoan | 133 | 0.5% |
| Scandinavian | 1,323 | 4.6% |
| Scotch-Irish | 125 | 0.4% |
| Scottish | 1,087 | 3.8% |
| Slovene | 3 | 0.0% |
| South African | 18 | 0.1% |
| South American | 138 | 0.5% |
| Spaniard | 47 | 0.2% |
| Spanish | 92 | 0.3% |
| Sri Lankan | 49 | 0.2% |
| Subsaharan African | 48 | 0.2% |
| Swedish | 1,410 | 4.9% |
| Swiss | 172 | 0.6% |
| Thai | 3 | 0.0% |
| Tongan | 26 | 0.1% |
| Ukrainian | 3 | 0.0% |
| Ute | 57 | 0.2% |
| Welsh | 609 | 2.1% | View All 82 Rows |
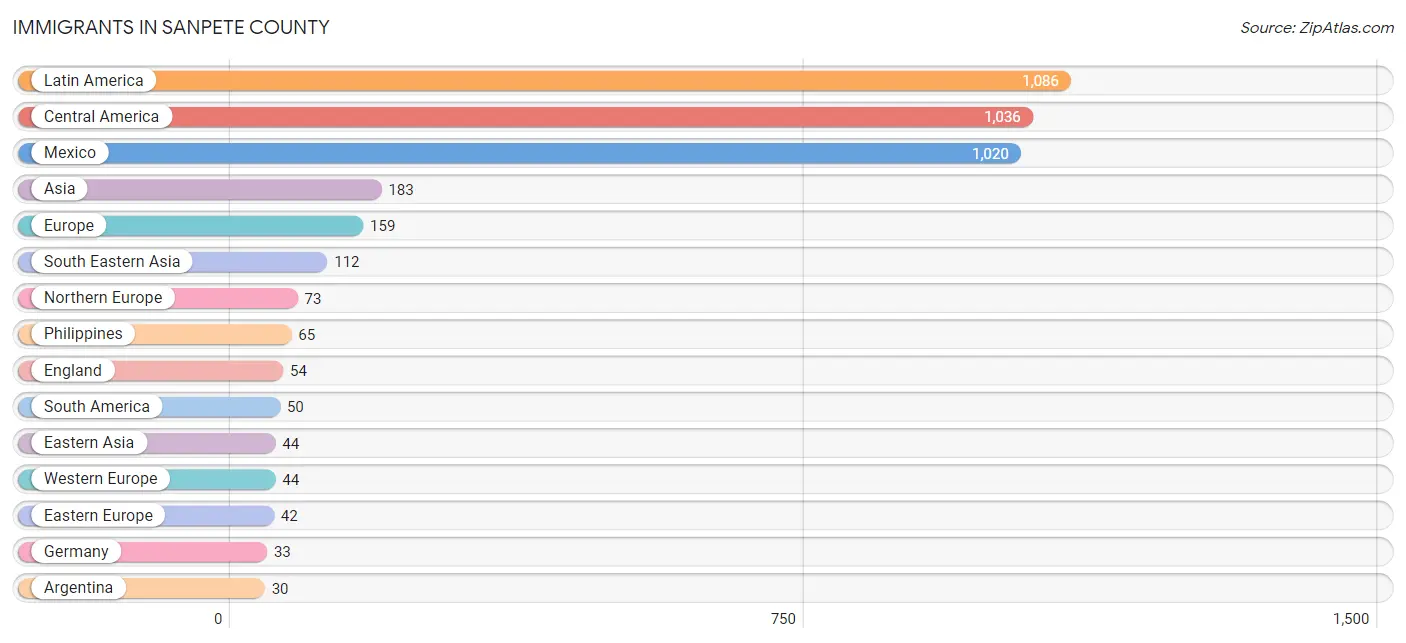
Immigrants in Sanpete County
The most numerous immigrant groups reported in Sanpete County came from Latin America (1,086 | 3.8%), Central America (1,036 | 3.6%), Mexico (1,020 | 3.5%), Asia (183 | 0.6%), and Europe (159 | 0.5%), together accounting for 12.1% of all Sanpete County residents.
| Immigration Origin | # Population | % Population |
| Africa | 18 | 0.1% |
| Argentina | 30 | 0.1% |
| Asia | 183 | 0.6% |
| Brazil | 10 | 0.0% |
| Canada | 11 | 0.0% |
| Central America | 1,036 | 3.6% |
| Chile | 1 | 0.0% |
| China | 28 | 0.1% |
| Eastern Africa | 8 | 0.0% |
| Eastern Asia | 44 | 0.2% |
| Eastern Europe | 42 | 0.2% |
| El Salvador | 12 | 0.0% |
| England | 54 | 0.2% |
| Europe | 159 | 0.5% |
| Germany | 33 | 0.1% |
| Guatemala | 3 | 0.0% |
| Honduras | 1 | 0.0% |
| India | 9 | 0.0% |
| Indonesia | 5 | 0.0% |
| Japan | 11 | 0.0% |
| Kenya | 8 | 0.0% |
| Korea | 5 | 0.0% |
| Laos | 10 | 0.0% |
| Latin America | 1,086 | 3.8% |
| Mexico | 1,020 | 3.5% |
| Netherlands | 11 | 0.0% |
| Northern Europe | 73 | 0.3% |
| Oceania | 8 | 0.0% |
| Peru | 4 | 0.0% |
| Philippines | 65 | 0.2% |
| Romania | 20 | 0.1% |
| South Africa | 10 | 0.0% |
| South America | 50 | 0.2% |
| South Central Asia | 27 | 0.1% |
| South Eastern Asia | 112 | 0.4% |
| Sri Lanka | 2 | 0.0% |
| Sweden | 3 | 0.0% |
| Thailand | 5 | 0.0% |
| Ukraine | 22 | 0.1% |
| Vietnam | 27 | 0.1% |
| Western Europe | 44 | 0.2% | View All 41 Rows |
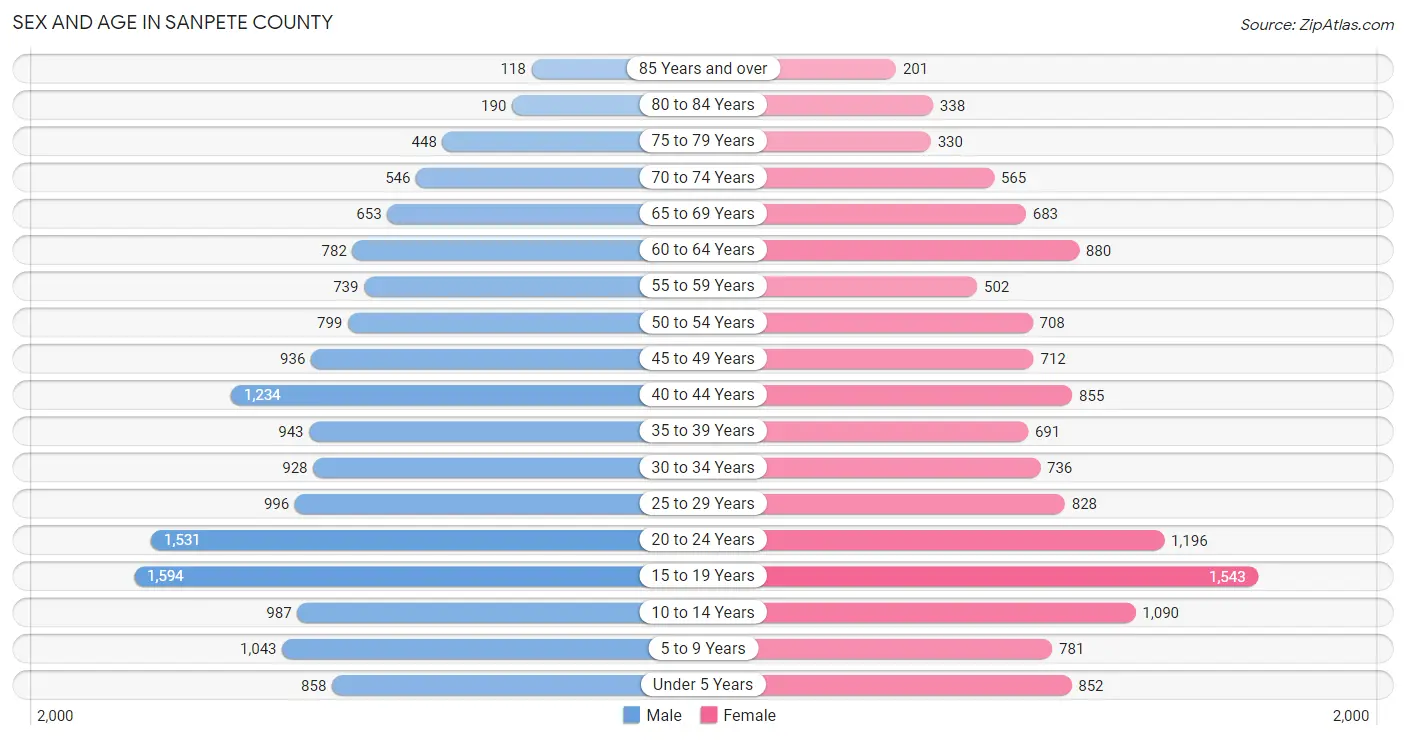
Sex and Age in Sanpete County
Sex and Age in Sanpete County
The most populous age groups in Sanpete County are 15 to 19 Years (1,594 | 10.4%) for men and 15 to 19 Years (1,543 | 11.4%) for women.
| Age Bracket | Male | Female |
| Under 5 Years | 858 (5.6%) | 852 (6.3%) |
| 5 to 9 Years | 1,043 (6.8%) | 781 (5.8%) |
| 10 to 14 Years | 987 (6.4%) | 1,090 (8.1%) |
| 15 to 19 Years | 1,594 (10.4%) | 1,543 (11.4%) |
| 20 to 24 Years | 1,531 (10.0%) | 1,196 (8.9%) |
| 25 to 29 Years | 996 (6.5%) | 828 (6.1%) |
| 30 to 34 Years | 928 (6.1%) | 736 (5.5%) |
| 35 to 39 Years | 943 (6.1%) | 691 (5.1%) |
| 40 to 44 Years | 1,234 (8.1%) | 855 (6.3%) |
| 45 to 49 Years | 936 (6.1%) | 712 (5.3%) |
| 50 to 54 Years | 799 (5.2%) | 708 (5.2%) |
| 55 to 59 Years | 739 (4.8%) | 502 (3.7%) |
| 60 to 64 Years | 782 (5.1%) | 880 (6.5%) |
| 65 to 69 Years | 653 (4.3%) | 683 (5.1%) |
| 70 to 74 Years | 546 (3.6%) | 565 (4.2%) |
| 75 to 79 Years | 448 (2.9%) | 330 (2.5%) |
| 80 to 84 Years | 190 (1.2%) | 338 (2.5%) |
| 85 Years and over | 118 (0.8%) | 201 (1.5%) |
| Total | 15,325 (100.0%) | 13,491 (100.0%) |
Families and Households in Sanpete County
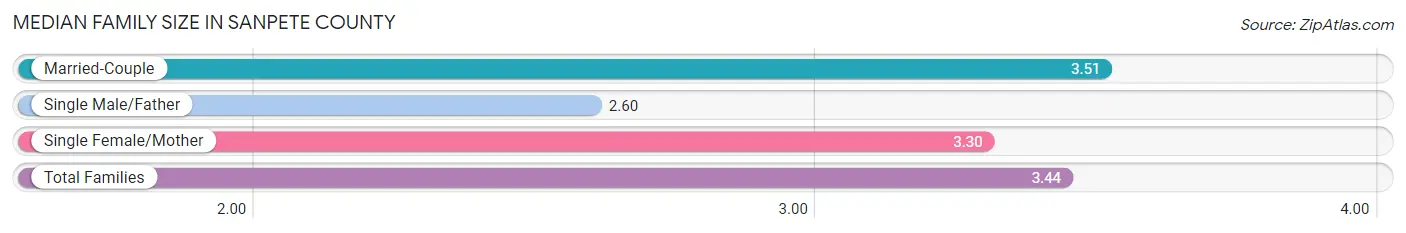
Median Family Size in Sanpete County
The median family size in Sanpete County is 3.44 persons per family, with married-couple families (5,670 | 86.7%) accounting for the largest median family size of 3.51 persons per family. On the other hand, single male/father families (359 | 5.5%) represent the smallest median family size with 2.60 persons per family.
| Family Type | # Families | Family Size |
| Married-Couple | 5,670 (86.7%) | 3.51 |
| Single Male/Father | 359 (5.5%) | 2.60 |
| Single Female/Mother | 510 (7.8%) | 3.30 |
| Total Families | 6,539 (100.0%) | 3.44 |
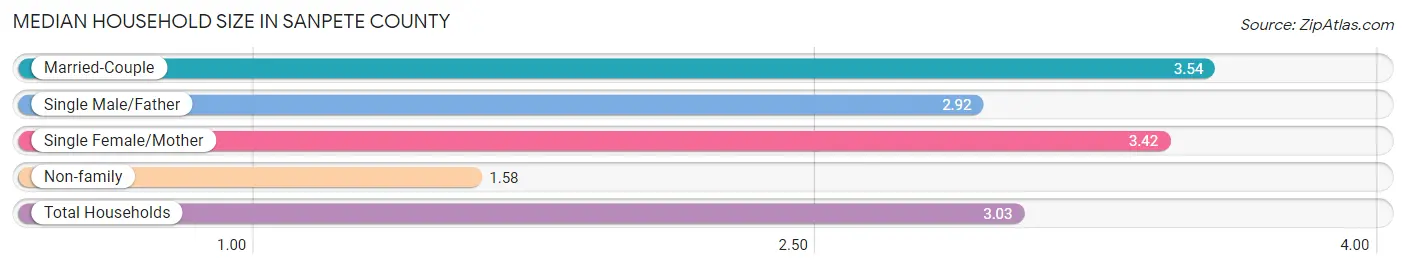
Median Household Size in Sanpete County
The median household size in Sanpete County is 3.03 persons per household, with married-couple households (5,670 | 65.8%) accounting for the largest median household size of 3.54 persons per household. non-family households (2,078 | 24.1%) represent the smallest median household size with 1.58 persons per household.
| Household Type | # Households | Household Size |
| Married-Couple | 5,670 (65.8%) | 3.54 |
| Single Male/Father | 359 (4.2%) | 2.92 |
| Single Female/Mother | 510 (5.9%) | 3.42 |
| Non-family | 2,078 (24.1%) | 1.58 |
| Total Households | 8,617 (100.0%) | 3.03 |
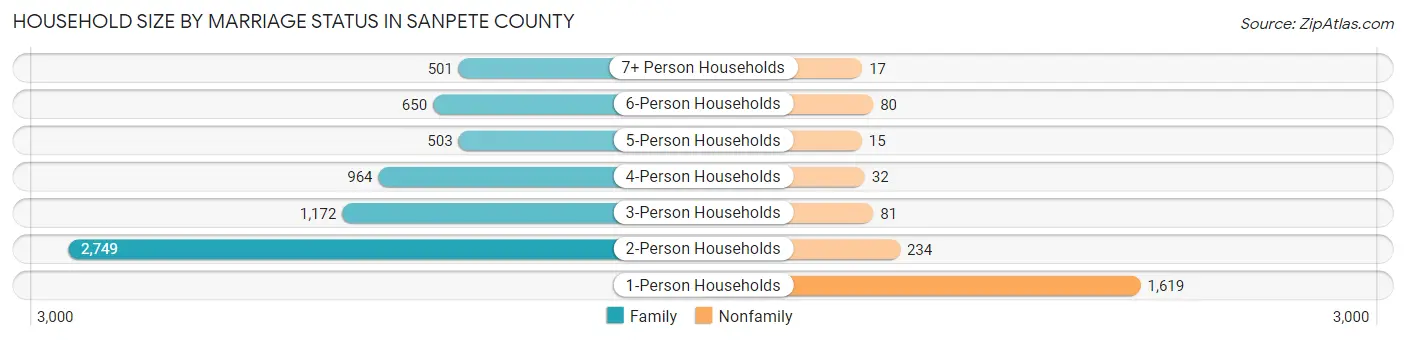
Household Size by Marriage Status in Sanpete County
Out of a total of 8,617 households in Sanpete County, 6,539 (75.9%) are family households, while 2,078 (24.1%) are nonfamily households. The most numerous type of family households are 2-person households, comprising 2,749, and the most common type of nonfamily households are 1-person households, comprising 1,619.
| Household Size | Family Households | Nonfamily Households |
| 1-Person Households | - | 1,619 (18.8%) |
| 2-Person Households | 2,749 (31.9%) | 234 (2.7%) |
| 3-Person Households | 1,172 (13.6%) | 81 (0.9%) |
| 4-Person Households | 964 (11.2%) | 32 (0.4%) |
| 5-Person Households | 503 (5.8%) | 15 (0.2%) |
| 6-Person Households | 650 (7.5%) | 80 (0.9%) |
| 7+ Person Households | 501 (5.8%) | 17 (0.2%) |
| Total | 6,539 (75.9%) | 2,078 (24.1%) |
Female Fertility in Sanpete County
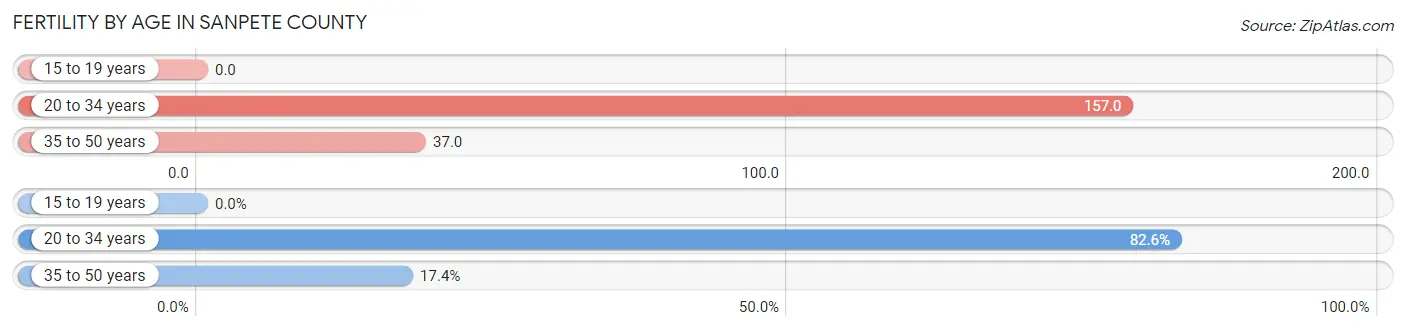
Fertility by Age in Sanpete County
Average fertility rate in Sanpete County is 78.0 births per 1,000 women. Women in the age bracket of 20 to 34 years have the highest fertility rate with 157.0 births per 1,000 women. Women in the age bracket of 20 to 34 years acount for 82.6% of all women with births.
| Age Bracket | Women with Births | Births / 1,000 Women |
| 15 to 19 years | 0 (0.0%) | 0.0 |
| 20 to 34 years | 432 (82.6%) | 157.0 |
| 35 to 50 years | 91 (17.4%) | 37.0 |
| Total | 523 (100.0%) | 78.0 |
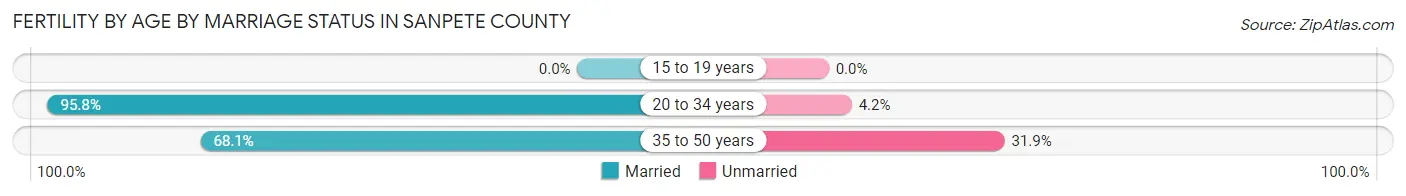
Fertility by Age by Marriage Status in Sanpete County
91.0% of women with births (523) in Sanpete County are married. The highest percentage of unmarried women with births falls into 35 to 50 years age bracket with 31.9% of them unmarried at the time of birth, while the lowest percentage of unmarried women with births belong to 20 to 34 years age bracket with 4.2% of them unmarried.
| Age Bracket | Married | Unmarried |
| 15 to 19 years | 0 (0.0%) | 0 (0.0%) |
| 20 to 34 years | 414 (95.8%) | 18 (4.2%) |
| 35 to 50 years | 62 (68.1%) | 29 (31.9%) |
| Total | 476 (91.0%) | 47 (9.0%) |
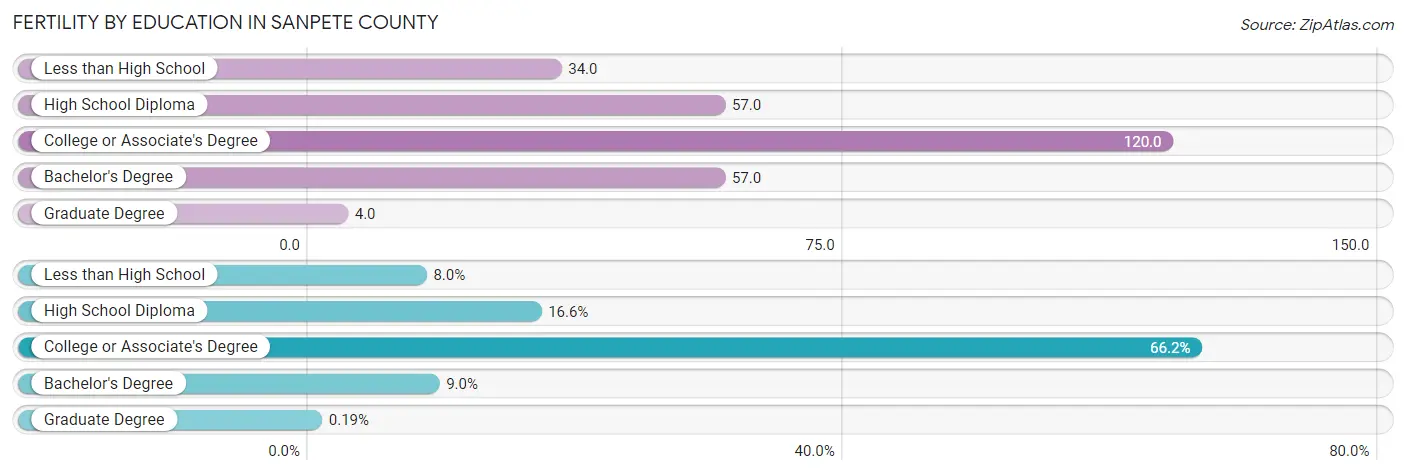
Fertility by Education in Sanpete County
Average fertility rate in Sanpete County is 78.0 births per 1,000 women. Women with the education attainment of college or associate's degree have the highest fertility rate of 120.0 births per 1,000 women, while women with the education attainment of graduate degree have the lowest fertility at 4.0 births per 1,000 women. Women with the education attainment of college or associate's degree represent 66.2% of all women with births.
| Educational Attainment | Women with Births | Births / 1,000 Women |
| Less than High School | 42 (8.0%) | 34.0 |
| High School Diploma | 87 (16.6%) | 57.0 |
| College or Associate's Degree | 346 (66.2%) | 120.0 |
| Bachelor's Degree | 47 (9.0%) | 57.0 |
| Graduate Degree | 1 (0.2%) | 4.0 |
| Total | 523 (100.0%) | 78.0 |
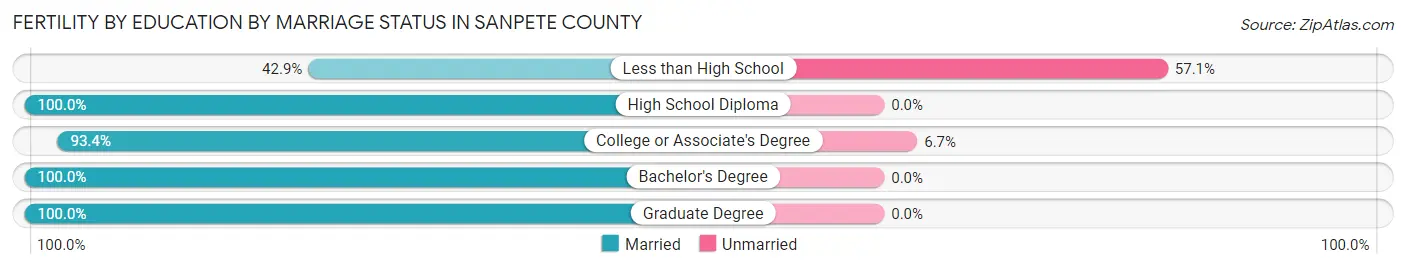
Fertility by Education by Marriage Status in Sanpete County
9.0% of women with births in Sanpete County are unmarried. Women with the educational attainment of high school diploma are most likely to be married with 100.0% of them married at childbirth, while women with the educational attainment of less than high school are least likely to be married with 57.1% of them unmarried at childbirth.
| Educational Attainment | Married | Unmarried |
| Less than High School | 18 (42.9%) | 24 (57.1%) |
| High School Diploma | 87 (100.0%) | 0 (0.0%) |
| College or Associate's Degree | 323 (93.3%) | 23 (6.7%) |
| Bachelor's Degree | 47 (100.0%) | 0 (0.0%) |
| Graduate Degree | 1 (100.0%) | 0 (0.0%) |
| Total | 476 (91.0%) | 47 (9.0%) |
Income in Sanpete County
Income Overview in Sanpete County
Per Capita Income in Sanpete County is $25,257, while median incomes of families and households are $72,583 and $64,356 respectively.
| Characteristic | Number | Measure |
| Per Capita Income | 28,816 | $25,257 |
| Median Family Income | 6,539 | $72,583 |
| Mean Family Income | 6,539 | $92,298 |
| Median Household Income | 8,617 | $64,356 |
| Mean Household Income | 8,617 | $81,805 |
| Income Deficit | 6,539 | $11,811 |
| Wage / Income Gap (%) | 28,816 | 55.29% |
| Wage / Income Gap ($) | 28,816 | 44.71¢ per $1 |
| Gini / Inequality Index | 28,816 | 0.41 |
Earnings by Sex in Sanpete County
Average Earnings in Sanpete County are $28,017, $40,119 for men and $17,939 for women, a difference of 55.3%.
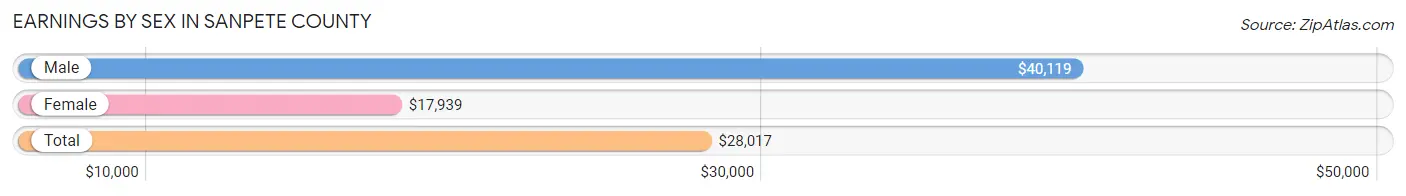
| Sex | Number | Average Earnings |
| Male | 8,180 (56.3%) | $40,119 |
| Female | 6,347 (43.7%) | $17,939 |
| Total | 14,527 (100.0%) | $28,017 |
Earnings by Sex by Income Bracket in Sanpete County
The most common earnings brackets in Sanpete County are $75,000 to $99,999 for men (757 | 9.2%) and $2,499 or less for women (746 | 11.7%).
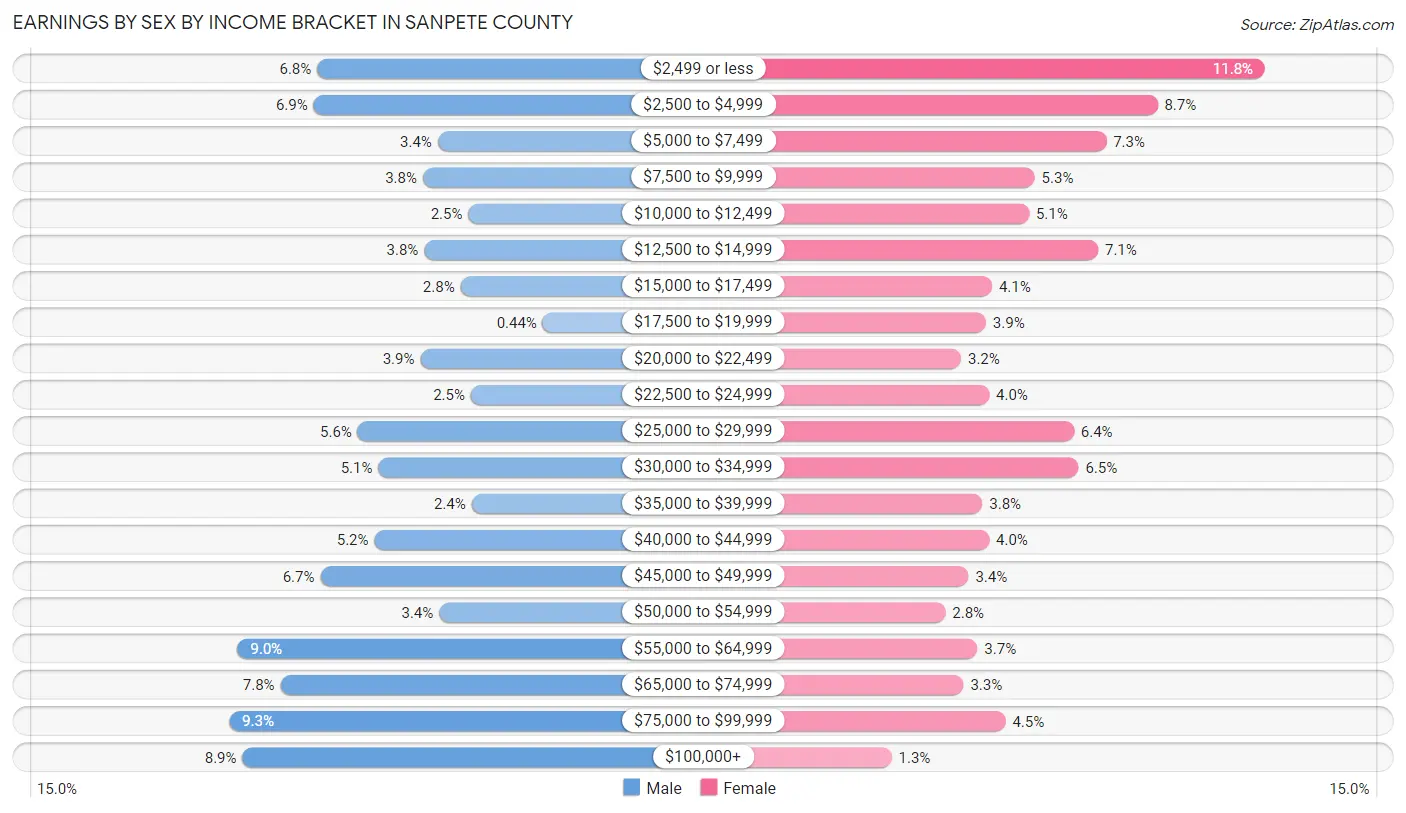
| Income | Male | Female |
| $2,499 or less | 555 (6.8%) | 746 (11.7%) |
| $2,500 to $4,999 | 563 (6.9%) | 554 (8.7%) |
| $5,000 to $7,499 | 277 (3.4%) | 463 (7.3%) |
| $7,500 to $9,999 | 312 (3.8%) | 335 (5.3%) |
| $10,000 to $12,499 | 207 (2.5%) | 325 (5.1%) |
| $12,500 to $14,999 | 308 (3.8%) | 448 (7.1%) |
| $15,000 to $17,499 | 225 (2.8%) | 259 (4.1%) |
| $17,500 to $19,999 | 36 (0.4%) | 248 (3.9%) |
| $20,000 to $22,499 | 317 (3.9%) | 204 (3.2%) |
| $22,500 to $24,999 | 201 (2.5%) | 254 (4.0%) |
| $25,000 to $29,999 | 461 (5.6%) | 405 (6.4%) |
| $30,000 to $34,999 | 414 (5.1%) | 413 (6.5%) |
| $35,000 to $39,999 | 200 (2.4%) | 242 (3.8%) |
| $40,000 to $44,999 | 423 (5.2%) | 254 (4.0%) |
| $45,000 to $49,999 | 547 (6.7%) | 217 (3.4%) |
| $50,000 to $54,999 | 274 (3.4%) | 176 (2.8%) |
| $55,000 to $64,999 | 738 (9.0%) | 233 (3.7%) |
| $65,000 to $74,999 | 639 (7.8%) | 208 (3.3%) |
| $75,000 to $99,999 | 757 (9.2%) | 283 (4.5%) |
| $100,000+ | 726 (8.9%) | 80 (1.3%) |
| Total | 8,180 (100.0%) | 6,347 (100.0%) |
Earnings by Sex by Educational Attainment in Sanpete County
Average earnings in Sanpete County are $50,586 for men and $24,640 for women, a difference of 51.3%. Men with an educational attainment of graduate degree enjoy the highest average annual earnings of $70,000, while those with less than high school education earn the least with $27,917. Women with an educational attainment of graduate degree earn the most with the average annual earnings of $65,192, while those with high school diploma education have the smallest earnings of $20,654.
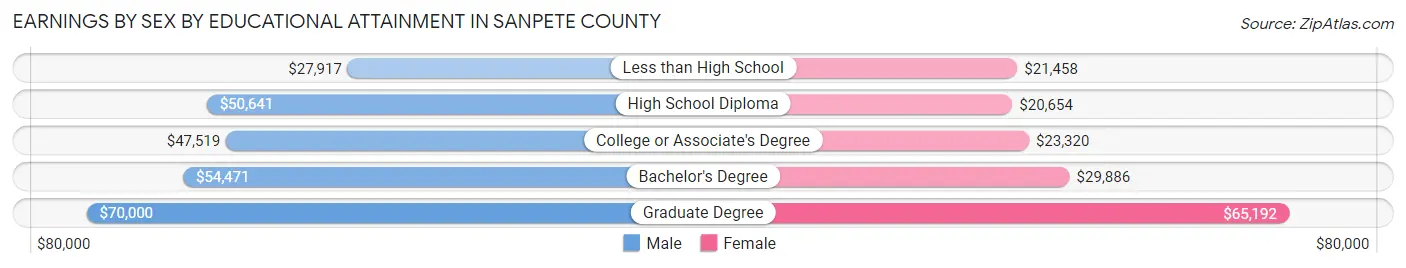
| Educational Attainment | Male Income | Female Income |
| Less than High School | $27,917 | $21,458 |
| High School Diploma | $50,641 | $20,654 |
| College or Associate's Degree | $47,519 | $23,320 |
| Bachelor's Degree | $54,471 | $29,886 |
| Graduate Degree | $70,000 | $65,192 |
| Total | $50,586 | $24,640 |
Family Income in Sanpete County
Family Income Brackets in Sanpete County
According to the Sanpete County family income data, there are 1,445 families falling into the $50,000 to $74,999 income range, which is the most common income bracket and makes up 22.1% of all families. Conversely, the less than $10,000 income bracket is the least frequent group with only 65 families (1.0%) belonging to this category.
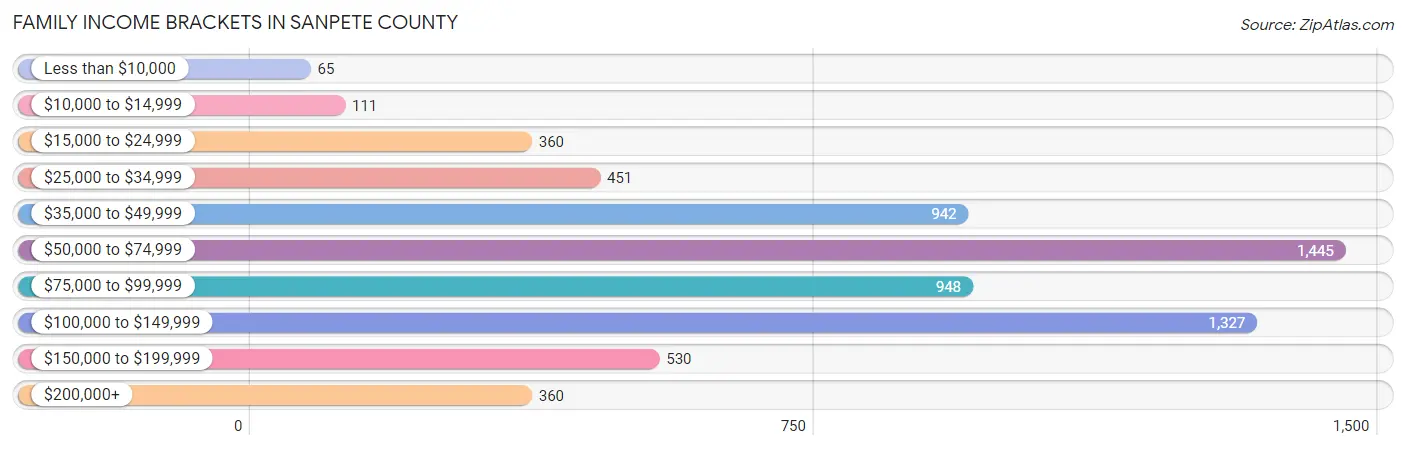
| Income Bracket | # Families | % Families |
| Less than $10,000 | 65 | 1.0% |
| $10,000 to $14,999 | 111 | 1.7% |
| $15,000 to $24,999 | 360 | 5.5% |
| $25,000 to $34,999 | 451 | 6.9% |
| $35,000 to $49,999 | 942 | 14.4% |
| $50,000 to $74,999 | 1,445 | 22.1% |
| $75,000 to $99,999 | 948 | 14.5% |
| $100,000 to $149,999 | 1,327 | 20.3% |
| $150,000 to $199,999 | 530 | 8.1% |
| $200,000+ | 360 | 5.5% |
Family Income by Famaliy Size in Sanpete County
4-person families (976 | 14.9%) account for the highest median family income in Sanpete County with $96,250 per family, while 2-person families (2,799 | 42.8%) have the highest median income of $32,760 per family member.
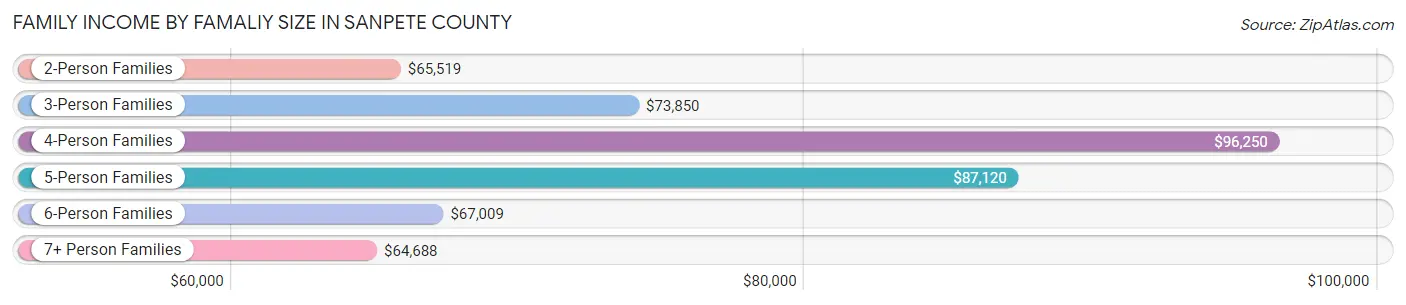
| Income Bracket | # Families | Median Income |
| 2-Person Families | 2,799 (42.8%) | $65,519 |
| 3-Person Families | 1,153 (17.6%) | $73,850 |
| 4-Person Families | 976 (14.9%) | $96,250 |
| 5-Person Families | 511 (7.8%) | $87,120 |
| 6-Person Families | 643 (9.8%) | $67,009 |
| 7+ Person Families | 457 (7.0%) | $64,688 |
| Total | 6,539 (100.0%) | $72,583 |
Family Income by Number of Earners in Sanpete County
The median family income in Sanpete County is $72,583, with families comprising 3+ earners (1,071) having the highest median family income of $124,688, while families with no earners (991) have the lowest median family income of $42,104, accounting for 16.4% and 15.2% of families, respectively.
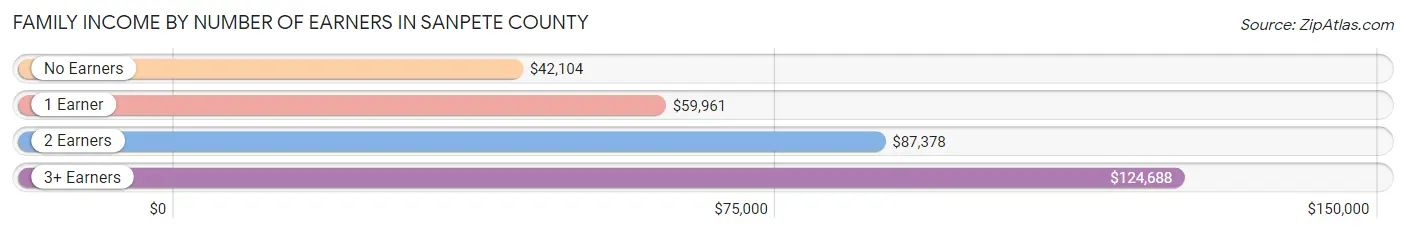
| Number of Earners | # Families | Median Income |
| No Earners | 991 (15.2%) | $42,104 |
| 1 Earner | 1,595 (24.4%) | $59,961 |
| 2 Earners | 2,882 (44.1%) | $87,378 |
| 3+ Earners | 1,071 (16.4%) | $124,688 |
| Total | 6,539 (100.0%) | $72,583 |
Household Income in Sanpete County
Household Income Brackets in Sanpete County
With 1,784 households falling in the category, the $50,000 to $74,999 income range is the most frequent in Sanpete County, accounting for 20.7% of all households. In contrast, only 284 households (3.3%) fall into the $10,000 to $14,999 income bracket, making it the least populous group.
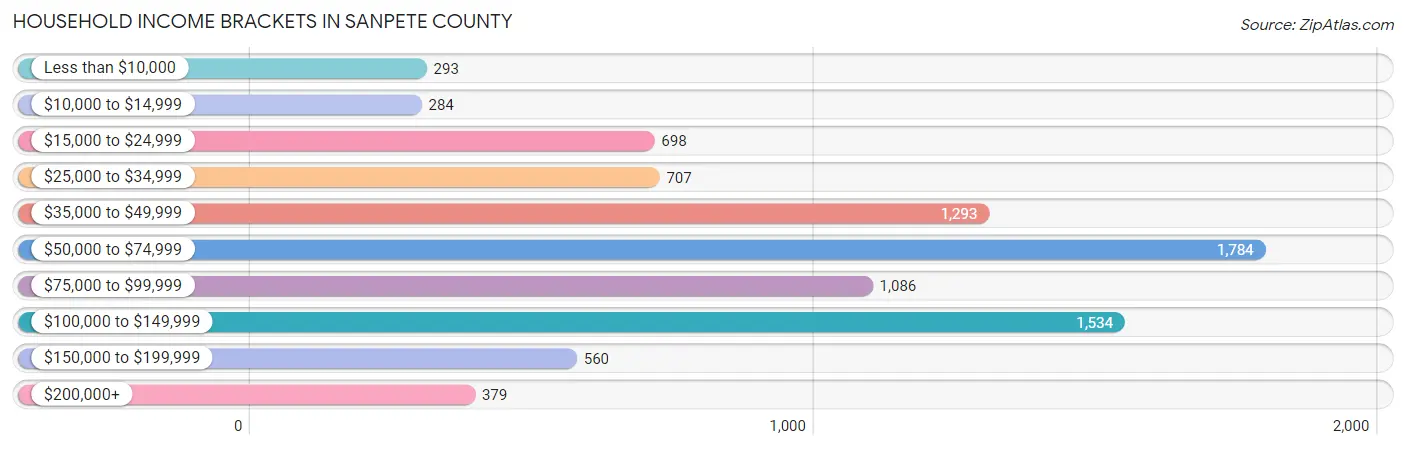
| Income Bracket | # Households | % Households |
| Less than $10,000 | 293 | 3.4% |
| $10,000 to $14,999 | 284 | 3.3% |
| $15,000 to $24,999 | 698 | 8.1% |
| $25,000 to $34,999 | 707 | 8.2% |
| $35,000 to $49,999 | 1,293 | 15.0% |
| $50,000 to $74,999 | 1,784 | 20.7% |
| $75,000 to $99,999 | 1,086 | 12.6% |
| $100,000 to $149,999 | 1,534 | 17.8% |
| $150,000 to $199,999 | 560 | 6.5% |
| $200,000+ | 379 | 4.4% |
Household Income by Householder Age in Sanpete County
The median household income in Sanpete County is $64,356, with the highest median household income of $84,773 found in the 45 to 64 years age bracket for the primary householder. A total of 2,792 households (32.4%) fall into this category. Meanwhile, the 15 to 24 years age bracket for the primary householder has the lowest median household income of $46,806, with 630 households (7.3%) in this group.
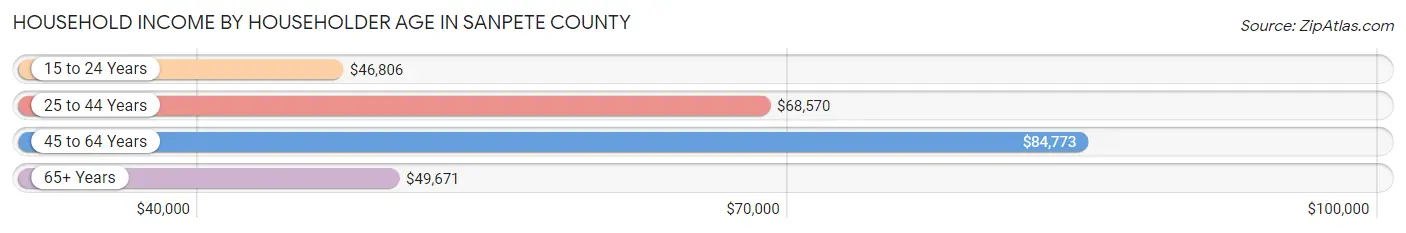
| Income Bracket | # Households | Median Income |
| 15 to 24 Years | 630 (7.3%) | $46,806 |
| 25 to 44 Years | 2,687 (31.2%) | $68,570 |
| 45 to 64 Years | 2,792 (32.4%) | $84,773 |
| 65+ Years | 2,508 (29.1%) | $49,671 |
| Total | 8,617 (100.0%) | $64,356 |
Poverty in Sanpete County
Income Below Poverty by Sex and Age in Sanpete County
With 12.5% poverty level for males and 17.1% for females among the residents of Sanpete County, 5 year old males and 18 to 24 year old females are the most vulnerable to poverty, with 83 males (30.5%) and 582 females (32.6%) in their respective age groups living below the poverty level.
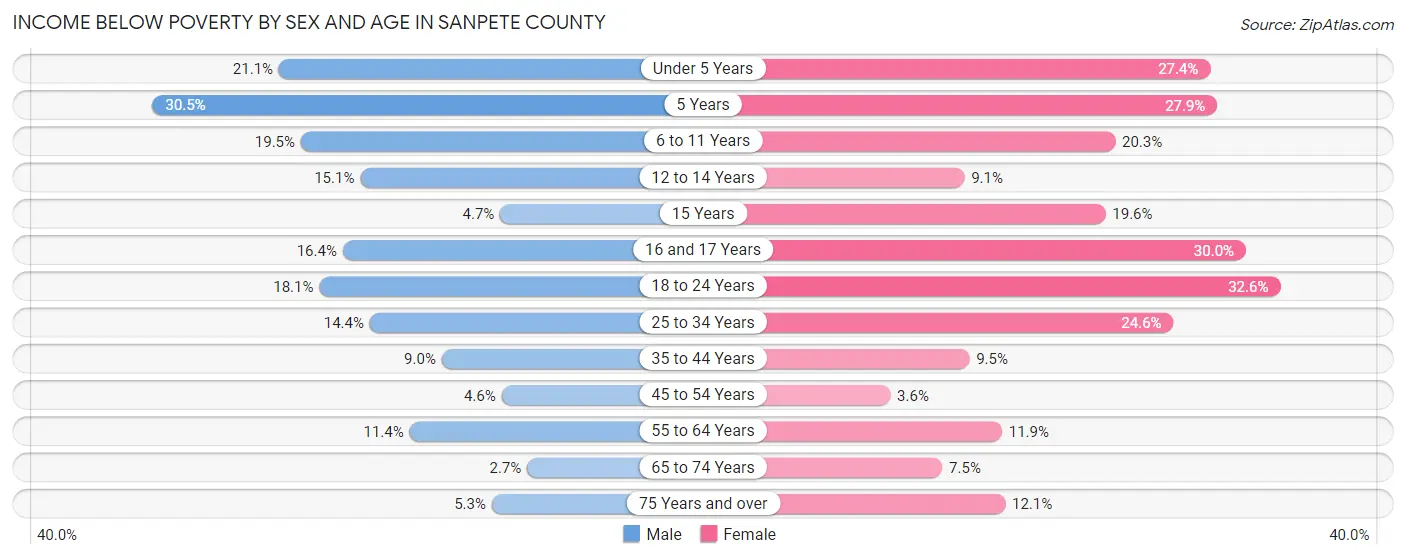
| Age Bracket | Male | Female |
| Under 5 Years | 173 (21.1%) | 233 (27.4%) |
| 5 Years | 83 (30.5%) | 51 (27.9%) |
| 6 to 11 Years | 230 (19.5%) | 194 (20.3%) |
| 12 to 14 Years | 81 (15.1%) | 62 (9.1%) |
| 15 Years | 12 (4.7%) | 46 (19.6%) |
| 16 and 17 Years | 76 (16.4%) | 138 (30.0%) |
| 18 to 24 Years | 375 (18.1%) | 582 (32.6%) |
| 25 to 34 Years | 185 (14.4%) | 385 (24.6%) |
| 35 to 44 Years | 140 (9.0%) | 146 (9.5%) |
| 45 to 54 Years | 65 (4.6%) | 51 (3.6%) |
| 55 to 64 Years | 150 (11.4%) | 163 (11.9%) |
| 65 to 74 Years | 32 (2.7%) | 93 (7.4%) |
| 75 Years and over | 39 (5.3%) | 103 (12.1%) |
| Total | 1,641 (12.5%) | 2,247 (17.1%) |
Income Above Poverty by Sex and Age in Sanpete County
According to the poverty statistics in Sanpete County, males aged 65 to 74 years and females aged 45 to 54 years are the age groups that are most secure financially, with 97.3% of males and 96.4% of females in these age groups living above the poverty line.
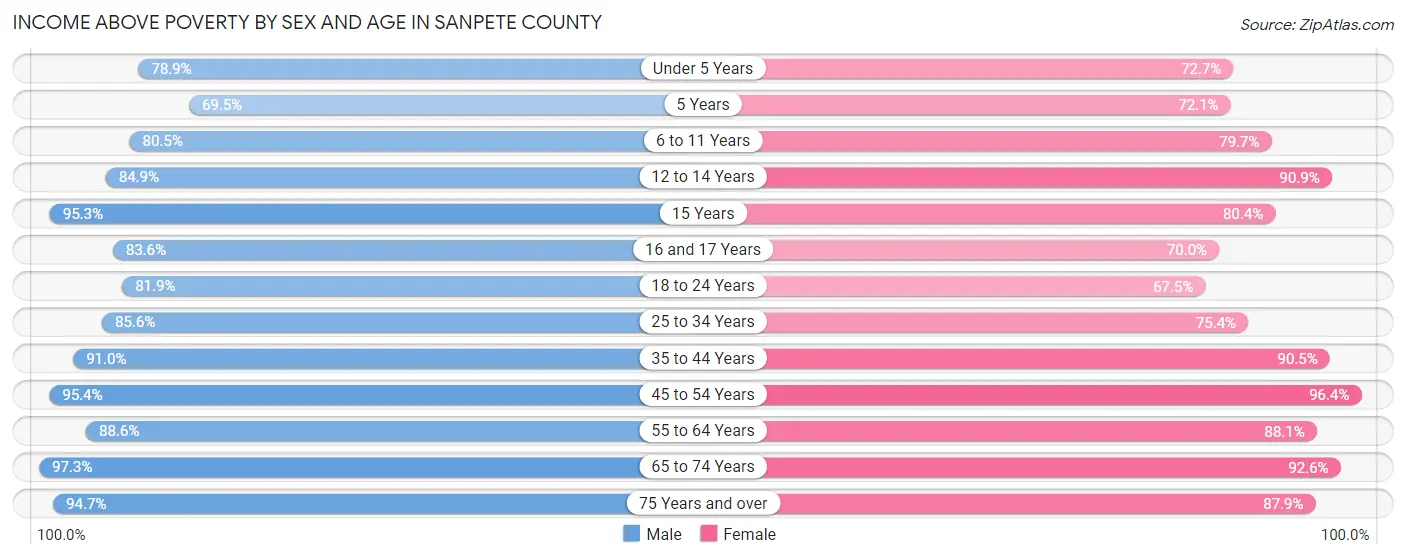
| Age Bracket | Male | Female |
| Under 5 Years | 646 (78.9%) | 619 (72.7%) |
| 5 Years | 189 (69.5%) | 132 (72.1%) |
| 6 to 11 Years | 950 (80.5%) | 762 (79.7%) |
| 12 to 14 Years | 456 (84.9%) | 620 (90.9%) |
| 15 Years | 244 (95.3%) | 189 (80.4%) |
| 16 and 17 Years | 388 (83.6%) | 322 (70.0%) |
| 18 to 24 Years | 1,694 (81.9%) | 1,206 (67.4%) |
| 25 to 34 Years | 1,102 (85.6%) | 1,179 (75.4%) |
| 35 to 44 Years | 1,411 (91.0%) | 1,398 (90.5%) |
| 45 to 54 Years | 1,350 (95.4%) | 1,369 (96.4%) |
| 55 to 64 Years | 1,164 (88.6%) | 1,209 (88.1%) |
| 65 to 74 Years | 1,159 (97.3%) | 1,155 (92.5%) |
| 75 Years and over | 696 (94.7%) | 747 (87.9%) |
| Total | 11,449 (87.5%) | 10,907 (82.9%) |
Income Below Poverty Among Married-Couple Families in Sanpete County
The poverty statistics for married-couple families in Sanpete County show that 7.2% or 406 of the total 5,670 families live below the poverty line. Families with 5 or more children have the highest poverty rate of 32.9%, comprising of 102 families. On the other hand, families with no children have the lowest poverty rate of 2.8%, which includes 83 families.
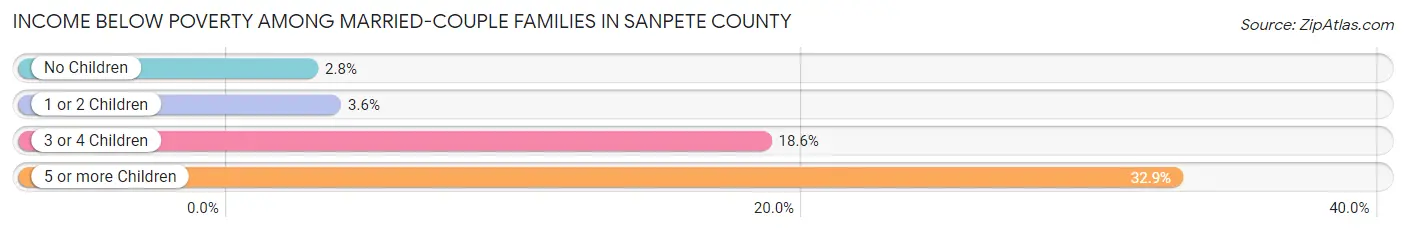
| Children | Above Poverty | Below Poverty |
| No Children | 2,896 (97.2%) | 83 (2.8%) |
| 1 or 2 Children | 1,424 (96.4%) | 53 (3.6%) |
| 3 or 4 Children | 736 (81.4%) | 168 (18.6%) |
| 5 or more Children | 208 (67.1%) | 102 (32.9%) |
| Total | 5,264 (92.8%) | 406 (7.2%) |
Income Below Poverty Among Single-Parent Households in Sanpete County
According to the poverty data in Sanpete County, 9.2% or 33 single-father households and 21.4% or 109 single-mother households are living below the poverty line. Among single-father households, those with 5 or more children have the highest poverty rate, with 3 households (100.0%) experiencing poverty. Likewise, among single-mother households, those with 5 or more children have the highest poverty rate, with 24 households (96.0%) falling below the poverty line.
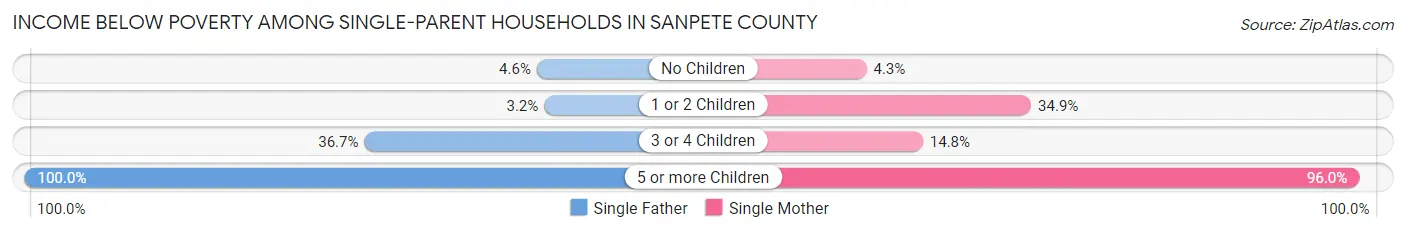
| Children | Single Father | Single Mother |
| No Children | 7 (4.6%) | 10 (4.3%) |
| 1 or 2 Children | 5 (3.2%) | 66 (34.9%) |
| 3 or 4 Children | 18 (36.7%) | 9 (14.7%) |
| 5 or more Children | 3 (100.0%) | 24 (96.0%) |
| Total | 33 (9.2%) | 109 (21.4%) |
Income Below Poverty Among Married-Couple vs Single-Parent Households in Sanpete County
The poverty data for Sanpete County shows that 406 of the married-couple family households (7.2%) and 142 of the single-parent households (16.3%) are living below the poverty level. Within the married-couple family households, those with 5 or more children have the highest poverty rate, with 102 households (32.9%) falling below the poverty line. Among the single-parent households, those with 5 or more children have the highest poverty rate, with 27 household (96.4%) living below poverty.
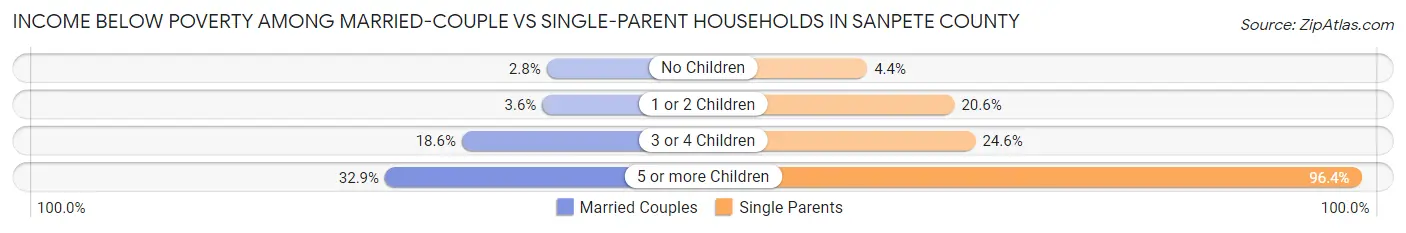
| Children | Married-Couple Families | Single-Parent Households |
| No Children | 83 (2.8%) | 17 (4.4%) |
| 1 or 2 Children | 53 (3.6%) | 71 (20.6%) |
| 3 or 4 Children | 168 (18.6%) | 27 (24.5%) |
| 5 or more Children | 102 (32.9%) | 27 (96.4%) |
| Total | 406 (7.2%) | 142 (16.3%) |
Employment Characteristics in Sanpete County
Employment by Class of Employer in Sanpete County
Among the 12,036 employed individuals in Sanpete County, private company employees (7,450 | 61.9%), state government employees (1,526 | 12.7%), and local government employees (876 | 7.3%) make up the most common classes of employment.
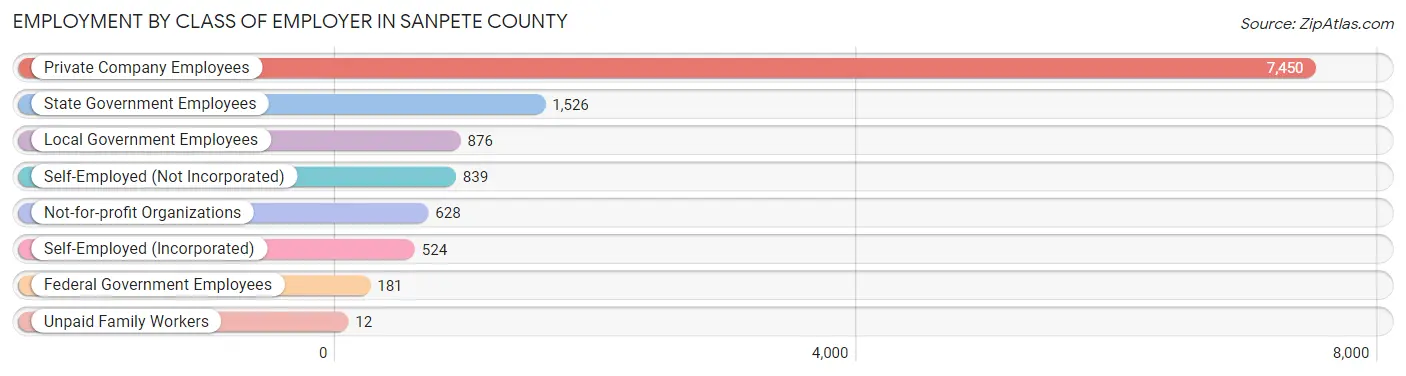
| Employer Class | # Employees | % Employees |
| Private Company Employees | 7,450 | 61.9% |
| Self-Employed (Incorporated) | 524 | 4.3% |
| Self-Employed (Not Incorporated) | 839 | 7.0% |
| Not-for-profit Organizations | 628 | 5.2% |
| Local Government Employees | 876 | 7.3% |
| State Government Employees | 1,526 | 12.7% |
| Federal Government Employees | 181 | 1.5% |
| Unpaid Family Workers | 12 | 0.1% |
| Total | 12,036 | 100.0% |
Employment Status by Age in Sanpete County
According to the labor force statistics for Sanpete County, out of the total population over 16 years of age (22,661), 56.8% or 12,871 individuals are in the labor force, with 4.6% or 592 of them unemployed. The age group with the highest labor force participation rate is 20 to 24 years, with 80.5% or 2,195 individuals in the labor force. Within the labor force, the 16 to 19 years age range has the highest percentage of unemployed individuals, with 12.8% or 180 of them being unemployed.
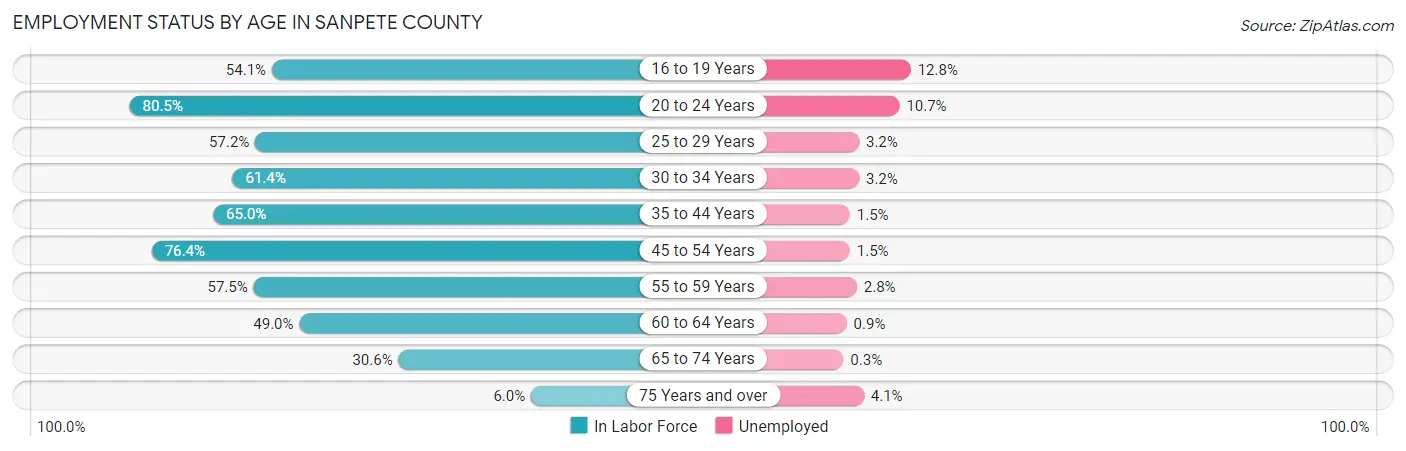
| Age Bracket | In Labor Force | Unemployed |
| 16 to 19 Years | 1,403 (54.1%) | 180 (12.8%) |
| 20 to 24 Years | 2,195 (80.5%) | 235 (10.7%) |
| 25 to 29 Years | 1,043 (57.2%) | 33 (3.2%) |
| 30 to 34 Years | 1,022 (61.4%) | 33 (3.2%) |
| 35 to 44 Years | 2,420 (65.0%) | 36 (1.5%) |
| 45 to 54 Years | 2,410 (76.4%) | 36 (1.5%) |
| 55 to 59 Years | 714 (57.5%) | 20 (2.8%) |
| 60 to 64 Years | 814 (49.0%) | 7 (0.9%) |
| 65 to 74 Years | 749 (30.6%) | 2 (0.3%) |
| 75 Years and over | 98 (6.0%) | 4 (4.1%) |
| Total | 12,871 (56.8%) | 592 (4.6%) |
Employment Status by Educational Attainment in Sanpete County
According to labor force statistics for Sanpete County, 63.5% of individuals (8,426) out of the total population between 25 and 64 years of age (13,269) are in the labor force, with 2.0% or 169 of them being unemployed. The group with the highest labor force participation rate are those with the educational attainment of bachelor's degree or higher, with 81.8% or 2,252 individuals in the labor force. Within the labor force, individuals with less than high school education have the highest percentage of unemployment, with 6.4% or 42 of them being unemployed.
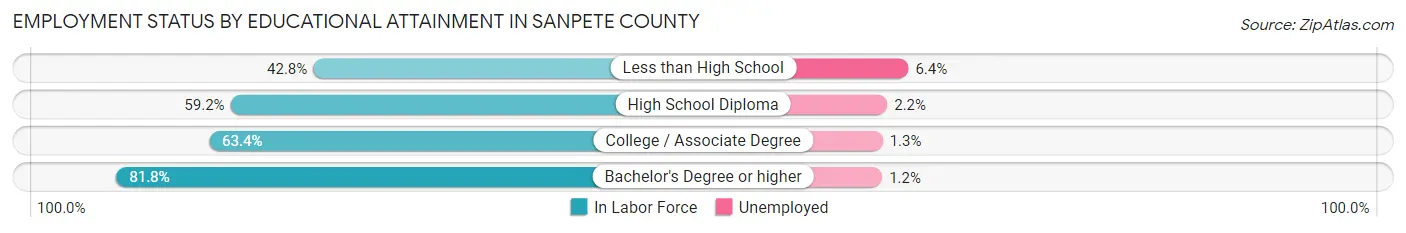
| Educational Attainment | In Labor Force | Unemployed |
| Less than High School | 660 (42.8%) | 99 (6.4%) |
| High School Diploma | 2,470 (59.2%) | 92 (2.2%) |
| College / Associate Degree | 3,045 (63.4%) | 62 (1.3%) |
| Bachelor's Degree or higher | 2,252 (81.8%) | 33 (1.2%) |
| Total | 8,426 (63.5%) | 265 (2.0%) |
Employment Occupations by Sex in Sanpete County
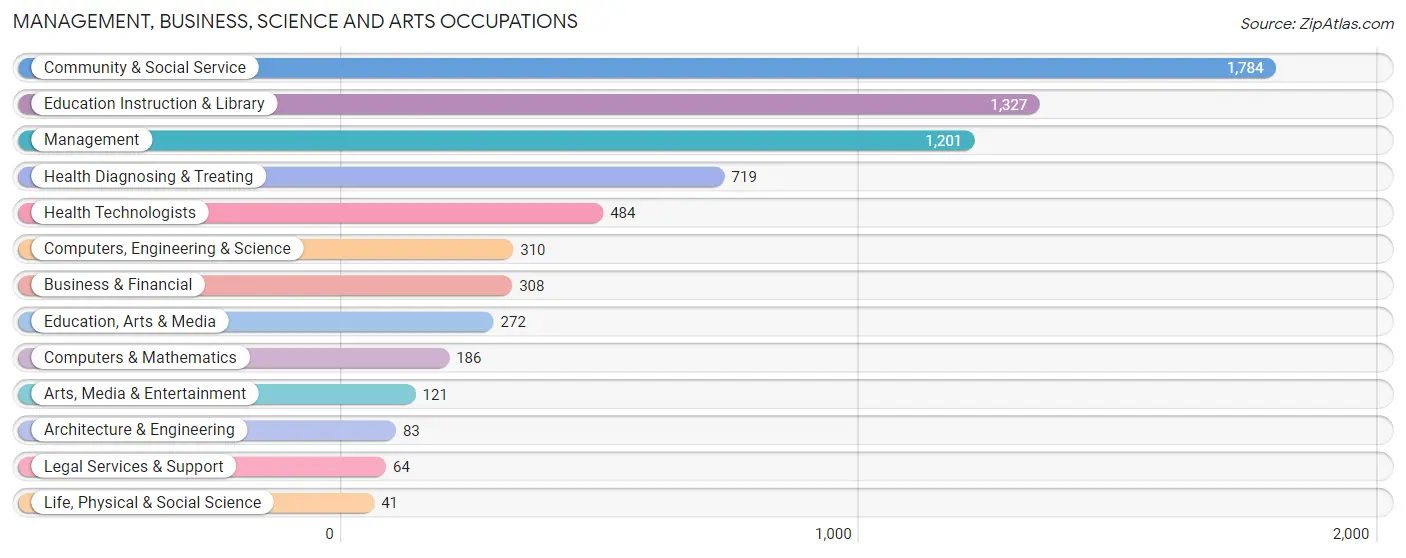
Management, Business, Science and Arts Occupations
The most common Management, Business, Science and Arts occupations in Sanpete County are Community & Social Service (1,784 | 14.6%), Education Instruction & Library (1,327 | 10.8%), Management (1,201 | 9.8%), Health Diagnosing & Treating (719 | 5.9%), and Health Technologists (484 | 4.0%).
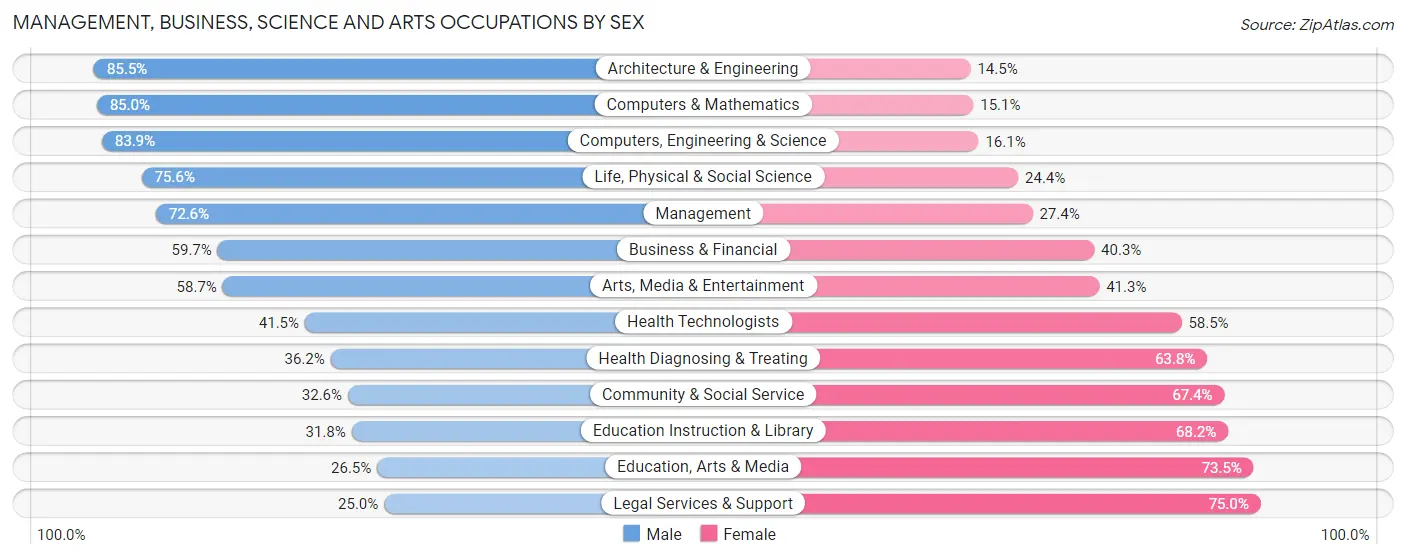
Management, Business, Science and Arts Occupations by Sex
Within the Management, Business, Science and Arts occupations in Sanpete County, the most male-oriented occupations are Architecture & Engineering (85.5%), Computers & Mathematics (85.0%), and Computers, Engineering & Science (83.9%), while the most female-oriented occupations are Legal Services & Support (75.0%), Education, Arts & Media (73.5%), and Education Instruction & Library (68.2%).
| Occupation | Male | Female |
| Management | 872 (72.6%) | 329 (27.4%) |
| Business & Financial | 184 (59.7%) | 124 (40.3%) |
| Computers, Engineering & Science | 260 (83.9%) | 50 (16.1%) |
| Computers & Mathematics | 158 (85.0%) | 28 (15.0%) |
| Architecture & Engineering | 71 (85.5%) | 12 (14.5%) |
| Life, Physical & Social Science | 31 (75.6%) | 10 (24.4%) |
| Community & Social Service | 581 (32.6%) | 1,203 (67.4%) |
| Education, Arts & Media | 72 (26.5%) | 200 (73.5%) |
| Legal Services & Support | 16 (25.0%) | 48 (75.0%) |
| Education Instruction & Library | 422 (31.8%) | 905 (68.2%) |
| Arts, Media & Entertainment | 71 (58.7%) | 50 (41.3%) |
| Health Diagnosing & Treating | 260 (36.2%) | 459 (63.8%) |
| Health Technologists | 201 (41.5%) | 283 (58.5%) |
| Total (Category) | 2,157 (49.9%) | 2,165 (50.1%) |
| Total (Overall) | 6,776 (55.4%) | 5,463 (44.6%) |
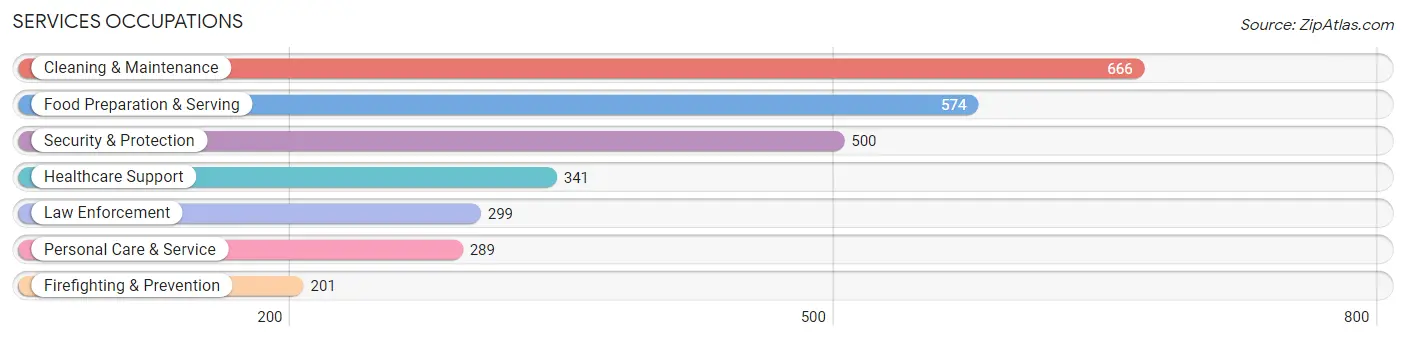
Services Occupations
The most common Services occupations in Sanpete County are Cleaning & Maintenance (666 | 5.4%), Food Preparation & Serving (574 | 4.7%), Security & Protection (500 | 4.1%), Healthcare Support (341 | 2.8%), and Law Enforcement (299 | 2.4%).
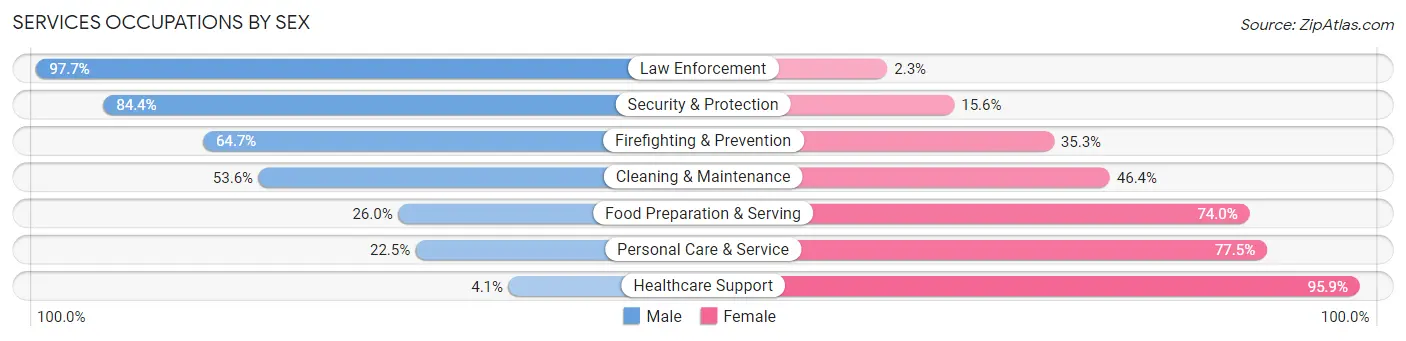
Services Occupations by Sex
Within the Services occupations in Sanpete County, the most male-oriented occupations are Law Enforcement (97.7%), Security & Protection (84.4%), and Firefighting & Prevention (64.7%), while the most female-oriented occupations are Healthcare Support (95.9%), Personal Care & Service (77.5%), and Food Preparation & Serving (74.0%).
| Occupation | Male | Female |
| Healthcare Support | 14 (4.1%) | 327 (95.9%) |
| Security & Protection | 422 (84.4%) | 78 (15.6%) |
| Firefighting & Prevention | 130 (64.7%) | 71 (35.3%) |
| Law Enforcement | 292 (97.7%) | 7 (2.3%) |
| Food Preparation & Serving | 149 (26.0%) | 425 (74.0%) |
| Cleaning & Maintenance | 357 (53.6%) | 309 (46.4%) |
| Personal Care & Service | 65 (22.5%) | 224 (77.5%) |
| Total (Category) | 1,007 (42.5%) | 1,363 (57.5%) |
| Total (Overall) | 6,776 (55.4%) | 5,463 (44.6%) |
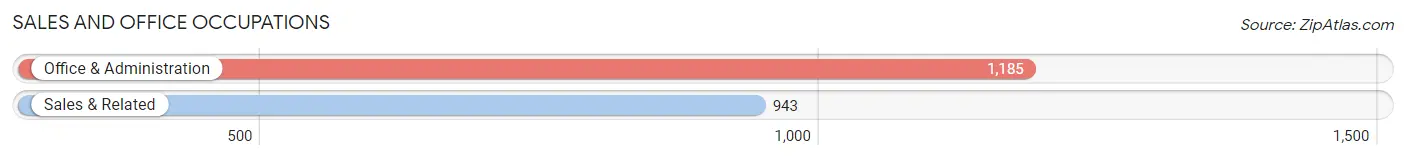
Sales and Office Occupations
The most common Sales and Office occupations in Sanpete County are Office & Administration (1,185 | 9.7%), and Sales & Related (943 | 7.7%).
Sales and Office Occupations by Sex
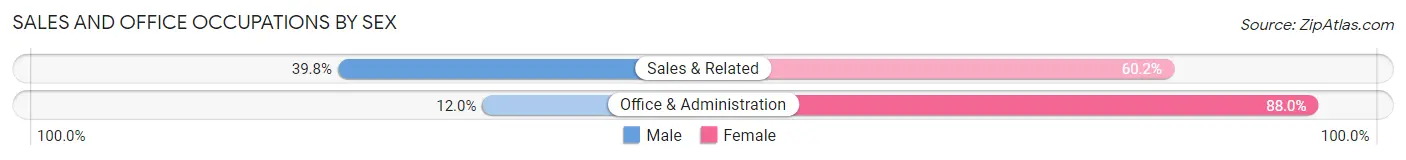
| Occupation | Male | Female |
| Sales & Related | 375 (39.8%) | 568 (60.2%) |
| Office & Administration | 142 (12.0%) | 1,043 (88.0%) |
| Total (Category) | 517 (24.3%) | 1,611 (75.7%) |
| Total (Overall) | 6,776 (55.4%) | 5,463 (44.6%) |
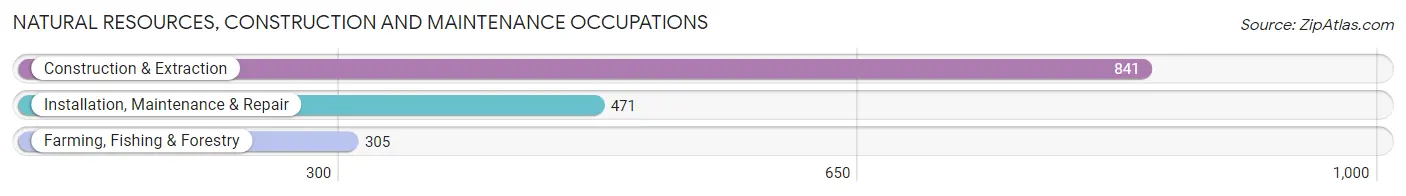
Natural Resources, Construction and Maintenance Occupations
The most common Natural Resources, Construction and Maintenance occupations in Sanpete County are Construction & Extraction (841 | 6.9%), Installation, Maintenance & Repair (471 | 3.8%), and Farming, Fishing & Forestry (305 | 2.5%).
Natural Resources, Construction and Maintenance Occupations by Sex
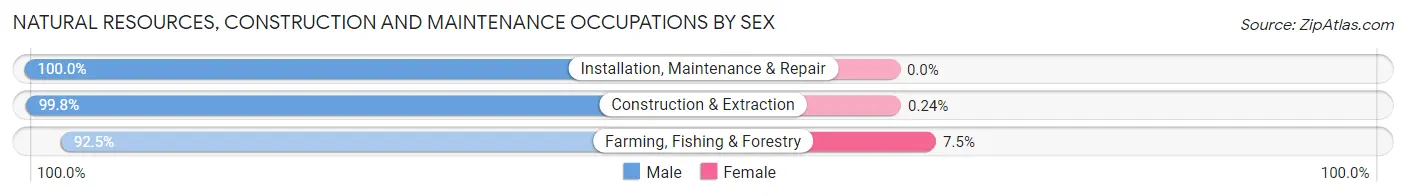
| Occupation | Male | Female |
| Farming, Fishing & Forestry | 282 (92.5%) | 23 (7.5%) |
| Construction & Extraction | 839 (99.8%) | 2 (0.2%) |
| Installation, Maintenance & Repair | 471 (100.0%) | 0 (0.0%) |
| Total (Category) | 1,592 (98.5%) | 25 (1.5%) |
| Total (Overall) | 6,776 (55.4%) | 5,463 (44.6%) |
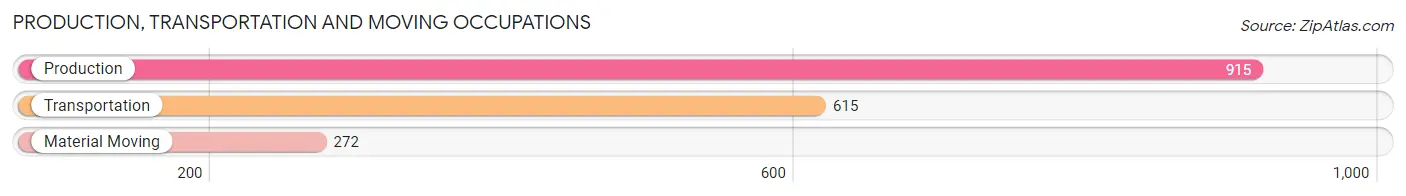
Production, Transportation and Moving Occupations
The most common Production, Transportation and Moving occupations in Sanpete County are Production (915 | 7.5%), Transportation (615 | 5.0%), and Material Moving (272 | 2.2%).
Production, Transportation and Moving Occupations by Sex
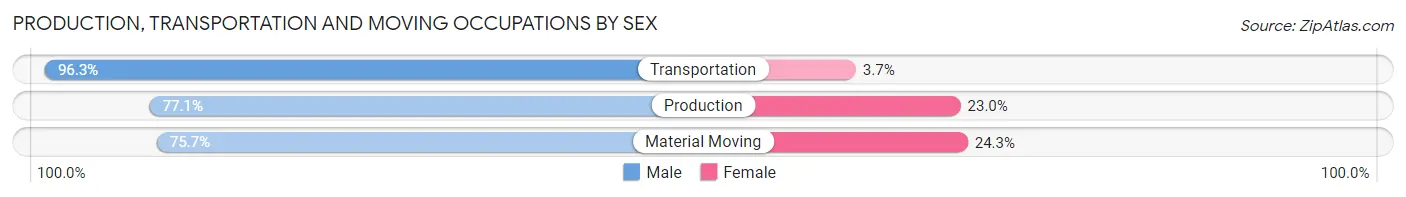
| Occupation | Male | Female |
| Production | 705 (77.0%) | 210 (23.0%) |
| Transportation | 592 (96.3%) | 23 (3.7%) |
| Material Moving | 206 (75.7%) | 66 (24.3%) |
| Total (Category) | 1,503 (83.4%) | 299 (16.6%) |
| Total (Overall) | 6,776 (55.4%) | 5,463 (44.6%) |
Employment Industries by Sex in Sanpete County
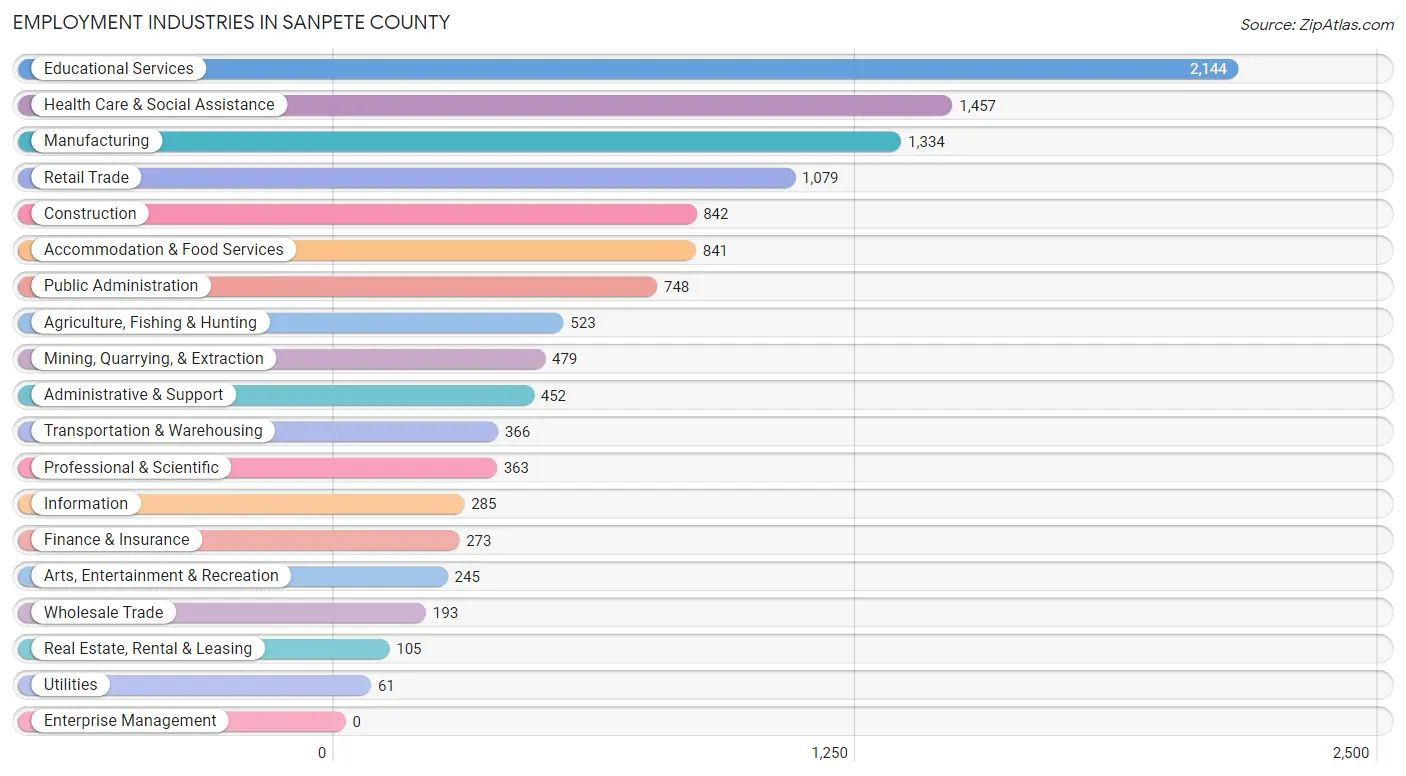
Employment Industries in Sanpete County
The major employment industries in Sanpete County include Educational Services (2,144 | 17.5%), Health Care & Social Assistance (1,457 | 11.9%), Manufacturing (1,334 | 10.9%), Retail Trade (1,079 | 8.8%), and Construction (842 | 6.9%).
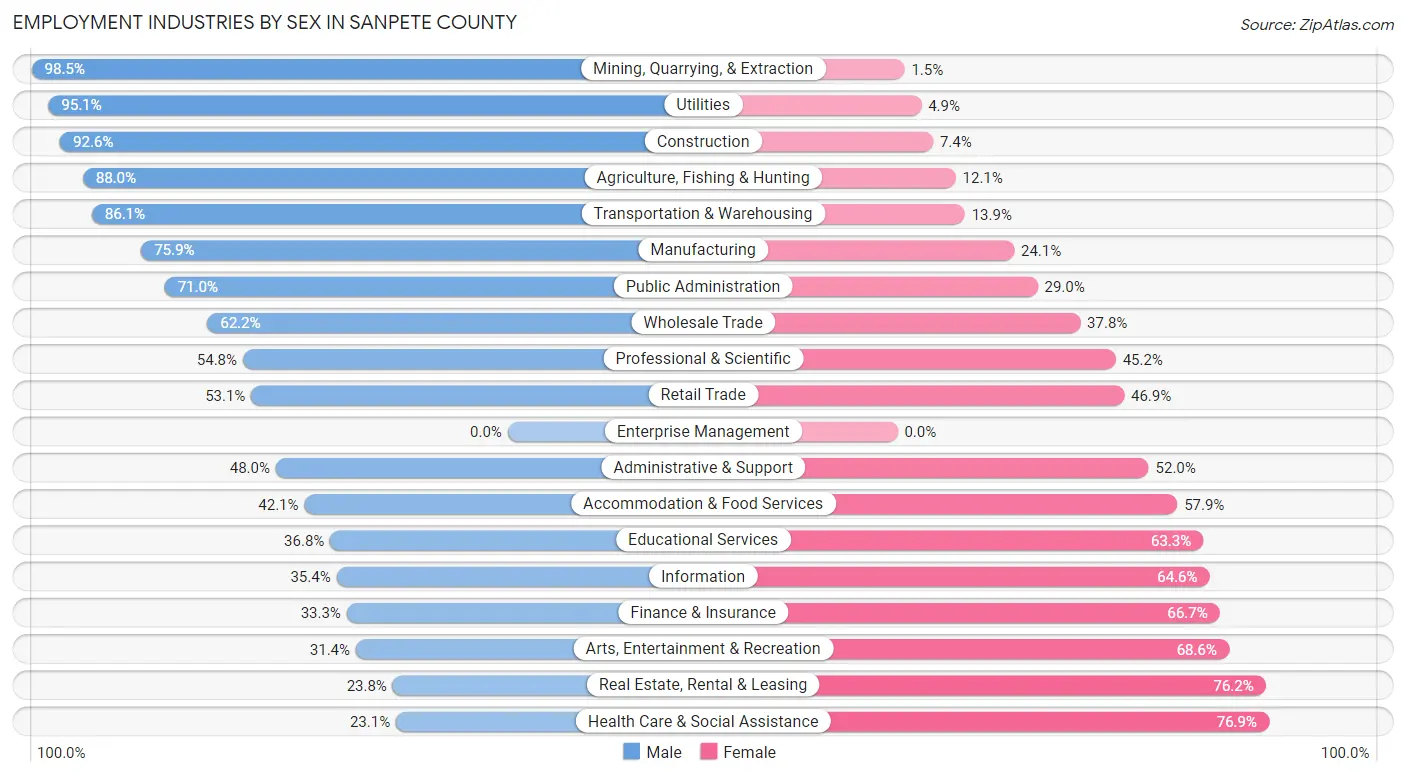
Employment Industries by Sex in Sanpete County
The Sanpete County industries that see more men than women are Mining, Quarrying, & Extraction (98.5%), Utilities (95.1%), and Construction (92.6%), whereas the industries that tend to have a higher number of women are Health Care & Social Assistance (76.9%), Real Estate, Rental & Leasing (76.2%), and Arts, Entertainment & Recreation (68.6%).
| Industry | Male | Female |
| Agriculture, Fishing & Hunting | 460 (87.9%) | 63 (12.0%) |
| Mining, Quarrying, & Extraction | 472 (98.5%) | 7 (1.5%) |
| Construction | 780 (92.6%) | 62 (7.4%) |
| Manufacturing | 1,012 (75.9%) | 322 (24.1%) |
| Wholesale Trade | 120 (62.2%) | 73 (37.8%) |
| Retail Trade | 573 (53.1%) | 506 (46.9%) |
| Transportation & Warehousing | 315 (86.1%) | 51 (13.9%) |
| Utilities | 58 (95.1%) | 3 (4.9%) |
| Information | 101 (35.4%) | 184 (64.6%) |
| Finance & Insurance | 91 (33.3%) | 182 (66.7%) |
| Real Estate, Rental & Leasing | 25 (23.8%) | 80 (76.2%) |
| Professional & Scientific | 199 (54.8%) | 164 (45.2%) |
| Enterprise Management | 0 (0.0%) | 0 (0.0%) |
| Administrative & Support | 217 (48.0%) | 235 (52.0%) |
| Educational Services | 788 (36.7%) | 1,356 (63.2%) |
| Health Care & Social Assistance | 337 (23.1%) | 1,120 (76.9%) |
| Arts, Entertainment & Recreation | 77 (31.4%) | 168 (68.6%) |
| Accommodation & Food Services | 354 (42.1%) | 487 (57.9%) |
| Public Administration | 531 (71.0%) | 217 (29.0%) |
| Total | 6,776 (55.4%) | 5,463 (44.6%) |
Education in Sanpete County
School Enrollment in Sanpete County
The most common levels of schooling among the 8,920 students in Sanpete County are college / undergraduate (2,738 | 30.7%), high school (2,105 | 23.6%), and middle school (1,654 | 18.5%).
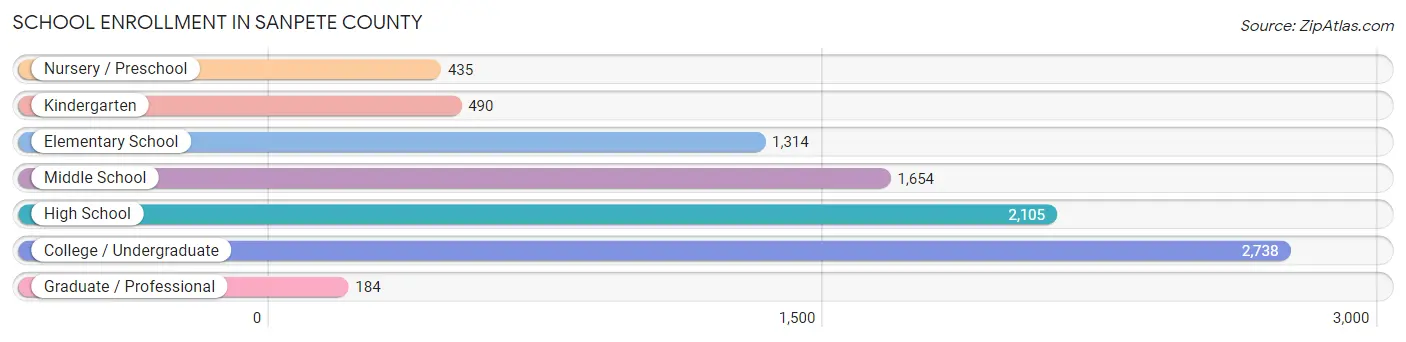
| School Level | # Students | % Students |
| Nursery / Preschool | 435 | 4.9% |
| Kindergarten | 490 | 5.5% |
| Elementary School | 1,314 | 14.7% |
| Middle School | 1,654 | 18.5% |
| High School | 2,105 | 23.6% |
| College / Undergraduate | 2,738 | 30.7% |
| Graduate / Professional | 184 | 2.1% |
| Total | 8,920 | 100.0% |
School Enrollment by Age by Funding Source in Sanpete County
Out of a total of 8,920 students who are enrolled in schools in Sanpete County, 963 (10.8%) attend a private institution, while the remaining 7,957 (89.2%) are enrolled in public schools. The age group of 3 to 4 year olds has the highest likelihood of being enrolled in private schools, with 73 (22.8% in the age bracket) enrolled. Conversely, the age group of 35 years and over has the lowest likelihood of being enrolled in a private school, with 383 (94.8% in the age bracket) attending a public institution.
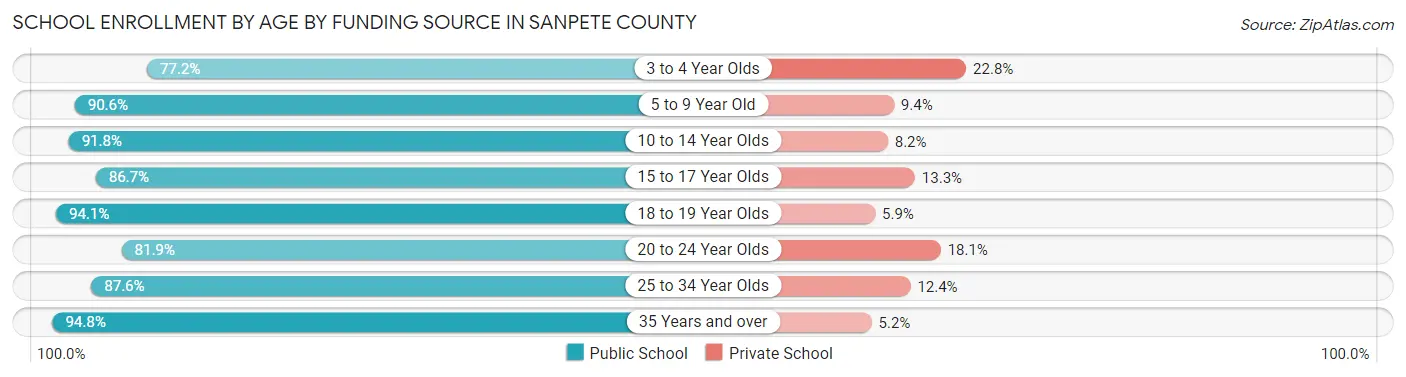
| Age Bracket | Public School | Private School |
| 3 to 4 Year Olds | 247 (77.2%) | 73 (22.8%) |
| 5 to 9 Year Old | 1,550 (90.6%) | 160 (9.4%) |
| 10 to 14 Year Olds | 1,897 (91.8%) | 170 (8.2%) |
| 15 to 17 Year Olds | 1,301 (86.7%) | 199 (13.3%) |
| 18 to 19 Year Olds | 1,301 (94.1%) | 81 (5.9%) |
| 20 to 24 Year Olds | 943 (81.9%) | 208 (18.1%) |
| 25 to 34 Year Olds | 338 (87.6%) | 48 (12.4%) |
| 35 Years and over | 383 (94.8%) | 21 (5.2%) |
| Total | 7,957 (89.2%) | 963 (10.8%) |
Educational Attainment by Field of Study in Sanpete County
Education (1,047 | 25.7%), business (625 | 15.4%), science & technology (504 | 12.4%), arts & humanities (370 | 9.1%), and bio, nature & agricultural (256 | 6.3%) are the most common fields of study among 4,068 individuals in Sanpete County who have obtained a bachelor's degree or higher.
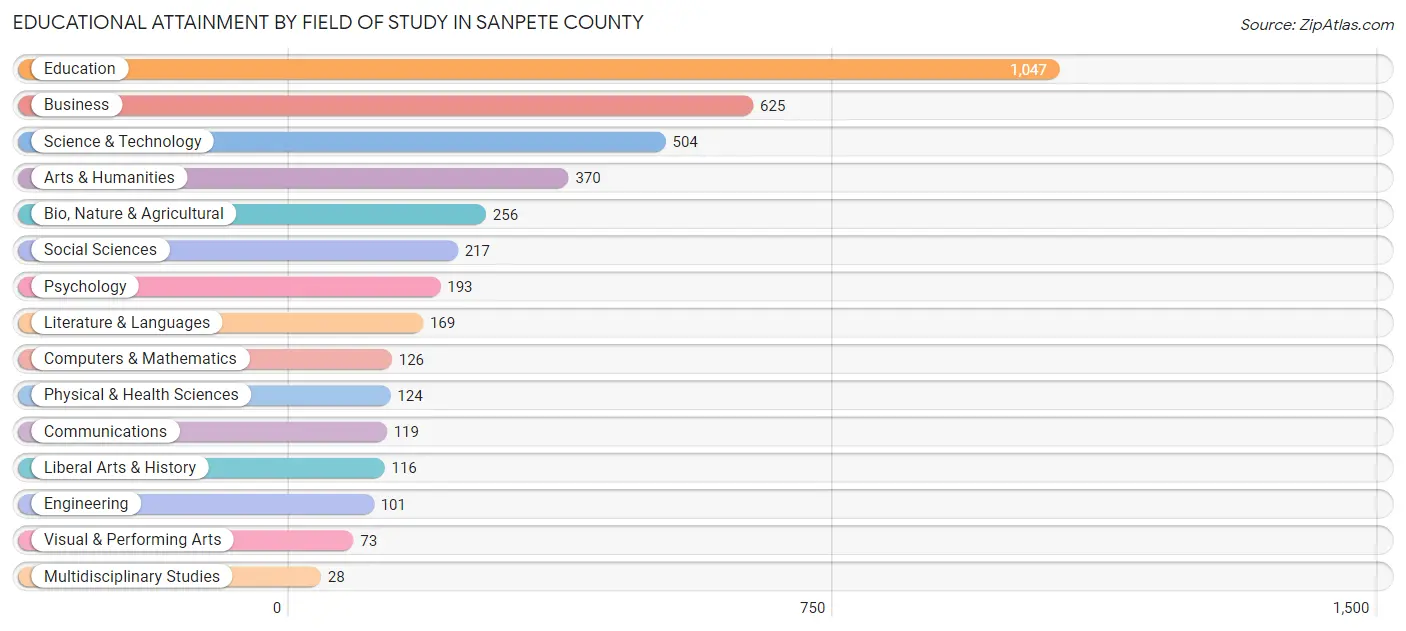
| Field of Study | # Graduates | % Graduates |
| Computers & Mathematics | 126 | 3.1% |
| Bio, Nature & Agricultural | 256 | 6.3% |
| Physical & Health Sciences | 124 | 3.0% |
| Psychology | 193 | 4.7% |
| Social Sciences | 217 | 5.3% |
| Engineering | 101 | 2.5% |
| Multidisciplinary Studies | 28 | 0.7% |
| Science & Technology | 504 | 12.4% |
| Business | 625 | 15.4% |
| Education | 1,047 | 25.7% |
| Literature & Languages | 169 | 4.2% |
| Liberal Arts & History | 116 | 2.9% |
| Visual & Performing Arts | 73 | 1.8% |
| Communications | 119 | 2.9% |
| Arts & Humanities | 370 | 9.1% |
| Total | 4,068 | 100.0% |
Transportation & Commute in Sanpete County
Vehicle Availability by Sex in Sanpete County
The most prevalent vehicle ownership categories in Sanpete County are males with 2 vehicles (2,004, accounting for 30.9%) and females with 2 vehicles (1,567, making up 38.5%).
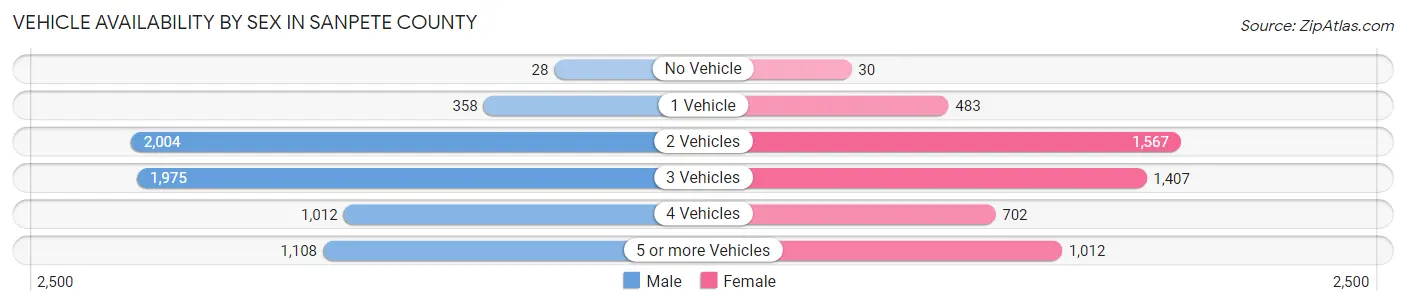
| Vehicles Available | Male | Female |
| No Vehicle | 28 (0.4%) | 30 (0.6%) |
| 1 Vehicle | 358 (5.5%) | 483 (9.3%) |
| 2 Vehicles | 2,004 (30.9%) | 1,567 (30.1%) |
| 3 Vehicles | 1,975 (30.4%) | 1,407 (27.1%) |
| 4 Vehicles | 1,012 (15.6%) | 702 (13.5%) |
| 5 or more Vehicles | 1,108 (17.1%) | 1,012 (19.5%) |
| Total | 6,485 (100.0%) | 5,201 (100.0%) |
Commute Time in Sanpete County
The most frequently occuring commute durations in Sanpete County are 5 to 9 minutes (2,545 commuters, 23.1%), less than 5 minutes (2,137 commuters, 19.4%), and 10 to 14 minutes (1,320 commuters, 12.0%).
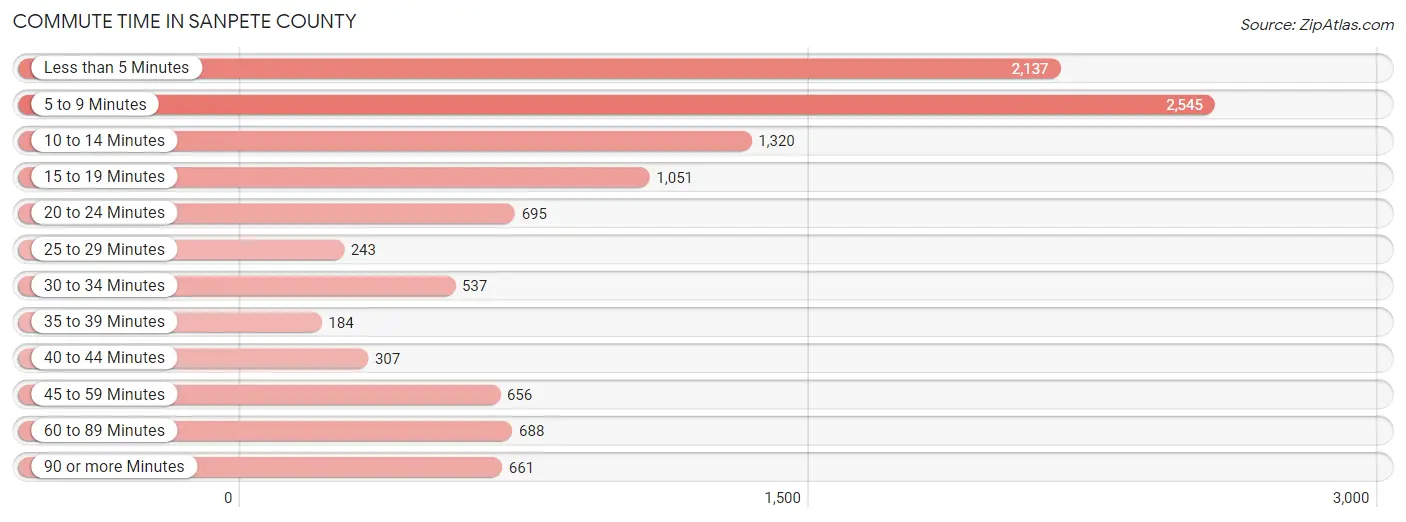
| Commute Time | # Commuters | % Commuters |
| Less than 5 Minutes | 2,137 | 19.4% |
| 5 to 9 Minutes | 2,545 | 23.1% |
| 10 to 14 Minutes | 1,320 | 12.0% |
| 15 to 19 Minutes | 1,051 | 9.5% |
| 20 to 24 Minutes | 695 | 6.3% |
| 25 to 29 Minutes | 243 | 2.2% |
| 30 to 34 Minutes | 537 | 4.9% |
| 35 to 39 Minutes | 184 | 1.7% |
| 40 to 44 Minutes | 307 | 2.8% |
| 45 to 59 Minutes | 656 | 5.9% |
| 60 to 89 Minutes | 688 | 6.2% |
| 90 or more Minutes | 661 | 6.0% |
Commute Time by Sex in Sanpete County
The most common commute times in Sanpete County are 5 to 9 minutes (1,183 commuters, 18.6%) for males and 5 to 9 minutes (1,362 commuters, 29.2%) for females.
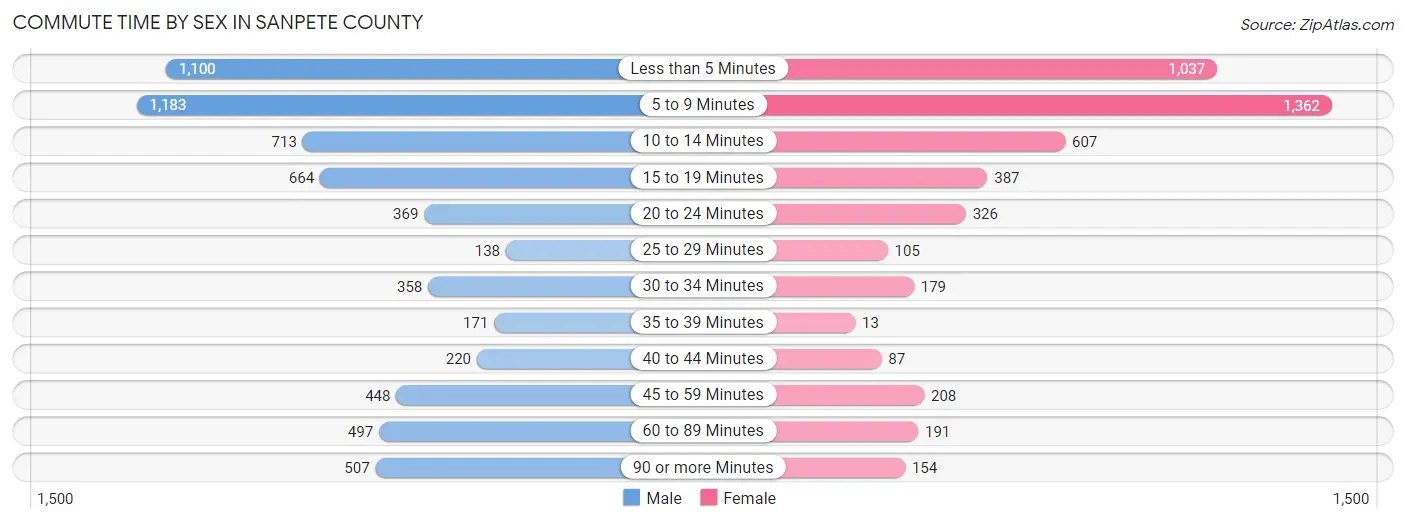
| Commute Time | Male | Female |
| Less than 5 Minutes | 1,100 (17.3%) | 1,037 (22.3%) |
| 5 to 9 Minutes | 1,183 (18.6%) | 1,362 (29.2%) |
| 10 to 14 Minutes | 713 (11.2%) | 607 (13.0%) |
| 15 to 19 Minutes | 664 (10.4%) | 387 (8.3%) |
| 20 to 24 Minutes | 369 (5.8%) | 326 (7.0%) |
| 25 to 29 Minutes | 138 (2.2%) | 105 (2.3%) |
| 30 to 34 Minutes | 358 (5.6%) | 179 (3.8%) |
| 35 to 39 Minutes | 171 (2.7%) | 13 (0.3%) |
| 40 to 44 Minutes | 220 (3.5%) | 87 (1.9%) |
| 45 to 59 Minutes | 448 (7.0%) | 208 (4.5%) |
| 60 to 89 Minutes | 497 (7.8%) | 191 (4.1%) |
| 90 or more Minutes | 507 (8.0%) | 154 (3.3%) |
Time of Departure to Work by Sex in Sanpete County
The most frequent times of departure to work in Sanpete County are 7:30 AM to 7:59 AM (987, 15.5%) for males and 7:30 AM to 7:59 AM (771, 16.6%) for females.
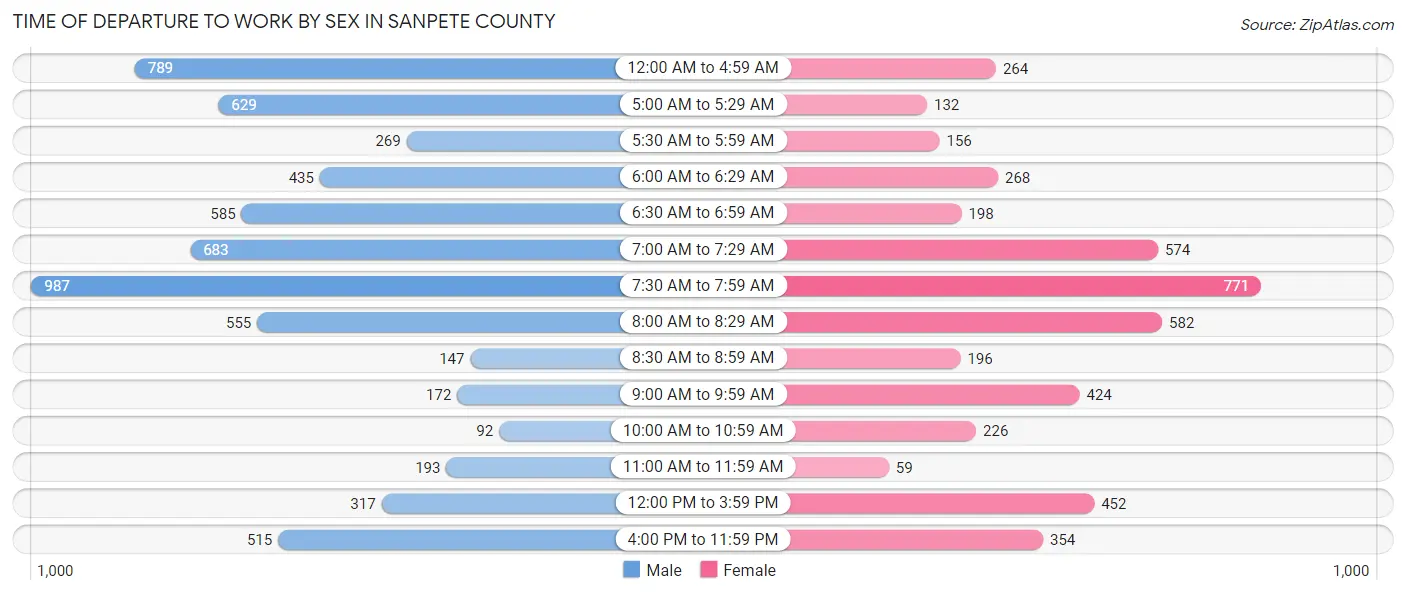
| Time of Departure | Male | Female |
| 12:00 AM to 4:59 AM | 789 (12.4%) | 264 (5.7%) |
| 5:00 AM to 5:29 AM | 629 (9.9%) | 132 (2.8%) |
| 5:30 AM to 5:59 AM | 269 (4.2%) | 156 (3.4%) |
| 6:00 AM to 6:29 AM | 435 (6.8%) | 268 (5.8%) |
| 6:30 AM to 6:59 AM | 585 (9.2%) | 198 (4.3%) |
| 7:00 AM to 7:29 AM | 683 (10.7%) | 574 (12.3%) |
| 7:30 AM to 7:59 AM | 987 (15.5%) | 771 (16.6%) |
| 8:00 AM to 8:29 AM | 555 (8.7%) | 582 (12.5%) |
| 8:30 AM to 8:59 AM | 147 (2.3%) | 196 (4.2%) |
| 9:00 AM to 9:59 AM | 172 (2.7%) | 424 (9.1%) |
| 10:00 AM to 10:59 AM | 92 (1.4%) | 226 (4.9%) |
| 11:00 AM to 11:59 AM | 193 (3.0%) | 59 (1.3%) |
| 12:00 PM to 3:59 PM | 317 (5.0%) | 452 (9.7%) |
| 4:00 PM to 11:59 PM | 515 (8.1%) | 354 (7.6%) |
| Total | 6,368 (100.0%) | 4,656 (100.0%) |
Housing Occupancy in Sanpete County
Occupancy by Ownership in Sanpete County
Of the total 8,617 dwellings in Sanpete County, owner-occupied units account for 6,706 (77.8%), while renter-occupied units make up 1,911 (22.2%).
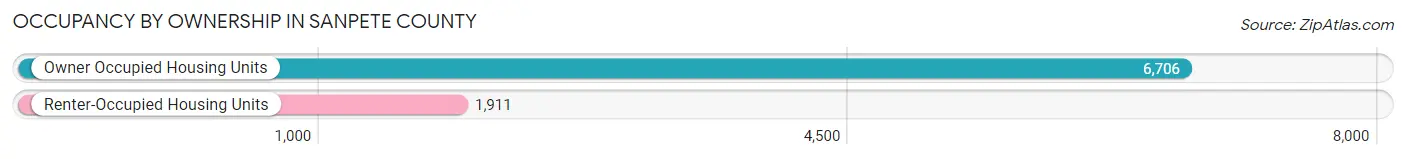
| Occupancy | # Housing Units | % Housing Units |
| Owner Occupied Housing Units | 6,706 | 77.8% |
| Renter-Occupied Housing Units | 1,911 | 22.2% |
| Total Occupied Housing Units | 8,617 | 100.0% |
Occupancy by Household Size in Sanpete County
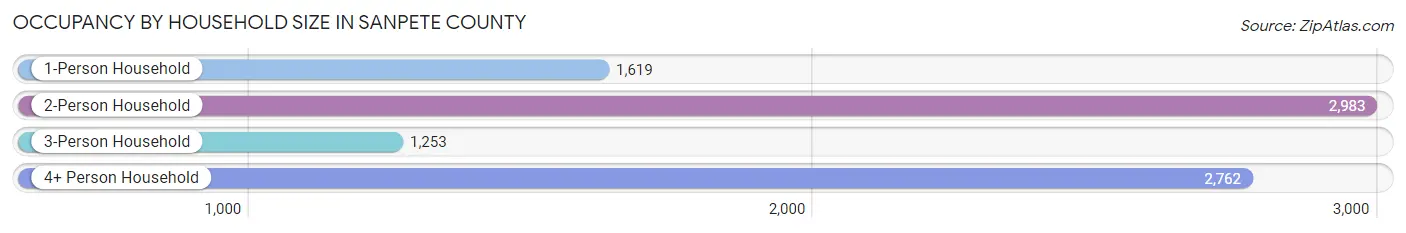
| Household Size | # Housing Units | % Housing Units |
| 1-Person Household | 1,619 | 18.8% |
| 2-Person Household | 2,983 | 34.6% |
| 3-Person Household | 1,253 | 14.5% |
| 4+ Person Household | 2,762 | 32.1% |
| Total Housing Units | 8,617 | 100.0% |
Occupancy by Ownership by Household Size in Sanpete County
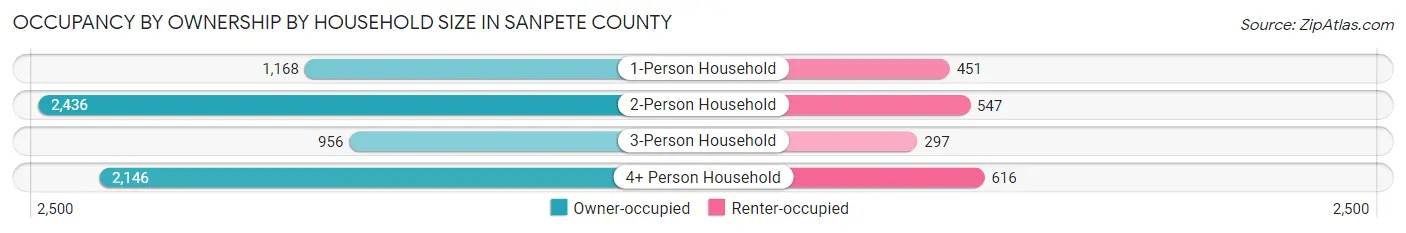
| Household Size | Owner-occupied | Renter-occupied |
| 1-Person Household | 1,168 (72.1%) | 451 (27.9%) |
| 2-Person Household | 2,436 (81.7%) | 547 (18.3%) |
| 3-Person Household | 956 (76.3%) | 297 (23.7%) |
| 4+ Person Household | 2,146 (77.7%) | 616 (22.3%) |
| Total Housing Units | 6,706 (77.8%) | 1,911 (22.2%) |
Occupancy by Educational Attainment in Sanpete County
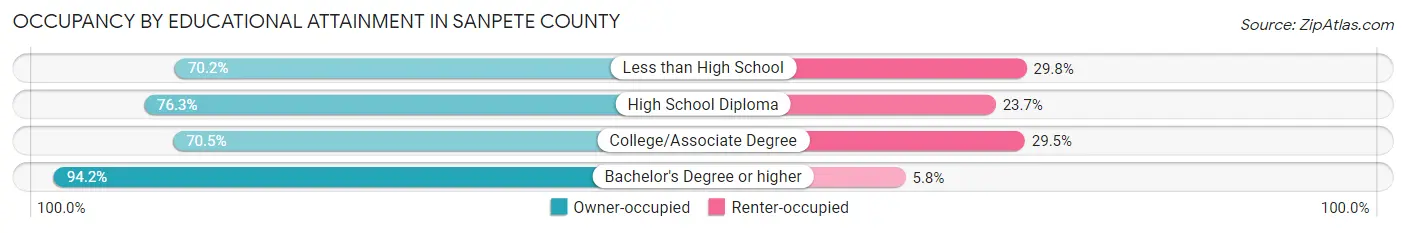
| Household Size | Owner-occupied | Renter-occupied |
| Less than High School | 386 (70.2%) | 164 (29.8%) |
| High School Diploma | 1,893 (76.3%) | 588 (23.7%) |
| College/Associate Degree | 2,485 (70.5%) | 1,039 (29.5%) |
| Bachelor's Degree or higher | 1,942 (94.2%) | 120 (5.8%) |
Occupancy by Age of Householder in Sanpete County
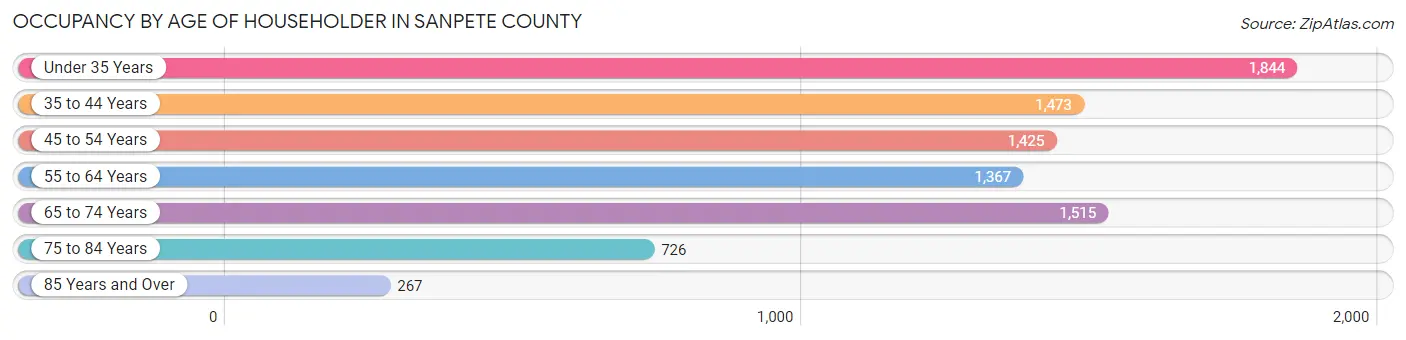
| Age Bracket | # Households | % Households |
| Under 35 Years | 1,844 | 21.4% |
| 35 to 44 Years | 1,473 | 17.1% |
| 45 to 54 Years | 1,425 | 16.5% |
| 55 to 64 Years | 1,367 | 15.9% |
| 65 to 74 Years | 1,515 | 17.6% |
| 75 to 84 Years | 726 | 8.4% |
| 85 Years and Over | 267 | 3.1% |
| Total | 8,617 | 100.0% |
Housing Finances in Sanpete County
Median Income by Occupancy in Sanpete County
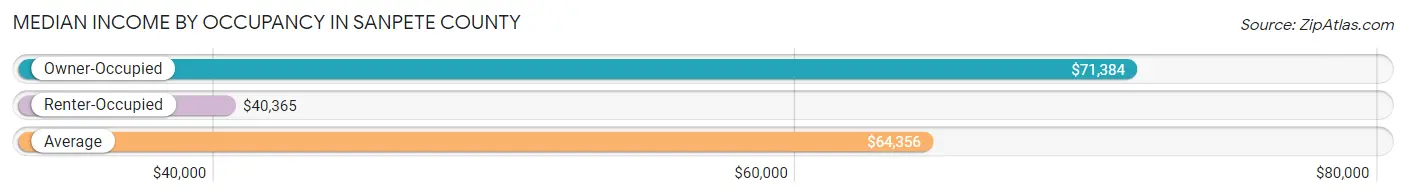
| Occupancy Type | # Households | Median Income |
| Owner-Occupied | 6,706 (77.8%) | $71,384 |
| Renter-Occupied | 1,911 (22.2%) | $40,365 |
| Average | 8,617 (100.0%) | $64,356 |
Occupancy by Householder Income Bracket in Sanpete County
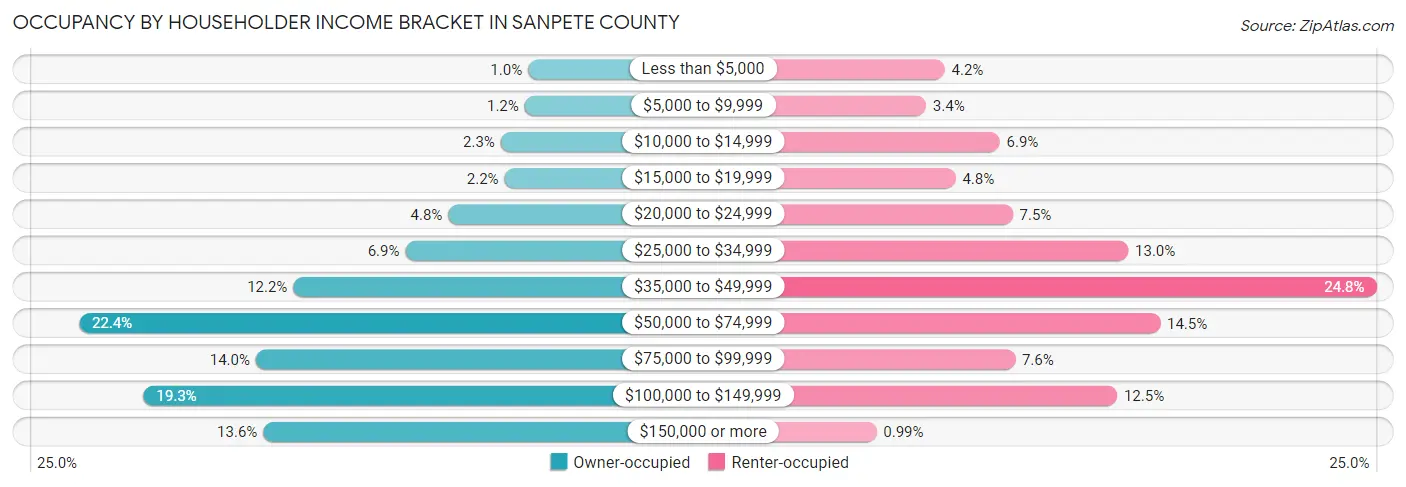
| Income Bracket | Owner-occupied | Renter-occupied |
| Less than $5,000 | 69 (1.0%) | 81 (4.2%) |
| $5,000 to $9,999 | 80 (1.2%) | 64 (3.4%) |
| $10,000 to $14,999 | 156 (2.3%) | 131 (6.9%) |
| $15,000 to $19,999 | 144 (2.1%) | 91 (4.8%) |
| $20,000 to $24,999 | 324 (4.8%) | 143 (7.5%) |
| $25,000 to $34,999 | 461 (6.9%) | 248 (13.0%) |
| $35,000 to $49,999 | 819 (12.2%) | 474 (24.8%) |
| $50,000 to $74,999 | 1,503 (22.4%) | 277 (14.5%) |
| $75,000 to $99,999 | 938 (14.0%) | 145 (7.6%) |
| $100,000 to $149,999 | 1,297 (19.3%) | 238 (12.4%) |
| $150,000 or more | 915 (13.6%) | 19 (1.0%) |
| Total | 6,706 (100.0%) | 1,911 (100.0%) |
Monthly Housing Cost Tiers in Sanpete County
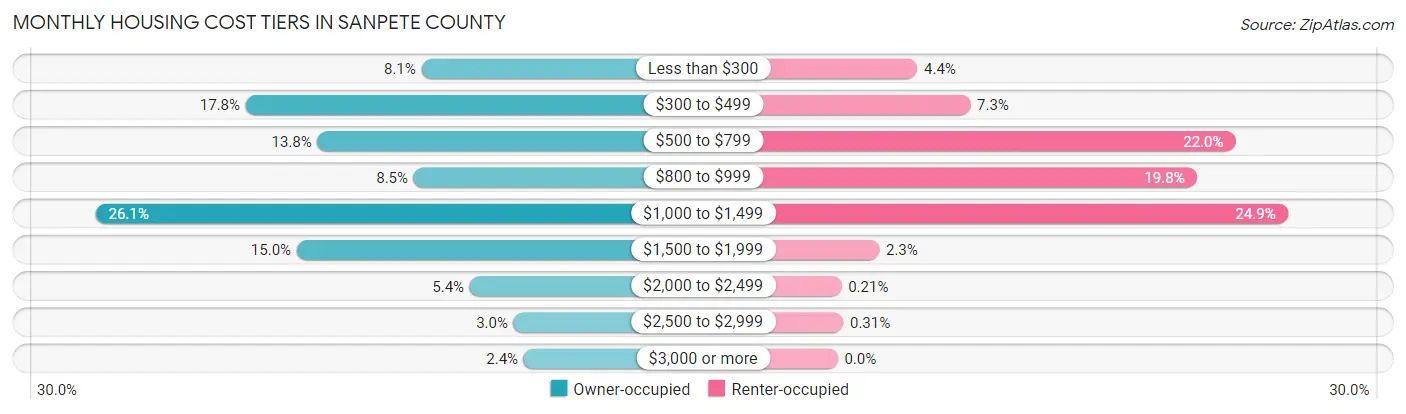
| Monthly Cost | Owner-occupied | Renter-occupied |
| Less than $300 | 541 (8.1%) | 84 (4.4%) |
| $300 to $499 | 1,192 (17.8%) | 140 (7.3%) |
| $500 to $799 | 927 (13.8%) | 420 (22.0%) |
| $800 to $999 | 570 (8.5%) | 379 (19.8%) |
| $1,000 to $1,499 | 1,749 (26.1%) | 475 (24.9%) |
| $1,500 to $1,999 | 1,003 (15.0%) | 44 (2.3%) |
| $2,000 to $2,499 | 362 (5.4%) | 4 (0.2%) |
| $2,500 to $2,999 | 200 (3.0%) | 6 (0.3%) |
| $3,000 or more | 162 (2.4%) | 0 (0.0%) |
| Total | 6,706 (100.0%) | 1,911 (100.0%) |
Physical Housing Characteristics in Sanpete County
Housing Structures in Sanpete County
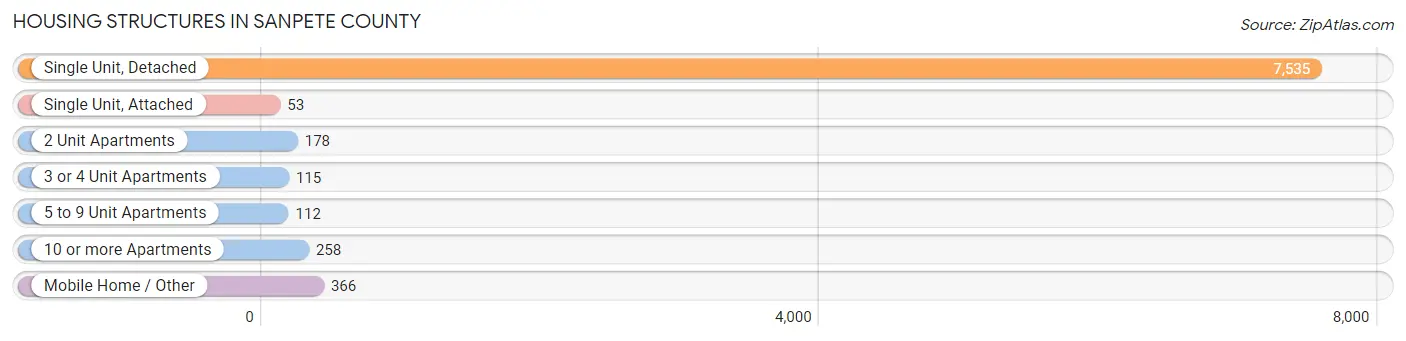
| Structure Type | # Housing Units | % Housing Units |
| Single Unit, Detached | 7,535 | 87.4% |
| Single Unit, Attached | 53 | 0.6% |
| 2 Unit Apartments | 178 | 2.1% |
| 3 or 4 Unit Apartments | 115 | 1.3% |
| 5 to 9 Unit Apartments | 112 | 1.3% |
| 10 or more Apartments | 258 | 3.0% |
| Mobile Home / Other | 366 | 4.3% |
| Total | 8,617 | 100.0% |
Housing Structures by Occupancy in Sanpete County
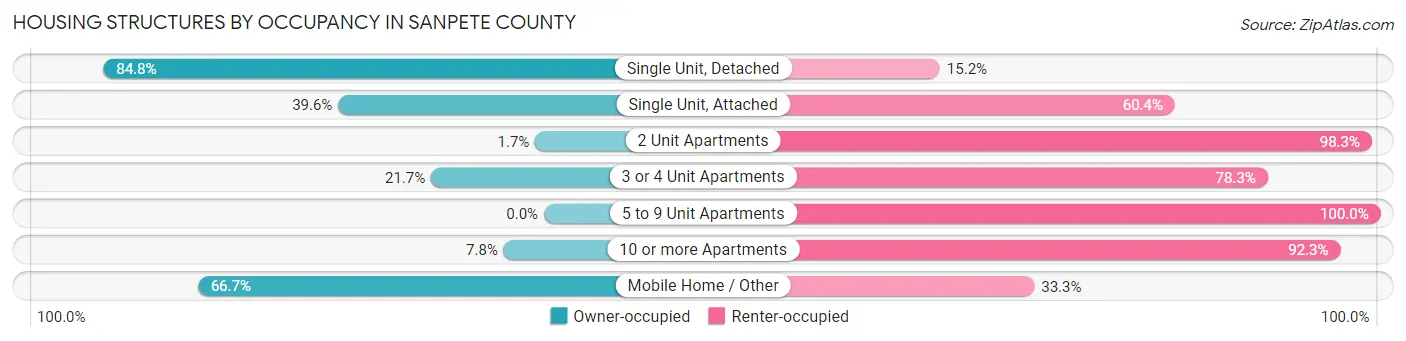
| Structure Type | Owner-occupied | Renter-occupied |
| Single Unit, Detached | 6,393 (84.8%) | 1,142 (15.2%) |
| Single Unit, Attached | 21 (39.6%) | 32 (60.4%) |
| 2 Unit Apartments | 3 (1.7%) | 175 (98.3%) |
| 3 or 4 Unit Apartments | 25 (21.7%) | 90 (78.3%) |
| 5 to 9 Unit Apartments | 0 (0.0%) | 112 (100.0%) |
| 10 or more Apartments | 20 (7.7%) | 238 (92.2%) |
| Mobile Home / Other | 244 (66.7%) | 122 (33.3%) |
| Total | 6,706 (77.8%) | 1,911 (22.2%) |
Housing Structures by Number of Rooms in Sanpete County
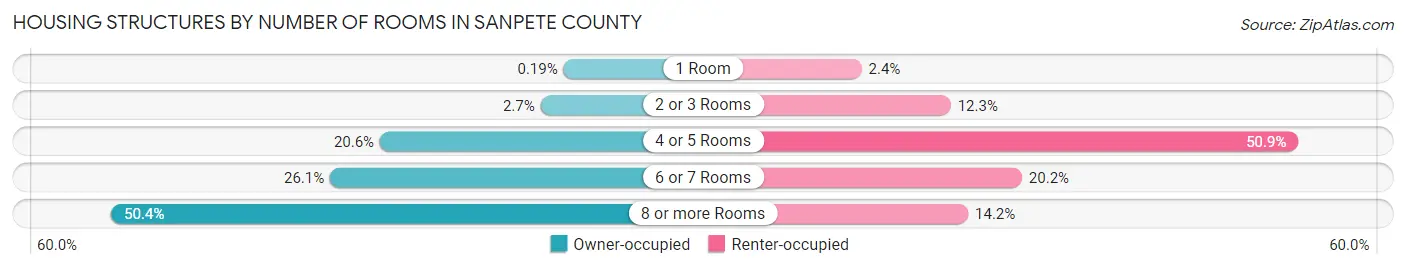
| Number of Rooms | Owner-occupied | Renter-occupied |
| 1 Room | 13 (0.2%) | 46 (2.4%) |
| 2 or 3 Rooms | 184 (2.7%) | 235 (12.3%) |
| 4 or 5 Rooms | 1,379 (20.6%) | 972 (50.9%) |
| 6 or 7 Rooms | 1,750 (26.1%) | 386 (20.2%) |
| 8 or more Rooms | 3,380 (50.4%) | 272 (14.2%) |
| Total | 6,706 (100.0%) | 1,911 (100.0%) |
Housing Structure by Heating Type in Sanpete County
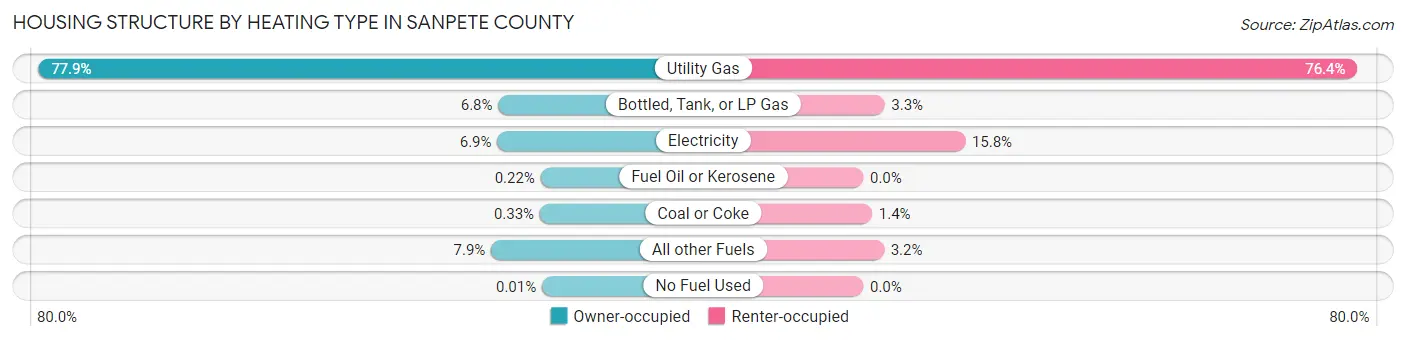
| Heating Type | Owner-occupied | Renter-occupied |
| Utility Gas | 5,223 (77.9%) | 1,460 (76.4%) |
| Bottled, Tank, or LP Gas | 453 (6.8%) | 63 (3.3%) |
| Electricity | 464 (6.9%) | 301 (15.8%) |
| Fuel Oil or Kerosene | 15 (0.2%) | 0 (0.0%) |
| Coal or Coke | 22 (0.3%) | 26 (1.4%) |
| All other Fuels | 528 (7.9%) | 61 (3.2%) |
| No Fuel Used | 1 (0.0%) | 0 (0.0%) |
| Total | 6,706 (100.0%) | 1,911 (100.0%) |
Household Vehicle Usage in Sanpete County
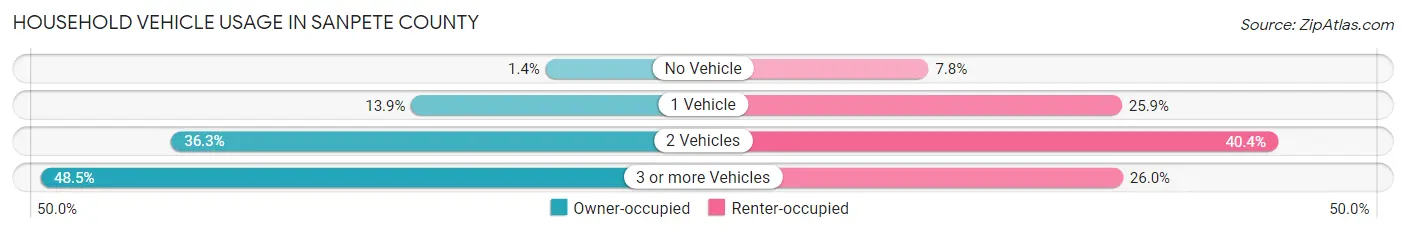
| Vehicles per Household | Owner-occupied | Renter-occupied |
| No Vehicle | 91 (1.4%) | 149 (7.8%) |
| 1 Vehicle | 932 (13.9%) | 494 (25.9%) |
| 2 Vehicles | 2,434 (36.3%) | 772 (40.4%) |
| 3 or more Vehicles | 3,249 (48.4%) | 496 (26.0%) |
| Total | 6,706 (100.0%) | 1,911 (100.0%) |
Real Estate & Mortgages in Sanpete County
Real Estate and Mortgage Overview in Sanpete County
| Characteristic | Without Mortgage | With Mortgage |
| Housing Units | 2,431 | 4,275 |
| Median Property Value | $253,800 | $276,200 |
| Median Household Income | $58,486 | $622 |
| Monthly Housing Costs | $412 | $145 |
| Real Estate Taxes | $1,445 | $82 |
Property Value by Mortgage Status in Sanpete County
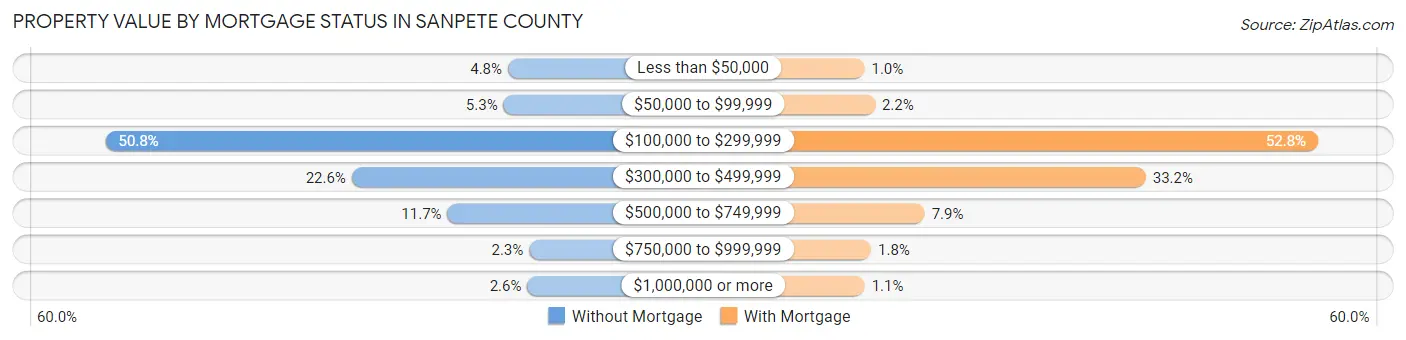
| Property Value | Without Mortgage | With Mortgage |
| Less than $50,000 | 116 (4.8%) | 44 (1.0%) |
| $50,000 to $99,999 | 128 (5.3%) | 95 (2.2%) |
| $100,000 to $299,999 | 1,234 (50.8%) | 2,259 (52.8%) |
| $300,000 to $499,999 | 550 (22.6%) | 1,418 (33.2%) |
| $500,000 to $749,999 | 284 (11.7%) | 338 (7.9%) |
| $750,000 to $999,999 | 57 (2.3%) | 76 (1.8%) |
| $1,000,000 or more | 62 (2.5%) | 45 (1.1%) |
| Total | 2,431 (100.0%) | 4,275 (100.0%) |
Household Income by Mortgage Status in Sanpete County
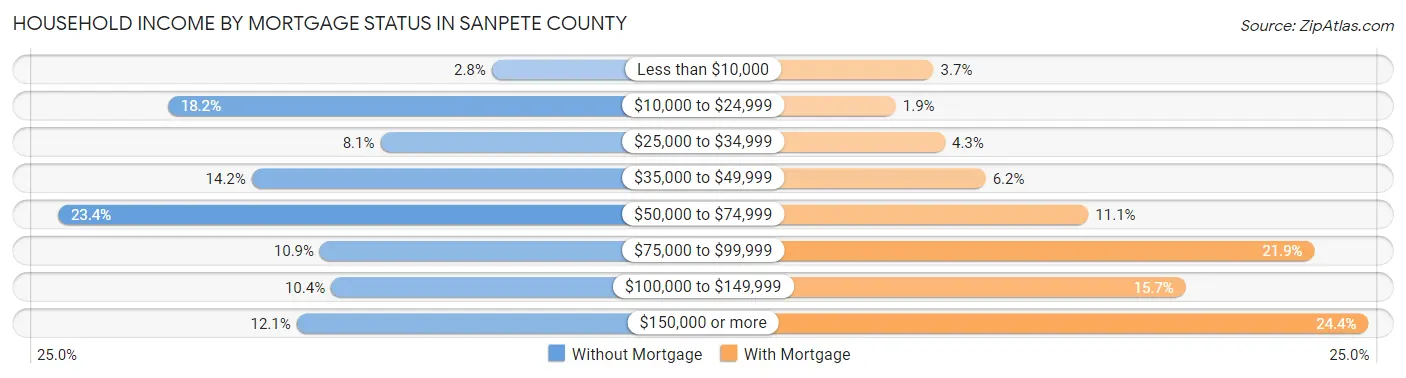
| Household Income | Without Mortgage | With Mortgage |
| Less than $10,000 | 67 (2.8%) | 159 (3.7%) |
| $10,000 to $24,999 | 442 (18.2%) | 82 (1.9%) |
| $25,000 to $34,999 | 196 (8.1%) | 182 (4.3%) |
| $35,000 to $49,999 | 345 (14.2%) | 265 (6.2%) |
| $50,000 to $74,999 | 569 (23.4%) | 474 (11.1%) |
| $75,000 to $99,999 | 266 (10.9%) | 934 (21.8%) |
| $100,000 to $149,999 | 253 (10.4%) | 672 (15.7%) |
| $150,000 or more | 293 (12.0%) | 1,044 (24.4%) |
| Total | 2,431 (100.0%) | 4,275 (100.0%) |
Property Value to Household Income Ratio in Sanpete County
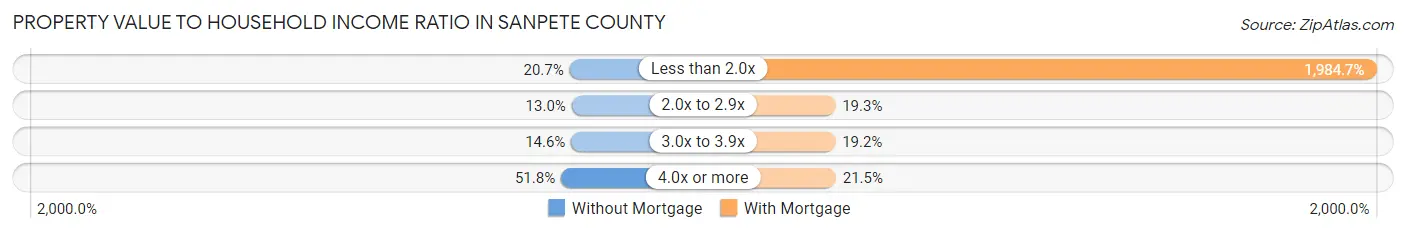
| Value-to-Income Ratio | Without Mortgage | With Mortgage |
| Less than 2.0x | 504 (20.7%) | 84,844 (1,984.6%) |
| 2.0x to 2.9x | 315 (13.0%) | 824 (19.3%) |
| 3.0x to 3.9x | 354 (14.6%) | 819 (19.2%) |
| 4.0x or more | 1,258 (51.7%) | 917 (21.4%) |
| Total | 2,431 (100.0%) | 4,275 (100.0%) |
Real Estate Taxes by Mortgage Status in Sanpete County
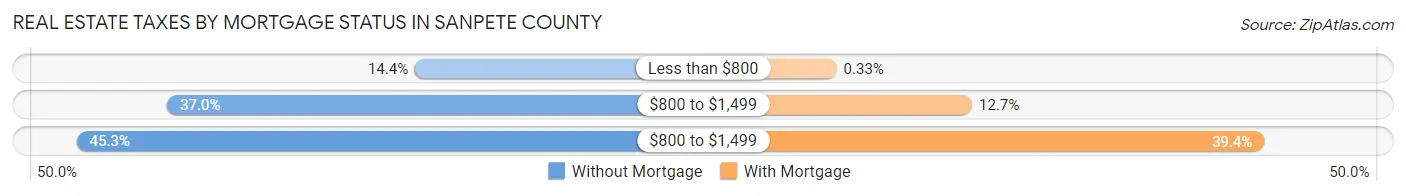
| Property Taxes | Without Mortgage | With Mortgage |
| Less than $800 | 351 (14.4%) | 14 (0.3%) |
| $800 to $1,499 | 899 (37.0%) | 543 (12.7%) |
| $800 to $1,499 | 1,100 (45.3%) | 1,683 (39.4%) |
| Total | 2,431 (100.0%) | 4,275 (100.0%) |
Health & Disability in Sanpete County
Health Insurance Coverage by Age in Sanpete County
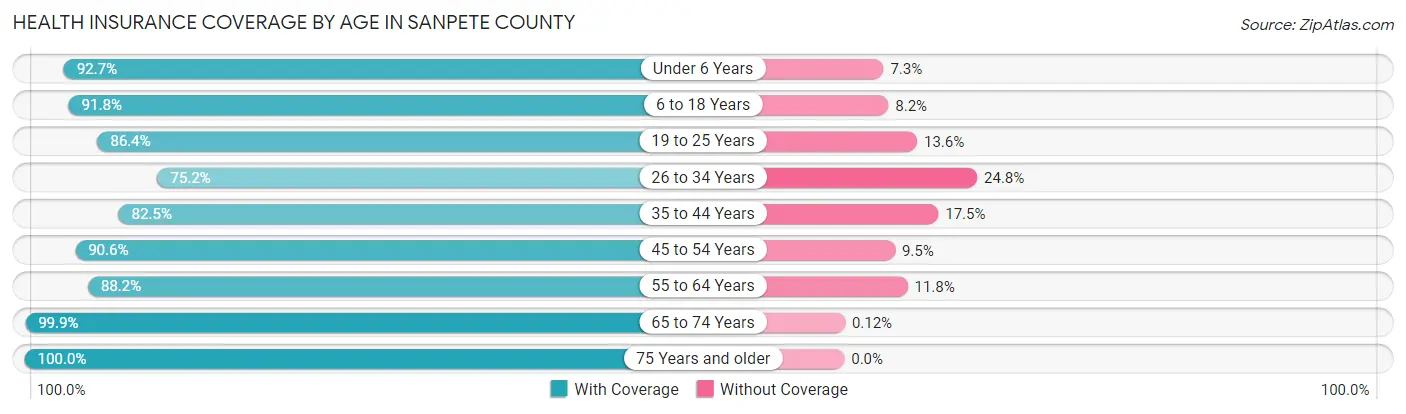
| Age Bracket | With Coverage | Without Coverage |
| Under 6 Years | 2,007 (92.7%) | 158 (7.3%) |
| 6 to 18 Years | 5,356 (91.8%) | 480 (8.2%) |
| 19 to 25 Years | 3,057 (86.4%) | 480 (13.6%) |
| 26 to 34 Years | 1,941 (75.2%) | 639 (24.8%) |
| 35 to 44 Years | 2,554 (82.5%) | 543 (17.5%) |
| 45 to 54 Years | 2,567 (90.5%) | 268 (9.5%) |
| 55 to 64 Years | 2,365 (88.2%) | 316 (11.8%) |
| 65 to 74 Years | 2,436 (99.9%) | 3 (0.1%) |
| 75 Years and older | 1,585 (100.0%) | 0 (0.0%) |
| Total | 23,868 (89.2%) | 2,887 (10.8%) |
Health Insurance Coverage by Citizenship Status in Sanpete County
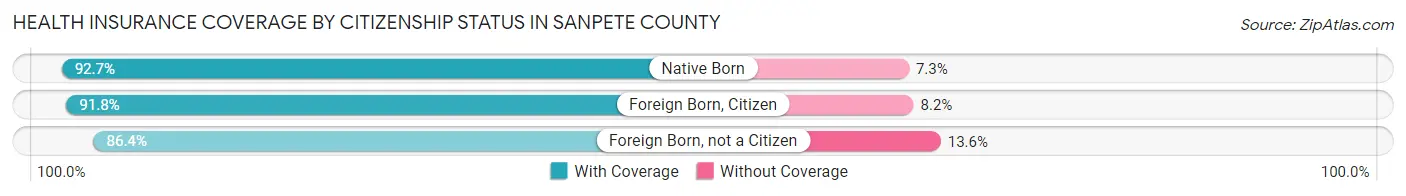
| Citizenship Status | With Coverage | Without Coverage |
| Native Born | 2,007 (92.7%) | 158 (7.3%) |
| Foreign Born, Citizen | 5,356 (91.8%) | 480 (8.2%) |
| Foreign Born, not a Citizen | 3,057 (86.4%) | 480 (13.6%) |
Health Insurance Coverage by Household Income in Sanpete County
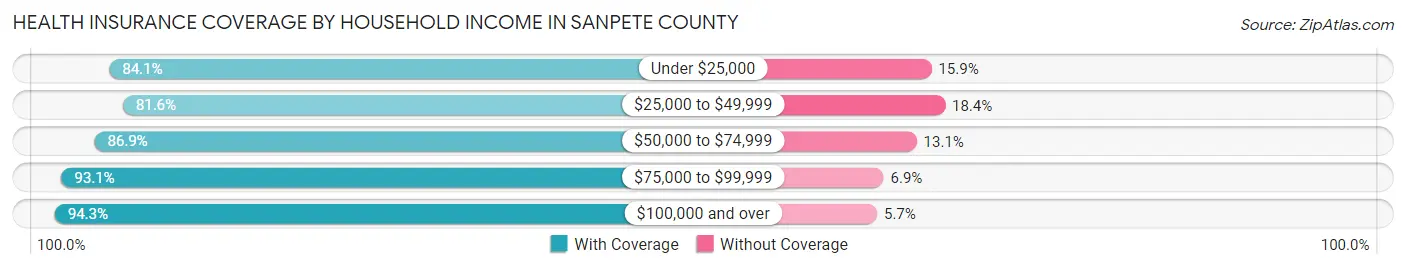
| Household Income | With Coverage | Without Coverage |
| Under $25,000 | 2,189 (84.1%) | 413 (15.9%) |
| $25,000 to $49,999 | 4,401 (81.6%) | 993 (18.4%) |
| $50,000 to $74,999 | 4,327 (86.9%) | 652 (13.1%) |
| $75,000 to $99,999 | 3,643 (93.1%) | 270 (6.9%) |
| $100,000 and over | 8,669 (94.3%) | 521 (5.7%) |
Public vs Private Health Insurance Coverage by Age in Sanpete County
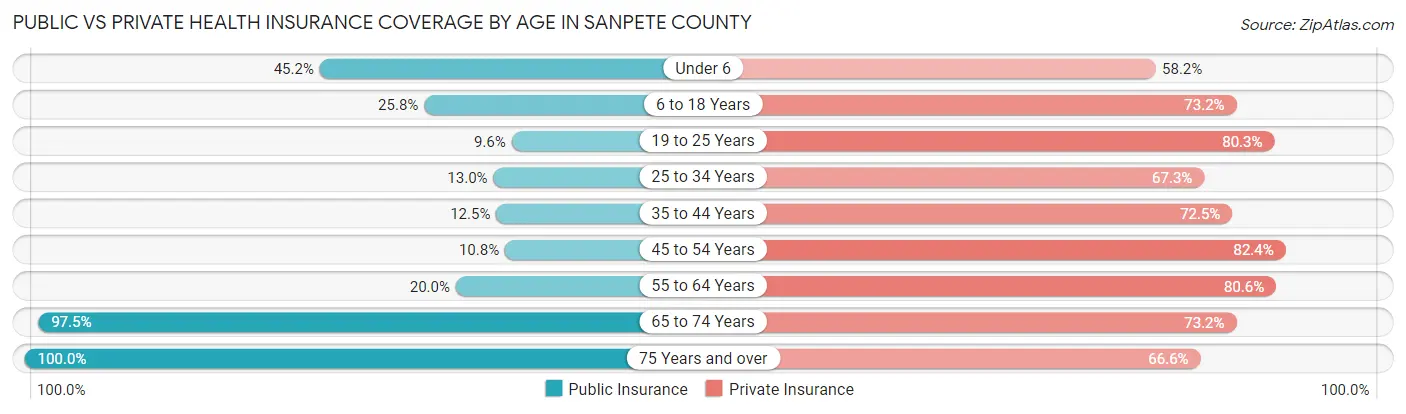
| Age Bracket | Public Insurance | Private Insurance |
| Under 6 | 979 (45.2%) | 1,259 (58.2%) |
| 6 to 18 Years | 1,508 (25.8%) | 4,274 (73.2%) |
| 19 to 25 Years | 340 (9.6%) | 2,839 (80.3%) |
| 25 to 34 Years | 335 (13.0%) | 1,735 (67.2%) |
| 35 to 44 Years | 386 (12.5%) | 2,244 (72.5%) |
| 45 to 54 Years | 307 (10.8%) | 2,335 (82.4%) |
| 55 to 64 Years | 535 (20.0%) | 2,161 (80.6%) |
| 65 to 74 Years | 2,377 (97.5%) | 1,786 (73.2%) |
| 75 Years and over | 1,585 (100.0%) | 1,055 (66.6%) |
| Total | 8,352 (31.2%) | 19,688 (73.6%) |
Disability Status by Sex by Age in Sanpete County
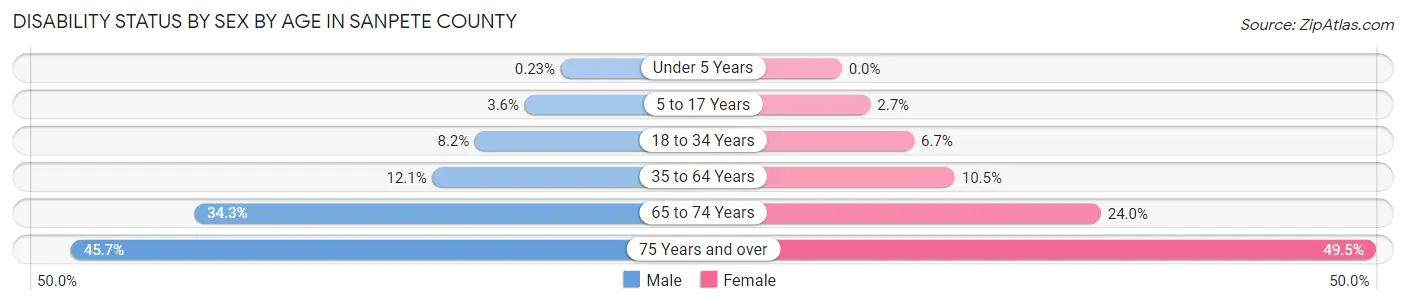
| Age Bracket | Male | Female |
| Under 5 Years | 2 (0.2%) | 0 (0.0%) |
| 5 to 17 Years | 99 (3.6%) | 68 (2.6%) |
| 18 to 34 Years | 285 (8.2%) | 241 (6.7%) |
| 35 to 64 Years | 519 (12.1%) | 455 (10.5%) |
| 65 to 74 Years | 408 (34.3%) | 300 (24.0%) |
| 75 Years and over | 336 (45.7%) | 421 (49.5%) |
Disability Class by Sex by Age in Sanpete County
Disability Class: Hearing Difficulty
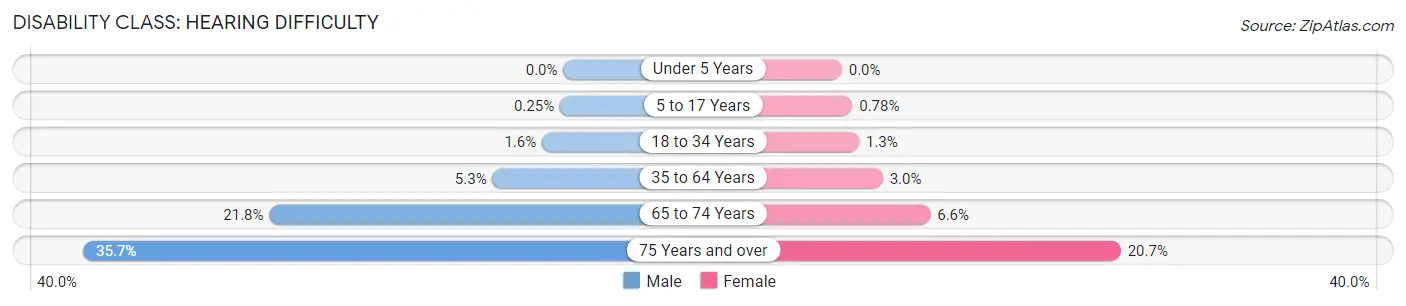
| Age Bracket | Male | Female |
| Under 5 Years | 0 (0.0%) | 0 (0.0%) |
| 5 to 17 Years | 7 (0.3%) | 20 (0.8%) |
| 18 to 34 Years | 55 (1.6%) | 46 (1.3%) |
| 35 to 64 Years | 225 (5.3%) | 132 (3.0%) |
| 65 to 74 Years | 260 (21.8%) | 82 (6.6%) |
| 75 Years and over | 262 (35.6%) | 176 (20.7%) |
Disability Class: Vision Difficulty
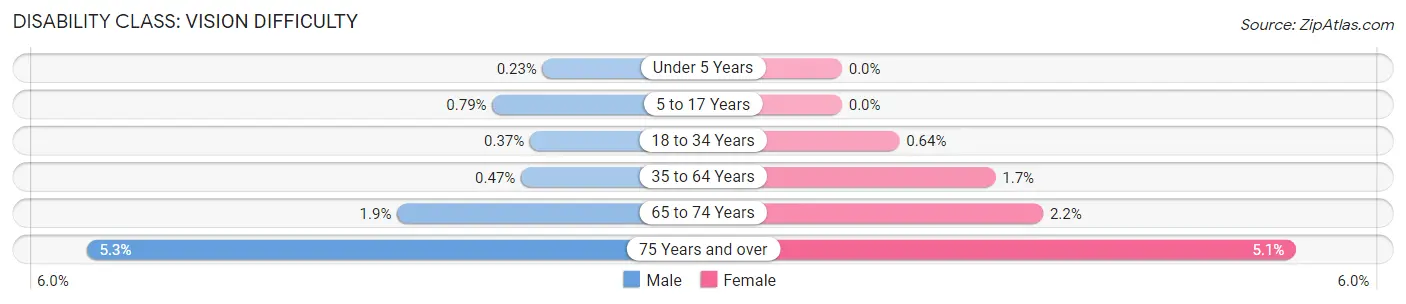
| Age Bracket | Male | Female |
| Under 5 Years | 2 (0.2%) | 0 (0.0%) |
| 5 to 17 Years | 22 (0.8%) | 0 (0.0%) |
| 18 to 34 Years | 13 (0.4%) | 23 (0.6%) |
| 35 to 64 Years | 20 (0.5%) | 74 (1.7%) |
| 65 to 74 Years | 22 (1.8%) | 28 (2.2%) |
| 75 Years and over | 39 (5.3%) | 43 (5.1%) |
Disability Class: Cognitive Difficulty
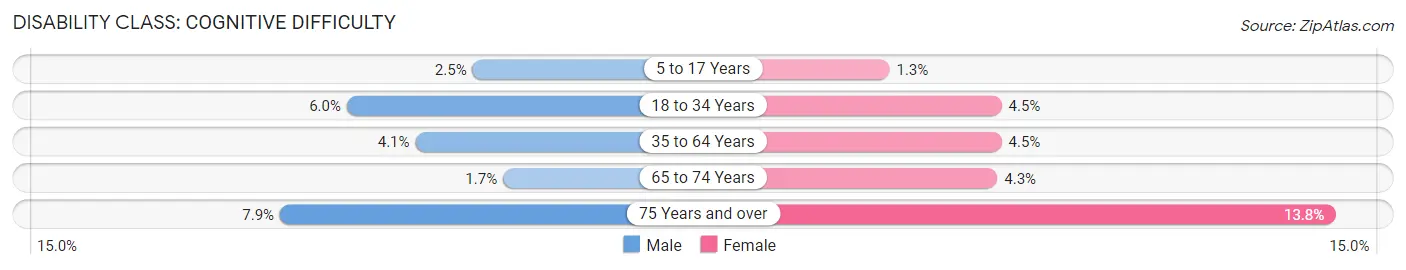
| Age Bracket | Male | Female |
| 5 to 17 Years | 70 (2.5%) | 34 (1.3%) |
| 18 to 34 Years | 210 (6.0%) | 160 (4.4%) |
| 35 to 64 Years | 176 (4.1%) | 193 (4.4%) |
| 65 to 74 Years | 20 (1.7%) | 54 (4.3%) |
| 75 Years and over | 58 (7.9%) | 117 (13.8%) |
Disability Class: Ambulatory Difficulty
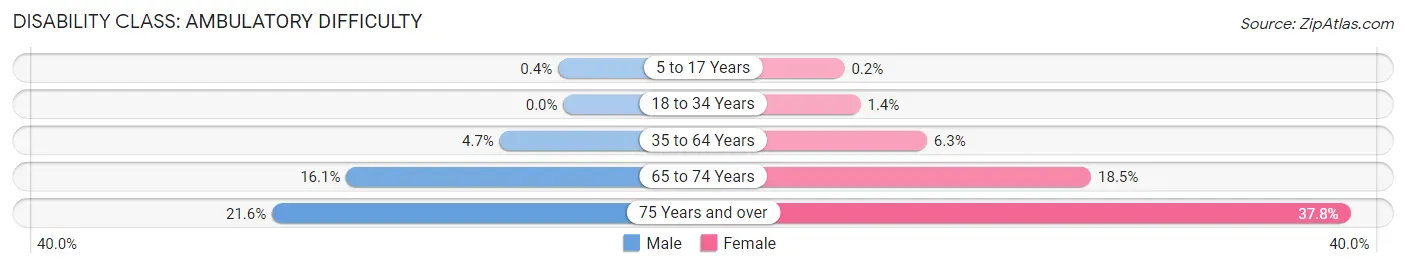
| Age Bracket | Male | Female |
| 5 to 17 Years | 11 (0.4%) | 5 (0.2%) |
| 18 to 34 Years | 0 (0.0%) | 50 (1.4%) |
| 35 to 64 Years | 202 (4.7%) | 274 (6.3%) |
| 65 to 74 Years | 192 (16.1%) | 231 (18.5%) |
| 75 Years and over | 159 (21.6%) | 321 (37.8%) |
Disability Class: Self-Care Difficulty
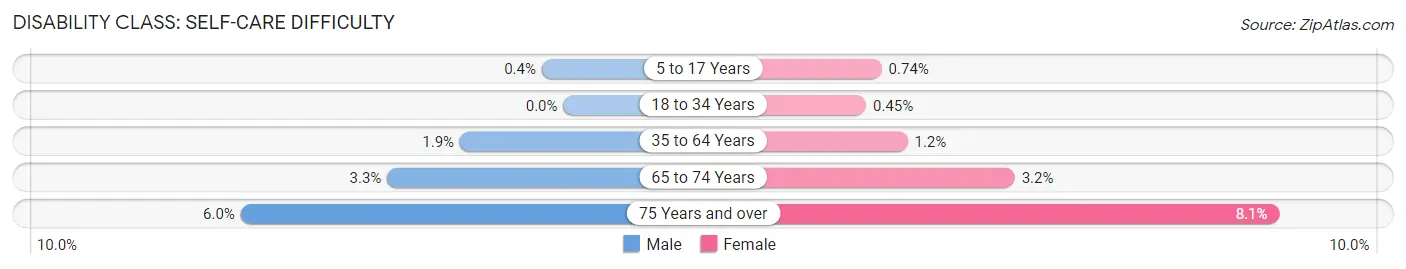
| Age Bracket | Male | Female |
| 5 to 17 Years | 11 (0.4%) | 19 (0.7%) |
| 18 to 34 Years | 0 (0.0%) | 16 (0.4%) |
| 35 to 64 Years | 82 (1.9%) | 53 (1.2%) |
| 65 to 74 Years | 39 (3.3%) | 40 (3.2%) |
| 75 Years and over | 44 (6.0%) | 69 (8.1%) |
Technology Access in Sanpete County
Computing Device Access in Sanpete County
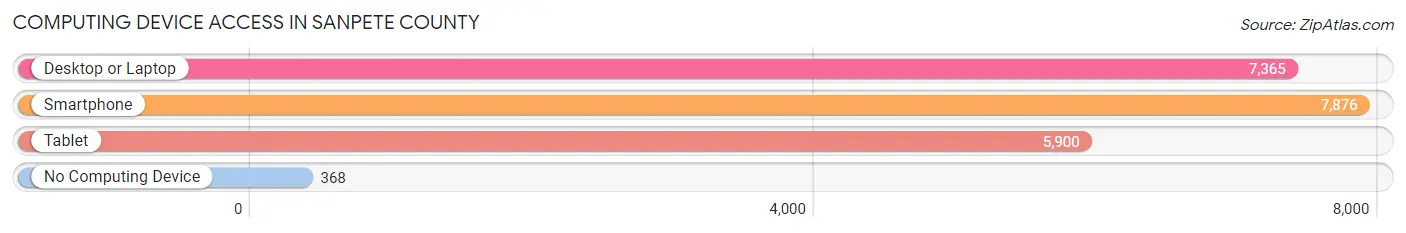
| Device Type | # Households | % Households |
| Desktop or Laptop | 7,365 | 85.5% |
| Smartphone | 7,876 | 91.4% |
| Tablet | 5,900 | 68.5% |
| No Computing Device | 368 | 4.3% |
| Total | 8,617 | 100.0% |
Internet Access in Sanpete County
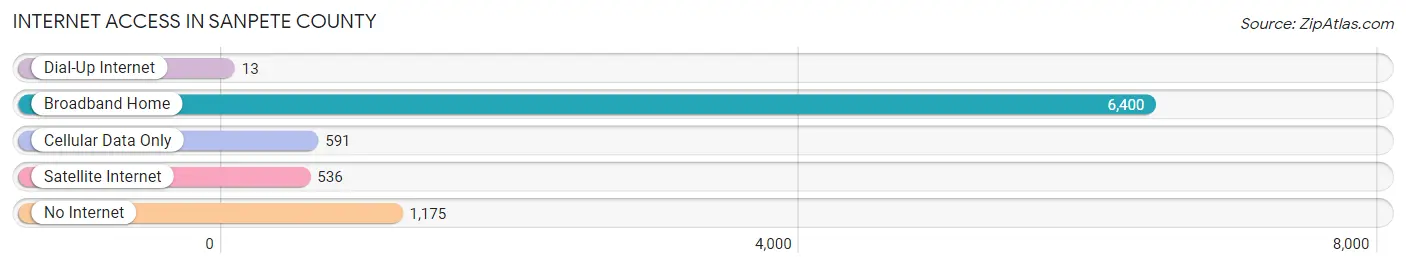
| Internet Type | # Households | % Households |
| Dial-Up Internet | 13 | 0.2% |
| Broadband Home | 6,400 | 74.3% |
| Cellular Data Only | 591 | 6.9% |
| Satellite Internet | 536 | 6.2% |
| No Internet | 1,175 | 13.6% |
| Total | 8,617 | 100.0% |
Sanpete County Summary
Sanpete County is located in the central part of Utah, and is part of the Wasatch Front region. It is bordered by Juab County to the north, Sevier County to the east, Emery County to the south, and San Juan County to the west. The county seat is Manti, and the largest city is Ephraim. The county has a total area of 2,072 square miles, and a population of 27,822 as of the 2010 census.
History
Sanpete County was established in 1850, and was named after the Sanpitch Ute Indians who lived in the area. The county was originally part of the State of Deseret, and was later incorporated into the Utah Territory in 1851. The county was initially populated by Mormon settlers, and the first county seat was established in Manti in 1852.
The county experienced rapid growth in the late 19th century, as the railroad was extended to the area in 1891. This allowed for the development of the coal mining industry, which was a major source of employment for the county. The county also experienced a population boom during this time, as many immigrants from Europe and Scandinavia moved to the area.
Geography
Sanpete County is located in the central part of Utah, and is part of the Wasatch Front region. It is bordered by Juab County to the north, Sevier County to the east, Emery County to the south, and San Juan County to the west. The county has a total area of 2,072 square miles, and is located at an elevation of 5,000 feet.
The county is mostly mountainous, with the Wasatch Range to the east and the San Pitch Mountains to the west. The county is also home to several lakes, including Gunnison Lake, Palisade Reservoir, and Scofield Reservoir. The county is also home to several rivers, including the San Pitch River, the Sevier River, and the Gunnison River.
Economy
Sanpete County has a diverse economy, with a mix of agriculture, manufacturing, and tourism. The county is home to several large agricultural operations, including dairy farms, beef cattle ranches, and sheep farms. The county is also home to several manufacturing companies, including a large paper mill in Ephraim and a furniture factory in Manti.
The county is also home to several tourist attractions, including the Manti Temple, the Sanpete County Historical Museum, and the Sanpete County Fairgrounds. The county is also home to several ski resorts, including the Wolf Creek Ski Resort and the Skyline Ski Resort.
Demographics
As of the 2010 census, Sanpete County had a population of 27,822. The racial makeup of the county was 94.2% White, 0.3% African American, 0.7% Native American, 0.4% Asian, 0.1% Pacific Islander, 2.7% from other races, and 1.6% from two or more races. Hispanic or Latino of any race were 5.3% of the population.
The median income for a household in the county was $41,945, and the median income for a family was $48,945. The per capita income for the county was $18,945. About 11.2% of families and 14.2% of the population were below the poverty line, including 17.2% of those under age 18 and 8.2% of those age 65 or over.
Common Questions
What is the Total Population of Sanpete County?
Total Population of Sanpete County is 28,816.
What is the Total Male Population of Sanpete County?
Total Male Population of Sanpete County is 15,325.
What is the Total Female Population of Sanpete County?
Total Female Population of Sanpete County is 13,491.
What is the Ratio of Males per 100 Females in Sanpete County?
There are 113.59 Males per 100 Females in Sanpete County.
What is the Ratio of Females per 100 Males in Sanpete County?
There are 88.03 Females per 100 Males in Sanpete County.
What is the Median Population Age in Sanpete County?
Median Population Age in Sanpete County is 33.1 Years.
What is the Average Family Size in Sanpete County
Average Family Size in Sanpete County is 3.4 People.
What is the Average Household Size in Sanpete County
Average Household Size in Sanpete County is 3.0 People.
What is Per Capita Income in Sanpete County?
Per Capita income in Sanpete County is $25,257.
What is the Median Family Income in Sanpete County?
Median Family Income in Sanpete County is $72,583.
What is the Median Household income in Sanpete County?
Median Household Income in Sanpete County is $64,356.
What is Income or Wage Gap in Sanpete County?
Income or Wage Gap in Sanpete County is 55.3%.
Women in Sanpete County earn 44.7 cents for every dollar earned by a man.
What is Family Income Deficit in Sanpete County?
Family Income Deficit in Sanpete County is $11,811.
Families that are below poverty line in Sanpete County earn $11,811 less on average than the poverty threshold level.
What is Inequality or Gini Index in Sanpete County?
Inequality or Gini Index in Sanpete County is 0.41.
How Large is the Labor Force in Sanpete County?
There are 12,871 People in the Labor Forcein in Sanpete County.
What is the Percentage of People in the Labor Force in Sanpete County?
56.8% of People are in the Labor Force in Sanpete County.
What is the Unemployment Rate in Sanpete County?
Unemployment Rate in Sanpete County is 4.6%.