San Juan County, UT
San Juan County Map
San Juan County Overview
14,524
TOTAL POPULATION
7,293
MALE POPULATION
7,231
FEMALE POPULATION
100.86
MALES / 100 FEMALES
99.15
FEMALES / 100 MALES
33.2
MEDIAN AGE
3.9
AVG FAMILY SIZE
3.2
AVG HOUSEHOLD SIZE
$25,591
PER CAPITA INCOME
$65,568
AVG FAMILY INCOME
$52,108
AVG HOUSEHOLD INCOME
39.9%
WAGE / INCOME GAP [ % ]
60.1¢/ $1
WAGE / INCOME GAP [ $ ]
$14,583
FAMILY INCOME DEFICIT
0.51
INEQUALITY / GINI INDEX
5,949
LABOR FORCE [ PEOPLE ]
54.1%
PERCENT IN LABOR FORCE
12.1%
UNEMPLOYMENT RATE
San Juan County Area Codes
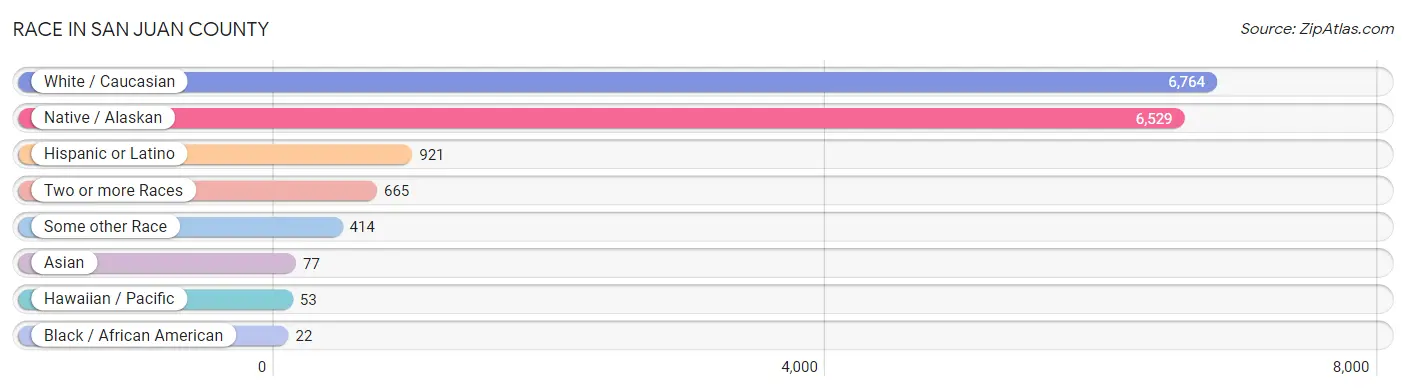
Race in San Juan County
The most populous races in San Juan County are White / Caucasian (6,764 | 46.6%), Native / Alaskan (6,529 | 45.0%), and Hispanic or Latino (921 | 6.3%).
| Race | # Population | % Population |
| Asian | 77 | 0.5% |
| Black / African American | 22 | 0.2% |
| Hawaiian / Pacific | 53 | 0.4% |
| Hispanic or Latino | 921 | 6.3% |
| Native / Alaskan | 6,529 | 45.0% |
| White / Caucasian | 6,764 | 46.6% |
| Two or more Races | 665 | 4.6% |
| Some other Race | 414 | 2.9% |
| Total | 14,524 | 100.0% |
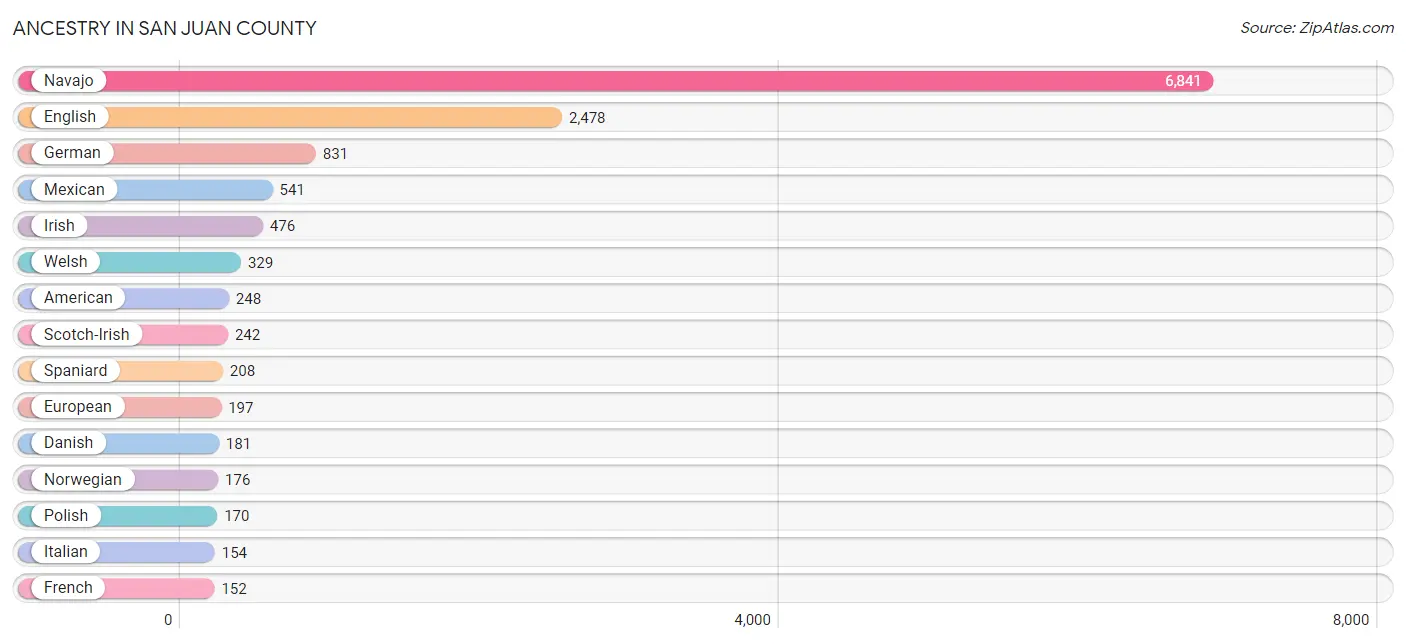
Ancestry in San Juan County
The most populous ancestries reported in San Juan County are Navajo (6,841 | 47.1%), English (2,478 | 17.1%), German (831 | 5.7%), Mexican (541 | 3.7%), and Irish (476 | 3.3%), together accounting for 76.9% of all San Juan County residents.
| Ancestry | # Population | % Population |
| American | 248 | 1.7% |
| Apache | 11 | 0.1% |
| Arapaho | 26 | 0.2% |
| Australian | 10 | 0.1% |
| Blackfeet | 5 | 0.0% |
| British | 131 | 0.9% |
| Canadian | 5 | 0.0% |
| Central American | 6 | 0.0% |
| Cuban | 1 | 0.0% |
| Czech | 7 | 0.1% |
| Danish | 181 | 1.3% |
| Dominican | 4 | 0.0% |
| Dutch | 77 | 0.5% |
| English | 2,478 | 17.1% |
| European | 197 | 1.4% |
| French | 152 | 1.1% |
| German | 831 | 5.7% |
| Icelander | 8 | 0.1% |
| Indian (Asian) | 6 | 0.0% |
| Inupiat | 4 | 0.0% |
| Irish | 476 | 3.3% |
| Italian | 154 | 1.1% |
| Japanese | 71 | 0.5% |
| Malaysian | 3 | 0.0% |
| Mexican | 541 | 3.7% |
| Navajo | 6,841 | 47.1% |
| Norwegian | 176 | 1.2% |
| Paiute | 31 | 0.2% |
| Polish | 170 | 1.2% |
| Portuguese | 40 | 0.3% |
| Pueblo | 19 | 0.1% |
| Puerto Rican | 59 | 0.4% |
| Russian | 51 | 0.4% |
| Salvadoran | 6 | 0.0% |
| Samoan | 53 | 0.4% |
| Scandinavian | 81 | 0.6% |
| Scotch-Irish | 242 | 1.7% |
| Scottish | 65 | 0.4% |
| South American | 10 | 0.1% |
| Spaniard | 208 | 1.4% |
| Spanish | 15 | 0.1% |
| Swedish | 83 | 0.6% |
| Swiss | 49 | 0.3% |
| Thai | 3 | 0.0% |
| Tohono O'Odham | 7 | 0.1% |
| Tongan | 9 | 0.1% |
| Ukrainian | 64 | 0.4% |
| Uruguayan | 1 | 0.0% |
| Ute | 60 | 0.4% |
| Venezuelan | 9 | 0.1% |
| Welsh | 329 | 2.3% | View All 51 Rows |
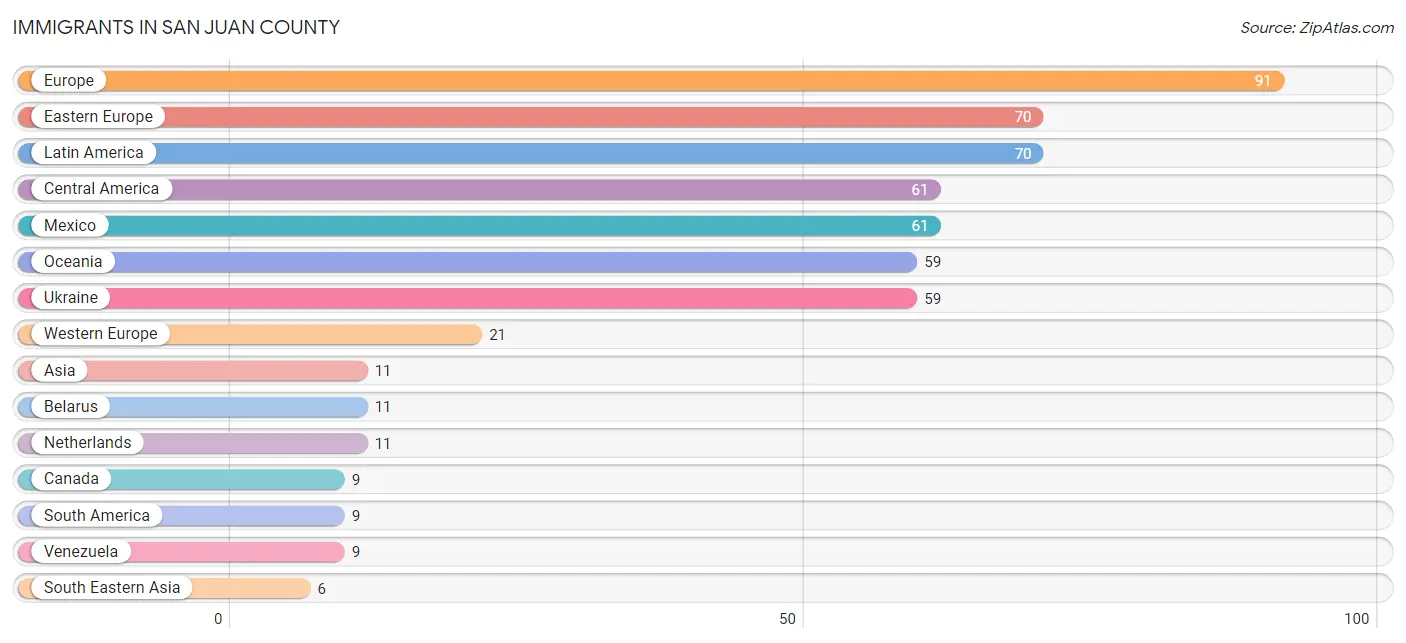
Immigrants in San Juan County
The most numerous immigrant groups reported in San Juan County came from Europe (91 | 0.6%), Eastern Europe (70 | 0.5%), Latin America (70 | 0.5%), Central America (61 | 0.4%), and Mexico (61 | 0.4%), together accounting for 2.4% of all San Juan County residents.
| Immigration Origin | # Population | % Population |
| Asia | 11 | 0.1% |
| Belarus | 11 | 0.1% |
| Cambodia | 3 | 0.0% |
| Canada | 9 | 0.1% |
| Central America | 61 | 0.4% |
| Eastern Europe | 70 | 0.5% |
| Europe | 91 | 0.6% |
| France | 5 | 0.0% |
| Germany | 5 | 0.0% |
| Laos | 3 | 0.0% |
| Latin America | 70 | 0.5% |
| Mexico | 61 | 0.4% |
| Netherlands | 11 | 0.1% |
| Oceania | 59 | 0.4% |
| South America | 9 | 0.1% |
| South Eastern Asia | 6 | 0.0% |
| Turkey | 2 | 0.0% |
| Ukraine | 59 | 0.4% |
| Venezuela | 9 | 0.1% |
| Western Asia | 5 | 0.0% |
| Western Europe | 21 | 0.1% | View All 21 Rows |
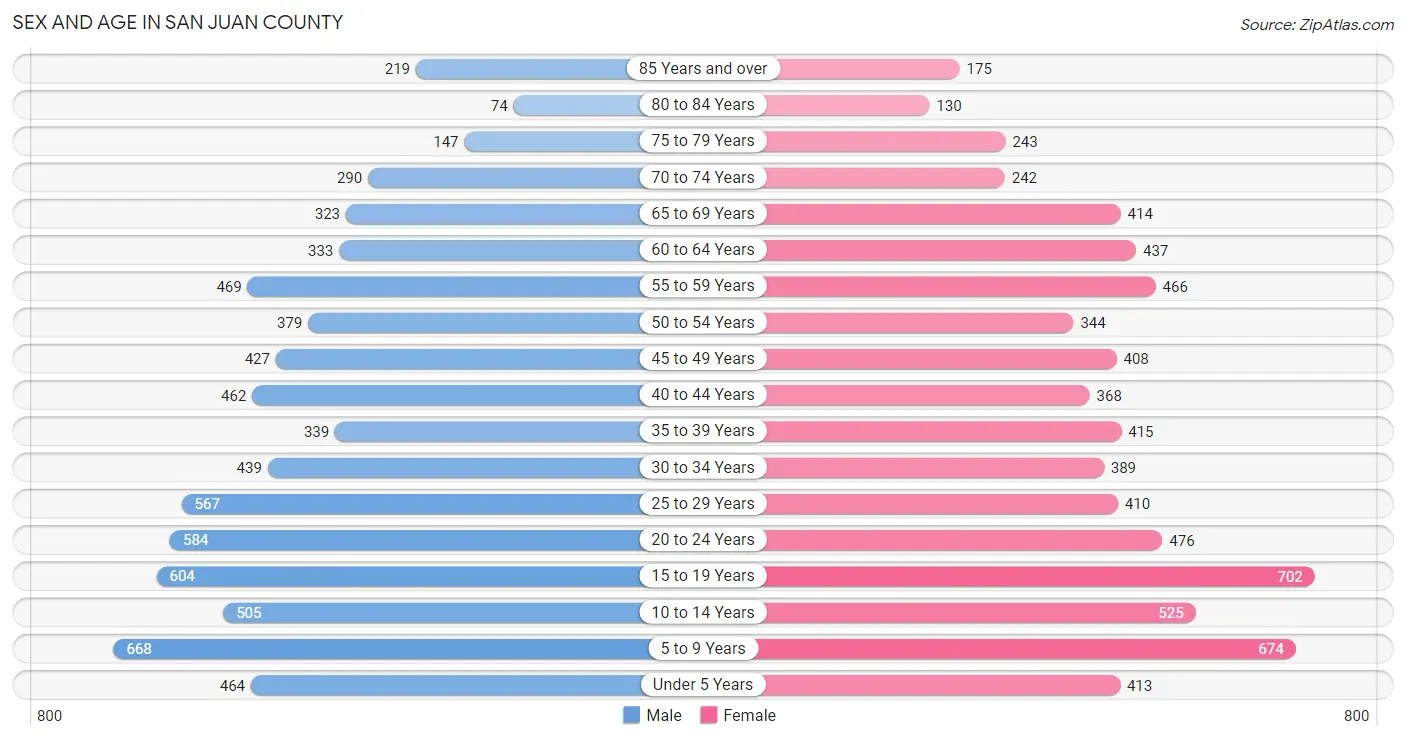
Sex and Age in San Juan County
Sex and Age in San Juan County
The most populous age groups in San Juan County are 5 to 9 Years (668 | 9.2%) for men and 15 to 19 Years (702 | 9.7%) for women.
| Age Bracket | Male | Female |
| Under 5 Years | 464 (6.4%) | 413 (5.7%) |
| 5 to 9 Years | 668 (9.2%) | 674 (9.3%) |
| 10 to 14 Years | 505 (6.9%) | 525 (7.3%) |
| 15 to 19 Years | 604 (8.3%) | 702 (9.7%) |
| 20 to 24 Years | 584 (8.0%) | 476 (6.6%) |
| 25 to 29 Years | 567 (7.8%) | 410 (5.7%) |
| 30 to 34 Years | 439 (6.0%) | 389 (5.4%) |
| 35 to 39 Years | 339 (4.6%) | 415 (5.7%) |
| 40 to 44 Years | 462 (6.3%) | 368 (5.1%) |
| 45 to 49 Years | 427 (5.9%) | 408 (5.6%) |
| 50 to 54 Years | 379 (5.2%) | 344 (4.8%) |
| 55 to 59 Years | 469 (6.4%) | 466 (6.4%) |
| 60 to 64 Years | 333 (4.6%) | 437 (6.0%) |
| 65 to 69 Years | 323 (4.4%) | 414 (5.7%) |
| 70 to 74 Years | 290 (4.0%) | 242 (3.4%) |
| 75 to 79 Years | 147 (2.0%) | 243 (3.4%) |
| 80 to 84 Years | 74 (1.0%) | 130 (1.8%) |
| 85 Years and over | 219 (3.0%) | 175 (2.4%) |
| Total | 7,293 (100.0%) | 7,231 (100.0%) |
Families and Households in San Juan County
Median Family Size in San Juan County
The median family size in San Juan County is 3.91 persons per family, with single female/mother families (677 | 21.2%) accounting for the largest median family size of 4.46 persons per family. On the other hand, married-couple families (2,318 | 72.6%) represent the smallest median family size with 3.76 persons per family.
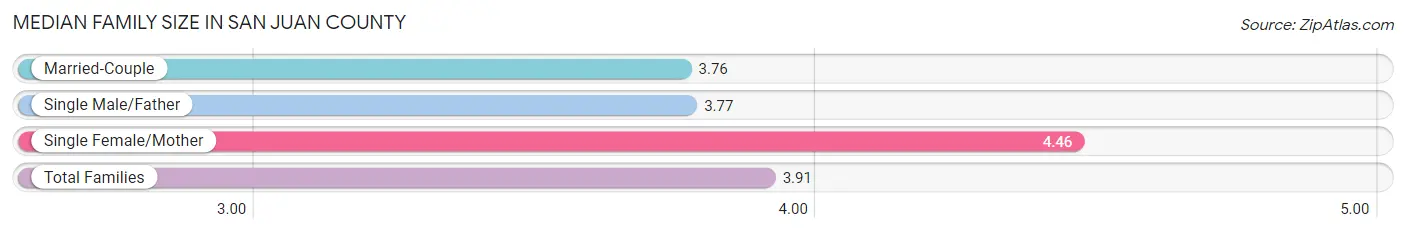
| Family Type | # Families | Family Size |
| Married-Couple | 2,318 (72.6%) | 3.76 |
| Single Male/Father | 198 (6.2%) | 3.77 |
| Single Female/Mother | 677 (21.2%) | 4.46 |
| Total Families | 3,193 (100.0%) | 3.91 |
Median Household Size in San Juan County
The median household size in San Juan County is 3.16 persons per household, with single female/mother households (677 | 15.2%) accounting for the largest median household size of 4.62 persons per household. non-family households (1,264 | 28.4%) represent the smallest median household size with 1.13 persons per household.
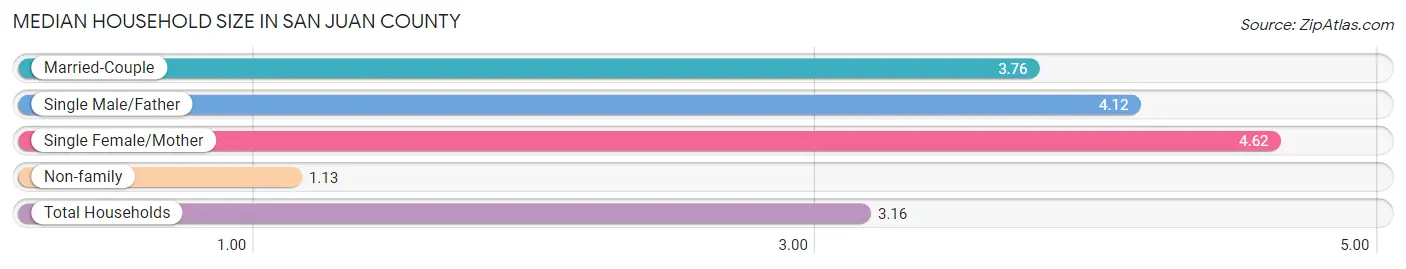
| Household Type | # Households | Household Size |
| Married-Couple | 2,318 (52.0%) | 3.76 |
| Single Male/Father | 198 (4.4%) | 4.12 |
| Single Female/Mother | 677 (15.2%) | 4.62 |
| Non-family | 1,264 (28.4%) | 1.13 |
| Total Households | 4,457 (100.0%) | 3.16 |
Household Size by Marriage Status in San Juan County
Out of a total of 4,457 households in San Juan County, 3,193 (71.6%) are family households, while 1,264 (28.4%) are nonfamily households. The most numerous type of family households are 2-person households, comprising 1,402, and the most common type of nonfamily households are 1-person households, comprising 1,090.
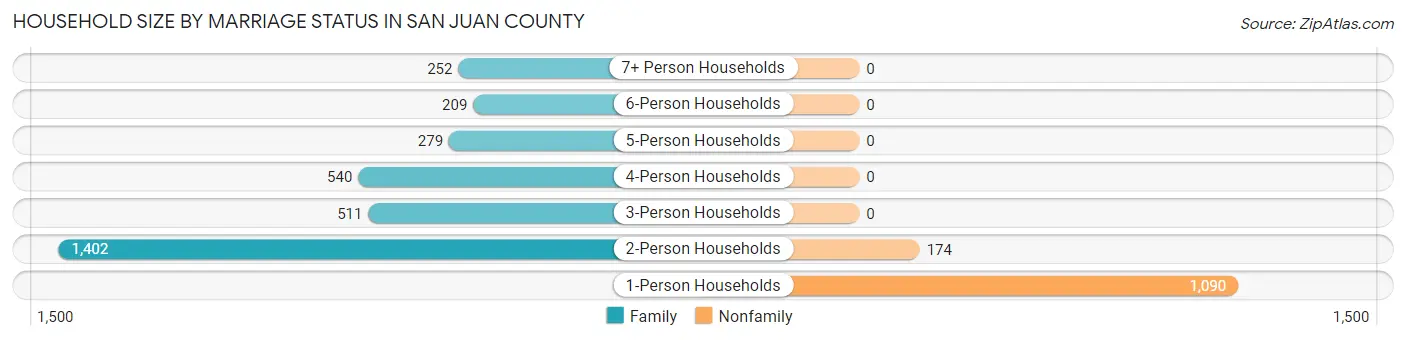
| Household Size | Family Households | Nonfamily Households |
| 1-Person Households | - | 1,090 (24.5%) |
| 2-Person Households | 1,402 (31.5%) | 174 (3.9%) |
| 3-Person Households | 511 (11.5%) | 0 (0.0%) |
| 4-Person Households | 540 (12.1%) | 0 (0.0%) |
| 5-Person Households | 279 (6.3%) | 0 (0.0%) |
| 6-Person Households | 209 (4.7%) | 0 (0.0%) |
| 7+ Person Households | 252 (5.7%) | 0 (0.0%) |
| Total | 3,193 (71.6%) | 1,264 (28.4%) |
Female Fertility in San Juan County
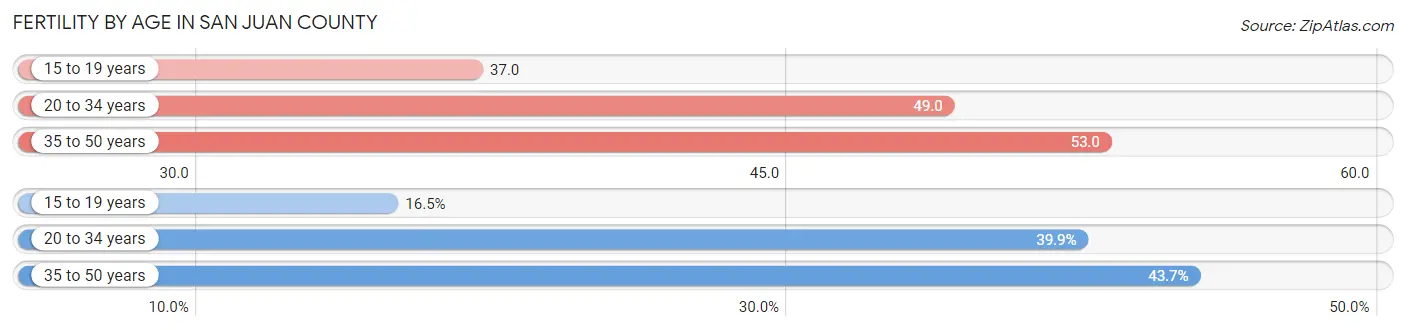
Fertility by Age in San Juan County
Average fertility rate in San Juan County is 48.0 births per 1,000 women. Women in the age bracket of 35 to 50 years have the highest fertility rate with 53.0 births per 1,000 women. Women in the age bracket of 35 to 50 years acount for 43.7% of all women with births.
| Age Bracket | Women with Births | Births / 1,000 Women |
| 15 to 19 years | 26 (16.5%) | 37.0 |
| 20 to 34 years | 63 (39.9%) | 49.0 |
| 35 to 50 years | 69 (43.7%) | 53.0 |
| Total | 158 (100.0%) | 48.0 |
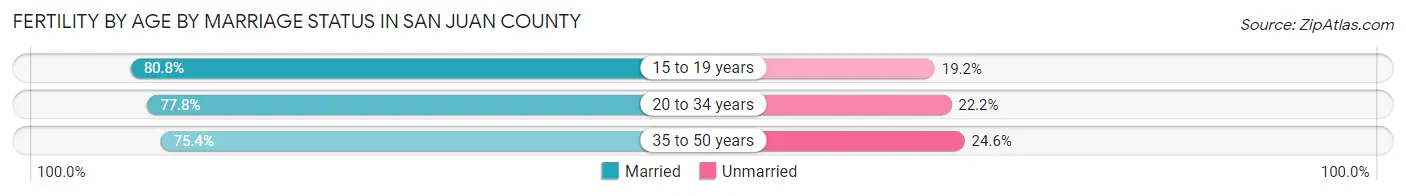
Fertility by Age by Marriage Status in San Juan County
77.2% of women with births (158) in San Juan County are married. The highest percentage of unmarried women with births falls into 35 to 50 years age bracket with 24.6% of them unmarried at the time of birth, while the lowest percentage of unmarried women with births belong to 15 to 19 years age bracket with 19.2% of them unmarried.
| Age Bracket | Married | Unmarried |
| 15 to 19 years | 21 (80.8%) | 5 (19.2%) |
| 20 to 34 years | 49 (77.8%) | 14 (22.2%) |
| 35 to 50 years | 52 (75.4%) | 17 (24.6%) |
| Total | 122 (77.2%) | 36 (22.8%) |
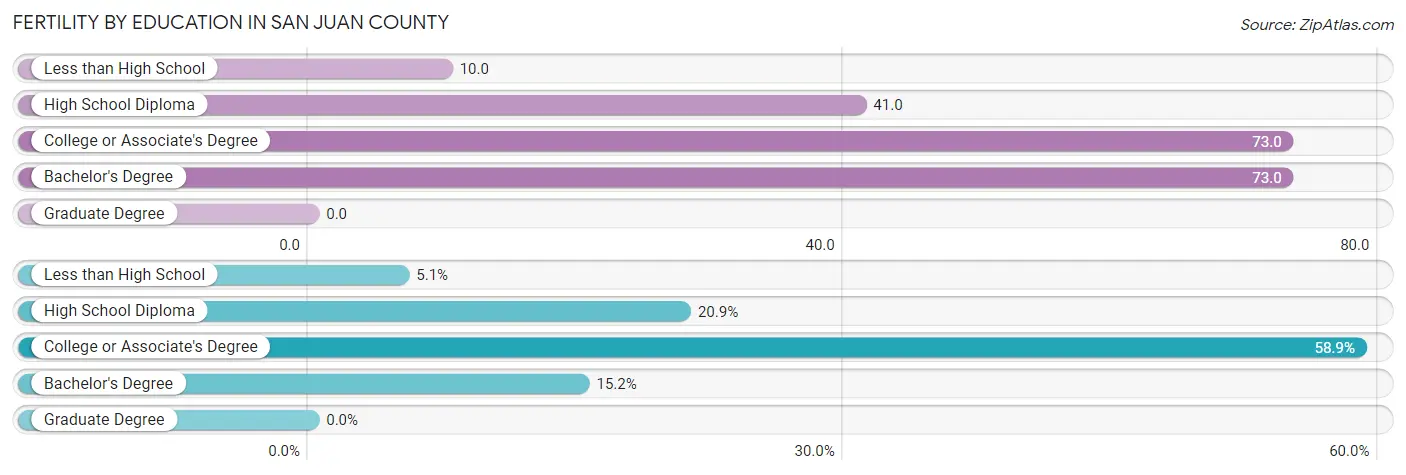
Fertility by Education in San Juan County
| Educational Attainment | Women with Births | Births / 1,000 Women |
| Less than High School | 8 (5.1%) | 10.0 |
| High School Diploma | 33 (20.9%) | 41.0 |
| College or Associate's Degree | 93 (58.9%) | 73.0 |
| Bachelor's Degree | 24 (15.2%) | 73.0 |
| Graduate Degree | 0 (0.0%) | 0.0 |
| Total | 158 (100.0%) | 48.0 |
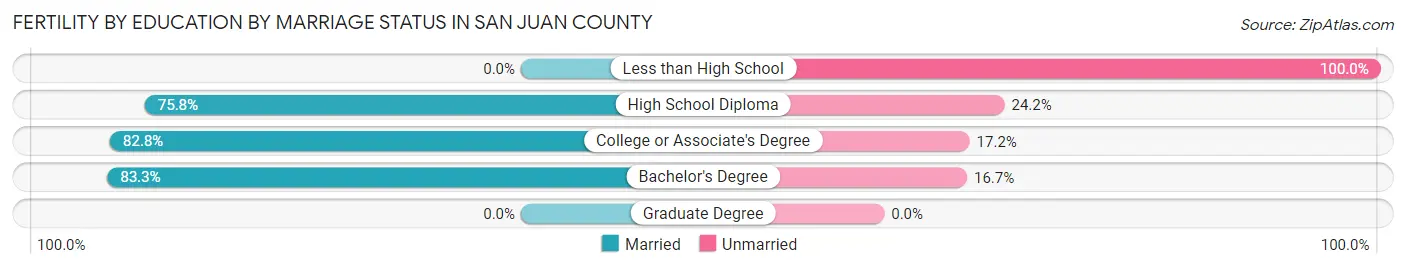
Fertility by Education by Marriage Status in San Juan County
22.8% of women with births in San Juan County are unmarried. Women with the educational attainment of bachelor's degree are most likely to be married with 83.3% of them married at childbirth, while women with the educational attainment of less than high school are least likely to be married with 100.0% of them unmarried at childbirth.
| Educational Attainment | Married | Unmarried |
| Less than High School | 0 (0.0%) | 8 (100.0%) |
| High School Diploma | 25 (75.8%) | 8 (24.2%) |
| College or Associate's Degree | 77 (82.8%) | 16 (17.2%) |
| Bachelor's Degree | 20 (83.3%) | 4 (16.7%) |
| Graduate Degree | 0 (0.0%) | 0 (0.0%) |
| Total | 122 (77.2%) | 36 (22.8%) |
Income in San Juan County
Income Overview in San Juan County
Per Capita Income in San Juan County is $25,591, while median incomes of families and households are $65,568 and $52,108 respectively.
| Characteristic | Number | Measure |
| Per Capita Income | 14,524 | $25,591 |
| Median Family Income | 3,193 | $65,568 |
| Mean Family Income | 3,193 | $86,075 |
| Median Household Income | 4,457 | $52,108 |
| Mean Household Income | 4,457 | $75,391 |
| Income Deficit | 3,193 | $14,583 |
| Wage / Income Gap (%) | 14,524 | 39.87% |
| Wage / Income Gap ($) | 14,524 | 60.13¢ per $1 |
| Gini / Inequality Index | 14,524 | 0.51 |
Earnings by Sex in San Juan County
Average Earnings in San Juan County are $33,104, $42,087 for men and $25,305 for women, a difference of 39.9%.
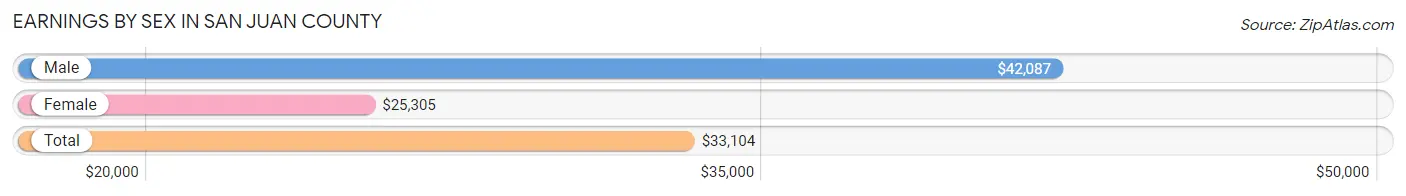
| Sex | Number | Average Earnings |
| Male | 3,306 (54.4%) | $42,087 |
| Female | 2,774 (45.6%) | $25,305 |
| Total | 6,080 (100.0%) | $33,104 |
Earnings by Sex by Income Bracket in San Juan County
The most common earnings brackets in San Juan County are $75,000 to $99,999 for men (415 | 12.6%) and $55,000 to $64,999 for women (239 | 8.6%).
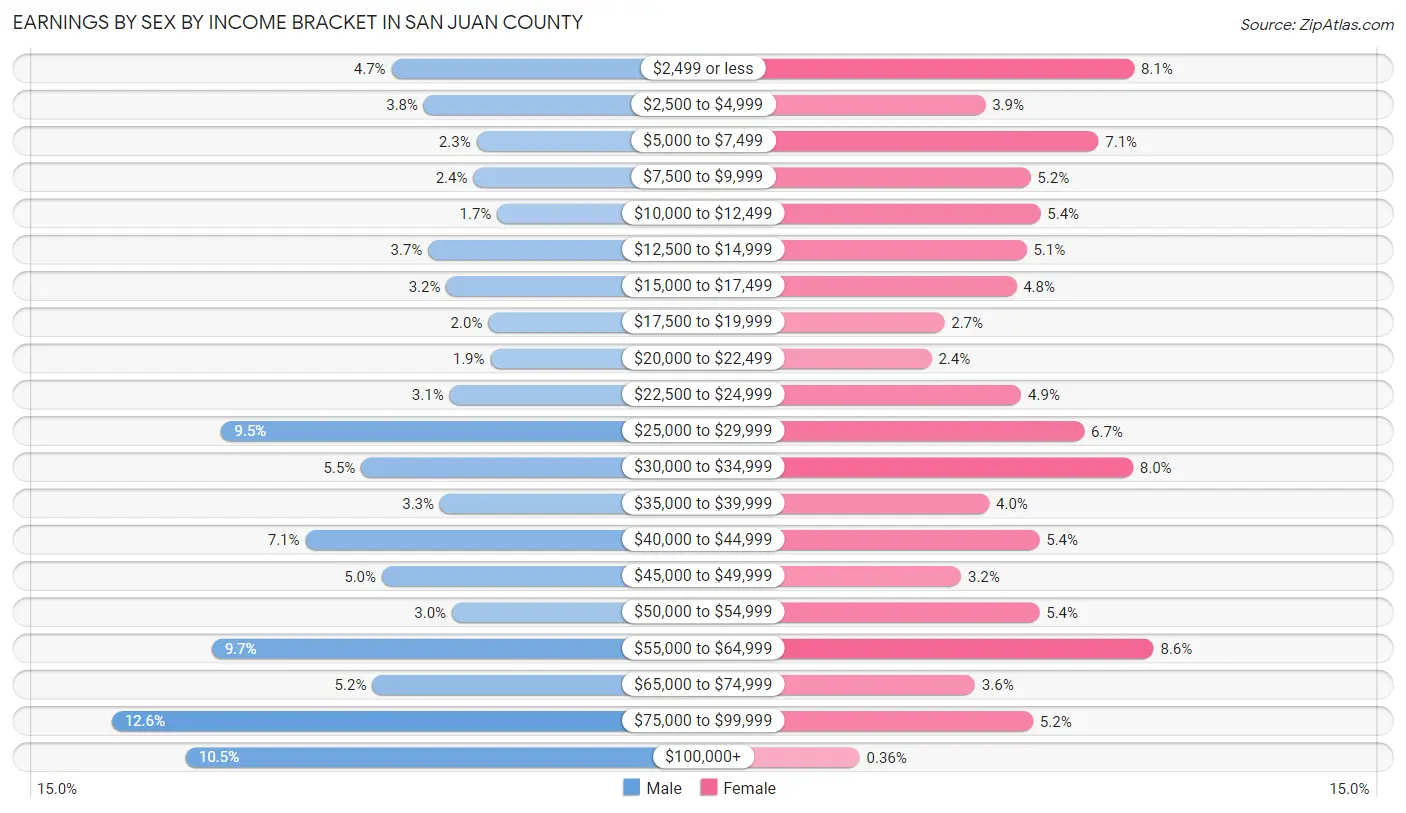
| Income | Male | Female |
| $2,499 or less | 155 (4.7%) | 224 (8.1%) |
| $2,500 to $4,999 | 125 (3.8%) | 108 (3.9%) |
| $5,000 to $7,499 | 76 (2.3%) | 196 (7.1%) |
| $7,500 to $9,999 | 79 (2.4%) | 143 (5.2%) |
| $10,000 to $12,499 | 57 (1.7%) | 151 (5.4%) |
| $12,500 to $14,999 | 121 (3.7%) | 140 (5.1%) |
| $15,000 to $17,499 | 104 (3.2%) | 132 (4.8%) |
| $17,500 to $19,999 | 65 (2.0%) | 76 (2.7%) |
| $20,000 to $22,499 | 63 (1.9%) | 66 (2.4%) |
| $22,500 to $24,999 | 101 (3.1%) | 136 (4.9%) |
| $25,000 to $29,999 | 313 (9.5%) | 185 (6.7%) |
| $30,000 to $34,999 | 183 (5.5%) | 223 (8.0%) |
| $35,000 to $39,999 | 110 (3.3%) | 111 (4.0%) |
| $40,000 to $44,999 | 235 (7.1%) | 150 (5.4%) |
| $45,000 to $49,999 | 164 (5.0%) | 89 (3.2%) |
| $50,000 to $54,999 | 99 (3.0%) | 150 (5.4%) |
| $55,000 to $64,999 | 322 (9.7%) | 239 (8.6%) |
| $65,000 to $74,999 | 173 (5.2%) | 100 (3.6%) |
| $75,000 to $99,999 | 415 (12.6%) | 145 (5.2%) |
| $100,000+ | 346 (10.5%) | 10 (0.4%) |
| Total | 3,306 (100.0%) | 2,774 (100.0%) |
Earnings by Sex by Educational Attainment in San Juan County
Average earnings in San Juan County are $46,815 for men and $31,217 for women, a difference of 33.3%. Men with an educational attainment of graduate degree enjoy the highest average annual earnings of $79,167, while those with high school diploma education earn the least with $40,718. Women with an educational attainment of graduate degree earn the most with the average annual earnings of $57,843, while those with less than high school education have the smallest earnings of $17,938.
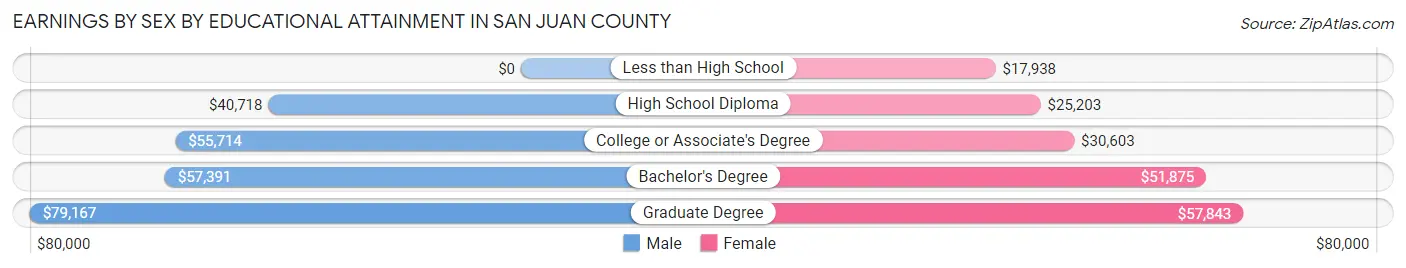
| Educational Attainment | Male Income | Female Income |
| Less than High School | - | - |
| High School Diploma | $40,718 | $25,203 |
| College or Associate's Degree | $55,714 | $30,603 |
| Bachelor's Degree | $57,391 | $51,875 |
| Graduate Degree | $79,167 | $57,843 |
| Total | $46,815 | $31,217 |
Family Income in San Juan County
Family Income Brackets in San Juan County
According to the San Juan County family income data, there are 559 families falling into the $50,000 to $74,999 income range, which is the most common income bracket and makes up 17.5% of all families. Conversely, the less than $10,000 income bracket is the least frequent group with only 156 families (4.9%) belonging to this category.
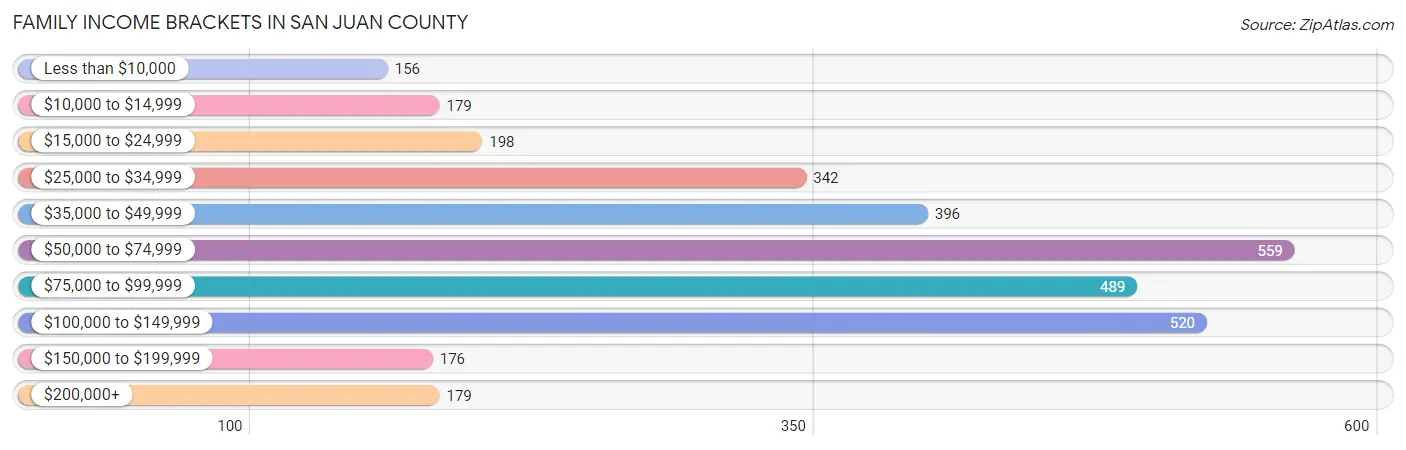
| Income Bracket | # Families | % Families |
| Less than $10,000 | 156 | 4.9% |
| $10,000 to $14,999 | 179 | 5.6% |
| $15,000 to $24,999 | 198 | 6.2% |
| $25,000 to $34,999 | 342 | 10.7% |
| $35,000 to $49,999 | 396 | 12.4% |
| $50,000 to $74,999 | 559 | 17.5% |
| $75,000 to $99,999 | 489 | 15.3% |
| $100,000 to $149,999 | 520 | 16.3% |
| $150,000 to $199,999 | 176 | 5.5% |
| $200,000+ | 179 | 5.6% |
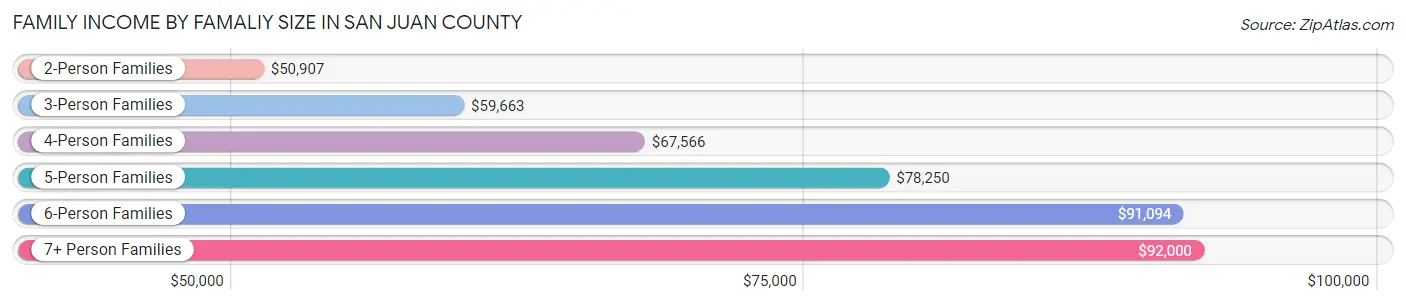
Family Income by Famaliy Size in San Juan County
7+ person families (252 | 7.9%) account for the highest median family income in San Juan County with $92,000 per family, while 2-person families (1,459 | 45.7%) have the highest median income of $25,454 per family member.
| Income Bracket | # Families | Median Income |
| 2-Person Families | 1,459 (45.7%) | $50,907 |
| 3-Person Families | 529 (16.6%) | $59,663 |
| 4-Person Families | 493 (15.4%) | $67,566 |
| 5-Person Families | 251 (7.9%) | $78,250 |
| 6-Person Families | 209 (6.6%) | $91,094 |
| 7+ Person Families | 252 (7.9%) | $92,000 |
| Total | 3,193 (100.0%) | $65,568 |
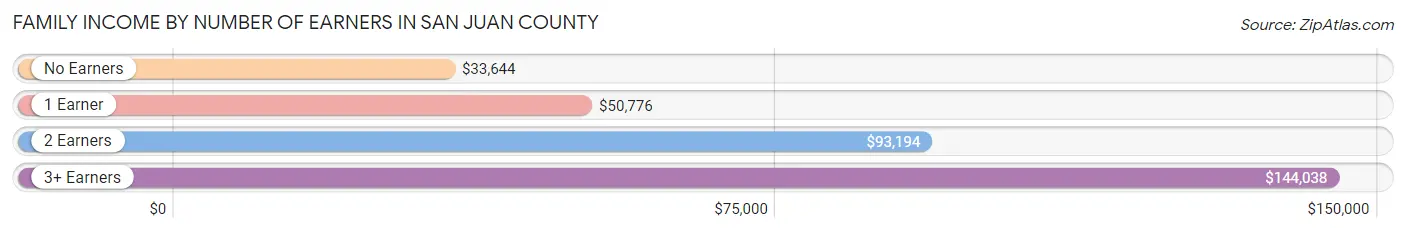
Family Income by Number of Earners in San Juan County
The median family income in San Juan County is $65,568, with families comprising 3+ earners (344) having the highest median family income of $144,038, while families with no earners (755) have the lowest median family income of $33,644, accounting for 10.8% and 23.6% of families, respectively.
| Number of Earners | # Families | Median Income |
| No Earners | 755 (23.6%) | $33,644 |
| 1 Earner | 1,036 (32.5%) | $50,776 |
| 2 Earners | 1,058 (33.1%) | $93,194 |
| 3+ Earners | 344 (10.8%) | $144,038 |
| Total | 3,193 (100.0%) | $65,568 |
Household Income in San Juan County
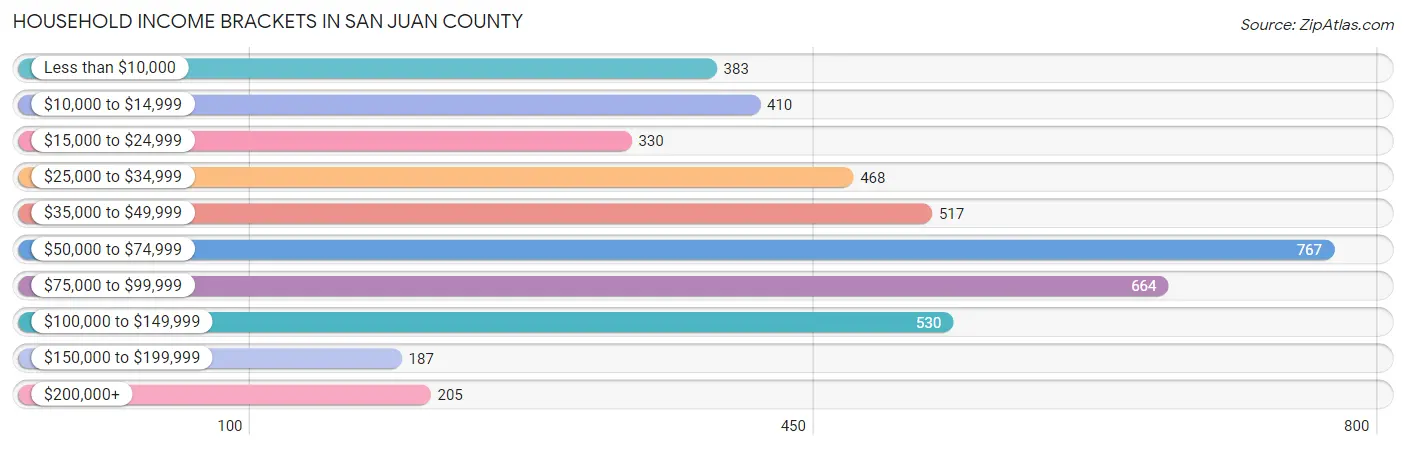
Household Income Brackets in San Juan County
With 767 households falling in the category, the $50,000 to $74,999 income range is the most frequent in San Juan County, accounting for 17.2% of all households. In contrast, only 187 households (4.2%) fall into the $150,000 to $199,999 income bracket, making it the least populous group.
| Income Bracket | # Households | % Households |
| Less than $10,000 | 383 | 8.6% |
| $10,000 to $14,999 | 410 | 9.2% |
| $15,000 to $24,999 | 330 | 7.4% |
| $25,000 to $34,999 | 468 | 10.5% |
| $35,000 to $49,999 | 517 | 11.6% |
| $50,000 to $74,999 | 767 | 17.2% |
| $75,000 to $99,999 | 664 | 14.9% |
| $100,000 to $149,999 | 530 | 11.9% |
| $150,000 to $199,999 | 187 | 4.2% |
| $200,000+ | 205 | 4.6% |
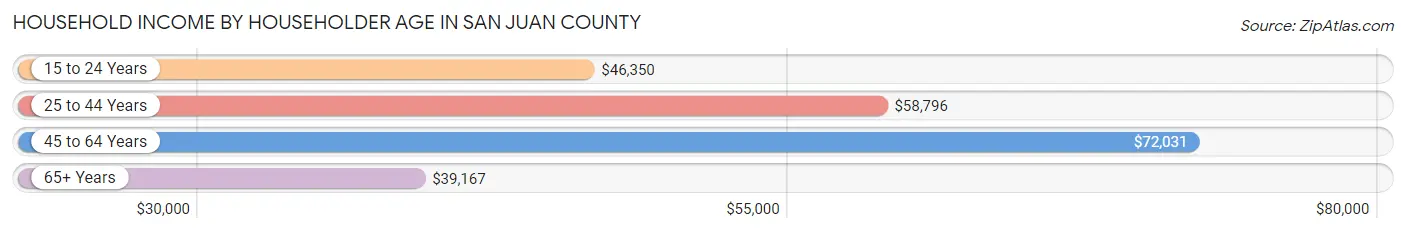
Household Income by Householder Age in San Juan County
The median household income in San Juan County is $52,108, with the highest median household income of $72,031 found in the 45 to 64 years age bracket for the primary householder. A total of 1,764 households (39.6%) fall into this category. Meanwhile, the 65+ years age bracket for the primary householder has the lowest median household income of $39,167, with 1,348 households (30.2%) in this group.
| Income Bracket | # Households | Median Income |
| 15 to 24 Years | 133 (3.0%) | $46,350 |
| 25 to 44 Years | 1,212 (27.2%) | $58,796 |
| 45 to 64 Years | 1,764 (39.6%) | $72,031 |
| 65+ Years | 1,348 (30.2%) | $39,167 |
| Total | 4,457 (100.0%) | $52,108 |
Poverty in San Juan County
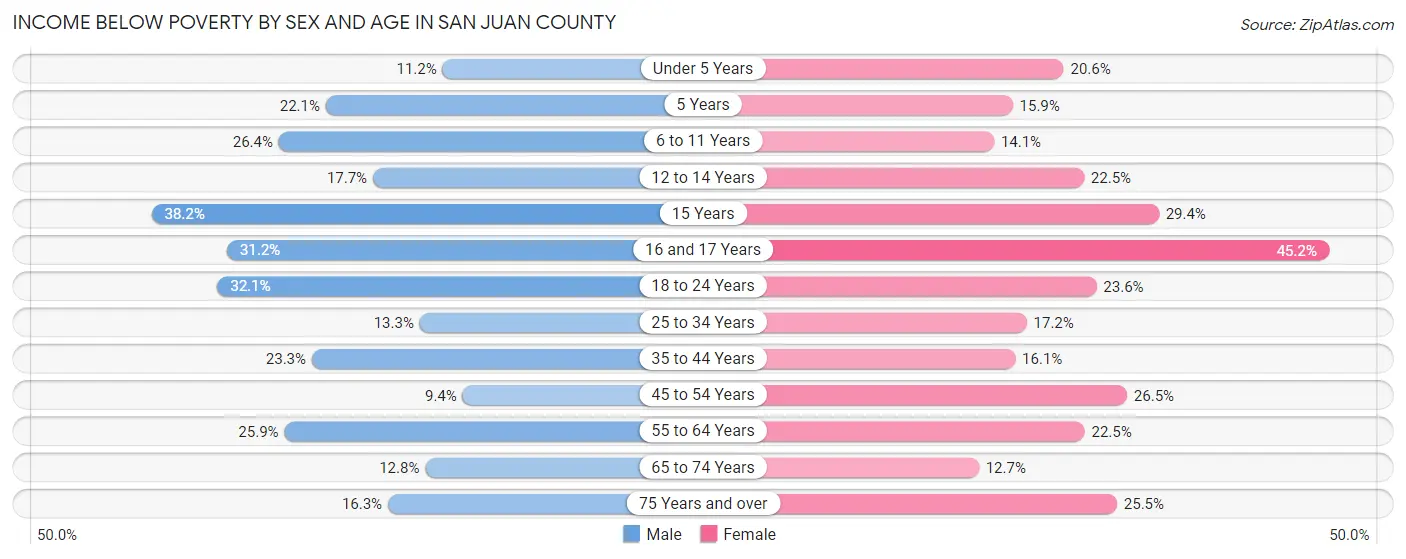
Income Below Poverty by Sex and Age in San Juan County
With 20.3% poverty level for males and 21.0% for females among the residents of San Juan County, 15 year old males and 16 and 17 year old females are the most vulnerable to poverty, with 73 males (38.2%) and 155 females (45.2%) in their respective age groups living below the poverty level.
| Age Bracket | Male | Female |
| Under 5 Years | 52 (11.2%) | 85 (20.6%) |
| 5 Years | 28 (22.1%) | 13 (15.9%) |
| 6 to 11 Years | 201 (26.4%) | 120 (14.1%) |
| 12 to 14 Years | 50 (17.7%) | 60 (22.5%) |
| 15 Years | 73 (38.2%) | 25 (29.4%) |
| 16 and 17 Years | 69 (31.2%) | 155 (45.2%) |
| 18 to 24 Years | 236 (32.1%) | 164 (23.6%) |
| 25 to 34 Years | 125 (13.3%) | 137 (17.2%) |
| 35 to 44 Years | 179 (23.3%) | 126 (16.1%) |
| 45 to 54 Years | 75 (9.3%) | 199 (26.5%) |
| 55 to 64 Years | 203 (25.9%) | 201 (22.5%) |
| 65 to 74 Years | 76 (12.8%) | 82 (12.7%) |
| 75 Years and over | 70 (16.3%) | 133 (25.5%) |
| Total | 1,437 (20.3%) | 1,500 (21.0%) |
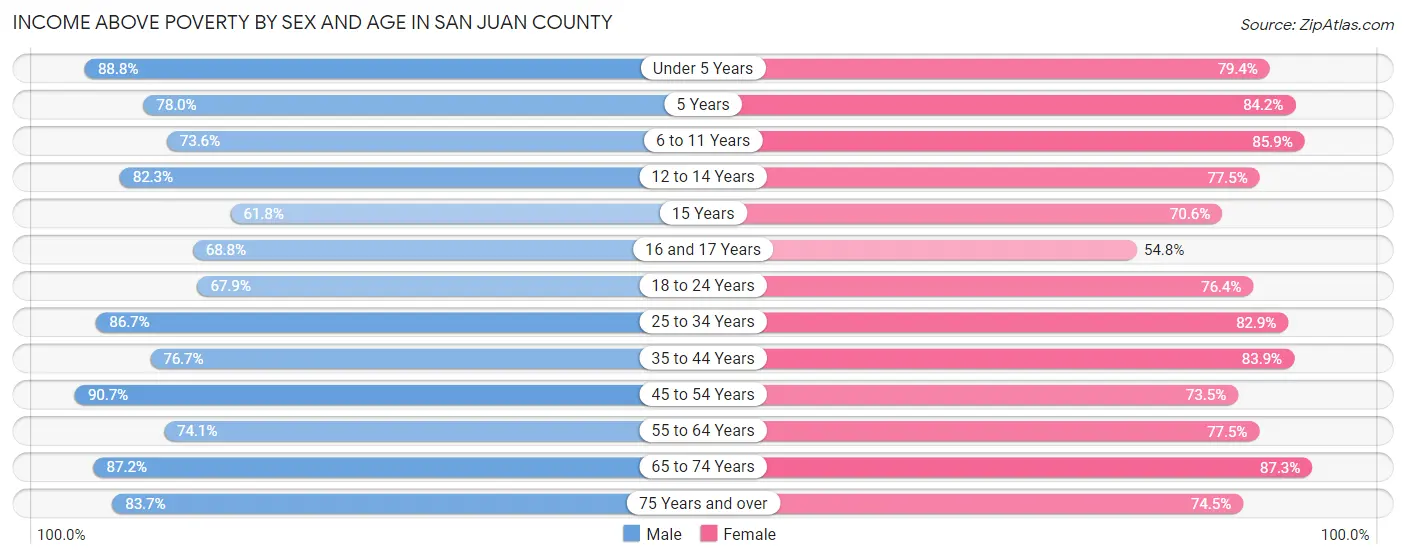
Income Above Poverty by Sex and Age in San Juan County
According to the poverty statistics in San Juan County, males aged 45 to 54 years and females aged 65 to 74 years are the age groups that are most secure financially, with 90.6% of males and 87.3% of females in these age groups living above the poverty line.
| Age Bracket | Male | Female |
| Under 5 Years | 412 (88.8%) | 328 (79.4%) |
| 5 Years | 99 (77.9%) | 69 (84.2%) |
| 6 to 11 Years | 560 (73.6%) | 730 (85.9%) |
| 12 to 14 Years | 233 (82.3%) | 207 (77.5%) |
| 15 Years | 118 (61.8%) | 60 (70.6%) |
| 16 and 17 Years | 152 (68.8%) | 188 (54.8%) |
| 18 to 24 Years | 499 (67.9%) | 530 (76.4%) |
| 25 to 34 Years | 813 (86.7%) | 662 (82.9%) |
| 35 to 44 Years | 588 (76.7%) | 657 (83.9%) |
| 45 to 54 Years | 727 (90.6%) | 553 (73.5%) |
| 55 to 64 Years | 581 (74.1%) | 691 (77.5%) |
| 65 to 74 Years | 517 (87.2%) | 563 (87.3%) |
| 75 Years and over | 360 (83.7%) | 388 (74.5%) |
| Total | 5,659 (79.7%) | 5,626 (78.9%) |
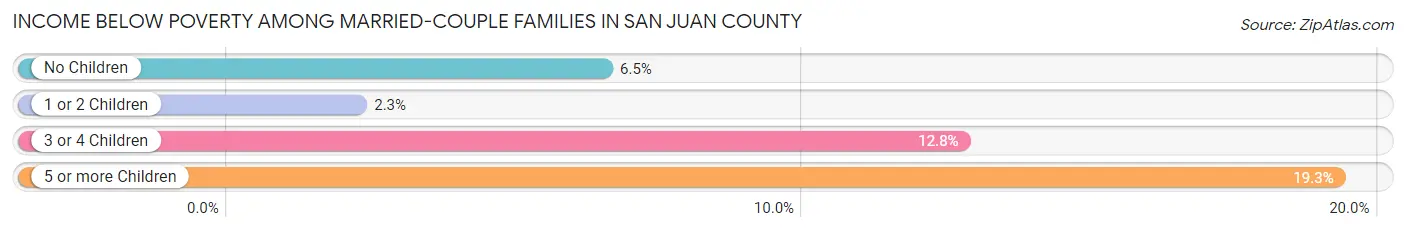
Income Below Poverty Among Married-Couple Families in San Juan County
The poverty statistics for married-couple families in San Juan County show that 7.0% or 163 of the total 2,318 families live below the poverty line. Families with 5 or more children have the highest poverty rate of 19.3%, comprising of 16 families. On the other hand, families with 1 or 2 children have the lowest poverty rate of 2.2%, which includes 11 families.
| Children | Above Poverty | Below Poverty |
| No Children | 1,302 (93.5%) | 91 (6.5%) |
| 1 or 2 Children | 478 (97.8%) | 11 (2.2%) |
| 3 or 4 Children | 308 (87.3%) | 45 (12.8%) |
| 5 or more Children | 67 (80.7%) | 16 (19.3%) |
| Total | 2,155 (93.0%) | 163 (7.0%) |
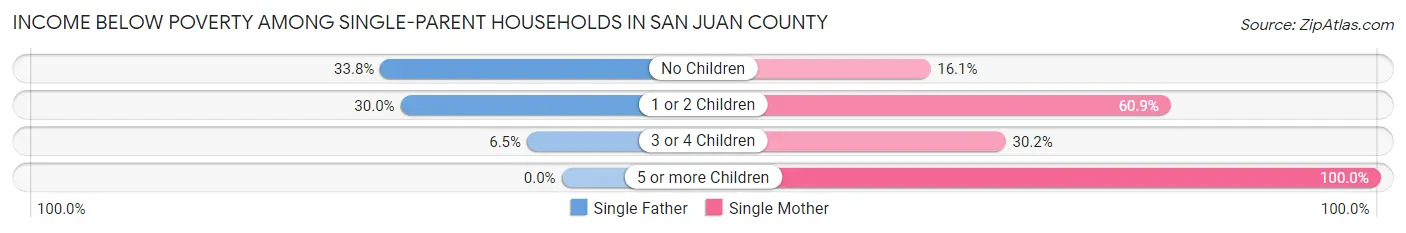
Income Below Poverty Among Single-Parent Households in San Juan County
According to the poverty data in San Juan County, 27.8% or 55 single-father households and 36.6% or 248 single-mother households are living below the poverty line. Among single-father households, those with no children have the highest poverty rate, with 26 households (33.8%) experiencing poverty. Likewise, among single-mother households, those with 5 or more children have the highest poverty rate, with 13 households (100.0%) falling below the poverty line.
| Children | Single Father | Single Mother |
| No Children | 26 (33.8%) | 46 (16.1%) |
| 1 or 2 Children | 27 (30.0%) | 148 (60.9%) |
| 3 or 4 Children | 2 (6.5%) | 41 (30.1%) |
| 5 or more Children | 0 (0.0%) | 13 (100.0%) |
| Total | 55 (27.8%) | 248 (36.6%) |
Income Below Poverty Among Married-Couple vs Single-Parent Households in San Juan County
The poverty data for San Juan County shows that 163 of the married-couple family households (7.0%) and 303 of the single-parent households (34.6%) are living below the poverty level. Within the married-couple family households, those with 5 or more children have the highest poverty rate, with 16 households (19.3%) falling below the poverty line. Among the single-parent households, those with 5 or more children have the highest poverty rate, with 13 household (100.0%) living below poverty.
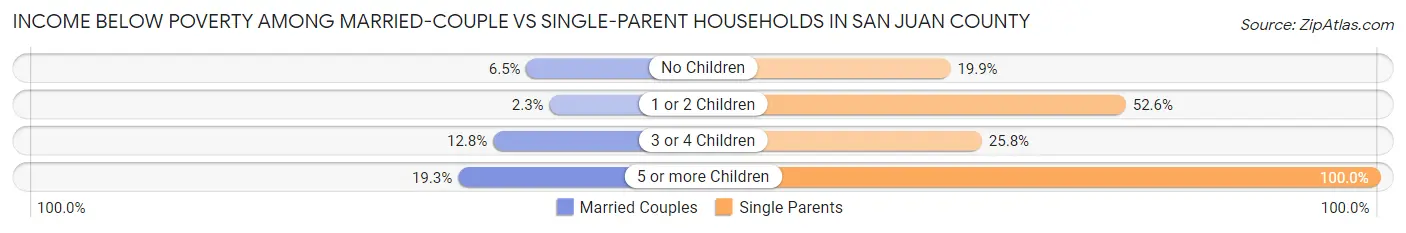
| Children | Married-Couple Families | Single-Parent Households |
| No Children | 91 (6.5%) | 72 (19.9%) |
| 1 or 2 Children | 11 (2.2%) | 175 (52.5%) |
| 3 or 4 Children | 45 (12.8%) | 43 (25.8%) |
| 5 or more Children | 16 (19.3%) | 13 (100.0%) |
| Total | 163 (7.0%) | 303 (34.6%) |
Employment Characteristics in San Juan County
Employment by Class of Employer in San Juan County
Among the 5,156 employed individuals in San Juan County, private company employees (2,611 | 50.6%), state government employees (678 | 13.2%), and local government employees (652 | 12.7%) make up the most common classes of employment.
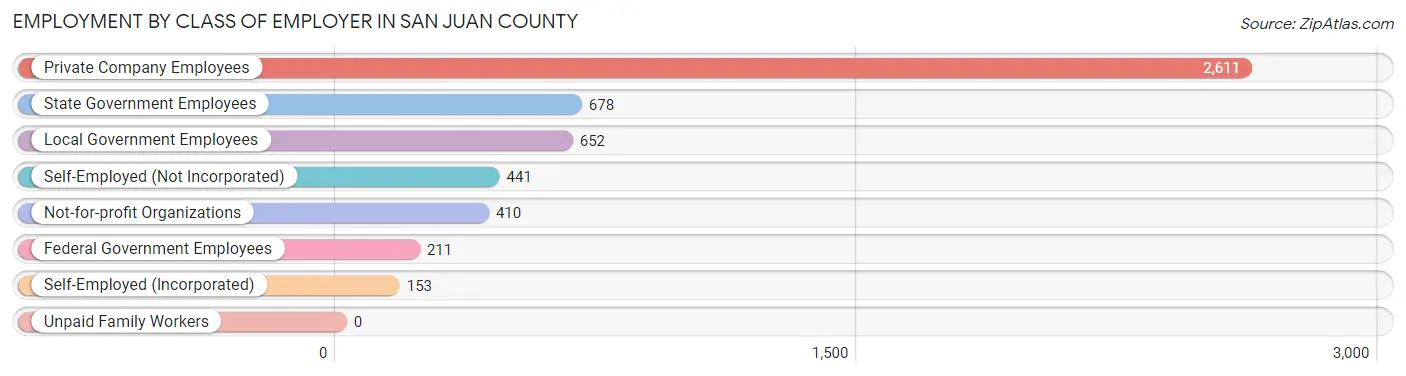
| Employer Class | # Employees | % Employees |
| Private Company Employees | 2,611 | 50.6% |
| Self-Employed (Incorporated) | 153 | 3.0% |
| Self-Employed (Not Incorporated) | 441 | 8.6% |
| Not-for-profit Organizations | 410 | 8.0% |
| Local Government Employees | 652 | 12.7% |
| State Government Employees | 678 | 13.2% |
| Federal Government Employees | 211 | 4.1% |
| Unpaid Family Workers | 0 | 0.0% |
| Total | 5,156 | 100.0% |
Employment Status by Age in San Juan County
According to the labor force statistics for San Juan County, out of the total population over 16 years of age (10,996), 54.1% or 5,949 individuals are in the labor force, with 12.1% or 720 of them unemployed. The age group with the highest labor force participation rate is 35 to 44 years, with 80.2% or 1,270 individuals in the labor force. Within the labor force, the 16 to 19 years age range has the highest percentage of unemployed individuals, with 42.6% or 156 of them being unemployed.
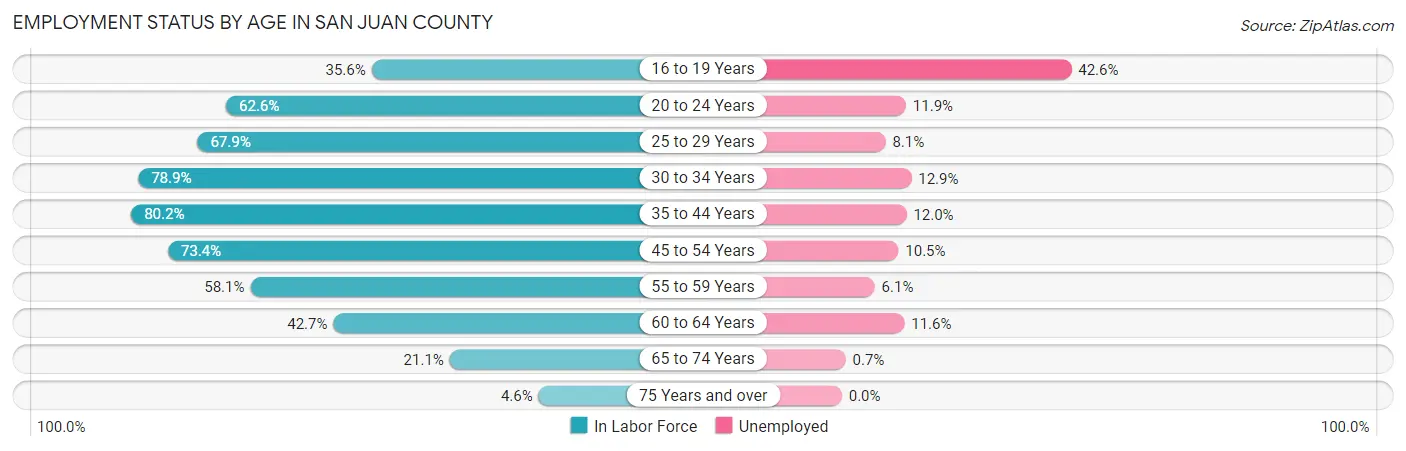
| Age Bracket | In Labor Force | Unemployed |
| 16 to 19 Years | 366 (35.6%) | 156 (42.6%) |
| 20 to 24 Years | 664 (62.6%) | 79 (11.9%) |
| 25 to 29 Years | 663 (67.9%) | 54 (8.1%) |
| 30 to 34 Years | 653 (78.9%) | 84 (12.9%) |
| 35 to 44 Years | 1,270 (80.2%) | 152 (12.0%) |
| 45 to 54 Years | 1,144 (73.4%) | 120 (10.5%) |
| 55 to 59 Years | 543 (58.1%) | 33 (6.1%) |
| 60 to 64 Years | 329 (42.7%) | 38 (11.6%) |
| 65 to 74 Years | 268 (21.1%) | 2 (0.7%) |
| 75 Years and over | 45 (4.6%) | 0 (0.0%) |
| Total | 5,949 (54.1%) | 720 (12.1%) |
Employment Status by Educational Attainment in San Juan County
According to labor force statistics for San Juan County, 69.2% of individuals (4,603) out of the total population between 25 and 64 years of age (6,652) are in the labor force, with 10.5% or 483 of them being unemployed. The group with the highest labor force participation rate are those with the educational attainment of bachelor's degree or higher, with 76.7% or 871 individuals in the labor force. Within the labor force, individuals with less than high school education have the highest percentage of unemployment, with 20.6% or 51 of them being unemployed.
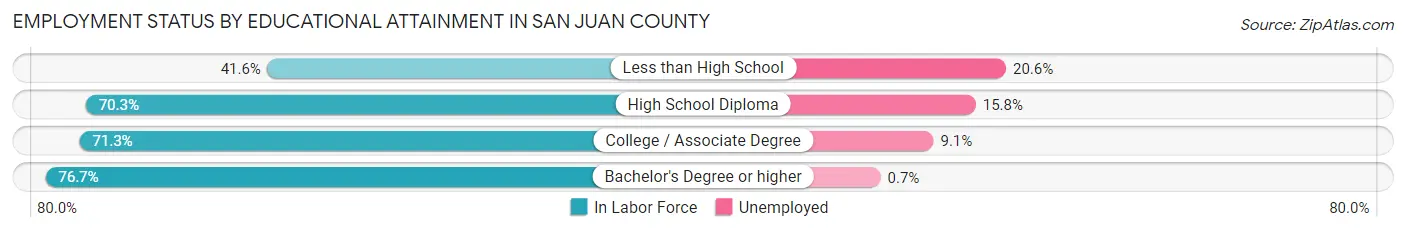
| Educational Attainment | In Labor Force | Unemployed |
| Less than High School | 247 (41.6%) | 122 (20.6%) |
| High School Diploma | 1,596 (70.3%) | 359 (15.8%) |
| College / Associate Degree | 1,891 (71.3%) | 241 (9.1%) |
| Bachelor's Degree or higher | 871 (76.7%) | 8 (0.7%) |
| Total | 4,603 (69.2%) | 698 (10.5%) |
Employment Occupations by Sex in San Juan County
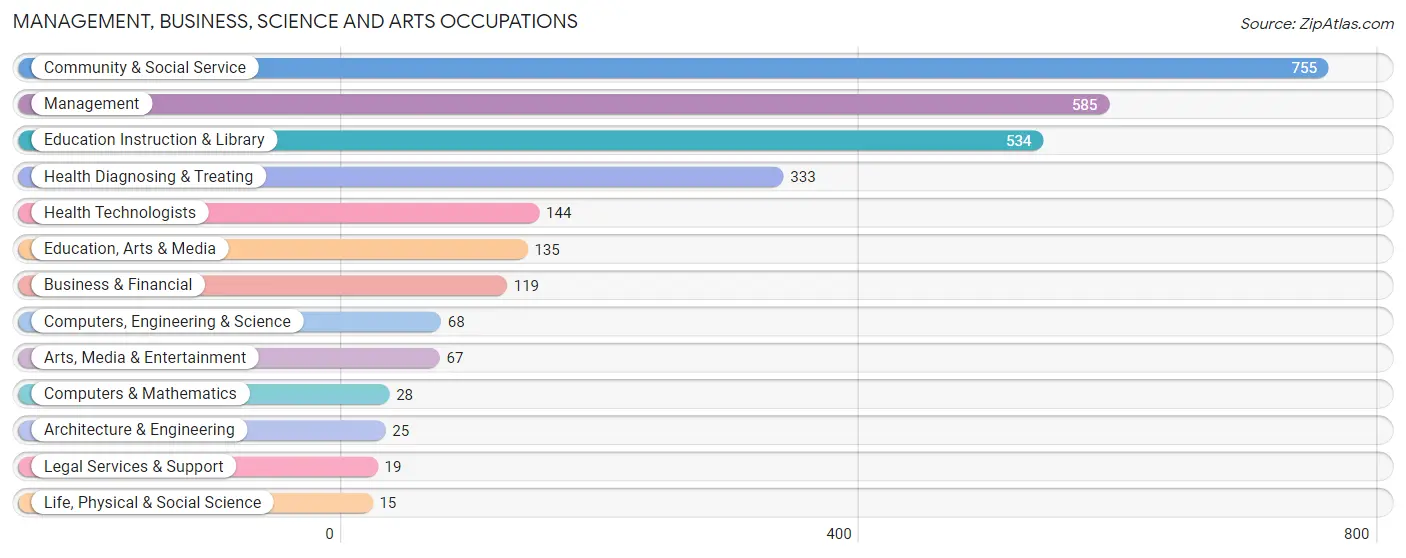
Management, Business, Science and Arts Occupations
The most common Management, Business, Science and Arts occupations in San Juan County are Community & Social Service (755 | 14.4%), Management (585 | 11.2%), Education Instruction & Library (534 | 10.2%), Health Diagnosing & Treating (333 | 6.4%), and Health Technologists (144 | 2.8%).
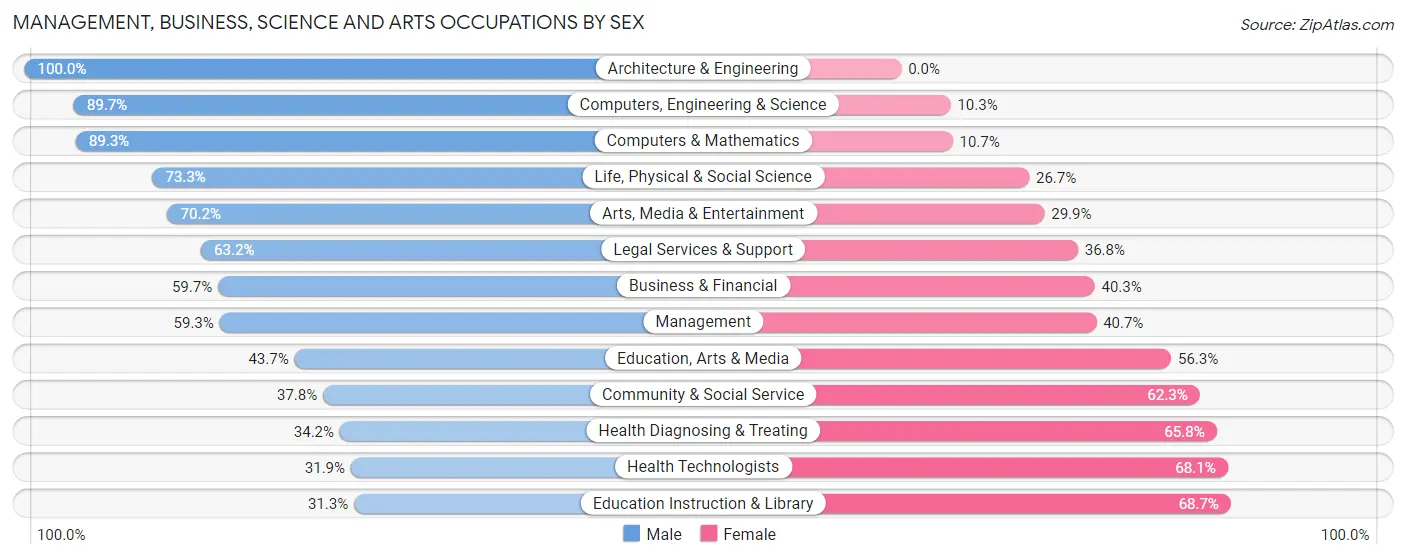
Management, Business, Science and Arts Occupations by Sex
Within the Management, Business, Science and Arts occupations in San Juan County, the most male-oriented occupations are Architecture & Engineering (100.0%), Computers, Engineering & Science (89.7%), and Computers & Mathematics (89.3%), while the most female-oriented occupations are Education Instruction & Library (68.7%), Health Technologists (68.1%), and Health Diagnosing & Treating (65.8%).
| Occupation | Male | Female |
| Management | 347 (59.3%) | 238 (40.7%) |
| Business & Financial | 71 (59.7%) | 48 (40.3%) |
| Computers, Engineering & Science | 61 (89.7%) | 7 (10.3%) |
| Computers & Mathematics | 25 (89.3%) | 3 (10.7%) |
| Architecture & Engineering | 25 (100.0%) | 0 (0.0%) |
| Life, Physical & Social Science | 11 (73.3%) | 4 (26.7%) |
| Community & Social Service | 285 (37.8%) | 470 (62.3%) |
| Education, Arts & Media | 59 (43.7%) | 76 (56.3%) |
| Legal Services & Support | 12 (63.2%) | 7 (36.8%) |
| Education Instruction & Library | 167 (31.3%) | 367 (68.7%) |
| Arts, Media & Entertainment | 47 (70.2%) | 20 (29.8%) |
| Health Diagnosing & Treating | 114 (34.2%) | 219 (65.8%) |
| Health Technologists | 46 (31.9%) | 98 (68.1%) |
| Total (Category) | 878 (47.2%) | 982 (52.8%) |
| Total (Overall) | 2,847 (54.5%) | 2,377 (45.5%) |
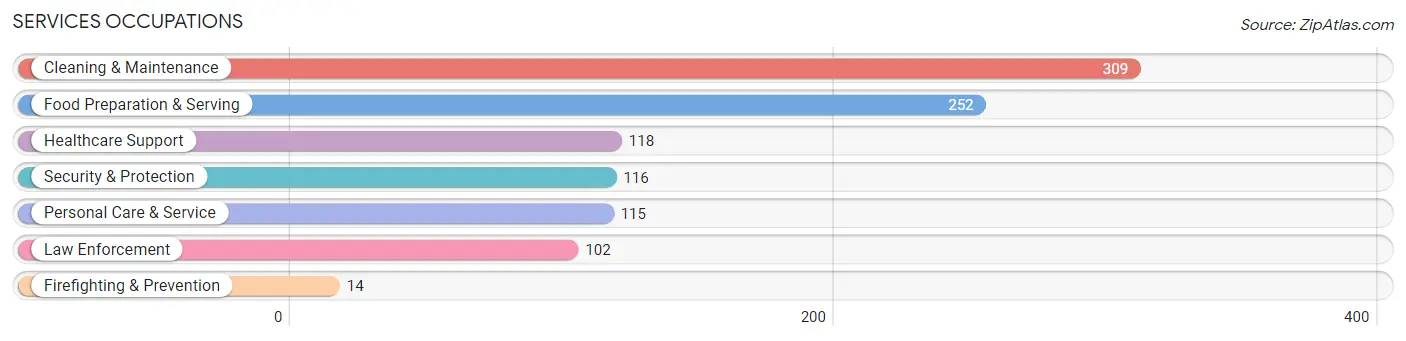
Services Occupations
The most common Services occupations in San Juan County are Cleaning & Maintenance (309 | 5.9%), Food Preparation & Serving (252 | 4.8%), Healthcare Support (118 | 2.3%), Security & Protection (116 | 2.2%), and Personal Care & Service (115 | 2.2%).
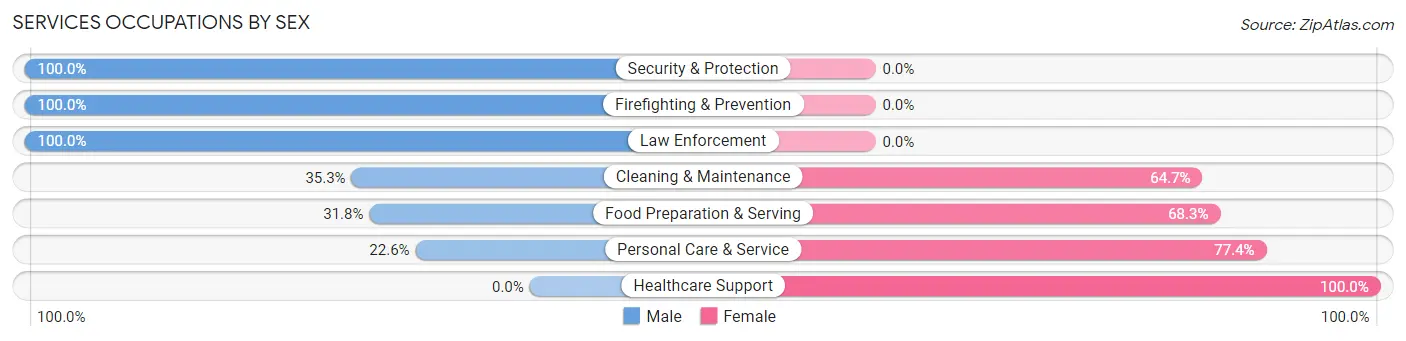
Services Occupations by Sex
Within the Services occupations in San Juan County, the most male-oriented occupations are Security & Protection (100.0%), Firefighting & Prevention (100.0%), and Law Enforcement (100.0%), while the most female-oriented occupations are Healthcare Support (100.0%), Personal Care & Service (77.4%), and Food Preparation & Serving (68.2%).
| Occupation | Male | Female |
| Healthcare Support | 0 (0.0%) | 118 (100.0%) |
| Security & Protection | 116 (100.0%) | 0 (0.0%) |
| Firefighting & Prevention | 14 (100.0%) | 0 (0.0%) |
| Law Enforcement | 102 (100.0%) | 0 (0.0%) |
| Food Preparation & Serving | 80 (31.8%) | 172 (68.2%) |
| Cleaning & Maintenance | 109 (35.3%) | 200 (64.7%) |
| Personal Care & Service | 26 (22.6%) | 89 (77.4%) |
| Total (Category) | 331 (36.4%) | 579 (63.6%) |
| Total (Overall) | 2,847 (54.5%) | 2,377 (45.5%) |
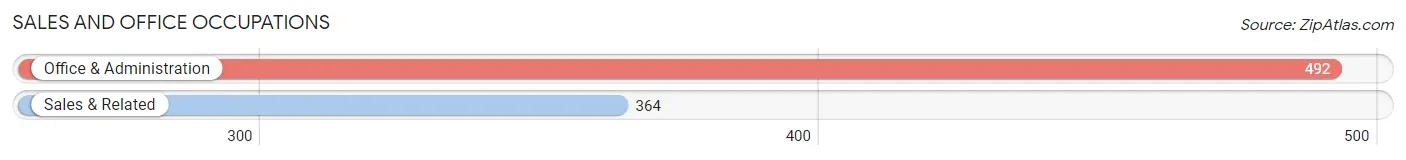
Sales and Office Occupations
The most common Sales and Office occupations in San Juan County are Office & Administration (492 | 9.4%), and Sales & Related (364 | 7.0%).
Sales and Office Occupations by Sex
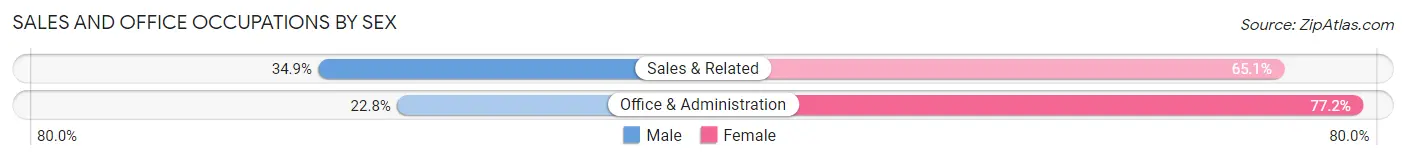
| Occupation | Male | Female |
| Sales & Related | 127 (34.9%) | 237 (65.1%) |
| Office & Administration | 112 (22.8%) | 380 (77.2%) |
| Total (Category) | 239 (27.9%) | 617 (72.1%) |
| Total (Overall) | 2,847 (54.5%) | 2,377 (45.5%) |
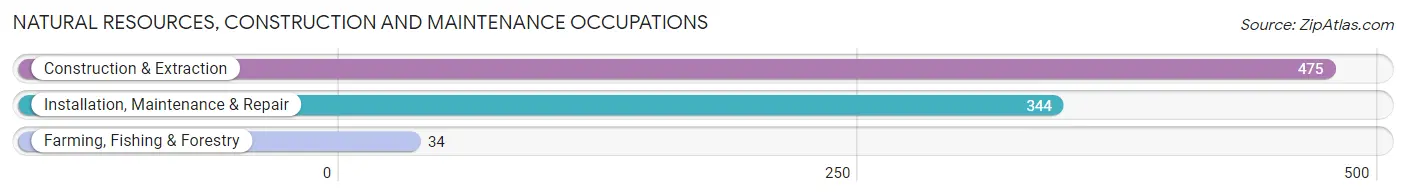
Natural Resources, Construction and Maintenance Occupations
The most common Natural Resources, Construction and Maintenance occupations in San Juan County are Construction & Extraction (475 | 9.1%), Installation, Maintenance & Repair (344 | 6.6%), and Farming, Fishing & Forestry (34 | 0.6%).
Natural Resources, Construction and Maintenance Occupations by Sex
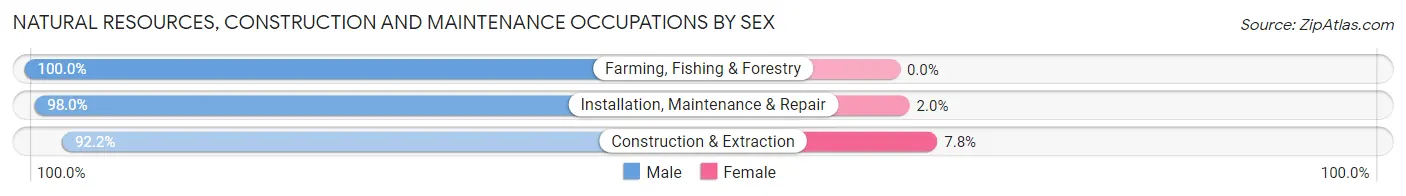
| Occupation | Male | Female |
| Farming, Fishing & Forestry | 34 (100.0%) | 0 (0.0%) |
| Construction & Extraction | 438 (92.2%) | 37 (7.8%) |
| Installation, Maintenance & Repair | 337 (98.0%) | 7 (2.0%) |
| Total (Category) | 809 (94.8%) | 44 (5.2%) |
| Total (Overall) | 2,847 (54.5%) | 2,377 (45.5%) |
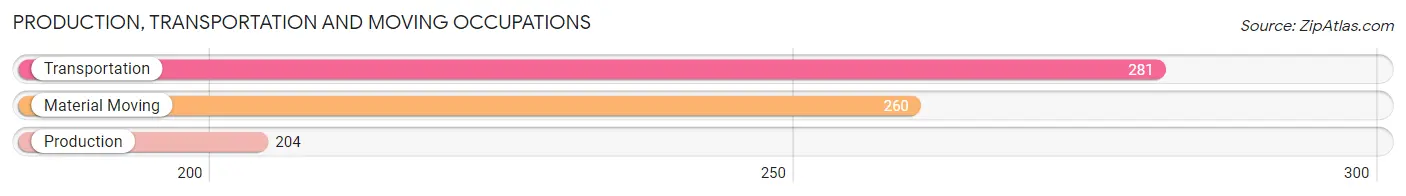
Production, Transportation and Moving Occupations
The most common Production, Transportation and Moving occupations in San Juan County are Transportation (281 | 5.4%), Material Moving (260 | 5.0%), and Production (204 | 3.9%).
Production, Transportation and Moving Occupations by Sex
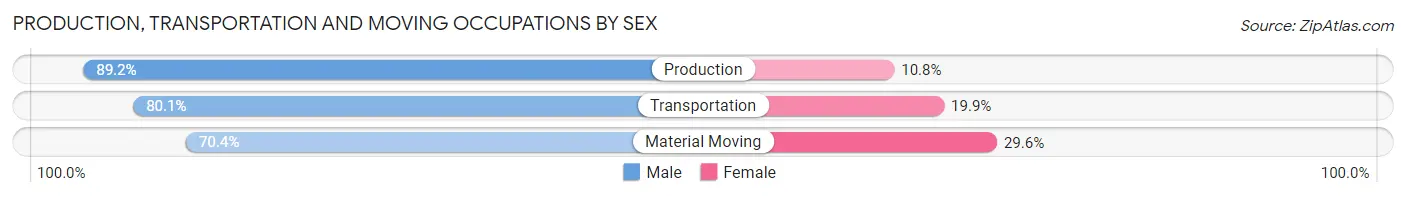
| Occupation | Male | Female |
| Production | 182 (89.2%) | 22 (10.8%) |
| Transportation | 225 (80.1%) | 56 (19.9%) |
| Material Moving | 183 (70.4%) | 77 (29.6%) |
| Total (Category) | 590 (79.2%) | 155 (20.8%) |
| Total (Overall) | 2,847 (54.5%) | 2,377 (45.5%) |
Employment Industries by Sex in San Juan County
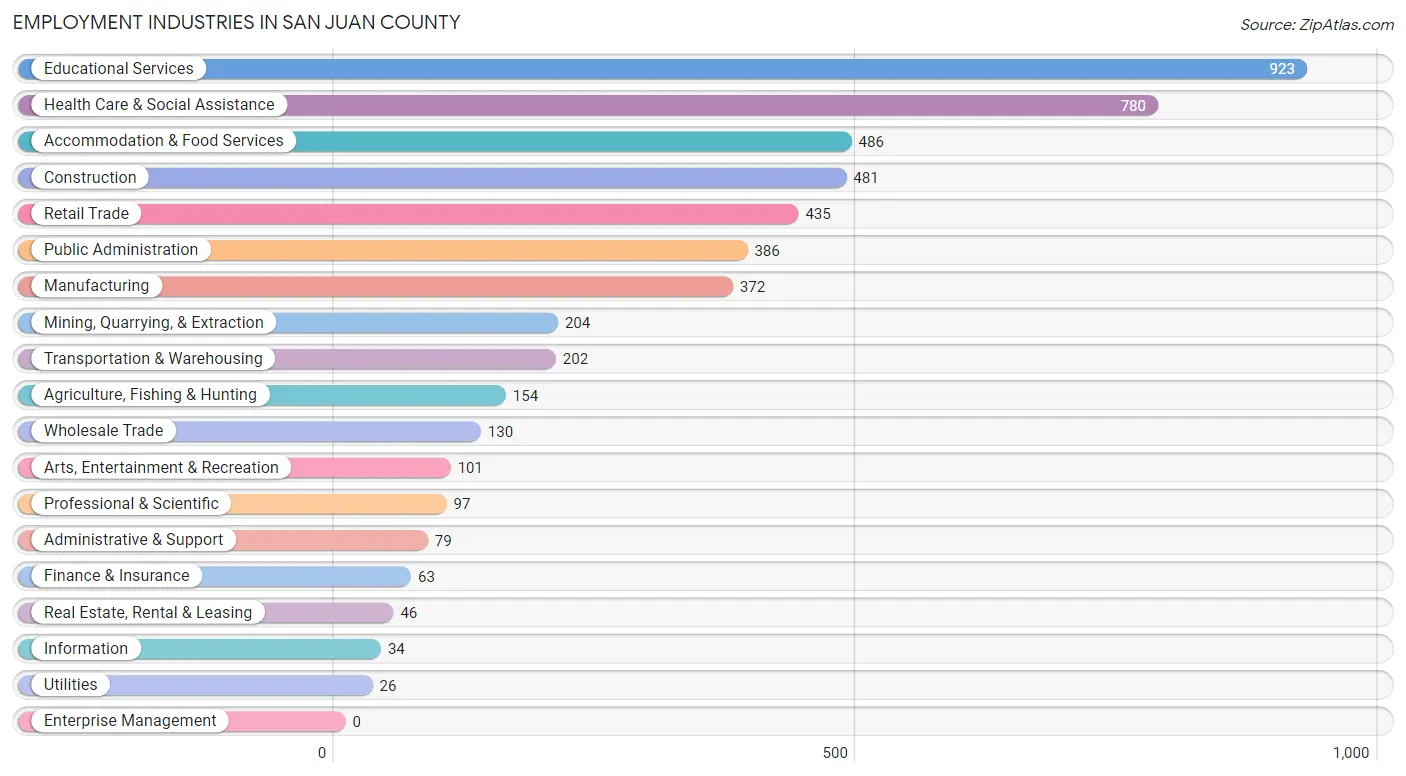
Employment Industries in San Juan County
The major employment industries in San Juan County include Educational Services (923 | 17.7%), Health Care & Social Assistance (780 | 14.9%), Accommodation & Food Services (486 | 9.3%), Construction (481 | 9.2%), and Retail Trade (435 | 8.3%).
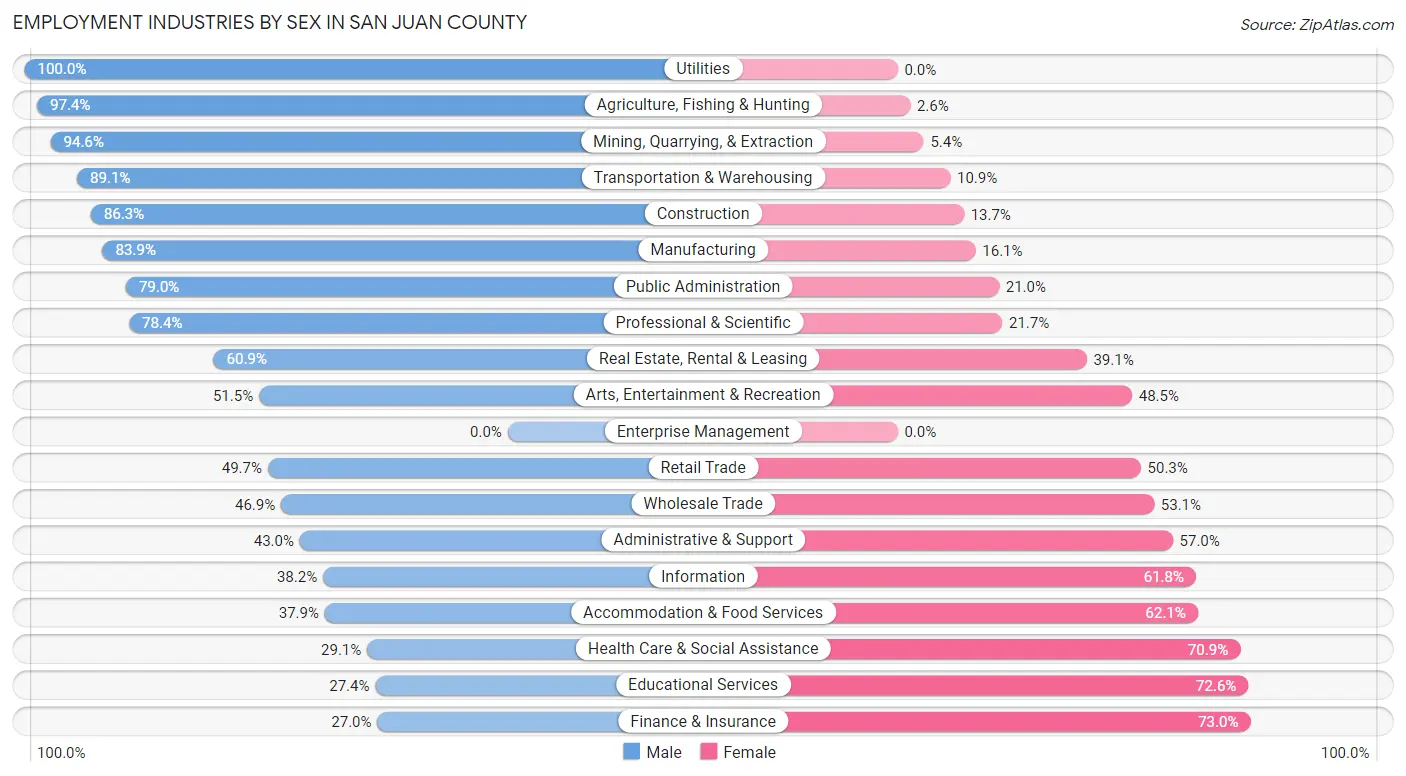
Employment Industries by Sex in San Juan County
The San Juan County industries that see more men than women are Utilities (100.0%), Agriculture, Fishing & Hunting (97.4%), and Mining, Quarrying, & Extraction (94.6%), whereas the industries that tend to have a higher number of women are Finance & Insurance (73.0%), Educational Services (72.6%), and Health Care & Social Assistance (70.9%).
| Industry | Male | Female |
| Agriculture, Fishing & Hunting | 150 (97.4%) | 4 (2.6%) |
| Mining, Quarrying, & Extraction | 193 (94.6%) | 11 (5.4%) |
| Construction | 415 (86.3%) | 66 (13.7%) |
| Manufacturing | 312 (83.9%) | 60 (16.1%) |
| Wholesale Trade | 61 (46.9%) | 69 (53.1%) |
| Retail Trade | 216 (49.7%) | 219 (50.3%) |
| Transportation & Warehousing | 180 (89.1%) | 22 (10.9%) |
| Utilities | 26 (100.0%) | 0 (0.0%) |
| Information | 13 (38.2%) | 21 (61.8%) |
| Finance & Insurance | 17 (27.0%) | 46 (73.0%) |
| Real Estate, Rental & Leasing | 28 (60.9%) | 18 (39.1%) |
| Professional & Scientific | 76 (78.3%) | 21 (21.6%) |
| Enterprise Management | 0 (0.0%) | 0 (0.0%) |
| Administrative & Support | 34 (43.0%) | 45 (57.0%) |
| Educational Services | 253 (27.4%) | 670 (72.6%) |
| Health Care & Social Assistance | 227 (29.1%) | 553 (70.9%) |
| Arts, Entertainment & Recreation | 52 (51.5%) | 49 (48.5%) |
| Accommodation & Food Services | 184 (37.9%) | 302 (62.1%) |
| Public Administration | 305 (79.0%) | 81 (21.0%) |
| Total | 2,847 (54.5%) | 2,377 (45.5%) |
Education in San Juan County
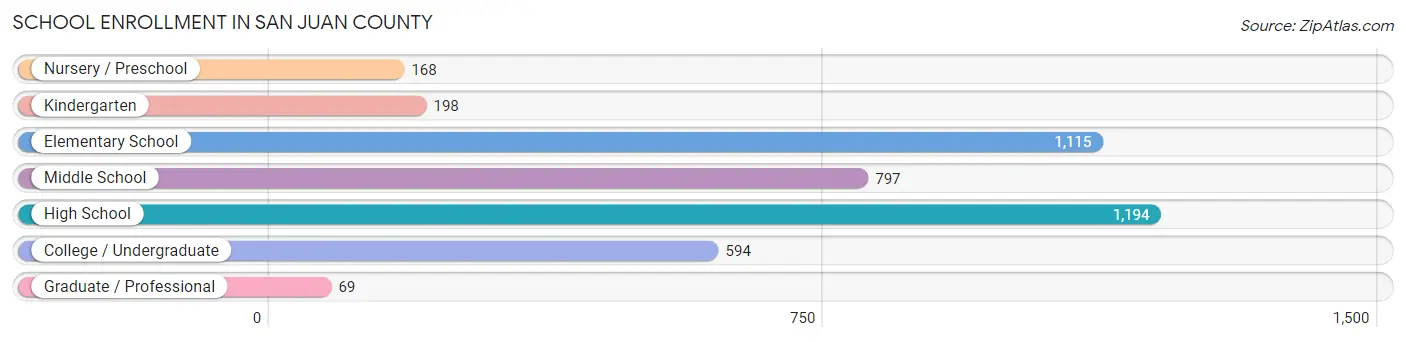
School Enrollment in San Juan County
The most common levels of schooling among the 4,135 students in San Juan County are high school (1,194 | 28.9%), elementary school (1,115 | 27.0%), and middle school (797 | 19.3%).
| School Level | # Students | % Students |
| Nursery / Preschool | 168 | 4.1% |
| Kindergarten | 198 | 4.8% |
| Elementary School | 1,115 | 27.0% |
| Middle School | 797 | 19.3% |
| High School | 1,194 | 28.9% |
| College / Undergraduate | 594 | 14.4% |
| Graduate / Professional | 69 | 1.7% |
| Total | 4,135 | 100.0% |
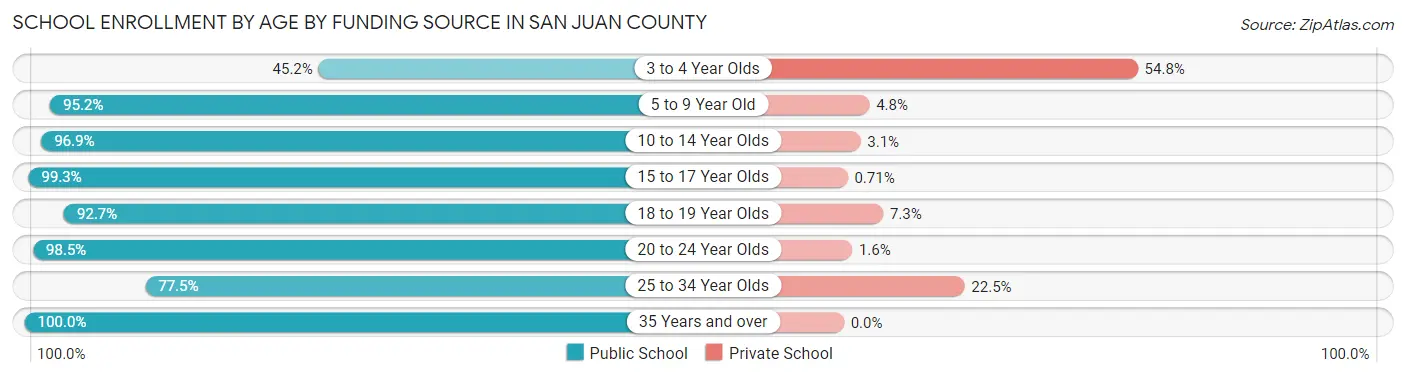
School Enrollment by Age by Funding Source in San Juan County
Out of a total of 4,135 students who are enrolled in schools in San Juan County, 219 (5.3%) attend a private institution, while the remaining 3,916 (94.7%) are enrolled in public schools. The age group of 3 to 4 year olds has the highest likelihood of being enrolled in private schools, with 46 (54.8% in the age bracket) enrolled. Conversely, the age group of 35 years and over has the lowest likelihood of being enrolled in a private school, with 82 (100.0% in the age bracket) attending a public institution.
| Age Bracket | Public School | Private School |
| 3 to 4 Year Olds | 38 (45.2%) | 46 (54.8%) |
| 5 to 9 Year Old | 1,221 (95.2%) | 61 (4.8%) |
| 10 to 14 Year Olds | 965 (96.9%) | 31 (3.1%) |
| 15 to 17 Year Olds | 839 (99.3%) | 6 (0.7%) |
| 18 to 19 Year Olds | 291 (92.7%) | 23 (7.3%) |
| 20 to 24 Year Olds | 318 (98.5%) | 5 (1.5%) |
| 25 to 34 Year Olds | 162 (77.5%) | 47 (22.5%) |
| 35 Years and over | 82 (100.0%) | 0 (0.0%) |
| Total | 3,916 (94.7%) | 219 (5.3%) |
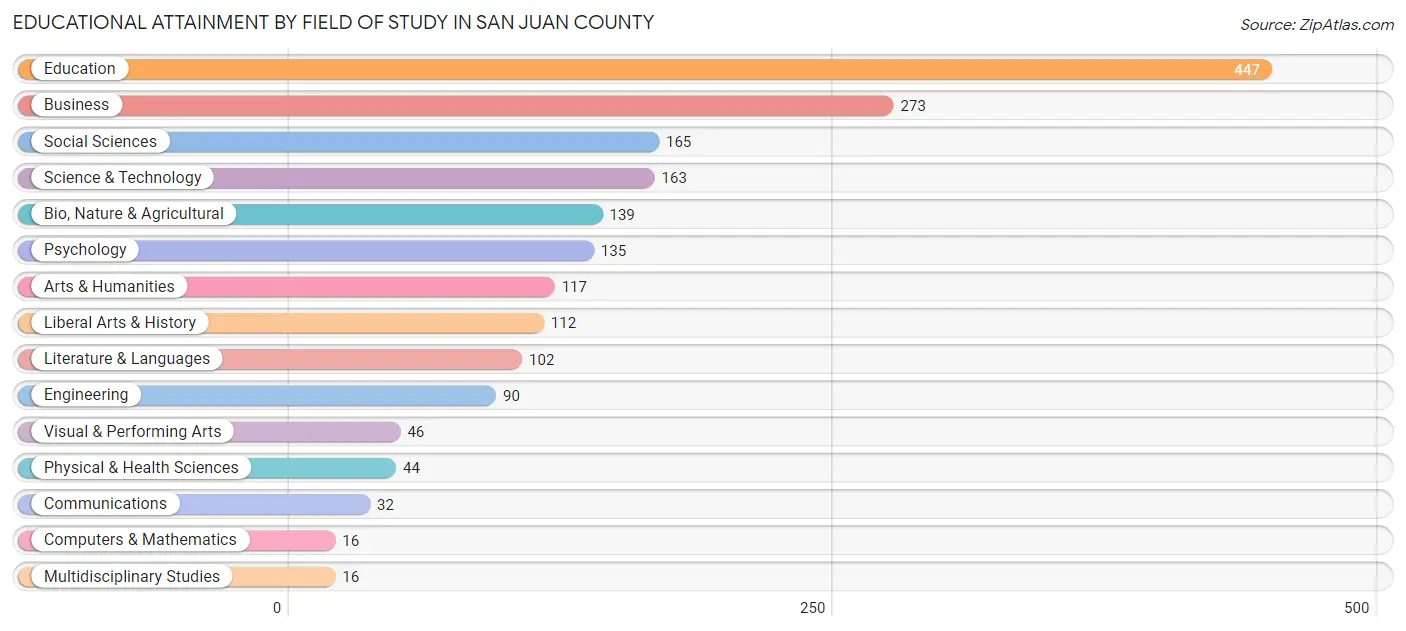
Educational Attainment by Field of Study in San Juan County
Education (447 | 23.6%), business (273 | 14.4%), social sciences (165 | 8.7%), science & technology (163 | 8.6%), and bio, nature & agricultural (139 | 7.3%) are the most common fields of study among 1,897 individuals in San Juan County who have obtained a bachelor's degree or higher.
| Field of Study | # Graduates | % Graduates |
| Computers & Mathematics | 16 | 0.8% |
| Bio, Nature & Agricultural | 139 | 7.3% |
| Physical & Health Sciences | 44 | 2.3% |
| Psychology | 135 | 7.1% |
| Social Sciences | 165 | 8.7% |
| Engineering | 90 | 4.7% |
| Multidisciplinary Studies | 16 | 0.8% |
| Science & Technology | 163 | 8.6% |
| Business | 273 | 14.4% |
| Education | 447 | 23.6% |
| Literature & Languages | 102 | 5.4% |
| Liberal Arts & History | 112 | 5.9% |
| Visual & Performing Arts | 46 | 2.4% |
| Communications | 32 | 1.7% |
| Arts & Humanities | 117 | 6.2% |
| Total | 1,897 | 100.0% |
Transportation & Commute in San Juan County
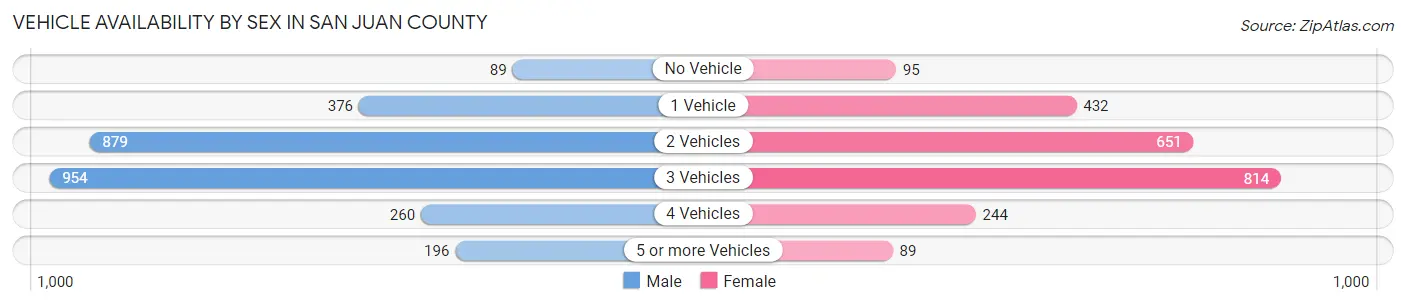
Vehicle Availability by Sex in San Juan County
The most prevalent vehicle ownership categories in San Juan County are males with 3 vehicles (954, accounting for 34.6%) and females with 3 vehicles (814, making up 41.0%).
| Vehicles Available | Male | Female |
| No Vehicle | 89 (3.2%) | 95 (4.1%) |
| 1 Vehicle | 376 (13.7%) | 432 (18.6%) |
| 2 Vehicles | 879 (31.9%) | 651 (28.0%) |
| 3 Vehicles | 954 (34.6%) | 814 (35.0%) |
| 4 Vehicles | 260 (9.4%) | 244 (10.5%) |
| 5 or more Vehicles | 196 (7.1%) | 89 (3.8%) |
| Total | 2,754 (100.0%) | 2,325 (100.0%) |
Commute Time in San Juan County
The most frequently occuring commute durations in San Juan County are 5 to 9 minutes (1,155 commuters, 24.0%), less than 5 minutes (904 commuters, 18.8%), and 10 to 14 minutes (568 commuters, 11.8%).
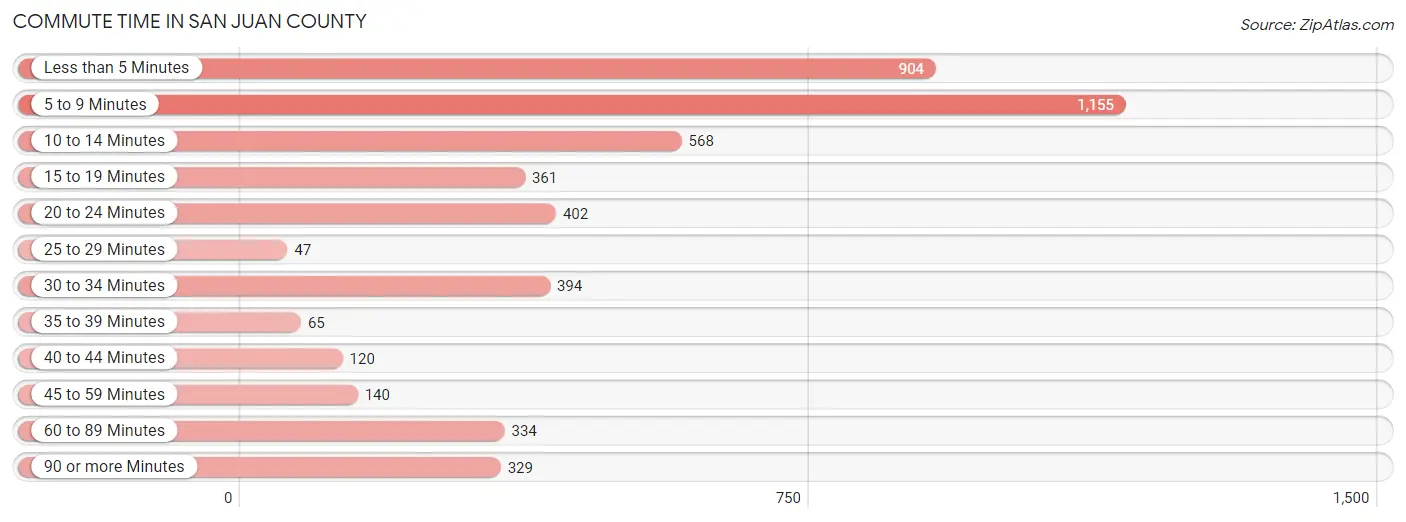
| Commute Time | # Commuters | % Commuters |
| Less than 5 Minutes | 904 | 18.8% |
| 5 to 9 Minutes | 1,155 | 24.0% |
| 10 to 14 Minutes | 568 | 11.8% |
| 15 to 19 Minutes | 361 | 7.5% |
| 20 to 24 Minutes | 402 | 8.3% |
| 25 to 29 Minutes | 47 | 1.0% |
| 30 to 34 Minutes | 394 | 8.2% |
| 35 to 39 Minutes | 65 | 1.3% |
| 40 to 44 Minutes | 120 | 2.5% |
| 45 to 59 Minutes | 140 | 2.9% |
| 60 to 89 Minutes | 334 | 6.9% |
| 90 or more Minutes | 329 | 6.8% |
Commute Time by Sex in San Juan County
The most common commute times in San Juan County are 5 to 9 minutes (553 commuters, 20.8%) for males and 5 to 9 minutes (602 commuters, 27.9%) for females.
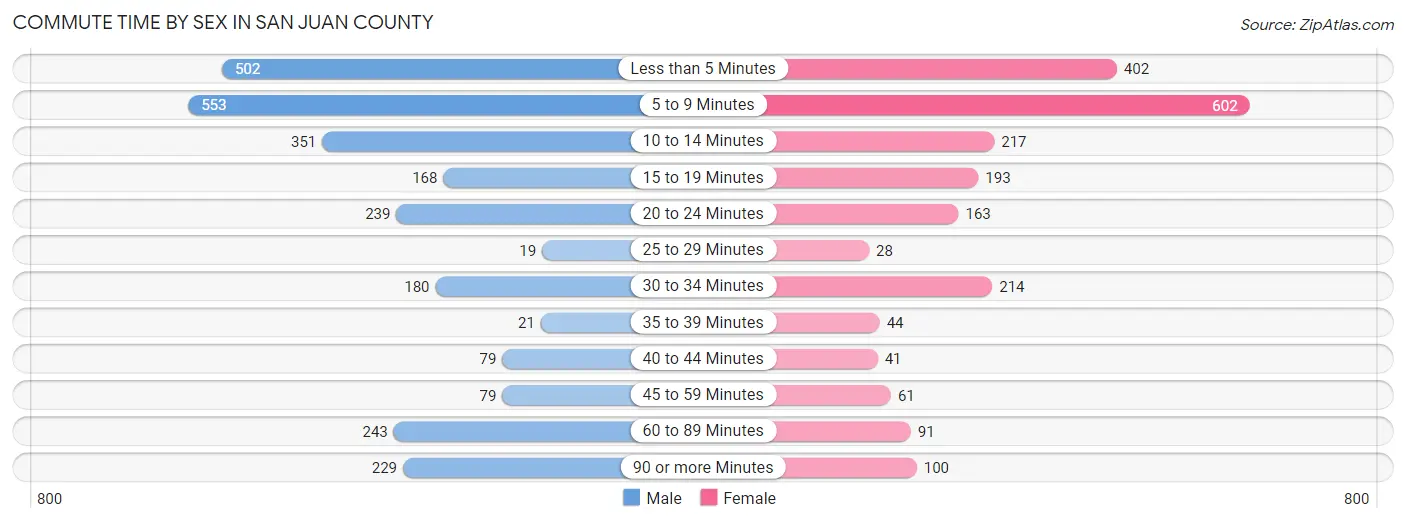
| Commute Time | Male | Female |
| Less than 5 Minutes | 502 (18.9%) | 402 (18.6%) |
| 5 to 9 Minutes | 553 (20.8%) | 602 (27.9%) |
| 10 to 14 Minutes | 351 (13.2%) | 217 (10.1%) |
| 15 to 19 Minutes | 168 (6.3%) | 193 (8.9%) |
| 20 to 24 Minutes | 239 (9.0%) | 163 (7.6%) |
| 25 to 29 Minutes | 19 (0.7%) | 28 (1.3%) |
| 30 to 34 Minutes | 180 (6.8%) | 214 (9.9%) |
| 35 to 39 Minutes | 21 (0.8%) | 44 (2.0%) |
| 40 to 44 Minutes | 79 (3.0%) | 41 (1.9%) |
| 45 to 59 Minutes | 79 (3.0%) | 61 (2.8%) |
| 60 to 89 Minutes | 243 (9.1%) | 91 (4.2%) |
| 90 or more Minutes | 229 (8.6%) | 100 (4.6%) |
Time of Departure to Work by Sex in San Juan County
The most frequent times of departure to work in San Juan County are 7:00 AM to 7:29 AM (560, 21.0%) for males and 7:30 AM to 7:59 AM (638, 29.6%) for females.
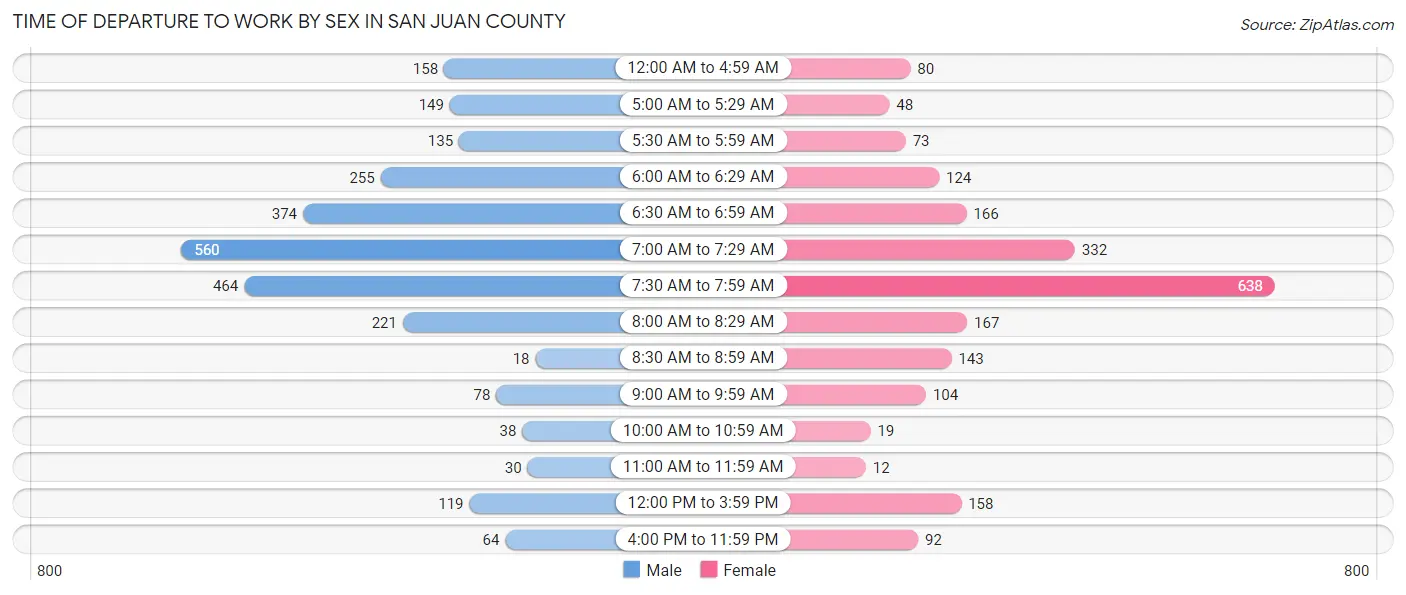
| Time of Departure | Male | Female |
| 12:00 AM to 4:59 AM | 158 (5.9%) | 80 (3.7%) |
| 5:00 AM to 5:29 AM | 149 (5.6%) | 48 (2.2%) |
| 5:30 AM to 5:59 AM | 135 (5.1%) | 73 (3.4%) |
| 6:00 AM to 6:29 AM | 255 (9.6%) | 124 (5.8%) |
| 6:30 AM to 6:59 AM | 374 (14.0%) | 166 (7.7%) |
| 7:00 AM to 7:29 AM | 560 (21.0%) | 332 (15.4%) |
| 7:30 AM to 7:59 AM | 464 (17.4%) | 638 (29.6%) |
| 8:00 AM to 8:29 AM | 221 (8.3%) | 167 (7.7%) |
| 8:30 AM to 8:59 AM | 18 (0.7%) | 143 (6.6%) |
| 9:00 AM to 9:59 AM | 78 (2.9%) | 104 (4.8%) |
| 10:00 AM to 10:59 AM | 38 (1.4%) | 19 (0.9%) |
| 11:00 AM to 11:59 AM | 30 (1.1%) | 12 (0.6%) |
| 12:00 PM to 3:59 PM | 119 (4.5%) | 158 (7.3%) |
| 4:00 PM to 11:59 PM | 64 (2.4%) | 92 (4.3%) |
| Total | 2,663 (100.0%) | 2,156 (100.0%) |
Housing Occupancy in San Juan County
Occupancy by Ownership in San Juan County
Of the total 4,457 dwellings in San Juan County, owner-occupied units account for 3,554 (79.7%), while renter-occupied units make up 903 (20.3%).
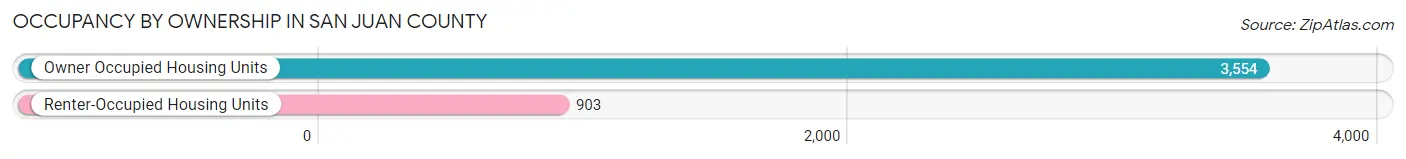
| Occupancy | # Housing Units | % Housing Units |
| Owner Occupied Housing Units | 3,554 | 79.7% |
| Renter-Occupied Housing Units | 903 | 20.3% |
| Total Occupied Housing Units | 4,457 | 100.0% |
Occupancy by Household Size in San Juan County
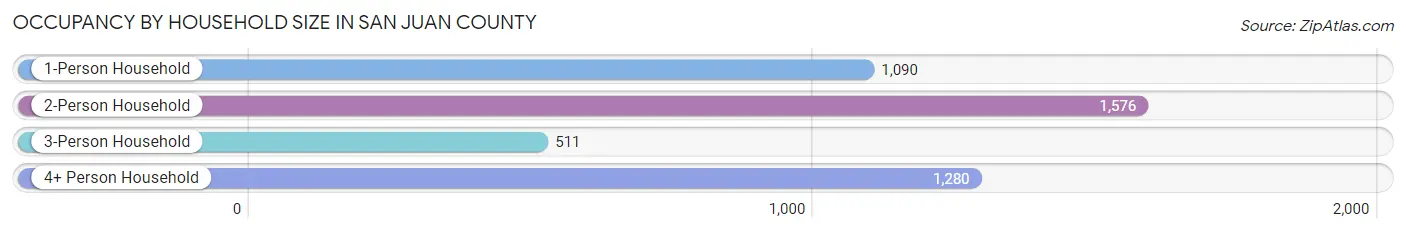
| Household Size | # Housing Units | % Housing Units |
| 1-Person Household | 1,090 | 24.5% |
| 2-Person Household | 1,576 | 35.4% |
| 3-Person Household | 511 | 11.5% |
| 4+ Person Household | 1,280 | 28.7% |
| Total Housing Units | 4,457 | 100.0% |
Occupancy by Ownership by Household Size in San Juan County
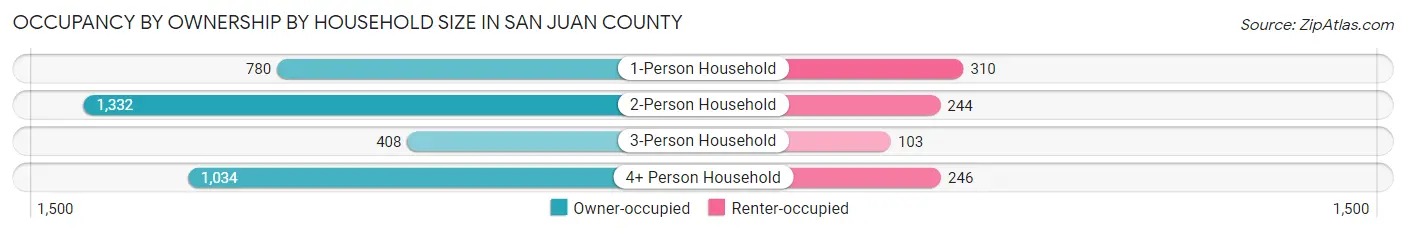
| Household Size | Owner-occupied | Renter-occupied |
| 1-Person Household | 780 (71.6%) | 310 (28.4%) |
| 2-Person Household | 1,332 (84.5%) | 244 (15.5%) |
| 3-Person Household | 408 (79.8%) | 103 (20.2%) |
| 4+ Person Household | 1,034 (80.8%) | 246 (19.2%) |
| Total Housing Units | 3,554 (79.7%) | 903 (20.3%) |
Occupancy by Educational Attainment in San Juan County
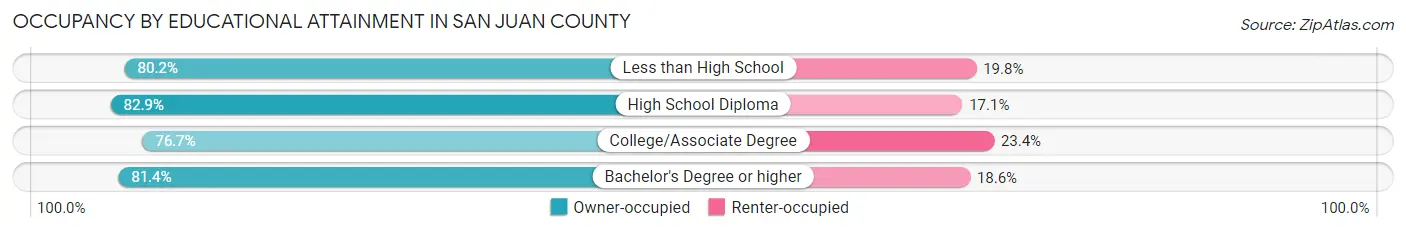
| Household Size | Owner-occupied | Renter-occupied |
| Less than High School | 501 (80.2%) | 124 (19.8%) |
| High School Diploma | 885 (82.9%) | 182 (17.1%) |
| College/Associate Degree | 1,336 (76.6%) | 407 (23.4%) |
| Bachelor's Degree or higher | 832 (81.4%) | 190 (18.6%) |
Occupancy by Age of Householder in San Juan County
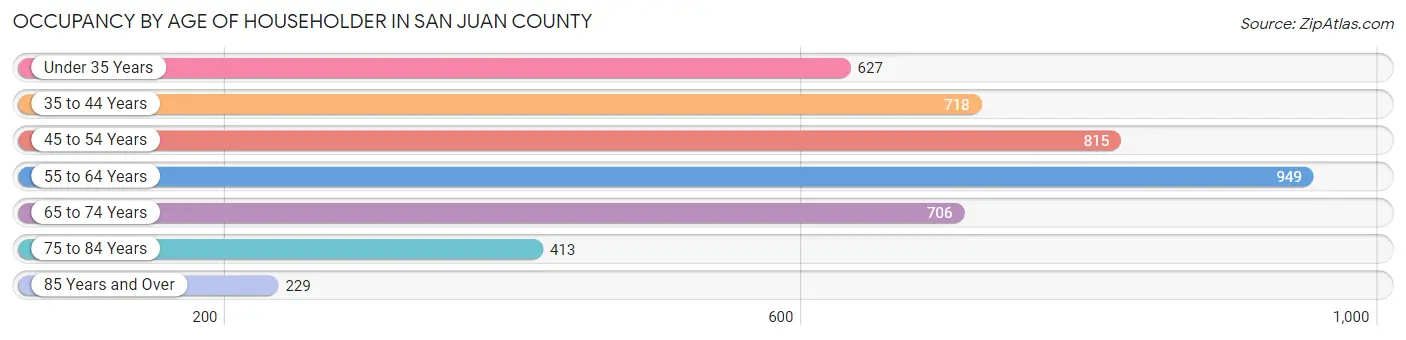
| Age Bracket | # Households | % Households |
| Under 35 Years | 627 | 14.1% |
| 35 to 44 Years | 718 | 16.1% |
| 45 to 54 Years | 815 | 18.3% |
| 55 to 64 Years | 949 | 21.3% |
| 65 to 74 Years | 706 | 15.8% |
| 75 to 84 Years | 413 | 9.3% |
| 85 Years and Over | 229 | 5.1% |
| Total | 4,457 | 100.0% |
Housing Finances in San Juan County
Median Income by Occupancy in San Juan County
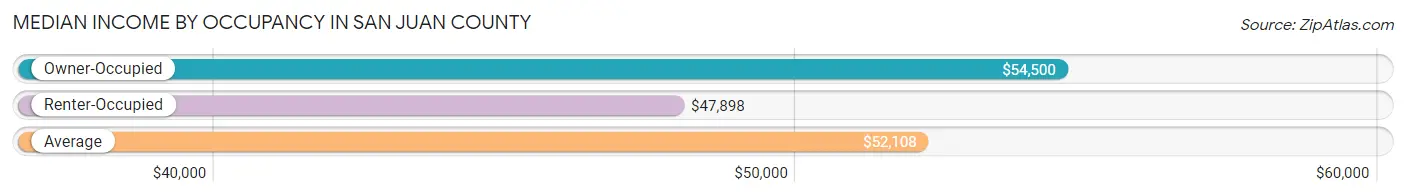
| Occupancy Type | # Households | Median Income |
| Owner-Occupied | 3,554 (79.7%) | $54,500 |
| Renter-Occupied | 903 (20.3%) | $47,898 |
| Average | 4,457 (100.0%) | $52,108 |
Occupancy by Householder Income Bracket in San Juan County
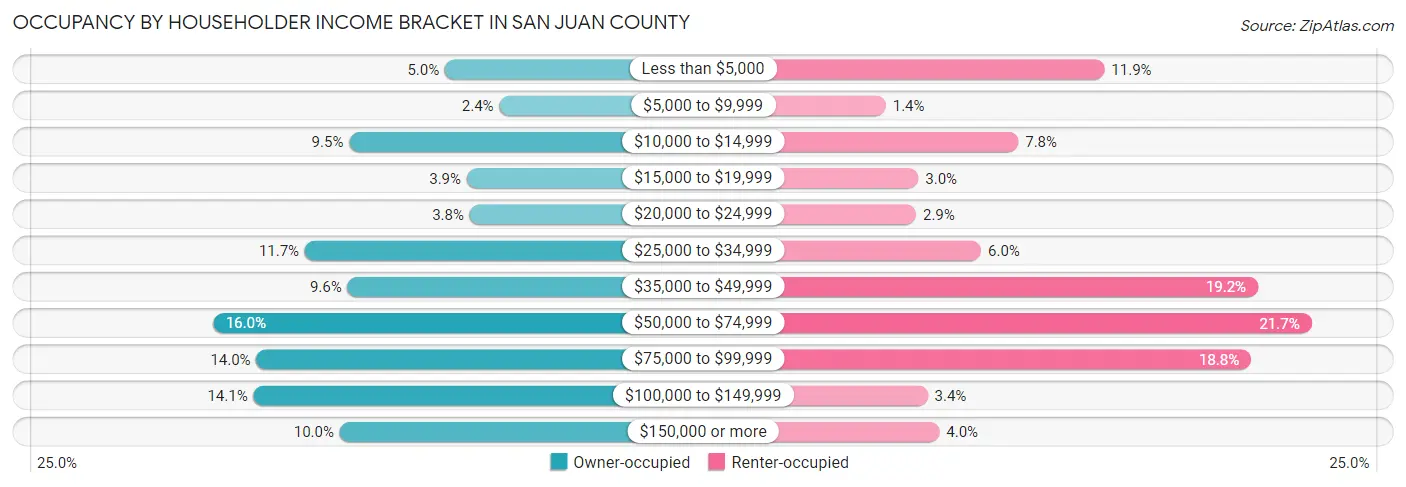
| Income Bracket | Owner-occupied | Renter-occupied |
| Less than $5,000 | 177 (5.0%) | 107 (11.8%) |
| $5,000 to $9,999 | 85 (2.4%) | 13 (1.4%) |
| $10,000 to $14,999 | 339 (9.5%) | 70 (7.7%) |
| $15,000 to $19,999 | 140 (3.9%) | 27 (3.0%) |
| $20,000 to $24,999 | 135 (3.8%) | 26 (2.9%) |
| $25,000 to $34,999 | 414 (11.7%) | 54 (6.0%) |
| $35,000 to $49,999 | 342 (9.6%) | 173 (19.2%) |
| $50,000 to $74,999 | 570 (16.0%) | 196 (21.7%) |
| $75,000 to $99,999 | 496 (14.0%) | 170 (18.8%) |
| $100,000 to $149,999 | 501 (14.1%) | 31 (3.4%) |
| $150,000 or more | 355 (10.0%) | 36 (4.0%) |
| Total | 3,554 (100.0%) | 903 (100.0%) |
Monthly Housing Cost Tiers in San Juan County
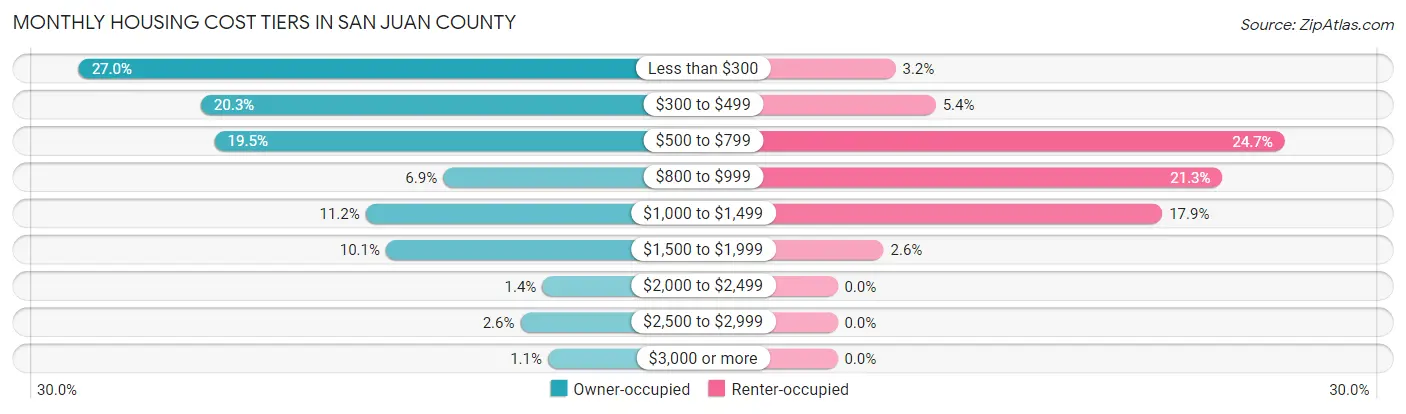
| Monthly Cost | Owner-occupied | Renter-occupied |
| Less than $300 | 960 (27.0%) | 29 (3.2%) |
| $300 to $499 | 720 (20.3%) | 49 (5.4%) |
| $500 to $799 | 693 (19.5%) | 223 (24.7%) |
| $800 to $999 | 245 (6.9%) | 192 (21.3%) |
| $1,000 to $1,499 | 397 (11.2%) | 162 (17.9%) |
| $1,500 to $1,999 | 357 (10.1%) | 23 (2.5%) |
| $2,000 to $2,499 | 50 (1.4%) | 0 (0.0%) |
| $2,500 to $2,999 | 93 (2.6%) | 0 (0.0%) |
| $3,000 or more | 39 (1.1%) | 0 (0.0%) |
| Total | 3,554 (100.0%) | 903 (100.0%) |
Physical Housing Characteristics in San Juan County
Housing Structures in San Juan County
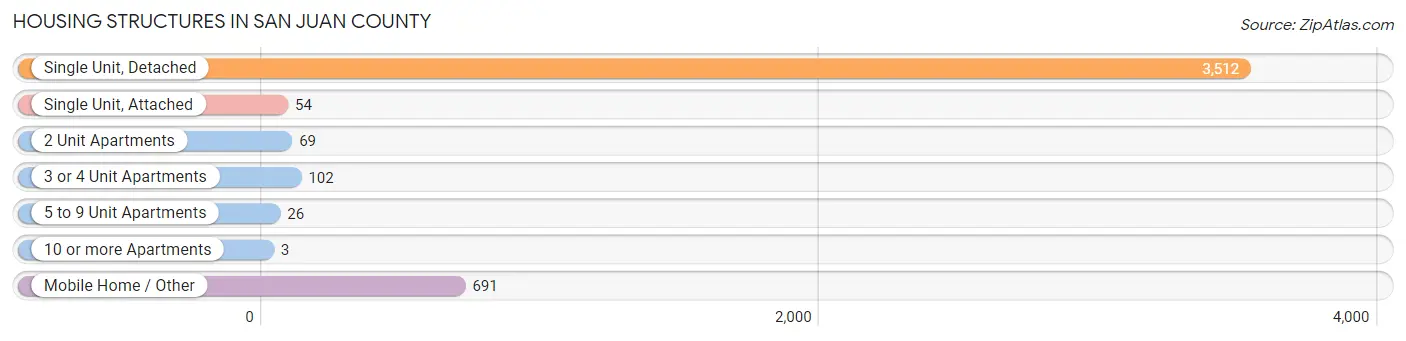
| Structure Type | # Housing Units | % Housing Units |
| Single Unit, Detached | 3,512 | 78.8% |
| Single Unit, Attached | 54 | 1.2% |
| 2 Unit Apartments | 69 | 1.5% |
| 3 or 4 Unit Apartments | 102 | 2.3% |
| 5 to 9 Unit Apartments | 26 | 0.6% |
| 10 or more Apartments | 3 | 0.1% |
| Mobile Home / Other | 691 | 15.5% |
| Total | 4,457 | 100.0% |
Housing Structures by Occupancy in San Juan County
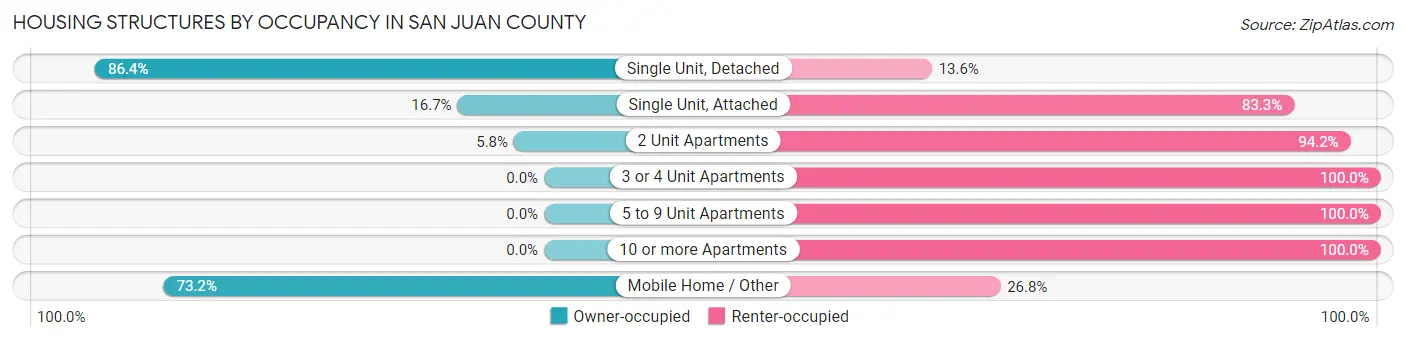
| Structure Type | Owner-occupied | Renter-occupied |
| Single Unit, Detached | 3,035 (86.4%) | 477 (13.6%) |
| Single Unit, Attached | 9 (16.7%) | 45 (83.3%) |
| 2 Unit Apartments | 4 (5.8%) | 65 (94.2%) |
| 3 or 4 Unit Apartments | 0 (0.0%) | 102 (100.0%) |
| 5 to 9 Unit Apartments | 0 (0.0%) | 26 (100.0%) |
| 10 or more Apartments | 0 (0.0%) | 3 (100.0%) |
| Mobile Home / Other | 506 (73.2%) | 185 (26.8%) |
| Total | 3,554 (79.7%) | 903 (20.3%) |
Housing Structures by Number of Rooms in San Juan County
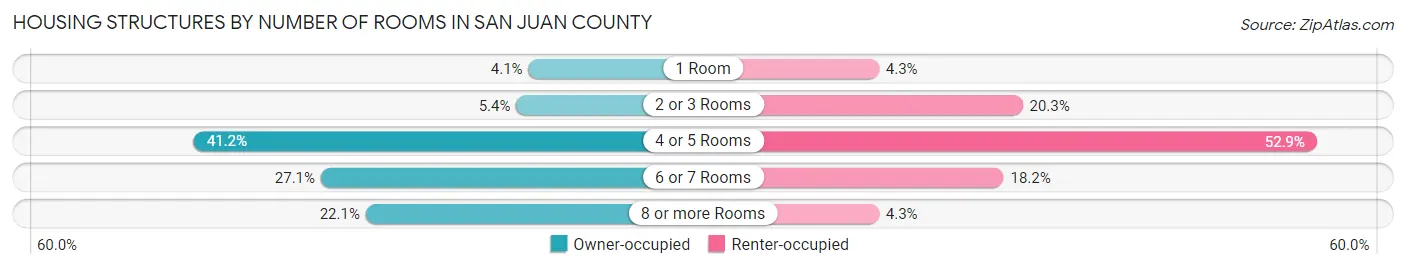
| Number of Rooms | Owner-occupied | Renter-occupied |
| 1 Room | 145 (4.1%) | 39 (4.3%) |
| 2 or 3 Rooms | 193 (5.4%) | 183 (20.3%) |
| 4 or 5 Rooms | 1,465 (41.2%) | 478 (52.9%) |
| 6 or 7 Rooms | 964 (27.1%) | 164 (18.2%) |
| 8 or more Rooms | 787 (22.1%) | 39 (4.3%) |
| Total | 3,554 (100.0%) | 903 (100.0%) |
Housing Structure by Heating Type in San Juan County
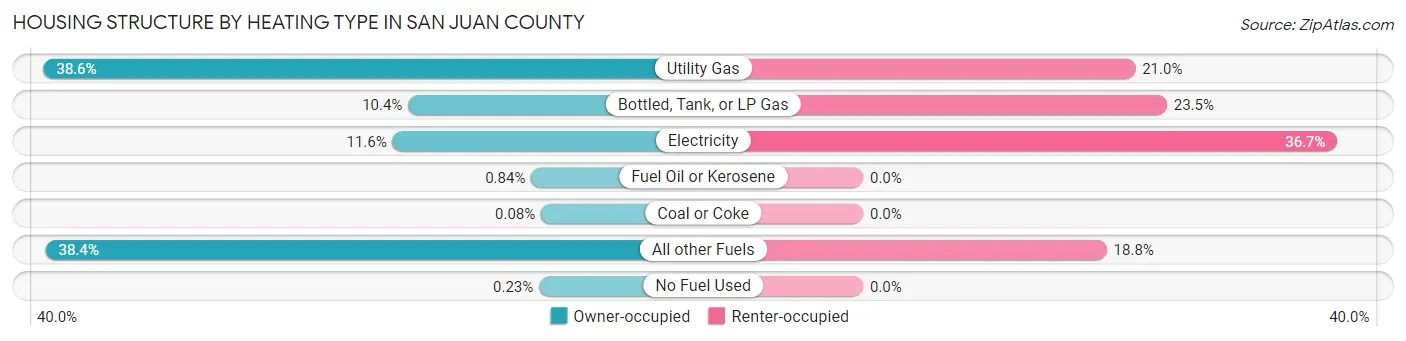
| Heating Type | Owner-occupied | Renter-occupied |
| Utility Gas | 1,370 (38.6%) | 190 (21.0%) |
| Bottled, Tank, or LP Gas | 368 (10.3%) | 212 (23.5%) |
| Electricity | 411 (11.6%) | 331 (36.7%) |
| Fuel Oil or Kerosene | 30 (0.8%) | 0 (0.0%) |
| Coal or Coke | 3 (0.1%) | 0 (0.0%) |
| All other Fuels | 1,364 (38.4%) | 170 (18.8%) |
| No Fuel Used | 8 (0.2%) | 0 (0.0%) |
| Total | 3,554 (100.0%) | 903 (100.0%) |
Household Vehicle Usage in San Juan County
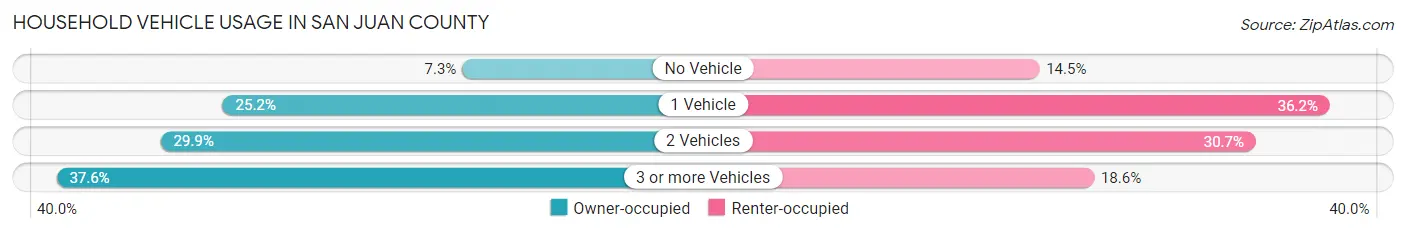
| Vehicles per Household | Owner-occupied | Renter-occupied |
| No Vehicle | 260 (7.3%) | 131 (14.5%) |
| 1 Vehicle | 896 (25.2%) | 327 (36.2%) |
| 2 Vehicles | 1,061 (29.8%) | 277 (30.7%) |
| 3 or more Vehicles | 1,337 (37.6%) | 168 (18.6%) |
| Total | 3,554 (100.0%) | 903 (100.0%) |
Real Estate & Mortgages in San Juan County
Real Estate and Mortgage Overview in San Juan County
| Characteristic | Without Mortgage | With Mortgage |
| Housing Units | 2,401 | 1,153 |
| Median Property Value | $84,100 | $278,900 |
| Median Household Income | $41,270 | $240 |
| Monthly Housing Costs | $380 | $39 |
| Real Estate Taxes | $1,371 | $110 |
Property Value by Mortgage Status in San Juan County
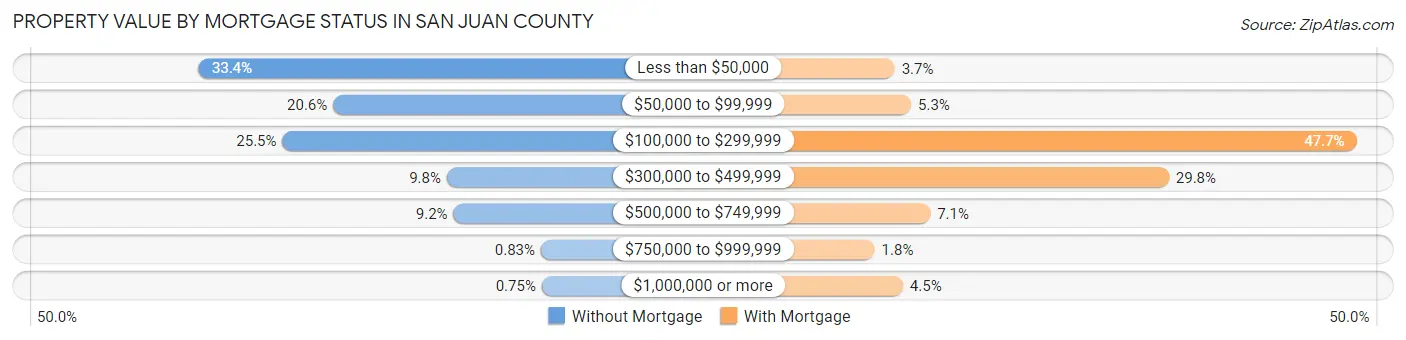
| Property Value | Without Mortgage | With Mortgage |
| Less than $50,000 | 802 (33.4%) | 43 (3.7%) |
| $50,000 to $99,999 | 495 (20.6%) | 61 (5.3%) |
| $100,000 to $299,999 | 611 (25.5%) | 550 (47.7%) |
| $300,000 to $499,999 | 235 (9.8%) | 344 (29.8%) |
| $500,000 to $749,999 | 220 (9.2%) | 82 (7.1%) |
| $750,000 to $999,999 | 20 (0.8%) | 21 (1.8%) |
| $1,000,000 or more | 18 (0.7%) | 52 (4.5%) |
| Total | 2,401 (100.0%) | 1,153 (100.0%) |
Household Income by Mortgage Status in San Juan County
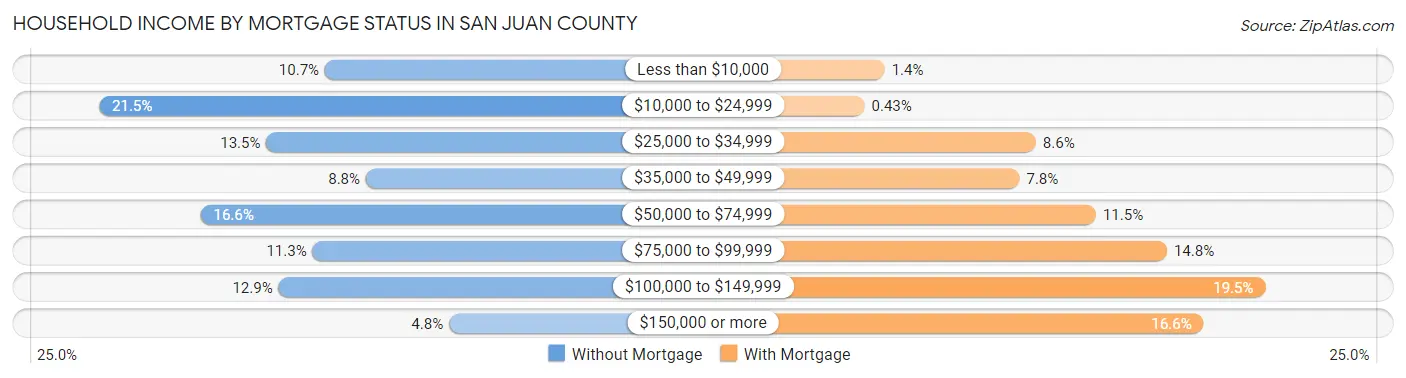
| Household Income | Without Mortgage | With Mortgage |
| Less than $10,000 | 257 (10.7%) | 16 (1.4%) |
| $10,000 to $24,999 | 515 (21.4%) | 5 (0.4%) |
| $25,000 to $34,999 | 324 (13.5%) | 99 (8.6%) |
| $35,000 to $49,999 | 210 (8.7%) | 90 (7.8%) |
| $50,000 to $74,999 | 399 (16.6%) | 132 (11.5%) |
| $75,000 to $99,999 | 271 (11.3%) | 171 (14.8%) |
| $100,000 to $149,999 | 310 (12.9%) | 225 (19.5%) |
| $150,000 or more | 115 (4.8%) | 191 (16.6%) |
| Total | 2,401 (100.0%) | 1,153 (100.0%) |
Property Value to Household Income Ratio in San Juan County
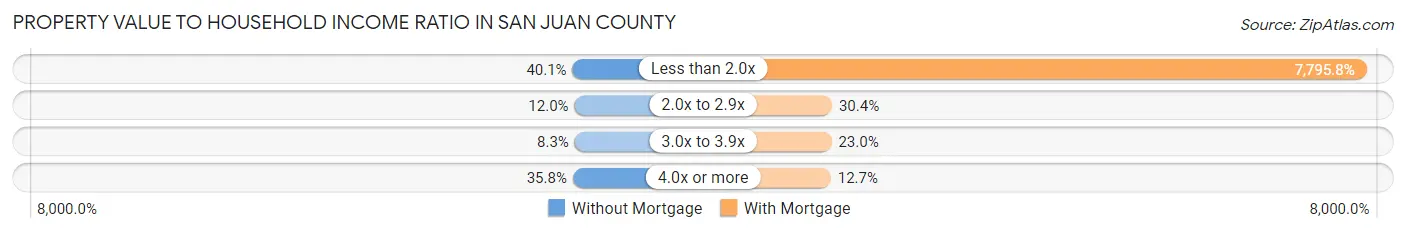
| Value-to-Income Ratio | Without Mortgage | With Mortgage |
| Less than 2.0x | 962 (40.1%) | 89,886 (7,795.8%) |
| 2.0x to 2.9x | 288 (12.0%) | 350 (30.4%) |
| 3.0x to 3.9x | 199 (8.3%) | 265 (23.0%) |
| 4.0x or more | 860 (35.8%) | 146 (12.7%) |
| Total | 2,401 (100.0%) | 1,153 (100.0%) |
Real Estate Taxes by Mortgage Status in San Juan County
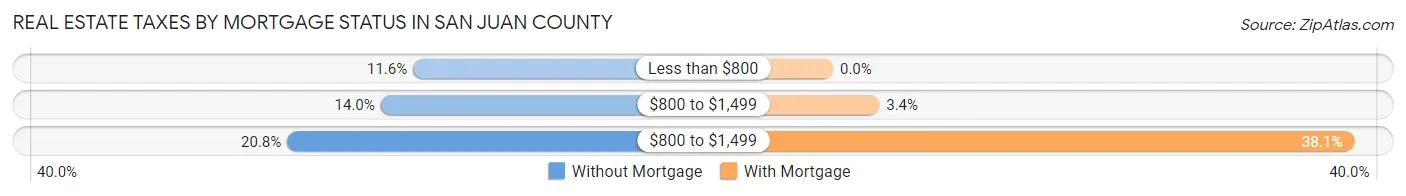
| Property Taxes | Without Mortgage | With Mortgage |
| Less than $800 | 279 (11.6%) | 0 (0.0%) |
| $800 to $1,499 | 336 (14.0%) | 39 (3.4%) |
| $800 to $1,499 | 500 (20.8%) | 439 (38.1%) |
| Total | 2,401 (100.0%) | 1,153 (100.0%) |
Health & Disability in San Juan County
Health Insurance Coverage by Age in San Juan County
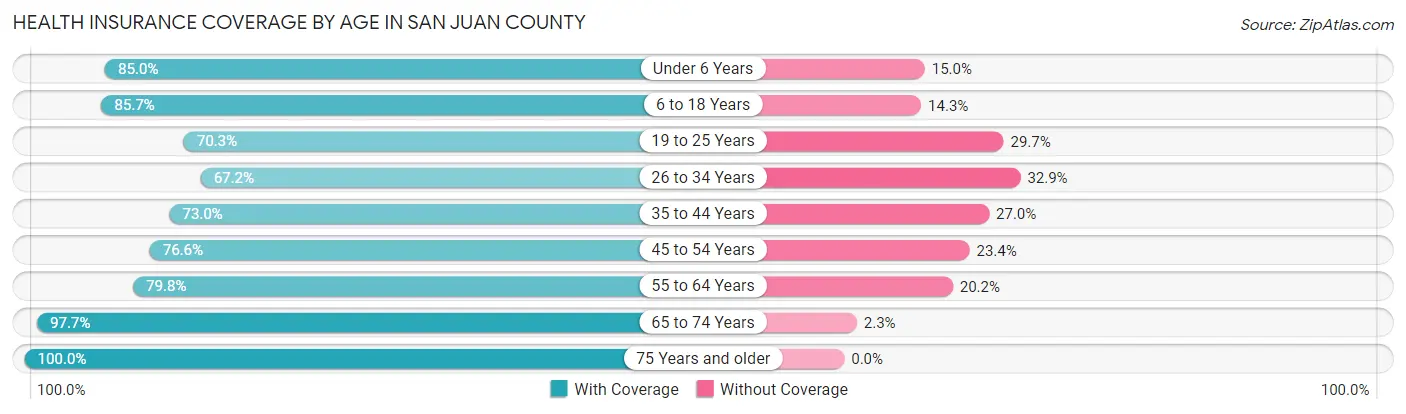
| Age Bracket | With Coverage | Without Coverage |
| Under 6 Years | 923 (85.0%) | 163 (15.0%) |
| 6 to 18 Years | 2,797 (85.7%) | 468 (14.3%) |
| 19 to 25 Years | 987 (70.3%) | 417 (29.7%) |
| 26 to 34 Years | 1,061 (67.1%) | 519 (32.9%) |
| 35 to 44 Years | 1,135 (73.0%) | 420 (27.0%) |
| 45 to 54 Years | 1,191 (76.6%) | 363 (23.4%) |
| 55 to 64 Years | 1,337 (79.8%) | 339 (20.2%) |
| 65 to 74 Years | 1,209 (97.7%) | 29 (2.3%) |
| 75 Years and older | 951 (100.0%) | 0 (0.0%) |
| Total | 11,591 (81.0%) | 2,718 (19.0%) |
Health Insurance Coverage by Citizenship Status in San Juan County
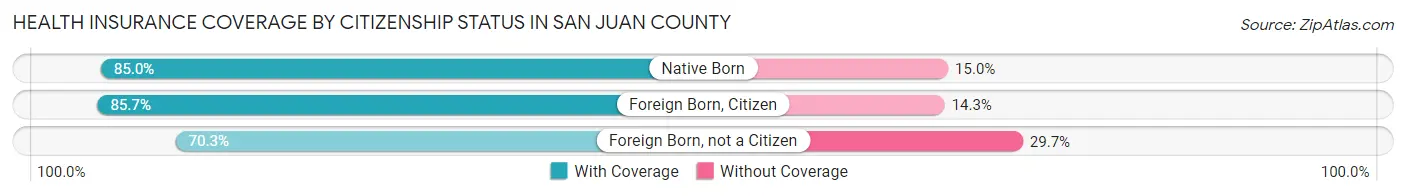
| Citizenship Status | With Coverage | Without Coverage |
| Native Born | 923 (85.0%) | 163 (15.0%) |
| Foreign Born, Citizen | 2,797 (85.7%) | 468 (14.3%) |
| Foreign Born, not a Citizen | 987 (70.3%) | 417 (29.7%) |
Health Insurance Coverage by Household Income in San Juan County
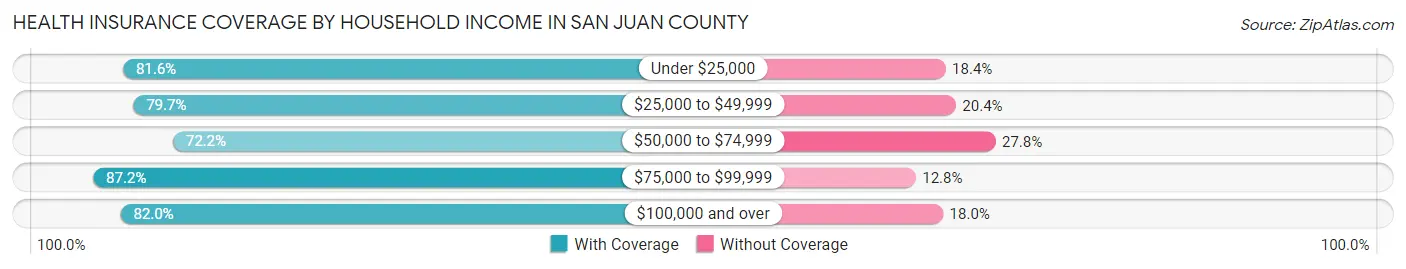
| Household Income | With Coverage | Without Coverage |
| Under $25,000 | 2,147 (81.6%) | 485 (18.4%) |
| $25,000 to $49,999 | 2,153 (79.6%) | 550 (20.3%) |
| $50,000 to $74,999 | 1,623 (72.2%) | 624 (27.8%) |
| $75,000 to $99,999 | 2,199 (87.2%) | 324 (12.8%) |
| $100,000 and over | 3,270 (82.0%) | 716 (18.0%) |
Public vs Private Health Insurance Coverage by Age in San Juan County
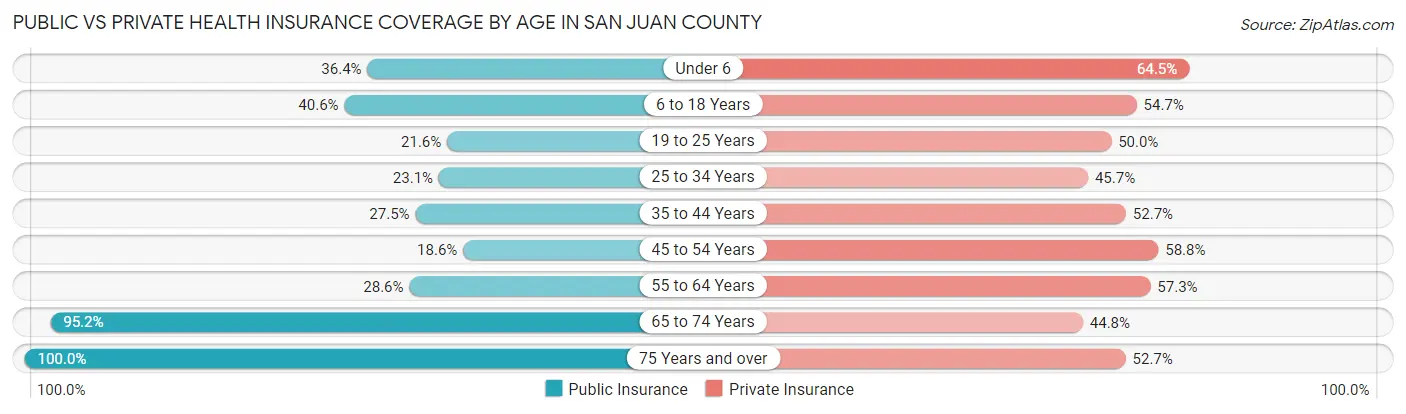
| Age Bracket | Public Insurance | Private Insurance |
| Under 6 | 395 (36.4%) | 700 (64.5%) |
| 6 to 18 Years | 1,327 (40.6%) | 1,787 (54.7%) |
| 19 to 25 Years | 303 (21.6%) | 702 (50.0%) |
| 25 to 34 Years | 365 (23.1%) | 722 (45.7%) |
| 35 to 44 Years | 427 (27.5%) | 820 (52.7%) |
| 45 to 54 Years | 289 (18.6%) | 913 (58.8%) |
| 55 to 64 Years | 479 (28.6%) | 960 (57.3%) |
| 65 to 74 Years | 1,179 (95.2%) | 554 (44.8%) |
| 75 Years and over | 951 (100.0%) | 501 (52.7%) |
| Total | 5,715 (39.9%) | 7,659 (53.5%) |
Disability Status by Sex by Age in San Juan County
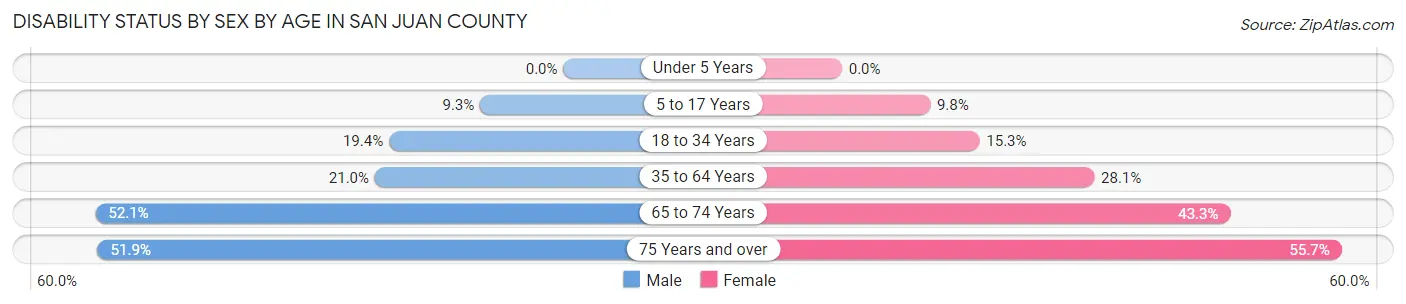
| Age Bracket | Male | Female |
| Under 5 Years | 0 (0.0%) | 0 (0.0%) |
| 5 to 17 Years | 147 (9.3%) | 160 (9.8%) |
| 18 to 34 Years | 331 (19.4%) | 236 (15.3%) |
| 35 to 64 Years | 495 (21.0%) | 682 (28.1%) |
| 65 to 74 Years | 309 (52.1%) | 279 (43.3%) |
| 75 Years and over | 223 (51.9%) | 290 (55.7%) |
Disability Class by Sex by Age in San Juan County
Disability Class: Hearing Difficulty
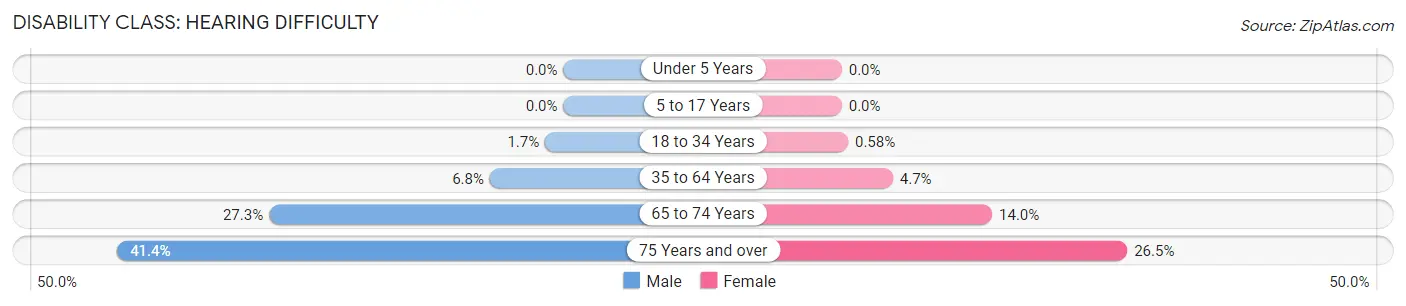
| Age Bracket | Male | Female |
| Under 5 Years | 0 (0.0%) | 0 (0.0%) |
| 5 to 17 Years | 0 (0.0%) | 0 (0.0%) |
| 18 to 34 Years | 29 (1.7%) | 9 (0.6%) |
| 35 to 64 Years | 161 (6.8%) | 115 (4.7%) |
| 65 to 74 Years | 162 (27.3%) | 90 (14.0%) |
| 75 Years and over | 178 (41.4%) | 138 (26.5%) |
Disability Class: Vision Difficulty
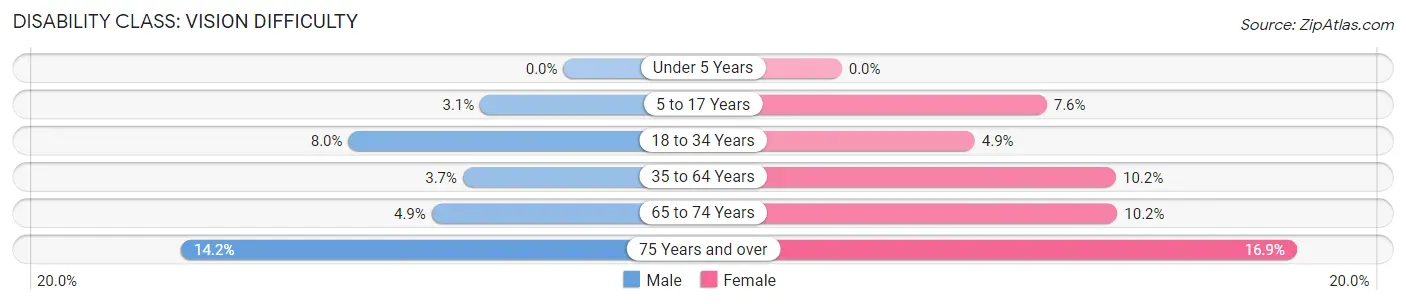
| Age Bracket | Male | Female |
| Under 5 Years | 0 (0.0%) | 0 (0.0%) |
| 5 to 17 Years | 49 (3.1%) | 124 (7.6%) |
| 18 to 34 Years | 136 (8.0%) | 76 (4.9%) |
| 35 to 64 Years | 88 (3.7%) | 247 (10.2%) |
| 65 to 74 Years | 29 (4.9%) | 66 (10.2%) |
| 75 Years and over | 61 (14.2%) | 88 (16.9%) |
Disability Class: Cognitive Difficulty
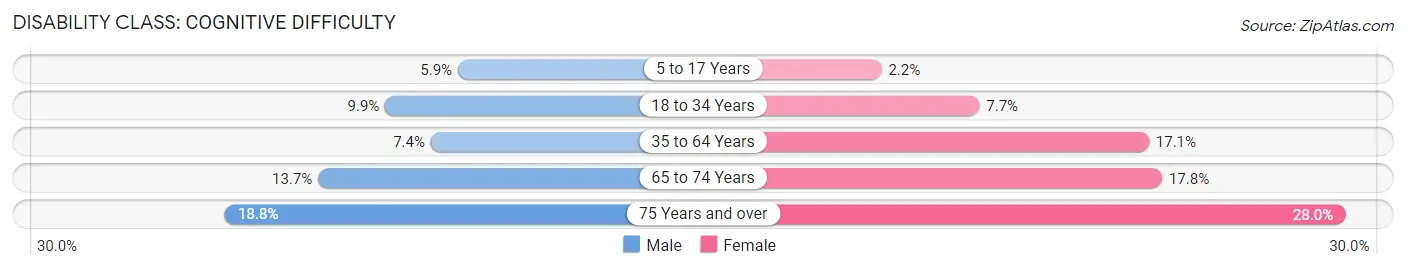
| Age Bracket | Male | Female |
| 5 to 17 Years | 93 (5.9%) | 36 (2.2%) |
| 18 to 34 Years | 169 (9.9%) | 118 (7.7%) |
| 35 to 64 Years | 174 (7.4%) | 415 (17.1%) |
| 65 to 74 Years | 81 (13.7%) | 115 (17.8%) |
| 75 Years and over | 81 (18.8%) | 146 (28.0%) |
Disability Class: Ambulatory Difficulty
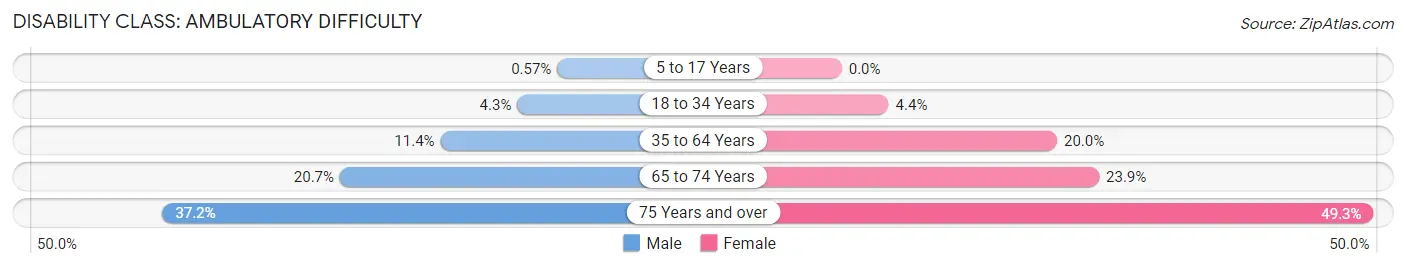
| Age Bracket | Male | Female |
| 5 to 17 Years | 9 (0.6%) | 0 (0.0%) |
| 18 to 34 Years | 73 (4.3%) | 67 (4.3%) |
| 35 to 64 Years | 269 (11.4%) | 485 (20.0%) |
| 65 to 74 Years | 123 (20.7%) | 154 (23.9%) |
| 75 Years and over | 160 (37.2%) | 257 (49.3%) |
Disability Class: Self-Care Difficulty
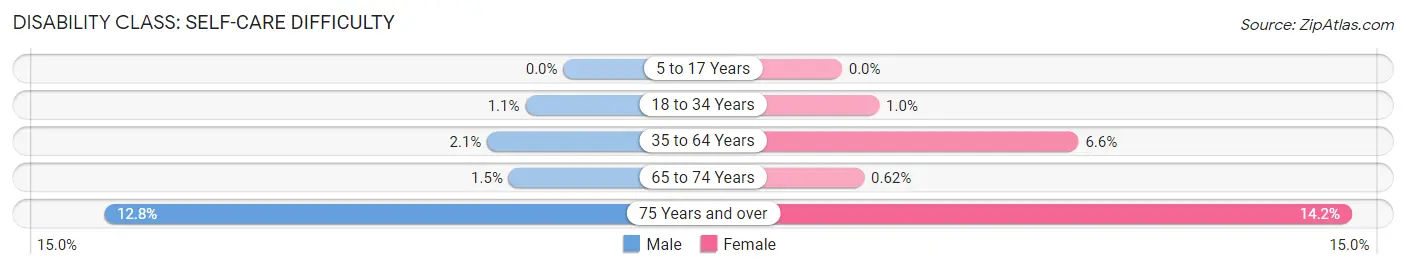
| Age Bracket | Male | Female |
| 5 to 17 Years | 0 (0.0%) | 0 (0.0%) |
| 18 to 34 Years | 18 (1.1%) | 16 (1.0%) |
| 35 to 64 Years | 50 (2.1%) | 160 (6.6%) |
| 65 to 74 Years | 9 (1.5%) | 4 (0.6%) |
| 75 Years and over | 55 (12.8%) | 74 (14.2%) |
Technology Access in San Juan County
Computing Device Access in San Juan County
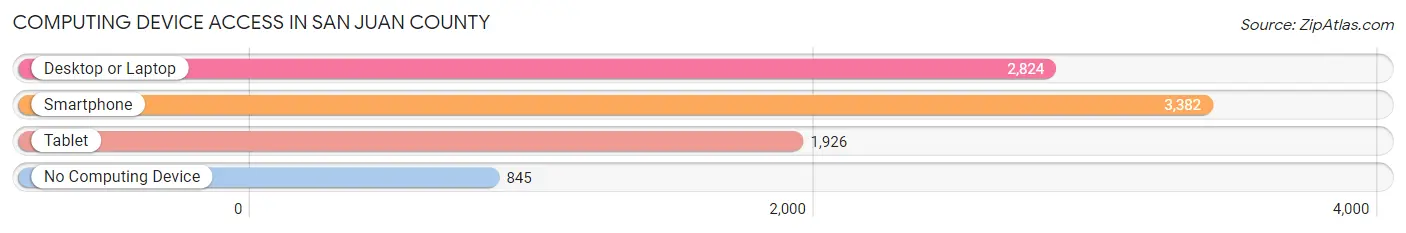
| Device Type | # Households | % Households |
| Desktop or Laptop | 2,824 | 63.4% |
| Smartphone | 3,382 | 75.9% |
| Tablet | 1,926 | 43.2% |
| No Computing Device | 845 | 19.0% |
| Total | 4,457 | 100.0% |
Internet Access in San Juan County
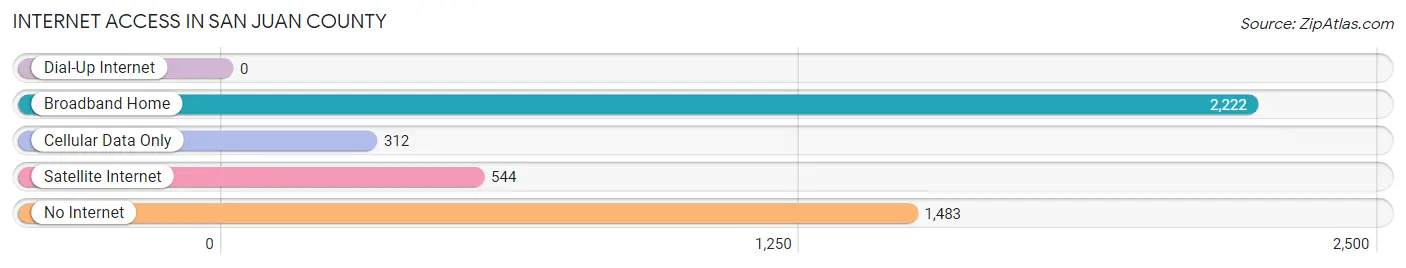
| Internet Type | # Households | % Households |
| Dial-Up Internet | 0 | 0.0% |
| Broadband Home | 2,222 | 49.8% |
| Cellular Data Only | 312 | 7.0% |
| Satellite Internet | 544 | 12.2% |
| No Internet | 1,483 | 33.3% |
| Total | 4,457 | 100.0% |
San Juan County Summary
San Juan County is located in the southeastern corner of Utah and is the largest county in the state. It is bordered by Colorado to the east, Arizona to the south, and Utah's Grand and Emery counties to the north and west, respectively. The county seat is Monticello, and the largest city is Blanding. The county was created in 1880 and named after the San Juan River, which flows through the county.
Geography
San Juan County covers an area of 7,933 square miles, making it the largest county in Utah. It is located in the Colorado Plateau region of the state and is characterized by high desert terrain, with elevations ranging from 4,000 to 11,000 feet. The county is home to several mountain ranges, including the Abajo Mountains, the La Sal Mountains, and the Henry Mountains. The San Juan River, which flows through the county, is the largest tributary of the Colorado River.
The county is home to several national parks and monuments, including Natural Bridges National Monument, Hovenweep National Monument, and Rainbow Bridge National Monument. The county also contains part of the Navajo Nation, the largest Native American reservation in the United States.
Economy
San Juan County has a diverse economy, with the largest sectors being tourism, agriculture, and energy. Tourism is a major industry in the county, with visitors coming to explore the area's national parks and monuments. Agriculture is also an important part of the county's economy, with cattle ranching and hay production being the main agricultural activities.
The county is also home to several energy-related industries, including oil and gas production, uranium mining, and coal-fired power plants. The county is also home to several renewable energy projects, including wind and solar farms.
Demographics
As of the 2010 census, San Juan County had a population of 14,746. The population is predominantly white (83.3%), with Native Americans (7.3%), Hispanics (4.7%), and African Americans (2.2%) making up the remainder of the population. The median household income is $41,945, and the median age is 37.
The county is home to several Native American tribes, including the Navajo, Ute, and Paiute. The county is also home to several Mormon settlements, with the Church of Jesus Christ of Latter-day Saints being the largest religious denomination in the county.
Conclusion
San Juan County is a large and diverse county located in the southeastern corner of Utah. It is home to several national parks and monuments, and has a diverse economy that includes tourism, agriculture, and energy. The population is predominantly white, with Native Americans, Hispanics, and African Americans making up the remainder of the population. The county is home to several Native American tribes and Mormon settlements, and is an important part of Utah's economy.
Common Questions
What is the Total Population of San Juan County?
Total Population of San Juan County is 14,524.
What is the Total Male Population of San Juan County?
Total Male Population of San Juan County is 7,293.
What is the Total Female Population of San Juan County?
Total Female Population of San Juan County is 7,231.
What is the Ratio of Males per 100 Females in San Juan County?
There are 100.86 Males per 100 Females in San Juan County.
What is the Ratio of Females per 100 Males in San Juan County?
There are 99.15 Females per 100 Males in San Juan County.
What is the Median Population Age in San Juan County?
Median Population Age in San Juan County is 33.2 Years.
What is the Average Family Size in San Juan County
Average Family Size in San Juan County is 3.9 People.
What is the Average Household Size in San Juan County
Average Household Size in San Juan County is 3.2 People.
What is Per Capita Income in San Juan County?
Per Capita income in San Juan County is $25,591.
What is the Median Family Income in San Juan County?
Median Family Income in San Juan County is $65,568.
What is the Median Household income in San Juan County?
Median Household Income in San Juan County is $52,108.
What is Income or Wage Gap in San Juan County?
Income or Wage Gap in San Juan County is 39.9%.
Women in San Juan County earn 60.1 cents for every dollar earned by a man.
What is Family Income Deficit in San Juan County?
Family Income Deficit in San Juan County is $14,583.
Families that are below poverty line in San Juan County earn $14,583 less on average than the poverty threshold level.
What is Inequality or Gini Index in San Juan County?
Inequality or Gini Index in San Juan County is 0.51.
How Large is the Labor Force in San Juan County?
There are 5,949 People in the Labor Forcein in San Juan County.
What is the Percentage of People in the Labor Force in San Juan County?
54.1% of People are in the Labor Force in San Juan County.
What is the Unemployment Rate in San Juan County?
Unemployment Rate in San Juan County is 12.1%.