Salt Lake County, UT
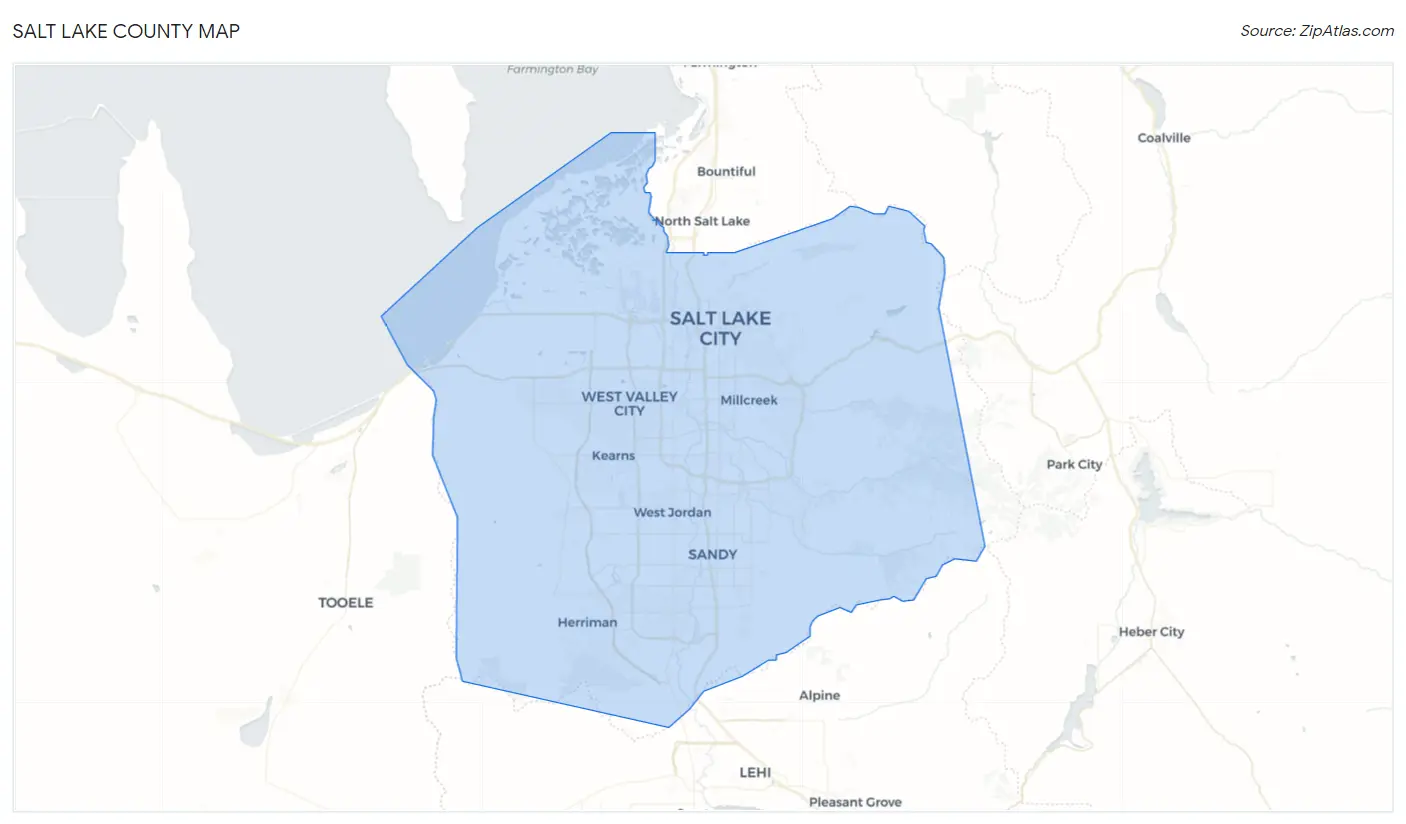
Salt Lake County Map
Salt Lake County Overview
1,180,643
TOTAL POPULATION
597,700
MALE POPULATION
582,943
FEMALE POPULATION
102.53
MALES / 100 FEMALES
97.53
FEMALES / 100 MALES
33.4
MEDIAN AGE
3.5
AVG FAMILY SIZE
2.9
AVG HOUSEHOLD SIZE
$40,969
PER CAPITA INCOME
$106,281
AVG FAMILY INCOME
$90,011
AVG HOUSEHOLD INCOME
33.0%
WAGE / INCOME GAP [ % ]
67.0¢/ $1
WAGE / INCOME GAP [ $ ]
$11,144
FAMILY INCOME DEFICIT
0.43
INEQUALITY / GINI INDEX
653,668
LABOR FORCE [ PEOPLE ]
72.0%
PERCENT IN LABOR FORCE
3.6%
UNEMPLOYMENT RATE
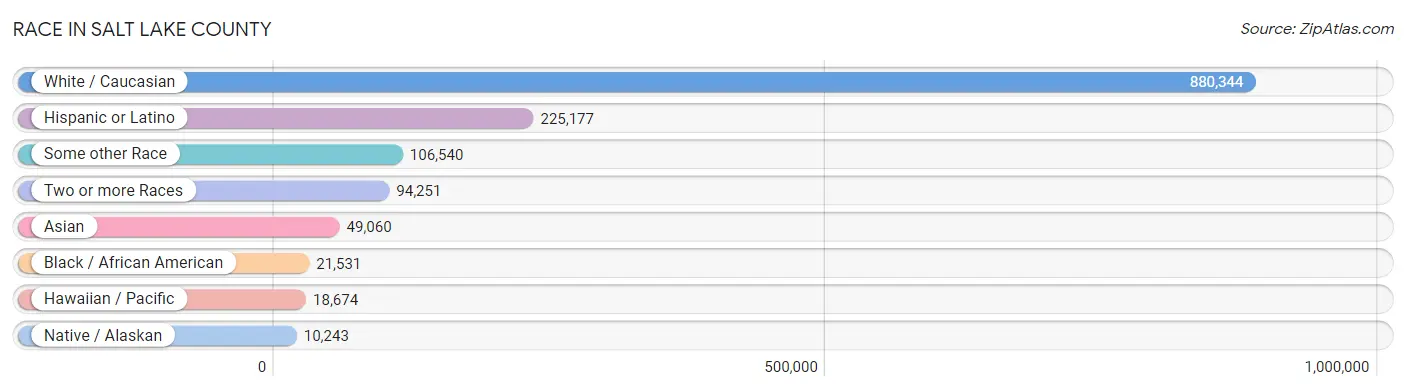
Race in Salt Lake County
The most populous races in Salt Lake County are White / Caucasian (880,344 | 74.6%), Hispanic or Latino (225,177 | 19.1%), and Some other Race (106,540 | 9.0%).
| Race | # Population | % Population |
| Asian | 49,060 | 4.2% |
| Black / African American | 21,531 | 1.8% |
| Hawaiian / Pacific | 18,674 | 1.6% |
| Hispanic or Latino | 225,177 | 19.1% |
| Native / Alaskan | 10,243 | 0.9% |
| White / Caucasian | 880,344 | 74.6% |
| Two or more Races | 94,251 | 8.0% |
| Some other Race | 106,540 | 9.0% |
| Total | 1,180,643 | 100.0% |
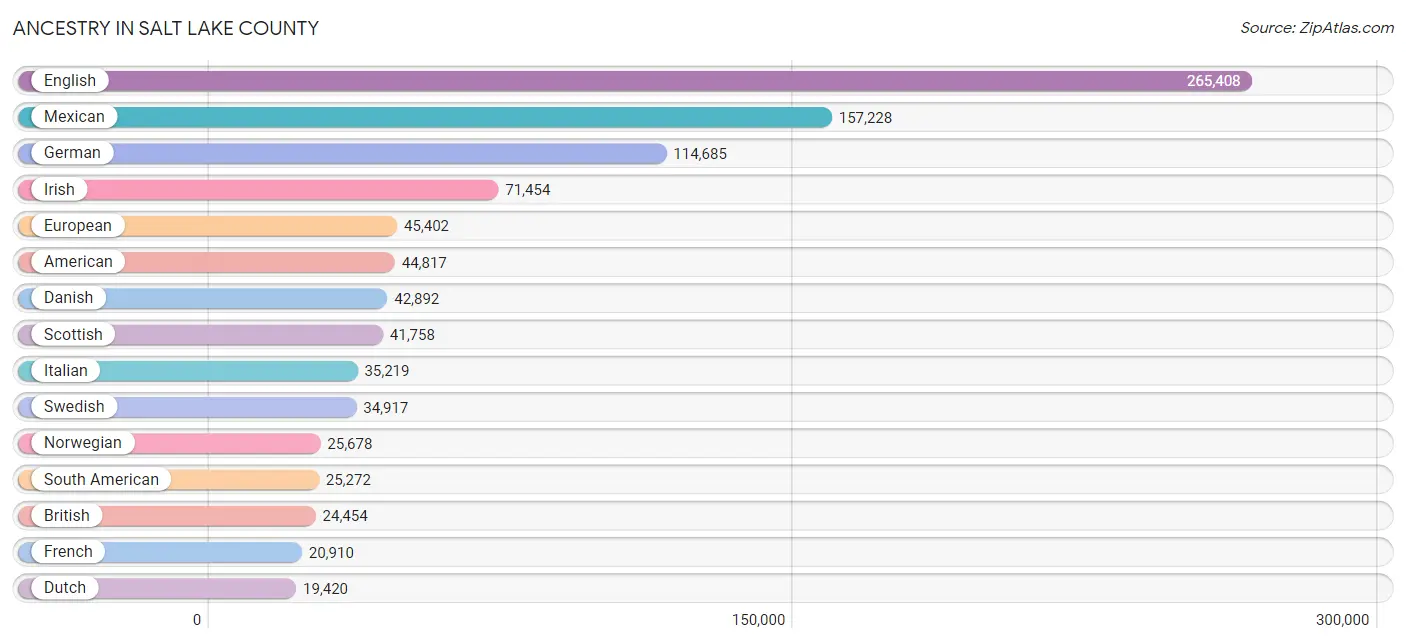
Ancestry in Salt Lake County
The most populous ancestries reported in Salt Lake County are English (265,408 | 22.5%), Mexican (157,228 | 13.3%), German (114,685 | 9.7%), Irish (71,454 | 6.0%), and European (45,402 | 3.8%), together accounting for 55.4% of all Salt Lake County residents.
| Ancestry | # Population | % Population |
| Afghan | 546 | 0.1% |
| African | 3,147 | 0.3% |
| Alaska Native | 50 | 0.0% |
| Alaskan Athabascan | 38 | 0.0% |
| Albanian | 211 | 0.0% |
| American | 44,817 | 3.8% |
| Apache | 943 | 0.1% |
| Arab | 5,199 | 0.4% |
| Arapaho | 170 | 0.0% |
| Argentinean | 2,114 | 0.2% |
| Armenian | 1,660 | 0.1% |
| Assyrian / Chaldean / Syriac | 8 | 0.0% |
| Australian | 867 | 0.1% |
| Austrian | 1,558 | 0.1% |
| Bahamian | 1 | 0.0% |
| Bangladeshi | 312 | 0.0% |
| Basque | 849 | 0.1% |
| Belgian | 833 | 0.1% |
| Belizean | 146 | 0.0% |
| Bhutanese | 6,745 | 0.6% |
| Blackfeet | 792 | 0.1% |
| Bolivian | 663 | 0.1% |
| Brazilian | 3,402 | 0.3% |
| British | 24,454 | 2.1% |
| British West Indian | 27 | 0.0% |
| Bulgarian | 117 | 0.0% |
| Burmese | 5,536 | 0.5% |
| Cajun | 164 | 0.0% |
| Cambodian | 196 | 0.0% |
| Canadian | 2,197 | 0.2% |
| Cape Verdean | 68 | 0.0% |
| Carpatho Rusyn | 18 | 0.0% |
| Celtic | 110 | 0.0% |
| Central American | 14,681 | 1.2% |
| Central American Indian | 885 | 0.1% |
| Cherokee | 2,491 | 0.2% |
| Cheyenne | 101 | 0.0% |
| Chickasaw | 119 | 0.0% |
| Chilean | 1,909 | 0.2% |
| Chippewa | 373 | 0.0% |
| Choctaw | 557 | 0.1% |
| Colombian | 4,217 | 0.4% |
| Comanche | 46 | 0.0% |
| Costa Rican | 670 | 0.1% |
| Cree | 25 | 0.0% |
| Creek | 222 | 0.0% |
| Croatian | 1,275 | 0.1% |
| Crow | 86 | 0.0% |
| Cuban | 1,984 | 0.2% |
| Cypriot | 47 | 0.0% |
| Czech | 2,193 | 0.2% |
| Czechoslovakian | 329 | 0.0% |
| Danish | 42,892 | 3.6% |
| Delaware | 26 | 0.0% |
| Dominican | 1,290 | 0.1% |
| Dutch | 19,420 | 1.6% |
| Dutch West Indian | 19 | 0.0% |
| Eastern European | 2,481 | 0.2% |
| Ecuadorian | 1,729 | 0.2% |
| Egyptian | 637 | 0.1% |
| English | 265,408 | 22.5% |
| Estonian | 72 | 0.0% |
| Ethiopian | 723 | 0.1% |
| European | 45,402 | 3.8% |
| Fijian | 826 | 0.1% |
| Filipino | 554 | 0.1% |
| Finnish | 2,112 | 0.2% |
| French | 20,910 | 1.8% |
| French American Indian | 102 | 0.0% |
| French Canadian | 2,106 | 0.2% |
| German | 114,685 | 9.7% |
| Ghanaian | 232 | 0.0% |
| Greek | 6,262 | 0.5% |
| Guamanian / Chamorro | 711 | 0.1% |
| Guatemalan | 4,862 | 0.4% |
| Guyanese | 76 | 0.0% |
| Haitian | 167 | 0.0% |
| Honduran | 2,472 | 0.2% |
| Hopi | 162 | 0.0% |
| Hungarian | 2,530 | 0.2% |
| Icelander | 880 | 0.1% |
| Indian (Asian) | 12,731 | 1.1% |
| Indonesian | 1,910 | 0.2% |
| Inupiat | 179 | 0.0% |
| Iranian | 2,664 | 0.2% |
| Iraqi | 1,764 | 0.2% |
| Irish | 71,454 | 6.0% |
| Iroquois | 338 | 0.0% |
| Israeli | 108 | 0.0% |
| Italian | 35,219 | 3.0% |
| Jamaican | 485 | 0.0% |
| Japanese | 2,104 | 0.2% |
| Jordanian | 331 | 0.0% |
| Kenyan | 662 | 0.1% |
| Kiowa | 10 | 0.0% |
| Korean | 9,679 | 0.8% |
| Laotian | 934 | 0.1% |
| Latvian | 333 | 0.0% |
| Lebanese | 1,137 | 0.1% |
| Liberian | 140 | 0.0% |
| Lithuanian | 736 | 0.1% |
| Lumbee | 6 | 0.0% |
| Luxembourger | 71 | 0.0% |
| Macedonian | 53 | 0.0% |
| Malaysian | 1,875 | 0.2% |
| Maltese | 98 | 0.0% |
| Mexican | 157,228 | 13.3% |
| Mexican American Indian | 3,119 | 0.3% |
| Mongolian | 226 | 0.0% |
| Moroccan | 61 | 0.0% |
| Native Hawaiian | 3,552 | 0.3% |
| Navajo | 4,610 | 0.4% |
| New Zealander | 368 | 0.0% |
| Nicaraguan | 348 | 0.0% |
| Nigerian | 666 | 0.1% |
| Northern European | 3,637 | 0.3% |
| Norwegian | 25,678 | 2.2% |
| Okinawan | 33 | 0.0% |
| Osage | 20 | 0.0% |
| Paiute | 133 | 0.0% |
| Pakistani | 1,685 | 0.1% |
| Palestinian | 208 | 0.0% |
| Panamanian | 377 | 0.0% |
| Paraguayan | 400 | 0.0% |
| Pennsylvania German | 29 | 0.0% |
| Peruvian | 6,194 | 0.5% |
| Pima | 176 | 0.0% |
| Polish | 11,023 | 0.9% |
| Portuguese | 2,029 | 0.2% |
| Potawatomi | 102 | 0.0% |
| Pueblo | 643 | 0.1% |
| Puerto Rican | 5,745 | 0.5% |
| Puget Sound Salish | 10 | 0.0% |
| Romanian | 1,074 | 0.1% |
| Russian | 5,012 | 0.4% |
| Salvadoran | 5,692 | 0.5% |
| Samoan | 9,575 | 0.8% |
| Scandinavian | 15,632 | 1.3% |
| Scotch-Irish | 9,780 | 0.8% |
| Scottish | 41,758 | 3.5% |
| Senegalese | 6 | 0.0% |
| Serbian | 504 | 0.0% |
| Shoshone | 746 | 0.1% |
| Sierra Leonean | 148 | 0.0% |
| Sioux | 793 | 0.1% |
| Slavic | 380 | 0.0% |
| Slovak | 564 | 0.1% |
| Slovene | 344 | 0.0% |
| Somali | 2,335 | 0.2% |
| South African | 408 | 0.0% |
| South American | 25,272 | 2.1% |
| South American Indian | 772 | 0.1% |
| Spaniard | 4,996 | 0.4% |
| Spanish | 6,955 | 0.6% |
| Spanish American | 198 | 0.0% |
| Spanish American Indian | 136 | 0.0% |
| Sri Lankan | 8,591 | 0.7% |
| Subsaharan African | 12,763 | 1.1% |
| Sudanese | 2,055 | 0.2% |
| Swedish | 34,917 | 3.0% |
| Swiss | 9,550 | 0.8% |
| Syrian | 468 | 0.0% |
| Thai | 10,795 | 0.9% |
| Tlingit-Haida | 127 | 0.0% |
| Tohono O'Odham | 8 | 0.0% |
| Tongan | 11,349 | 1.0% |
| Trinidadian and Tobagonian | 89 | 0.0% |
| Turkish | 315 | 0.0% |
| Ugandan | 223 | 0.0% |
| Ukrainian | 1,436 | 0.1% |
| Uruguayan | 470 | 0.0% |
| Ute | 464 | 0.0% |
| Venezuelan | 7,501 | 0.6% |
| Vietnamese | 67 | 0.0% |
| Welsh | 18,668 | 1.6% |
| West Indian | 115 | 0.0% |
| Yakama | 94 | 0.0% |
| Yaqui | 62 | 0.0% |
| Yugoslavian | 3,322 | 0.3% |
| Yuman | 43 | 0.0% |
| Yup'ik | 16 | 0.0% |
| Zimbabwean | 103 | 0.0% | View All 182 Rows |
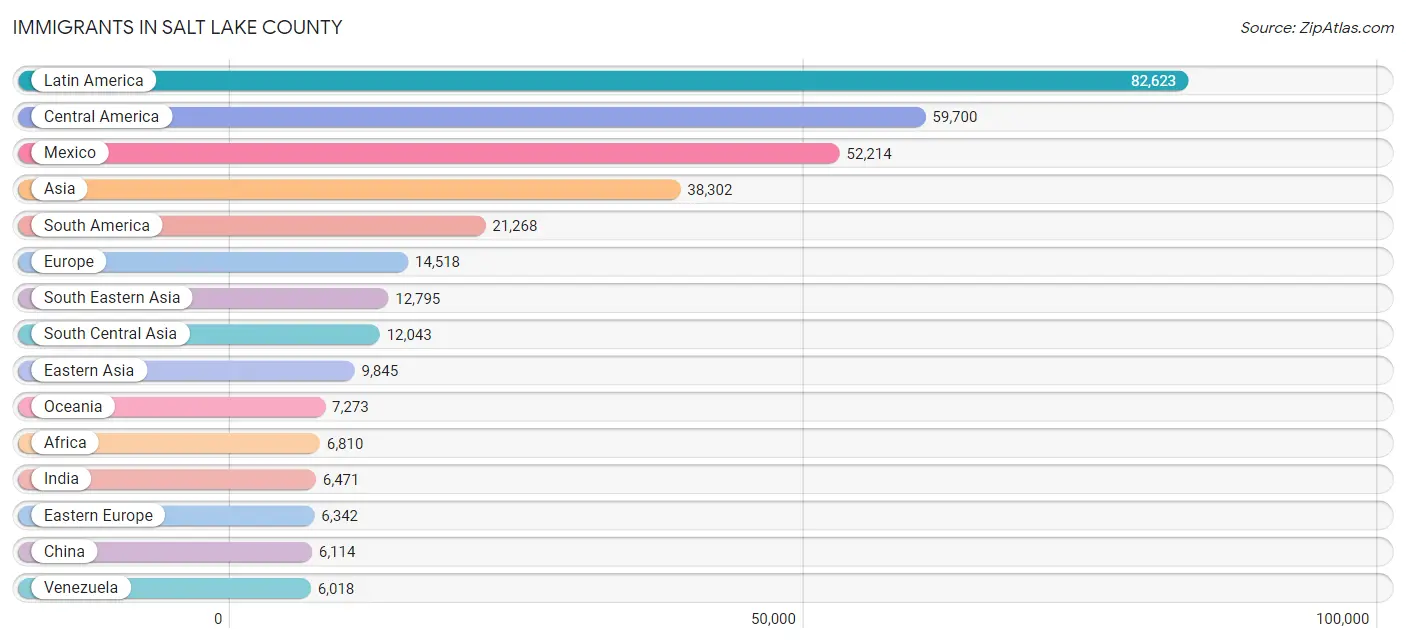
Immigrants in Salt Lake County
The most numerous immigrant groups reported in Salt Lake County came from Latin America (82,623 | 7.0%), Central America (59,700 | 5.1%), Mexico (52,214 | 4.4%), Asia (38,302 | 3.2%), and South America (21,268 | 1.8%), together accounting for 21.5% of all Salt Lake County residents.
| Immigration Origin | # Population | % Population |
| Afghanistan | 575 | 0.1% |
| Africa | 6,810 | 0.6% |
| Albania | 106 | 0.0% |
| Argentina | 1,386 | 0.1% |
| Armenia | 279 | 0.0% |
| Asia | 38,302 | 3.2% |
| Australia | 555 | 0.1% |
| Austria | 82 | 0.0% |
| Bangladesh | 124 | 0.0% |
| Barbados | 18 | 0.0% |
| Belarus | 180 | 0.0% |
| Belgium | 56 | 0.0% |
| Belize | 99 | 0.0% |
| Bolivia | 417 | 0.0% |
| Bosnia and Herzegovina | 1,466 | 0.1% |
| Brazil | 3,630 | 0.3% |
| Bulgaria | 134 | 0.0% |
| Cambodia | 1,058 | 0.1% |
| Canada | 3,116 | 0.3% |
| Caribbean | 1,655 | 0.1% |
| Central America | 59,700 | 5.1% |
| Chile | 1,387 | 0.1% |
| China | 6,114 | 0.5% |
| Colombia | 3,466 | 0.3% |
| Congo | 471 | 0.0% |
| Costa Rica | 217 | 0.0% |
| Croatia | 141 | 0.0% |
| Cuba | 604 | 0.1% |
| Czechoslovakia | 337 | 0.0% |
| Denmark | 223 | 0.0% |
| Dominican Republic | 488 | 0.0% |
| Eastern Africa | 3,194 | 0.3% |
| Eastern Asia | 9,845 | 0.8% |
| Eastern Europe | 6,342 | 0.5% |
| Ecuador | 956 | 0.1% |
| Egypt | 368 | 0.0% |
| El Salvador | 2,687 | 0.2% |
| England | 1,416 | 0.1% |
| Eritrea | 194 | 0.0% |
| Ethiopia | 447 | 0.0% |
| Europe | 14,518 | 1.2% |
| Fiji | 242 | 0.0% |
| France | 272 | 0.0% |
| Germany | 1,954 | 0.2% |
| Ghana | 96 | 0.0% |
| Greece | 294 | 0.0% |
| Guatemala | 2,835 | 0.2% |
| Guyana | 54 | 0.0% |
| Haiti | 183 | 0.0% |
| Honduras | 1,320 | 0.1% |
| Hong Kong | 467 | 0.0% |
| Hungary | 365 | 0.0% |
| India | 6,471 | 0.5% |
| Indonesia | 186 | 0.0% |
| Iran | 1,801 | 0.2% |
| Iraq | 1,639 | 0.1% |
| Ireland | 102 | 0.0% |
| Israel | 114 | 0.0% |
| Italy | 353 | 0.0% |
| Jamaica | 282 | 0.0% |
| Japan | 1,069 | 0.1% |
| Jordan | 102 | 0.0% |
| Kazakhstan | 111 | 0.0% |
| Kenya | 238 | 0.0% |
| Korea | 2,538 | 0.2% |
| Kuwait | 251 | 0.0% |
| Laos | 893 | 0.1% |
| Latin America | 82,623 | 7.0% |
| Latvia | 9 | 0.0% |
| Lebanon | 137 | 0.0% |
| Liberia | 165 | 0.0% |
| Lithuania | 103 | 0.0% |
| Malaysia | 393 | 0.0% |
| Mexico | 52,214 | 4.4% |
| Micronesia | 191 | 0.0% |
| Middle Africa | 669 | 0.1% |
| Moldova | 201 | 0.0% |
| Morocco | 71 | 0.0% |
| Nepal | 906 | 0.1% |
| Netherlands | 884 | 0.1% |
| Nicaragua | 214 | 0.0% |
| Nigeria | 148 | 0.0% |
| North Macedonia | 14 | 0.0% |
| Northern Africa | 1,327 | 0.1% |
| Northern Europe | 3,285 | 0.3% |
| Norway | 147 | 0.0% |
| Oceania | 7,273 | 0.6% |
| Pakistan | 1,318 | 0.1% |
| Panama | 93 | 0.0% |
| Peru | 3,617 | 0.3% |
| Philippines | 2,762 | 0.2% |
| Poland | 651 | 0.1% |
| Portugal | 76 | 0.0% |
| Romania | 340 | 0.0% |
| Russia | 855 | 0.1% |
| Saudi Arabia | 153 | 0.0% |
| Scotland | 161 | 0.0% |
| Senegal | 6 | 0.0% |
| Serbia | 136 | 0.0% |
| Sierra Leone | 160 | 0.0% |
| Singapore | 122 | 0.0% |
| Somalia | 607 | 0.1% |
| South Africa | 384 | 0.0% |
| South America | 21,268 | 1.8% |
| South Central Asia | 12,043 | 1.0% |
| South Eastern Asia | 12,795 | 1.1% |
| Southern Europe | 1,379 | 0.1% |
| Spain | 640 | 0.1% |
| Sri Lanka | 118 | 0.0% |
| Sudan | 864 | 0.1% |
| Sweden | 290 | 0.0% |
| Switzerland | 185 | 0.0% |
| Syria | 330 | 0.0% |
| Taiwan | 320 | 0.0% |
| Thailand | 1,212 | 0.1% |
| Trinidad and Tobago | 80 | 0.0% |
| Turkey | 229 | 0.0% |
| Uganda | 138 | 0.0% |
| Ukraine | 375 | 0.0% |
| Uruguay | 190 | 0.0% |
| Uzbekistan | 95 | 0.0% |
| Venezuela | 6,018 | 0.5% |
| Vietnam | 5,270 | 0.4% |
| Western Africa | 914 | 0.1% |
| Western Asia | 3,509 | 0.3% |
| Western Europe | 3,441 | 0.3% |
| Yemen | 8 | 0.0% |
| Zaire | 177 | 0.0% |
| Zimbabwe | 157 | 0.0% | View All 129 Rows |
Sex and Age in Salt Lake County
Sex and Age in Salt Lake County
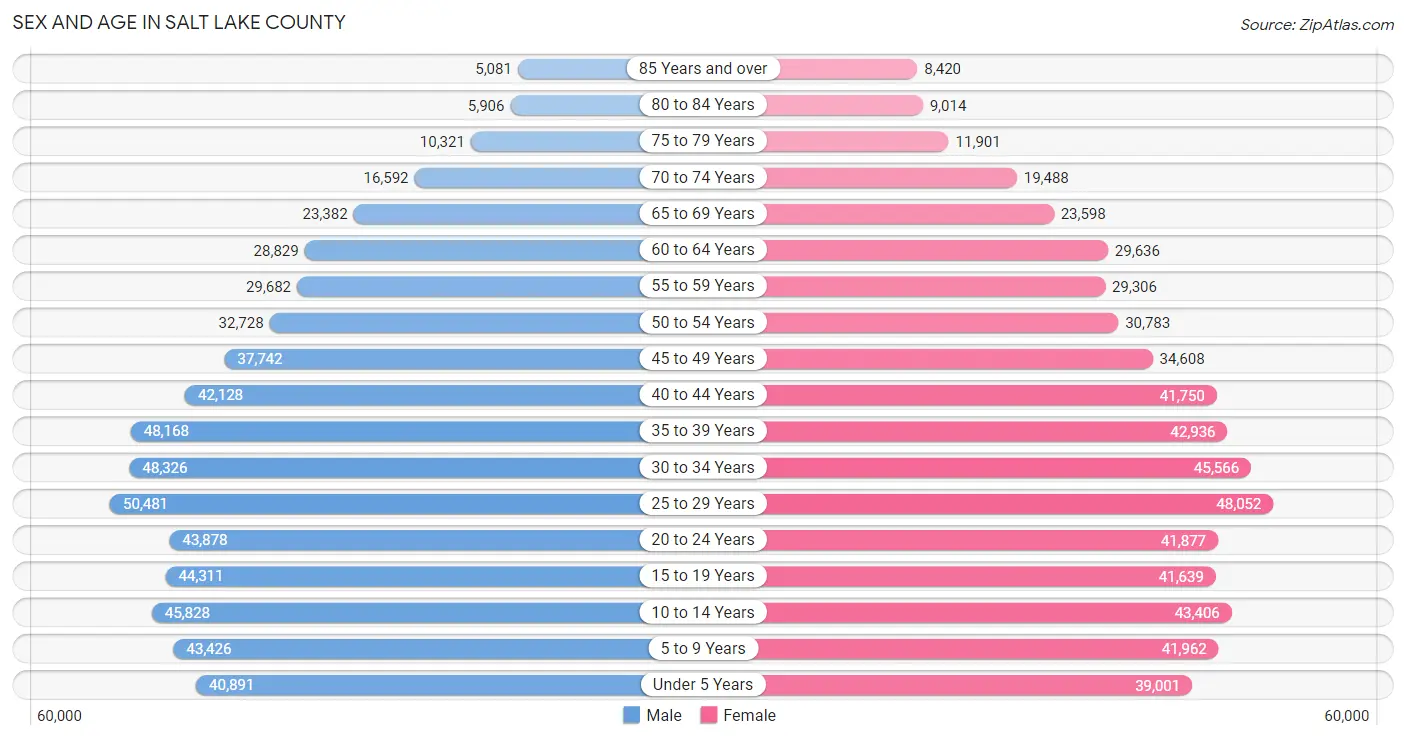
The most populous age groups in Salt Lake County are 25 to 29 Years (50,481 | 8.5%) for men and 25 to 29 Years (48,052 | 8.2%) for women.
| Age Bracket | Male | Female |
| Under 5 Years | 40,891 (6.8%) | 39,001 (6.7%) |
| 5 to 9 Years | 43,426 (7.3%) | 41,962 (7.2%) |
| 10 to 14 Years | 45,828 (7.7%) | 43,406 (7.4%) |
| 15 to 19 Years | 44,311 (7.4%) | 41,639 (7.1%) |
| 20 to 24 Years | 43,878 (7.3%) | 41,877 (7.2%) |
| 25 to 29 Years | 50,481 (8.5%) | 48,052 (8.2%) |
| 30 to 34 Years | 48,326 (8.1%) | 45,566 (7.8%) |
| 35 to 39 Years | 48,168 (8.1%) | 42,936 (7.4%) |
| 40 to 44 Years | 42,128 (7.0%) | 41,750 (7.2%) |
| 45 to 49 Years | 37,742 (6.3%) | 34,608 (5.9%) |
| 50 to 54 Years | 32,728 (5.5%) | 30,783 (5.3%) |
| 55 to 59 Years | 29,682 (5.0%) | 29,306 (5.0%) |
| 60 to 64 Years | 28,829 (4.8%) | 29,636 (5.1%) |
| 65 to 69 Years | 23,382 (3.9%) | 23,598 (4.1%) |
| 70 to 74 Years | 16,592 (2.8%) | 19,488 (3.3%) |
| 75 to 79 Years | 10,321 (1.7%) | 11,901 (2.0%) |
| 80 to 84 Years | 5,906 (1.0%) | 9,014 (1.5%) |
| 85 Years and over | 5,081 (0.9%) | 8,420 (1.4%) |
| Total | 597,700 (100.0%) | 582,943 (100.0%) |
Families and Households in Salt Lake County
Median Family Size in Salt Lake County
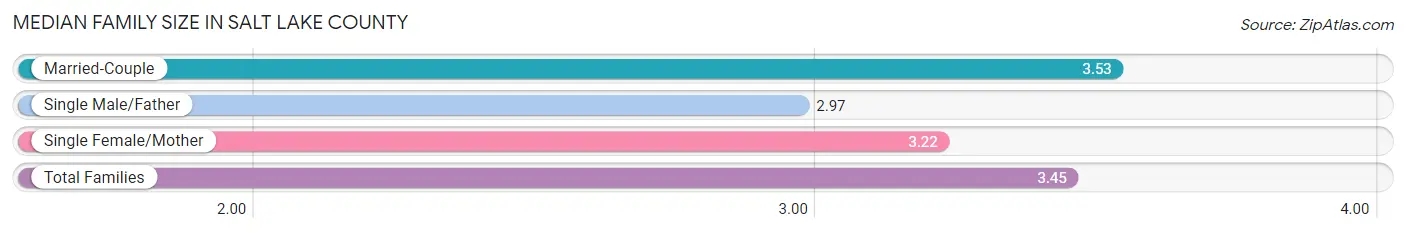
The median family size in Salt Lake County is 3.45 persons per family, with married-couple families (216,023 | 78.0%) accounting for the largest median family size of 3.53 persons per family. On the other hand, single male/father families (20,098 | 7.3%) represent the smallest median family size with 2.97 persons per family.
| Family Type | # Families | Family Size |
| Married-Couple | 216,023 (78.0%) | 3.53 |
| Single Male/Father | 20,098 (7.3%) | 2.97 |
| Single Female/Mother | 40,724 (14.7%) | 3.22 |
| Total Families | 276,845 (100.0%) | 3.45 |
Median Household Size in Salt Lake County
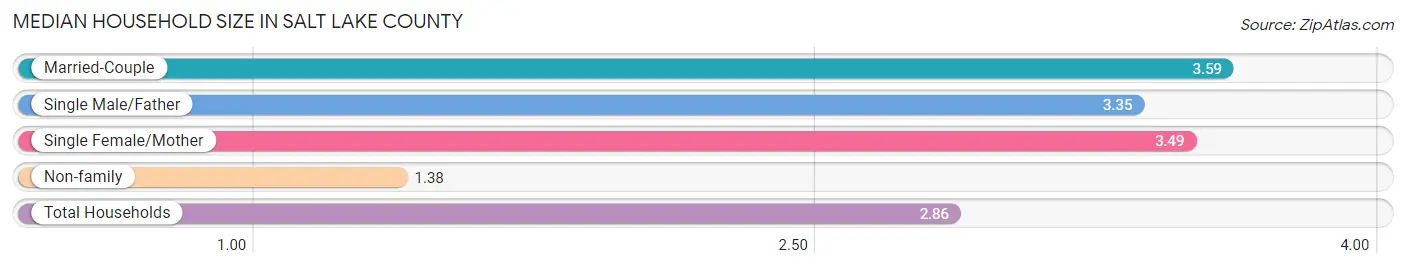
The median household size in Salt Lake County is 2.86 persons per household, with married-couple households (216,023 | 53.0%) accounting for the largest median household size of 3.59 persons per household. non-family households (130,828 | 32.1%) represent the smallest median household size with 1.38 persons per household.
| Household Type | # Households | Household Size |
| Married-Couple | 216,023 (53.0%) | 3.59 |
| Single Male/Father | 20,098 (4.9%) | 3.35 |
| Single Female/Mother | 40,724 (10.0%) | 3.49 |
| Non-family | 130,828 (32.1%) | 1.38 |
| Total Households | 407,673 (100.0%) | 2.86 |
Household Size by Marriage Status in Salt Lake County
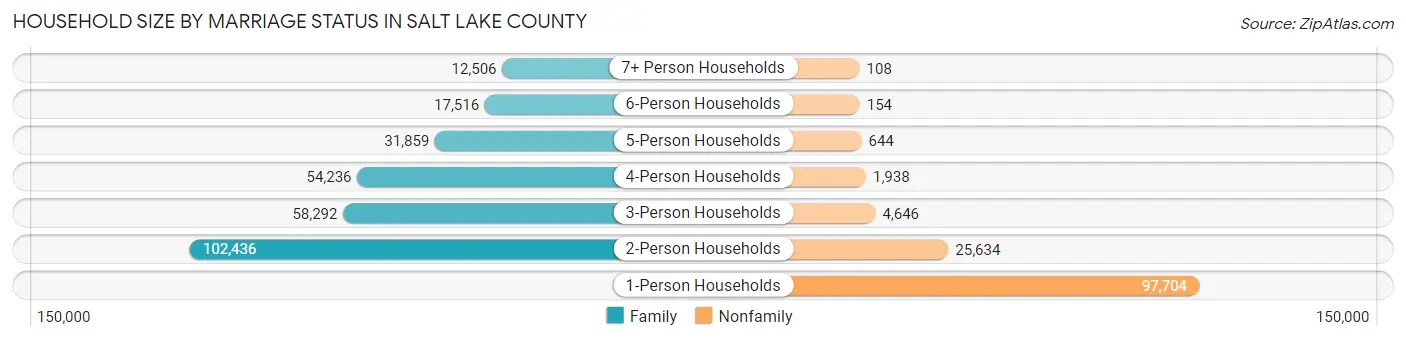
Out of a total of 407,673 households in Salt Lake County, 276,845 (67.9%) are family households, while 130,828 (32.1%) are nonfamily households. The most numerous type of family households are 2-person households, comprising 102,436, and the most common type of nonfamily households are 1-person households, comprising 97,704.
| Household Size | Family Households | Nonfamily Households |
| 1-Person Households | - | 97,704 (24.0%) |
| 2-Person Households | 102,436 (25.1%) | 25,634 (6.3%) |
| 3-Person Households | 58,292 (14.3%) | 4,646 (1.1%) |
| 4-Person Households | 54,236 (13.3%) | 1,938 (0.5%) |
| 5-Person Households | 31,859 (7.8%) | 644 (0.2%) |
| 6-Person Households | 17,516 (4.3%) | 154 (0.0%) |
| 7+ Person Households | 12,506 (3.1%) | 108 (0.0%) |
| Total | 276,845 (67.9%) | 130,828 (32.1%) |
Female Fertility in Salt Lake County
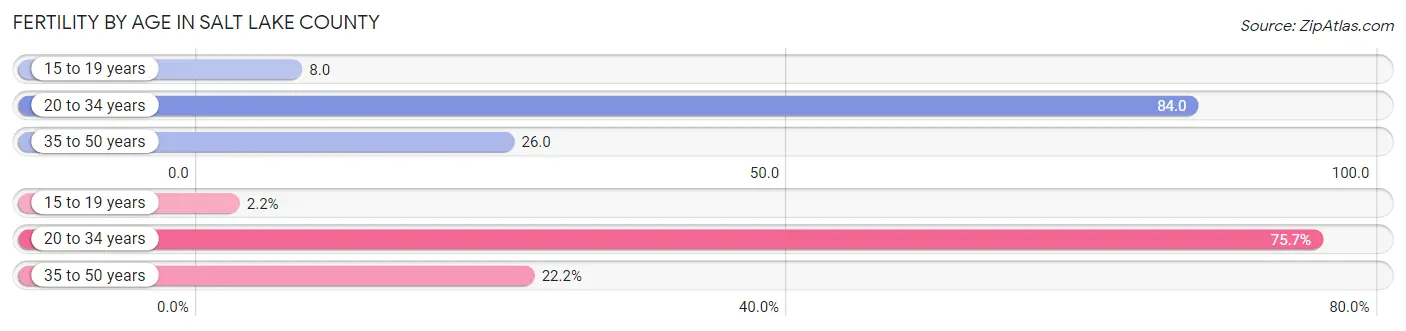
Fertility by Age in Salt Lake County
Average fertility rate in Salt Lake County is 50.0 births per 1,000 women. Women in the age bracket of 20 to 34 years have the highest fertility rate with 84.0 births per 1,000 women. Women in the age bracket of 20 to 34 years acount for 75.7% of all women with births.
| Age Bracket | Women with Births | Births / 1,000 Women |
| 15 to 19 years | 326 (2.2%) | 8.0 |
| 20 to 34 years | 11,400 (75.7%) | 84.0 |
| 35 to 50 years | 3,341 (22.2%) | 26.0 |
| Total | 15,067 (100.0%) | 50.0 |
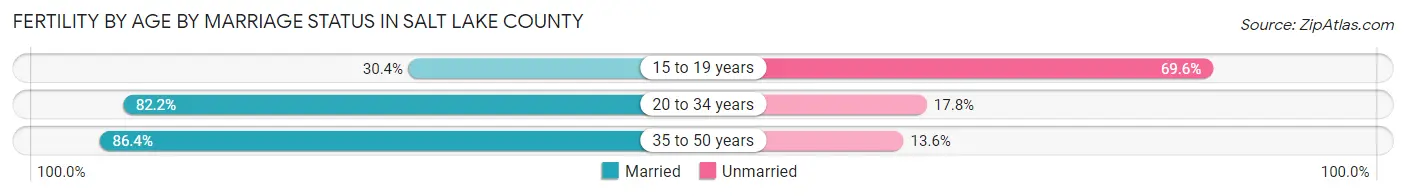
Fertility by Age by Marriage Status in Salt Lake County
82.0% of women with births (15,067) in Salt Lake County are married. The highest percentage of unmarried women with births falls into 15 to 19 years age bracket with 69.6% of them unmarried at the time of birth, while the lowest percentage of unmarried women with births belong to 35 to 50 years age bracket with 13.6% of them unmarried.
| Age Bracket | Married | Unmarried |
| 15 to 19 years | 99 (30.4%) | 227 (69.6%) |
| 20 to 34 years | 9,371 (82.2%) | 2,029 (17.8%) |
| 35 to 50 years | 2,887 (86.4%) | 454 (13.6%) |
| Total | 12,355 (82.0%) | 2,712 (18.0%) |
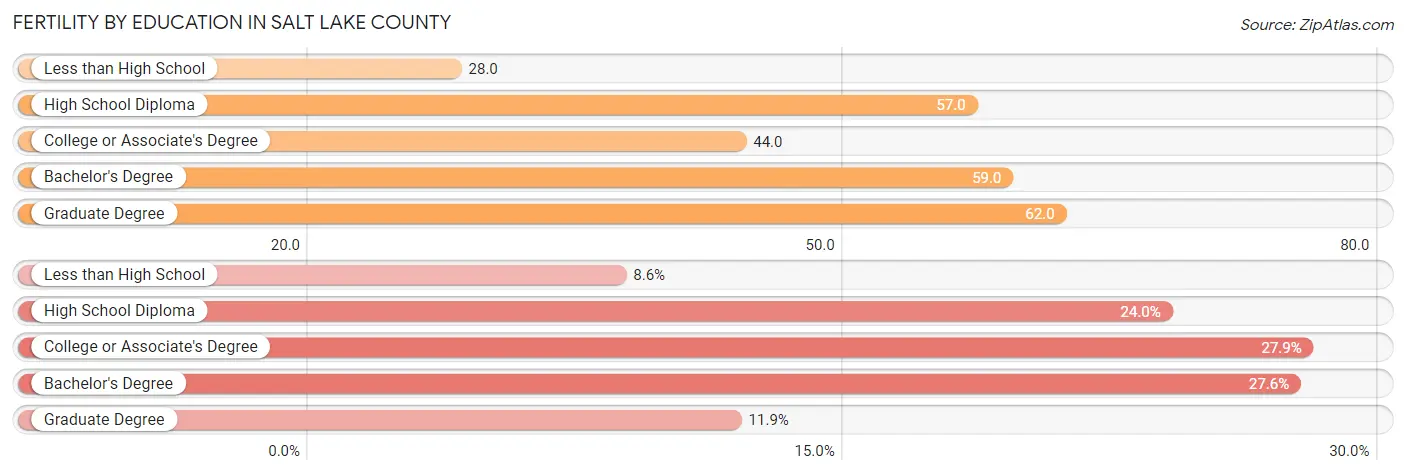
Fertility by Education in Salt Lake County
Average fertility rate in Salt Lake County is 50.0 births per 1,000 women. Women with the education attainment of graduate degree have the highest fertility rate of 62.0 births per 1,000 women, while women with the education attainment of less than high school have the lowest fertility at 28.0 births per 1,000 women. Women with the education attainment of college or associate's degree represent 27.9% of all women with births.
| Educational Attainment | Women with Births | Births / 1,000 Women |
| Less than High School | 1,300 (8.6%) | 28.0 |
| High School Diploma | 3,613 (24.0%) | 57.0 |
| College or Associate's Degree | 4,209 (27.9%) | 44.0 |
| Bachelor's Degree | 4,157 (27.6%) | 59.0 |
| Graduate Degree | 1,788 (11.9%) | 62.0 |
| Total | 15,067 (100.0%) | 50.0 |
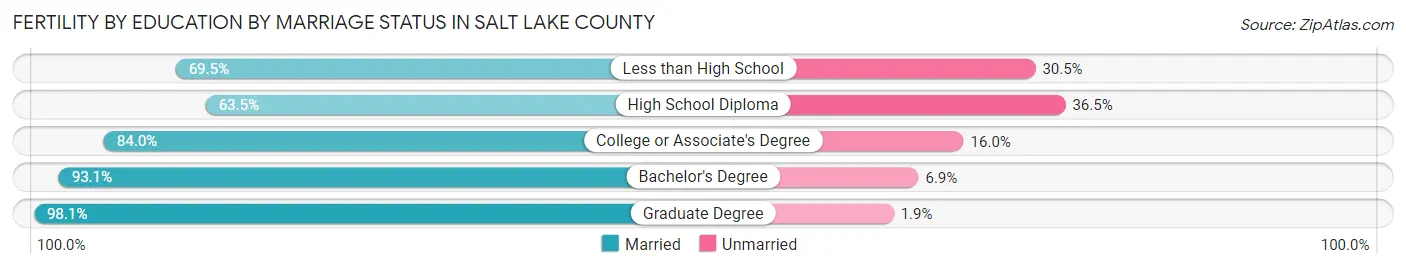
Fertility by Education by Marriage Status in Salt Lake County
18.0% of women with births in Salt Lake County are unmarried. Women with the educational attainment of graduate degree are most likely to be married with 98.1% of them married at childbirth, while women with the educational attainment of high school diploma are least likely to be married with 36.5% of them unmarried at childbirth.
| Educational Attainment | Married | Unmarried |
| Less than High School | 904 (69.5%) | 396 (30.5%) |
| High School Diploma | 2,294 (63.5%) | 1,319 (36.5%) |
| College or Associate's Degree | 3,536 (84.0%) | 673 (16.0%) |
| Bachelor's Degree | 3,870 (93.1%) | 287 (6.9%) |
| Graduate Degree | 1,754 (98.1%) | 34 (1.9%) |
| Total | 12,355 (82.0%) | 2,712 (18.0%) |
Income in Salt Lake County
Income Overview in Salt Lake County
Per Capita Income in Salt Lake County is $40,969, while median incomes of families and households are $106,281 and $90,011 respectively.
| Characteristic | Number | Measure |
| Per Capita Income | 1,180,643 | $40,969 |
| Median Family Income | 276,845 | $106,281 |
| Mean Family Income | 276,845 | $133,343 |
| Median Household Income | 407,673 | $90,011 |
| Mean Household Income | 407,673 | $115,832 |
| Income Deficit | 276,845 | $11,144 |
| Wage / Income Gap (%) | 1,180,643 | 32.96% |
| Wage / Income Gap ($) | 1,180,643 | 67.04¢ per $1 |
| Gini / Inequality Index | 1,180,643 | 0.43 |
Earnings by Sex in Salt Lake County
Average Earnings in Salt Lake County are $43,501, $52,378 for men and $35,115 for women, a difference of 33.0%.
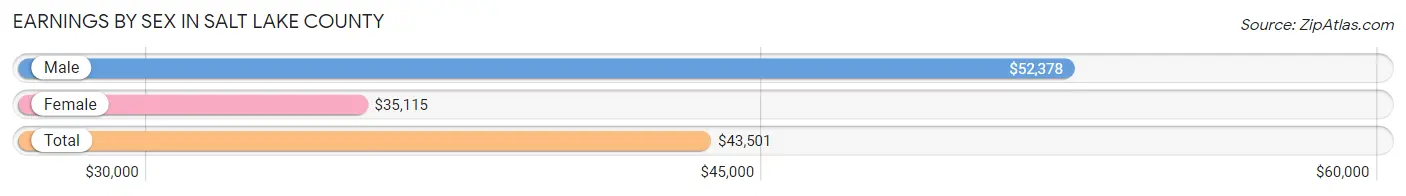
| Sex | Number | Average Earnings |
| Male | 371,538 (54.6%) | $52,378 |
| Female | 309,467 (45.4%) | $35,115 |
| Total | 681,005 (100.0%) | $43,501 |
Earnings by Sex by Income Bracket in Salt Lake County
The most common earnings brackets in Salt Lake County are $100,000+ for men (74,016 | 19.9%) and $75,000 to $99,999 for women (24,140 | 7.8%).
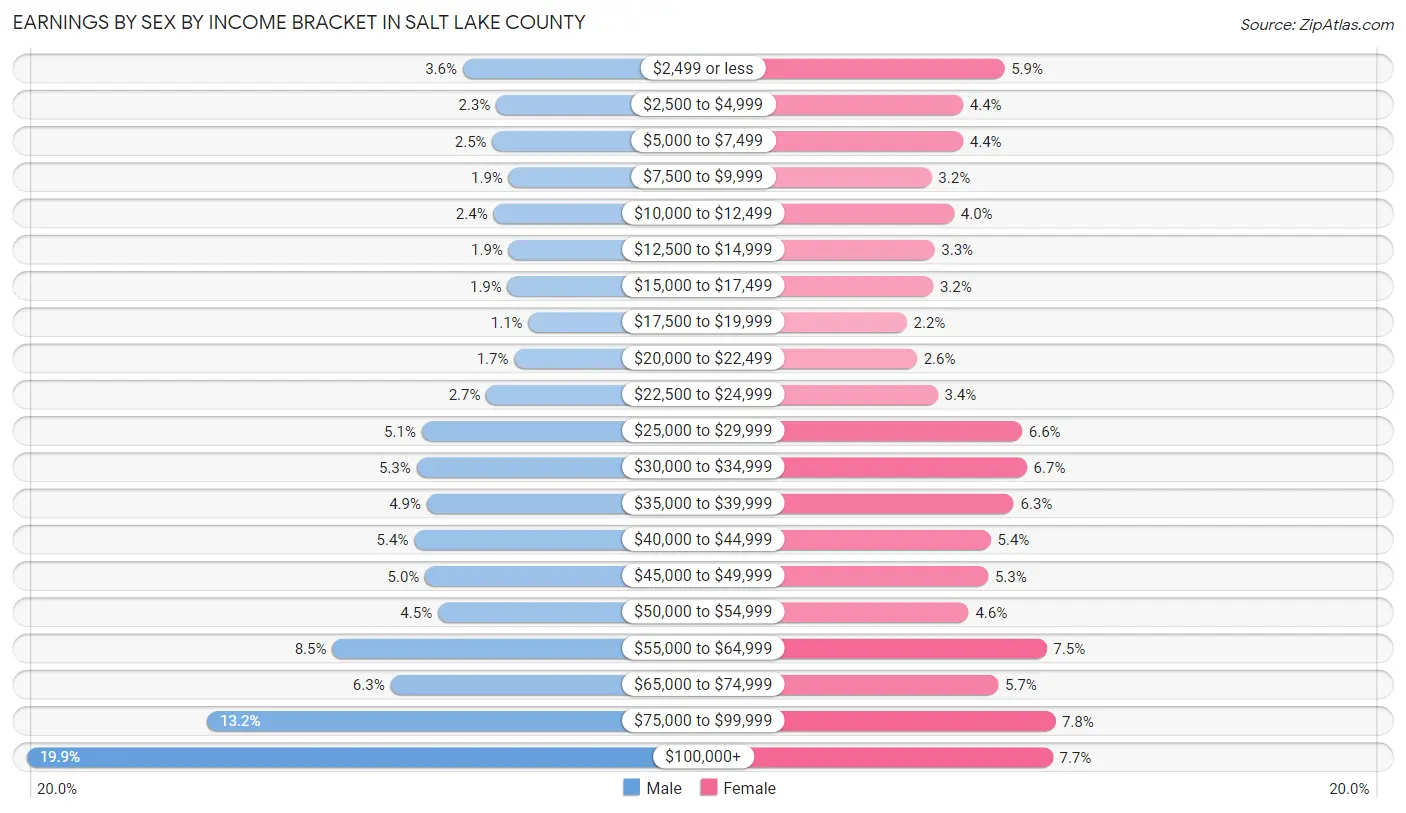
| Income | Male | Female |
| $2,499 or less | 13,297 (3.6%) | 18,262 (5.9%) |
| $2,500 to $4,999 | 8,643 (2.3%) | 13,476 (4.3%) |
| $5,000 to $7,499 | 9,175 (2.5%) | 13,467 (4.3%) |
| $7,500 to $9,999 | 6,926 (1.9%) | 9,809 (3.2%) |
| $10,000 to $12,499 | 9,040 (2.4%) | 12,415 (4.0%) |
| $12,500 to $14,999 | 6,917 (1.9%) | 10,154 (3.3%) |
| $15,000 to $17,499 | 7,047 (1.9%) | 9,986 (3.2%) |
| $17,500 to $19,999 | 4,173 (1.1%) | 6,945 (2.2%) |
| $20,000 to $22,499 | 6,118 (1.7%) | 8,095 (2.6%) |
| $22,500 to $24,999 | 10,047 (2.7%) | 10,507 (3.4%) |
| $25,000 to $29,999 | 19,028 (5.1%) | 20,300 (6.6%) |
| $30,000 to $34,999 | 19,720 (5.3%) | 20,857 (6.7%) |
| $35,000 to $39,999 | 18,328 (4.9%) | 19,328 (6.2%) |
| $40,000 to $44,999 | 20,047 (5.4%) | 16,690 (5.4%) |
| $45,000 to $49,999 | 18,540 (5.0%) | 16,366 (5.3%) |
| $50,000 to $54,999 | 16,746 (4.5%) | 14,127 (4.6%) |
| $55,000 to $64,999 | 31,453 (8.5%) | 23,143 (7.5%) |
| $65,000 to $74,999 | 23,369 (6.3%) | 17,549 (5.7%) |
| $75,000 to $99,999 | 48,908 (13.2%) | 24,140 (7.8%) |
| $100,000+ | 74,016 (19.9%) | 23,851 (7.7%) |
| Total | 371,538 (100.0%) | 309,467 (100.0%) |
Earnings by Sex by Educational Attainment in Salt Lake County
Average earnings in Salt Lake County are $60,350 for men and $41,335 for women, a difference of 31.5%. Men with an educational attainment of graduate degree enjoy the highest average annual earnings of $102,914, while those with less than high school education earn the least with $40,092. Women with an educational attainment of graduate degree earn the most with the average annual earnings of $70,696, while those with less than high school education have the smallest earnings of $27,018.
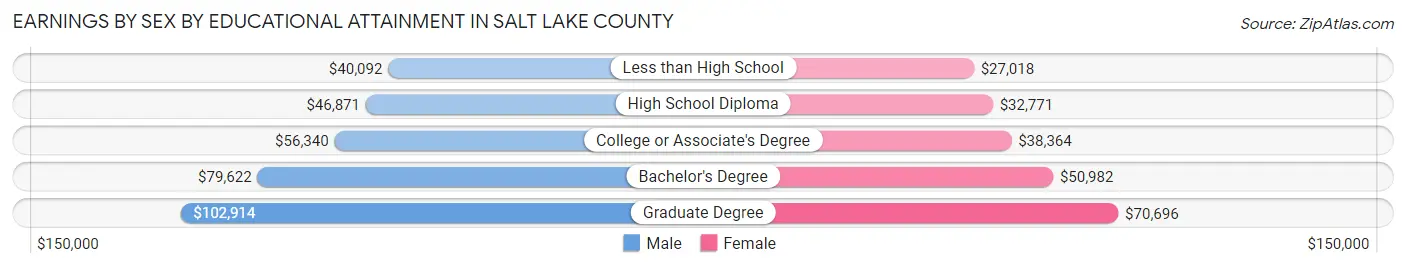
| Educational Attainment | Male Income | Female Income |
| Less than High School | $40,092 | $27,018 |
| High School Diploma | $46,871 | $32,771 |
| College or Associate's Degree | $56,340 | $38,364 |
| Bachelor's Degree | $79,622 | $50,982 |
| Graduate Degree | $102,914 | $70,696 |
| Total | $60,350 | $41,335 |
Family Income in Salt Lake County
Family Income Brackets in Salt Lake County
According to the Salt Lake County family income data, there are 66,996 families falling into the $100,000 to $149,999 income range, which is the most common income bracket and makes up 24.2% of all families. Conversely, the $10,000 to $14,999 income bracket is the least frequent group with only 3,045 families (1.1%) belonging to this category.
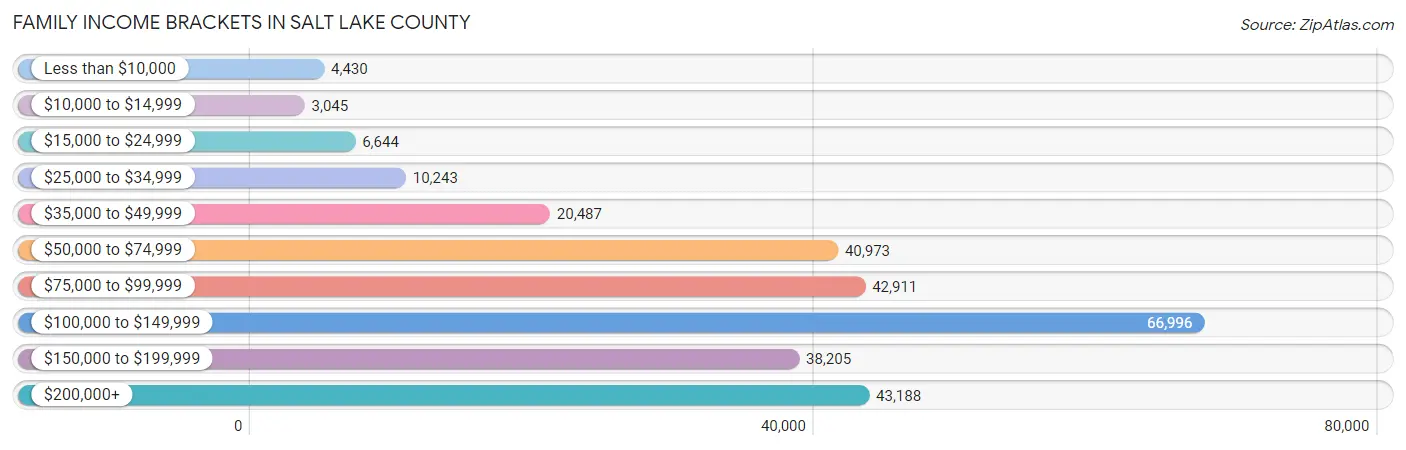
| Income Bracket | # Families | % Families |
| Less than $10,000 | 4,430 | 1.6% |
| $10,000 to $14,999 | 3,045 | 1.1% |
| $15,000 to $24,999 | 6,644 | 2.4% |
| $25,000 to $34,999 | 10,243 | 3.7% |
| $35,000 to $49,999 | 20,487 | 7.4% |
| $50,000 to $74,999 | 40,973 | 14.8% |
| $75,000 to $99,999 | 42,911 | 15.5% |
| $100,000 to $149,999 | 66,996 | 24.2% |
| $150,000 to $199,999 | 38,205 | 13.8% |
| $200,000+ | 43,188 | 15.6% |
Family Income by Famaliy Size in Salt Lake County
7+ person families (10,799 | 3.9%) account for the highest median family income in Salt Lake County with $142,939 per family, while 2-person families (111,753 | 40.4%) have the highest median income of $45,661 per family member.
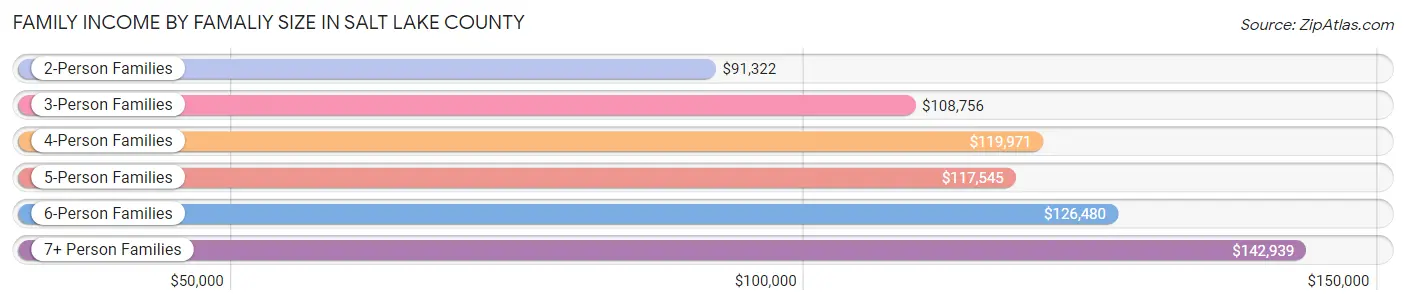
| Income Bracket | # Families | Median Income |
| 2-Person Families | 111,753 (40.4%) | $91,322 |
| 3-Person Families | 56,334 (20.3%) | $108,756 |
| 4-Person Families | 51,367 (18.5%) | $119,971 |
| 5-Person Families | 30,081 (10.9%) | $117,545 |
| 6-Person Families | 16,511 (6.0%) | $126,480 |
| 7+ Person Families | 10,799 (3.9%) | $142,939 |
| Total | 276,845 (100.0%) | $106,281 |
Family Income by Number of Earners in Salt Lake County
The median family income in Salt Lake County is $106,281, with families comprising 3+ earners (50,460) having the highest median family income of $152,383, while families with no earners (24,963) have the lowest median family income of $58,743, accounting for 18.2% and 9.0% of families, respectively.
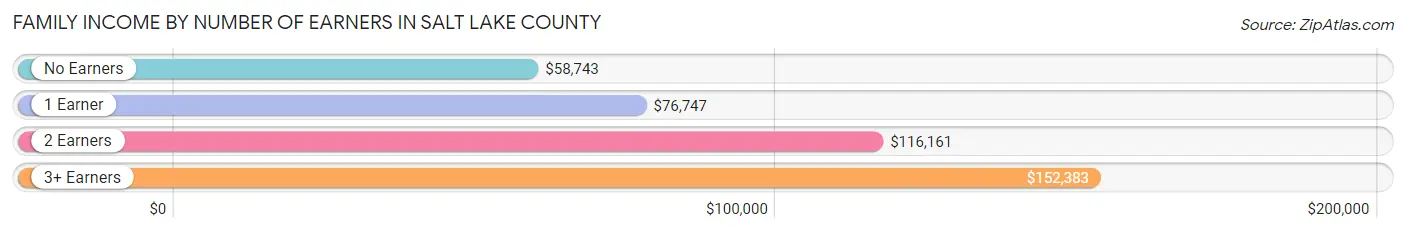
| Number of Earners | # Families | Median Income |
| No Earners | 24,963 (9.0%) | $58,743 |
| 1 Earner | 74,036 (26.7%) | $76,747 |
| 2 Earners | 127,386 (46.0%) | $116,161 |
| 3+ Earners | 50,460 (18.2%) | $152,383 |
| Total | 276,845 (100.0%) | $106,281 |
Household Income in Salt Lake County
Household Income Brackets in Salt Lake County
With 84,796 households falling in the category, the $100,000 to $149,999 income range is the most frequent in Salt Lake County, accounting for 20.8% of all households. In contrast, only 9,376 households (2.3%) fall into the $10,000 to $14,999 income bracket, making it the least populous group.
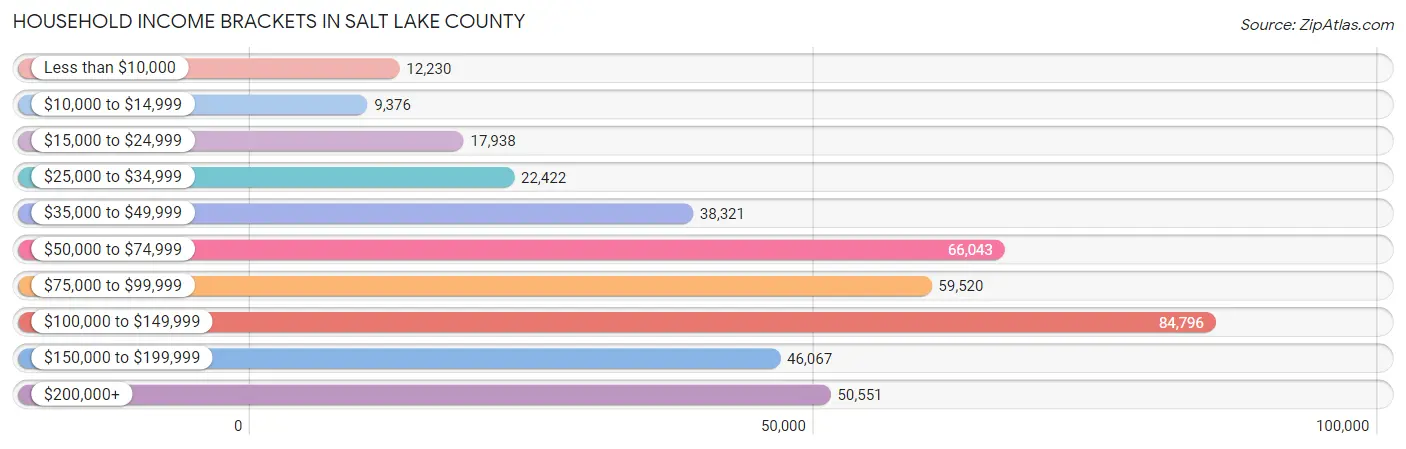
| Income Bracket | # Households | % Households |
| Less than $10,000 | 12,230 | 3.0% |
| $10,000 to $14,999 | 9,376 | 2.3% |
| $15,000 to $24,999 | 17,938 | 4.4% |
| $25,000 to $34,999 | 22,422 | 5.5% |
| $35,000 to $49,999 | 38,321 | 9.4% |
| $50,000 to $74,999 | 66,043 | 16.2% |
| $75,000 to $99,999 | 59,520 | 14.6% |
| $100,000 to $149,999 | 84,796 | 20.8% |
| $150,000 to $199,999 | 46,067 | 11.3% |
| $200,000+ | 50,551 | 12.4% |
Household Income by Householder Age in Salt Lake County
The median household income in Salt Lake County is $90,011, with the highest median household income of $109,459 found in the 45 to 64 years age bracket for the primary householder. A total of 136,078 households (33.4%) fall into this category. Meanwhile, the 15 to 24 years age bracket for the primary householder has the lowest median household income of $53,457, with 21,391 households (5.2%) in this group.
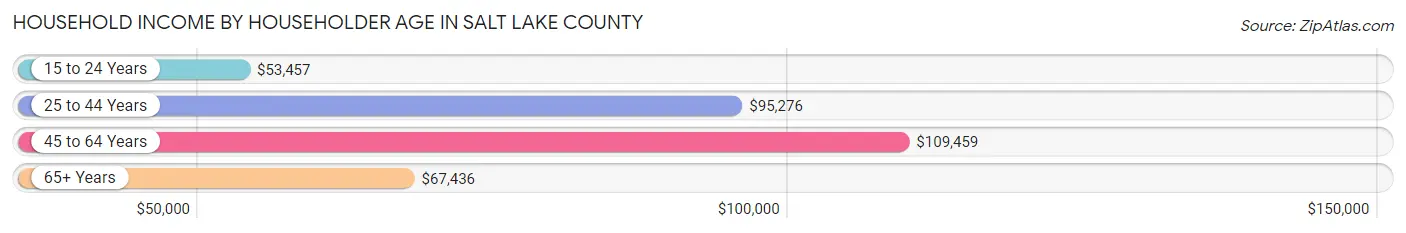
| Income Bracket | # Households | Median Income |
| 15 to 24 Years | 21,391 (5.2%) | $53,457 |
| 25 to 44 Years | 168,364 (41.3%) | $95,276 |
| 45 to 64 Years | 136,078 (33.4%) | $109,459 |
| 65+ Years | 81,840 (20.1%) | $67,436 |
| Total | 407,673 (100.0%) | $90,011 |
Poverty in Salt Lake County
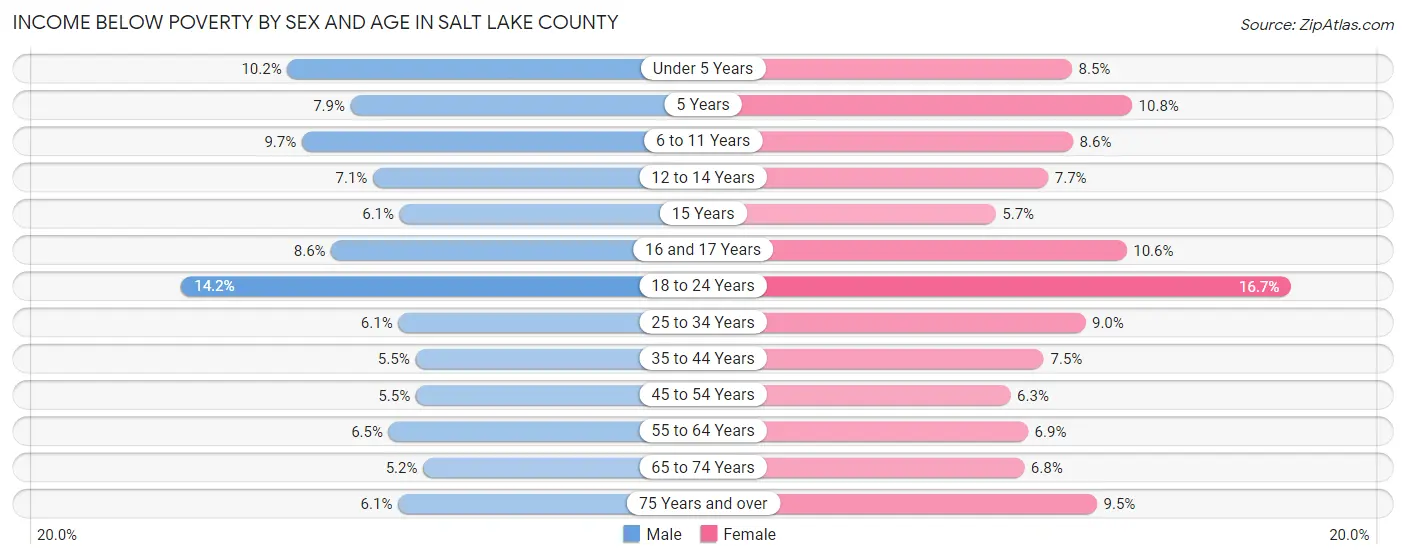
Income Below Poverty by Sex and Age in Salt Lake County
With 7.5% poverty level for males and 8.7% for females among the residents of Salt Lake County, 18 to 24 year old males and 18 to 24 year old females are the most vulnerable to poverty, with 8,267 males (14.2%) and 9,195 females (16.7%) in their respective age groups living below the poverty level.
| Age Bracket | Male | Female |
| Under 5 Years | 4,138 (10.2%) | 3,284 (8.5%) |
| 5 Years | 633 (7.9%) | 791 (10.8%) |
| 6 to 11 Years | 5,104 (9.7%) | 4,416 (8.6%) |
| 12 to 14 Years | 1,929 (7.1%) | 1,884 (7.6%) |
| 15 Years | 597 (6.1%) | 474 (5.7%) |
| 16 and 17 Years | 1,495 (8.6%) | 1,865 (10.6%) |
| 18 to 24 Years | 8,267 (14.2%) | 9,195 (16.7%) |
| 25 to 34 Years | 5,952 (6.1%) | 8,413 (9.0%) |
| 35 to 44 Years | 4,906 (5.5%) | 6,323 (7.5%) |
| 45 to 54 Years | 3,814 (5.5%) | 4,079 (6.2%) |
| 55 to 64 Years | 3,768 (6.5%) | 4,045 (6.9%) |
| 65 to 74 Years | 2,055 (5.2%) | 2,896 (6.8%) |
| 75 Years and over | 1,282 (6.1%) | 2,701 (9.5%) |
| Total | 43,940 (7.5%) | 50,366 (8.7%) |
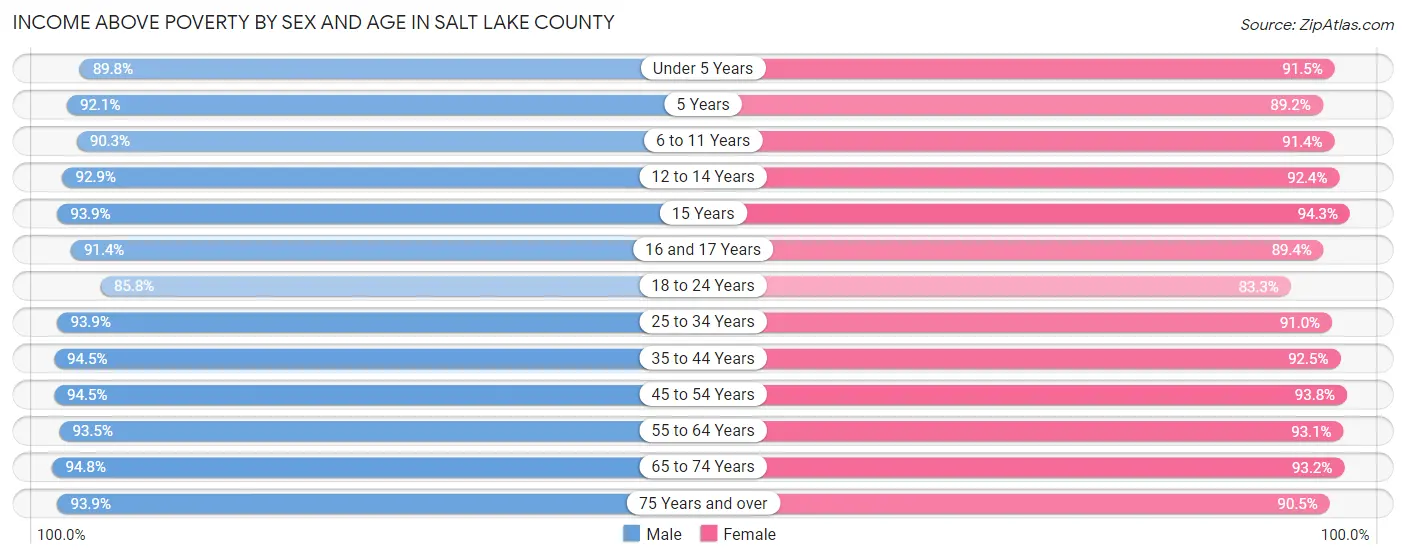
Income Above Poverty by Sex and Age in Salt Lake County
According to the poverty statistics in Salt Lake County, males aged 65 to 74 years and females aged 15 years are the age groups that are most secure financially, with 94.8% of males and 94.3% of females in these age groups living above the poverty line.
| Age Bracket | Male | Female |
| Under 5 Years | 36,257 (89.8%) | 35,210 (91.5%) |
| 5 Years | 7,391 (92.1%) | 6,562 (89.2%) |
| 6 to 11 Years | 47,511 (90.3%) | 47,119 (91.4%) |
| 12 to 14 Years | 25,384 (92.9%) | 22,745 (92.3%) |
| 15 Years | 9,233 (93.9%) | 7,845 (94.3%) |
| 16 and 17 Years | 15,860 (91.4%) | 15,792 (89.4%) |
| 18 to 24 Years | 50,016 (85.8%) | 45,945 (83.3%) |
| 25 to 34 Years | 91,322 (93.9%) | 84,732 (91.0%) |
| 35 to 44 Years | 84,524 (94.5%) | 78,134 (92.5%) |
| 45 to 54 Years | 65,899 (94.5%) | 61,163 (93.8%) |
| 55 to 64 Years | 54,345 (93.5%) | 54,572 (93.1%) |
| 65 to 74 Years | 37,443 (94.8%) | 39,949 (93.2%) |
| 75 Years and over | 19,641 (93.9%) | 25,863 (90.5%) |
| Total | 544,826 (92.5%) | 525,631 (91.3%) |
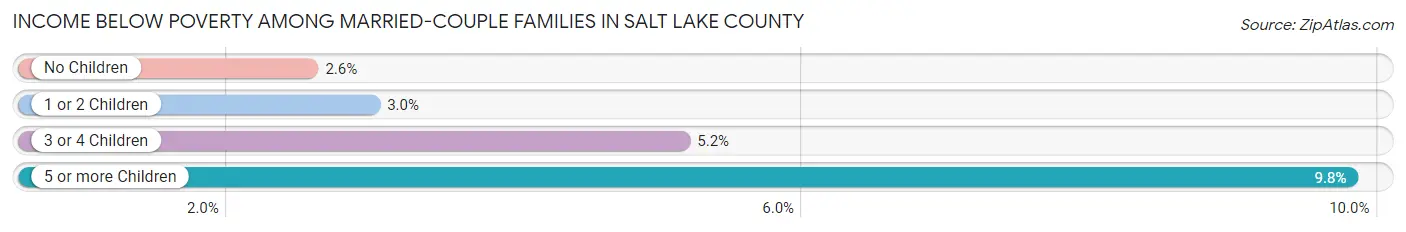
Income Below Poverty Among Married-Couple Families in Salt Lake County
The poverty statistics for married-couple families in Salt Lake County show that 3.2% or 6,917 of the total 216,023 families live below the poverty line. Families with 5 or more children have the highest poverty rate of 9.8%, comprising of 427 families. On the other hand, families with no children have the lowest poverty rate of 2.6%, which includes 2,813 families.
| Children | Above Poverty | Below Poverty |
| No Children | 107,236 (97.4%) | 2,813 (2.6%) |
| 1 or 2 Children | 70,024 (97.0%) | 2,160 (3.0%) |
| 3 or 4 Children | 27,916 (94.9%) | 1,517 (5.1%) |
| 5 or more Children | 3,930 (90.2%) | 427 (9.8%) |
| Total | 209,106 (96.8%) | 6,917 (3.2%) |
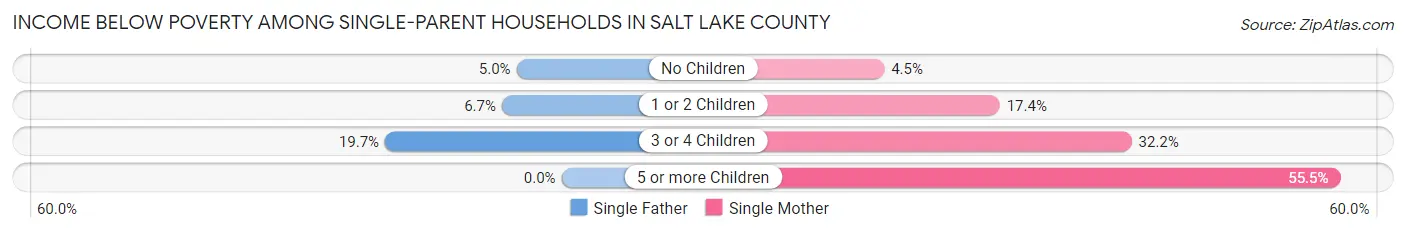
Income Below Poverty Among Single-Parent Households in Salt Lake County
According to the poverty data in Salt Lake County, 6.9% or 1,376 single-father households and 14.6% or 5,945 single-mother households are living below the poverty line. Among single-father households, those with 3 or 4 children have the highest poverty rate, with 308 households (19.7%) experiencing poverty. Likewise, among single-mother households, those with 5 or more children have the highest poverty rate, with 459 households (55.5%) falling below the poverty line.
| Children | Single Father | Single Mother |
| No Children | 468 (5.0%) | 720 (4.5%) |
| 1 or 2 Children | 600 (6.7%) | 3,504 (17.4%) |
| 3 or 4 Children | 308 (19.7%) | 1,262 (32.2%) |
| 5 or more Children | 0 (0.0%) | 459 (55.5%) |
| Total | 1,376 (6.9%) | 5,945 (14.6%) |
Income Below Poverty Among Married-Couple vs Single-Parent Households in Salt Lake County
The poverty data for Salt Lake County shows that 6,917 of the married-couple family households (3.2%) and 7,321 of the single-parent households (12.0%) are living below the poverty level. Within the married-couple family households, those with 5 or more children have the highest poverty rate, with 427 households (9.8%) falling below the poverty line. Among the single-parent households, those with 5 or more children have the highest poverty rate, with 459 household (43.3%) living below poverty.
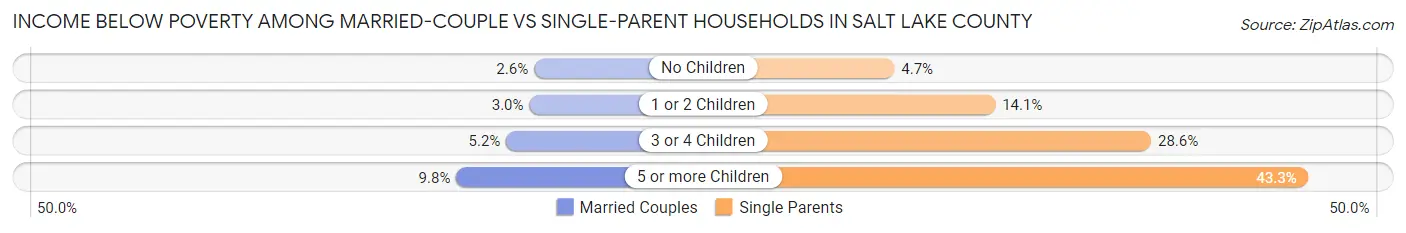
| Children | Married-Couple Families | Single-Parent Households |
| No Children | 2,813 (2.6%) | 1,188 (4.7%) |
| 1 or 2 Children | 2,160 (3.0%) | 4,104 (14.1%) |
| 3 or 4 Children | 1,517 (5.1%) | 1,570 (28.6%) |
| 5 or more Children | 427 (9.8%) | 459 (43.3%) |
| Total | 6,917 (3.2%) | 7,321 (12.0%) |
Employment Characteristics in Salt Lake County
Employment by Class of Employer in Salt Lake County
Among the 619,466 employed individuals in Salt Lake County, private company employees (430,122 | 69.4%), not-for-profit organizations (47,696 | 7.7%), and local government employees (35,979 | 5.8%) make up the most common classes of employment.
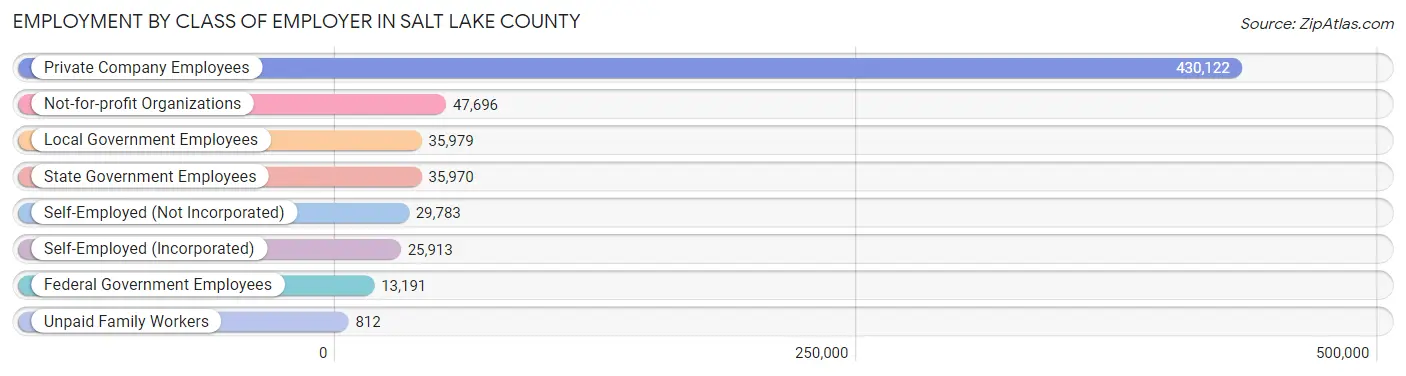
| Employer Class | # Employees | % Employees |
| Private Company Employees | 430,122 | 69.4% |
| Self-Employed (Incorporated) | 25,913 | 4.2% |
| Self-Employed (Not Incorporated) | 29,783 | 4.8% |
| Not-for-profit Organizations | 47,696 | 7.7% |
| Local Government Employees | 35,979 | 5.8% |
| State Government Employees | 35,970 | 5.8% |
| Federal Government Employees | 13,191 | 2.1% |
| Unpaid Family Workers | 812 | 0.1% |
| Total | 619,466 | 100.0% |
Employment Status by Age in Salt Lake County
According to the labor force statistics for Salt Lake County, out of the total population over 16 years of age (907,872), 72.0% or 653,668 individuals are in the labor force, with 3.6% or 23,532 of them unemployed. The age group with the highest labor force participation rate is 25 to 29 years, with 87.7% or 86,413 individuals in the labor force. Within the labor force, the 16 to 19 years age range has the highest percentage of unemployed individuals, with 10.9% or 3,940 of them being unemployed.
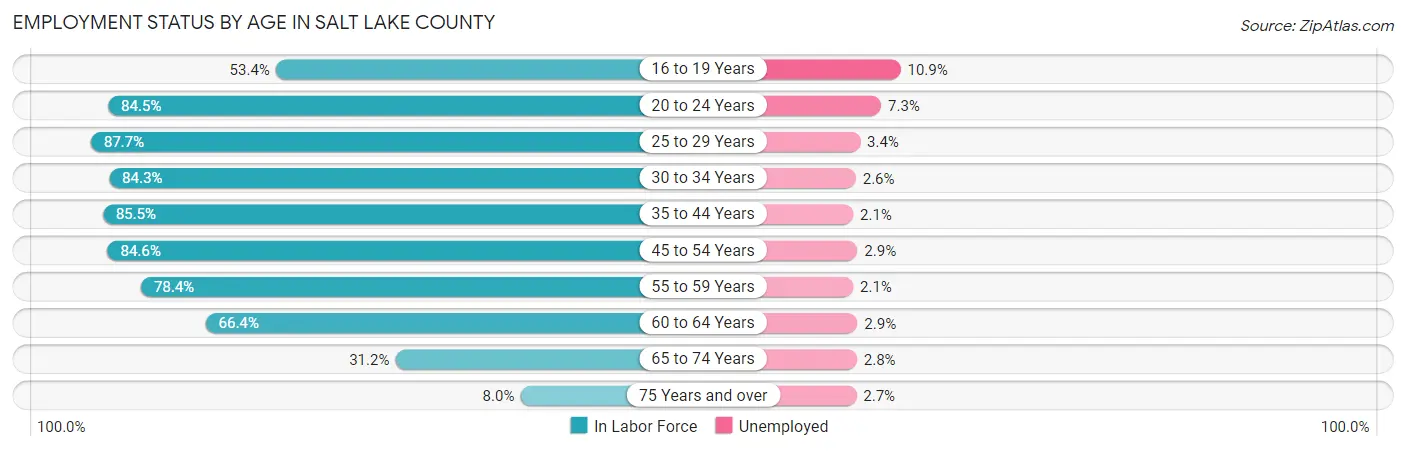
| Age Bracket | In Labor Force | Unemployed |
| 16 to 19 Years | 36,148 (53.4%) | 3,940 (10.9%) |
| 20 to 24 Years | 72,463 (84.5%) | 5,290 (7.3%) |
| 25 to 29 Years | 86,413 (87.7%) | 2,938 (3.4%) |
| 30 to 34 Years | 79,151 (84.3%) | 2,058 (2.6%) |
| 35 to 44 Years | 149,610 (85.5%) | 3,142 (2.1%) |
| 45 to 54 Years | 114,938 (84.6%) | 3,333 (2.9%) |
| 55 to 59 Years | 46,247 (78.4%) | 971 (2.1%) |
| 60 to 64 Years | 38,821 (66.4%) | 1,126 (2.9%) |
| 65 to 74 Years | 25,915 (31.2%) | 726 (2.8%) |
| 75 Years and over | 4,051 (8.0%) | 109 (2.7%) |
| Total | 653,668 (72.0%) | 23,532 (3.6%) |
Employment Status by Educational Attainment in Salt Lake County
According to labor force statistics for Salt Lake County, 83.0% of individuals (515,198) out of the total population between 25 and 64 years of age (620,721) are in the labor force, with 2.6% or 13,395 of them being unemployed. The group with the highest labor force participation rate are those with the educational attainment of bachelor's degree or higher, with 87.7% or 208,569 individuals in the labor force. Within the labor force, individuals with less than high school education have the highest percentage of unemployment, with 3.8% or 1,442 of them being unemployed.
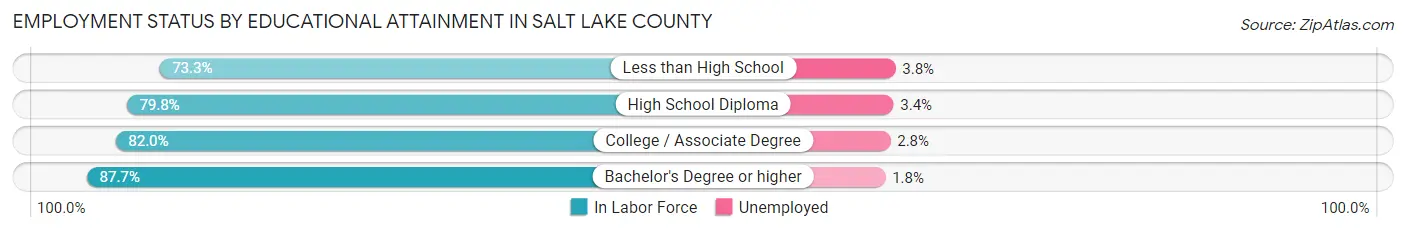
| Educational Attainment | In Labor Force | Unemployed |
| Less than High School | 37,957 (73.3%) | 1,968 (3.8%) |
| High School Diploma | 108,154 (79.8%) | 4,608 (3.4%) |
| College / Associate Degree | 160,381 (82.0%) | 5,476 (2.8%) |
| Bachelor's Degree or higher | 208,569 (87.7%) | 4,281 (1.8%) |
| Total | 515,198 (83.0%) | 16,139 (2.6%) |
Employment Occupations by Sex in Salt Lake County
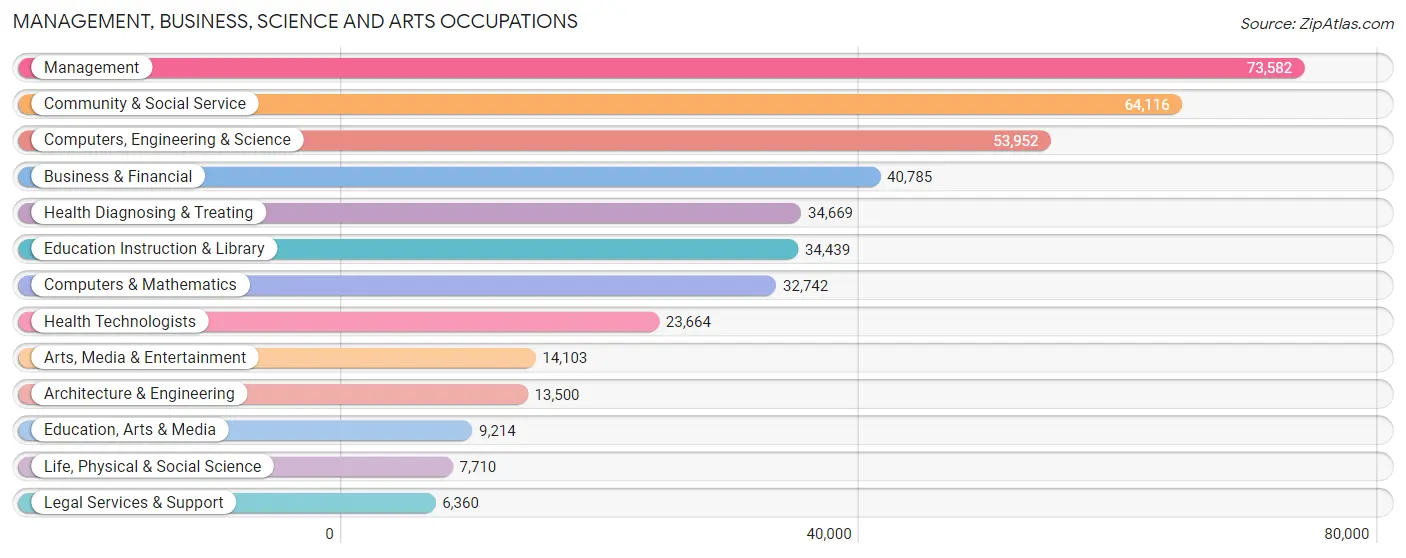
Management, Business, Science and Arts Occupations
The most common Management, Business, Science and Arts occupations in Salt Lake County are Management (73,582 | 11.7%), Community & Social Service (64,116 | 10.2%), Computers, Engineering & Science (53,952 | 8.6%), Business & Financial (40,785 | 6.5%), and Health Diagnosing & Treating (34,669 | 5.5%).
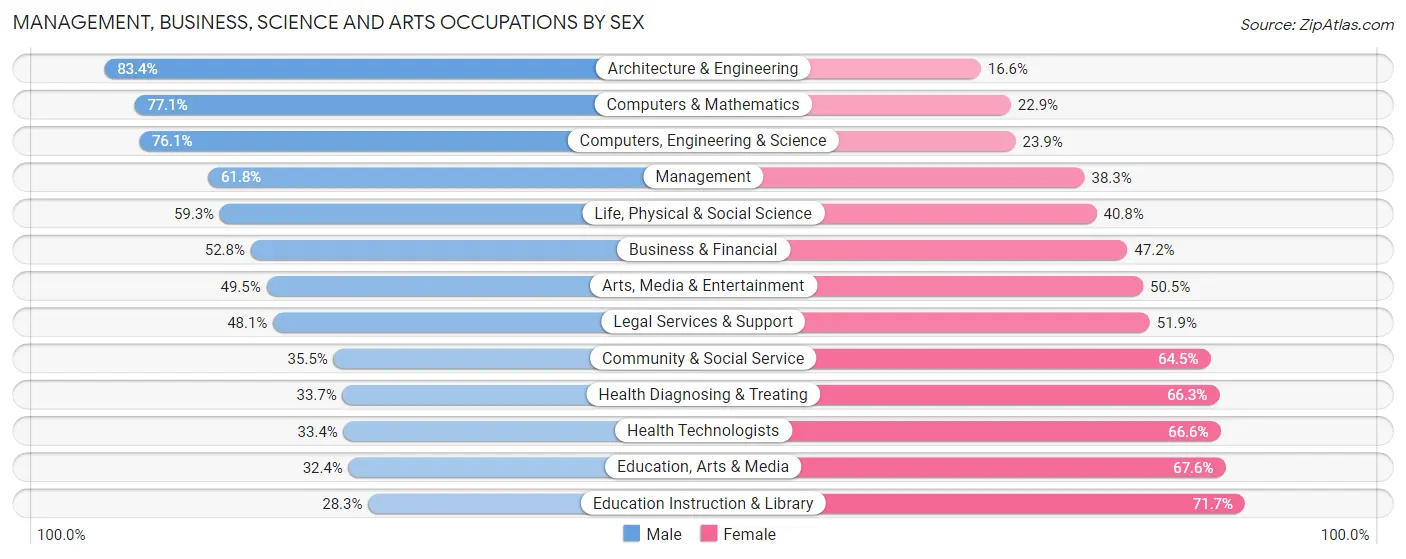
Management, Business, Science and Arts Occupations by Sex
Within the Management, Business, Science and Arts occupations in Salt Lake County, the most male-oriented occupations are Architecture & Engineering (83.4%), Computers & Mathematics (77.1%), and Computers, Engineering & Science (76.1%), while the most female-oriented occupations are Education Instruction & Library (71.7%), Education, Arts & Media (67.6%), and Health Technologists (66.6%).
| Occupation | Male | Female |
| Management | 45,440 (61.8%) | 28,142 (38.3%) |
| Business & Financial | 21,537 (52.8%) | 19,248 (47.2%) |
| Computers, Engineering & Science | 41,072 (76.1%) | 12,880 (23.9%) |
| Computers & Mathematics | 25,248 (77.1%) | 7,494 (22.9%) |
| Architecture & Engineering | 11,256 (83.4%) | 2,244 (16.6%) |
| Life, Physical & Social Science | 4,568 (59.3%) | 3,142 (40.7%) |
| Community & Social Service | 22,782 (35.5%) | 41,334 (64.5%) |
| Education, Arts & Media | 2,984 (32.4%) | 6,230 (67.6%) |
| Legal Services & Support | 3,062 (48.1%) | 3,298 (51.9%) |
| Education Instruction & Library | 9,751 (28.3%) | 24,688 (71.7%) |
| Arts, Media & Entertainment | 6,985 (49.5%) | 7,118 (50.5%) |
| Health Diagnosing & Treating | 11,673 (33.7%) | 22,996 (66.3%) |
| Health Technologists | 7,914 (33.4%) | 15,750 (66.6%) |
| Total (Category) | 142,504 (53.3%) | 124,600 (46.7%) |
| Total (Overall) | 346,145 (55.0%) | 283,172 (45.0%) |
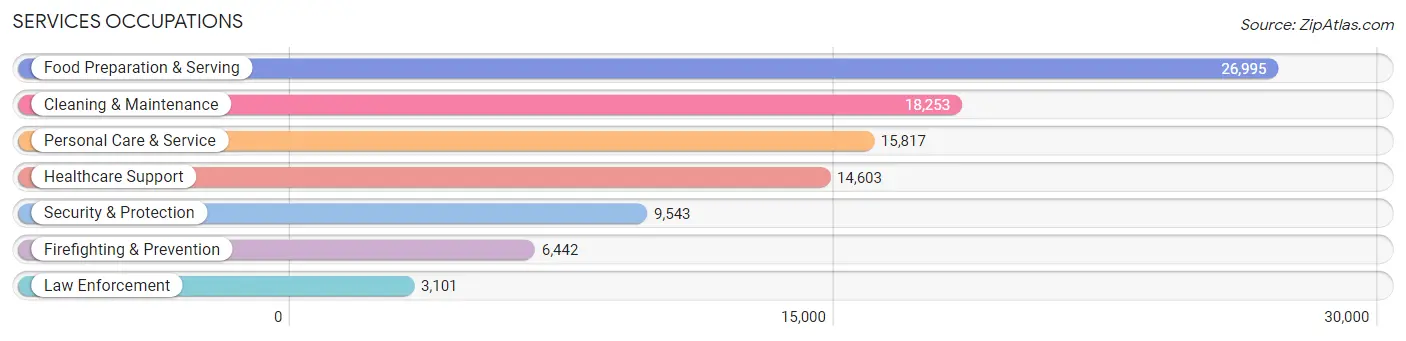
Services Occupations
The most common Services occupations in Salt Lake County are Food Preparation & Serving (26,995 | 4.3%), Cleaning & Maintenance (18,253 | 2.9%), Personal Care & Service (15,817 | 2.5%), Healthcare Support (14,603 | 2.3%), and Security & Protection (9,543 | 1.5%).
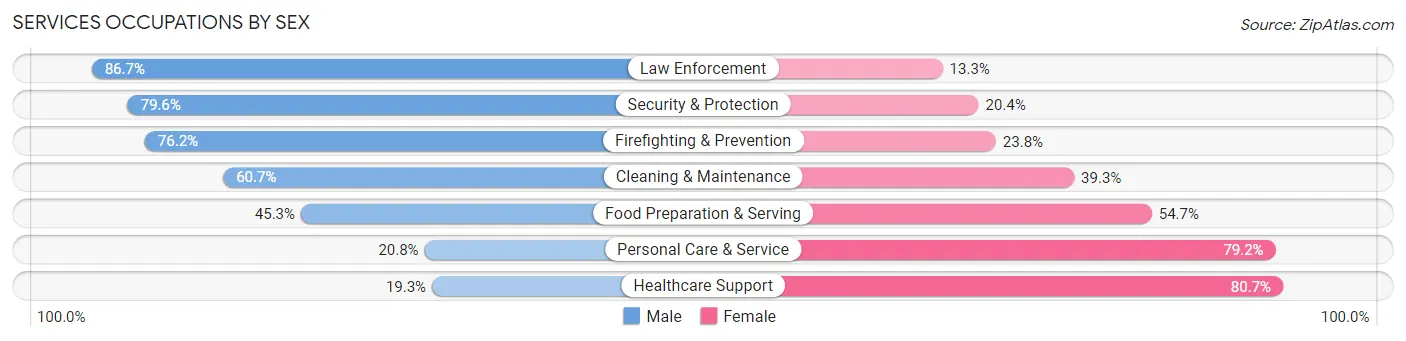
Services Occupations by Sex
Within the Services occupations in Salt Lake County, the most male-oriented occupations are Law Enforcement (86.7%), Security & Protection (79.6%), and Firefighting & Prevention (76.2%), while the most female-oriented occupations are Healthcare Support (80.7%), Personal Care & Service (79.2%), and Food Preparation & Serving (54.7%).
| Occupation | Male | Female |
| Healthcare Support | 2,824 (19.3%) | 11,779 (80.7%) |
| Security & Protection | 7,596 (79.6%) | 1,947 (20.4%) |
| Firefighting & Prevention | 4,907 (76.2%) | 1,535 (23.8%) |
| Law Enforcement | 2,689 (86.7%) | 412 (13.3%) |
| Food Preparation & Serving | 12,230 (45.3%) | 14,765 (54.7%) |
| Cleaning & Maintenance | 11,075 (60.7%) | 7,178 (39.3%) |
| Personal Care & Service | 3,293 (20.8%) | 12,524 (79.2%) |
| Total (Category) | 37,018 (43.4%) | 48,193 (56.6%) |
| Total (Overall) | 346,145 (55.0%) | 283,172 (45.0%) |
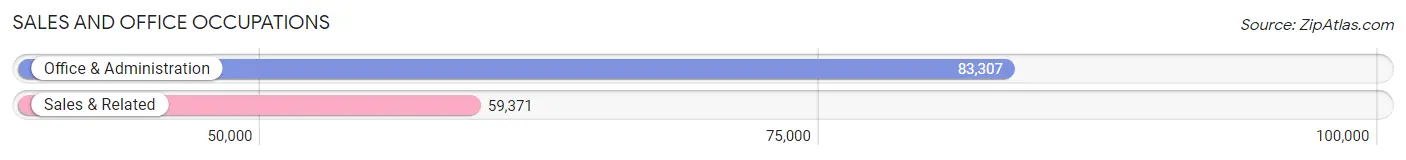
Sales and Office Occupations
The most common Sales and Office occupations in Salt Lake County are Office & Administration (83,307 | 13.2%), and Sales & Related (59,371 | 9.4%).
Sales and Office Occupations by Sex
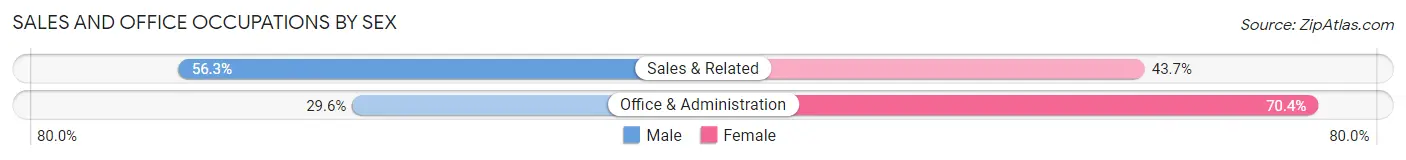
| Occupation | Male | Female |
| Sales & Related | 33,406 (56.3%) | 25,965 (43.7%) |
| Office & Administration | 24,659 (29.6%) | 58,648 (70.4%) |
| Total (Category) | 58,065 (40.7%) | 84,613 (59.3%) |
| Total (Overall) | 346,145 (55.0%) | 283,172 (45.0%) |
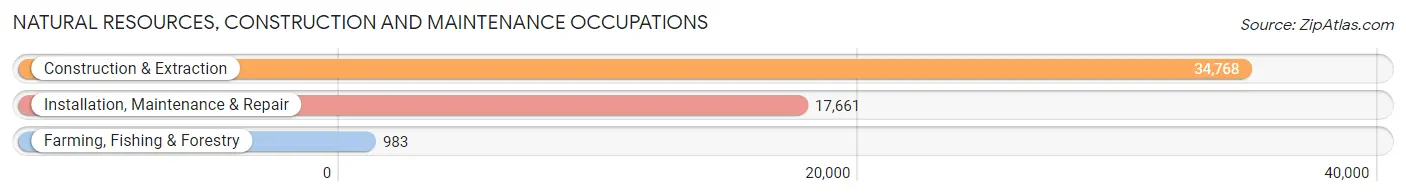
Natural Resources, Construction and Maintenance Occupations
The most common Natural Resources, Construction and Maintenance occupations in Salt Lake County are Construction & Extraction (34,768 | 5.5%), Installation, Maintenance & Repair (17,661 | 2.8%), and Farming, Fishing & Forestry (983 | 0.2%).
Natural Resources, Construction and Maintenance Occupations by Sex
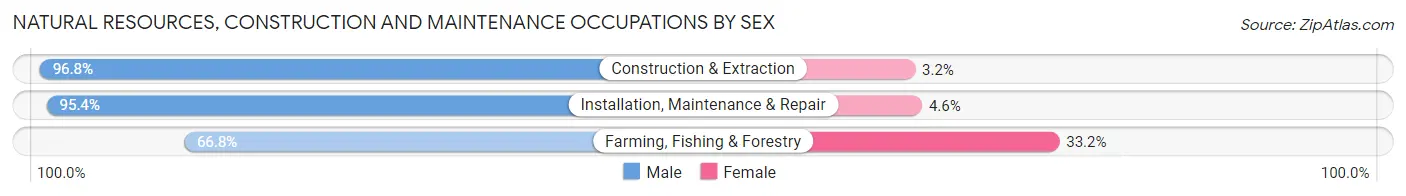
| Occupation | Male | Female |
| Farming, Fishing & Forestry | 657 (66.8%) | 326 (33.2%) |
| Construction & Extraction | 33,668 (96.8%) | 1,100 (3.2%) |
| Installation, Maintenance & Repair | 16,853 (95.4%) | 808 (4.6%) |
| Total (Category) | 51,178 (95.8%) | 2,234 (4.2%) |
| Total (Overall) | 346,145 (55.0%) | 283,172 (45.0%) |
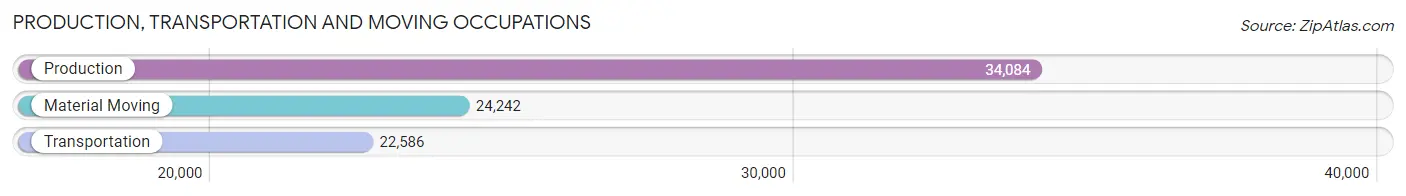
Production, Transportation and Moving Occupations
The most common Production, Transportation and Moving occupations in Salt Lake County are Production (34,084 | 5.4%), Material Moving (24,242 | 3.8%), and Transportation (22,586 | 3.6%).
Production, Transportation and Moving Occupations by Sex
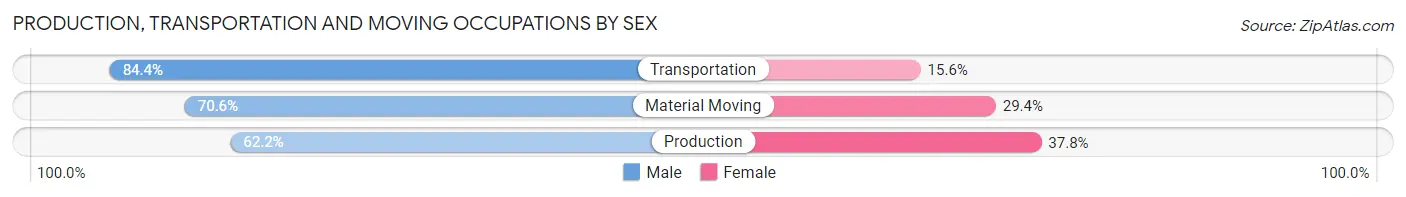
| Occupation | Male | Female |
| Production | 21,210 (62.2%) | 12,874 (37.8%) |
| Transportation | 19,057 (84.4%) | 3,529 (15.6%) |
| Material Moving | 17,113 (70.6%) | 7,129 (29.4%) |
| Total (Category) | 57,380 (70.9%) | 23,532 (29.1%) |
| Total (Overall) | 346,145 (55.0%) | 283,172 (45.0%) |
Employment Industries by Sex in Salt Lake County
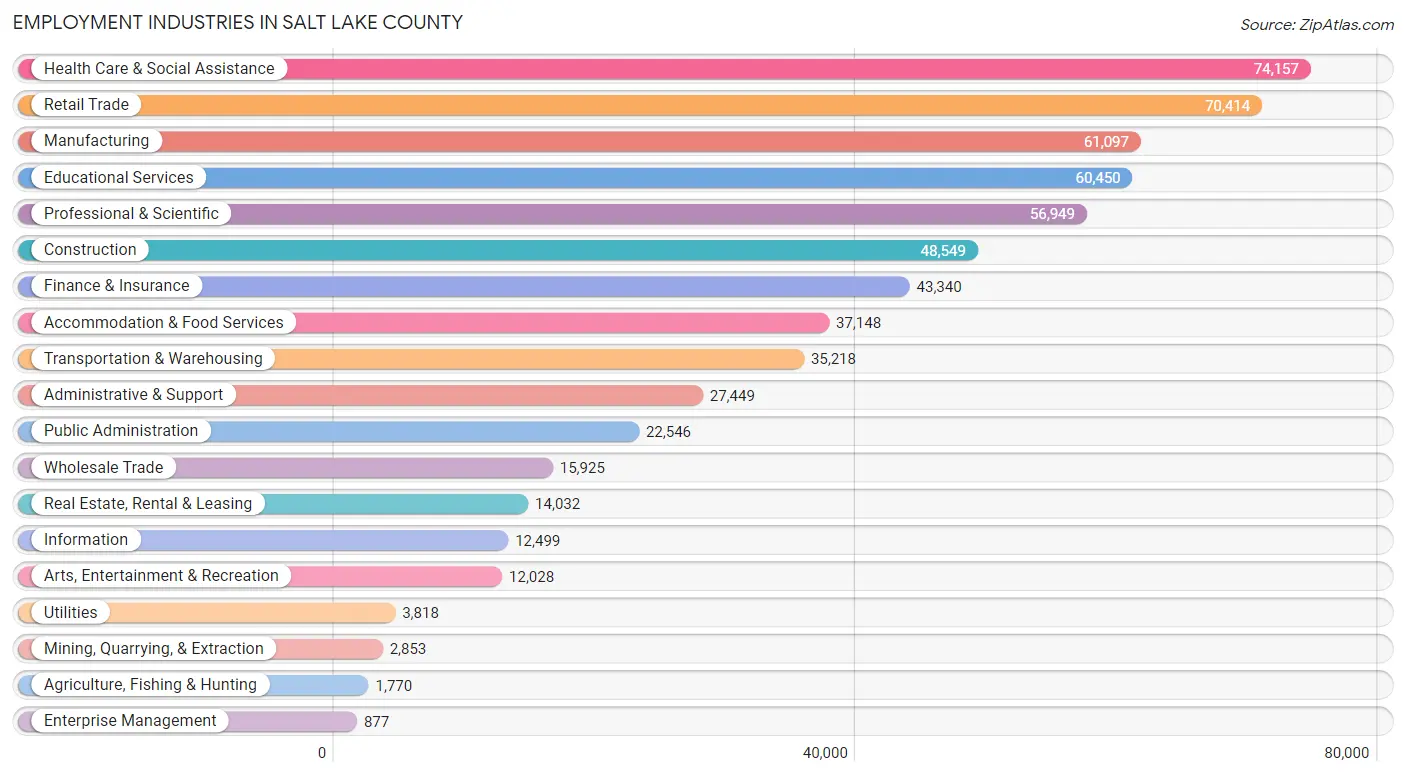
Employment Industries in Salt Lake County
The major employment industries in Salt Lake County include Health Care & Social Assistance (74,157 | 11.8%), Retail Trade (70,414 | 11.2%), Manufacturing (61,097 | 9.7%), Educational Services (60,450 | 9.6%), and Professional & Scientific (56,949 | 9.0%).
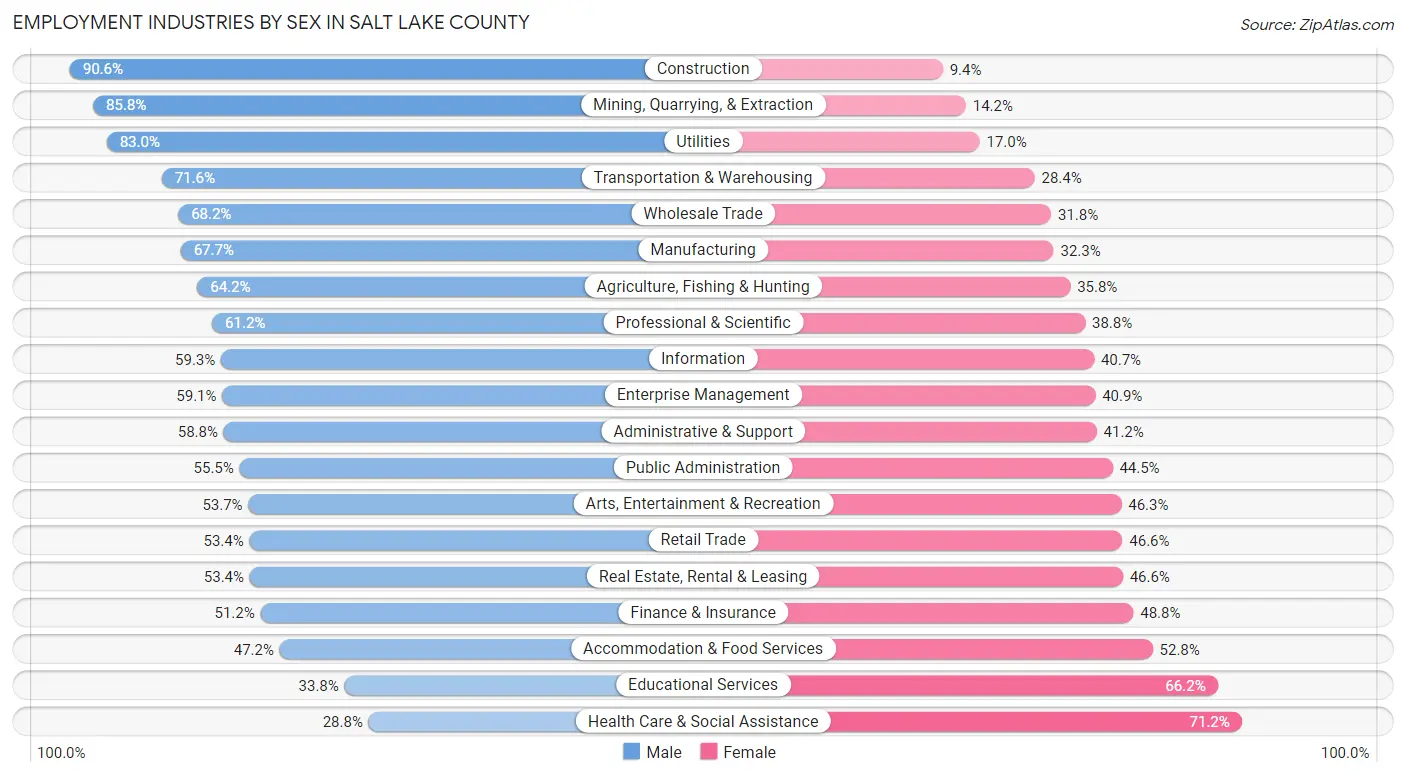
Employment Industries by Sex in Salt Lake County
The Salt Lake County industries that see more men than women are Construction (90.6%), Mining, Quarrying, & Extraction (85.8%), and Utilities (83.0%), whereas the industries that tend to have a higher number of women are Health Care & Social Assistance (71.2%), Educational Services (66.2%), and Accommodation & Food Services (52.8%).
| Industry | Male | Female |
| Agriculture, Fishing & Hunting | 1,137 (64.2%) | 633 (35.8%) |
| Mining, Quarrying, & Extraction | 2,449 (85.8%) | 404 (14.2%) |
| Construction | 44,000 (90.6%) | 4,549 (9.4%) |
| Manufacturing | 41,350 (67.7%) | 19,747 (32.3%) |
| Wholesale Trade | 10,861 (68.2%) | 5,064 (31.8%) |
| Retail Trade | 37,630 (53.4%) | 32,784 (46.6%) |
| Transportation & Warehousing | 25,221 (71.6%) | 9,997 (28.4%) |
| Utilities | 3,169 (83.0%) | 649 (17.0%) |
| Information | 7,414 (59.3%) | 5,085 (40.7%) |
| Finance & Insurance | 22,175 (51.2%) | 21,165 (48.8%) |
| Real Estate, Rental & Leasing | 7,489 (53.4%) | 6,543 (46.6%) |
| Professional & Scientific | 34,838 (61.2%) | 22,111 (38.8%) |
| Enterprise Management | 518 (59.1%) | 359 (40.9%) |
| Administrative & Support | 16,132 (58.8%) | 11,317 (41.2%) |
| Educational Services | 20,410 (33.8%) | 40,040 (66.2%) |
| Health Care & Social Assistance | 21,332 (28.8%) | 52,825 (71.2%) |
| Arts, Entertainment & Recreation | 6,455 (53.7%) | 5,573 (46.3%) |
| Accommodation & Food Services | 17,527 (47.2%) | 19,621 (52.8%) |
| Public Administration | 12,511 (55.5%) | 10,035 (44.5%) |
| Total | 346,145 (55.0%) | 283,172 (45.0%) |
Education in Salt Lake County
School Enrollment in Salt Lake County
The most common levels of schooling among the 330,304 students in Salt Lake County are high school (73,095 | 22.1%), middle school (69,401 | 21.0%), and elementary school (69,117 | 20.9%).
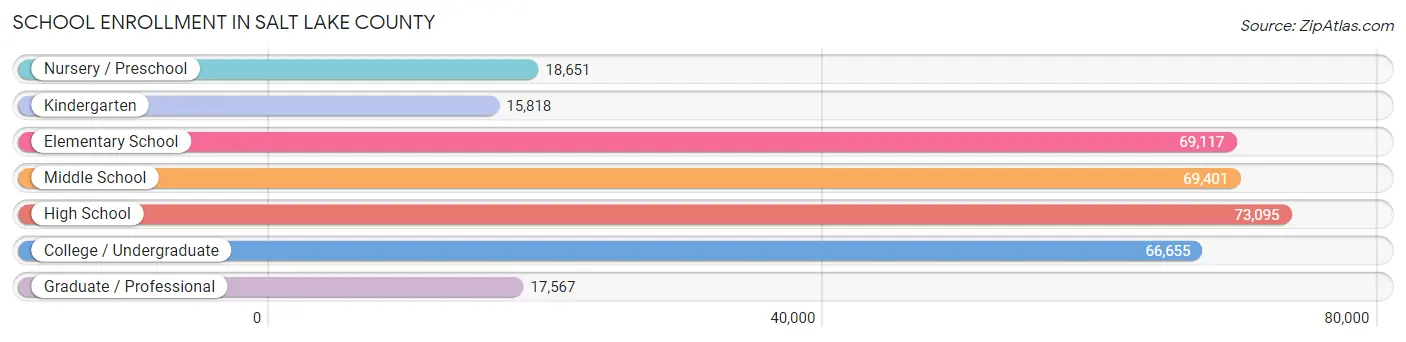
| School Level | # Students | % Students |
| Nursery / Preschool | 18,651 | 5.7% |
| Kindergarten | 15,818 | 4.8% |
| Elementary School | 69,117 | 20.9% |
| Middle School | 69,401 | 21.0% |
| High School | 73,095 | 22.1% |
| College / Undergraduate | 66,655 | 20.2% |
| Graduate / Professional | 17,567 | 5.3% |
| Total | 330,304 | 100.0% |
School Enrollment by Age by Funding Source in Salt Lake County
Out of a total of 330,304 students who are enrolled in schools in Salt Lake County, 43,930 (13.3%) attend a private institution, while the remaining 286,374 (86.7%) are enrolled in public schools. The age group of 3 to 4 year olds has the highest likelihood of being enrolled in private schools, with 6,575 (45.5% in the age bracket) enrolled. Conversely, the age group of 15 to 17 year olds has the lowest likelihood of being enrolled in a private school, with 48,551 (93.9% in the age bracket) attending a public institution.
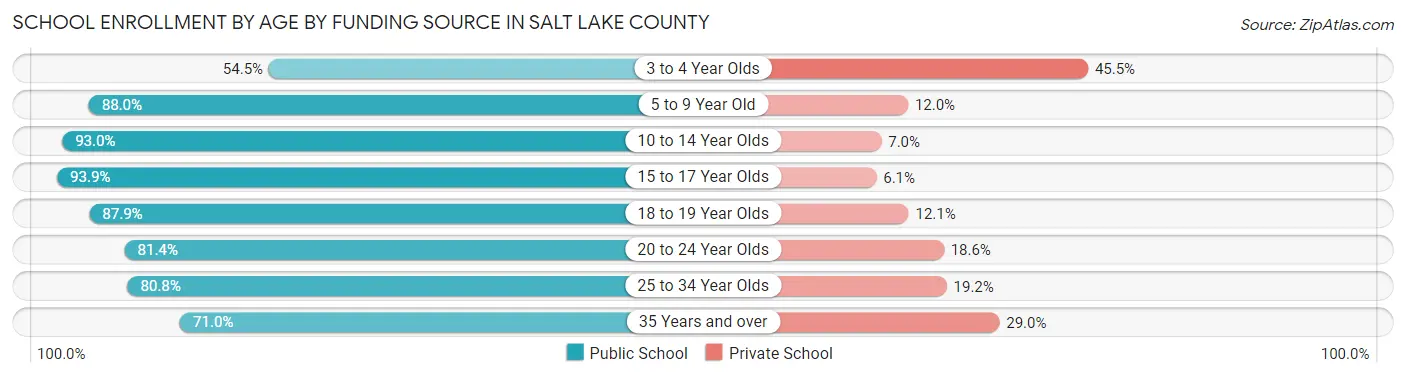
| Age Bracket | Public School | Private School |
| 3 to 4 Year Olds | 7,874 (54.5%) | 6,575 (45.5%) |
| 5 to 9 Year Old | 70,817 (88.0%) | 9,634 (12.0%) |
| 10 to 14 Year Olds | 81,345 (93.0%) | 6,133 (7.0%) |
| 15 to 17 Year Olds | 48,551 (93.9%) | 3,136 (6.1%) |
| 18 to 19 Year Olds | 18,428 (87.9%) | 2,532 (12.1%) |
| 20 to 24 Year Olds | 27,072 (81.4%) | 6,197 (18.6%) |
| 25 to 34 Year Olds | 20,455 (80.8%) | 4,851 (19.2%) |
| 35 Years and over | 11,863 (71.0%) | 4,841 (29.0%) |
| Total | 286,374 (86.7%) | 43,930 (13.3%) |
Educational Attainment by Field of Study in Salt Lake County
Business (56,050 | 18.1%), science & technology (32,478 | 10.5%), education (28,761 | 9.3%), social sciences (27,600 | 8.9%), and engineering (22,905 | 7.4%) are the most common fields of study among 310,198 individuals in Salt Lake County who have obtained a bachelor's degree or higher.
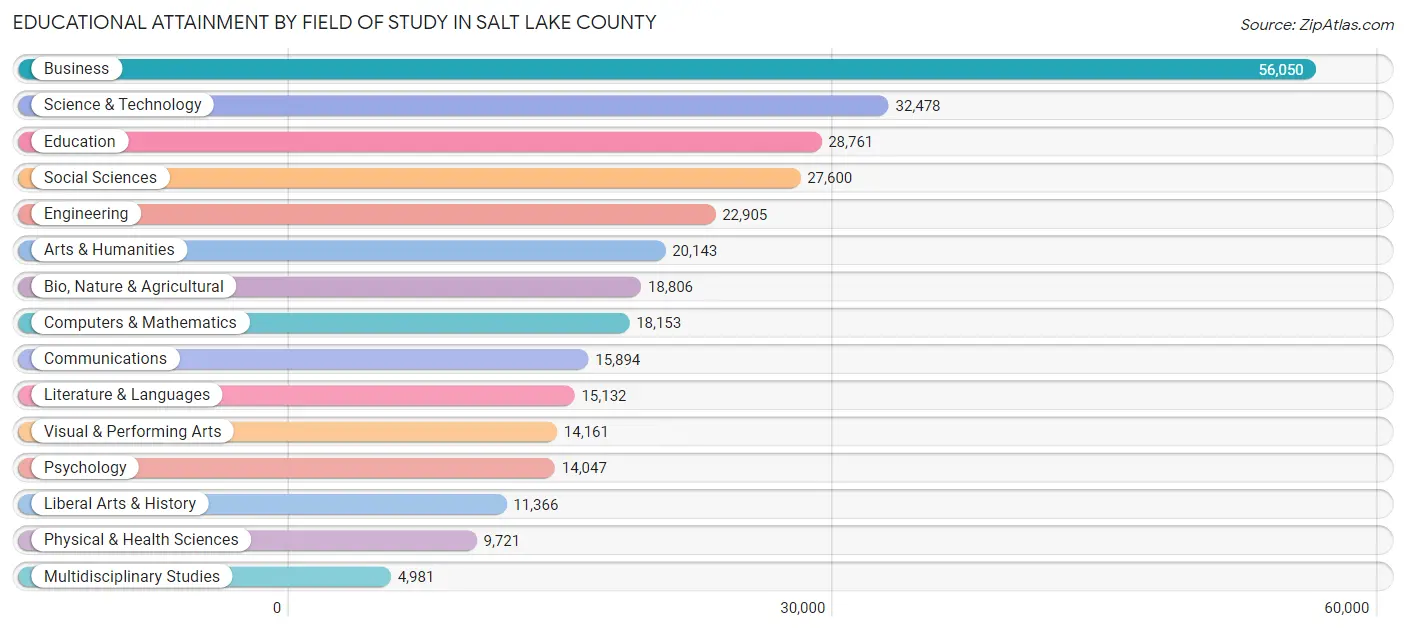
| Field of Study | # Graduates | % Graduates |
| Computers & Mathematics | 18,153 | 5.9% |
| Bio, Nature & Agricultural | 18,806 | 6.1% |
| Physical & Health Sciences | 9,721 | 3.1% |
| Psychology | 14,047 | 4.5% |
| Social Sciences | 27,600 | 8.9% |
| Engineering | 22,905 | 7.4% |
| Multidisciplinary Studies | 4,981 | 1.6% |
| Science & Technology | 32,478 | 10.5% |
| Business | 56,050 | 18.1% |
| Education | 28,761 | 9.3% |
| Literature & Languages | 15,132 | 4.9% |
| Liberal Arts & History | 11,366 | 3.7% |
| Visual & Performing Arts | 14,161 | 4.6% |
| Communications | 15,894 | 5.1% |
| Arts & Humanities | 20,143 | 6.5% |
| Total | 310,198 | 100.0% |
Transportation & Commute in Salt Lake County
Vehicle Availability by Sex in Salt Lake County
The most prevalent vehicle ownership categories in Salt Lake County are males with 2 vehicles (133,548, accounting for 39.3%) and females with 2 vehicles (104,912, making up 48.5%).
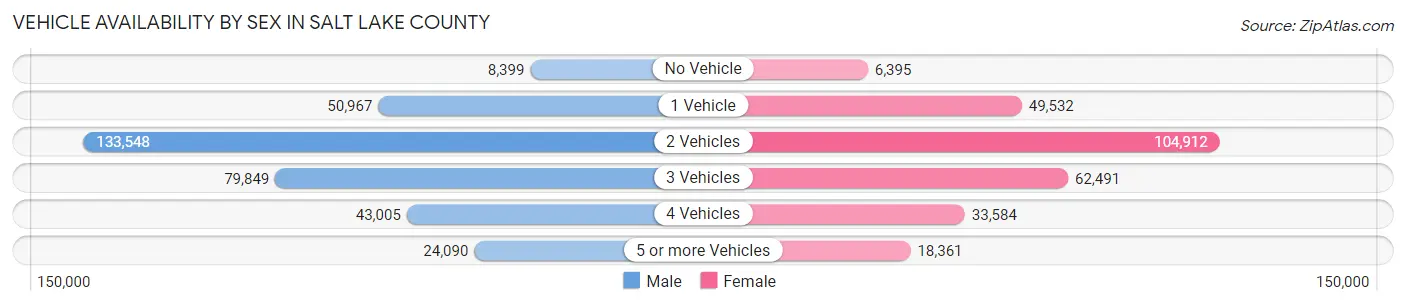
| Vehicles Available | Male | Female |
| No Vehicle | 8,399 (2.5%) | 6,395 (2.3%) |
| 1 Vehicle | 50,967 (15.0%) | 49,532 (18.0%) |
| 2 Vehicles | 133,548 (39.3%) | 104,912 (38.1%) |
| 3 Vehicles | 79,849 (23.5%) | 62,491 (22.7%) |
| 4 Vehicles | 43,005 (12.7%) | 33,584 (12.2%) |
| 5 or more Vehicles | 24,090 (7.1%) | 18,361 (6.7%) |
| Total | 339,858 (100.0%) | 275,275 (100.0%) |
Commute Time in Salt Lake County
The most frequently occuring commute durations in Salt Lake County are 20 to 24 minutes (101,850 commuters, 19.4%), 15 to 19 minutes (101,508 commuters, 19.4%), and 10 to 14 minutes (78,610 commuters, 15.0%).
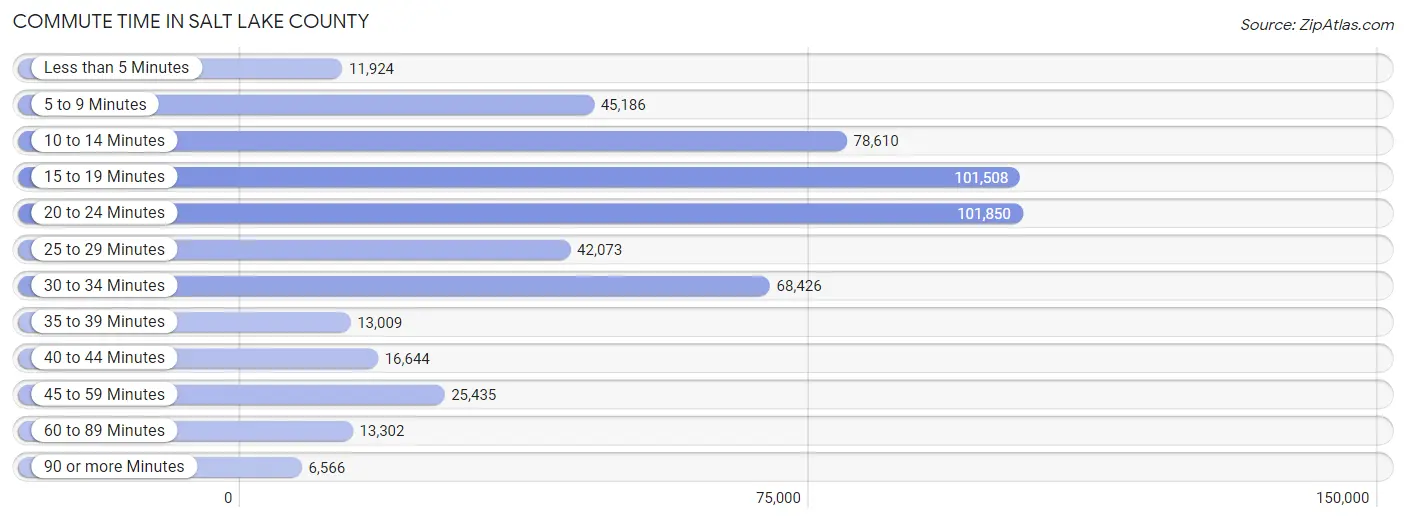
| Commute Time | # Commuters | % Commuters |
| Less than 5 Minutes | 11,924 | 2.3% |
| 5 to 9 Minutes | 45,186 | 8.6% |
| 10 to 14 Minutes | 78,610 | 15.0% |
| 15 to 19 Minutes | 101,508 | 19.4% |
| 20 to 24 Minutes | 101,850 | 19.4% |
| 25 to 29 Minutes | 42,073 | 8.0% |
| 30 to 34 Minutes | 68,426 | 13.1% |
| 35 to 39 Minutes | 13,009 | 2.5% |
| 40 to 44 Minutes | 16,644 | 3.2% |
| 45 to 59 Minutes | 25,435 | 4.9% |
| 60 to 89 Minutes | 13,302 | 2.5% |
| 90 or more Minutes | 6,566 | 1.3% |
Commute Time by Sex in Salt Lake County
The most common commute times in Salt Lake County are 20 to 24 minutes (57,172 commuters, 19.4%) for males and 20 to 24 minutes (44,678 commuters, 19.5%) for females.
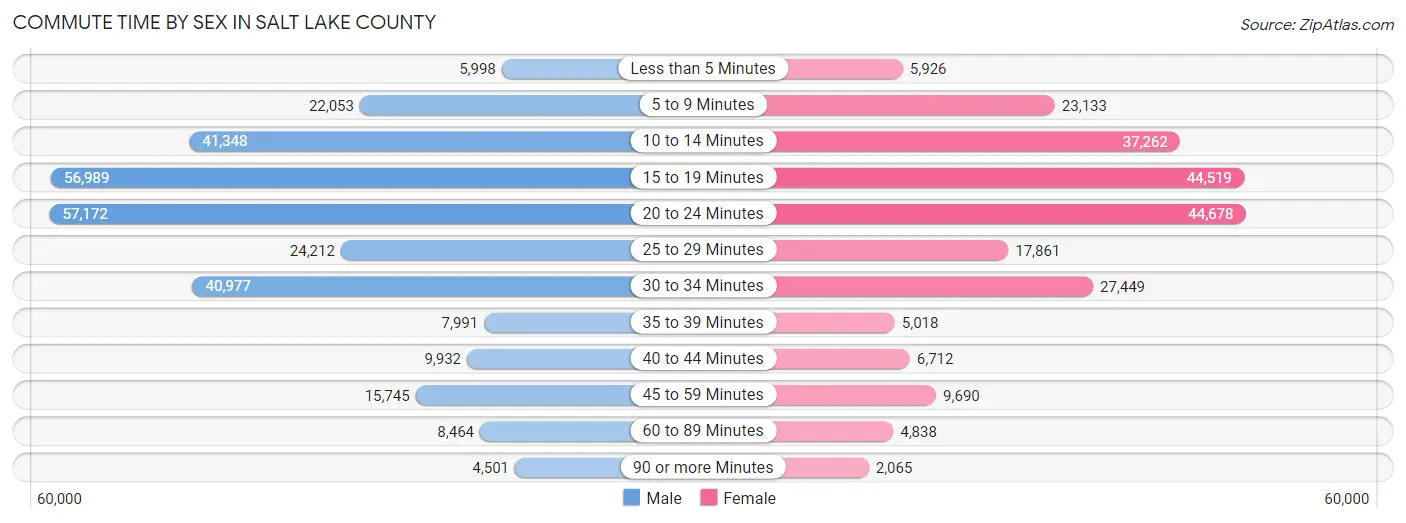
| Commute Time | Male | Female |
| Less than 5 Minutes | 5,998 (2.0%) | 5,926 (2.6%) |
| 5 to 9 Minutes | 22,053 (7.5%) | 23,133 (10.1%) |
| 10 to 14 Minutes | 41,348 (14.0%) | 37,262 (16.3%) |
| 15 to 19 Minutes | 56,989 (19.3%) | 44,519 (19.4%) |
| 20 to 24 Minutes | 57,172 (19.4%) | 44,678 (19.5%) |
| 25 to 29 Minutes | 24,212 (8.2%) | 17,861 (7.8%) |
| 30 to 34 Minutes | 40,977 (13.9%) | 27,449 (12.0%) |
| 35 to 39 Minutes | 7,991 (2.7%) | 5,018 (2.2%) |
| 40 to 44 Minutes | 9,932 (3.4%) | 6,712 (2.9%) |
| 45 to 59 Minutes | 15,745 (5.3%) | 9,690 (4.2%) |
| 60 to 89 Minutes | 8,464 (2.9%) | 4,838 (2.1%) |
| 90 or more Minutes | 4,501 (1.5%) | 2,065 (0.9%) |
Time of Departure to Work by Sex in Salt Lake County
The most frequent times of departure to work in Salt Lake County are 7:00 AM to 7:29 AM (37,324, 12.6%) for males and 8:00 AM to 8:29 AM (30,386, 13.3%) for females.
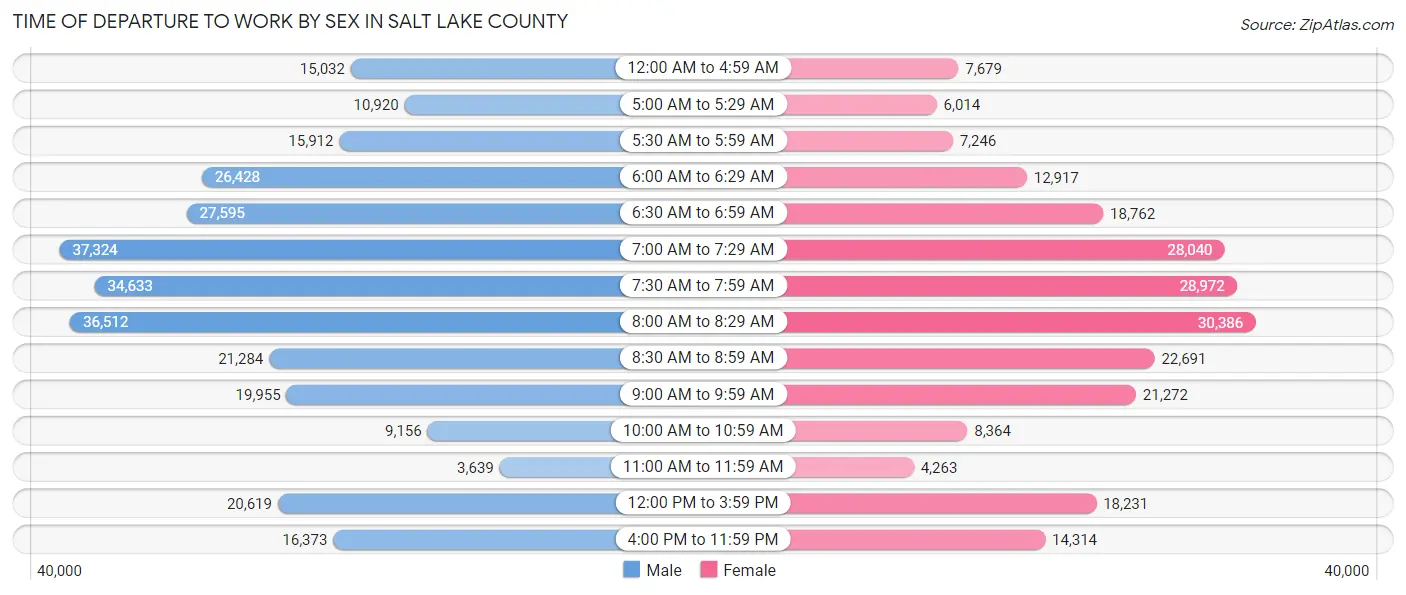
| Time of Departure | Male | Female |
| 12:00 AM to 4:59 AM | 15,032 (5.1%) | 7,679 (3.4%) |
| 5:00 AM to 5:29 AM | 10,920 (3.7%) | 6,014 (2.6%) |
| 5:30 AM to 5:59 AM | 15,912 (5.4%) | 7,246 (3.2%) |
| 6:00 AM to 6:29 AM | 26,428 (8.9%) | 12,917 (5.6%) |
| 6:30 AM to 6:59 AM | 27,595 (9.3%) | 18,762 (8.2%) |
| 7:00 AM to 7:29 AM | 37,324 (12.6%) | 28,040 (12.2%) |
| 7:30 AM to 7:59 AM | 34,633 (11.7%) | 28,972 (12.6%) |
| 8:00 AM to 8:29 AM | 36,512 (12.4%) | 30,386 (13.3%) |
| 8:30 AM to 8:59 AM | 21,284 (7.2%) | 22,691 (9.9%) |
| 9:00 AM to 9:59 AM | 19,955 (6.8%) | 21,272 (9.3%) |
| 10:00 AM to 10:59 AM | 9,156 (3.1%) | 8,364 (3.6%) |
| 11:00 AM to 11:59 AM | 3,639 (1.2%) | 4,263 (1.9%) |
| 12:00 PM to 3:59 PM | 20,619 (7.0%) | 18,231 (8.0%) |
| 4:00 PM to 11:59 PM | 16,373 (5.5%) | 14,314 (6.2%) |
| Total | 295,382 (100.0%) | 229,151 (100.0%) |
Housing Occupancy in Salt Lake County
Occupancy by Ownership in Salt Lake County
Of the total 407,673 dwellings in Salt Lake County, owner-occupied units account for 273,739 (67.1%), while renter-occupied units make up 133,934 (32.9%).
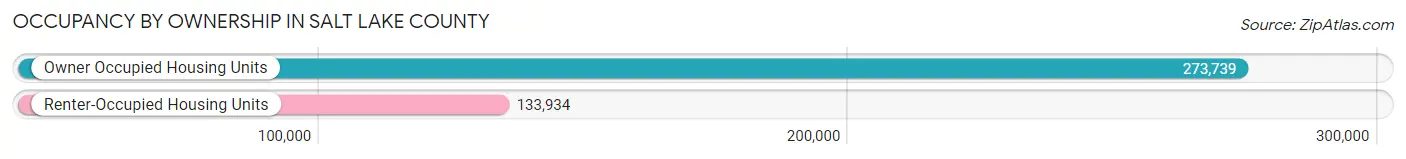
| Occupancy | # Housing Units | % Housing Units |
| Owner Occupied Housing Units | 273,739 | 67.1% |
| Renter-Occupied Housing Units | 133,934 | 32.9% |
| Total Occupied Housing Units | 407,673 | 100.0% |
Occupancy by Household Size in Salt Lake County
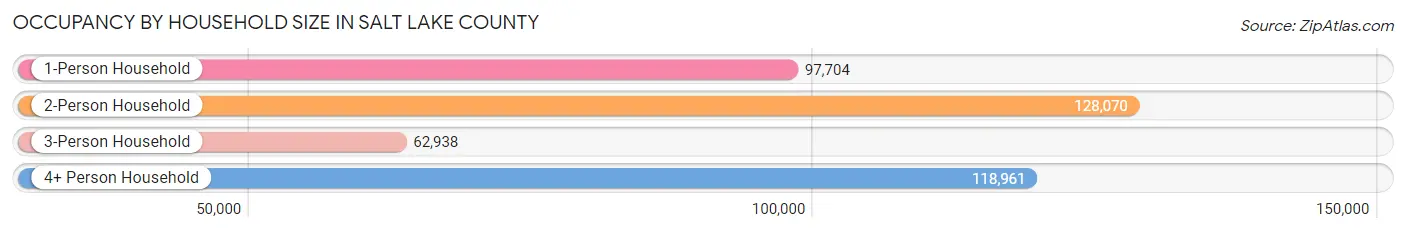
| Household Size | # Housing Units | % Housing Units |
| 1-Person Household | 97,704 | 24.0% |
| 2-Person Household | 128,070 | 31.4% |
| 3-Person Household | 62,938 | 15.4% |
| 4+ Person Household | 118,961 | 29.2% |
| Total Housing Units | 407,673 | 100.0% |
Occupancy by Ownership by Household Size in Salt Lake County
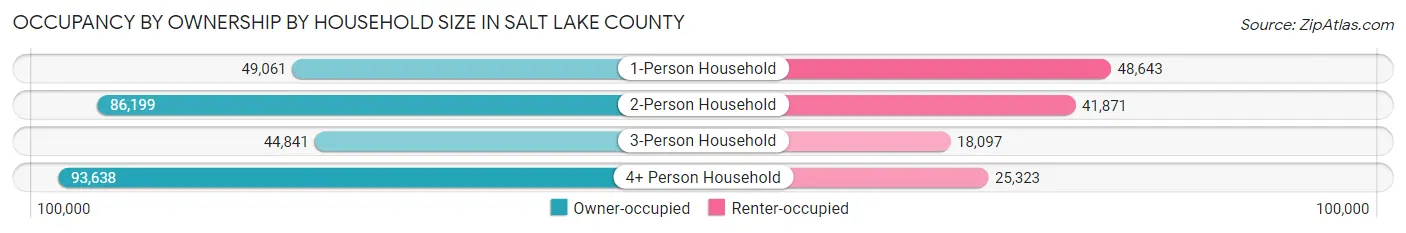
| Household Size | Owner-occupied | Renter-occupied |
| 1-Person Household | 49,061 (50.2%) | 48,643 (49.8%) |
| 2-Person Household | 86,199 (67.3%) | 41,871 (32.7%) |
| 3-Person Household | 44,841 (71.3%) | 18,097 (28.7%) |
| 4+ Person Household | 93,638 (78.7%) | 25,323 (21.3%) |
| Total Housing Units | 273,739 (67.1%) | 133,934 (32.9%) |
Occupancy by Educational Attainment in Salt Lake County
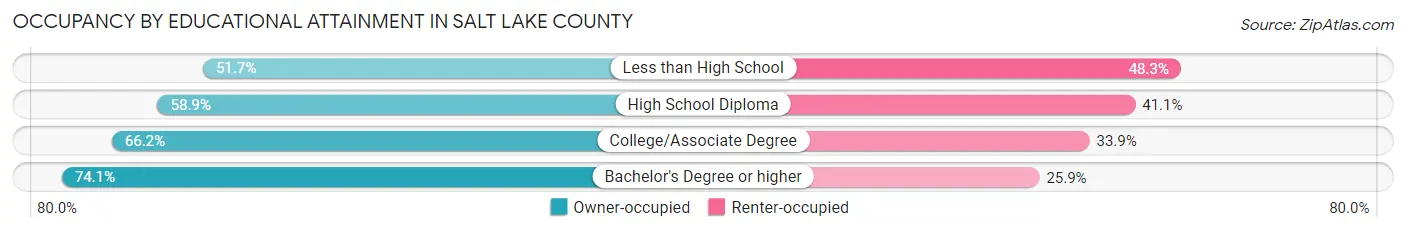
| Household Size | Owner-occupied | Renter-occupied |
| Less than High School | 13,147 (51.7%) | 12,281 (48.3%) |
| High School Diploma | 46,073 (58.9%) | 32,144 (41.1%) |
| College/Associate Degree | 89,570 (66.1%) | 45,840 (33.9%) |
| Bachelor's Degree or higher | 124,949 (74.1%) | 43,669 (25.9%) |
Occupancy by Age of Householder in Salt Lake County
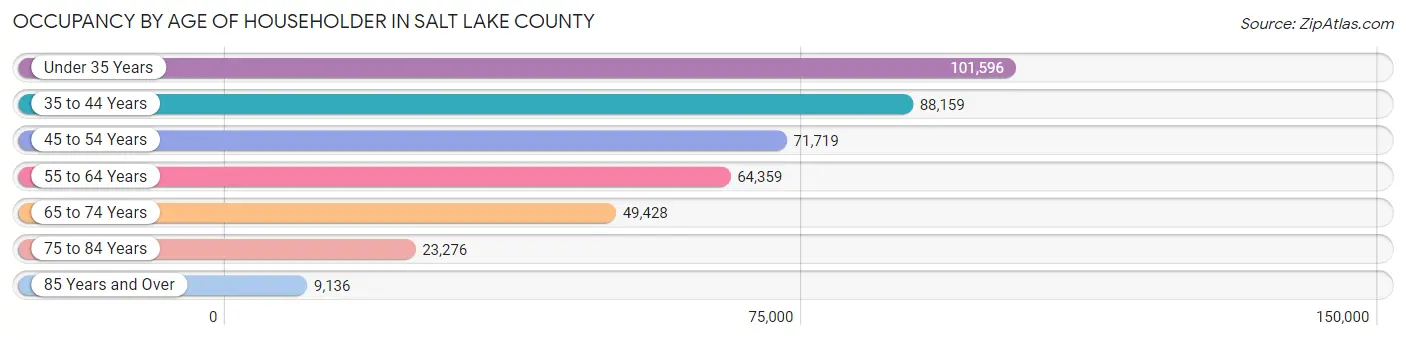
| Age Bracket | # Households | % Households |
| Under 35 Years | 101,596 | 24.9% |
| 35 to 44 Years | 88,159 | 21.6% |
| 45 to 54 Years | 71,719 | 17.6% |
| 55 to 64 Years | 64,359 | 15.8% |
| 65 to 74 Years | 49,428 | 12.1% |
| 75 to 84 Years | 23,276 | 5.7% |
| 85 Years and Over | 9,136 | 2.2% |
| Total | 407,673 | 100.0% |
Housing Finances in Salt Lake County
Median Income by Occupancy in Salt Lake County
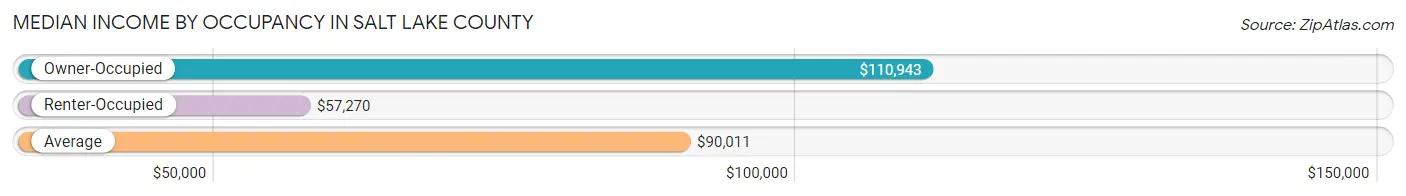
| Occupancy Type | # Households | Median Income |
| Owner-Occupied | 273,739 (67.1%) | $110,943 |
| Renter-Occupied | 133,934 (32.9%) | $57,270 |
| Average | 407,673 (100.0%) | $90,011 |
Occupancy by Householder Income Bracket in Salt Lake County
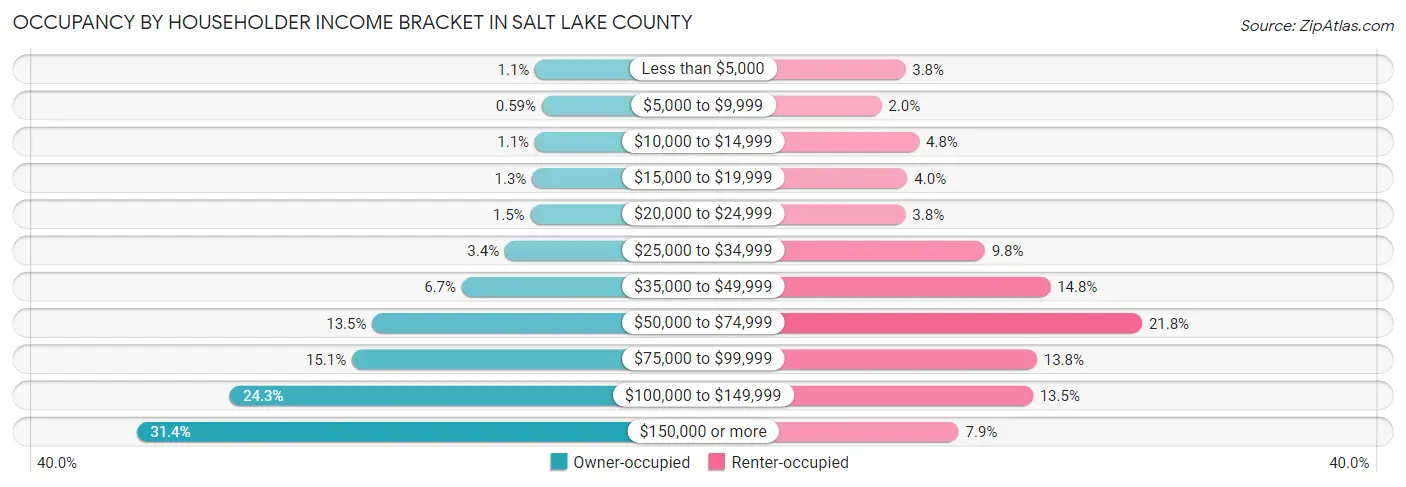
| Income Bracket | Owner-occupied | Renter-occupied |
| Less than $5,000 | 3,009 (1.1%) | 5,072 (3.8%) |
| $5,000 to $9,999 | 1,618 (0.6%) | 2,640 (2.0%) |
| $10,000 to $14,999 | 3,059 (1.1%) | 6,482 (4.8%) |
| $15,000 to $19,999 | 3,638 (1.3%) | 5,293 (4.0%) |
| $20,000 to $24,999 | 3,996 (1.5%) | 5,090 (3.8%) |
| $25,000 to $34,999 | 9,310 (3.4%) | 13,175 (9.8%) |
| $35,000 to $49,999 | 18,326 (6.7%) | 19,858 (14.8%) |
| $50,000 to $74,999 | 36,969 (13.5%) | 29,222 (21.8%) |
| $75,000 to $99,999 | 41,198 (15.0%) | 18,501 (13.8%) |
| $100,000 to $149,999 | 66,639 (24.3%) | 18,085 (13.5%) |
| $150,000 or more | 85,977 (31.4%) | 10,516 (7.9%) |
| Total | 273,739 (100.0%) | 133,934 (100.0%) |
Monthly Housing Cost Tiers in Salt Lake County
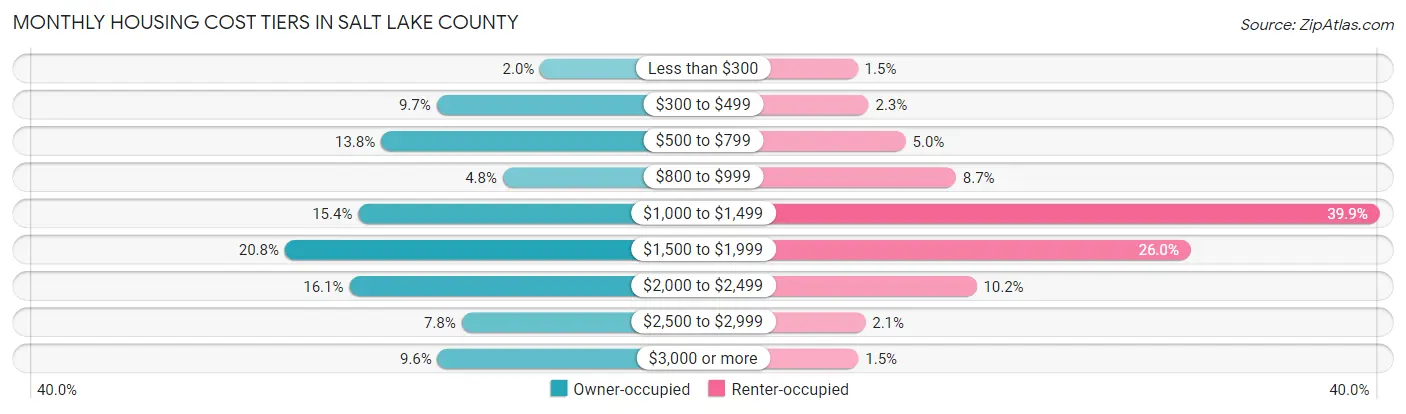
| Monthly Cost | Owner-occupied | Renter-occupied |
| Less than $300 | 5,557 (2.0%) | 1,998 (1.5%) |
| $300 to $499 | 26,448 (9.7%) | 3,067 (2.3%) |
| $500 to $799 | 37,650 (13.8%) | 6,722 (5.0%) |
| $800 to $999 | 13,098 (4.8%) | 11,680 (8.7%) |
| $1,000 to $1,499 | 42,251 (15.4%) | 53,470 (39.9%) |
| $1,500 to $1,999 | 57,052 (20.8%) | 34,843 (26.0%) |
| $2,000 to $2,499 | 44,053 (16.1%) | 13,709 (10.2%) |
| $2,500 to $2,999 | 21,407 (7.8%) | 2,747 (2.1%) |
| $3,000 or more | 26,223 (9.6%) | 2,062 (1.5%) |
| Total | 273,739 (100.0%) | 133,934 (100.0%) |
Physical Housing Characteristics in Salt Lake County
Housing Structures in Salt Lake County
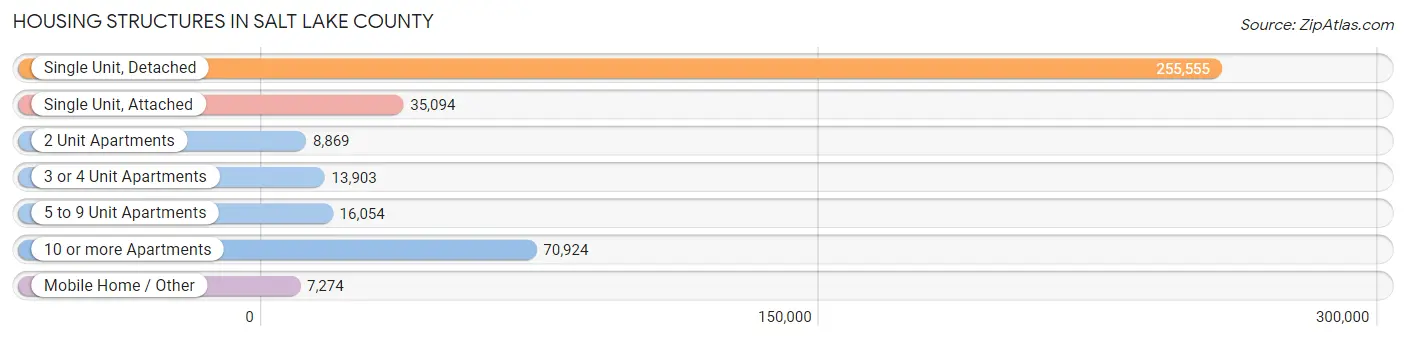
| Structure Type | # Housing Units | % Housing Units |
| Single Unit, Detached | 255,555 | 62.7% |
| Single Unit, Attached | 35,094 | 8.6% |
| 2 Unit Apartments | 8,869 | 2.2% |
| 3 or 4 Unit Apartments | 13,903 | 3.4% |
| 5 to 9 Unit Apartments | 16,054 | 3.9% |
| 10 or more Apartments | 70,924 | 17.4% |
| Mobile Home / Other | 7,274 | 1.8% |
| Total | 407,673 | 100.0% |
Housing Structures by Occupancy in Salt Lake County
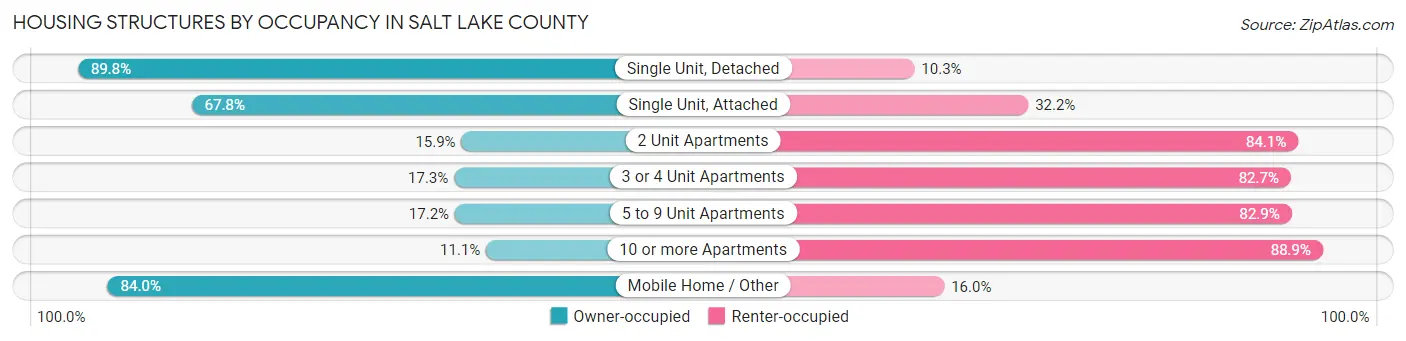
| Structure Type | Owner-occupied | Renter-occupied |
| Single Unit, Detached | 229,358 (89.7%) | 26,197 (10.2%) |
| Single Unit, Attached | 23,809 (67.8%) | 11,285 (32.2%) |
| 2 Unit Apartments | 1,409 (15.9%) | 7,460 (84.1%) |
| 3 or 4 Unit Apartments | 2,405 (17.3%) | 11,498 (82.7%) |
| 5 to 9 Unit Apartments | 2,753 (17.2%) | 13,301 (82.9%) |
| 10 or more Apartments | 7,894 (11.1%) | 63,030 (88.9%) |
| Mobile Home / Other | 6,111 (84.0%) | 1,163 (16.0%) |
| Total | 273,739 (67.1%) | 133,934 (32.9%) |
Housing Structures by Number of Rooms in Salt Lake County
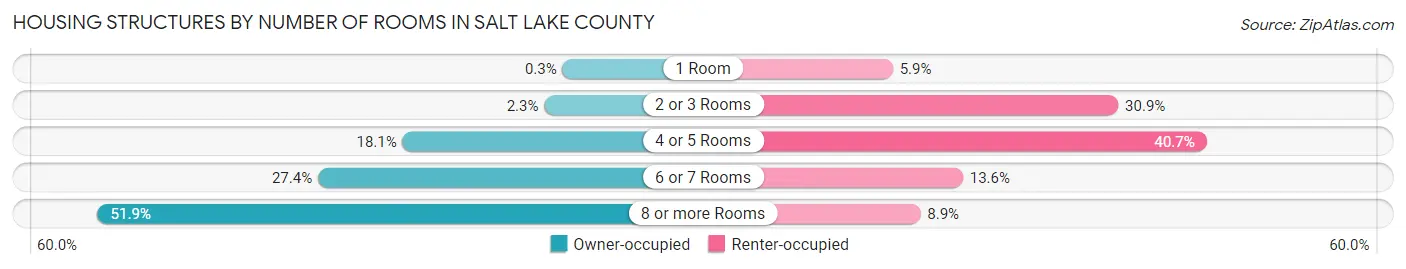
| Number of Rooms | Owner-occupied | Renter-occupied |
| 1 Room | 819 (0.3%) | 7,842 (5.9%) |
| 2 or 3 Rooms | 6,360 (2.3%) | 41,363 (30.9%) |
| 4 or 5 Rooms | 49,402 (18.0%) | 54,491 (40.7%) |
| 6 or 7 Rooms | 75,124 (27.4%) | 18,273 (13.6%) |
| 8 or more Rooms | 142,034 (51.9%) | 11,965 (8.9%) |
| Total | 273,739 (100.0%) | 133,934 (100.0%) |
Housing Structure by Heating Type in Salt Lake County
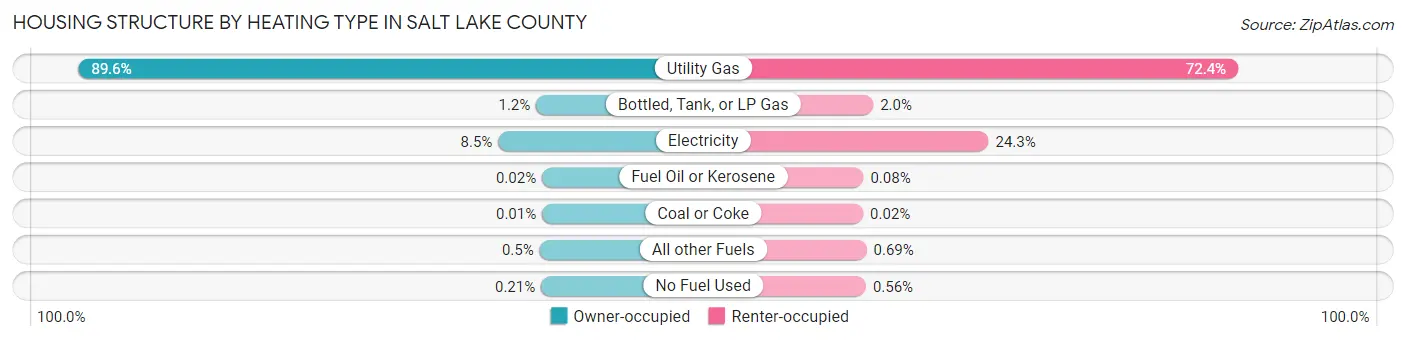
| Heating Type | Owner-occupied | Renter-occupied |
| Utility Gas | 245,303 (89.6%) | 97,003 (72.4%) |
| Bottled, Tank, or LP Gas | 3,185 (1.2%) | 2,641 (2.0%) |
| Electricity | 23,246 (8.5%) | 32,495 (24.3%) |
| Fuel Oil or Kerosene | 48 (0.0%) | 104 (0.1%) |
| Coal or Coke | 32 (0.0%) | 25 (0.0%) |
| All other Fuels | 1,358 (0.5%) | 921 (0.7%) |
| No Fuel Used | 567 (0.2%) | 745 (0.6%) |
| Total | 273,739 (100.0%) | 133,934 (100.0%) |
Household Vehicle Usage in Salt Lake County
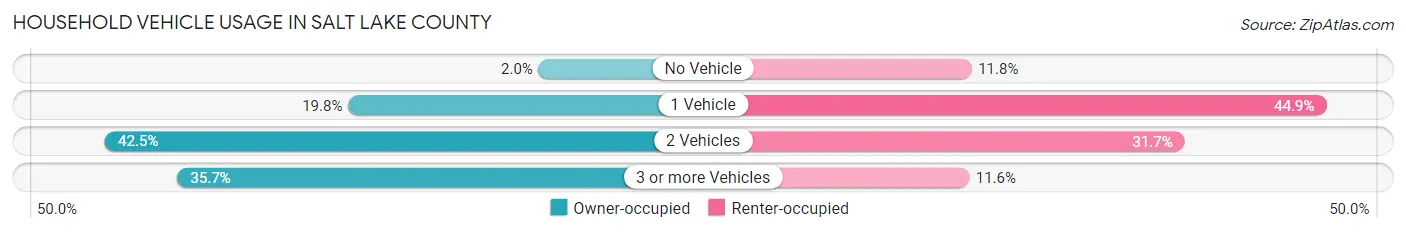
| Vehicles per Household | Owner-occupied | Renter-occupied |
| No Vehicle | 5,502 (2.0%) | 15,789 (11.8%) |
| 1 Vehicle | 54,163 (19.8%) | 60,196 (44.9%) |
| 2 Vehicles | 116,274 (42.5%) | 42,460 (31.7%) |
| 3 or more Vehicles | 97,800 (35.7%) | 15,489 (11.6%) |
| Total | 273,739 (100.0%) | 133,934 (100.0%) |
Real Estate & Mortgages in Salt Lake County
Real Estate and Mortgage Overview in Salt Lake County
| Characteristic | Without Mortgage | With Mortgage |
| Housing Units | 78,916 | 194,823 |
| Median Property Value | $435,800 | $442,000 |
| Median Household Income | $86,511 | $67,734 |
| Monthly Housing Costs | $556 | $25,796 |
| Real Estate Taxes | $2,642 | $4,461 |
Property Value by Mortgage Status in Salt Lake County
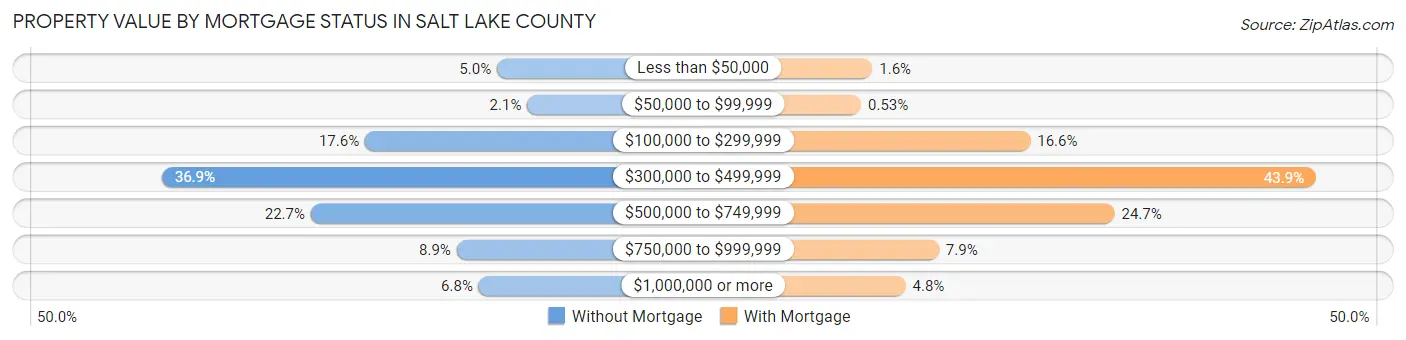
| Property Value | Without Mortgage | With Mortgage |
| Less than $50,000 | 3,956 (5.0%) | 3,118 (1.6%) |
| $50,000 to $99,999 | 1,679 (2.1%) | 1,034 (0.5%) |
| $100,000 to $299,999 | 13,874 (17.6%) | 32,415 (16.6%) |
| $300,000 to $499,999 | 29,146 (36.9%) | 85,422 (43.9%) |
| $500,000 to $749,999 | 17,948 (22.7%) | 48,058 (24.7%) |
| $750,000 to $999,999 | 6,988 (8.8%) | 15,478 (7.9%) |
| $1,000,000 or more | 5,325 (6.8%) | 9,298 (4.8%) |
| Total | 78,916 (100.0%) | 194,823 (100.0%) |
Household Income by Mortgage Status in Salt Lake County
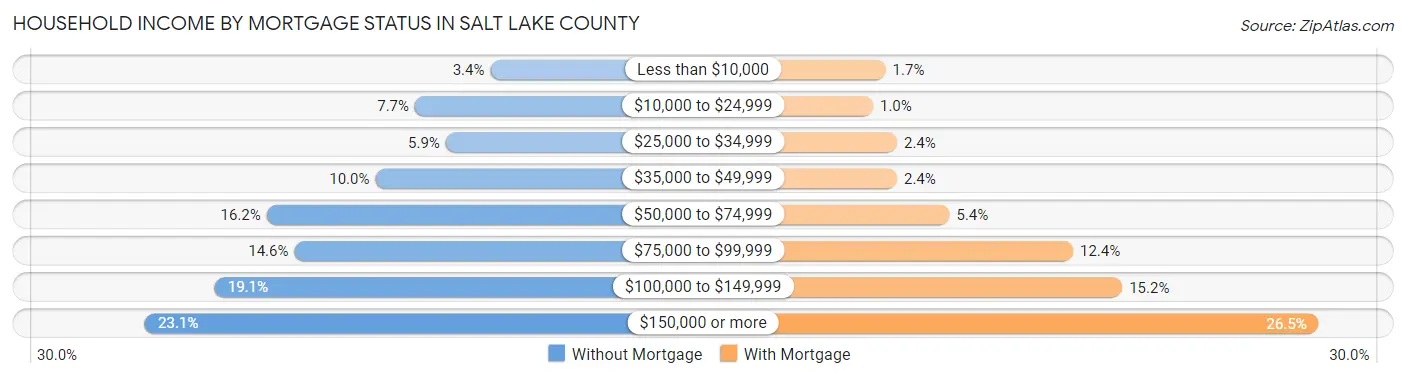
| Household Income | Without Mortgage | With Mortgage |
| Less than $10,000 | 2,676 (3.4%) | 3,349 (1.7%) |
| $10,000 to $24,999 | 6,080 (7.7%) | 1,951 (1.0%) |
| $25,000 to $34,999 | 4,688 (5.9%) | 4,613 (2.4%) |
| $35,000 to $49,999 | 7,862 (10.0%) | 4,622 (2.4%) |
| $50,000 to $74,999 | 12,758 (16.2%) | 10,464 (5.4%) |
| $75,000 to $99,999 | 11,512 (14.6%) | 24,211 (12.4%) |
| $100,000 to $149,999 | 15,097 (19.1%) | 29,686 (15.2%) |
| $150,000 or more | 18,243 (23.1%) | 51,542 (26.5%) |
| Total | 78,916 (100.0%) | 194,823 (100.0%) |
Property Value to Household Income Ratio in Salt Lake County
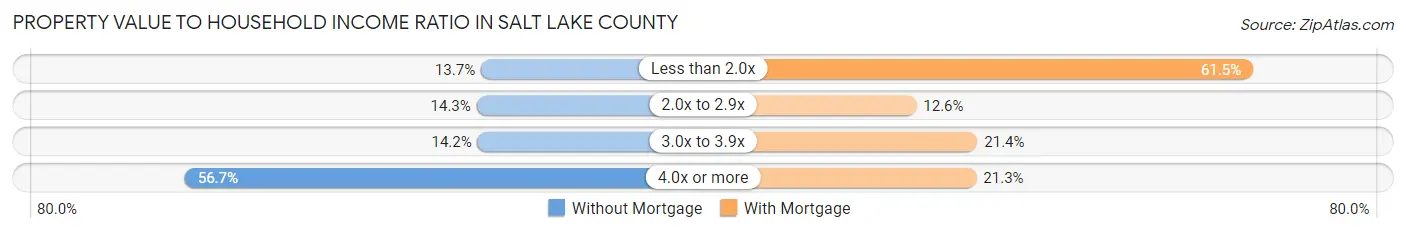
| Value-to-Income Ratio | Without Mortgage | With Mortgage |
| Less than 2.0x | 10,801 (13.7%) | 119,786 (61.5%) |
| 2.0x to 2.9x | 11,308 (14.3%) | 24,471 (12.6%) |
| 3.0x to 3.9x | 11,196 (14.2%) | 41,735 (21.4%) |
| 4.0x or more | 44,764 (56.7%) | 41,466 (21.3%) |
| Total | 78,916 (100.0%) | 194,823 (100.0%) |
Real Estate Taxes by Mortgage Status in Salt Lake County
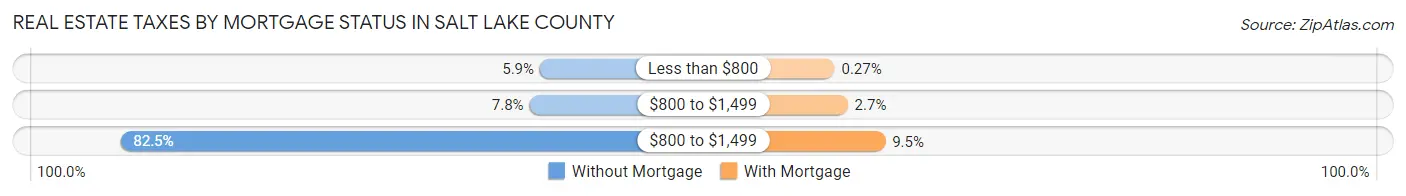
| Property Taxes | Without Mortgage | With Mortgage |
| Less than $800 | 4,649 (5.9%) | 523 (0.3%) |
| $800 to $1,499 | 6,150 (7.8%) | 5,209 (2.7%) |
| $800 to $1,499 | 65,102 (82.5%) | 18,560 (9.5%) |
| Total | 78,916 (100.0%) | 194,823 (100.0%) |
Health & Disability in Salt Lake County
Health Insurance Coverage by Age in Salt Lake County
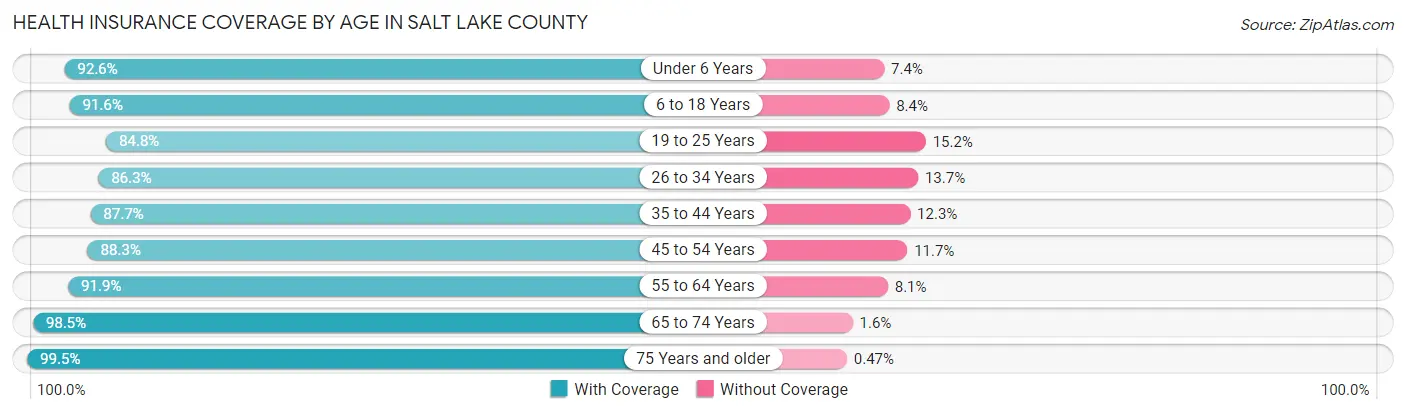
| Age Bracket | With Coverage | Without Coverage |
| Under 6 Years | 88,291 (92.6%) | 7,080 (7.4%) |
| 6 to 18 Years | 209,944 (91.6%) | 19,206 (8.4%) |
| 19 to 25 Years | 100,563 (84.8%) | 18,004 (15.2%) |
| 26 to 34 Years | 149,223 (86.3%) | 23,777 (13.7%) |
| 35 to 44 Years | 152,527 (87.7%) | 21,347 (12.3%) |
| 45 to 54 Years | 119,061 (88.3%) | 15,818 (11.7%) |
| 55 to 64 Years | 107,266 (91.9%) | 9,470 (8.1%) |
| 65 to 74 Years | 81,072 (98.5%) | 1,280 (1.5%) |
| 75 Years and older | 49,255 (99.5%) | 232 (0.5%) |
| Total | 1,057,202 (90.1%) | 116,214 (9.9%) |
Health Insurance Coverage by Citizenship Status in Salt Lake County
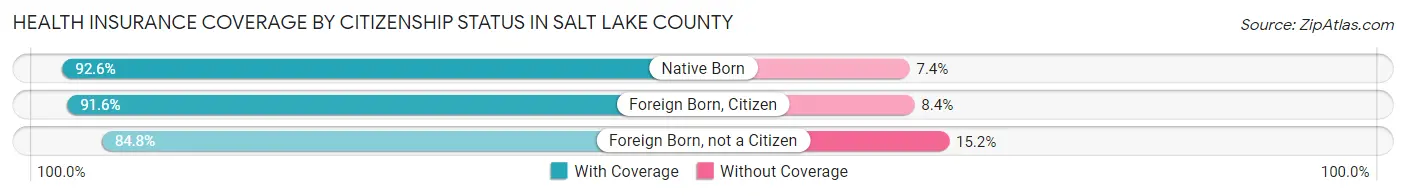
| Citizenship Status | With Coverage | Without Coverage |
| Native Born | 88,291 (92.6%) | 7,080 (7.4%) |
| Foreign Born, Citizen | 209,944 (91.6%) | 19,206 (8.4%) |
| Foreign Born, not a Citizen | 100,563 (84.8%) | 18,004 (15.2%) |
Health Insurance Coverage by Household Income in Salt Lake County
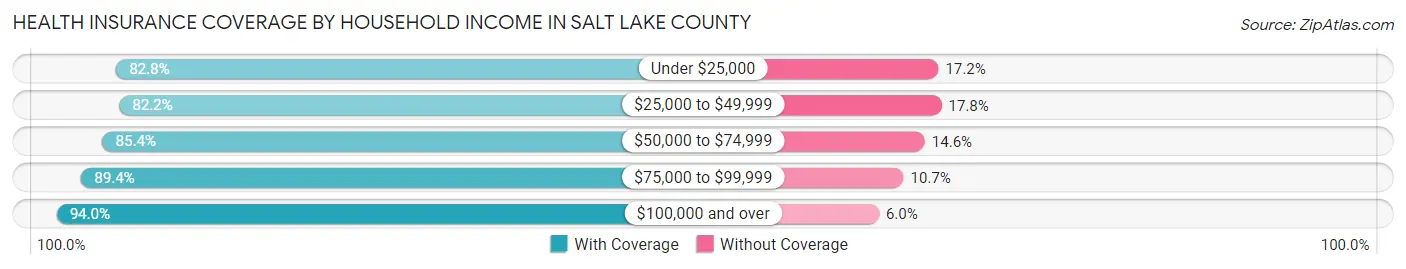
| Household Income | With Coverage | Without Coverage |
| Under $25,000 | 56,530 (82.8%) | 11,727 (17.2%) |
| $25,000 to $49,999 | 105,662 (82.2%) | 22,820 (17.8%) |
| $50,000 to $74,999 | 143,088 (85.4%) | 24,515 (14.6%) |
| $75,000 to $99,999 | 150,190 (89.3%) | 17,909 (10.6%) |
| $100,000 and over | 593,419 (94.0%) | 38,062 (6.0%) |
Public vs Private Health Insurance Coverage by Age in Salt Lake County
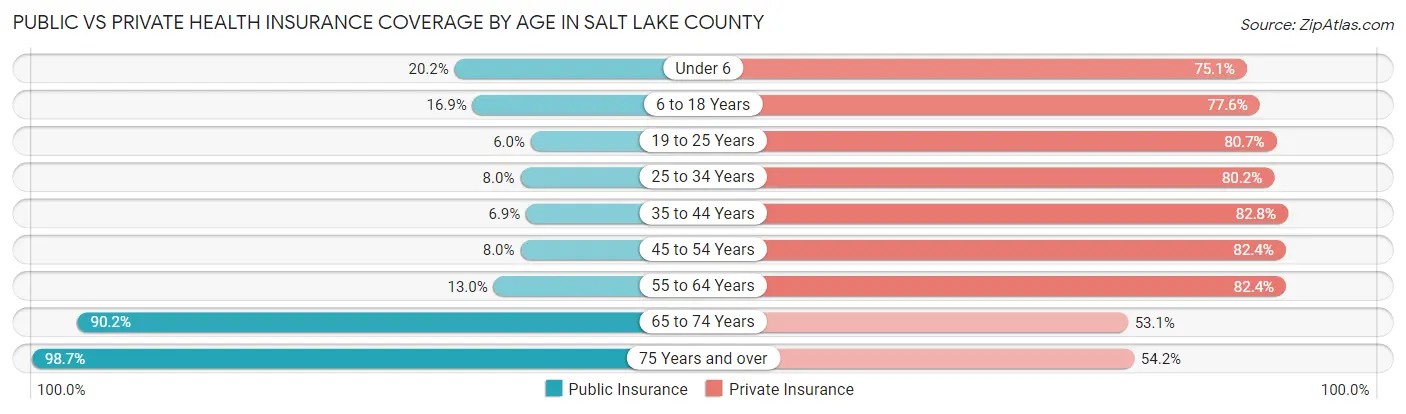
| Age Bracket | Public Insurance | Private Insurance |
| Under 6 | 19,258 (20.2%) | 71,631 (75.1%) |
| 6 to 18 Years | 38,618 (16.9%) | 177,708 (77.5%) |
| 19 to 25 Years | 7,156 (6.0%) | 95,648 (80.7%) |
| 25 to 34 Years | 13,840 (8.0%) | 138,818 (80.2%) |
| 35 to 44 Years | 12,014 (6.9%) | 143,957 (82.8%) |
| 45 to 54 Years | 10,760 (8.0%) | 111,108 (82.4%) |
| 55 to 64 Years | 15,112 (13.0%) | 96,231 (82.4%) |
| 65 to 74 Years | 74,254 (90.2%) | 43,701 (53.1%) |
| 75 Years and over | 48,824 (98.7%) | 26,833 (54.2%) |
| Total | 239,836 (20.4%) | 905,635 (77.2%) |
Disability Status by Sex by Age in Salt Lake County
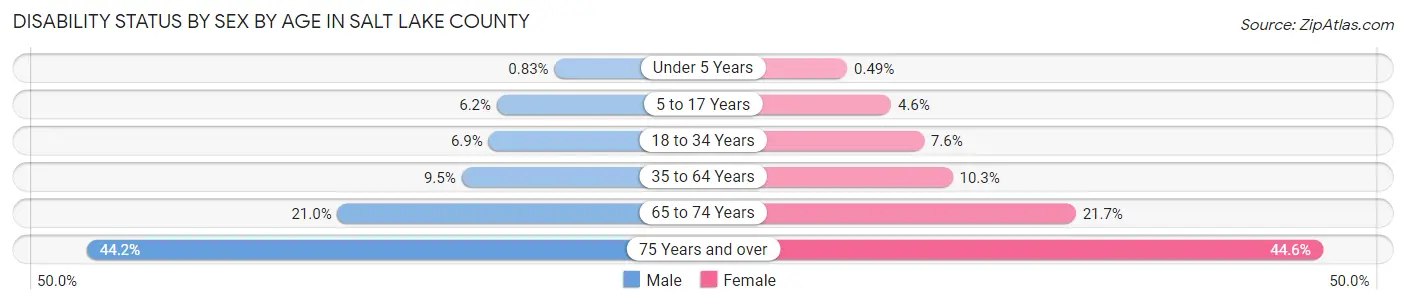
| Age Bracket | Male | Female |
| Under 5 Years | 341 (0.8%) | 190 (0.5%) |
| 5 to 17 Years | 7,169 (6.2%) | 5,085 (4.6%) |
| 18 to 34 Years | 10,958 (6.9%) | 11,488 (7.6%) |
| 35 to 64 Years | 20,506 (9.5%) | 21,419 (10.3%) |
| 65 to 74 Years | 8,282 (21.0%) | 9,301 (21.7%) |
| 75 Years and over | 9,252 (44.2%) | 12,744 (44.6%) |
Disability Class by Sex by Age in Salt Lake County
Disability Class: Hearing Difficulty
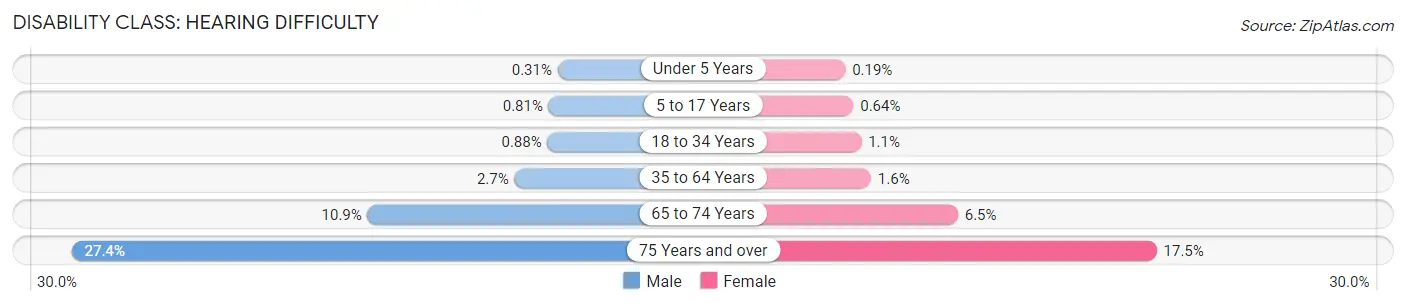
| Age Bracket | Male | Female |
| Under 5 Years | 126 (0.3%) | 73 (0.2%) |
| 5 to 17 Years | 941 (0.8%) | 708 (0.6%) |
| 18 to 34 Years | 1,390 (0.9%) | 1,624 (1.1%) |
| 35 to 64 Years | 5,912 (2.7%) | 3,378 (1.6%) |
| 65 to 74 Years | 4,305 (10.9%) | 2,766 (6.5%) |
| 75 Years and over | 5,728 (27.4%) | 5,008 (17.5%) |
Disability Class: Vision Difficulty
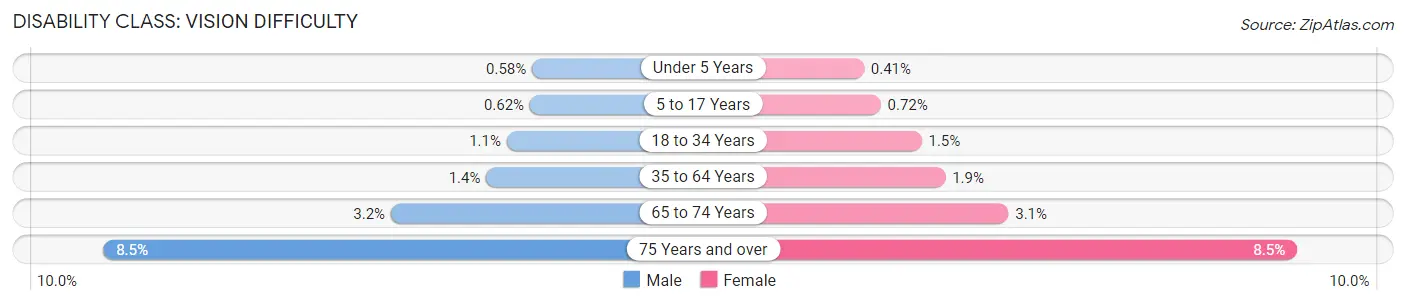
| Age Bracket | Male | Female |
| Under 5 Years | 239 (0.6%) | 160 (0.4%) |
| 5 to 17 Years | 716 (0.6%) | 803 (0.7%) |
| 18 to 34 Years | 1,659 (1.1%) | 2,236 (1.5%) |
| 35 to 64 Years | 3,106 (1.4%) | 4,002 (1.9%) |
| 65 to 74 Years | 1,263 (3.2%) | 1,322 (3.1%) |
| 75 Years and over | 1,786 (8.5%) | 2,413 (8.5%) |
Disability Class: Cognitive Difficulty
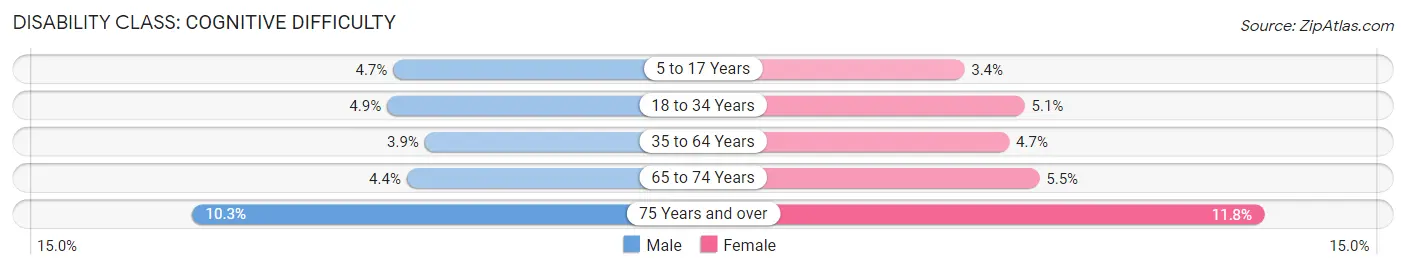
| Age Bracket | Male | Female |
| 5 to 17 Years | 5,511 (4.7%) | 3,796 (3.4%) |
| 18 to 34 Years | 7,743 (4.9%) | 7,684 (5.1%) |
| 35 to 64 Years | 8,389 (3.9%) | 9,710 (4.7%) |
| 65 to 74 Years | 1,721 (4.4%) | 2,355 (5.5%) |
| 75 Years and over | 2,159 (10.3%) | 3,356 (11.7%) |
Disability Class: Ambulatory Difficulty
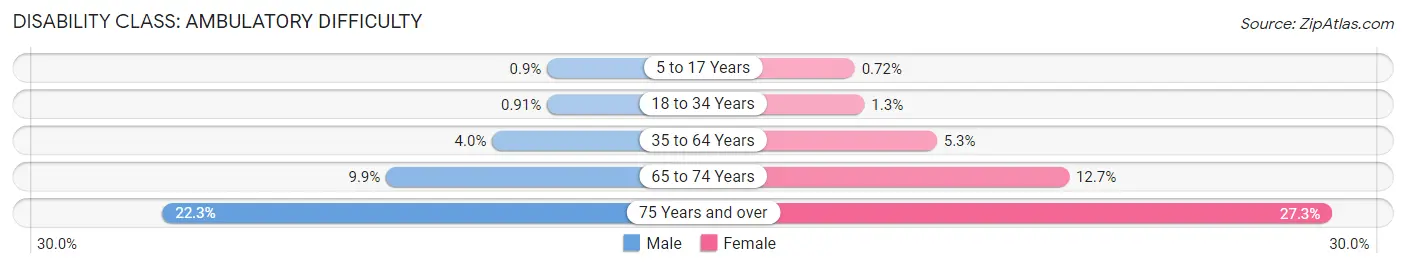
| Age Bracket | Male | Female |
| 5 to 17 Years | 1,051 (0.9%) | 807 (0.7%) |
| 18 to 34 Years | 1,430 (0.9%) | 1,900 (1.3%) |
| 35 to 64 Years | 8,598 (4.0%) | 11,035 (5.3%) |
| 65 to 74 Years | 3,900 (9.9%) | 5,420 (12.7%) |
| 75 Years and over | 4,672 (22.3%) | 7,798 (27.3%) |
Disability Class: Self-Care Difficulty
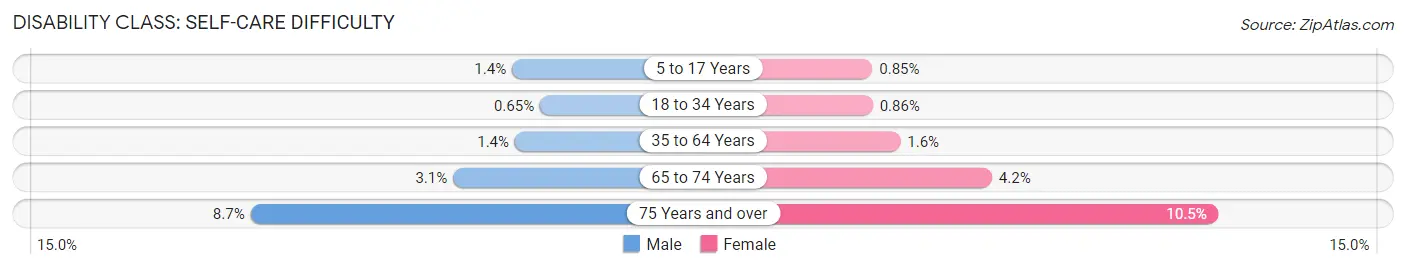
| Age Bracket | Male | Female |
| 5 to 17 Years | 1,656 (1.4%) | 945 (0.9%) |
| 18 to 34 Years | 1,033 (0.6%) | 1,300 (0.9%) |
| 35 to 64 Years | 2,928 (1.3%) | 3,405 (1.6%) |
| 65 to 74 Years | 1,212 (3.1%) | 1,792 (4.2%) |
| 75 Years and over | 1,822 (8.7%) | 2,996 (10.5%) |
Technology Access in Salt Lake County
Computing Device Access in Salt Lake County
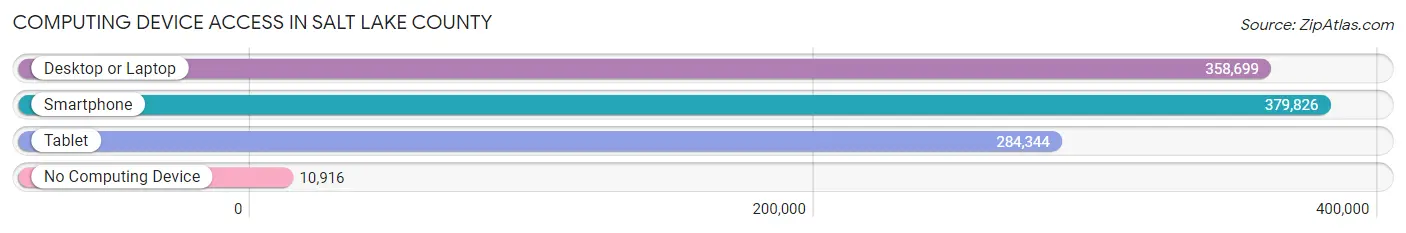
| Device Type | # Households | % Households |
| Desktop or Laptop | 358,699 | 88.0% |
| Smartphone | 379,826 | 93.2% |
| Tablet | 284,344 | 69.8% |
| No Computing Device | 10,916 | 2.7% |
| Total | 407,673 | 100.0% |
Internet Access in Salt Lake County
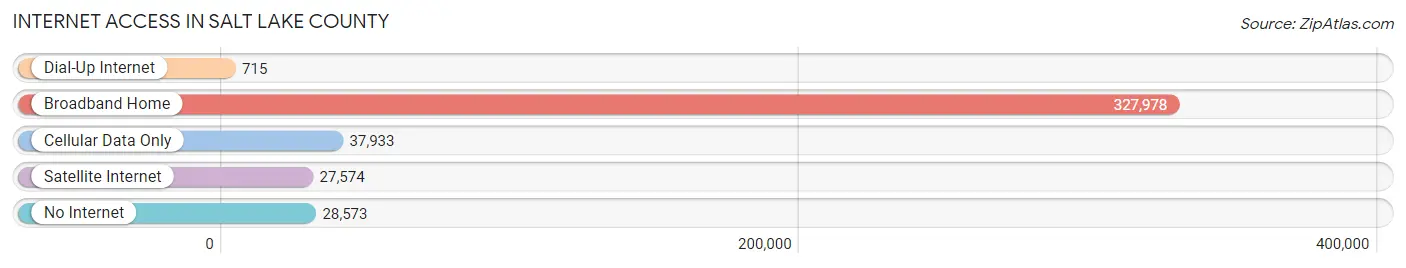
| Internet Type | # Households | % Households |
| Dial-Up Internet | 715 | 0.2% |
| Broadband Home | 327,978 | 80.4% |
| Cellular Data Only | 37,933 | 9.3% |
| Satellite Internet | 27,574 | 6.8% |
| No Internet | 28,573 | 7.0% |
| Total | 407,673 | 100.0% |
Salt Lake County Summary
Salt Lake County is located in the northern part of the U.S. state of Utah. It is the most populous county in the state, with an estimated population of 1,222,540 in 2019. The county seat is Salt Lake City, the state capital. Salt Lake County is bordered by Davis County to the north, Utah County to the south, Tooele County to the west, and Summit and Wasatch counties to the east.
History
Salt Lake County was established in 1850 as part of the Utah Territory. The county was named after the Great Salt Lake, which lies to the northwest of the county. The county was originally part of the larger Great Salt Lake County, which was created in 1852. In 1868, the county was divided into two parts, with the eastern portion becoming Salt Lake County and the western portion becoming Tooele County.
The county has a rich history, with many of its cities and towns having been founded by Mormon pioneers in the mid-1800s. Salt Lake City, the county seat, was founded in 1847 by Brigham Young and other members of The Church of Jesus Christ of Latter-day Saints. The city quickly grew to become the largest city in the state and the center of the Mormon faith.
Geography
Salt Lake County covers an area of 1,904 square miles, making it the largest county in Utah. The county is located in the Wasatch Front region of the state, which is characterized by its mountainous terrain and numerous lakes and rivers. The county is home to the Wasatch Mountains, which run along its eastern border. The highest point in the county is Mount Nebo, which rises to an elevation of 11,928 feet.
The county is home to several major rivers, including the Jordan River, which flows through the county from north to south. The county also contains several large reservoirs, including the Jordanelle Reservoir, which is located in the northern part of the county.
Economy
Salt Lake County has a diverse economy, with a variety of industries contributing to its economic growth. The county is home to several major corporations, including the Intermountain Healthcare system, the University of Utah, and the Church of Jesus Christ of Latter-day Saints.
The county is also home to a number of technology companies, including Adobe, eBay, and Oracle. The county is also home to several major retail centers, including the City Creek Center in downtown Salt Lake City.
Demographics
As of the 2019 census, Salt Lake County had an estimated population of 1,222,540. The population is predominantly white (83.3%), with the remaining population being made up of African Americans (3.2%), Asians (4.7%), and Hispanics (7.7%).
The median household income in the county is $63,945, and the median home value is $322,400. The county has a poverty rate of 11.2%, which is slightly higher than the national average.
Conclusion
Salt Lake County is the most populous county in Utah, with an estimated population of 1,222,540 in 2019. The county has a rich history, with many of its cities and towns having been founded by Mormon pioneers in the mid-1800s. The county is located in the Wasatch Front region of the state, and is home to the Wasatch Mountains, several major rivers, and several large reservoirs. The county has a diverse economy, with a variety of industries contributing to its economic growth. The population of the county is predominantly white, with the remaining population being made up of African Americans, Asians, and Hispanics. The median household income in the county is $63,945, and the median home value is $322,400.
Common Questions
What is the Total Population of Salt Lake County?
Total Population of Salt Lake County is 1,180,643.
What is the Total Male Population of Salt Lake County?
Total Male Population of Salt Lake County is 597,700.
What is the Total Female Population of Salt Lake County?
Total Female Population of Salt Lake County is 582,943.
What is the Ratio of Males per 100 Females in Salt Lake County?
There are 102.53 Males per 100 Females in Salt Lake County.
What is the Ratio of Females per 100 Males in Salt Lake County?
There are 97.53 Females per 100 Males in Salt Lake County.
What is the Median Population Age in Salt Lake County?
Median Population Age in Salt Lake County is 33.4 Years.
What is the Average Family Size in Salt Lake County
Average Family Size in Salt Lake County is 3.5 People.
What is the Average Household Size in Salt Lake County
Average Household Size in Salt Lake County is 2.9 People.
What is Per Capita Income in Salt Lake County?
Per Capita income in Salt Lake County is $40,969.
What is the Median Family Income in Salt Lake County?
Median Family Income in Salt Lake County is $106,281.
What is the Median Household income in Salt Lake County?
Median Household Income in Salt Lake County is $90,011.
What is Income or Wage Gap in Salt Lake County?
Income or Wage Gap in Salt Lake County is 33.0%.
Women in Salt Lake County earn 67.0 cents for every dollar earned by a man.
What is Family Income Deficit in Salt Lake County?
Family Income Deficit in Salt Lake County is $11,144.
Families that are below poverty line in Salt Lake County earn $11,144 less on average than the poverty threshold level.
What is Inequality or Gini Index in Salt Lake County?
Inequality or Gini Index in Salt Lake County is 0.43.
How Large is the Labor Force in Salt Lake County?
There are 653,668 People in the Labor Forcein in Salt Lake County.
What is the Percentage of People in the Labor Force in Salt Lake County?
72.0% of People are in the Labor Force in Salt Lake County.
What is the Unemployment Rate in Salt Lake County?
Unemployment Rate in Salt Lake County is 3.6%.