Rich County, UT
Rich County Map
Rich County Overview
2,543
TOTAL POPULATION
1,287
MALE POPULATION
1,256
FEMALE POPULATION
102.47
MALES / 100 FEMALES
97.59
FEMALES / 100 MALES
33.9
MEDIAN AGE
3.8
AVG FAMILY SIZE
3.3
AVG HOUSEHOLD SIZE
$26,796
PER CAPITA INCOME
$82,875
AVG FAMILY INCOME
$69,250
AVG HOUSEHOLD INCOME
49.9%
WAGE / INCOME GAP [ % ]
50.1¢/ $1
WAGE / INCOME GAP [ $ ]
0.37
INEQUALITY / GINI INDEX
1,008
LABOR FORCE [ PEOPLE ]
55.7%
PERCENT IN LABOR FORCE
2.6%
UNEMPLOYMENT RATE
Rich County Area Codes
Race in Rich County
The most populous races in Rich County are White / Caucasian (2,239 | 88.0%), Hispanic or Latino (256 | 10.1%), and Two or more Races (198 | 7.8%).
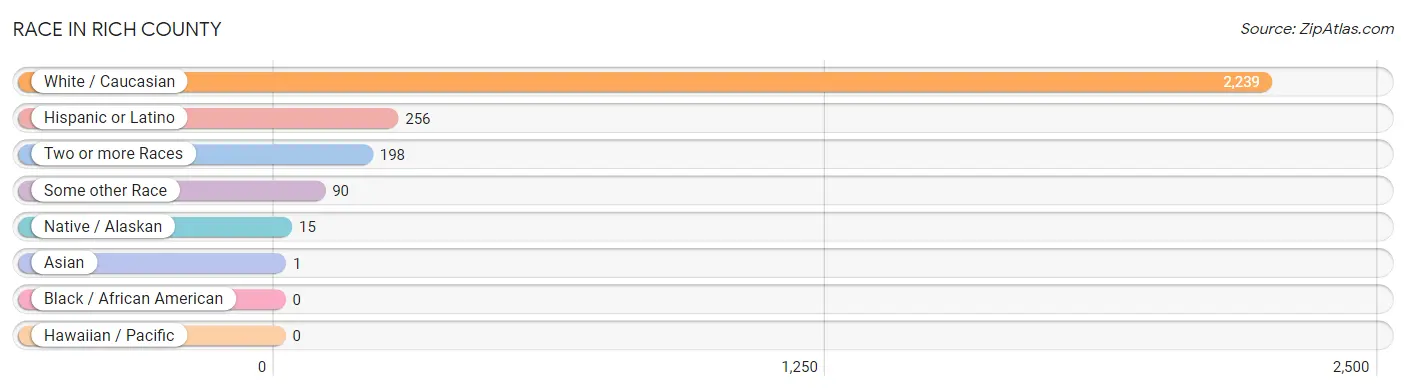
| Race | # Population | % Population |
| Asian | 1 | 0.0% |
| Black / African American | 0 | 0.0% |
| Hawaiian / Pacific | 0 | 0.0% |
| Hispanic or Latino | 256 | 10.1% |
| Native / Alaskan | 15 | 0.6% |
| White / Caucasian | 2,239 | 88.0% |
| Two or more Races | 198 | 7.8% |
| Some other Race | 90 | 3.5% |
| Total | 2,543 | 100.0% |
Ancestry in Rich County
The most populous ancestries reported in Rich County are English (1,073 | 42.2%), Scottish (274 | 10.8%), German (270 | 10.6%), European (269 | 10.6%), and Mexican (219 | 8.6%), together accounting for 82.8% of all Rich County residents.
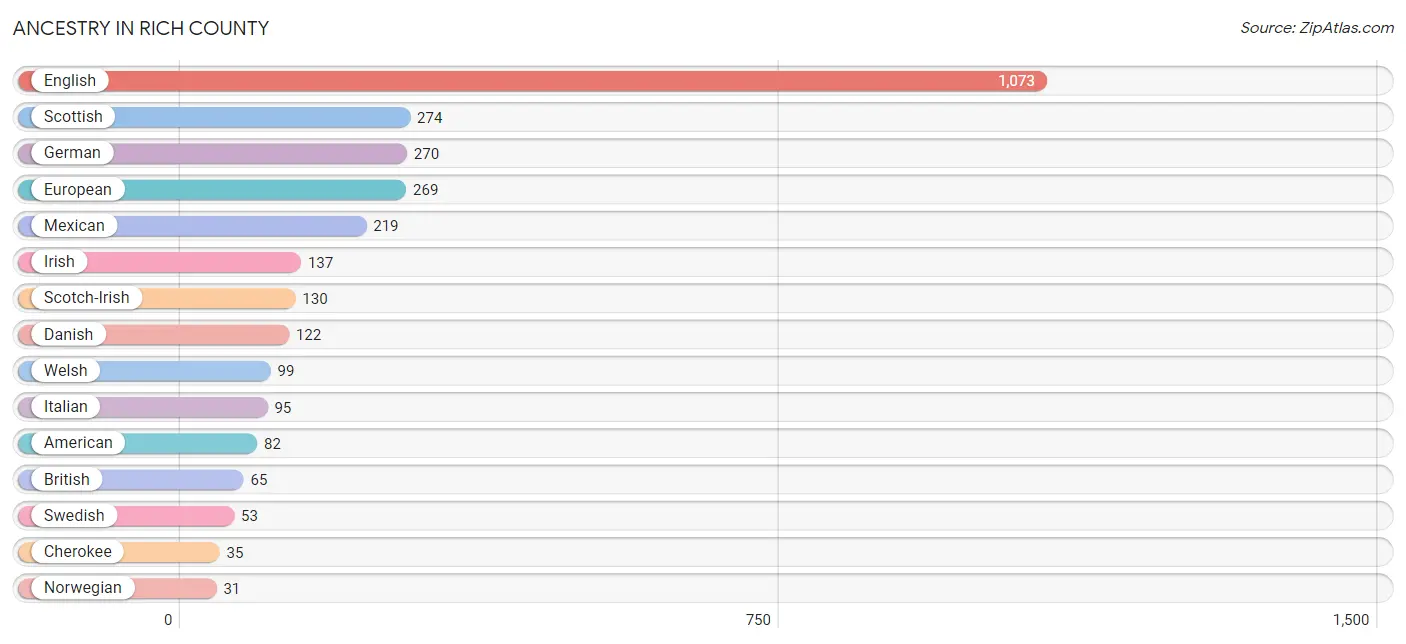
| Ancestry | # Population | % Population |
| American | 82 | 3.2% |
| Belgian | 14 | 0.5% |
| Brazilian | 1 | 0.0% |
| British | 65 | 2.6% |
| Cherokee | 35 | 1.4% |
| Czech | 20 | 0.8% |
| Danish | 122 | 4.8% |
| Dutch | 27 | 1.1% |
| English | 1,073 | 42.2% |
| European | 269 | 10.6% |
| French | 24 | 0.9% |
| German | 270 | 10.6% |
| Irish | 137 | 5.4% |
| Italian | 95 | 3.7% |
| Mexican | 219 | 8.6% |
| Navajo | 15 | 0.6% |
| Northern European | 4 | 0.2% |
| Norwegian | 31 | 1.2% |
| Peruvian | 7 | 0.3% |
| Polish | 7 | 0.3% |
| Puerto Rican | 10 | 0.4% |
| Russian | 4 | 0.2% |
| Scandinavian | 7 | 0.3% |
| Scotch-Irish | 130 | 5.1% |
| Scottish | 274 | 10.8% |
| South American | 7 | 0.3% |
| Spaniard | 19 | 0.7% |
| Spanish | 1 | 0.0% |
| Swedish | 53 | 2.1% |
| Swiss | 28 | 1.1% |
| Turkish | 9 | 0.4% |
| Welsh | 99 | 3.9% | View All 32 Rows |
Immigrants in Rich County
The most numerous immigrant groups reported in Rich County came from Latin America (79 | 3.1%), Central America (72 | 2.8%), Mexico (72 | 2.8%), Peru (7 | 0.3%), and South America (7 | 0.3%), together accounting for 9.3% of all Rich County residents.
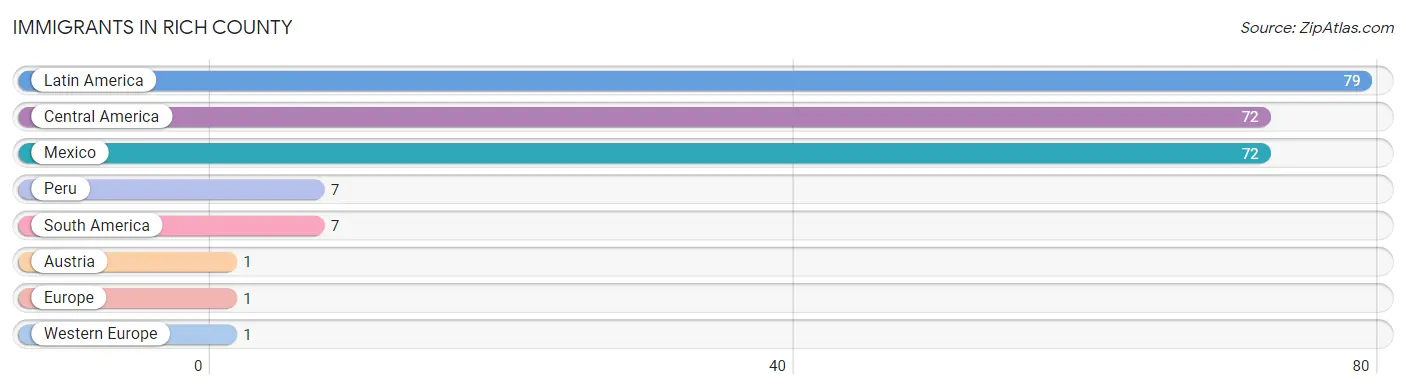
| Immigration Origin | # Population | % Population |
| Austria | 1 | 0.0% |
| Central America | 72 | 2.8% |
| Europe | 1 | 0.0% |
| Latin America | 79 | 3.1% |
| Mexico | 72 | 2.8% |
| Peru | 7 | 0.3% |
| South America | 7 | 0.3% |
| Western Europe | 1 | 0.0% | View All 8 Rows |
Sex and Age in Rich County
Sex and Age in Rich County
The most populous age groups in Rich County are 5 to 9 Years (189 | 14.7%) for men and 15 to 19 Years (148 | 11.8%) for women.
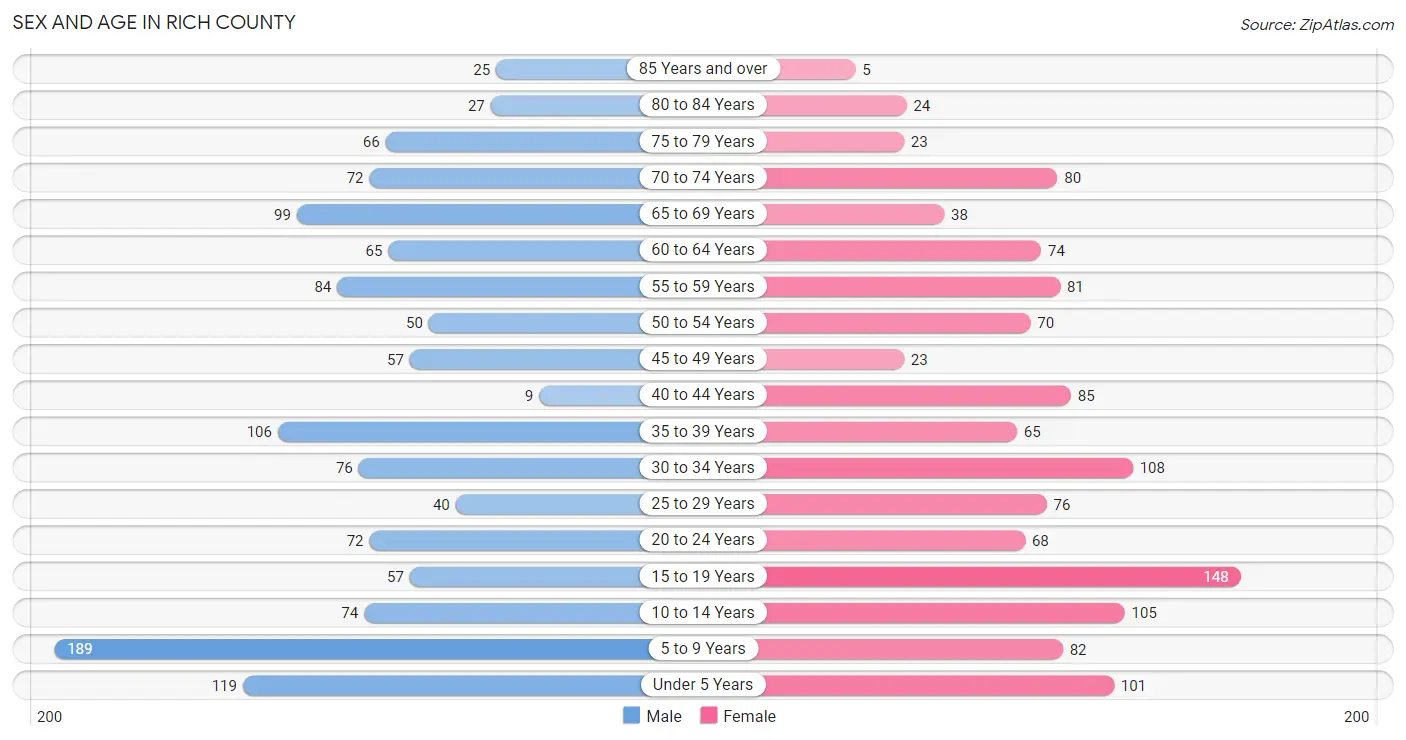
| Age Bracket | Male | Female |
| Under 5 Years | 119 (9.2%) | 101 (8.0%) |
| 5 to 9 Years | 189 (14.7%) | 82 (6.5%) |
| 10 to 14 Years | 74 (5.8%) | 105 (8.4%) |
| 15 to 19 Years | 57 (4.4%) | 148 (11.8%) |
| 20 to 24 Years | 72 (5.6%) | 68 (5.4%) |
| 25 to 29 Years | 40 (3.1%) | 76 (6.0%) |
| 30 to 34 Years | 76 (5.9%) | 108 (8.6%) |
| 35 to 39 Years | 106 (8.2%) | 65 (5.2%) |
| 40 to 44 Years | 9 (0.7%) | 85 (6.8%) |
| 45 to 49 Years | 57 (4.4%) | 23 (1.8%) |
| 50 to 54 Years | 50 (3.9%) | 70 (5.6%) |
| 55 to 59 Years | 84 (6.5%) | 81 (6.5%) |
| 60 to 64 Years | 65 (5.1%) | 74 (5.9%) |
| 65 to 69 Years | 99 (7.7%) | 38 (3.0%) |
| 70 to 74 Years | 72 (5.6%) | 80 (6.4%) |
| 75 to 79 Years | 66 (5.1%) | 23 (1.8%) |
| 80 to 84 Years | 27 (2.1%) | 24 (1.9%) |
| 85 Years and over | 25 (1.9%) | 5 (0.4%) |
| Total | 1,287 (100.0%) | 1,256 (100.0%) |
Families and Households in Rich County
Median Family Size in Rich County
The median family size in Rich County is 3.82 persons per family, with married-couple families (537 | 88.0%) accounting for the largest median family size of 3.9 persons per family. On the other hand, single female/mother families (58 | 9.5%) represent the smallest median family size with 3.16 persons per family.
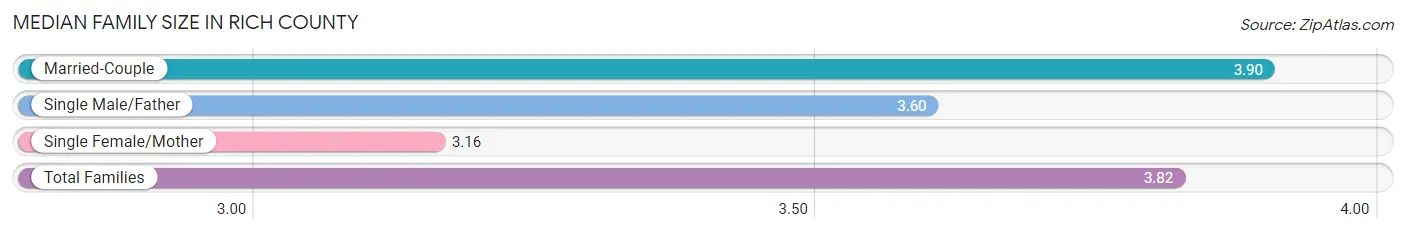
| Family Type | # Families | Family Size |
| Married-Couple | 537 (88.0%) | 3.90 |
| Single Male/Father | 15 (2.5%) | 3.60 |
| Single Female/Mother | 58 (9.5%) | 3.16 |
| Total Families | 610 (100.0%) | 3.82 |
Median Household Size in Rich County
The median household size in Rich County is 3.30 persons per household, with married-couple households (537 | 70.2%) accounting for the largest median household size of 3.94 persons per household. non-family households (155 | 20.3%) represent the smallest median household size with 1.11 persons per household.
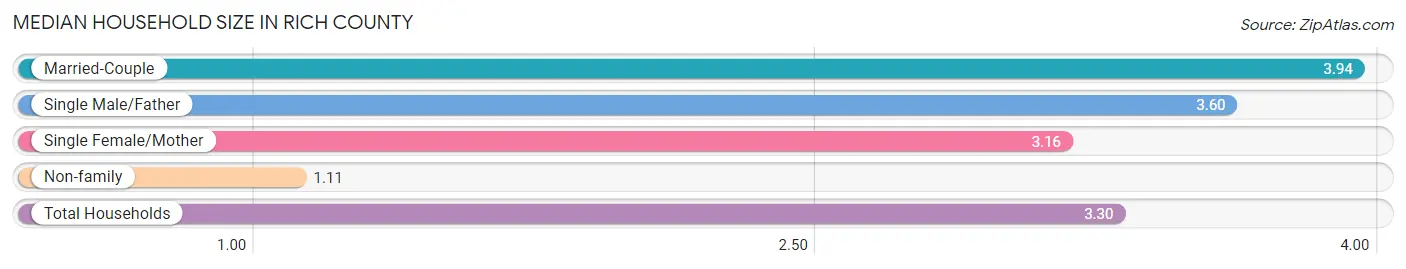
| Household Type | # Households | Household Size |
| Married-Couple | 537 (70.2%) | 3.94 |
| Single Male/Father | 15 (2.0%) | 3.60 |
| Single Female/Mother | 58 (7.6%) | 3.16 |
| Non-family | 155 (20.3%) | 1.11 |
| Total Households | 765 (100.0%) | 3.30 |
Household Size by Marriage Status in Rich County
Out of a total of 765 households in Rich County, 610 (79.7%) are family households, while 155 (20.3%) are nonfamily households. The most numerous type of family households are 2-person households, comprising 320, and the most common type of nonfamily households are 1-person households, comprising 138.
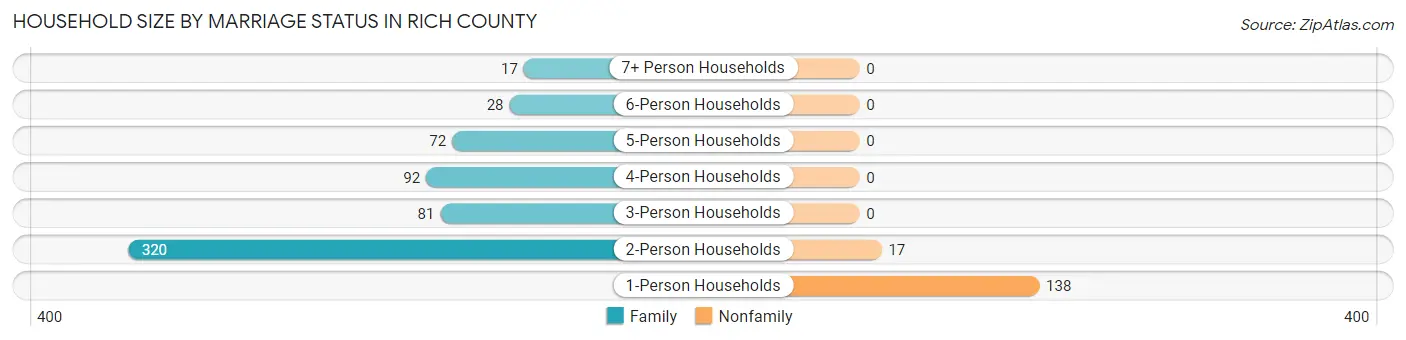
| Household Size | Family Households | Nonfamily Households |
| 1-Person Households | - | 138 (18.0%) |
| 2-Person Households | 320 (41.8%) | 17 (2.2%) |
| 3-Person Households | 81 (10.6%) | 0 (0.0%) |
| 4-Person Households | 92 (12.0%) | 0 (0.0%) |
| 5-Person Households | 72 (9.4%) | 0 (0.0%) |
| 6-Person Households | 28 (3.7%) | 0 (0.0%) |
| 7+ Person Households | 17 (2.2%) | 0 (0.0%) |
| Total | 610 (79.7%) | 155 (20.3%) |
Female Fertility in Rich County
Fertility by Age in Rich County
Average fertility rate in Rich County is 22.0 births per 1,000 women. Women in the age bracket of 20 to 34 years have the highest fertility rate with 52.0 births per 1,000 women. Women in the age bracket of 20 to 34 years acount for 100.0% of all women with births.
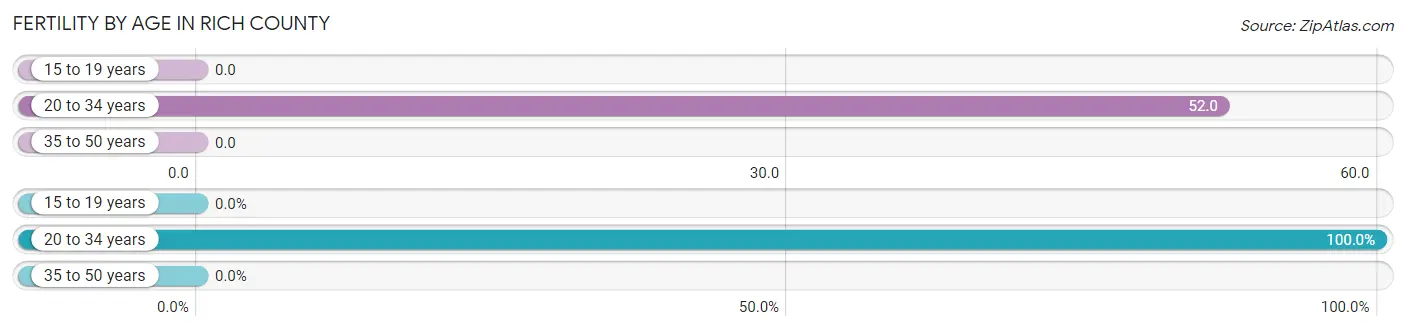
| Age Bracket | Women with Births | Births / 1,000 Women |
| 15 to 19 years | 0 (0.0%) | 0.0 |
| 20 to 34 years | 13 (100.0%) | 52.0 |
| 35 to 50 years | 0 (0.0%) | 0.0 |
| Total | 13 (100.0%) | 22.0 |
Fertility by Age by Marriage Status in Rich County
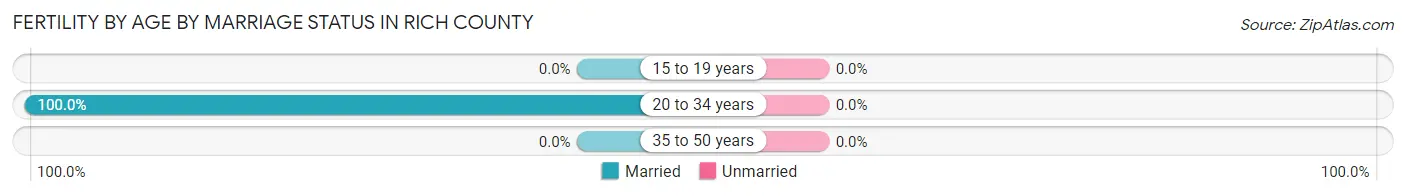
| Age Bracket | Married | Unmarried |
| 15 to 19 years | 0 (0.0%) | 0 (0.0%) |
| 20 to 34 years | 13 (100.0%) | 0 (0.0%) |
| 35 to 50 years | 0 (0.0%) | 0 (0.0%) |
| Total | 13 (100.0%) | 0 (0.0%) |
Fertility by Education in Rich County
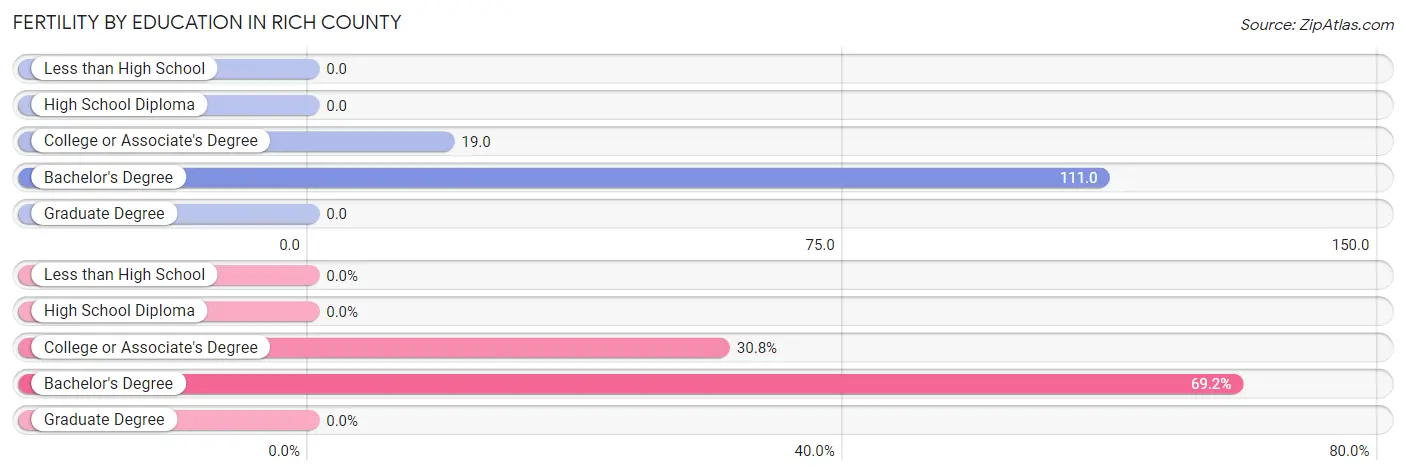
| Educational Attainment | Women with Births | Births / 1,000 Women |
| Less than High School | 0 (0.0%) | 0.0 |
| High School Diploma | 0 (0.0%) | 0.0 |
| College or Associate's Degree | 4 (30.8%) | 19.0 |
| Bachelor's Degree | 9 (69.2%) | 111.0 |
| Graduate Degree | 0 (0.0%) | 0.0 |
| Total | 13 (100.0%) | 22.0 |
Fertility by Education by Marriage Status in Rich County
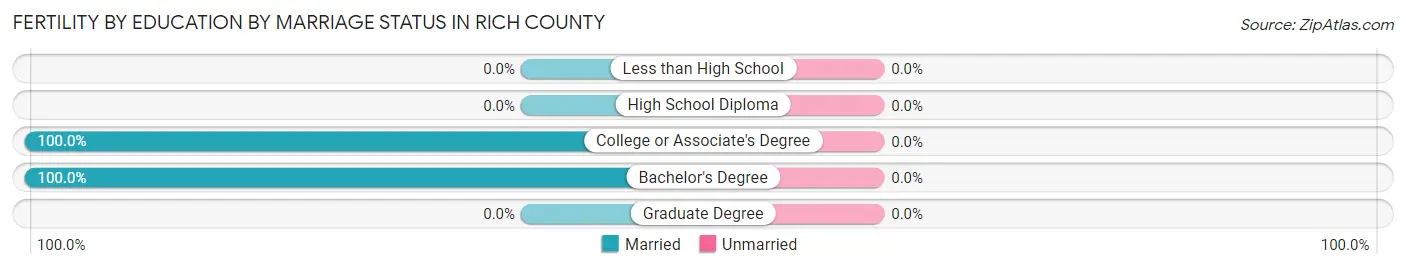
| Educational Attainment | Married | Unmarried |
| Less than High School | 0 (0.0%) | 0 (0.0%) |
| High School Diploma | 0 (0.0%) | 0 (0.0%) |
| College or Associate's Degree | 4 (100.0%) | 0 (0.0%) |
| Bachelor's Degree | 9 (100.0%) | 0 (0.0%) |
| Graduate Degree | 0 (0.0%) | 0 (0.0%) |
| Total | 13 (100.0%) | 0 (0.0%) |
Income in Rich County
Income Overview in Rich County
Per Capita Income in Rich County is $26,796, while median incomes of families and households are $82,875 and $69,250 respectively.
| Characteristic | Number | Measure |
| Per Capita Income | 2,543 | $26,796 |
| Median Family Income | 610 | $82,875 |
| Mean Family Income | 610 | $90,509 |
| Median Household Income | 765 | $69,250 |
| Mean Household Income | 765 | $81,732 |
| Income Deficit | 610 | $0 |
| Wage / Income Gap (%) | 2,543 | 49.92% |
| Wage / Income Gap ($) | 2,543 | 50.08¢ per $1 |
| Gini / Inequality Index | 2,543 | 0.37 |
Earnings by Sex in Rich County
Average Earnings in Rich County are $38,245, $53,750 for men and $26,920 for women, a difference of 49.9%.
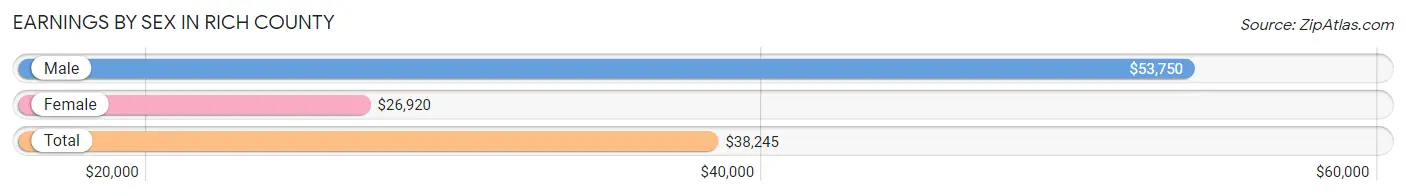
| Sex | Number | Average Earnings |
| Male | 568 (52.8%) | $53,750 |
| Female | 507 (47.2%) | $26,920 |
| Total | 1,075 (100.0%) | $38,245 |
Earnings by Sex by Income Bracket in Rich County
The most common earnings brackets in Rich County are $100,000+ for men (99 | 17.4%) and $35,000 to $39,999 for women (96 | 18.9%).
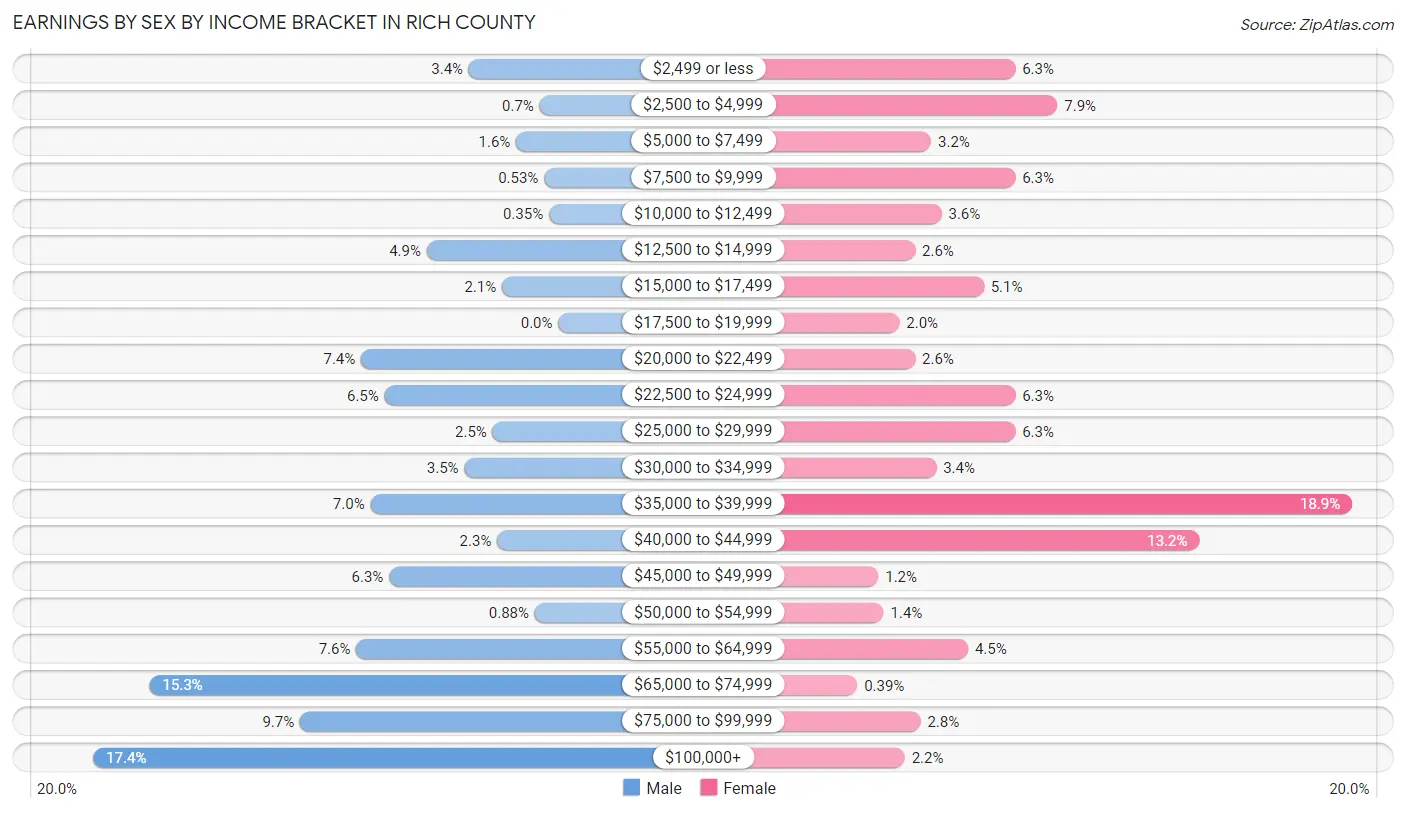
| Income | Male | Female |
| $2,499 or less | 19 (3.4%) | 32 (6.3%) |
| $2,500 to $4,999 | 4 (0.7%) | 40 (7.9%) |
| $5,000 to $7,499 | 9 (1.6%) | 16 (3.2%) |
| $7,500 to $9,999 | 3 (0.5%) | 32 (6.3%) |
| $10,000 to $12,499 | 2 (0.4%) | 18 (3.5%) |
| $12,500 to $14,999 | 28 (4.9%) | 13 (2.6%) |
| $15,000 to $17,499 | 12 (2.1%) | 26 (5.1%) |
| $17,500 to $19,999 | 0 (0.0%) | 10 (2.0%) |
| $20,000 to $22,499 | 42 (7.4%) | 13 (2.6%) |
| $22,500 to $24,999 | 37 (6.5%) | 32 (6.3%) |
| $25,000 to $29,999 | 14 (2.5%) | 32 (6.3%) |
| $30,000 to $34,999 | 20 (3.5%) | 17 (3.4%) |
| $35,000 to $39,999 | 40 (7.0%) | 96 (18.9%) |
| $40,000 to $44,999 | 13 (2.3%) | 67 (13.2%) |
| $45,000 to $49,999 | 36 (6.3%) | 6 (1.2%) |
| $50,000 to $54,999 | 5 (0.9%) | 7 (1.4%) |
| $55,000 to $64,999 | 43 (7.6%) | 23 (4.5%) |
| $65,000 to $74,999 | 87 (15.3%) | 2 (0.4%) |
| $75,000 to $99,999 | 55 (9.7%) | 14 (2.8%) |
| $100,000+ | 99 (17.4%) | 11 (2.2%) |
| Total | 568 (100.0%) | 507 (100.0%) |
Earnings by Sex by Educational Attainment in Rich County
Average earnings in Rich County are $56,700 for men and $35,761 for women, a difference of 36.9%. Men with an educational attainment of high school diploma enjoy the highest average annual earnings of $73,250, while those with less than high school education earn the least with $24,792. Women with an educational attainment of college or associate's degree earn the most with the average annual earnings of $37,994, while those with high school diploma education have the smallest earnings of $33,000.
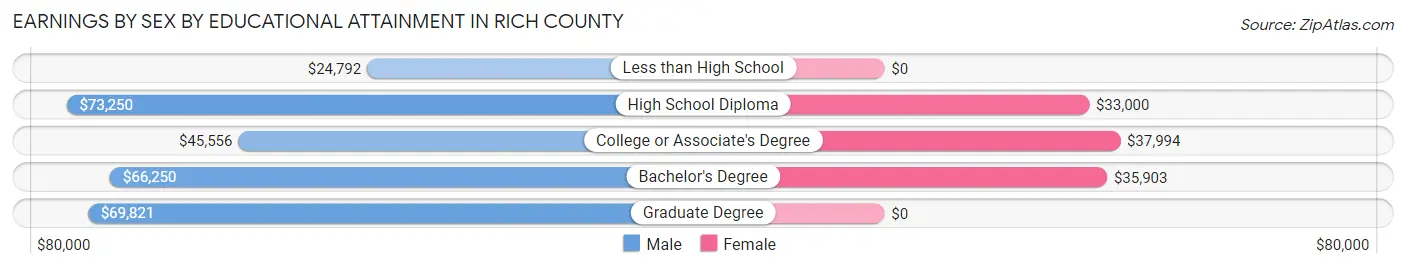
| Educational Attainment | Male Income | Female Income |
| Less than High School | $24,792 | $0 |
| High School Diploma | $73,250 | $33,000 |
| College or Associate's Degree | $45,556 | $37,994 |
| Bachelor's Degree | $66,250 | $35,903 |
| Graduate Degree | $69,821 | $0 |
| Total | $56,700 | $35,761 |
Family Income in Rich County
Family Income Brackets in Rich County
According to the Rich County family income data, there are 157 families falling into the $50,000 to $74,999 income range, which is the most common income bracket and makes up 25.7% of all families. Conversely, the $15,000 to $24,999 income bracket is the least frequent group with only 10 families (1.6%) belonging to this category.
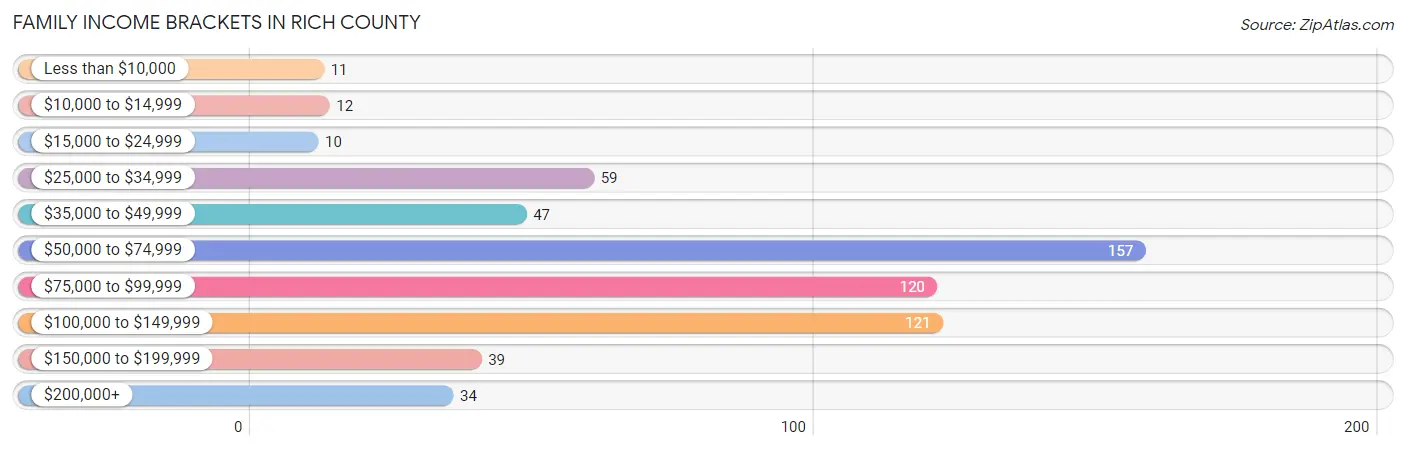
| Income Bracket | # Families | % Families |
| Less than $10,000 | 11 | 1.8% |
| $10,000 to $14,999 | 12 | 2.0% |
| $15,000 to $24,999 | 10 | 1.6% |
| $25,000 to $34,999 | 59 | 9.7% |
| $35,000 to $49,999 | 47 | 7.7% |
| $50,000 to $74,999 | 157 | 25.7% |
| $75,000 to $99,999 | 120 | 19.7% |
| $100,000 to $149,999 | 121 | 19.8% |
| $150,000 to $199,999 | 39 | 6.4% |
| $200,000+ | 34 | 5.6% |
Family Income by Famaliy Size in Rich County
3-person families (81 | 13.3%) account for the highest median family income in Rich County with $179,375 per family, while 3-person families (81 | 13.3%) have the highest median income of $59,792 per family member.
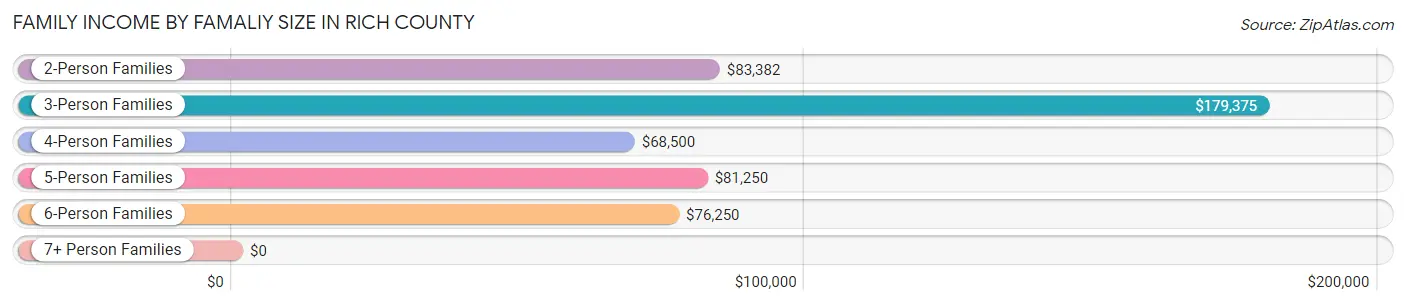
| Income Bracket | # Families | Median Income |
| 2-Person Families | 320 (52.5%) | $83,382 |
| 3-Person Families | 81 (13.3%) | $179,375 |
| 4-Person Families | 92 (15.1%) | $68,500 |
| 5-Person Families | 84 (13.8%) | $81,250 |
| 6-Person Families | 16 (2.6%) | $76,250 |
| 7+ Person Families | 17 (2.8%) | $0 |
| Total | 610 (100.0%) | $82,875 |
Family Income by Number of Earners in Rich County
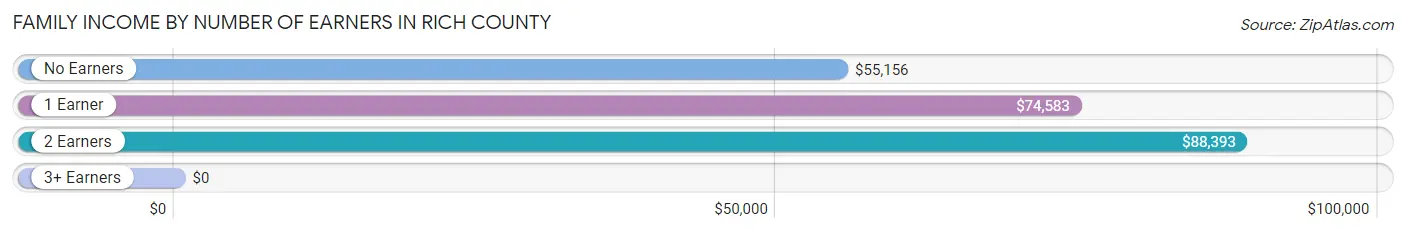
| Number of Earners | # Families | Median Income |
| No Earners | 81 (13.3%) | $55,156 |
| 1 Earner | 241 (39.5%) | $74,583 |
| 2 Earners | 241 (39.5%) | $88,393 |
| 3+ Earners | 47 (7.7%) | $0 |
| Total | 610 (100.0%) | $82,875 |
Household Income in Rich County
Household Income Brackets in Rich County
With 202 households falling in the category, the $50,000 to $74,999 income range is the most frequent in Rich County, accounting for 26.4% of all households. In contrast, only 15 households (2.0%) fall into the less than $10,000 income bracket, making it the least populous group.
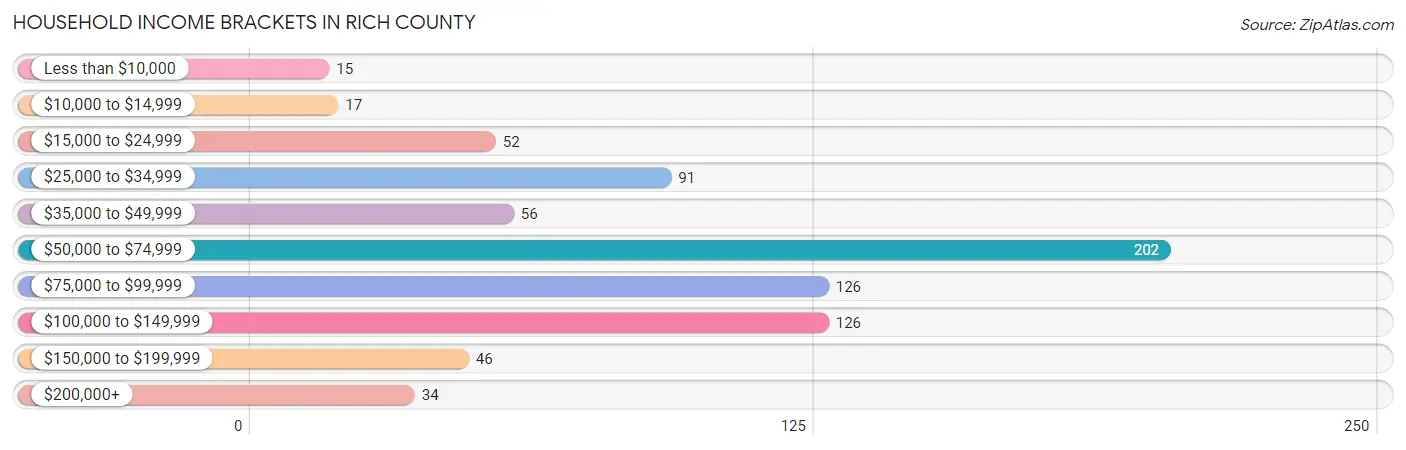
| Income Bracket | # Households | % Households |
| Less than $10,000 | 15 | 2.0% |
| $10,000 to $14,999 | 17 | 2.2% |
| $15,000 to $24,999 | 52 | 6.8% |
| $25,000 to $34,999 | 91 | 11.9% |
| $35,000 to $49,999 | 56 | 7.3% |
| $50,000 to $74,999 | 202 | 26.4% |
| $75,000 to $99,999 | 126 | 16.5% |
| $100,000 to $149,999 | 126 | 16.5% |
| $150,000 to $199,999 | 46 | 6.0% |
| $200,000+ | 34 | 4.4% |
Household Income by Householder Age in Rich County
The median household income in Rich County is $69,250, with the highest median household income of $97,500 found in the 45 to 64 years age bracket for the primary householder. A total of 244 households (31.9%) fall into this category. Meanwhile, the 15 to 24 years age bracket for the primary householder has the lowest median household income of $48,750, with 12 households (1.6%) in this group.
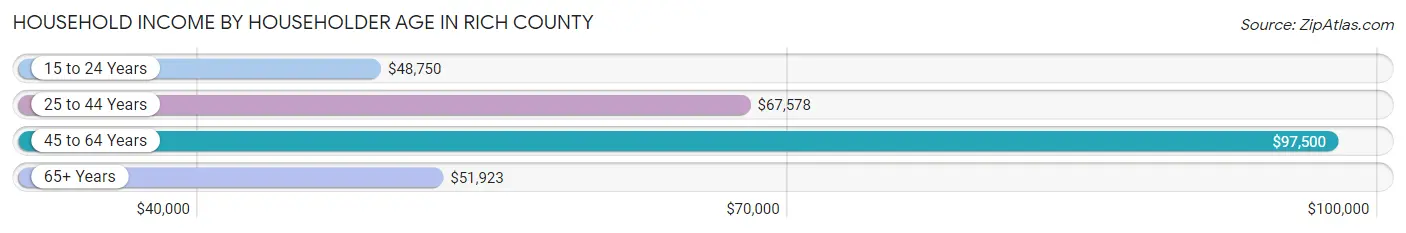
| Income Bracket | # Households | Median Income |
| 15 to 24 Years | 12 (1.6%) | $48,750 |
| 25 to 44 Years | 265 (34.6%) | $67,578 |
| 45 to 64 Years | 244 (31.9%) | $97,500 |
| 65+ Years | 244 (31.9%) | $51,923 |
| Total | 765 (100.0%) | $69,250 |
Poverty in Rich County
Income Below Poverty by Sex and Age in Rich County
With 3.8% poverty level for males and 12.3% for females among the residents of Rich County, 5 year old males and 18 to 24 year old females are the most vulnerable to poverty, with 9 males (60.0%) and 66 females (54.1%) in their respective age groups living below the poverty level.
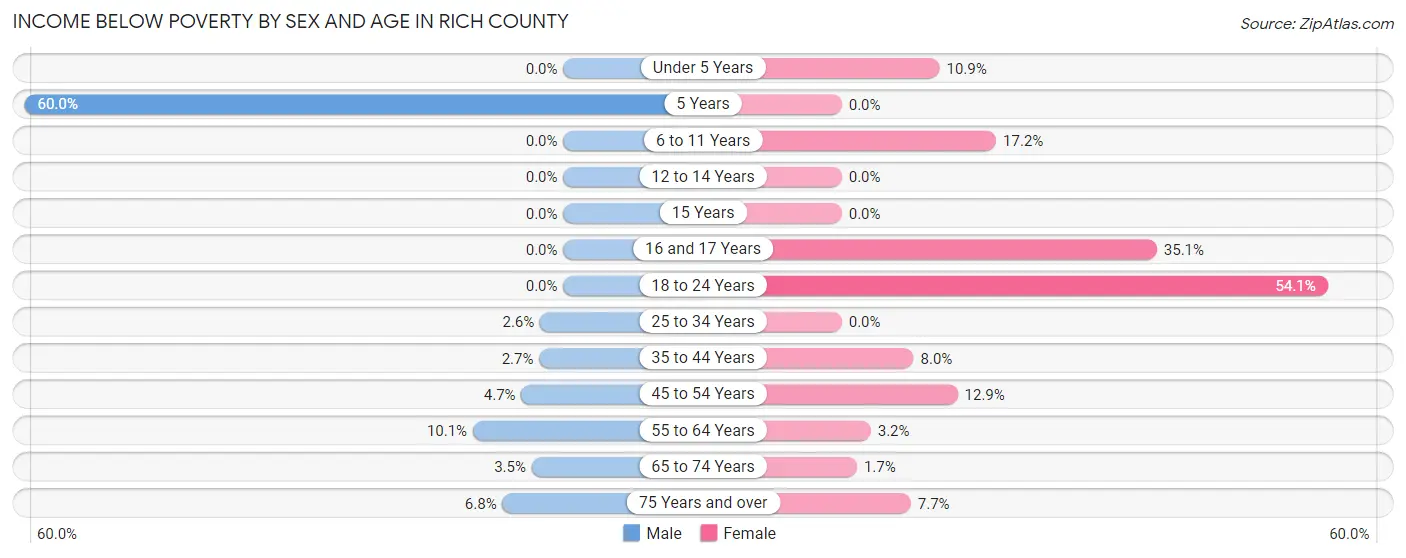
| Age Bracket | Male | Female |
| Under 5 Years | 0 (0.0%) | 11 (10.9%) |
| 5 Years | 9 (60.0%) | 0 (0.0%) |
| 6 to 11 Years | 0 (0.0%) | 22 (17.2%) |
| 12 to 14 Years | 0 (0.0%) | 0 (0.0%) |
| 15 Years | 0 (0.0%) | 0 (0.0%) |
| 16 and 17 Years | 0 (0.0%) | 20 (35.1%) |
| 18 to 24 Years | 0 (0.0%) | 66 (54.1%) |
| 25 to 34 Years | 3 (2.6%) | 0 (0.0%) |
| 35 to 44 Years | 3 (2.7%) | 12 (8.0%) |
| 45 to 54 Years | 5 (4.7%) | 12 (12.9%) |
| 55 to 64 Years | 15 (10.1%) | 5 (3.2%) |
| 65 to 74 Years | 6 (3.5%) | 2 (1.7%) |
| 75 Years and over | 8 (6.8%) | 4 (7.7%) |
| Total | 49 (3.8%) | 154 (12.3%) |
Income Above Poverty by Sex and Age in Rich County
According to the poverty statistics in Rich County, males aged under 5 years and females aged 12 to 14 years are the age groups that are most secure financially, with 100.0% of males and 100.0% of females in these age groups living above the poverty line.
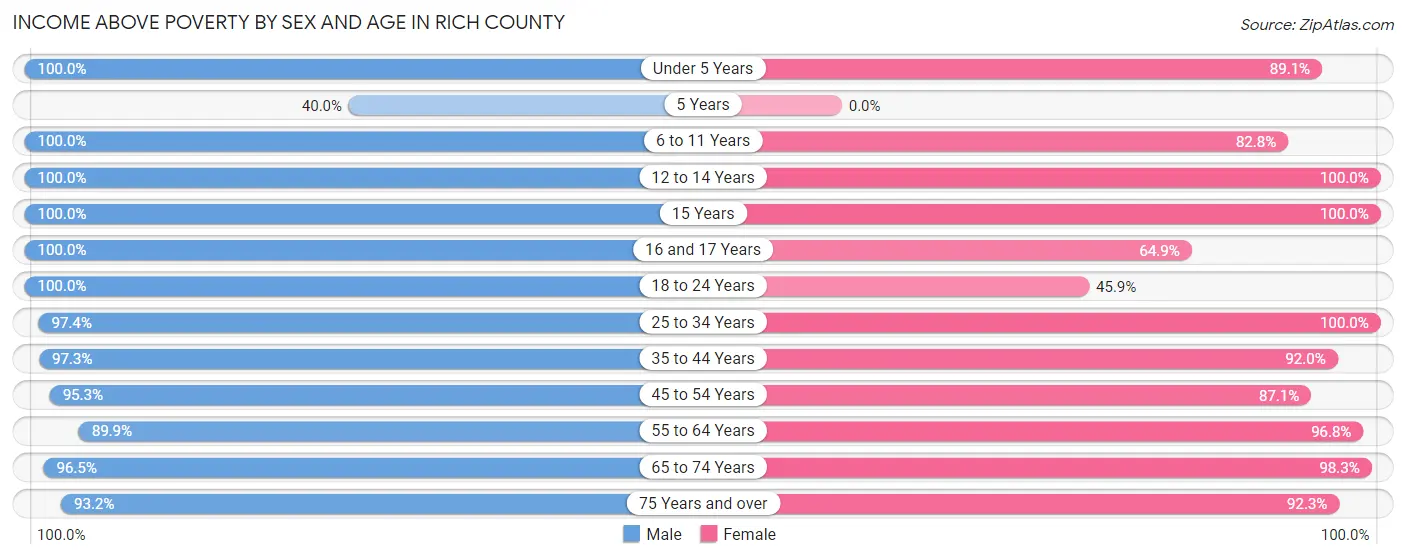
| Age Bracket | Male | Female |
| Under 5 Years | 119 (100.0%) | 90 (89.1%) |
| 5 Years | 6 (40.0%) | 0 (0.0%) |
| 6 to 11 Years | 199 (100.0%) | 106 (82.8%) |
| 12 to 14 Years | 49 (100.0%) | 59 (100.0%) |
| 15 Years | 27 (100.0%) | 37 (100.0%) |
| 16 and 17 Years | 27 (100.0%) | 37 (64.9%) |
| 18 to 24 Years | 70 (100.0%) | 56 (45.9%) |
| 25 to 34 Years | 113 (97.4%) | 184 (100.0%) |
| 35 to 44 Years | 109 (97.3%) | 138 (92.0%) |
| 45 to 54 Years | 102 (95.3%) | 81 (87.1%) |
| 55 to 64 Years | 134 (89.9%) | 150 (96.8%) |
| 65 to 74 Years | 165 (96.5%) | 116 (98.3%) |
| 75 Years and over | 110 (93.2%) | 48 (92.3%) |
| Total | 1,230 (96.2%) | 1,102 (87.7%) |
Income Below Poverty Among Married-Couple Families in Rich County
The poverty statistics for married-couple families in Rich County show that 4.1% or 22 of the total 537 families live below the poverty line. Families with 1 or 2 children have the highest poverty rate of 9.2%, comprising of 12 families. On the other hand, families with 3 or 4 children have the lowest poverty rate of 0.0%, which includes 0 families.
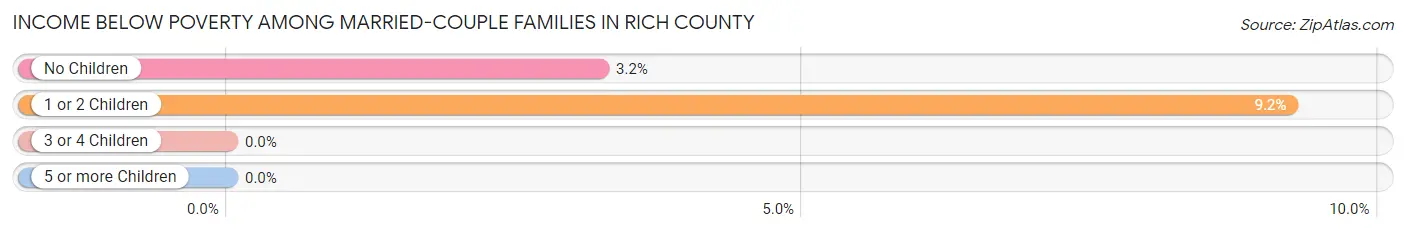
| Children | Above Poverty | Below Poverty |
| No Children | 300 (96.8%) | 10 (3.2%) |
| 1 or 2 Children | 118 (90.8%) | 12 (9.2%) |
| 3 or 4 Children | 89 (100.0%) | 0 (0.0%) |
| 5 or more Children | 8 (100.0%) | 0 (0.0%) |
| Total | 515 (95.9%) | 22 (4.1%) |
Income Below Poverty Among Single-Parent Households in Rich County
According to the poverty data in Rich County, 20.0% or 3 single-father households and 20.7% or 12 single-mother households are living below the poverty line. Among single-father households, those with 1 or 2 children have the highest poverty rate, with 3 households (100.0%) experiencing poverty. Likewise, among single-mother households, those with 3 or 4 children have the highest poverty rate, with 12 households (70.6%) falling below the poverty line.
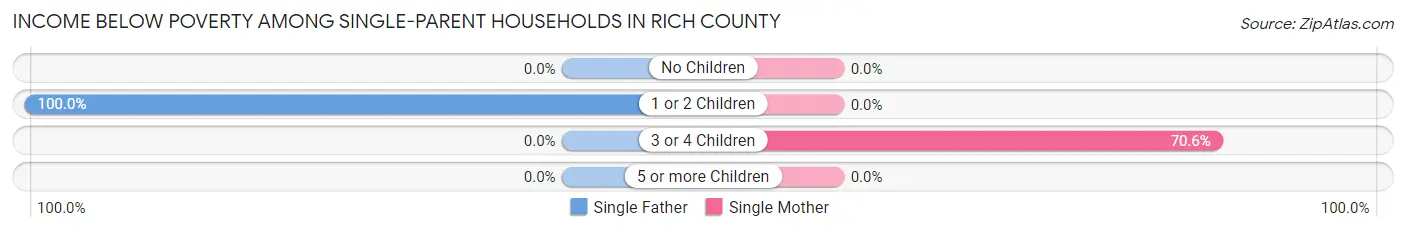
| Children | Single Father | Single Mother |
| No Children | 0 (0.0%) | 0 (0.0%) |
| 1 or 2 Children | 3 (100.0%) | 0 (0.0%) |
| 3 or 4 Children | 0 (0.0%) | 12 (70.6%) |
| 5 or more Children | 0 (0.0%) | 0 (0.0%) |
| Total | 3 (20.0%) | 12 (20.7%) |
Income Below Poverty Among Married-Couple vs Single-Parent Households in Rich County
The poverty data for Rich County shows that 22 of the married-couple family households (4.1%) and 15 of the single-parent households (20.5%) are living below the poverty level. Within the married-couple family households, those with 1 or 2 children have the highest poverty rate, with 12 households (9.2%) falling below the poverty line. Among the single-parent households, those with 3 or 4 children have the highest poverty rate, with 12 household (70.6%) living below poverty.
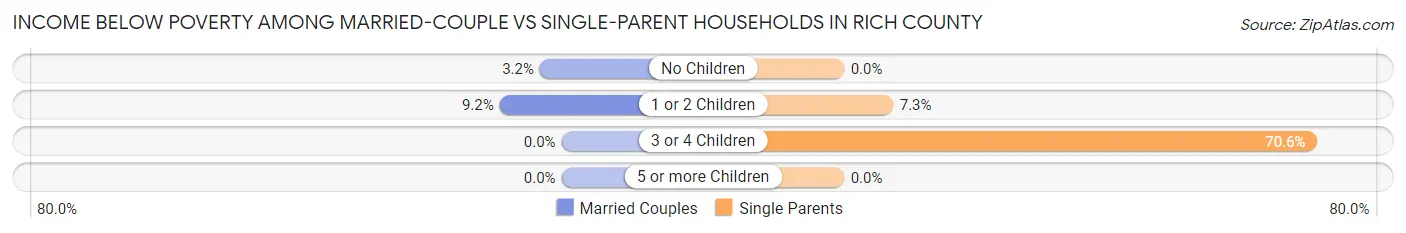
| Children | Married-Couple Families | Single-Parent Households |
| No Children | 10 (3.2%) | 0 (0.0%) |
| 1 or 2 Children | 12 (9.2%) | 3 (7.3%) |
| 3 or 4 Children | 0 (0.0%) | 12 (70.6%) |
| 5 or more Children | 0 (0.0%) | 0 (0.0%) |
| Total | 22 (4.1%) | 15 (20.5%) |
Employment Characteristics in Rich County
Employment by Class of Employer in Rich County
Among the 976 employed individuals in Rich County, private company employees (614 | 62.9%), local government employees (112 | 11.5%), and self-employed (incorporated) (101 | 10.3%) make up the most common classes of employment.
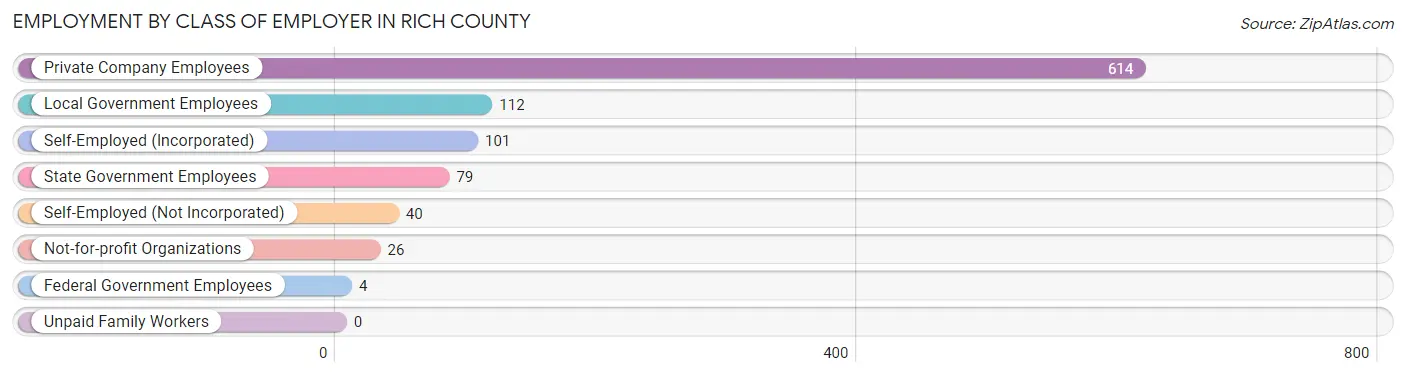
| Employer Class | # Employees | % Employees |
| Private Company Employees | 614 | 62.9% |
| Self-Employed (Incorporated) | 101 | 10.3% |
| Self-Employed (Not Incorporated) | 40 | 4.1% |
| Not-for-profit Organizations | 26 | 2.7% |
| Local Government Employees | 112 | 11.5% |
| State Government Employees | 79 | 8.1% |
| Federal Government Employees | 4 | 0.4% |
| Unpaid Family Workers | 0 | 0.0% |
| Total | 976 | 100.0% |
Employment Status by Age in Rich County
According to the labor force statistics for Rich County, out of the total population over 16 years of age (1,809), 55.7% or 1,008 individuals are in the labor force, with 2.6% or 26 of them unemployed. The age group with the highest labor force participation rate is 25 to 29 years, with 94.0% or 109 individuals in the labor force. Within the labor force, the 65 to 74 years age range has the highest percentage of unemployed individuals, with 15.6% or 19 of them being unemployed.
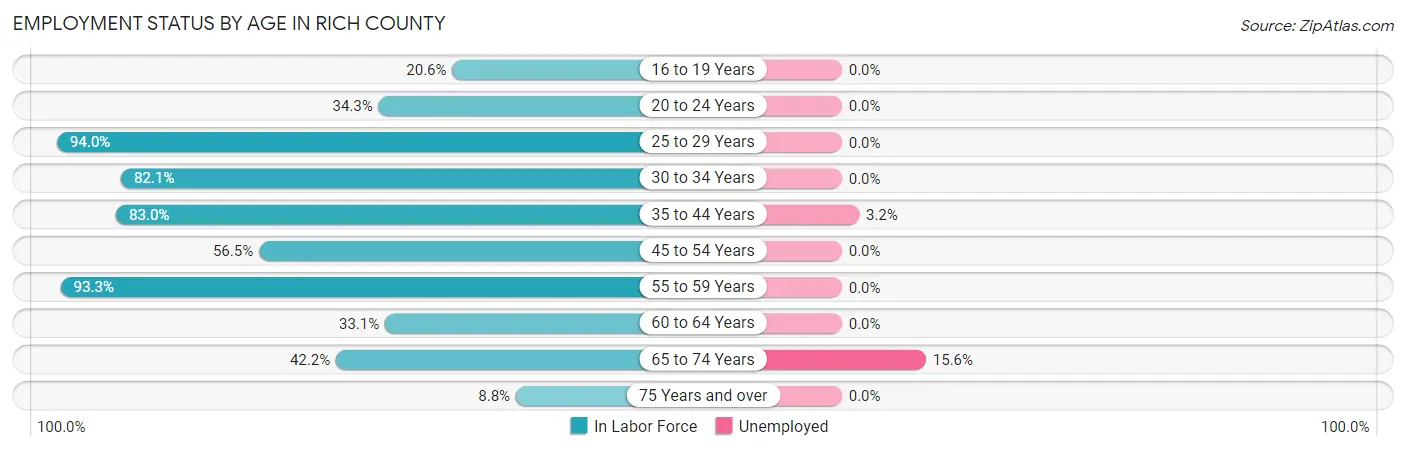
| Age Bracket | In Labor Force | Unemployed |
| 16 to 19 Years | 29 (20.6%) | 0 (0.0%) |
| 20 to 24 Years | 48 (34.3%) | 0 (0.0%) |
| 25 to 29 Years | 109 (94.0%) | 0 (0.0%) |
| 30 to 34 Years | 151 (82.1%) | 0 (0.0%) |
| 35 to 44 Years | 220 (83.0%) | 7 (3.2%) |
| 45 to 54 Years | 113 (56.5%) | 0 (0.0%) |
| 55 to 59 Years | 154 (93.3%) | 0 (0.0%) |
| 60 to 64 Years | 46 (33.1%) | 0 (0.0%) |
| 65 to 74 Years | 122 (42.2%) | 19 (15.6%) |
| 75 Years and over | 15 (8.8%) | 0 (0.0%) |
| Total | 1,008 (55.7%) | 26 (2.6%) |
Employment Status by Educational Attainment in Rich County
According to labor force statistics for Rich County, 74.2% of individuals (793) out of the total population between 25 and 64 years of age (1,069) are in the labor force, with 0.9% or 7 of them being unemployed. The group with the highest labor force participation rate are those with the educational attainment of bachelor's degree or higher, with 82.1% or 183 individuals in the labor force. Within the labor force, individuals with college / associate degree education have the highest percentage of unemployment, with 1.7% or 7 of them being unemployed.
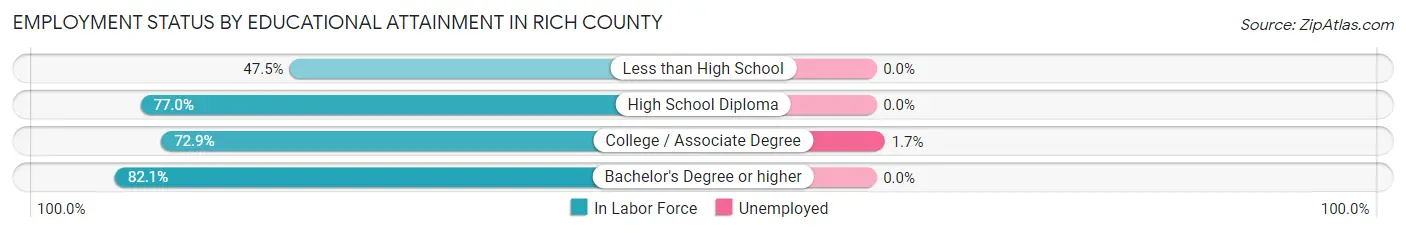
| Educational Attainment | In Labor Force | Unemployed |
| Less than High School | 29 (47.5%) | 0 (0.0%) |
| High School Diploma | 164 (77.0%) | 0 (0.0%) |
| College / Associate Degree | 417 (72.9%) | 10 (1.7%) |
| Bachelor's Degree or higher | 183 (82.1%) | 0 (0.0%) |
| Total | 793 (74.2%) | 10 (0.9%) |
Employment Occupations by Sex in Rich County
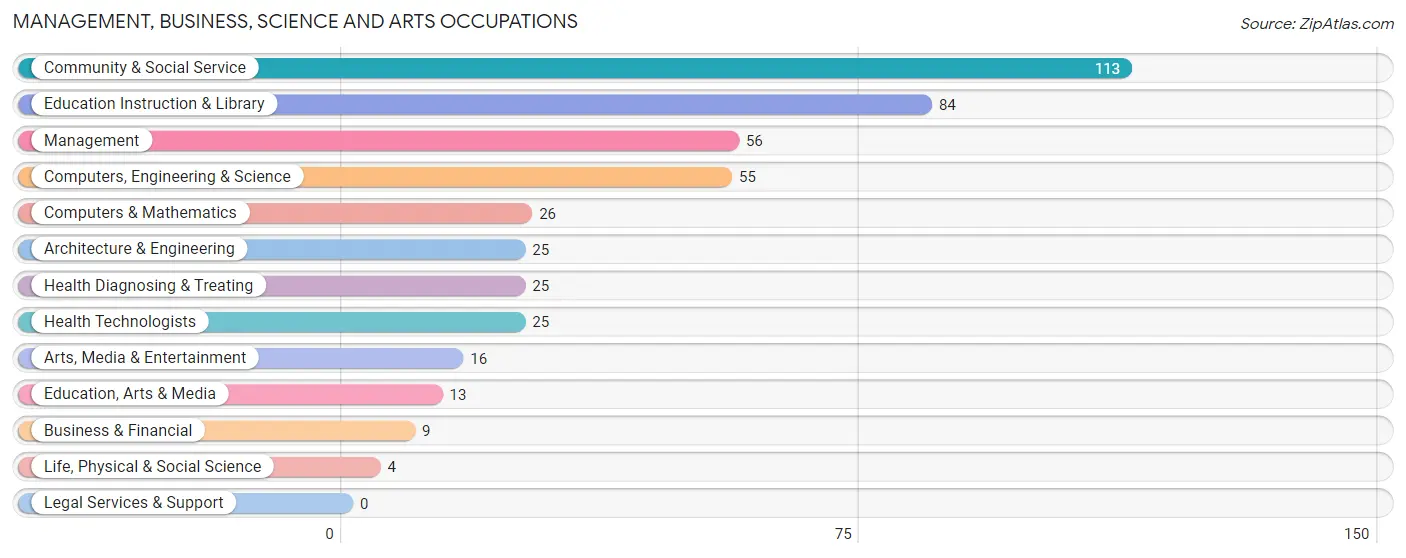
Management, Business, Science and Arts Occupations
The most common Management, Business, Science and Arts occupations in Rich County are Community & Social Service (113 | 11.5%), Education Instruction & Library (84 | 8.6%), Management (56 | 5.7%), Computers, Engineering & Science (55 | 5.6%), and Computers & Mathematics (26 | 2.6%).
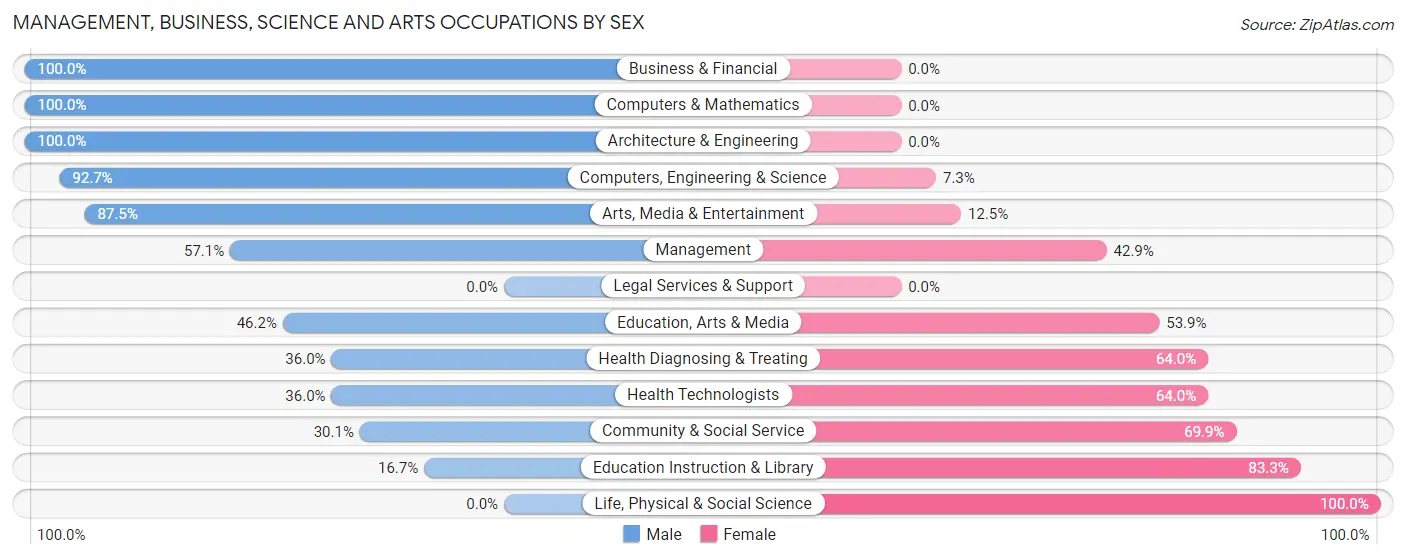
Management, Business, Science and Arts Occupations by Sex
Within the Management, Business, Science and Arts occupations in Rich County, the most male-oriented occupations are Business & Financial (100.0%), Computers & Mathematics (100.0%), and Architecture & Engineering (100.0%), while the most female-oriented occupations are Life, Physical & Social Science (100.0%), Education Instruction & Library (83.3%), and Community & Social Service (69.9%).
| Occupation | Male | Female |
| Management | 32 (57.1%) | 24 (42.9%) |
| Business & Financial | 9 (100.0%) | 0 (0.0%) |
| Computers, Engineering & Science | 51 (92.7%) | 4 (7.3%) |
| Computers & Mathematics | 26 (100.0%) | 0 (0.0%) |
| Architecture & Engineering | 25 (100.0%) | 0 (0.0%) |
| Life, Physical & Social Science | 0 (0.0%) | 4 (100.0%) |
| Community & Social Service | 34 (30.1%) | 79 (69.9%) |
| Education, Arts & Media | 6 (46.2%) | 7 (53.8%) |
| Legal Services & Support | 0 (0.0%) | 0 (0.0%) |
| Education Instruction & Library | 14 (16.7%) | 70 (83.3%) |
| Arts, Media & Entertainment | 14 (87.5%) | 2 (12.5%) |
| Health Diagnosing & Treating | 9 (36.0%) | 16 (64.0%) |
| Health Technologists | 9 (36.0%) | 16 (64.0%) |
| Total (Category) | 135 (52.3%) | 123 (47.7%) |
| Total (Overall) | 526 (53.6%) | 455 (46.4%) |
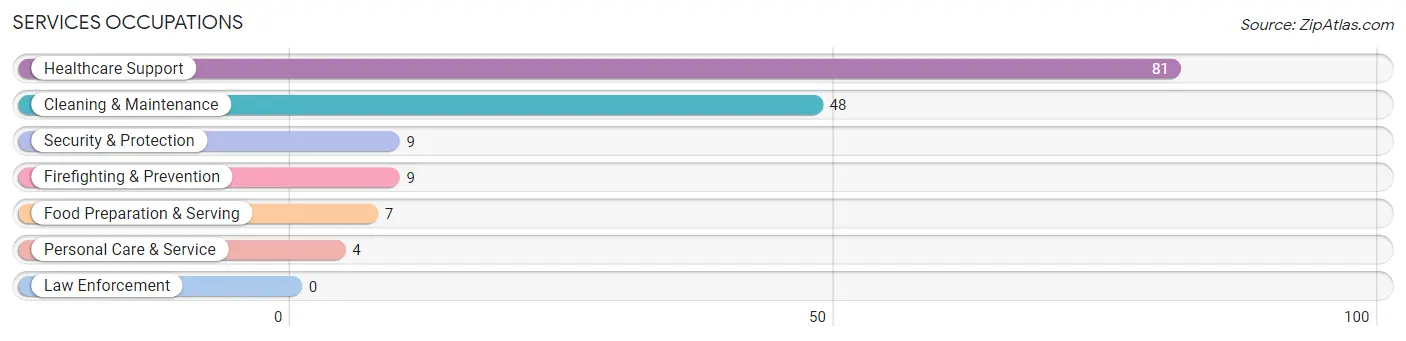
Services Occupations
The most common Services occupations in Rich County are Healthcare Support (81 | 8.3%), Cleaning & Maintenance (48 | 4.9%), Security & Protection (9 | 0.9%), Firefighting & Prevention (9 | 0.9%), and Food Preparation & Serving (7 | 0.7%).
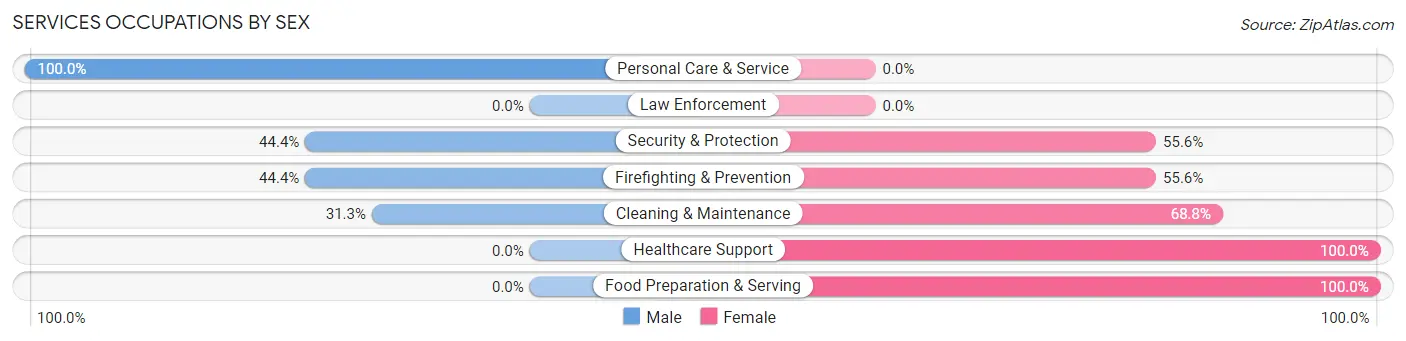
Services Occupations by Sex
Within the Services occupations in Rich County, the most male-oriented occupations are Personal Care & Service (100.0%), Security & Protection (44.4%), and Firefighting & Prevention (44.4%), while the most female-oriented occupations are Healthcare Support (100.0%), Food Preparation & Serving (100.0%), and Cleaning & Maintenance (68.8%).
| Occupation | Male | Female |
| Healthcare Support | 0 (0.0%) | 81 (100.0%) |
| Security & Protection | 4 (44.4%) | 5 (55.6%) |
| Firefighting & Prevention | 4 (44.4%) | 5 (55.6%) |
| Law Enforcement | 0 (0.0%) | 0 (0.0%) |
| Food Preparation & Serving | 0 (0.0%) | 7 (100.0%) |
| Cleaning & Maintenance | 15 (31.2%) | 33 (68.8%) |
| Personal Care & Service | 4 (100.0%) | 0 (0.0%) |
| Total (Category) | 23 (15.4%) | 126 (84.6%) |
| Total (Overall) | 526 (53.6%) | 455 (46.4%) |
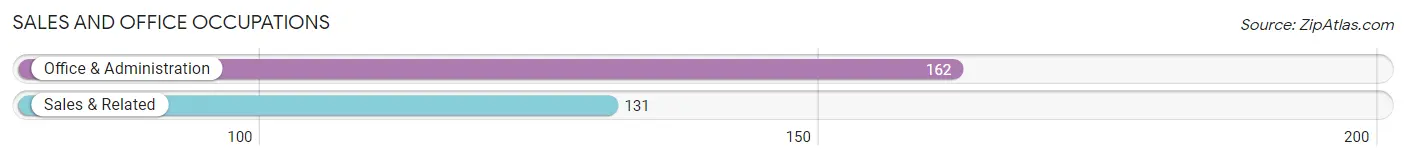
Sales and Office Occupations
The most common Sales and Office occupations in Rich County are Office & Administration (162 | 16.5%), and Sales & Related (131 | 13.4%).
Sales and Office Occupations by Sex
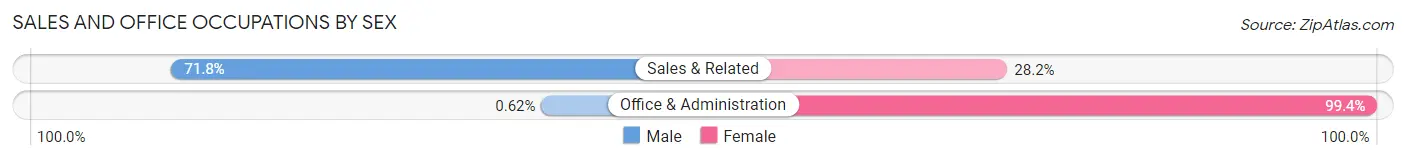
| Occupation | Male | Female |
| Sales & Related | 94 (71.8%) | 37 (28.2%) |
| Office & Administration | 1 (0.6%) | 161 (99.4%) |
| Total (Category) | 95 (32.4%) | 198 (67.6%) |
| Total (Overall) | 526 (53.6%) | 455 (46.4%) |
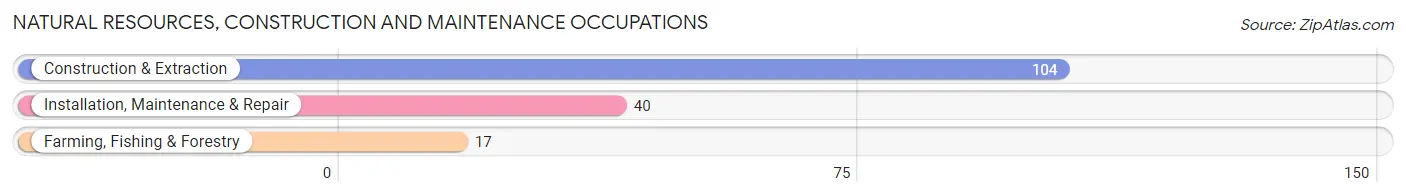
Natural Resources, Construction and Maintenance Occupations
The most common Natural Resources, Construction and Maintenance occupations in Rich County are Construction & Extraction (104 | 10.6%), Installation, Maintenance & Repair (40 | 4.1%), and Farming, Fishing & Forestry (17 | 1.7%).
Natural Resources, Construction and Maintenance Occupations by Sex
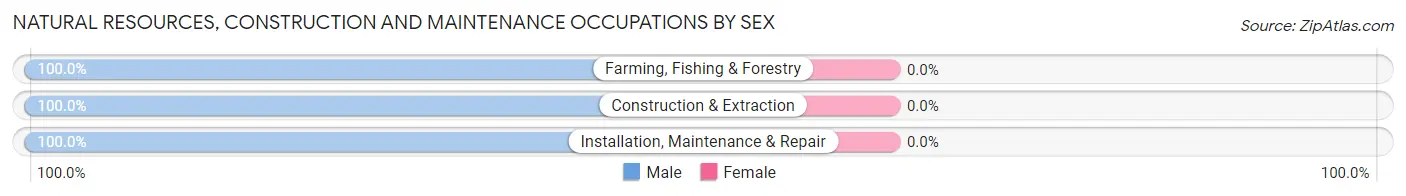
| Occupation | Male | Female |
| Farming, Fishing & Forestry | 17 (100.0%) | 0 (0.0%) |
| Construction & Extraction | 104 (100.0%) | 0 (0.0%) |
| Installation, Maintenance & Repair | 40 (100.0%) | 0 (0.0%) |
| Total (Category) | 161 (100.0%) | 0 (0.0%) |
| Total (Overall) | 526 (53.6%) | 455 (46.4%) |
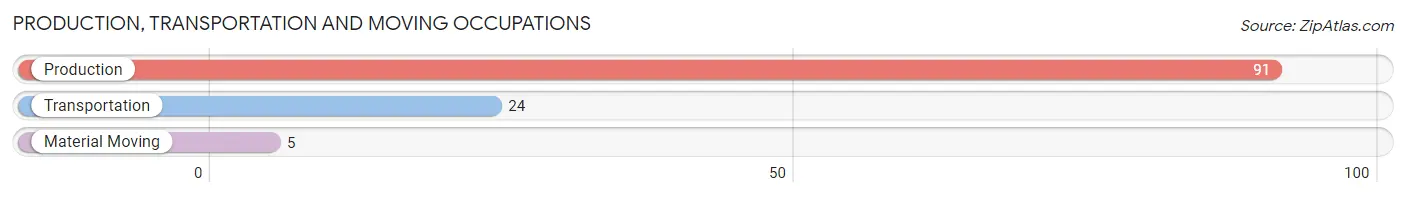
Production, Transportation and Moving Occupations
The most common Production, Transportation and Moving occupations in Rich County are Production (91 | 9.3%), Transportation (24 | 2.5%), and Material Moving (5 | 0.5%).
Production, Transportation and Moving Occupations by Sex
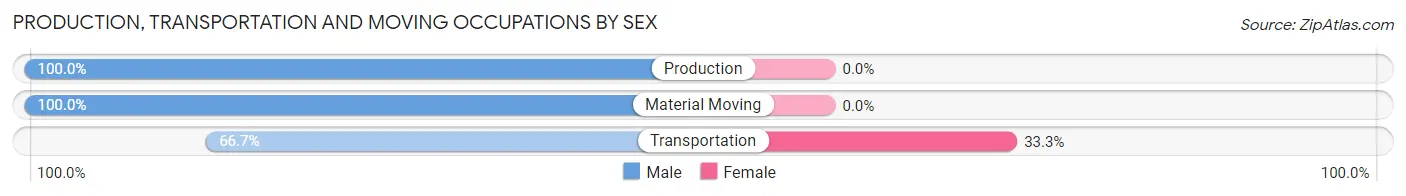
| Occupation | Male | Female |
| Production | 91 (100.0%) | 0 (0.0%) |
| Transportation | 16 (66.7%) | 8 (33.3%) |
| Material Moving | 5 (100.0%) | 0 (0.0%) |
| Total (Category) | 112 (93.3%) | 8 (6.7%) |
| Total (Overall) | 526 (53.6%) | 455 (46.4%) |
Employment Industries by Sex in Rich County
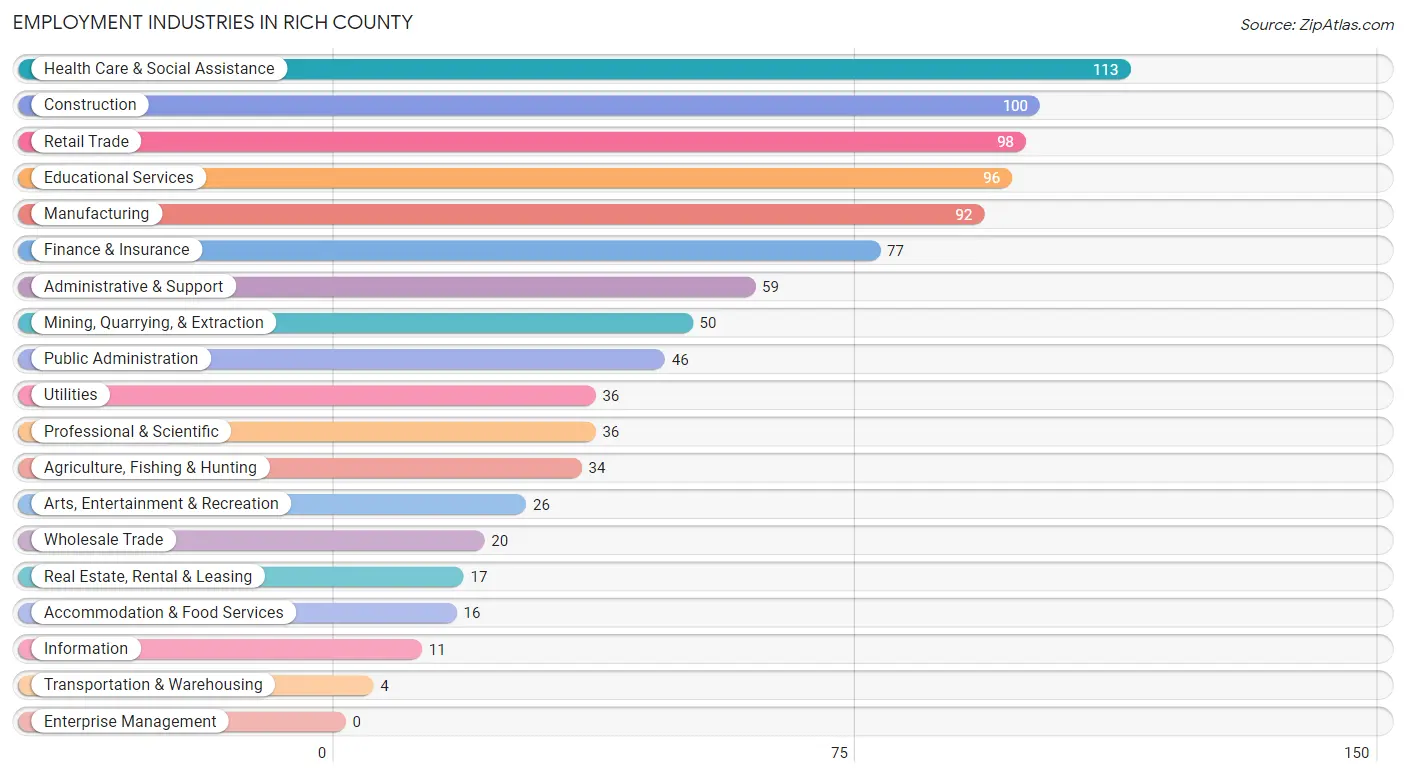
Employment Industries in Rich County
The major employment industries in Rich County include Health Care & Social Assistance (113 | 11.5%), Construction (100 | 10.2%), Retail Trade (98 | 10.0%), Educational Services (96 | 9.8%), and Manufacturing (92 | 9.4%).
Employment Industries by Sex in Rich County
The Rich County industries that see more men than women are Mining, Quarrying, & Extraction (100.0%), Transportation & Warehousing (100.0%), and Arts, Entertainment & Recreation (96.2%), whereas the industries that tend to have a higher number of women are Information (100.0%), Health Care & Social Assistance (88.5%), and Accommodation & Food Services (87.5%).
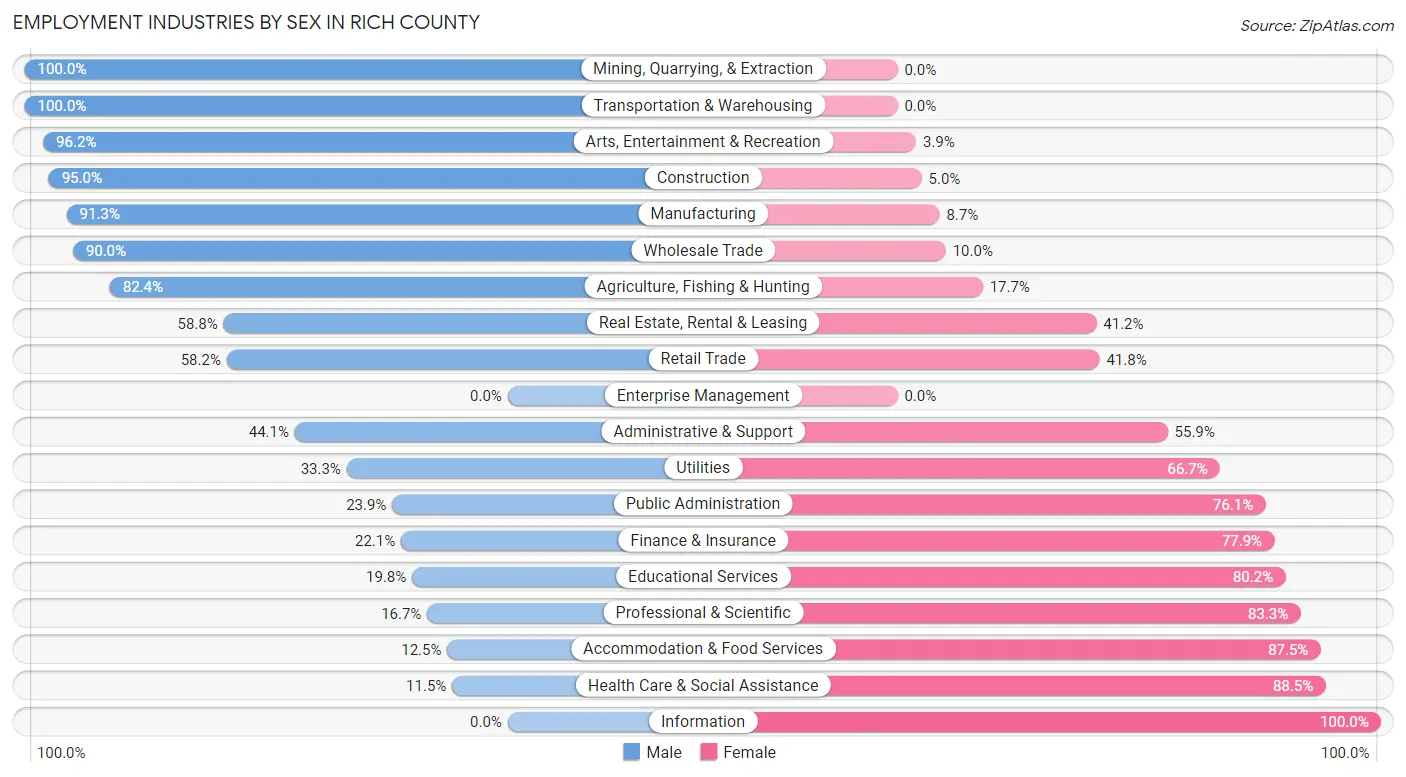
| Industry | Male | Female |
| Agriculture, Fishing & Hunting | 28 (82.4%) | 6 (17.6%) |
| Mining, Quarrying, & Extraction | 50 (100.0%) | 0 (0.0%) |
| Construction | 95 (95.0%) | 5 (5.0%) |
| Manufacturing | 84 (91.3%) | 8 (8.7%) |
| Wholesale Trade | 18 (90.0%) | 2 (10.0%) |
| Retail Trade | 57 (58.2%) | 41 (41.8%) |
| Transportation & Warehousing | 4 (100.0%) | 0 (0.0%) |
| Utilities | 12 (33.3%) | 24 (66.7%) |
| Information | 0 (0.0%) | 11 (100.0%) |
| Finance & Insurance | 17 (22.1%) | 60 (77.9%) |
| Real Estate, Rental & Leasing | 10 (58.8%) | 7 (41.2%) |
| Professional & Scientific | 6 (16.7%) | 30 (83.3%) |
| Enterprise Management | 0 (0.0%) | 0 (0.0%) |
| Administrative & Support | 26 (44.1%) | 33 (55.9%) |
| Educational Services | 19 (19.8%) | 77 (80.2%) |
| Health Care & Social Assistance | 13 (11.5%) | 100 (88.5%) |
| Arts, Entertainment & Recreation | 25 (96.2%) | 1 (3.8%) |
| Accommodation & Food Services | 2 (12.5%) | 14 (87.5%) |
| Public Administration | 11 (23.9%) | 35 (76.1%) |
| Total | 526 (53.6%) | 455 (46.4%) |
Education in Rich County
School Enrollment in Rich County
The most common levels of schooling among the 695 students in Rich County are elementary school (206 | 29.6%), high school (178 | 25.6%), and middle school (156 | 22.5%).
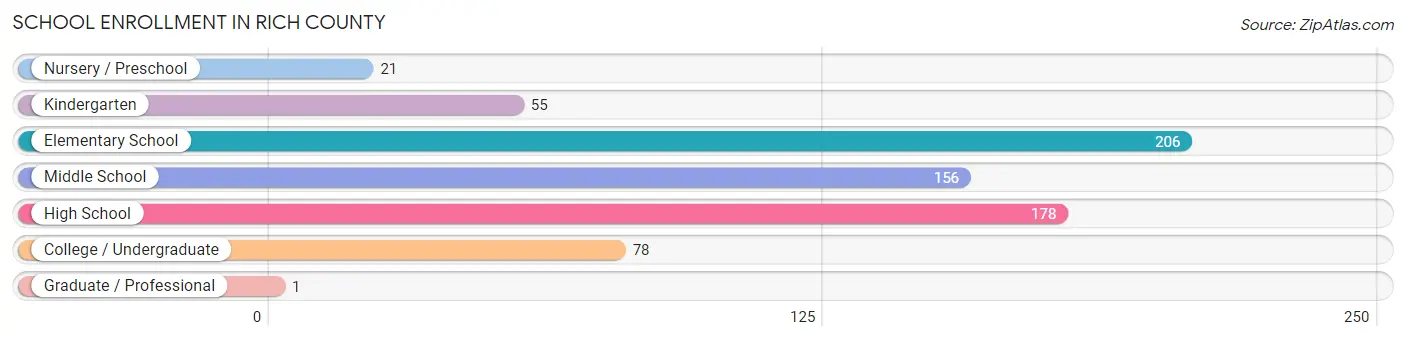
| School Level | # Students | % Students |
| Nursery / Preschool | 21 | 3.0% |
| Kindergarten | 55 | 7.9% |
| Elementary School | 206 | 29.6% |
| Middle School | 156 | 22.5% |
| High School | 178 | 25.6% |
| College / Undergraduate | 78 | 11.2% |
| Graduate / Professional | 1 | 0.1% |
| Total | 695 | 100.0% |
School Enrollment by Age by Funding Source in Rich County
Out of a total of 695 students who are enrolled in schools in Rich County, 42 (6.0%) attend a private institution, while the remaining 653 (94.0%) are enrolled in public schools. The age group of 3 to 4 year olds has the highest likelihood of being enrolled in private schools, with 11 (52.4% in the age bracket) enrolled. Conversely, the age group of 15 to 17 year olds has the lowest likelihood of being enrolled in a private school, with 136 (100.0% in the age bracket) attending a public institution.
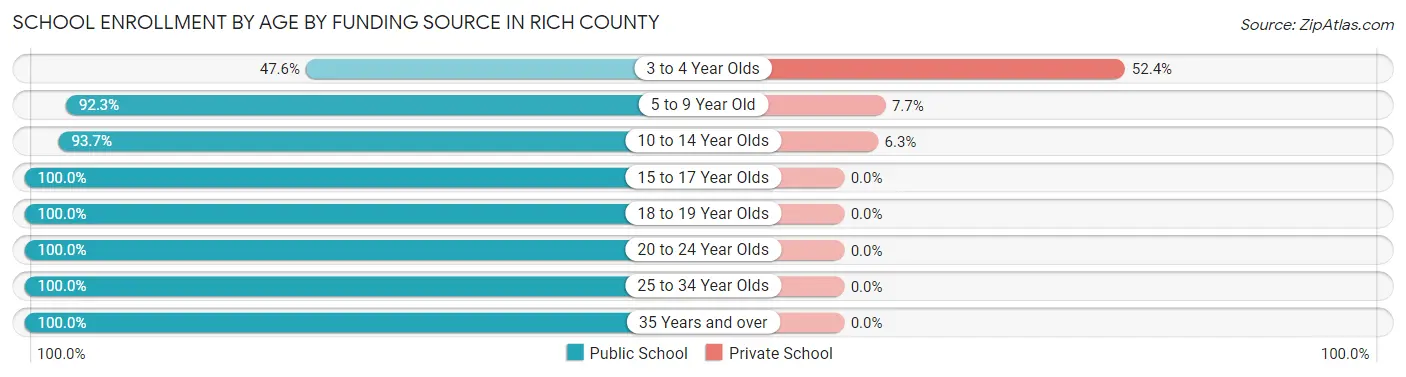
| Age Bracket | Public School | Private School |
| 3 to 4 Year Olds | 10 (47.6%) | 11 (52.4%) |
| 5 to 9 Year Old | 240 (92.3%) | 20 (7.7%) |
| 10 to 14 Year Olds | 163 (93.7%) | 11 (6.3%) |
| 15 to 17 Year Olds | 136 (100.0%) | 0 (0.0%) |
| 18 to 19 Year Olds | 30 (100.0%) | 0 (0.0%) |
| 20 to 24 Year Olds | 9 (100.0%) | 0 (0.0%) |
| 25 to 34 Year Olds | 36 (100.0%) | 0 (0.0%) |
| 35 Years and over | 29 (100.0%) | 0 (0.0%) |
| Total | 653 (94.0%) | 42 (6.0%) |
Educational Attainment by Field of Study in Rich County
Business (74 | 17.5%), education (73 | 17.3%), science & technology (67 | 15.8%), bio, nature & agricultural (43 | 10.2%), and physical & health sciences (41 | 9.7%) are the most common fields of study among 423 individuals in Rich County who have obtained a bachelor's degree or higher.
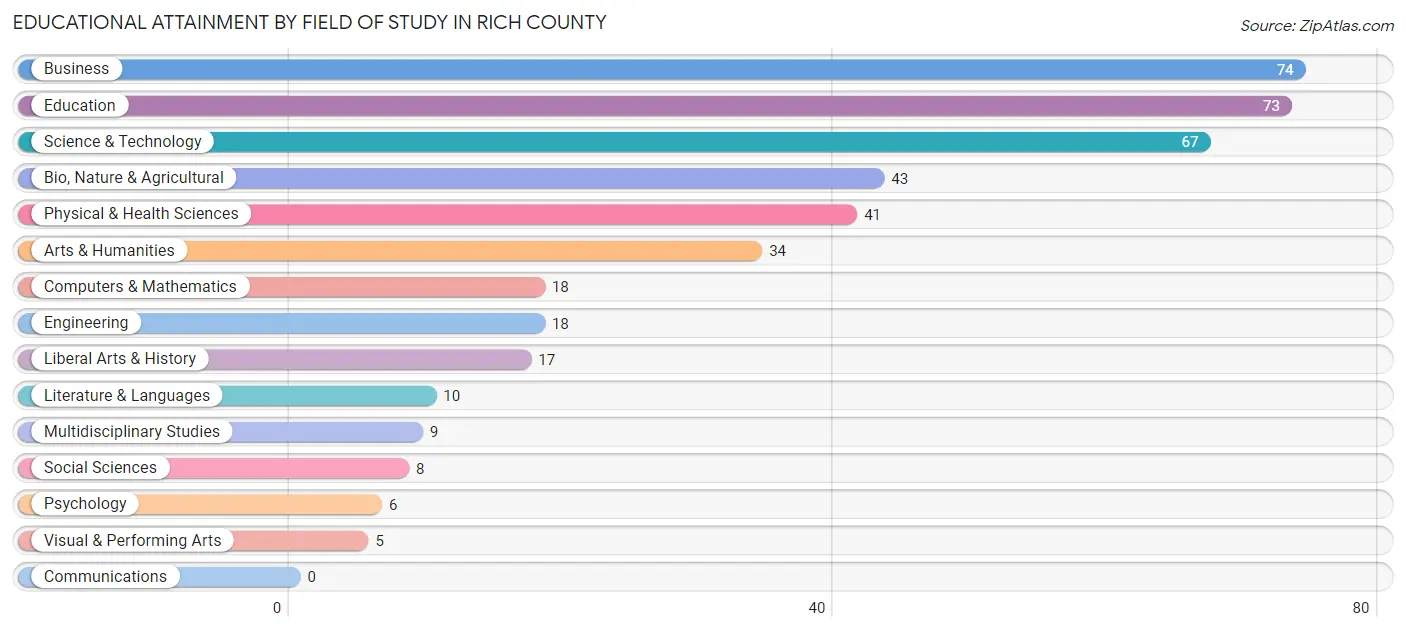
| Field of Study | # Graduates | % Graduates |
| Computers & Mathematics | 18 | 4.3% |
| Bio, Nature & Agricultural | 43 | 10.2% |
| Physical & Health Sciences | 41 | 9.7% |
| Psychology | 6 | 1.4% |
| Social Sciences | 8 | 1.9% |
| Engineering | 18 | 4.3% |
| Multidisciplinary Studies | 9 | 2.1% |
| Science & Technology | 67 | 15.8% |
| Business | 74 | 17.5% |
| Education | 73 | 17.3% |
| Literature & Languages | 10 | 2.4% |
| Liberal Arts & History | 17 | 4.0% |
| Visual & Performing Arts | 5 | 1.2% |
| Communications | 0 | 0.0% |
| Arts & Humanities | 34 | 8.0% |
| Total | 423 | 100.0% |
Transportation & Commute in Rich County
Vehicle Availability by Sex in Rich County
The most prevalent vehicle ownership categories in Rich County are males with 3 vehicles (192, accounting for 36.8%) and females with 3 vehicles (123, making up 42.5%).
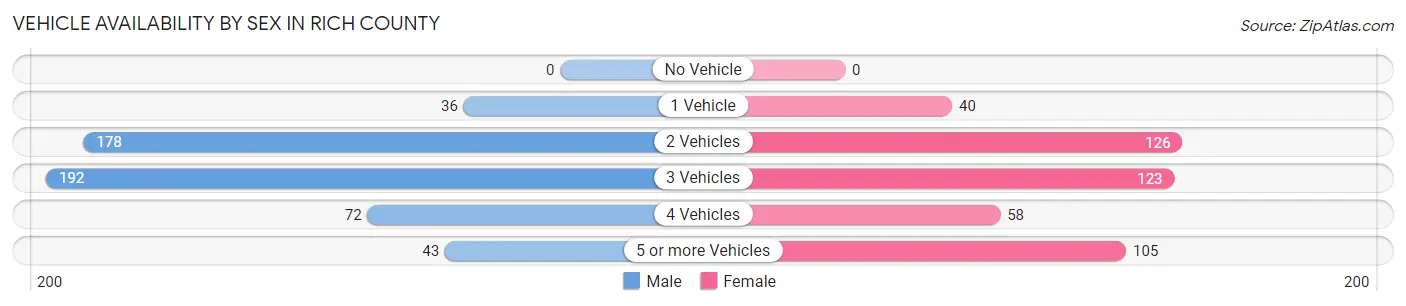
| Vehicles Available | Male | Female |
| No Vehicle | 0 (0.0%) | 0 (0.0%) |
| 1 Vehicle | 36 (6.9%) | 40 (8.8%) |
| 2 Vehicles | 178 (34.2%) | 126 (27.9%) |
| 3 Vehicles | 192 (36.8%) | 123 (27.2%) |
| 4 Vehicles | 72 (13.8%) | 58 (12.8%) |
| 5 or more Vehicles | 43 (8.3%) | 105 (23.2%) |
| Total | 521 (100.0%) | 452 (100.0%) |
Commute Time in Rich County
The most frequently occuring commute durations in Rich County are less than 5 minutes (132 commuters, 15.8%), 30 to 34 minutes (116 commuters, 13.8%), and 5 to 9 minutes (113 commuters, 13.5%).
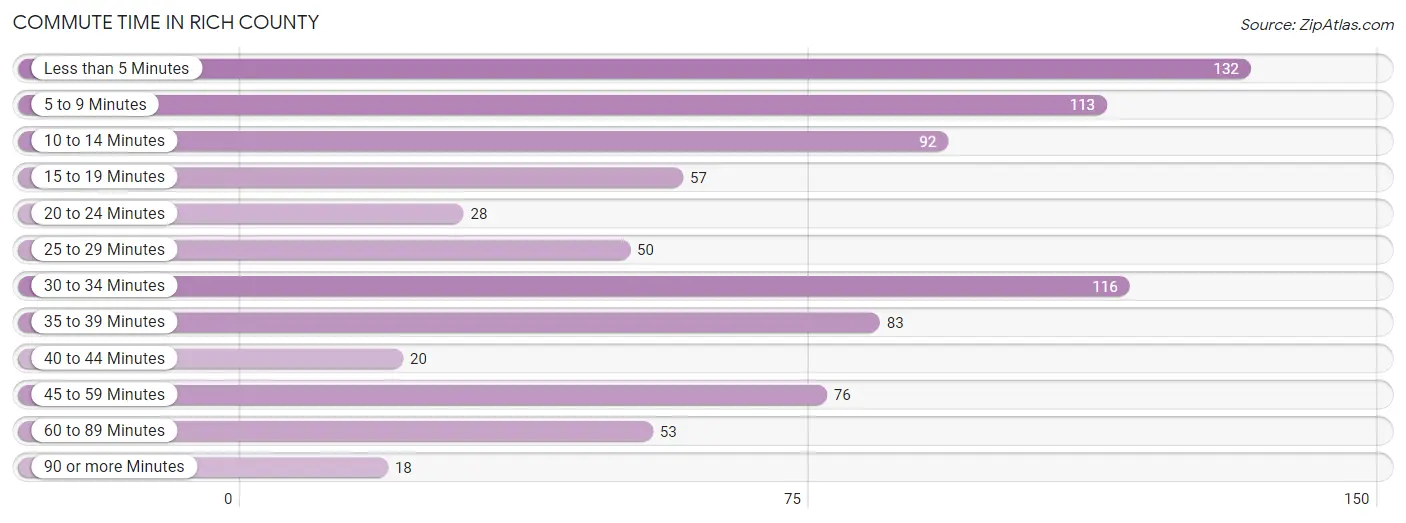
| Commute Time | # Commuters | % Commuters |
| Less than 5 Minutes | 132 | 15.8% |
| 5 to 9 Minutes | 113 | 13.5% |
| 10 to 14 Minutes | 92 | 11.0% |
| 15 to 19 Minutes | 57 | 6.8% |
| 20 to 24 Minutes | 28 | 3.3% |
| 25 to 29 Minutes | 50 | 6.0% |
| 30 to 34 Minutes | 116 | 13.8% |
| 35 to 39 Minutes | 83 | 9.9% |
| 40 to 44 Minutes | 20 | 2.4% |
| 45 to 59 Minutes | 76 | 9.1% |
| 60 to 89 Minutes | 53 | 6.3% |
| 90 or more Minutes | 18 | 2.1% |
Commute Time by Sex in Rich County
The most common commute times in Rich County are 5 to 9 minutes (78 commuters, 17.1%) for males and 35 to 39 minutes (80 commuters, 20.9%) for females.
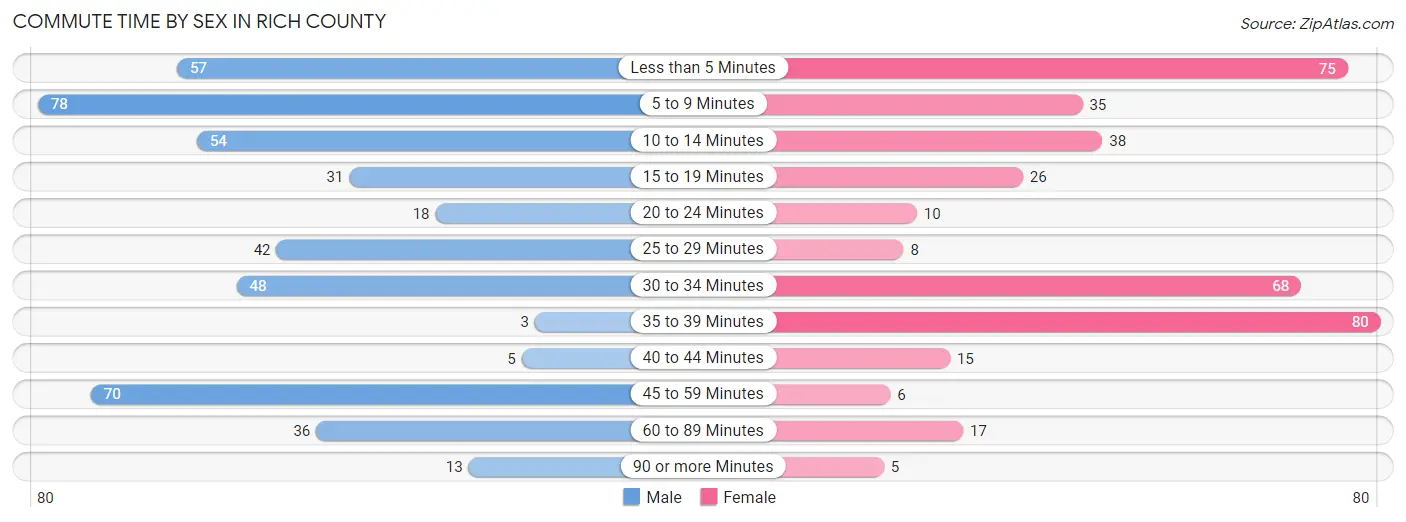
| Commute Time | Male | Female |
| Less than 5 Minutes | 57 (12.5%) | 75 (19.6%) |
| 5 to 9 Minutes | 78 (17.1%) | 35 (9.1%) |
| 10 to 14 Minutes | 54 (11.9%) | 38 (9.9%) |
| 15 to 19 Minutes | 31 (6.8%) | 26 (6.8%) |
| 20 to 24 Minutes | 18 (4.0%) | 10 (2.6%) |
| 25 to 29 Minutes | 42 (9.2%) | 8 (2.1%) |
| 30 to 34 Minutes | 48 (10.5%) | 68 (17.7%) |
| 35 to 39 Minutes | 3 (0.7%) | 80 (20.9%) |
| 40 to 44 Minutes | 5 (1.1%) | 15 (3.9%) |
| 45 to 59 Minutes | 70 (15.4%) | 6 (1.6%) |
| 60 to 89 Minutes | 36 (7.9%) | 17 (4.4%) |
| 90 or more Minutes | 13 (2.9%) | 5 (1.3%) |
Time of Departure to Work by Sex in Rich County
The most frequent times of departure to work in Rich County are 6:30 AM to 6:59 AM (81, 17.8%) for males and 7:30 AM to 7:59 AM (70, 18.3%) for females.
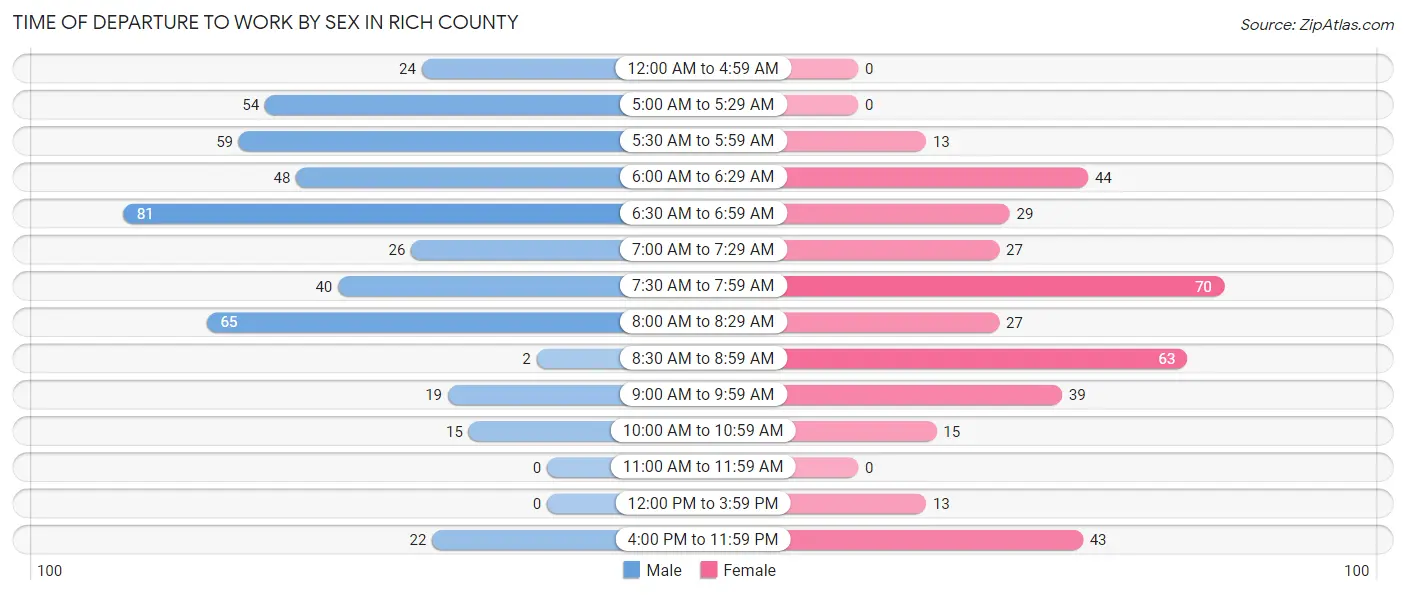
| Time of Departure | Male | Female |
| 12:00 AM to 4:59 AM | 24 (5.3%) | 0 (0.0%) |
| 5:00 AM to 5:29 AM | 54 (11.9%) | 0 (0.0%) |
| 5:30 AM to 5:59 AM | 59 (13.0%) | 13 (3.4%) |
| 6:00 AM to 6:29 AM | 48 (10.5%) | 44 (11.5%) |
| 6:30 AM to 6:59 AM | 81 (17.8%) | 29 (7.6%) |
| 7:00 AM to 7:29 AM | 26 (5.7%) | 27 (7.0%) |
| 7:30 AM to 7:59 AM | 40 (8.8%) | 70 (18.3%) |
| 8:00 AM to 8:29 AM | 65 (14.3%) | 27 (7.0%) |
| 8:30 AM to 8:59 AM | 2 (0.4%) | 63 (16.5%) |
| 9:00 AM to 9:59 AM | 19 (4.2%) | 39 (10.2%) |
| 10:00 AM to 10:59 AM | 15 (3.3%) | 15 (3.9%) |
| 11:00 AM to 11:59 AM | 0 (0.0%) | 0 (0.0%) |
| 12:00 PM to 3:59 PM | 0 (0.0%) | 13 (3.4%) |
| 4:00 PM to 11:59 PM | 22 (4.8%) | 43 (11.2%) |
| Total | 455 (100.0%) | 383 (100.0%) |
Housing Occupancy in Rich County
Occupancy by Ownership in Rich County
Of the total 765 dwellings in Rich County, owner-occupied units account for 605 (79.1%), while renter-occupied units make up 160 (20.9%).
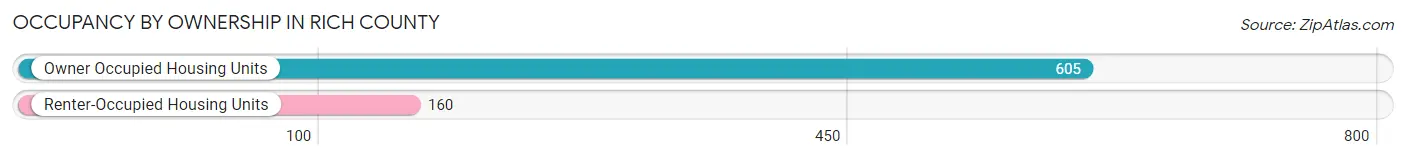
| Occupancy | # Housing Units | % Housing Units |
| Owner Occupied Housing Units | 605 | 79.1% |
| Renter-Occupied Housing Units | 160 | 20.9% |
| Total Occupied Housing Units | 765 | 100.0% |
Occupancy by Household Size in Rich County
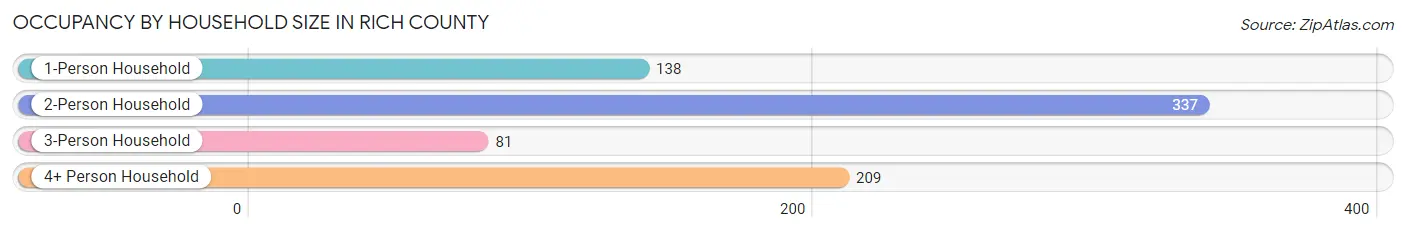
| Household Size | # Housing Units | % Housing Units |
| 1-Person Household | 138 | 18.0% |
| 2-Person Household | 337 | 44.1% |
| 3-Person Household | 81 | 10.6% |
| 4+ Person Household | 209 | 27.3% |
| Total Housing Units | 765 | 100.0% |
Occupancy by Ownership by Household Size in Rich County
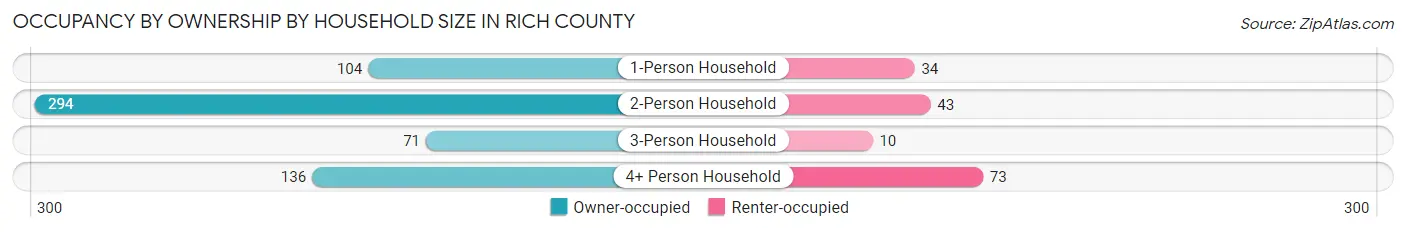
| Household Size | Owner-occupied | Renter-occupied |
| 1-Person Household | 104 (75.4%) | 34 (24.6%) |
| 2-Person Household | 294 (87.2%) | 43 (12.8%) |
| 3-Person Household | 71 (87.6%) | 10 (12.3%) |
| 4+ Person Household | 136 (65.1%) | 73 (34.9%) |
| Total Housing Units | 605 (79.1%) | 160 (20.9%) |
Occupancy by Educational Attainment in Rich County
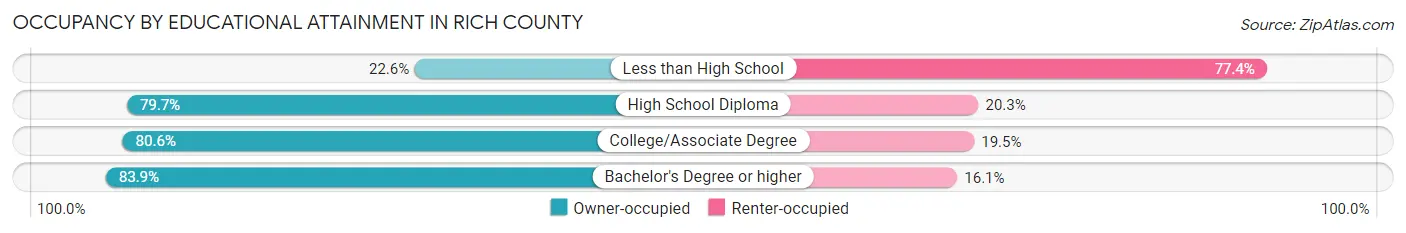
| Household Size | Owner-occupied | Renter-occupied |
| Less than High School | 7 (22.6%) | 24 (77.4%) |
| High School Diploma | 106 (79.7%) | 27 (20.3%) |
| College/Associate Degree | 294 (80.5%) | 71 (19.5%) |
| Bachelor's Degree or higher | 198 (83.9%) | 38 (16.1%) |
Occupancy by Age of Householder in Rich County
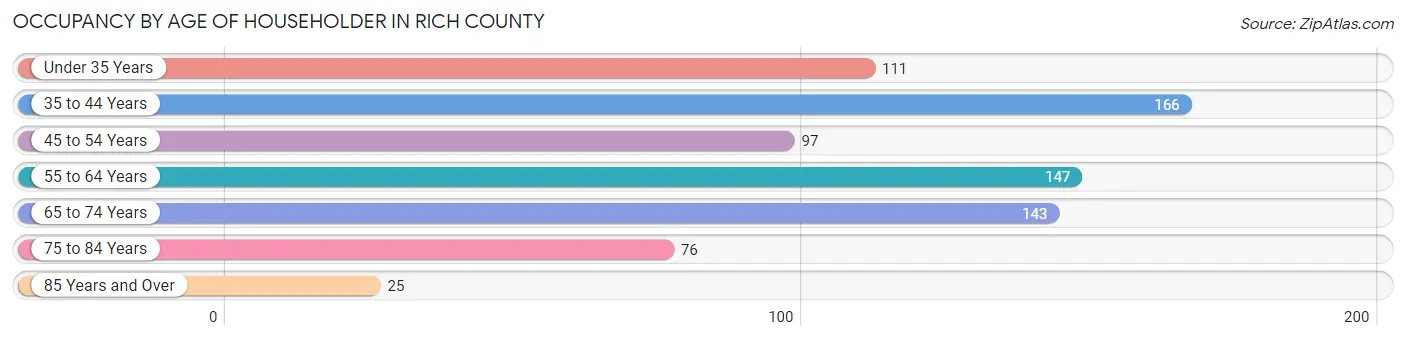
| Age Bracket | # Households | % Households |
| Under 35 Years | 111 | 14.5% |
| 35 to 44 Years | 166 | 21.7% |
| 45 to 54 Years | 97 | 12.7% |
| 55 to 64 Years | 147 | 19.2% |
| 65 to 74 Years | 143 | 18.7% |
| 75 to 84 Years | 76 | 9.9% |
| 85 Years and Over | 25 | 3.3% |
| Total | 765 | 100.0% |
Housing Finances in Rich County
Median Income by Occupancy in Rich County
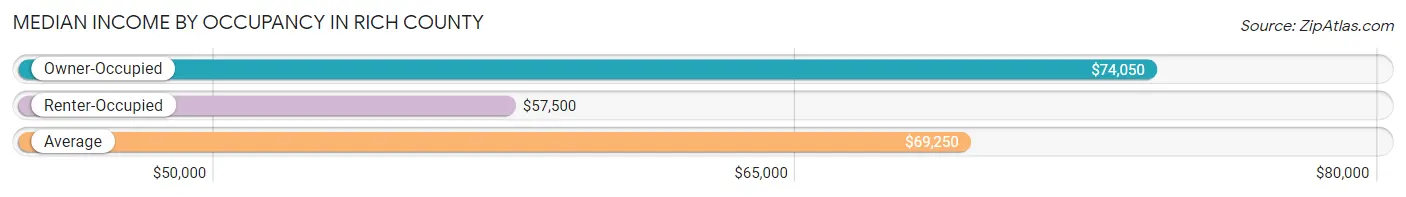
| Occupancy Type | # Households | Median Income |
| Owner-Occupied | 605 (79.1%) | $74,050 |
| Renter-Occupied | 160 (20.9%) | $57,500 |
| Average | 765 (100.0%) | $69,250 |
Occupancy by Householder Income Bracket in Rich County
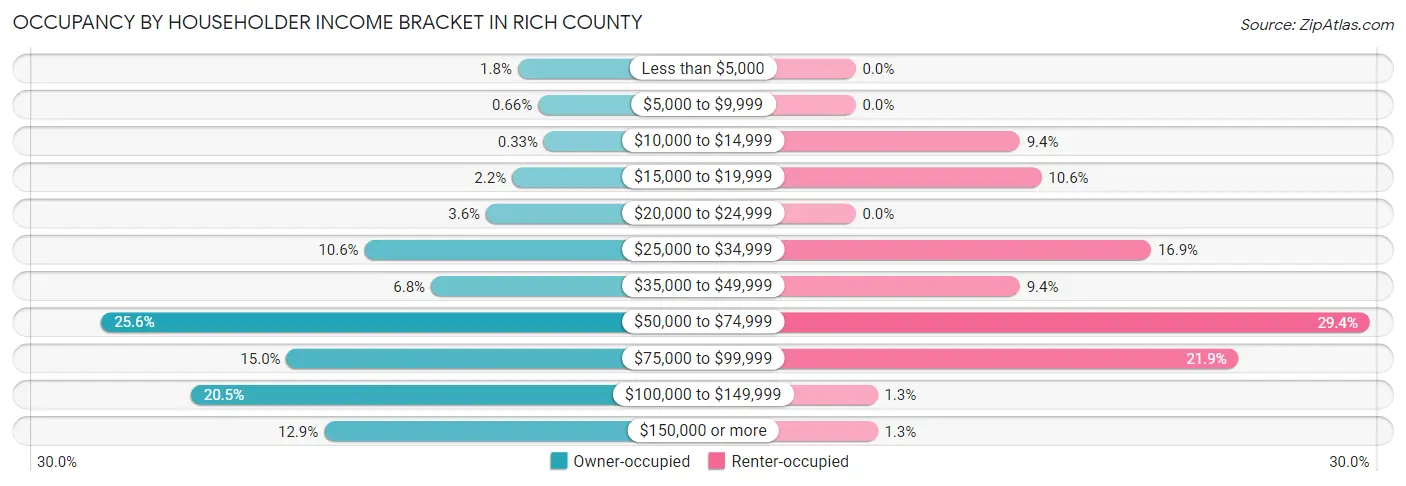
| Income Bracket | Owner-occupied | Renter-occupied |
| Less than $5,000 | 11 (1.8%) | 0 (0.0%) |
| $5,000 to $9,999 | 4 (0.7%) | 0 (0.0%) |
| $10,000 to $14,999 | 2 (0.3%) | 15 (9.4%) |
| $15,000 to $19,999 | 13 (2.1%) | 17 (10.6%) |
| $20,000 to $24,999 | 22 (3.6%) | 0 (0.0%) |
| $25,000 to $34,999 | 64 (10.6%) | 27 (16.9%) |
| $35,000 to $49,999 | 41 (6.8%) | 15 (9.4%) |
| $50,000 to $74,999 | 155 (25.6%) | 47 (29.4%) |
| $75,000 to $99,999 | 91 (15.0%) | 35 (21.9%) |
| $100,000 to $149,999 | 124 (20.5%) | 2 (1.3%) |
| $150,000 or more | 78 (12.9%) | 2 (1.3%) |
| Total | 605 (100.0%) | 160 (100.0%) |
Monthly Housing Cost Tiers in Rich County
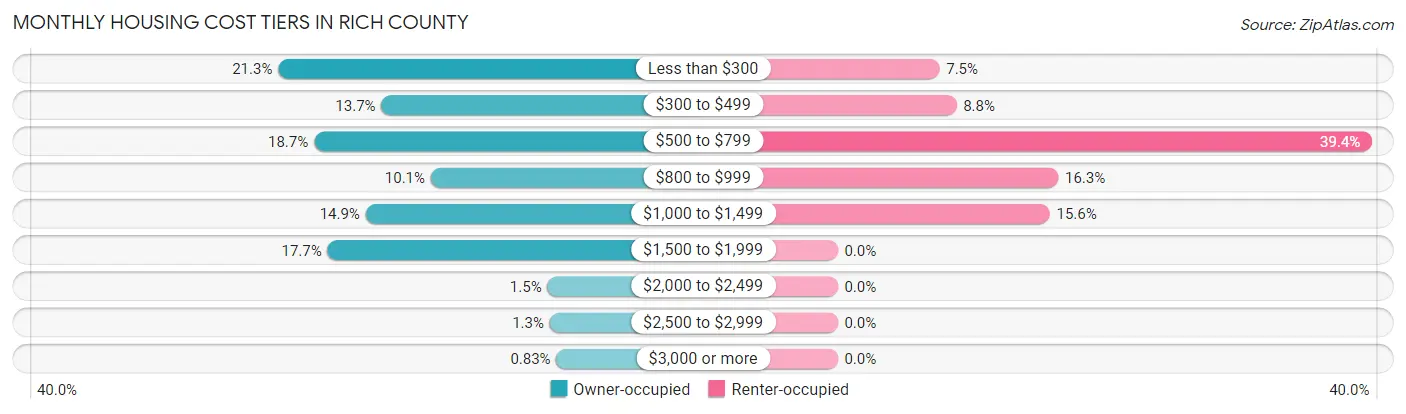
| Monthly Cost | Owner-occupied | Renter-occupied |
| Less than $300 | 129 (21.3%) | 12 (7.5%) |
| $300 to $499 | 83 (13.7%) | 14 (8.7%) |
| $500 to $799 | 113 (18.7%) | 63 (39.4%) |
| $800 to $999 | 61 (10.1%) | 26 (16.3%) |
| $1,000 to $1,499 | 90 (14.9%) | 25 (15.6%) |
| $1,500 to $1,999 | 107 (17.7%) | 0 (0.0%) |
| $2,000 to $2,499 | 9 (1.5%) | 0 (0.0%) |
| $2,500 to $2,999 | 8 (1.3%) | 0 (0.0%) |
| $3,000 or more | 5 (0.8%) | 0 (0.0%) |
| Total | 605 (100.0%) | 160 (100.0%) |
Physical Housing Characteristics in Rich County
Housing Structures in Rich County
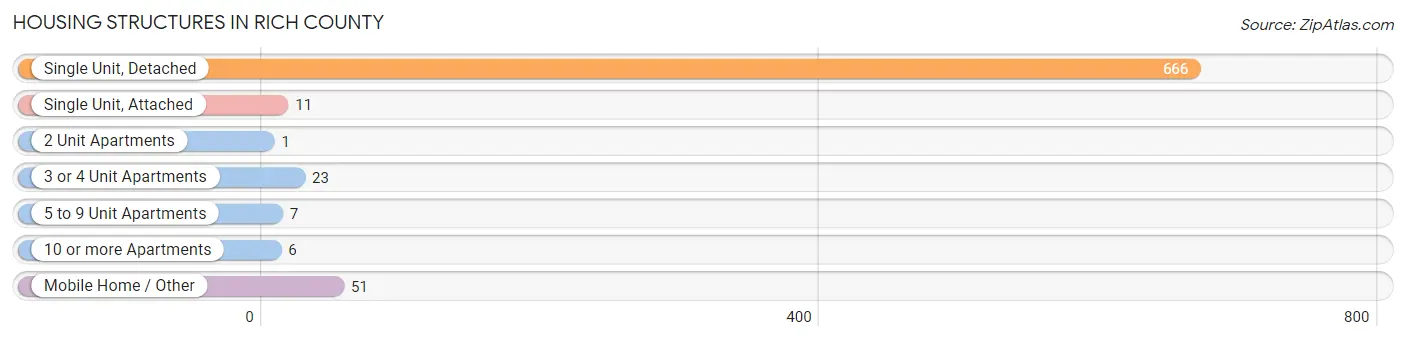
| Structure Type | # Housing Units | % Housing Units |
| Single Unit, Detached | 666 | 87.1% |
| Single Unit, Attached | 11 | 1.4% |
| 2 Unit Apartments | 1 | 0.1% |
| 3 or 4 Unit Apartments | 23 | 3.0% |
| 5 to 9 Unit Apartments | 7 | 0.9% |
| 10 or more Apartments | 6 | 0.8% |
| Mobile Home / Other | 51 | 6.7% |
| Total | 765 | 100.0% |
Housing Structures by Occupancy in Rich County
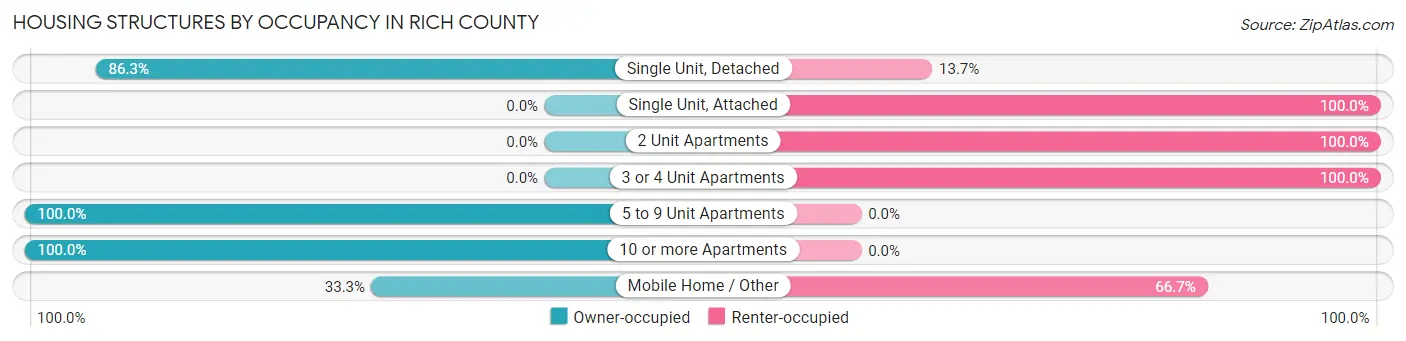
| Structure Type | Owner-occupied | Renter-occupied |
| Single Unit, Detached | 575 (86.3%) | 91 (13.7%) |
| Single Unit, Attached | 0 (0.0%) | 11 (100.0%) |
| 2 Unit Apartments | 0 (0.0%) | 1 (100.0%) |
| 3 or 4 Unit Apartments | 0 (0.0%) | 23 (100.0%) |
| 5 to 9 Unit Apartments | 7 (100.0%) | 0 (0.0%) |
| 10 or more Apartments | 6 (100.0%) | 0 (0.0%) |
| Mobile Home / Other | 17 (33.3%) | 34 (66.7%) |
| Total | 605 (79.1%) | 160 (20.9%) |
Housing Structures by Number of Rooms in Rich County
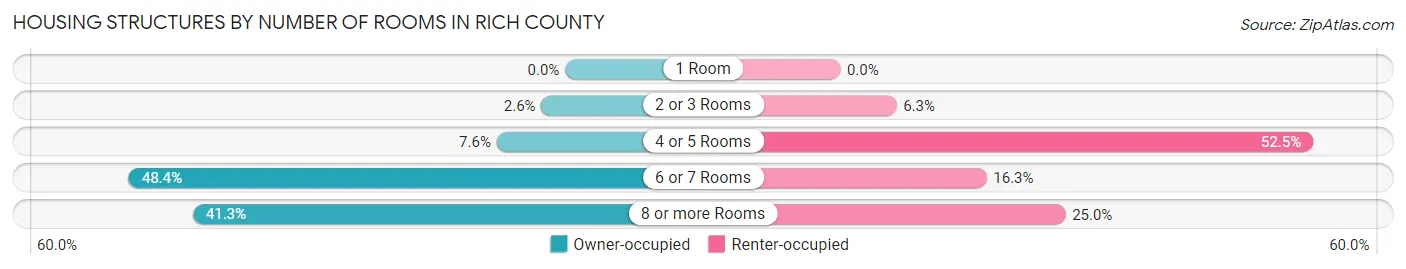
| Number of Rooms | Owner-occupied | Renter-occupied |
| 1 Room | 0 (0.0%) | 0 (0.0%) |
| 2 or 3 Rooms | 16 (2.6%) | 10 (6.2%) |
| 4 or 5 Rooms | 46 (7.6%) | 84 (52.5%) |
| 6 or 7 Rooms | 293 (48.4%) | 26 (16.3%) |
| 8 or more Rooms | 250 (41.3%) | 40 (25.0%) |
| Total | 605 (100.0%) | 160 (100.0%) |
Housing Structure by Heating Type in Rich County
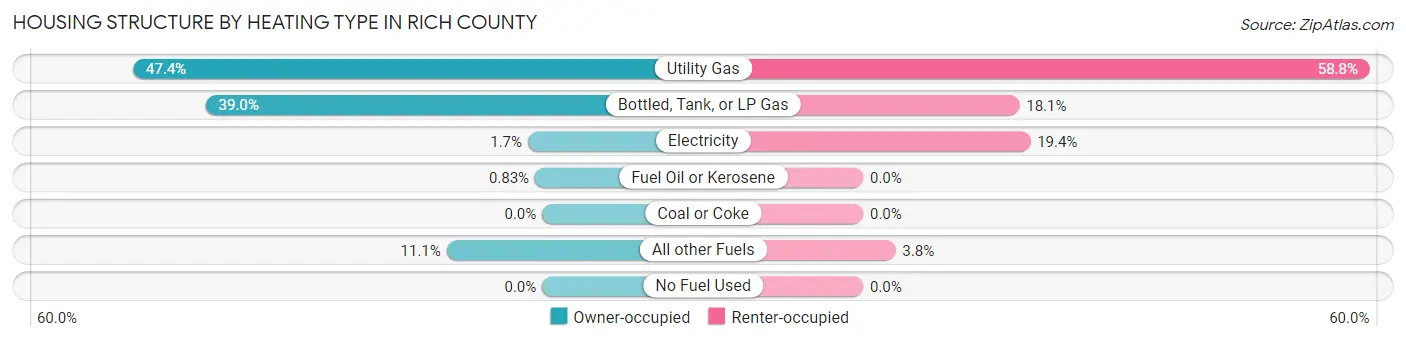
| Heating Type | Owner-occupied | Renter-occupied |
| Utility Gas | 287 (47.4%) | 94 (58.8%) |
| Bottled, Tank, or LP Gas | 236 (39.0%) | 29 (18.1%) |
| Electricity | 10 (1.7%) | 31 (19.4%) |
| Fuel Oil or Kerosene | 5 (0.8%) | 0 (0.0%) |
| Coal or Coke | 0 (0.0%) | 0 (0.0%) |
| All other Fuels | 67 (11.1%) | 6 (3.7%) |
| No Fuel Used | 0 (0.0%) | 0 (0.0%) |
| Total | 605 (100.0%) | 160 (100.0%) |
Household Vehicle Usage in Rich County
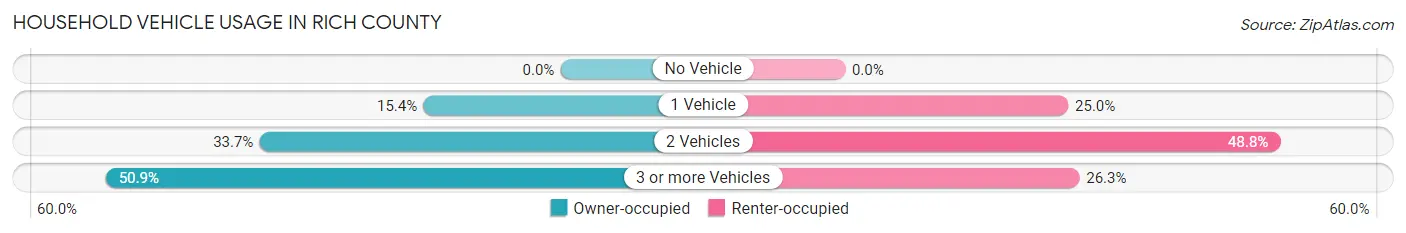
| Vehicles per Household | Owner-occupied | Renter-occupied |
| No Vehicle | 0 (0.0%) | 0 (0.0%) |
| 1 Vehicle | 93 (15.4%) | 40 (25.0%) |
| 2 Vehicles | 204 (33.7%) | 78 (48.7%) |
| 3 or more Vehicles | 308 (50.9%) | 42 (26.3%) |
| Total | 605 (100.0%) | 160 (100.0%) |
Real Estate & Mortgages in Rich County
Real Estate and Mortgage Overview in Rich County
| Characteristic | Without Mortgage | With Mortgage |
| Housing Units | 284 | 321 |
| Median Property Value | $233,800 | $305,000 |
| Median Household Income | $56,458 | $14 |
| Monthly Housing Costs | $323 | $5 |
| Real Estate Taxes | $1,044 | $3 |
Property Value by Mortgage Status in Rich County
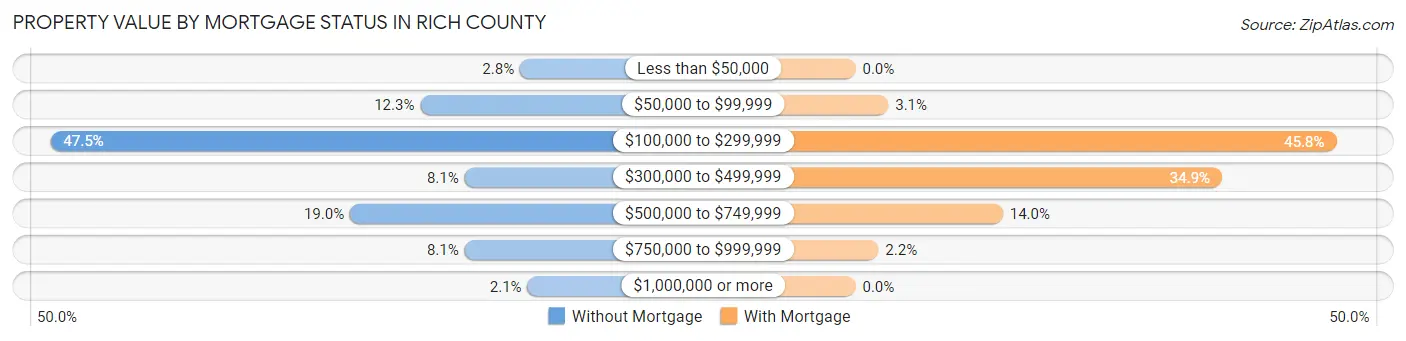
| Property Value | Without Mortgage | With Mortgage |
| Less than $50,000 | 8 (2.8%) | 0 (0.0%) |
| $50,000 to $99,999 | 35 (12.3%) | 10 (3.1%) |
| $100,000 to $299,999 | 135 (47.5%) | 147 (45.8%) |
| $300,000 to $499,999 | 23 (8.1%) | 112 (34.9%) |
| $500,000 to $749,999 | 54 (19.0%) | 45 (14.0%) |
| $750,000 to $999,999 | 23 (8.1%) | 7 (2.2%) |
| $1,000,000 or more | 6 (2.1%) | 0 (0.0%) |
| Total | 284 (100.0%) | 321 (100.0%) |
Household Income by Mortgage Status in Rich County
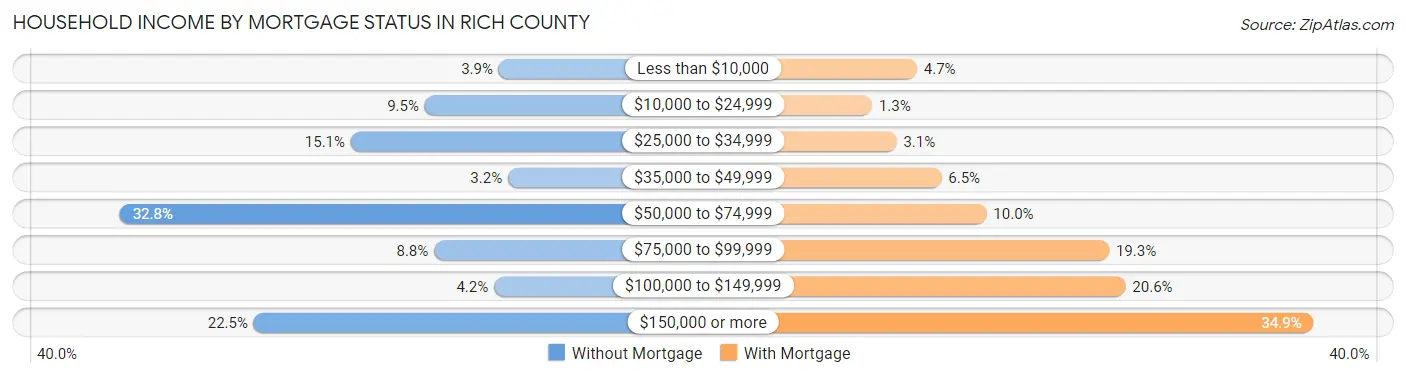
| Household Income | Without Mortgage | With Mortgage |
| Less than $10,000 | 11 (3.9%) | 15 (4.7%) |
| $10,000 to $24,999 | 27 (9.5%) | 4 (1.3%) |
| $25,000 to $34,999 | 43 (15.1%) | 10 (3.1%) |
| $35,000 to $49,999 | 9 (3.2%) | 21 (6.5%) |
| $50,000 to $74,999 | 93 (32.8%) | 32 (10.0%) |
| $75,000 to $99,999 | 25 (8.8%) | 62 (19.3%) |
| $100,000 to $149,999 | 12 (4.2%) | 66 (20.6%) |
| $150,000 or more | 64 (22.5%) | 112 (34.9%) |
| Total | 284 (100.0%) | 321 (100.0%) |
Property Value to Household Income Ratio in Rich County
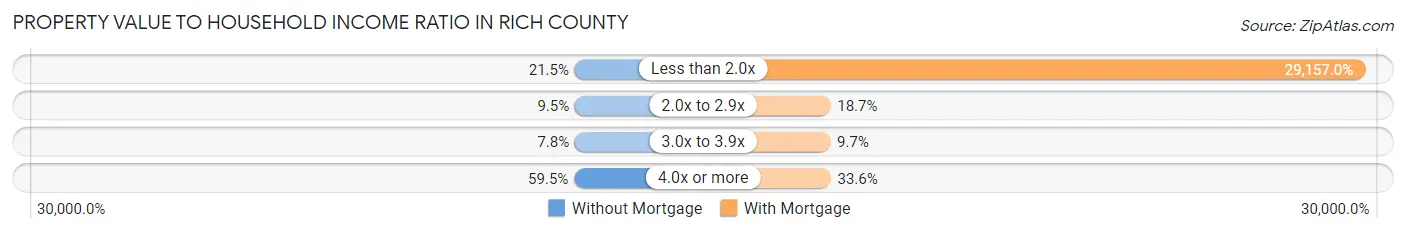
| Value-to-Income Ratio | Without Mortgage | With Mortgage |
| Less than 2.0x | 61 (21.5%) | 93,594 (29,157.0%) |
| 2.0x to 2.9x | 27 (9.5%) | 60 (18.7%) |
| 3.0x to 3.9x | 22 (7.7%) | 31 (9.7%) |
| 4.0x or more | 169 (59.5%) | 108 (33.6%) |
| Total | 284 (100.0%) | 321 (100.0%) |
Real Estate Taxes by Mortgage Status in Rich County
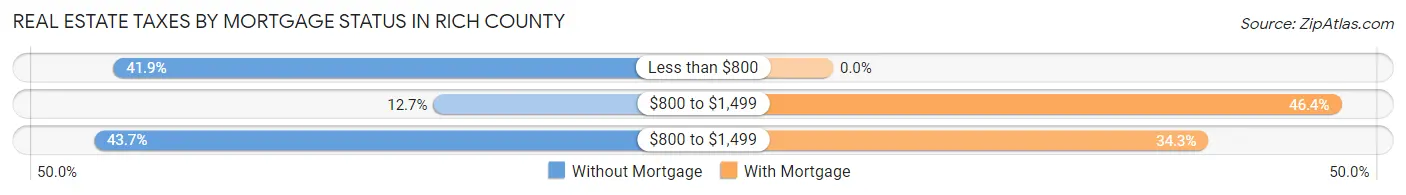
| Property Taxes | Without Mortgage | With Mortgage |
| Less than $800 | 119 (41.9%) | 0 (0.0%) |
| $800 to $1,499 | 36 (12.7%) | 149 (46.4%) |
| $800 to $1,499 | 124 (43.7%) | 110 (34.3%) |
| Total | 284 (100.0%) | 321 (100.0%) |
Health & Disability in Rich County
Health Insurance Coverage by Age in Rich County
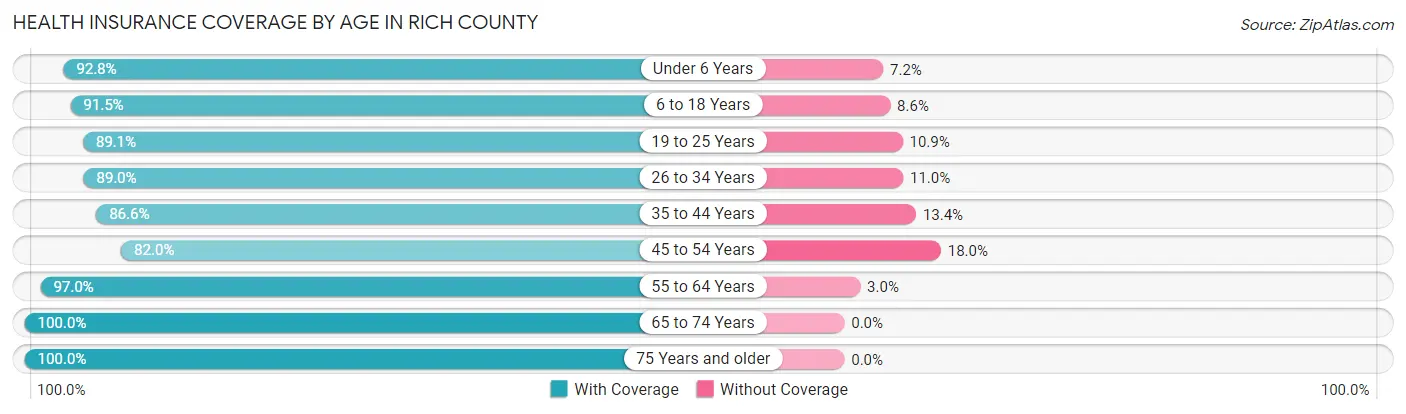
| Age Bracket | With Coverage | Without Coverage |
| Under 6 Years | 218 (92.8%) | 17 (7.2%) |
| 6 to 18 Years | 556 (91.4%) | 52 (8.6%) |
| 19 to 25 Years | 156 (89.1%) | 19 (10.9%) |
| 26 to 34 Years | 260 (89.0%) | 32 (11.0%) |
| 35 to 44 Years | 227 (86.6%) | 35 (13.4%) |
| 45 to 54 Years | 164 (82.0%) | 36 (18.0%) |
| 55 to 64 Years | 295 (97.0%) | 9 (3.0%) |
| 65 to 74 Years | 289 (100.0%) | 0 (0.0%) |
| 75 Years and older | 170 (100.0%) | 0 (0.0%) |
| Total | 2,335 (92.1%) | 200 (7.9%) |
Health Insurance Coverage by Citizenship Status in Rich County
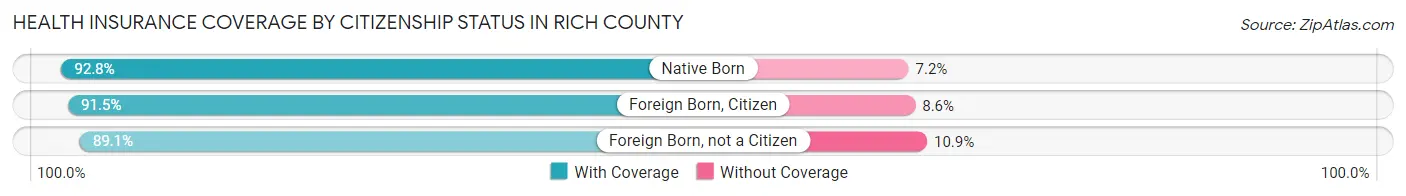
| Citizenship Status | With Coverage | Without Coverage |
| Native Born | 218 (92.8%) | 17 (7.2%) |
| Foreign Born, Citizen | 556 (91.4%) | 52 (8.6%) |
| Foreign Born, not a Citizen | 156 (89.1%) | 19 (10.9%) |
Health Insurance Coverage by Household Income in Rich County
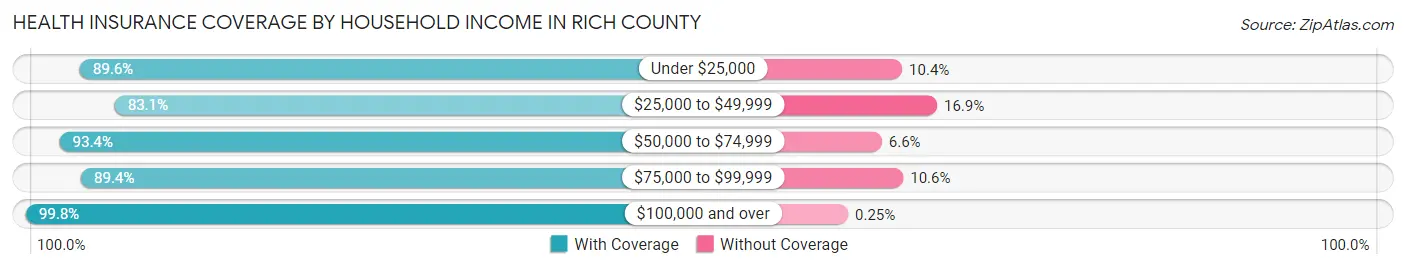
| Household Income | With Coverage | Without Coverage |
| Under $25,000 | 121 (89.6%) | 14 (10.4%) |
| $25,000 to $49,999 | 403 (83.1%) | 82 (16.9%) |
| $50,000 to $74,999 | 569 (93.4%) | 40 (6.6%) |
| $75,000 to $99,999 | 456 (89.4%) | 54 (10.6%) |
| $100,000 and over | 786 (99.8%) | 2 (0.3%) |
Public vs Private Health Insurance Coverage by Age in Rich County
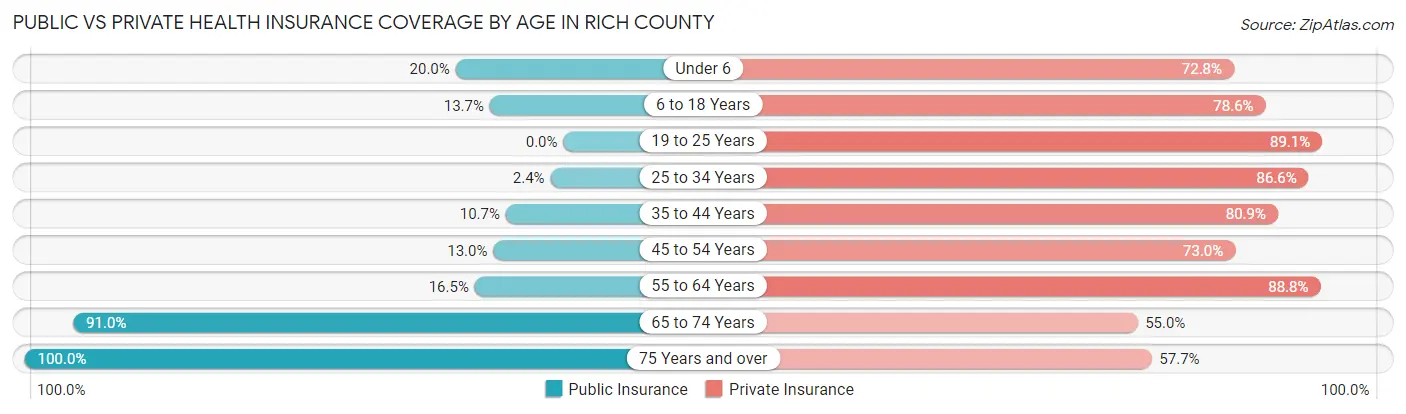
| Age Bracket | Public Insurance | Private Insurance |
| Under 6 | 47 (20.0%) | 171 (72.8%) |
| 6 to 18 Years | 83 (13.7%) | 478 (78.6%) |
| 19 to 25 Years | 0 (0.0%) | 156 (89.1%) |
| 25 to 34 Years | 7 (2.4%) | 253 (86.6%) |
| 35 to 44 Years | 28 (10.7%) | 212 (80.9%) |
| 45 to 54 Years | 26 (13.0%) | 146 (73.0%) |
| 55 to 64 Years | 50 (16.5%) | 270 (88.8%) |
| 65 to 74 Years | 263 (91.0%) | 159 (55.0%) |
| 75 Years and over | 170 (100.0%) | 98 (57.7%) |
| Total | 674 (26.6%) | 1,943 (76.6%) |
Disability Status by Sex by Age in Rich County
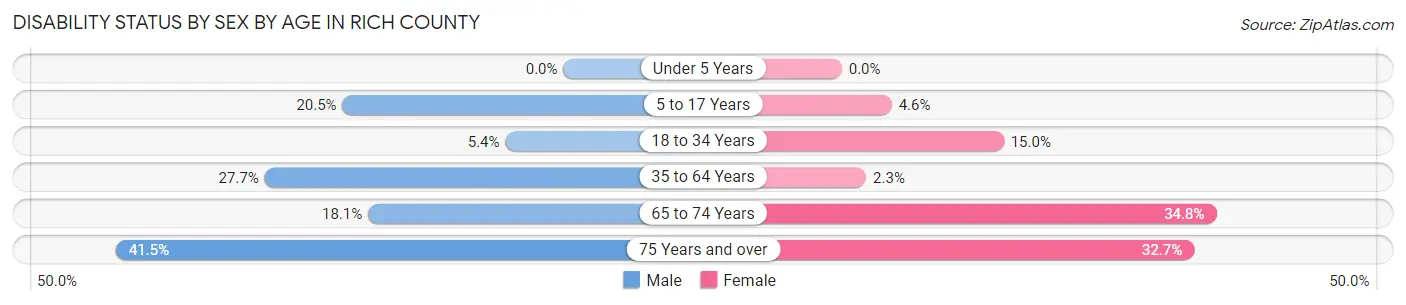
| Age Bracket | Male | Female |
| Under 5 Years | 0 (0.0%) | 0 (0.0%) |
| 5 to 17 Years | 65 (20.5%) | 13 (4.6%) |
| 18 to 34 Years | 10 (5.4%) | 46 (15.0%) |
| 35 to 64 Years | 102 (27.7%) | 9 (2.3%) |
| 65 to 74 Years | 31 (18.1%) | 41 (34.7%) |
| 75 Years and over | 49 (41.5%) | 17 (32.7%) |
Disability Class by Sex by Age in Rich County
Disability Class: Hearing Difficulty
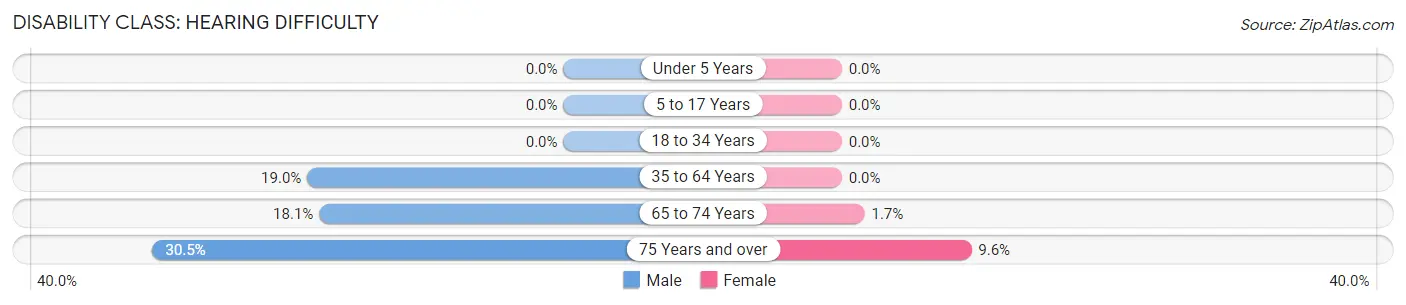
| Age Bracket | Male | Female |
| Under 5 Years | 0 (0.0%) | 0 (0.0%) |
| 5 to 17 Years | 0 (0.0%) | 0 (0.0%) |
| 18 to 34 Years | 0 (0.0%) | 0 (0.0%) |
| 35 to 64 Years | 70 (19.0%) | 0 (0.0%) |
| 65 to 74 Years | 31 (18.1%) | 2 (1.7%) |
| 75 Years and over | 36 (30.5%) | 5 (9.6%) |
Disability Class: Vision Difficulty
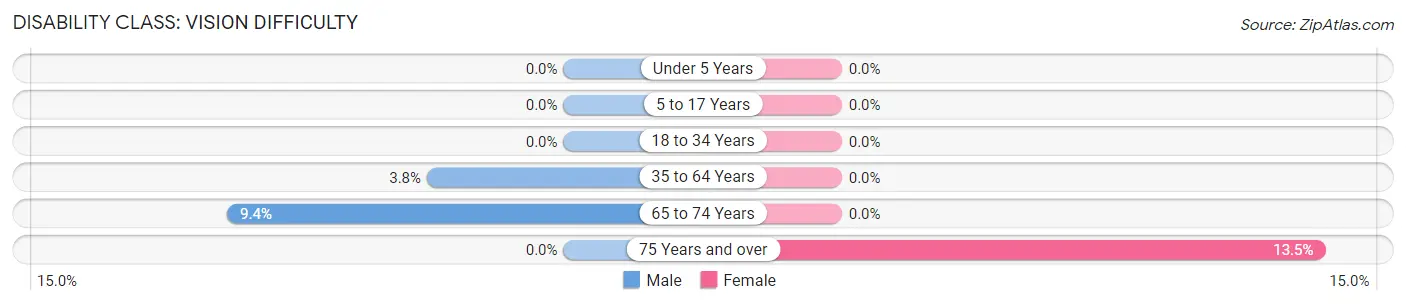
| Age Bracket | Male | Female |
| Under 5 Years | 0 (0.0%) | 0 (0.0%) |
| 5 to 17 Years | 0 (0.0%) | 0 (0.0%) |
| 18 to 34 Years | 0 (0.0%) | 0 (0.0%) |
| 35 to 64 Years | 14 (3.8%) | 0 (0.0%) |
| 65 to 74 Years | 16 (9.4%) | 0 (0.0%) |
| 75 Years and over | 0 (0.0%) | 7 (13.5%) |
Disability Class: Cognitive Difficulty
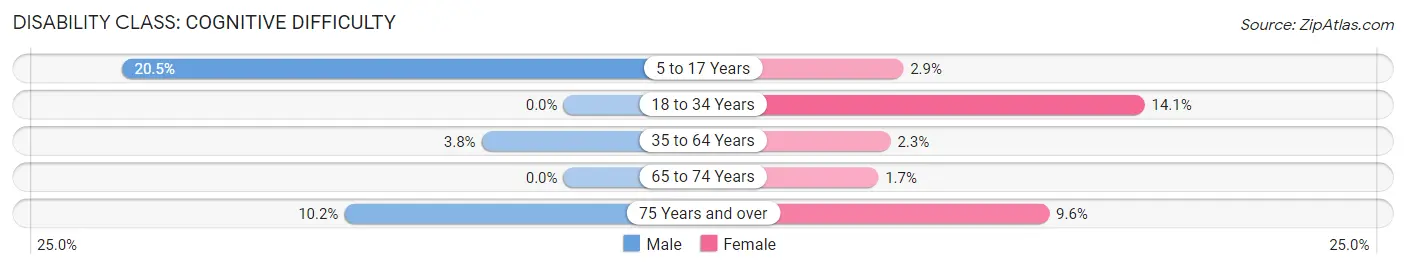
| Age Bracket | Male | Female |
| 5 to 17 Years | 65 (20.5%) | 8 (2.9%) |
| 18 to 34 Years | 0 (0.0%) | 43 (14.1%) |
| 35 to 64 Years | 14 (3.8%) | 9 (2.3%) |
| 65 to 74 Years | 0 (0.0%) | 2 (1.7%) |
| 75 Years and over | 12 (10.2%) | 5 (9.6%) |
Disability Class: Ambulatory Difficulty
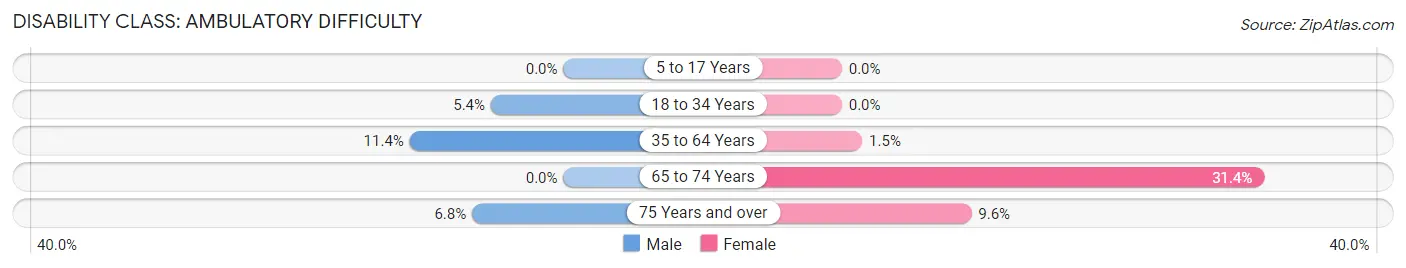
| Age Bracket | Male | Female |
| 5 to 17 Years | 0 (0.0%) | 0 (0.0%) |
| 18 to 34 Years | 10 (5.4%) | 0 (0.0%) |
| 35 to 64 Years | 42 (11.4%) | 6 (1.5%) |
| 65 to 74 Years | 0 (0.0%) | 37 (31.4%) |
| 75 Years and over | 8 (6.8%) | 5 (9.6%) |
Disability Class: Self-Care Difficulty
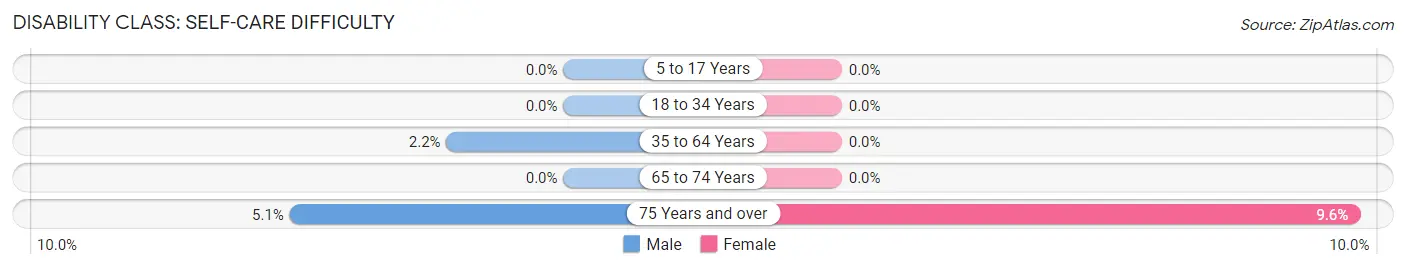
| Age Bracket | Male | Female |
| 5 to 17 Years | 0 (0.0%) | 0 (0.0%) |
| 18 to 34 Years | 0 (0.0%) | 0 (0.0%) |
| 35 to 64 Years | 8 (2.2%) | 0 (0.0%) |
| 65 to 74 Years | 0 (0.0%) | 0 (0.0%) |
| 75 Years and over | 6 (5.1%) | 5 (9.6%) |
Technology Access in Rich County
Computing Device Access in Rich County
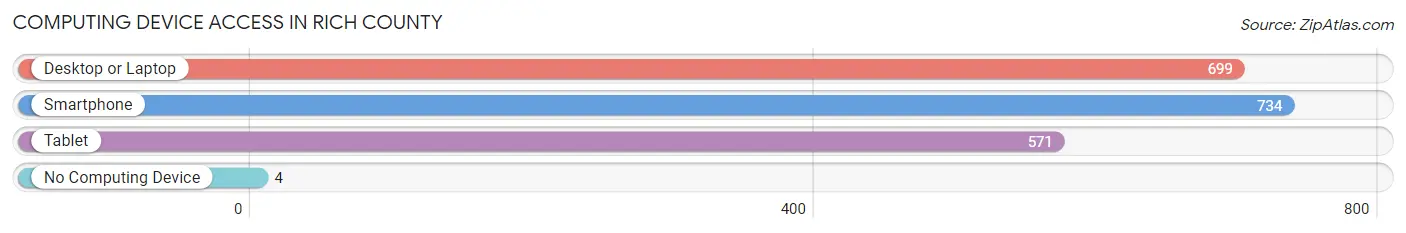
| Device Type | # Households | % Households |
| Desktop or Laptop | 699 | 91.4% |
| Smartphone | 734 | 96.0% |
| Tablet | 571 | 74.6% |
| No Computing Device | 4 | 0.5% |
| Total | 765 | 100.0% |
Internet Access in Rich County
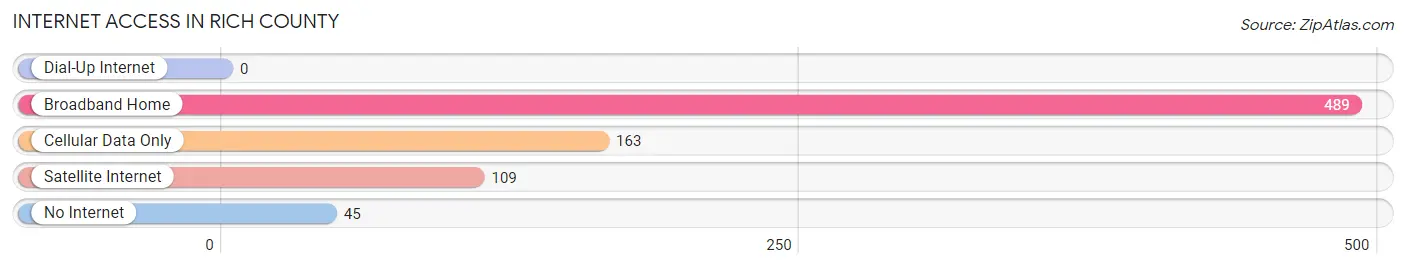
| Internet Type | # Households | % Households |
| Dial-Up Internet | 0 | 0.0% |
| Broadband Home | 489 | 63.9% |
| Cellular Data Only | 163 | 21.3% |
| Satellite Internet | 109 | 14.2% |
| No Internet | 45 | 5.9% |
| Total | 765 | 100.0% |
Rich County Summary
Rich County is located in the northern part of Utah, and is bordered by Cache County to the north, Box Elder County to the east, and Summit County to the south. The county seat is Randolph, and the largest city is Woodruff. The county was named for an early settler, Charles C. Rich, who was a leader in the Church of Jesus Christ of Latter-day Saints.
Geography
Rich County is located in the northern part of Utah, and is bordered by Cache County to the north, Box Elder County to the east, and Summit County to the south. The county is located in the Wasatch Range of the Rocky Mountains, and is home to the Bear River Mountains, the highest mountain range in Utah. The county is also home to the Bear River, which is the largest tributary of the Great Salt Lake. The county has a total area of 1,845 square miles, of which 1,843 square miles is land and 2 square miles is water.
The county is home to several state parks, including Bear Lake State Park, which is located on the shores of Bear Lake, and is a popular destination for fishing, boating, and camping. Other parks in the county include the Bear River Migratory Bird Refuge, which is a protected area for migratory birds, and the Red Creek Wildlife Management Area, which is a protected area for wildlife.
Economy
The economy of Rich County is largely based on agriculture and tourism. The county is home to several large farms, which produce a variety of crops, including hay, corn, wheat, and potatoes. The county is also home to several large dairies, which produce milk, cheese, and other dairy products.
Tourism is also an important part of the economy of Rich County. The county is home to several popular tourist attractions, including Bear Lake State Park, which is a popular destination for fishing, boating, and camping. The county is also home to several ski resorts, including the Bear River Ski Resort, which is located in the Bear River Mountains.
Demographics
As of the 2010 census, the population of Rich County was 2,264, an increase of 4.3% from the 2000 census. The population density was 1.2 people per square mile. The racial makeup of the county was 97.3% White, 0.3% Native American, 0.2% Asian, 0.1% Pacific Islander, 0.2% from other races, and 1.9% from two or more races. Hispanic or Latino of any race were 1.3% of the population.
The median income for a household in the county was $37,917, and the median income for a family was $44,917. The per capita income for the county was $17,917. About 11.3% of families and 14.2% of the population were below the poverty line, including 17.2% of those under age 18 and 8.3% of those age 65 or over.
Rich County is a rural county with a small population, but it is a beautiful area with a lot to offer. The county is home to several state parks, ski resorts, and other attractions, and is a popular destination for tourists. The economy of the county is largely based on agriculture and tourism, and the county is home to several large farms and dairies. The population of the county is diverse, and the median income is slightly above the state average.
Common Questions
What is the Total Population of Rich County?
Total Population of Rich County is 2,543.
What is the Total Male Population of Rich County?
Total Male Population of Rich County is 1,287.
What is the Total Female Population of Rich County?
Total Female Population of Rich County is 1,256.
What is the Ratio of Males per 100 Females in Rich County?
There are 102.47 Males per 100 Females in Rich County.
What is the Ratio of Females per 100 Males in Rich County?
There are 97.59 Females per 100 Males in Rich County.
What is the Median Population Age in Rich County?
Median Population Age in Rich County is 33.9 Years.
What is the Average Family Size in Rich County
Average Family Size in Rich County is 3.8 People.
What is the Average Household Size in Rich County
Average Household Size in Rich County is 3.3 People.
What is Per Capita Income in Rich County?
Per Capita income in Rich County is $26,796.
What is the Median Family Income in Rich County?
Median Family Income in Rich County is $82,875.
What is the Median Household income in Rich County?
Median Household Income in Rich County is $69,250.
What is Income or Wage Gap in Rich County?
Income or Wage Gap in Rich County is 49.9%.
Women in Rich County earn 50.1 cents for every dollar earned by a man.
What is Inequality or Gini Index in Rich County?
Inequality or Gini Index in Rich County is 0.37.
How Large is the Labor Force in Rich County?
There are 1,008 People in the Labor Forcein in Rich County.
What is the Percentage of People in the Labor Force in Rich County?
55.7% of People are in the Labor Force in Rich County.
What is the Unemployment Rate in Rich County?
Unemployment Rate in Rich County is 2.6%.