Piute County, UT
Piute County Map
Piute County Overview
1,764
TOTAL POPULATION
940
MALE POPULATION
824
FEMALE POPULATION
114.08
MALES / 100 FEMALES
87.66
FEMALES / 100 MALES
49.5
MEDIAN AGE
4.3
AVG FAMILY SIZE
3.1
AVG HOUSEHOLD SIZE
$19,919
PER CAPITA INCOME
$44,125
AVG FAMILY INCOME
$33,359
AVG HOUSEHOLD INCOME
50.6%
WAGE / INCOME GAP [ % ]
49.4¢/ $1
WAGE / INCOME GAP [ $ ]
0.48
INEQUALITY / GINI INDEX
636
LABOR FORCE [ PEOPLE ]
43.0%
PERCENT IN LABOR FORCE
9.1%
UNEMPLOYMENT RATE
Piute County Area Codes
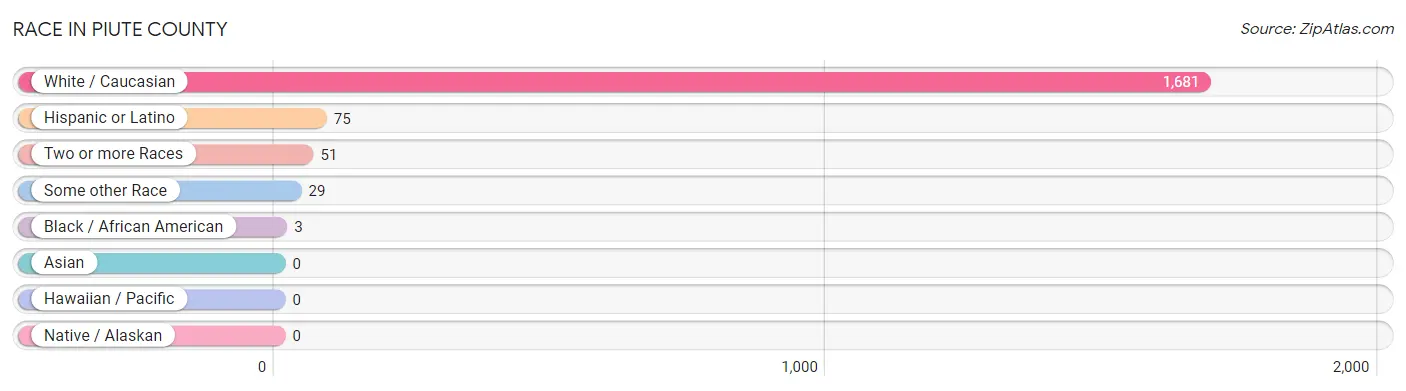
Race in Piute County
The most populous races in Piute County are White / Caucasian (1,681 | 95.3%), Hispanic or Latino (75 | 4.3%), and Two or more Races (51 | 2.9%).
| Race | # Population | % Population |
| Asian | 0 | 0.0% |
| Black / African American | 3 | 0.2% |
| Hawaiian / Pacific | 0 | 0.0% |
| Hispanic or Latino | 75 | 4.3% |
| Native / Alaskan | 0 | 0.0% |
| White / Caucasian | 1,681 | 95.3% |
| Two or more Races | 51 | 2.9% |
| Some other Race | 29 | 1.6% |
| Total | 1,764 | 100.0% |
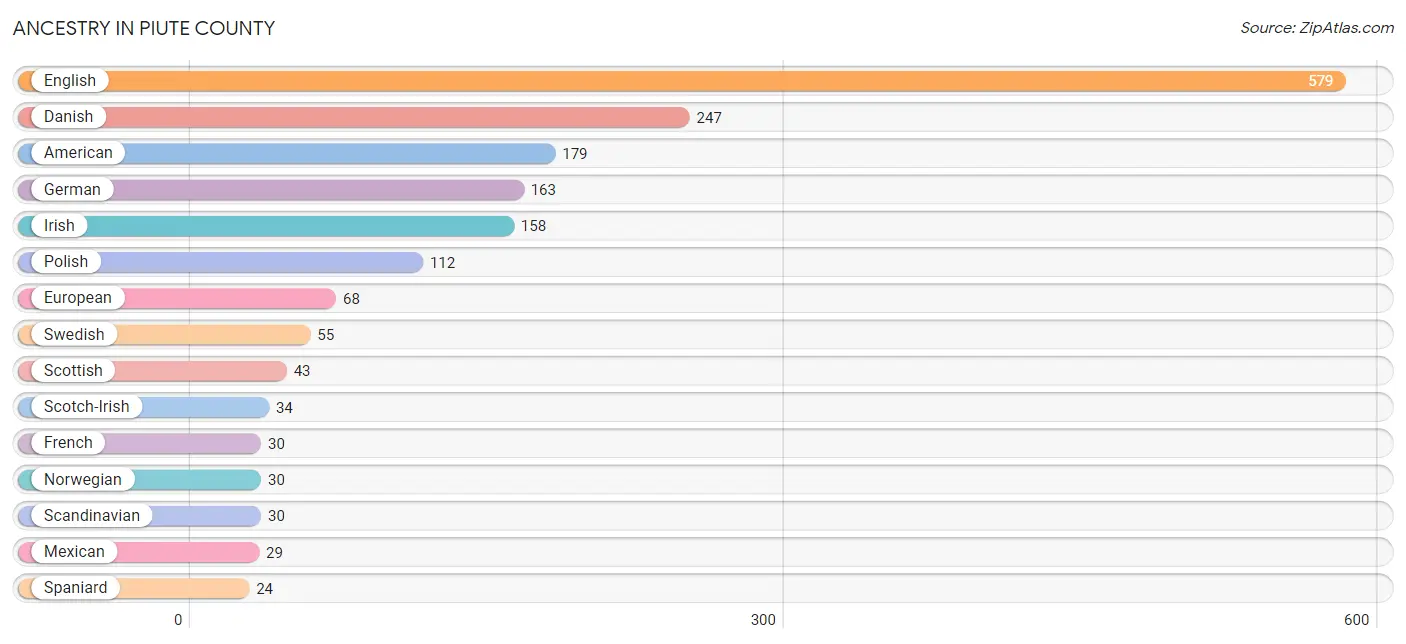
Ancestry in Piute County
The most populous ancestries reported in Piute County are English (579 | 32.8%), Danish (247 | 14.0%), American (179 | 10.2%), German (163 | 9.2%), and Irish (158 | 9.0%), together accounting for 75.2% of all Piute County residents.
| Ancestry | # Population | % Population |
| American | 179 | 10.2% |
| Armenian | 2 | 0.1% |
| British | 5 | 0.3% |
| Central American | 20 | 1.1% |
| Czech | 8 | 0.4% |
| Danish | 247 | 14.0% |
| Dutch | 7 | 0.4% |
| English | 579 | 32.8% |
| European | 68 | 3.8% |
| French | 30 | 1.7% |
| German | 163 | 9.2% |
| Irish | 158 | 9.0% |
| Italian | 12 | 0.7% |
| Kenyan | 12 | 0.7% |
| Mexican | 29 | 1.6% |
| Norwegian | 30 | 1.7% |
| Polish | 112 | 6.4% |
| Portuguese | 1 | 0.1% |
| Puerto Rican | 1 | 0.1% |
| Salvadoran | 20 | 1.1% |
| Scandinavian | 30 | 1.7% |
| Scotch-Irish | 34 | 1.9% |
| Scottish | 43 | 2.4% |
| South African | 5 | 0.3% |
| Spaniard | 24 | 1.4% |
| Spanish | 1 | 0.1% |
| Subsaharan African | 17 | 1.0% |
| Swedish | 55 | 3.1% |
| Swiss | 2 | 0.1% |
| Welsh | 7 | 0.4% | View All 30 Rows |
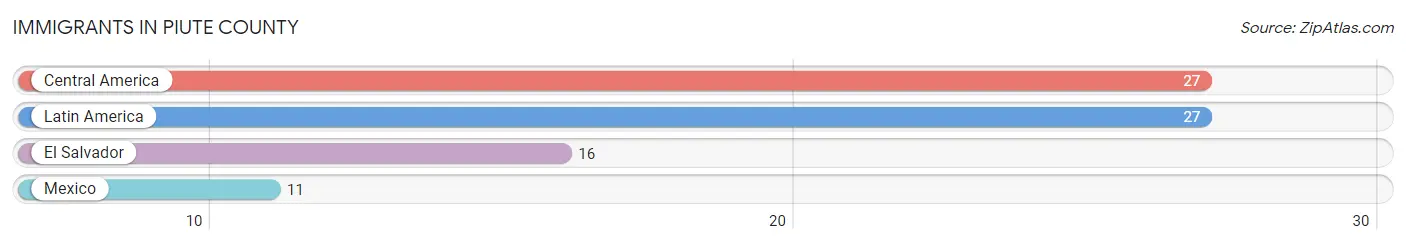
Immigrants in Piute County
The most numerous immigrant groups reported in Piute County came from Central America (27 | 1.5%), Latin America (27 | 1.5%), El Salvador (16 | 0.9%), and Mexico (11 | 0.6%), together accounting for 4.6% of all Piute County residents.
| Immigration Origin | # Population | % Population |
| Central America | 27 | 1.5% |
| El Salvador | 16 | 0.9% |
| Latin America | 27 | 1.5% |
| Mexico | 11 | 0.6% | View All 4 Rows |
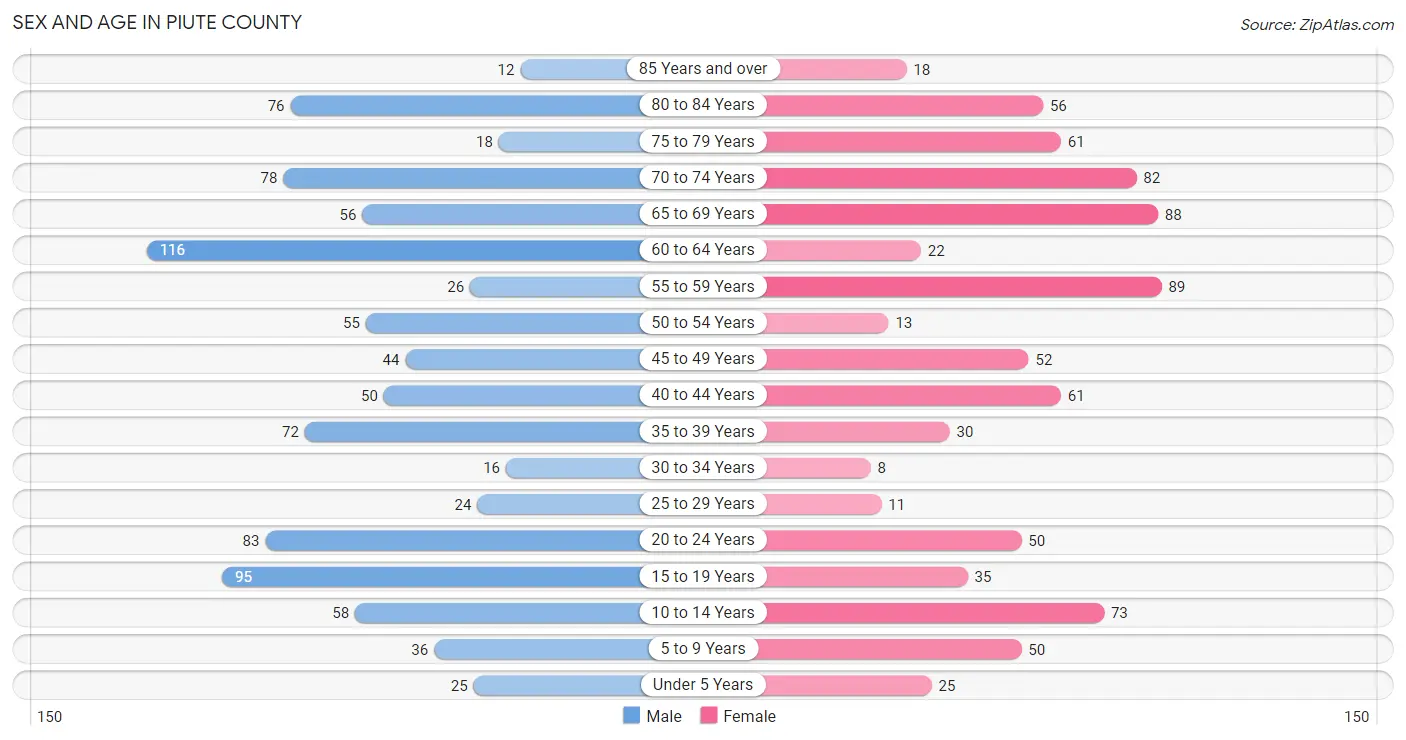
Sex and Age in Piute County
Sex and Age in Piute County
The most populous age groups in Piute County are 60 to 64 Years (116 | 12.3%) for men and 55 to 59 Years (89 | 10.8%) for women.
| Age Bracket | Male | Female |
| Under 5 Years | 25 (2.7%) | 25 (3.0%) |
| 5 to 9 Years | 36 (3.8%) | 50 (6.1%) |
| 10 to 14 Years | 58 (6.2%) | 73 (8.9%) |
| 15 to 19 Years | 95 (10.1%) | 35 (4.3%) |
| 20 to 24 Years | 83 (8.8%) | 50 (6.1%) |
| 25 to 29 Years | 24 (2.5%) | 11 (1.3%) |
| 30 to 34 Years | 16 (1.7%) | 8 (1.0%) |
| 35 to 39 Years | 72 (7.7%) | 30 (3.6%) |
| 40 to 44 Years | 50 (5.3%) | 61 (7.4%) |
| 45 to 49 Years | 44 (4.7%) | 52 (6.3%) |
| 50 to 54 Years | 55 (5.9%) | 13 (1.6%) |
| 55 to 59 Years | 26 (2.8%) | 89 (10.8%) |
| 60 to 64 Years | 116 (12.3%) | 22 (2.7%) |
| 65 to 69 Years | 56 (6.0%) | 88 (10.7%) |
| 70 to 74 Years | 78 (8.3%) | 82 (10.0%) |
| 75 to 79 Years | 18 (1.9%) | 61 (7.4%) |
| 80 to 84 Years | 76 (8.1%) | 56 (6.8%) |
| 85 Years and over | 12 (1.3%) | 18 (2.2%) |
| Total | 940 (100.0%) | 824 (100.0%) |
Families and Households in Piute County
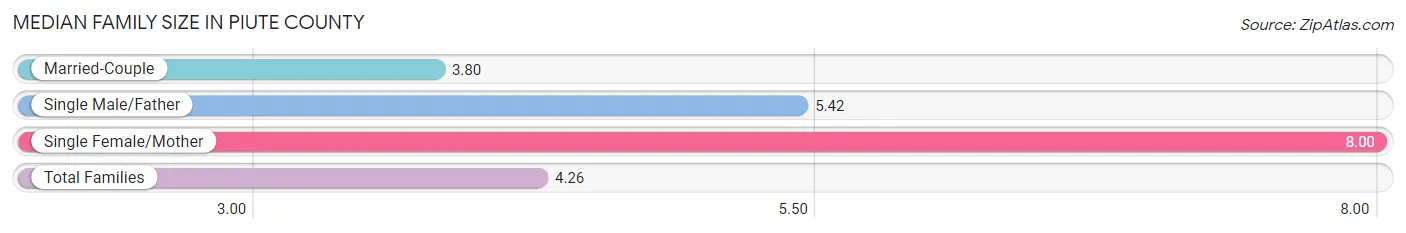
Median Family Size in Piute County
The median family size in Piute County is 4.26 persons per family, with single female/mother families (30 | 8.4%) accounting for the largest median family size of 8 persons per family. On the other hand, married-couple families (305 | 85.0%) represent the smallest median family size with 3.80 persons per family.
| Family Type | # Families | Family Size |
| Married-Couple | 305 (85.0%) | 3.80 |
| Single Male/Father | 24 (6.7%) | 5.42 |
| Single Female/Mother | 30 (8.4%) | 8.00 |
| Total Families | 359 (100.0%) | 4.26 |
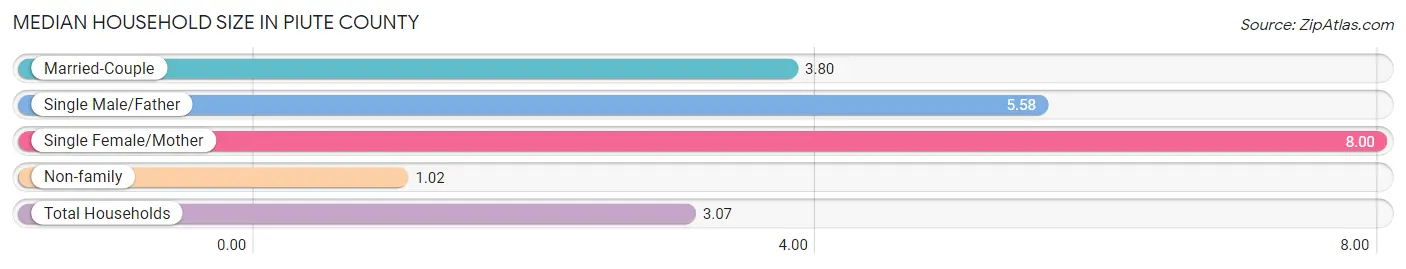
Median Household Size in Piute County
The median household size in Piute County is 3.07 persons per household, with single female/mother households (30 | 5.3%) accounting for the largest median household size of 8 persons per household. non-family households (210 | 36.9%) represent the smallest median household size with 1.02 persons per household.
| Household Type | # Households | Household Size |
| Married-Couple | 305 (53.6%) | 3.80 |
| Single Male/Father | 24 (4.2%) | 5.58 |
| Single Female/Mother | 30 (5.3%) | 8.00 |
| Non-family | 210 (36.9%) | 1.02 |
| Total Households | 569 (100.0%) | 3.07 |
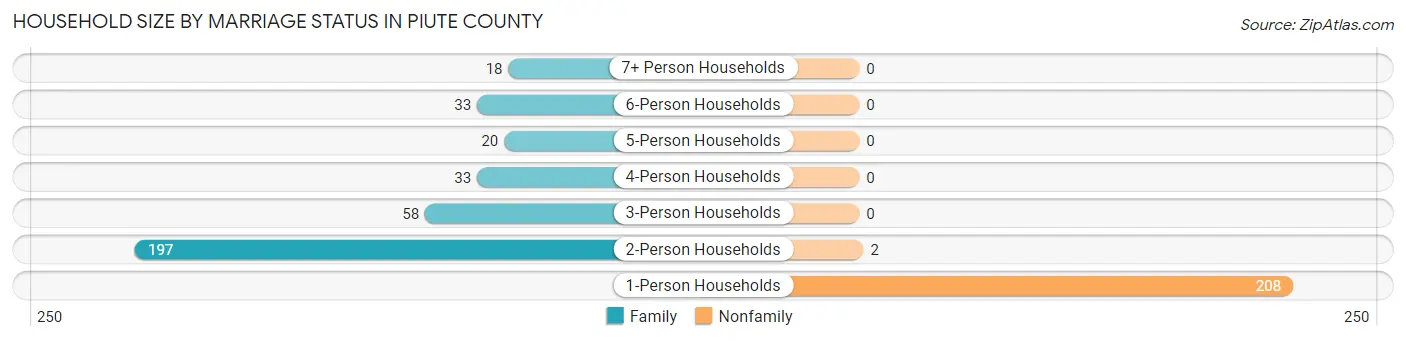
Household Size by Marriage Status in Piute County
Out of a total of 569 households in Piute County, 359 (63.1%) are family households, while 210 (36.9%) are nonfamily households. The most numerous type of family households are 2-person households, comprising 197, and the most common type of nonfamily households are 1-person households, comprising 208.
| Household Size | Family Households | Nonfamily Households |
| 1-Person Households | - | 208 (36.6%) |
| 2-Person Households | 197 (34.6%) | 2 (0.4%) |
| 3-Person Households | 58 (10.2%) | 0 (0.0%) |
| 4-Person Households | 33 (5.8%) | 0 (0.0%) |
| 5-Person Households | 20 (3.5%) | 0 (0.0%) |
| 6-Person Households | 33 (5.8%) | 0 (0.0%) |
| 7+ Person Households | 18 (3.2%) | 0 (0.0%) |
| Total | 359 (63.1%) | 210 (36.9%) |
Female Fertility in Piute County
Fertility by Age in Piute County
Average fertility rate in Piute County is 79.0 births per 1,000 women. Women in the age bracket of 20 to 34 years have the highest fertility rate with 290.0 births per 1,000 women. Women in the age bracket of 20 to 34 years acount for 100.0% of all women with births.
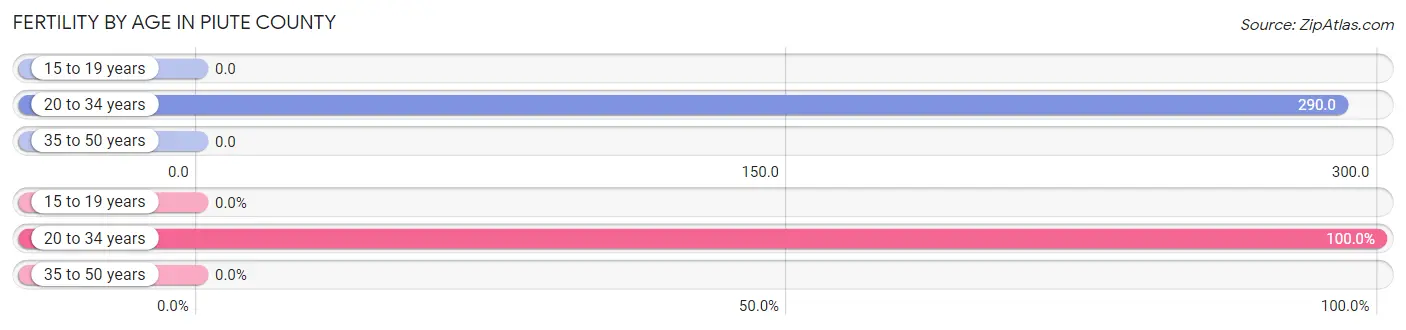
| Age Bracket | Women with Births | Births / 1,000 Women |
| 15 to 19 years | 0 (0.0%) | 0.0 |
| 20 to 34 years | 20 (100.0%) | 290.0 |
| 35 to 50 years | 0 (0.0%) | 0.0 |
| Total | 20 (100.0%) | 79.0 |
Fertility by Age by Marriage Status in Piute County
40.0% of women with births (20) in Piute County are married. The highest percentage of unmarried women with births falls into 20 to 34 years age bracket with 60.0% of them unmarried at the time of birth, while the lowest percentage of unmarried women with births belong to 20 to 34 years age bracket with 60.0% of them unmarried.
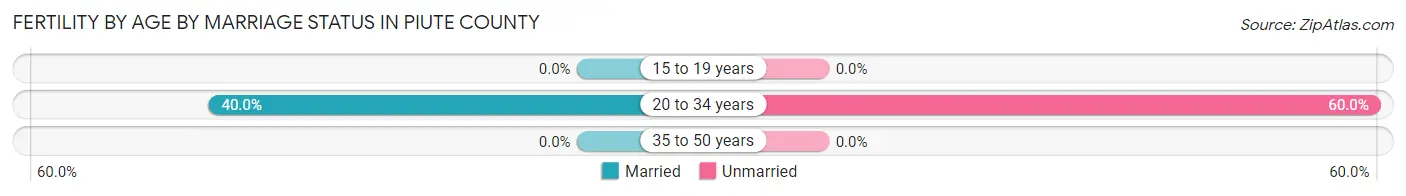
| Age Bracket | Married | Unmarried |
| 15 to 19 years | 0 (0.0%) | 0 (0.0%) |
| 20 to 34 years | 8 (40.0%) | 12 (60.0%) |
| 35 to 50 years | 0 (0.0%) | 0 (0.0%) |
| Total | 8 (40.0%) | 12 (60.0%) |
Fertility by Education in Piute County
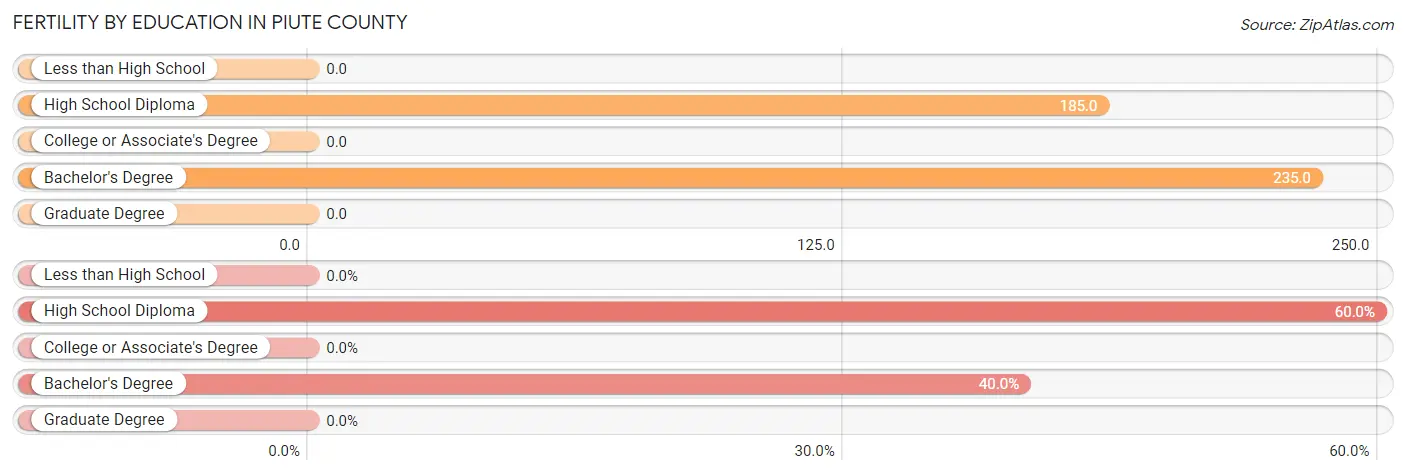
| Educational Attainment | Women with Births | Births / 1,000 Women |
| Less than High School | 0 (0.0%) | 0.0 |
| High School Diploma | 12 (60.0%) | 185.0 |
| College or Associate's Degree | 0 (0.0%) | 0.0 |
| Bachelor's Degree | 8 (40.0%) | 235.0 |
| Graduate Degree | 0 (0.0%) | 0.0 |
| Total | 20 (100.0%) | 79.0 |
Fertility by Education by Marriage Status in Piute County
60.0% of women with births in Piute County are unmarried. Women with the educational attainment of bachelor's degree are most likely to be married with 100.0% of them married at childbirth, while women with the educational attainment of high school diploma are least likely to be married with 100.0% of them unmarried at childbirth.
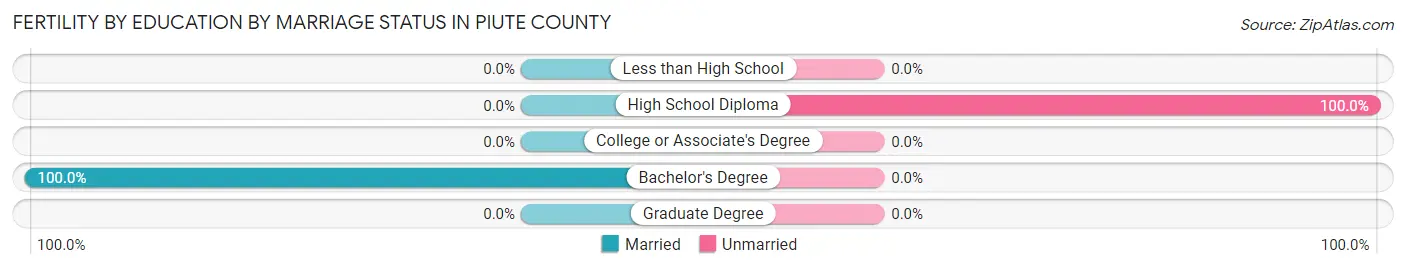
| Educational Attainment | Married | Unmarried |
| Less than High School | 0 (0.0%) | 0 (0.0%) |
| High School Diploma | 0 (0.0%) | 12 (100.0%) |
| College or Associate's Degree | 0 (0.0%) | 0 (0.0%) |
| Bachelor's Degree | 8 (100.0%) | 0 (0.0%) |
| Graduate Degree | 0 (0.0%) | 0 (0.0%) |
| Total | 8 (40.0%) | 12 (60.0%) |
Income in Piute County
Income Overview in Piute County
Per Capita Income in Piute County is $19,919, while median incomes of families and households are $44,125 and $33,359 respectively.
| Characteristic | Number | Measure |
| Per Capita Income | 1,764 | $19,919 |
| Median Family Income | 359 | $44,125 |
| Mean Family Income | 359 | $60,564 |
| Median Household Income | 569 | $33,359 |
| Mean Household Income | 569 | $49,356 |
| Income Deficit | 359 | $0 |
| Wage / Income Gap (%) | 1,764 | 50.64% |
| Wage / Income Gap ($) | 1,764 | 49.36¢ per $1 |
| Gini / Inequality Index | 1,764 | 0.48 |
Earnings by Sex in Piute County
Average Earnings in Piute County are $28,446, $31,445 for men and $15,521 for women, a difference of 50.6%.
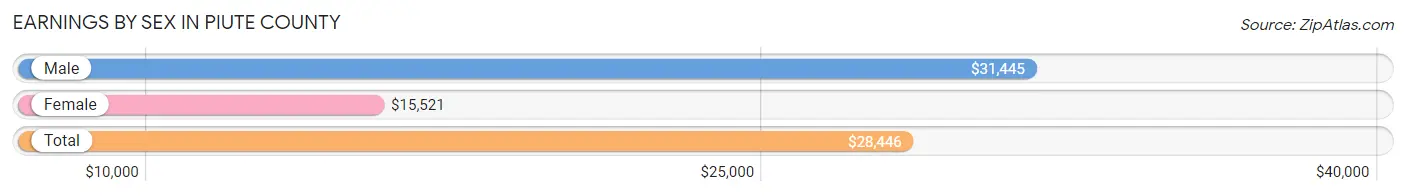
| Sex | Number | Average Earnings |
| Male | 369 (55.1%) | $31,445 |
| Female | 301 (44.9%) | $15,521 |
| Total | 670 (100.0%) | $28,446 |
Earnings by Sex by Income Bracket in Piute County
The most common earnings brackets in Piute County are $17,500 to $19,999 for men (53 | 14.4%) and $30,000 to $34,999 for women (54 | 17.9%).
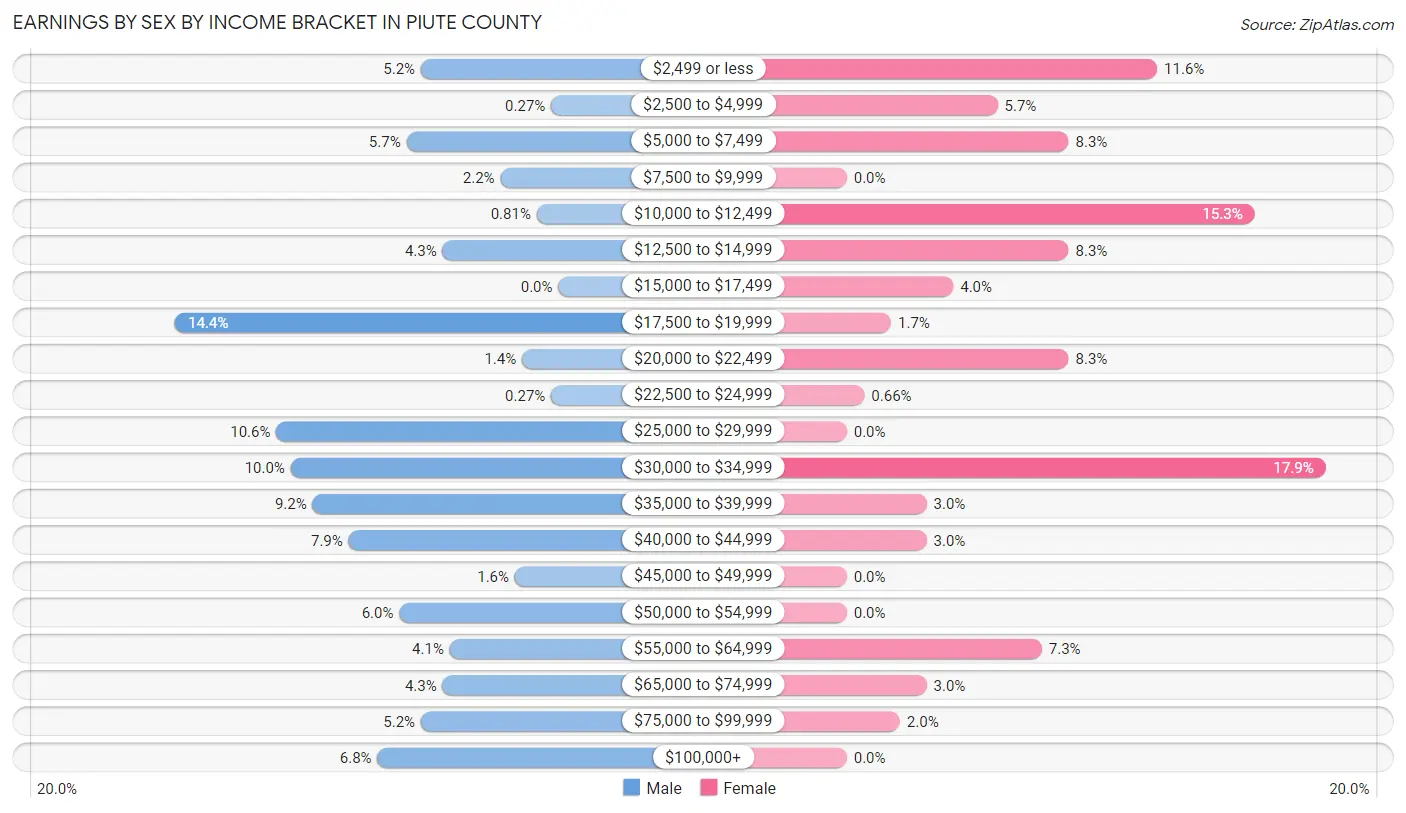
| Income | Male | Female |
| $2,499 or less | 19 (5.1%) | 35 (11.6%) |
| $2,500 to $4,999 | 1 (0.3%) | 17 (5.7%) |
| $5,000 to $7,499 | 21 (5.7%) | 25 (8.3%) |
| $7,500 to $9,999 | 8 (2.2%) | 0 (0.0%) |
| $10,000 to $12,499 | 3 (0.8%) | 46 (15.3%) |
| $12,500 to $14,999 | 16 (4.3%) | 25 (8.3%) |
| $15,000 to $17,499 | 0 (0.0%) | 12 (4.0%) |
| $17,500 to $19,999 | 53 (14.4%) | 5 (1.7%) |
| $20,000 to $22,499 | 5 (1.4%) | 25 (8.3%) |
| $22,500 to $24,999 | 1 (0.3%) | 2 (0.7%) |
| $25,000 to $29,999 | 39 (10.6%) | 0 (0.0%) |
| $30,000 to $34,999 | 37 (10.0%) | 54 (17.9%) |
| $35,000 to $39,999 | 34 (9.2%) | 9 (3.0%) |
| $40,000 to $44,999 | 29 (7.9%) | 9 (3.0%) |
| $45,000 to $49,999 | 6 (1.6%) | 0 (0.0%) |
| $50,000 to $54,999 | 22 (6.0%) | 0 (0.0%) |
| $55,000 to $64,999 | 15 (4.1%) | 22 (7.3%) |
| $65,000 to $74,999 | 16 (4.3%) | 9 (3.0%) |
| $75,000 to $99,999 | 19 (5.1%) | 6 (2.0%) |
| $100,000+ | 25 (6.8%) | 0 (0.0%) |
| Total | 369 (100.0%) | 301 (100.0%) |
Earnings by Sex by Educational Attainment in Piute County
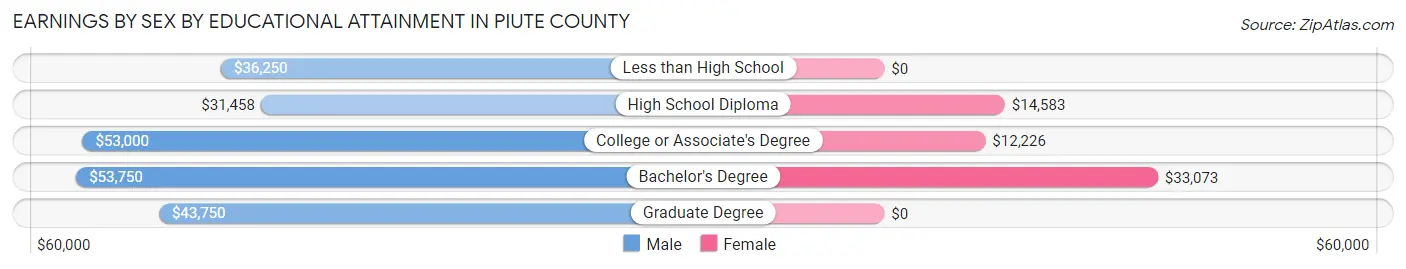
| Educational Attainment | Male Income | Female Income |
| Less than High School | $36,250 | $0 |
| High School Diploma | $31,458 | $14,583 |
| College or Associate's Degree | $53,000 | $12,226 |
| Bachelor's Degree | $53,750 | $33,073 |
| Graduate Degree | $43,750 | $0 |
| Total | $37,417 | $0 |
Family Income in Piute County
Family Income Brackets in Piute County
According to the Piute County family income data, there are 65 families falling into the $15,000 to $24,999 income range, which is the most common income bracket and makes up 18.1% of all families. Conversely, the $200,000+ income bracket is the least frequent group with only 2 families (0.6%) belonging to this category.
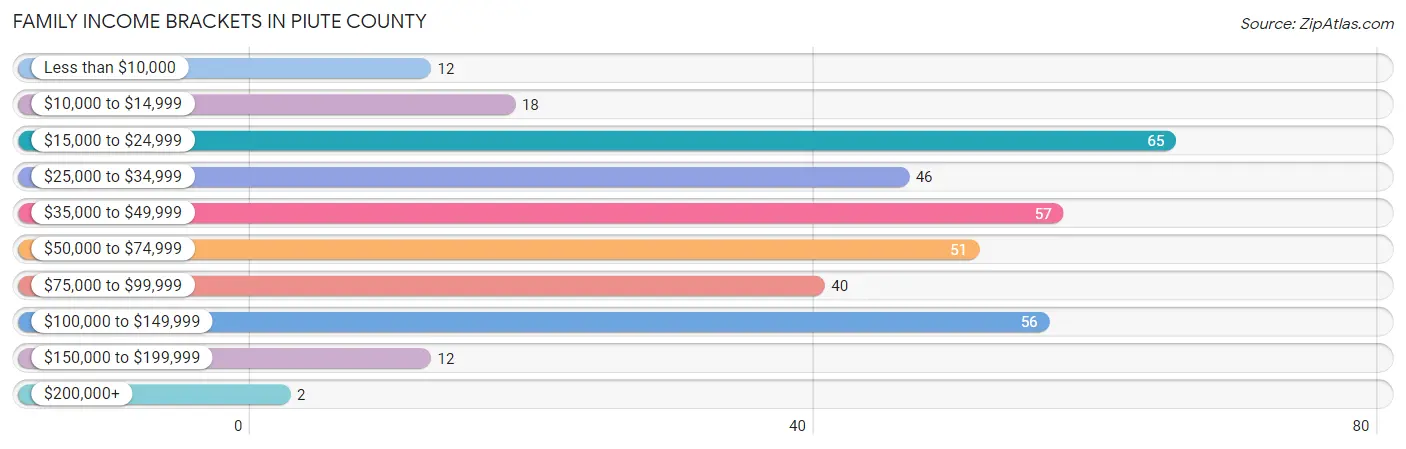
| Income Bracket | # Families | % Families |
| Less than $10,000 | 12 | 3.3% |
| $10,000 to $14,999 | 18 | 5.0% |
| $15,000 to $24,999 | 65 | 18.1% |
| $25,000 to $34,999 | 46 | 12.8% |
| $35,000 to $49,999 | 57 | 15.9% |
| $50,000 to $74,999 | 51 | 14.2% |
| $75,000 to $99,999 | 40 | 11.1% |
| $100,000 to $149,999 | 56 | 15.6% |
| $150,000 to $199,999 | 12 | 3.3% |
| $200,000+ | 2 | 0.6% |
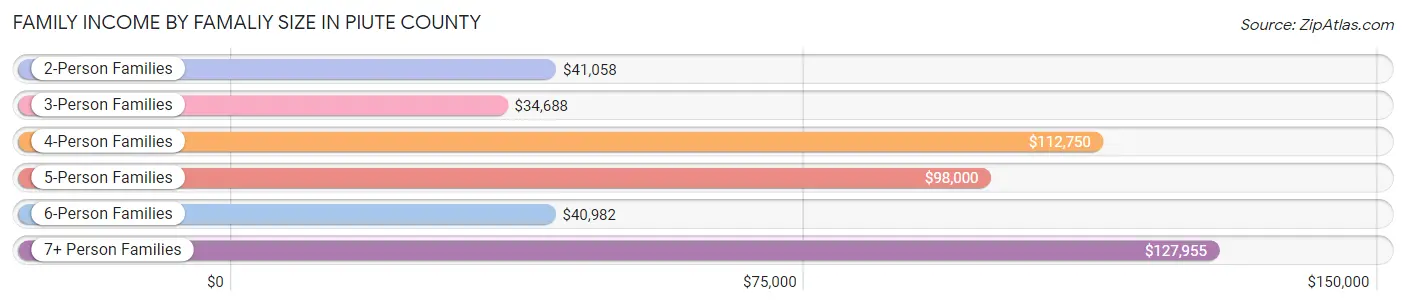
Family Income by Famaliy Size in Piute County
7+ person families (18 | 5.0%) account for the highest median family income in Piute County with $127,955 per family, while 4-person families (33 | 9.2%) have the highest median income of $28,188 per family member.
| Income Bracket | # Families | Median Income |
| 2-Person Families | 203 (56.6%) | $41,058 |
| 3-Person Families | 52 (14.5%) | $34,688 |
| 4-Person Families | 33 (9.2%) | $112,750 |
| 5-Person Families | 20 (5.6%) | $98,000 |
| 6-Person Families | 33 (9.2%) | $40,982 |
| 7+ Person Families | 18 (5.0%) | $127,955 |
| Total | 359 (100.0%) | $44,125 |
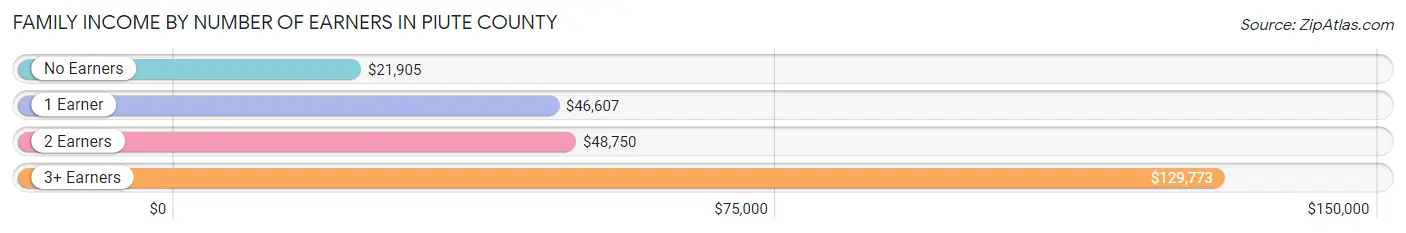
Family Income by Number of Earners in Piute County
The median family income in Piute County is $44,125, with families comprising 3+ earners (36) having the highest median family income of $129,773, while families with no earners (124) have the lowest median family income of $21,905, accounting for 10.0% and 34.5% of families, respectively.
| Number of Earners | # Families | Median Income |
| No Earners | 124 (34.5%) | $21,905 |
| 1 Earner | 113 (31.5%) | $46,607 |
| 2 Earners | 86 (24.0%) | $48,750 |
| 3+ Earners | 36 (10.0%) | $129,773 |
| Total | 359 (100.0%) | $44,125 |
Household Income in Piute County
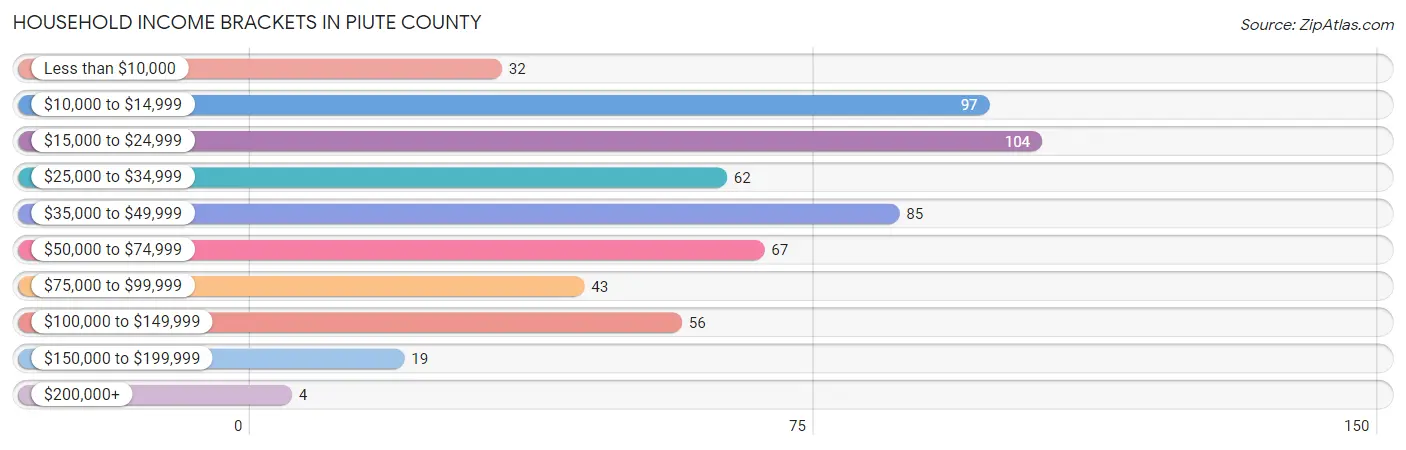
Household Income Brackets in Piute County
With 104 households falling in the category, the $15,000 to $24,999 income range is the most frequent in Piute County, accounting for 18.3% of all households. In contrast, only 4 households (0.7%) fall into the $200,000+ income bracket, making it the least populous group.
| Income Bracket | # Households | % Households |
| Less than $10,000 | 32 | 5.6% |
| $10,000 to $14,999 | 97 | 17.0% |
| $15,000 to $24,999 | 104 | 18.3% |
| $25,000 to $34,999 | 62 | 10.9% |
| $35,000 to $49,999 | 85 | 14.9% |
| $50,000 to $74,999 | 67 | 11.8% |
| $75,000 to $99,999 | 43 | 7.6% |
| $100,000 to $149,999 | 56 | 9.8% |
| $150,000 to $199,999 | 19 | 3.3% |
| $200,000+ | 4 | 0.7% |
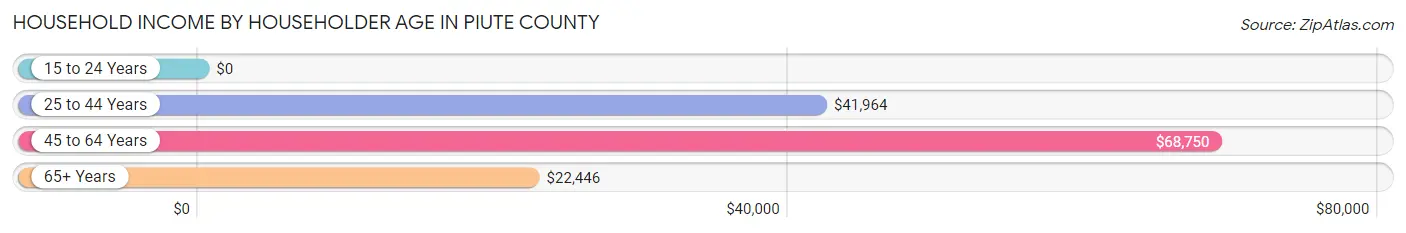
Household Income by Householder Age in Piute County
The median household income in Piute County is $33,359, with the highest median household income of $68,750 found in the 45 to 64 years age bracket for the primary householder. A total of 127 households (22.3%) fall into this category.
| Income Bracket | # Households | Median Income |
| 15 to 24 Years | 0 (0.0%) | $0 |
| 25 to 44 Years | 76 (13.4%) | $41,964 |
| 45 to 64 Years | 127 (22.3%) | $68,750 |
| 65+ Years | 366 (64.3%) | $22,446 |
| Total | 569 (100.0%) | $33,359 |
Poverty in Piute County
Income Below Poverty by Sex and Age in Piute County
With 22.3% poverty level for males and 19.3% for females among the residents of Piute County, 5 year old males and 35 to 44 year old females are the most vulnerable to poverty, with 1 males (100.0%) and 34 females (37.4%) in their respective age groups living below the poverty level.
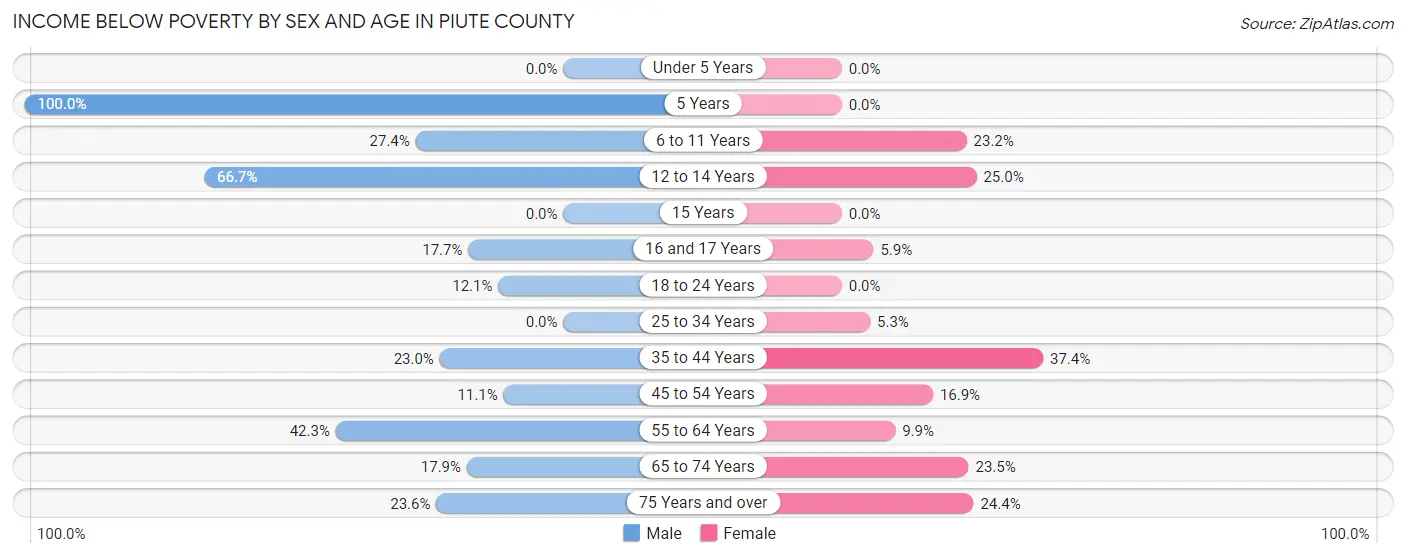
| Age Bracket | Male | Female |
| Under 5 Years | 0 (0.0%) | 0 (0.0%) |
| 5 Years | 1 (100.0%) | 0 (0.0%) |
| 6 to 11 Years | 17 (27.4%) | 19 (23.2%) |
| 12 to 14 Years | 20 (66.7%) | 9 (25.0%) |
| 15 Years | 0 (0.0%) | 0 (0.0%) |
| 16 and 17 Years | 6 (17.6%) | 1 (5.9%) |
| 18 to 24 Years | 14 (12.1%) | 0 (0.0%) |
| 25 to 34 Years | 0 (0.0%) | 1 (5.3%) |
| 35 to 44 Years | 28 (23.0%) | 34 (37.4%) |
| 45 to 54 Years | 11 (11.1%) | 11 (16.9%) |
| 55 to 64 Years | 60 (42.2%) | 11 (9.9%) |
| 65 to 74 Years | 24 (17.9%) | 40 (23.5%) |
| 75 Years and over | 25 (23.6%) | 33 (24.4%) |
| Total | 206 (22.3%) | 159 (19.3%) |
Income Above Poverty by Sex and Age in Piute County
According to the poverty statistics in Piute County, males aged under 5 years and females aged under 5 years are the age groups that are most secure financially, with 100.0% of males and 100.0% of females in these age groups living above the poverty line.
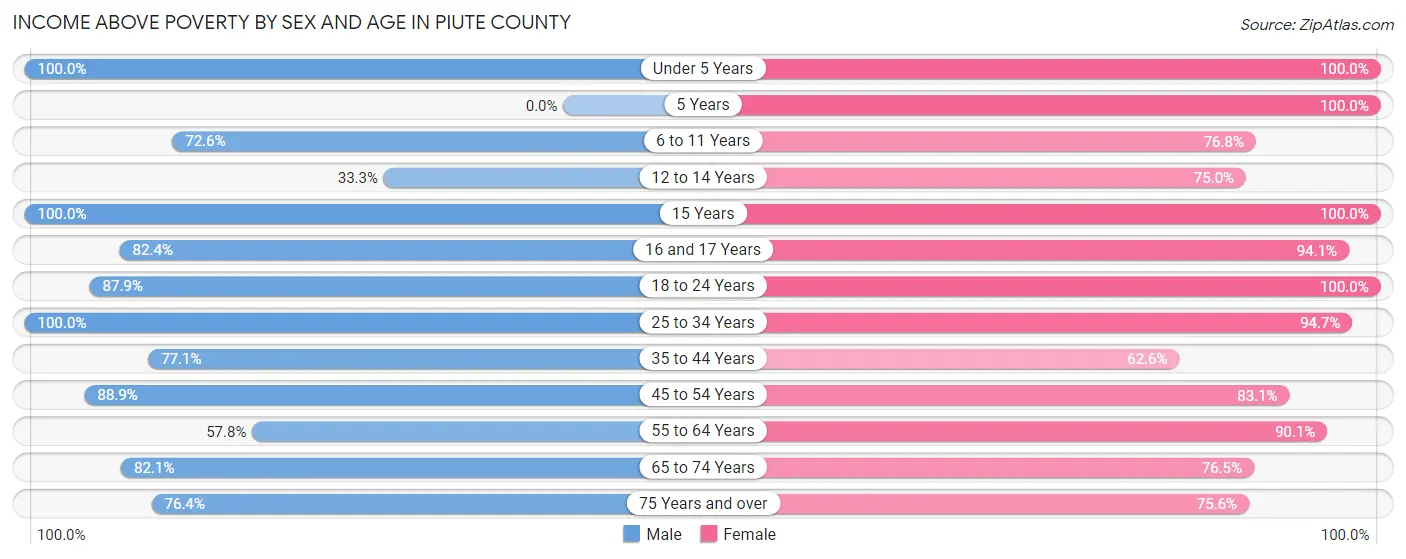
| Age Bracket | Male | Female |
| Under 5 Years | 25 (100.0%) | 25 (100.0%) |
| 5 Years | 0 (0.0%) | 5 (100.0%) |
| 6 to 11 Years | 45 (72.6%) | 63 (76.8%) |
| 12 to 14 Years | 10 (33.3%) | 27 (75.0%) |
| 15 Years | 11 (100.0%) | 3 (100.0%) |
| 16 and 17 Years | 28 (82.4%) | 16 (94.1%) |
| 18 to 24 Years | 102 (87.9%) | 65 (100.0%) |
| 25 to 34 Years | 40 (100.0%) | 18 (94.7%) |
| 35 to 44 Years | 94 (77.0%) | 57 (62.6%) |
| 45 to 54 Years | 88 (88.9%) | 54 (83.1%) |
| 55 to 64 Years | 82 (57.8%) | 100 (90.1%) |
| 65 to 74 Years | 110 (82.1%) | 130 (76.5%) |
| 75 Years and over | 81 (76.4%) | 102 (75.6%) |
| Total | 716 (77.7%) | 665 (80.7%) |
Income Below Poverty Among Married-Couple Families in Piute County
The poverty statistics for married-couple families in Piute County show that 14.4% or 44 of the total 305 families live below the poverty line. Families with 3 or 4 children have the highest poverty rate of 42.9%, comprising of 18 families. On the other hand, families with 5 or more children have the lowest poverty rate of 0.0%, which includes 0 families.
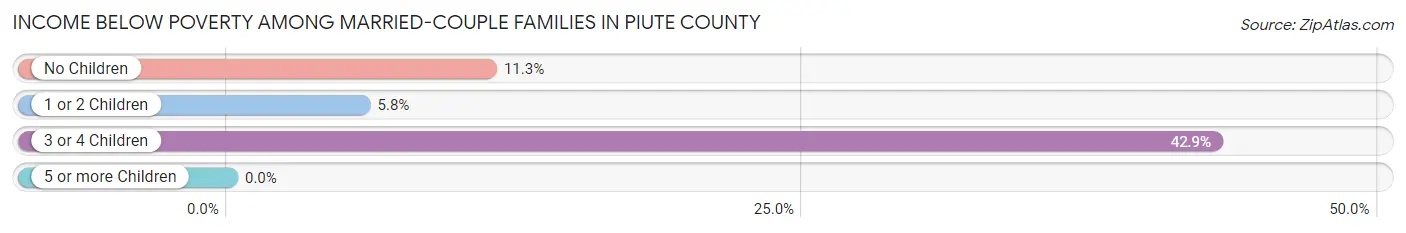
| Children | Above Poverty | Below Poverty |
| No Children | 181 (88.7%) | 23 (11.3%) |
| 1 or 2 Children | 49 (94.2%) | 3 (5.8%) |
| 3 or 4 Children | 24 (57.1%) | 18 (42.9%) |
| 5 or more Children | 7 (100.0%) | 0 (0.0%) |
| Total | 261 (85.6%) | 44 (14.4%) |
Income Below Poverty Among Single-Parent Households in Piute County
According to the poverty data in Piute County, 8.3% or 2 single-father households and 23.3% or 7 single-mother households are living below the poverty line. Among single-father households, those with no children have the highest poverty rate, with 2 households (8.3%) experiencing poverty. Likewise, among single-mother households, those with 1 or 2 children have the highest poverty rate, with 7 households (100.0%) falling below the poverty line.
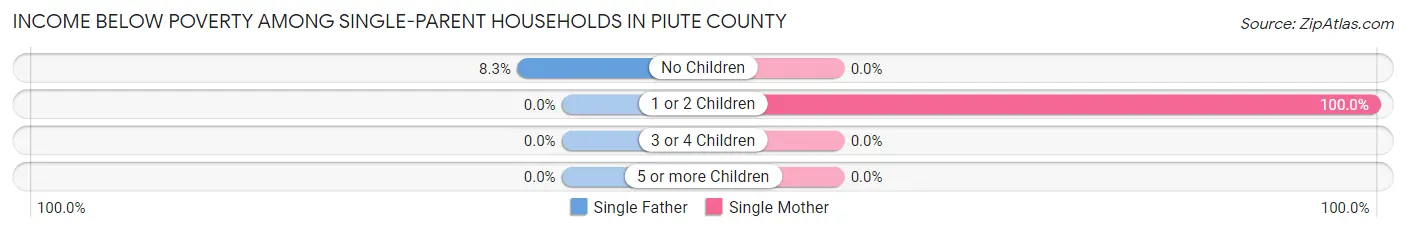
| Children | Single Father | Single Mother |
| No Children | 2 (8.3%) | 0 (0.0%) |
| 1 or 2 Children | 0 (0.0%) | 7 (100.0%) |
| 3 or 4 Children | 0 (0.0%) | 0 (0.0%) |
| 5 or more Children | 0 (0.0%) | 0 (0.0%) |
| Total | 2 (8.3%) | 7 (23.3%) |
Income Below Poverty Among Married-Couple vs Single-Parent Households in Piute County
The poverty data for Piute County shows that 44 of the married-couple family households (14.4%) and 9 of the single-parent households (16.7%) are living below the poverty level. Within the married-couple family households, those with 3 or 4 children have the highest poverty rate, with 18 households (42.9%) falling below the poverty line. Among the single-parent households, those with 1 or 2 children have the highest poverty rate, with 7 household (100.0%) living below poverty.
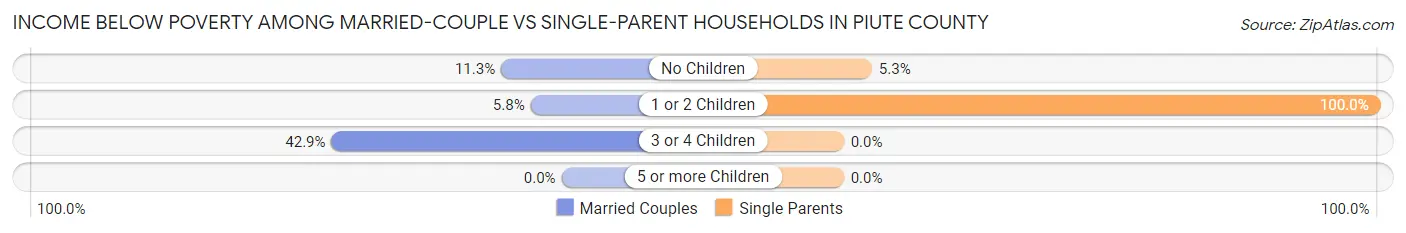
| Children | Married-Couple Families | Single-Parent Households |
| No Children | 23 (11.3%) | 2 (5.3%) |
| 1 or 2 Children | 3 (5.8%) | 7 (100.0%) |
| 3 or 4 Children | 18 (42.9%) | 0 (0.0%) |
| 5 or more Children | 0 (0.0%) | 0 (0.0%) |
| Total | 44 (14.4%) | 9 (16.7%) |
Employment Characteristics in Piute County
Employment by Class of Employer in Piute County
Among the 570 employed individuals in Piute County, private company employees (361 | 63.3%), self-employed (not incorporated) (54 | 9.5%), and state government employees (52 | 9.1%) make up the most common classes of employment.
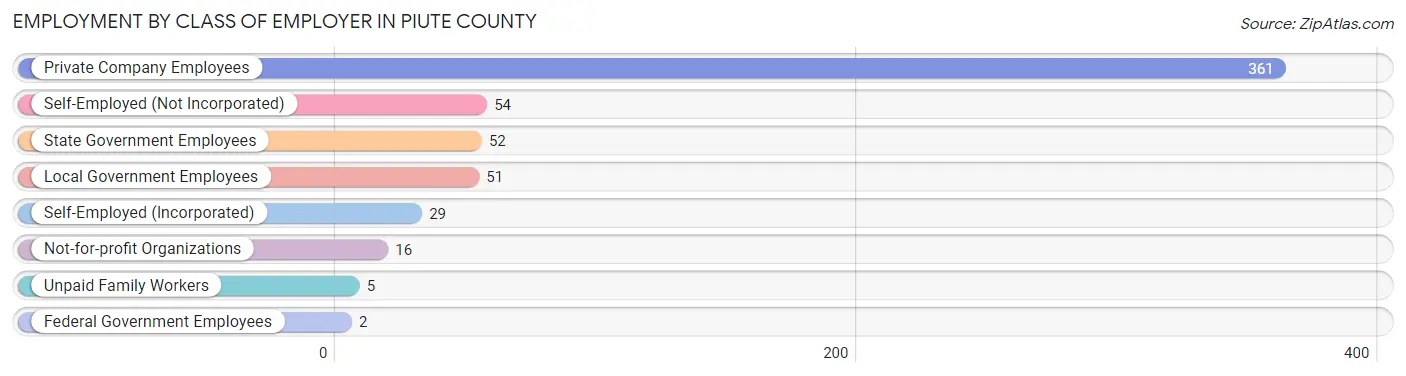
| Employer Class | # Employees | % Employees |
| Private Company Employees | 361 | 63.3% |
| Self-Employed (Incorporated) | 29 | 5.1% |
| Self-Employed (Not Incorporated) | 54 | 9.5% |
| Not-for-profit Organizations | 16 | 2.8% |
| Local Government Employees | 51 | 8.9% |
| State Government Employees | 52 | 9.1% |
| Federal Government Employees | 2 | 0.4% |
| Unpaid Family Workers | 5 | 0.9% |
| Total | 570 | 100.0% |
Employment Status by Age in Piute County
According to the labor force statistics for Piute County, out of the total population over 16 years of age (1,478), 43.0% or 636 individuals are in the labor force, with 9.1% or 58 of them unemployed. The age group with the highest labor force participation rate is 55 to 59 years, with 92.2% or 106 individuals in the labor force. Within the labor force, the 35 to 44 years age range has the highest percentage of unemployed individuals, with 24.3% or 41 of them being unemployed.
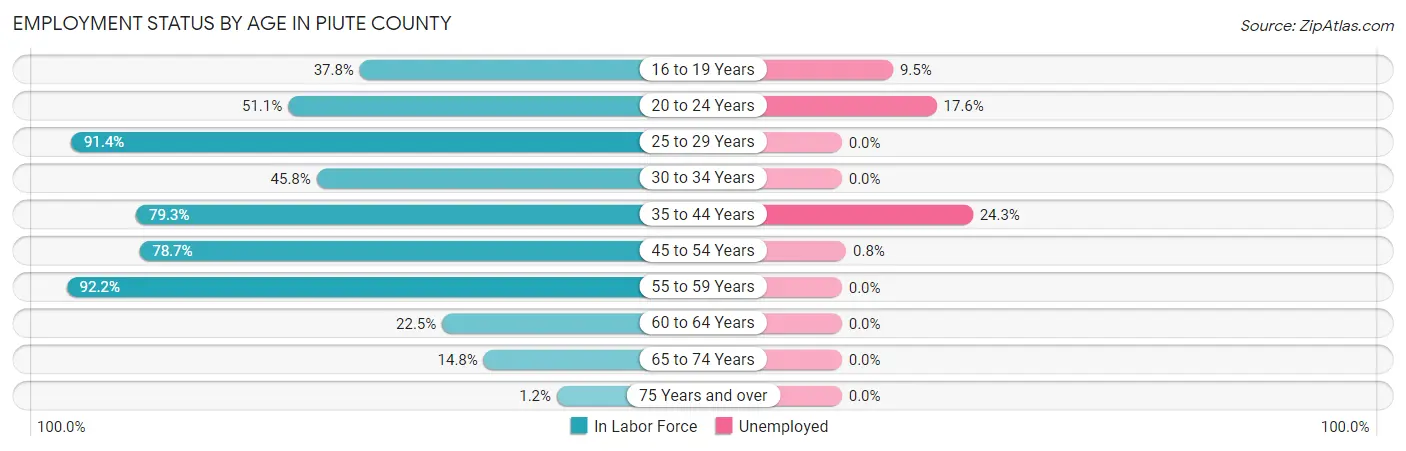
| Age Bracket | In Labor Force | Unemployed |
| 16 to 19 Years | 42 (37.8%) | 4 (9.5%) |
| 20 to 24 Years | 68 (51.1%) | 12 (17.6%) |
| 25 to 29 Years | 32 (91.4%) | 0 (0.0%) |
| 30 to 34 Years | 11 (45.8%) | 0 (0.0%) |
| 35 to 44 Years | 169 (79.3%) | 41 (24.3%) |
| 45 to 54 Years | 129 (78.7%) | 1 (0.8%) |
| 55 to 59 Years | 106 (92.2%) | 0 (0.0%) |
| 60 to 64 Years | 31 (22.5%) | 0 (0.0%) |
| 65 to 74 Years | 45 (14.8%) | 0 (0.0%) |
| 75 Years and over | 3 (1.2%) | 0 (0.0%) |
| Total | 636 (43.0%) | 58 (9.1%) |
Employment Status by Educational Attainment in Piute County
According to labor force statistics for Piute County, 69.4% of individuals (478) out of the total population between 25 and 64 years of age (689) are in the labor force, with 8.8% or 42 of them being unemployed. The group with the highest labor force participation rate are those with the educational attainment of bachelor's degree or higher, with 91.4% or 148 individuals in the labor force. Within the labor force, individuals with high school diploma education have the highest percentage of unemployment, with 27.8% or 40 of them being unemployed.
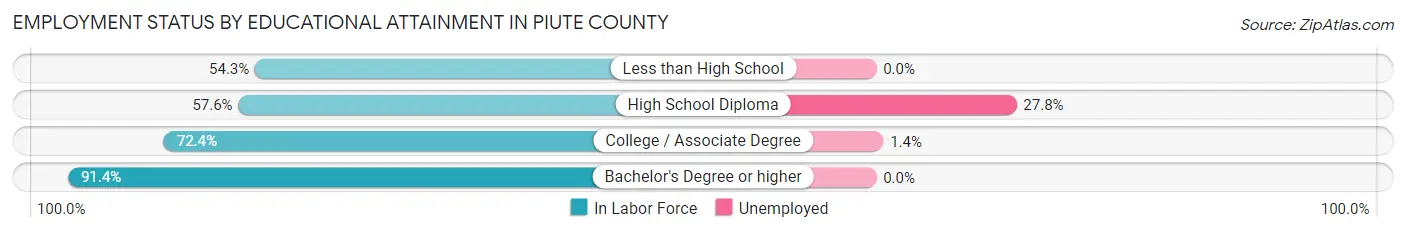
| Educational Attainment | In Labor Force | Unemployed |
| Less than High School | 44 (54.3%) | 0 (0.0%) |
| High School Diploma | 144 (57.6%) | 70 (27.8%) |
| College / Associate Degree | 142 (72.4%) | 3 (1.4%) |
| Bachelor's Degree or higher | 148 (91.4%) | 0 (0.0%) |
| Total | 478 (69.4%) | 61 (8.8%) |
Employment Occupations by Sex in Piute County
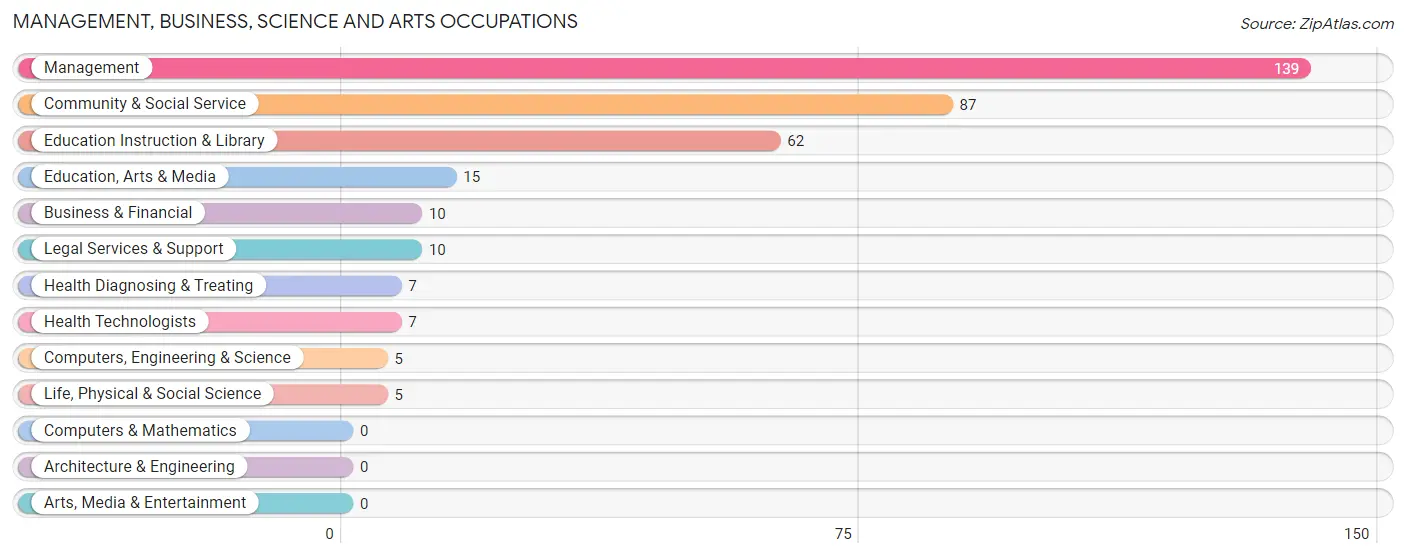
Management, Business, Science and Arts Occupations
The most common Management, Business, Science and Arts occupations in Piute County are Management (139 | 24.0%), Community & Social Service (87 | 15.0%), Education Instruction & Library (62 | 10.7%), Education, Arts & Media (15 | 2.6%), and Business & Financial (10 | 1.7%).
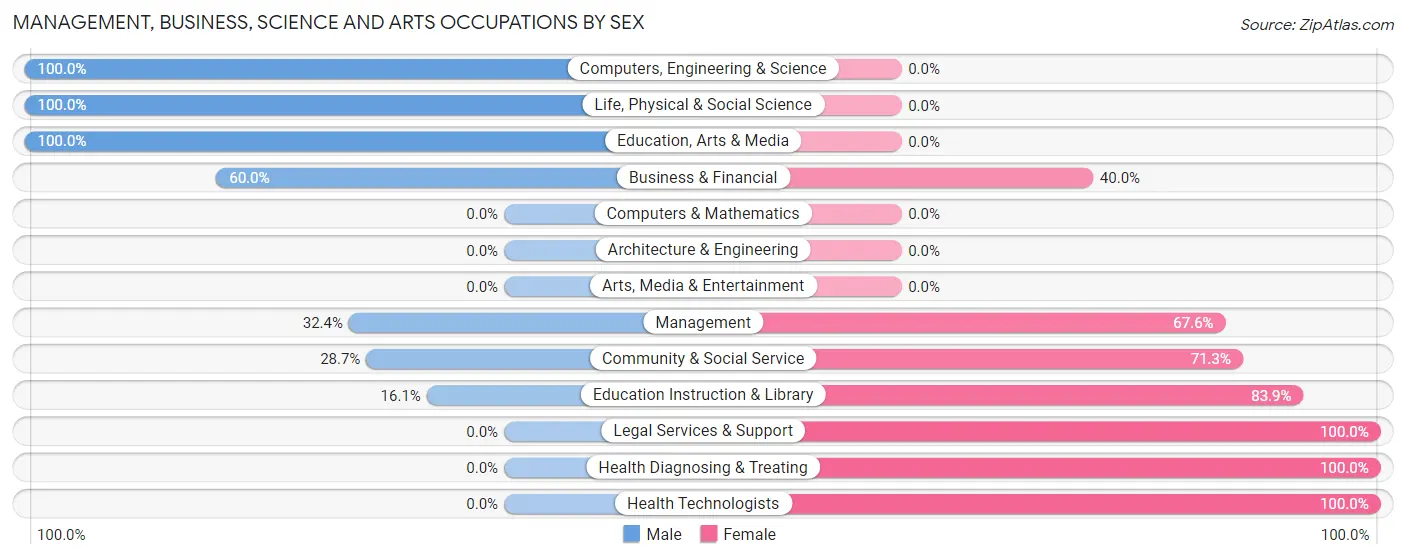
Management, Business, Science and Arts Occupations by Sex
Within the Management, Business, Science and Arts occupations in Piute County, the most male-oriented occupations are Computers, Engineering & Science (100.0%), Life, Physical & Social Science (100.0%), and Education, Arts & Media (100.0%), while the most female-oriented occupations are Legal Services & Support (100.0%), Health Diagnosing & Treating (100.0%), and Health Technologists (100.0%).
| Occupation | Male | Female |
| Management | 45 (32.4%) | 94 (67.6%) |
| Business & Financial | 6 (60.0%) | 4 (40.0%) |
| Computers, Engineering & Science | 5 (100.0%) | 0 (0.0%) |
| Computers & Mathematics | 0 (0.0%) | 0 (0.0%) |
| Architecture & Engineering | 0 (0.0%) | 0 (0.0%) |
| Life, Physical & Social Science | 5 (100.0%) | 0 (0.0%) |
| Community & Social Service | 25 (28.7%) | 62 (71.3%) |
| Education, Arts & Media | 15 (100.0%) | 0 (0.0%) |
| Legal Services & Support | 0 (0.0%) | 10 (100.0%) |
| Education Instruction & Library | 10 (16.1%) | 52 (83.9%) |
| Arts, Media & Entertainment | 0 (0.0%) | 0 (0.0%) |
| Health Diagnosing & Treating | 0 (0.0%) | 7 (100.0%) |
| Health Technologists | 0 (0.0%) | 7 (100.0%) |
| Total (Category) | 81 (32.7%) | 167 (67.3%) |
| Total (Overall) | 304 (52.6%) | 274 (47.4%) |
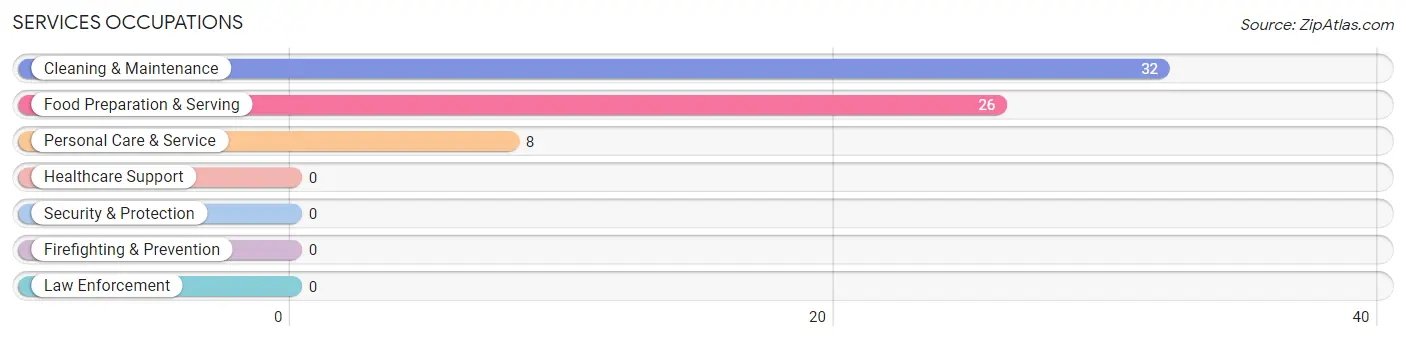
Services Occupations
The most common Services occupations in Piute County are Cleaning & Maintenance (32 | 5.5%), Food Preparation & Serving (26 | 4.5%), and Personal Care & Service (8 | 1.4%).
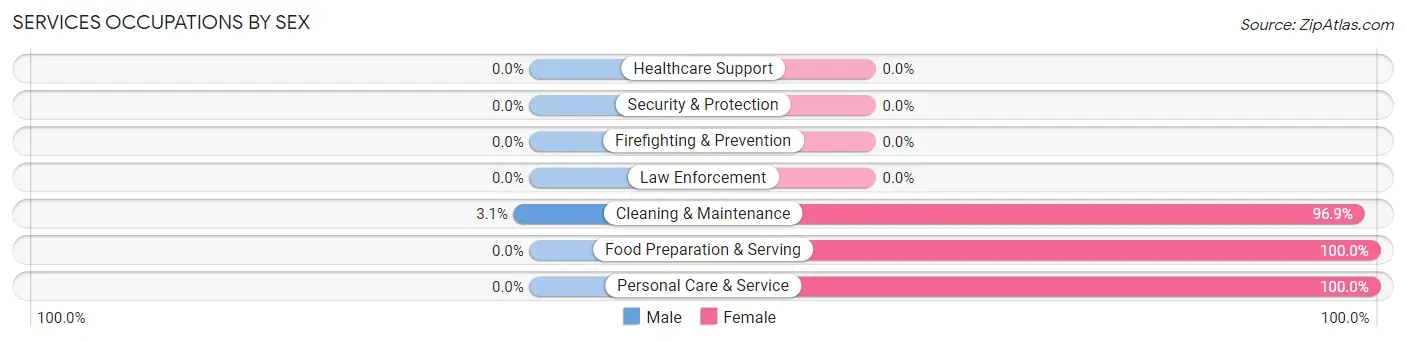
Services Occupations by Sex
| Occupation | Male | Female |
| Healthcare Support | 0 (0.0%) | 0 (0.0%) |
| Security & Protection | 0 (0.0%) | 0 (0.0%) |
| Firefighting & Prevention | 0 (0.0%) | 0 (0.0%) |
| Law Enforcement | 0 (0.0%) | 0 (0.0%) |
| Food Preparation & Serving | 0 (0.0%) | 26 (100.0%) |
| Cleaning & Maintenance | 1 (3.1%) | 31 (96.9%) |
| Personal Care & Service | 0 (0.0%) | 8 (100.0%) |
| Total (Category) | 1 (1.5%) | 65 (98.5%) |
| Total (Overall) | 304 (52.6%) | 274 (47.4%) |
Sales and Office Occupations
The most common Sales and Office occupations in Piute County are Office & Administration (31 | 5.4%), and Sales & Related (18 | 3.1%).
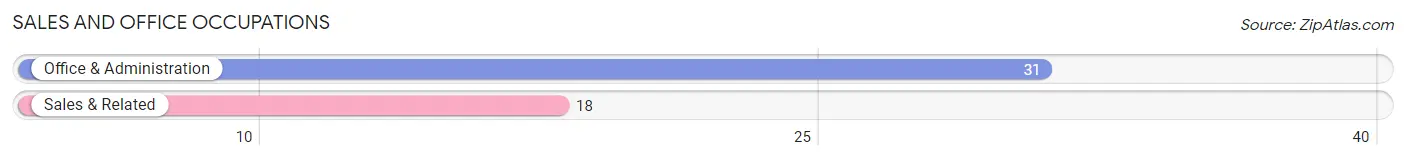
Sales and Office Occupations by Sex

| Occupation | Male | Female |
| Sales & Related | 6 (33.3%) | 12 (66.7%) |
| Office & Administration | 1 (3.2%) | 30 (96.8%) |
| Total (Category) | 7 (14.3%) | 42 (85.7%) |
| Total (Overall) | 304 (52.6%) | 274 (47.4%) |
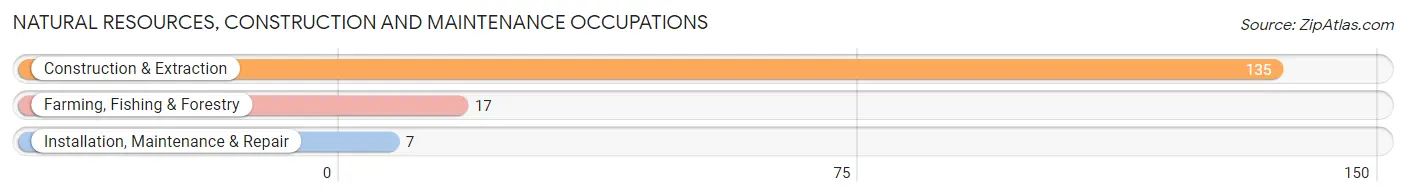
Natural Resources, Construction and Maintenance Occupations
The most common Natural Resources, Construction and Maintenance occupations in Piute County are Construction & Extraction (135 | 23.4%), Farming, Fishing & Forestry (17 | 2.9%), and Installation, Maintenance & Repair (7 | 1.2%).
Natural Resources, Construction and Maintenance Occupations by Sex
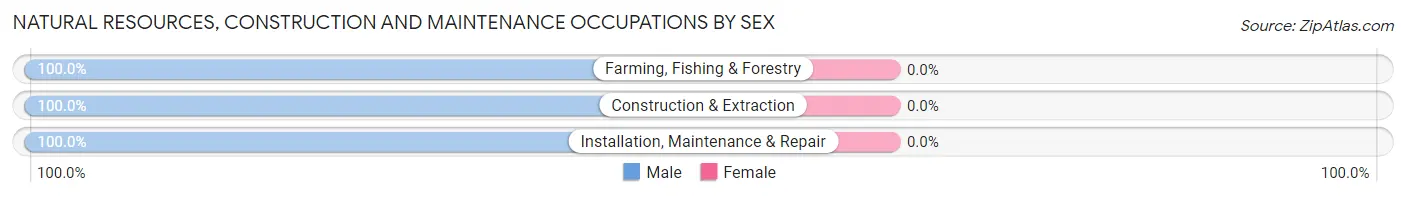
| Occupation | Male | Female |
| Farming, Fishing & Forestry | 17 (100.0%) | 0 (0.0%) |
| Construction & Extraction | 135 (100.0%) | 0 (0.0%) |
| Installation, Maintenance & Repair | 7 (100.0%) | 0 (0.0%) |
| Total (Category) | 159 (100.0%) | 0 (0.0%) |
| Total (Overall) | 304 (52.6%) | 274 (47.4%) |
Production, Transportation and Moving Occupations
The most common Production, Transportation and Moving occupations in Piute County are Production (29 | 5.0%), Transportation (18 | 3.1%), and Material Moving (9 | 1.6%).
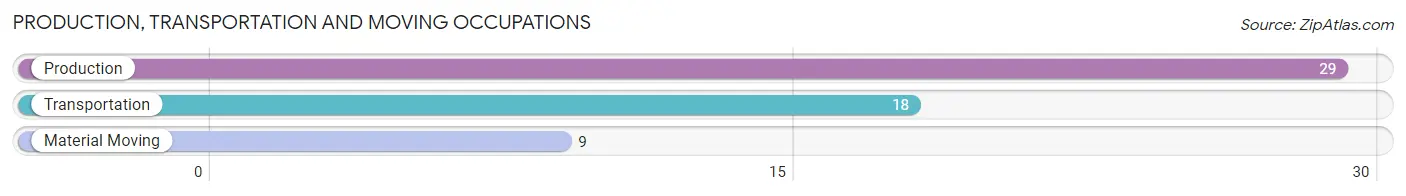
Production, Transportation and Moving Occupations by Sex
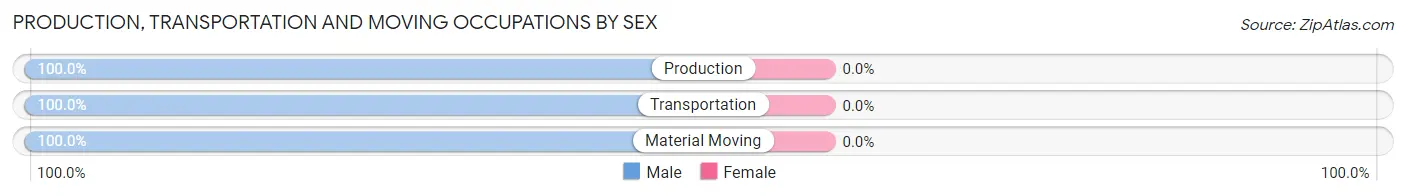
| Occupation | Male | Female |
| Production | 29 (100.0%) | 0 (0.0%) |
| Transportation | 18 (100.0%) | 0 (0.0%) |
| Material Moving | 9 (100.0%) | 0 (0.0%) |
| Total (Category) | 56 (100.0%) | 0 (0.0%) |
| Total (Overall) | 304 (52.6%) | 274 (47.4%) |
Employment Industries by Sex in Piute County
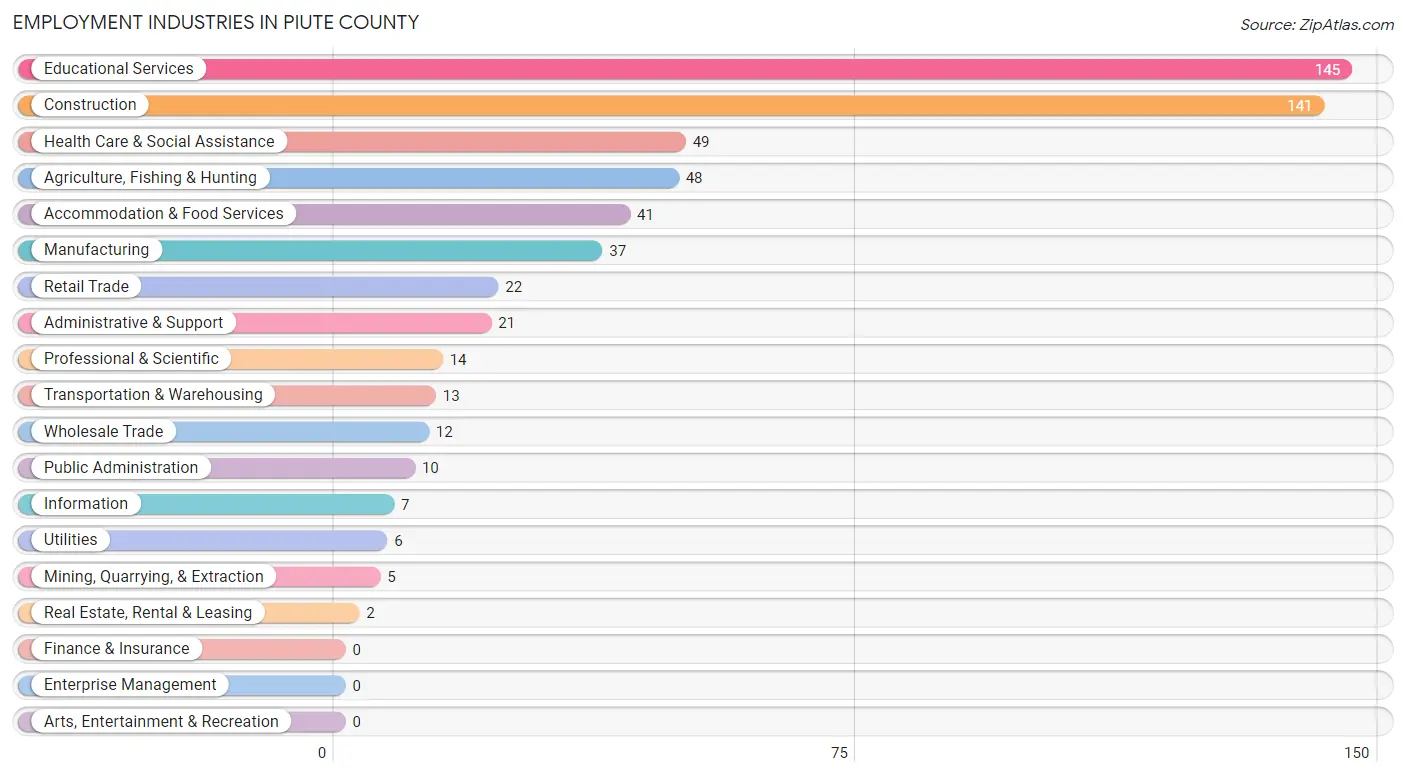
Employment Industries in Piute County
The major employment industries in Piute County include Educational Services (145 | 25.1%), Construction (141 | 24.4%), Health Care & Social Assistance (49 | 8.5%), Agriculture, Fishing & Hunting (48 | 8.3%), and Accommodation & Food Services (41 | 7.1%).
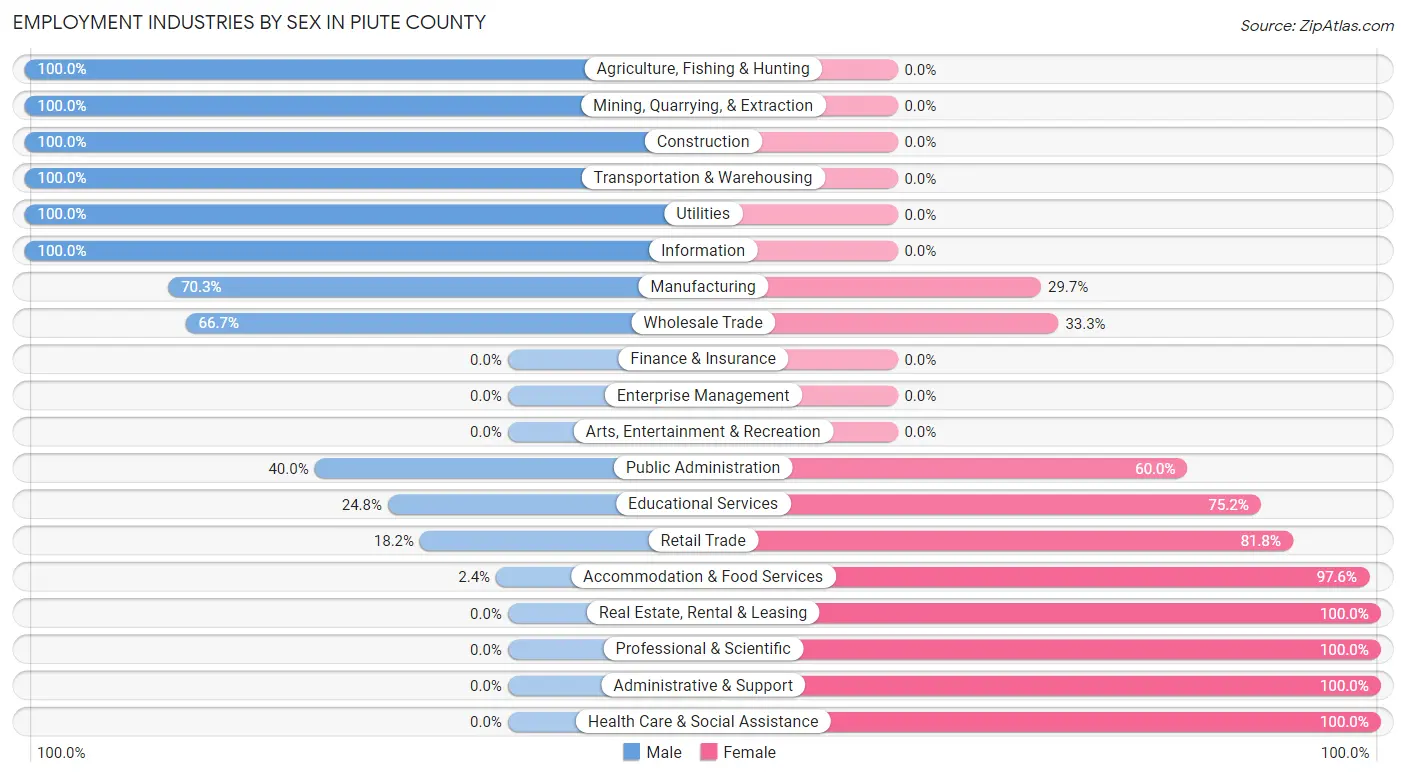
Employment Industries by Sex in Piute County
The Piute County industries that see more men than women are Agriculture, Fishing & Hunting (100.0%), Mining, Quarrying, & Extraction (100.0%), and Construction (100.0%), whereas the industries that tend to have a higher number of women are Real Estate, Rental & Leasing (100.0%), Professional & Scientific (100.0%), and Administrative & Support (100.0%).
| Industry | Male | Female |
| Agriculture, Fishing & Hunting | 48 (100.0%) | 0 (0.0%) |
| Mining, Quarrying, & Extraction | 5 (100.0%) | 0 (0.0%) |
| Construction | 141 (100.0%) | 0 (0.0%) |
| Manufacturing | 26 (70.3%) | 11 (29.7%) |
| Wholesale Trade | 8 (66.7%) | 4 (33.3%) |
| Retail Trade | 4 (18.2%) | 18 (81.8%) |
| Transportation & Warehousing | 13 (100.0%) | 0 (0.0%) |
| Utilities | 6 (100.0%) | 0 (0.0%) |
| Information | 7 (100.0%) | 0 (0.0%) |
| Finance & Insurance | 0 (0.0%) | 0 (0.0%) |
| Real Estate, Rental & Leasing | 0 (0.0%) | 2 (100.0%) |
| Professional & Scientific | 0 (0.0%) | 14 (100.0%) |
| Enterprise Management | 0 (0.0%) | 0 (0.0%) |
| Administrative & Support | 0 (0.0%) | 21 (100.0%) |
| Educational Services | 36 (24.8%) | 109 (75.2%) |
| Health Care & Social Assistance | 0 (0.0%) | 49 (100.0%) |
| Arts, Entertainment & Recreation | 0 (0.0%) | 0 (0.0%) |
| Accommodation & Food Services | 1 (2.4%) | 40 (97.6%) |
| Public Administration | 4 (40.0%) | 6 (60.0%) |
| Total | 304 (52.6%) | 274 (47.4%) |
Education in Piute County
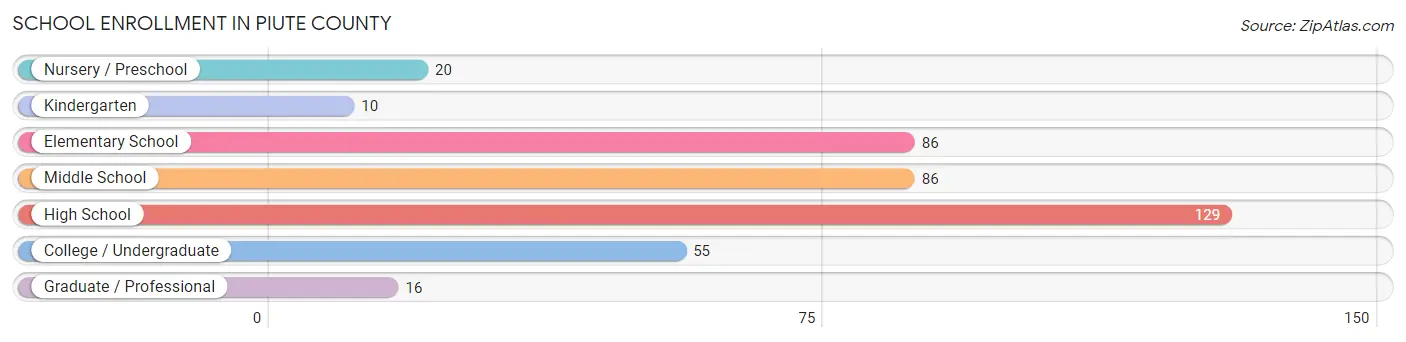
School Enrollment in Piute County
The most common levels of schooling among the 402 students in Piute County are high school (129 | 32.1%), elementary school (86 | 21.4%), and middle school (86 | 21.4%).
| School Level | # Students | % Students |
| Nursery / Preschool | 20 | 5.0% |
| Kindergarten | 10 | 2.5% |
| Elementary School | 86 | 21.4% |
| Middle School | 86 | 21.4% |
| High School | 129 | 32.1% |
| College / Undergraduate | 55 | 13.7% |
| Graduate / Professional | 16 | 4.0% |
| Total | 402 | 100.0% |
School Enrollment by Age by Funding Source in Piute County
Out of a total of 402 students who are enrolled in schools in Piute County, 34 (8.5%) attend a private institution, while the remaining 368 (91.5%) are enrolled in public schools. The age group of 35 years and over has the highest likelihood of being enrolled in private schools, with 12 (48.0% in the age bracket) enrolled. Conversely, the age group of 3 to 4 year olds has the lowest likelihood of being enrolled in a private school, with 19 (100.0% in the age bracket) attending a public institution.
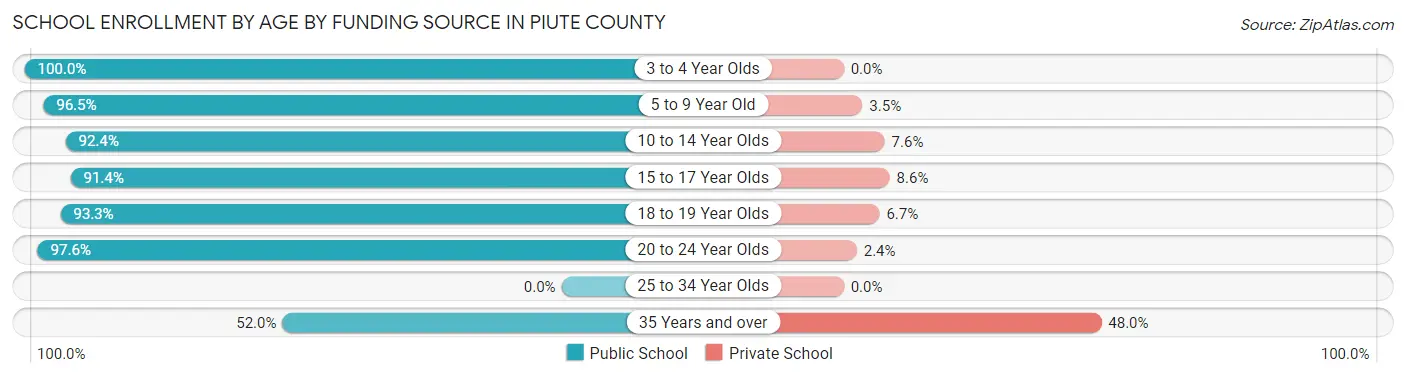
| Age Bracket | Public School | Private School |
| 3 to 4 Year Olds | 19 (100.0%) | 0 (0.0%) |
| 5 to 9 Year Old | 83 (96.5%) | 3 (3.5%) |
| 10 to 14 Year Olds | 121 (92.4%) | 10 (7.6%) |
| 15 to 17 Year Olds | 64 (91.4%) | 6 (8.6%) |
| 18 to 19 Year Olds | 28 (93.3%) | 2 (6.7%) |
| 20 to 24 Year Olds | 40 (97.6%) | 1 (2.4%) |
| 25 to 34 Year Olds | 0 (0.0%) | 0 (0.0%) |
| 35 Years and over | 13 (52.0%) | 12 (48.0%) |
| Total | 368 (91.5%) | 34 (8.5%) |
Educational Attainment by Field of Study in Piute County
Science & technology (69 | 28.3%), education (69 | 28.3%), business (34 | 13.9%), liberal arts & history (19 | 7.8%), and computers & mathematics (18 | 7.4%) are the most common fields of study among 244 individuals in Piute County who have obtained a bachelor's degree or higher.
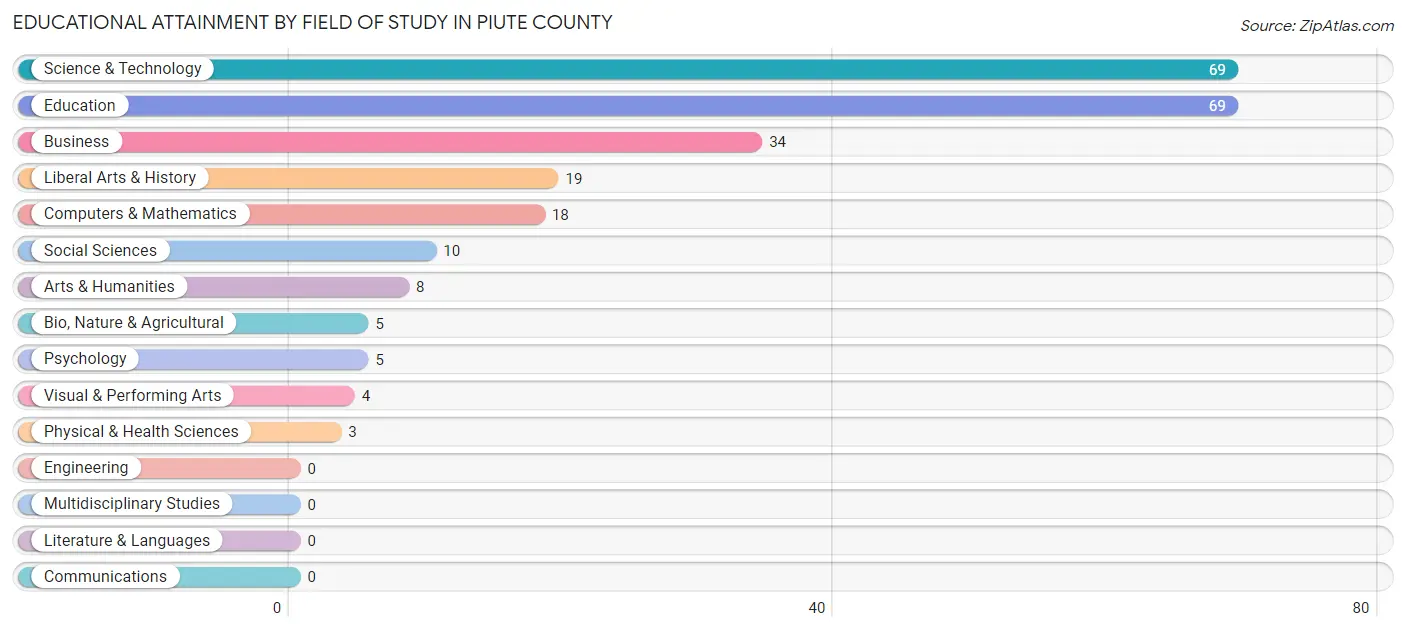
| Field of Study | # Graduates | % Graduates |
| Computers & Mathematics | 18 | 7.4% |
| Bio, Nature & Agricultural | 5 | 2.1% |
| Physical & Health Sciences | 3 | 1.2% |
| Psychology | 5 | 2.1% |
| Social Sciences | 10 | 4.1% |
| Engineering | 0 | 0.0% |
| Multidisciplinary Studies | 0 | 0.0% |
| Science & Technology | 69 | 28.3% |
| Business | 34 | 13.9% |
| Education | 69 | 28.3% |
| Literature & Languages | 0 | 0.0% |
| Liberal Arts & History | 19 | 7.8% |
| Visual & Performing Arts | 4 | 1.6% |
| Communications | 0 | 0.0% |
| Arts & Humanities | 8 | 3.3% |
| Total | 244 | 100.0% |
Transportation & Commute in Piute County
Vehicle Availability by Sex in Piute County
The most prevalent vehicle ownership categories in Piute County are males with 5 or more vehicles (136, accounting for 45.8%) and females with 5 or more vehicles (35, making up 49.8%).
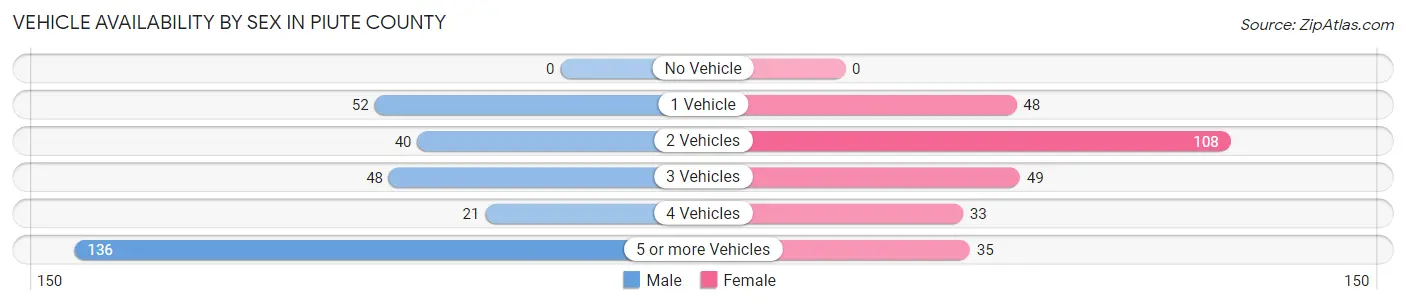
| Vehicles Available | Male | Female |
| No Vehicle | 0 (0.0%) | 0 (0.0%) |
| 1 Vehicle | 52 (17.5%) | 48 (17.6%) |
| 2 Vehicles | 40 (13.5%) | 108 (39.6%) |
| 3 Vehicles | 48 (16.2%) | 49 (17.9%) |
| 4 Vehicles | 21 (7.1%) | 33 (12.1%) |
| 5 or more Vehicles | 136 (45.8%) | 35 (12.8%) |
| Total | 297 (100.0%) | 273 (100.0%) |
Commute Time in Piute County
The most frequently occuring commute durations in Piute County are 30 to 34 minutes (113 commuters, 25.5%), less than 5 minutes (101 commuters, 22.8%), and 5 to 9 minutes (90 commuters, 20.3%).
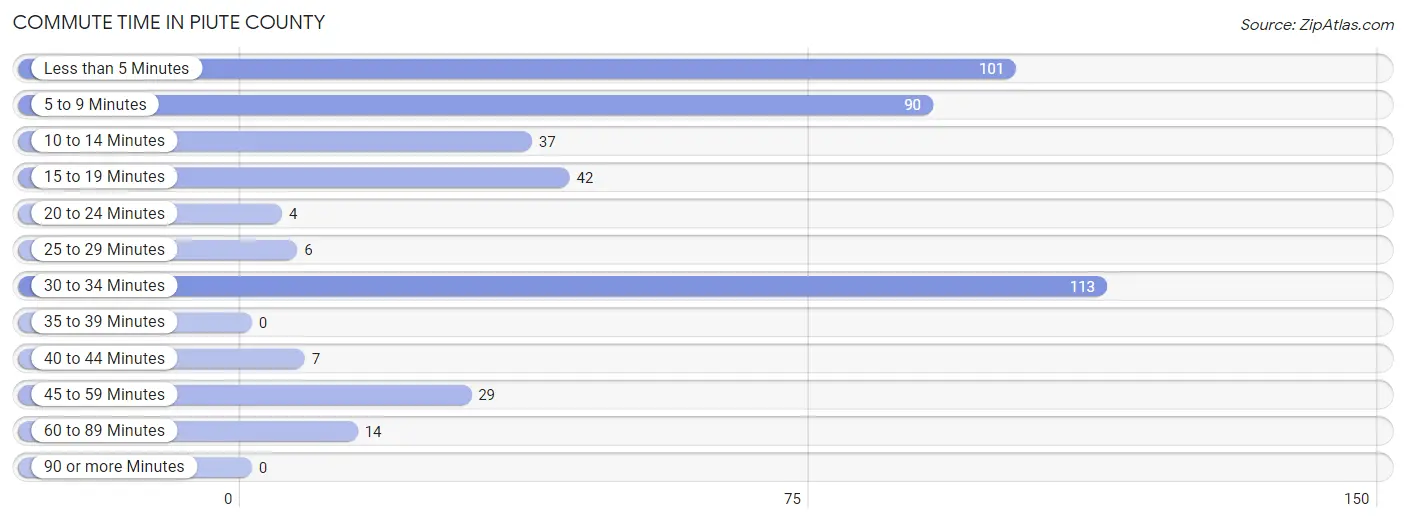
| Commute Time | # Commuters | % Commuters |
| Less than 5 Minutes | 101 | 22.8% |
| 5 to 9 Minutes | 90 | 20.3% |
| 10 to 14 Minutes | 37 | 8.4% |
| 15 to 19 Minutes | 42 | 9.5% |
| 20 to 24 Minutes | 4 | 0.9% |
| 25 to 29 Minutes | 6 | 1.3% |
| 30 to 34 Minutes | 113 | 25.5% |
| 35 to 39 Minutes | 0 | 0.0% |
| 40 to 44 Minutes | 7 | 1.6% |
| 45 to 59 Minutes | 29 | 6.6% |
| 60 to 89 Minutes | 14 | 3.2% |
| 90 or more Minutes | 0 | 0.0% |
Commute Time by Sex in Piute County
The most common commute times in Piute County are less than 5 minutes (60 commuters, 27.2%) for males and 30 to 34 minutes (76 commuters, 34.2%) for females.
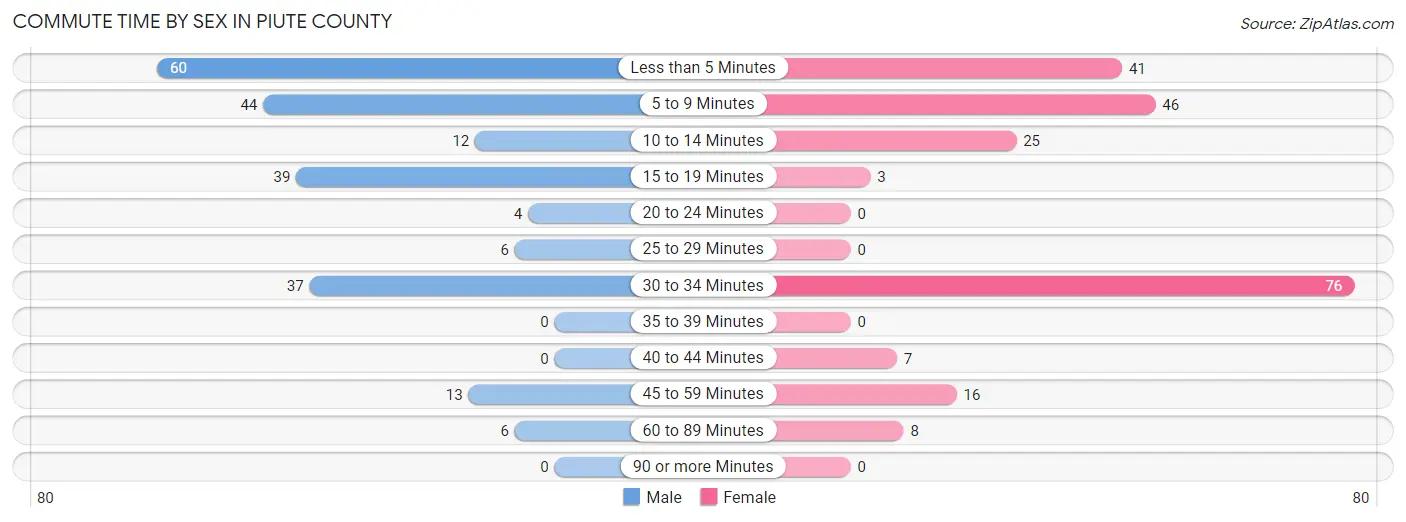
| Commute Time | Male | Female |
| Less than 5 Minutes | 60 (27.2%) | 41 (18.5%) |
| 5 to 9 Minutes | 44 (19.9%) | 46 (20.7%) |
| 10 to 14 Minutes | 12 (5.4%) | 25 (11.3%) |
| 15 to 19 Minutes | 39 (17.6%) | 3 (1.3%) |
| 20 to 24 Minutes | 4 (1.8%) | 0 (0.0%) |
| 25 to 29 Minutes | 6 (2.7%) | 0 (0.0%) |
| 30 to 34 Minutes | 37 (16.7%) | 76 (34.2%) |
| 35 to 39 Minutes | 0 (0.0%) | 0 (0.0%) |
| 40 to 44 Minutes | 0 (0.0%) | 7 (3.2%) |
| 45 to 59 Minutes | 13 (5.9%) | 16 (7.2%) |
| 60 to 89 Minutes | 6 (2.7%) | 8 (3.6%) |
| 90 or more Minutes | 0 (0.0%) | 0 (0.0%) |
Time of Departure to Work by Sex in Piute County
The most frequent times of departure to work in Piute County are 7:30 AM to 7:59 AM (46, 20.8%) for males and 8:00 AM to 8:29 AM (81, 36.5%) for females.
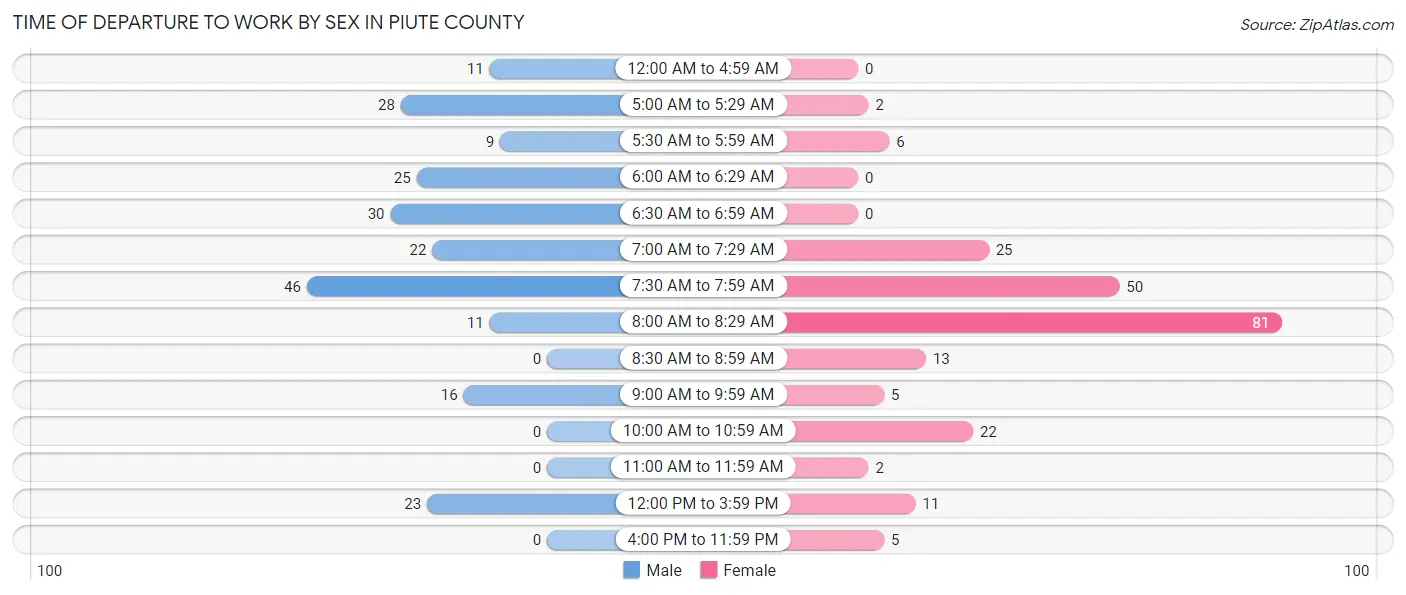
| Time of Departure | Male | Female |
| 12:00 AM to 4:59 AM | 11 (5.0%) | 0 (0.0%) |
| 5:00 AM to 5:29 AM | 28 (12.7%) | 2 (0.9%) |
| 5:30 AM to 5:59 AM | 9 (4.1%) | 6 (2.7%) |
| 6:00 AM to 6:29 AM | 25 (11.3%) | 0 (0.0%) |
| 6:30 AM to 6:59 AM | 30 (13.6%) | 0 (0.0%) |
| 7:00 AM to 7:29 AM | 22 (10.0%) | 25 (11.3%) |
| 7:30 AM to 7:59 AM | 46 (20.8%) | 50 (22.5%) |
| 8:00 AM to 8:29 AM | 11 (5.0%) | 81 (36.5%) |
| 8:30 AM to 8:59 AM | 0 (0.0%) | 13 (5.9%) |
| 9:00 AM to 9:59 AM | 16 (7.2%) | 5 (2.2%) |
| 10:00 AM to 10:59 AM | 0 (0.0%) | 22 (9.9%) |
| 11:00 AM to 11:59 AM | 0 (0.0%) | 2 (0.9%) |
| 12:00 PM to 3:59 PM | 23 (10.4%) | 11 (5.0%) |
| 4:00 PM to 11:59 PM | 0 (0.0%) | 5 (2.2%) |
| Total | 221 (100.0%) | 222 (100.0%) |
Housing Occupancy in Piute County
Occupancy by Ownership in Piute County
Of the total 569 dwellings in Piute County, owner-occupied units account for 518 (91.0%), while renter-occupied units make up 51 (9.0%).
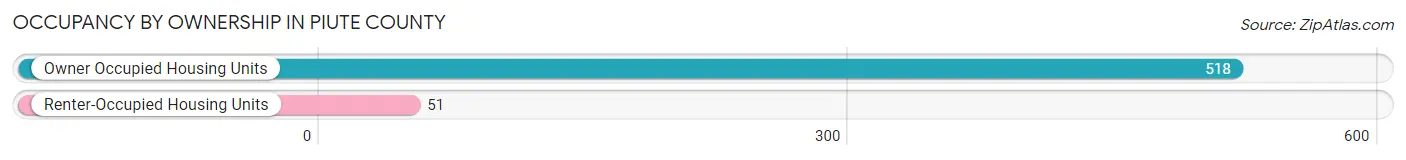
| Occupancy | # Housing Units | % Housing Units |
| Owner Occupied Housing Units | 518 | 91.0% |
| Renter-Occupied Housing Units | 51 | 9.0% |
| Total Occupied Housing Units | 569 | 100.0% |
Occupancy by Household Size in Piute County
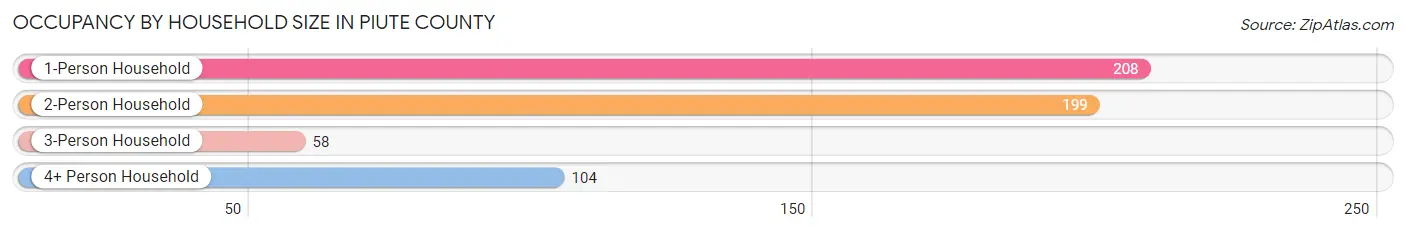
| Household Size | # Housing Units | % Housing Units |
| 1-Person Household | 208 | 36.6% |
| 2-Person Household | 199 | 35.0% |
| 3-Person Household | 58 | 10.2% |
| 4+ Person Household | 104 | 18.3% |
| Total Housing Units | 569 | 100.0% |
Occupancy by Ownership by Household Size in Piute County
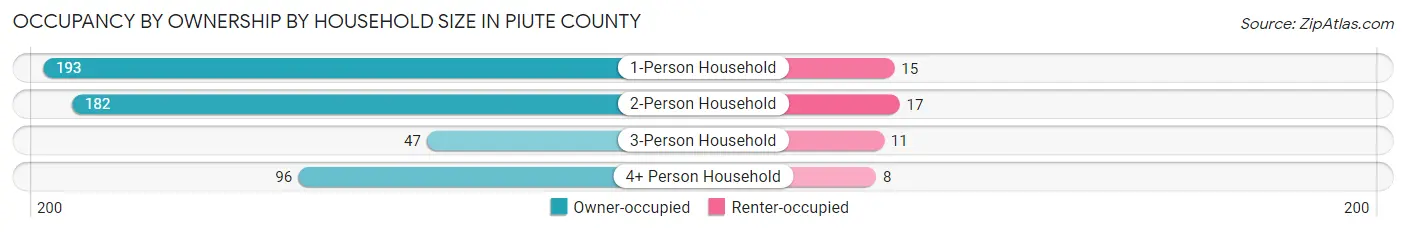
| Household Size | Owner-occupied | Renter-occupied |
| 1-Person Household | 193 (92.8%) | 15 (7.2%) |
| 2-Person Household | 182 (91.5%) | 17 (8.5%) |
| 3-Person Household | 47 (81.0%) | 11 (19.0%) |
| 4+ Person Household | 96 (92.3%) | 8 (7.7%) |
| Total Housing Units | 518 (91.0%) | 51 (9.0%) |
Occupancy by Educational Attainment in Piute County
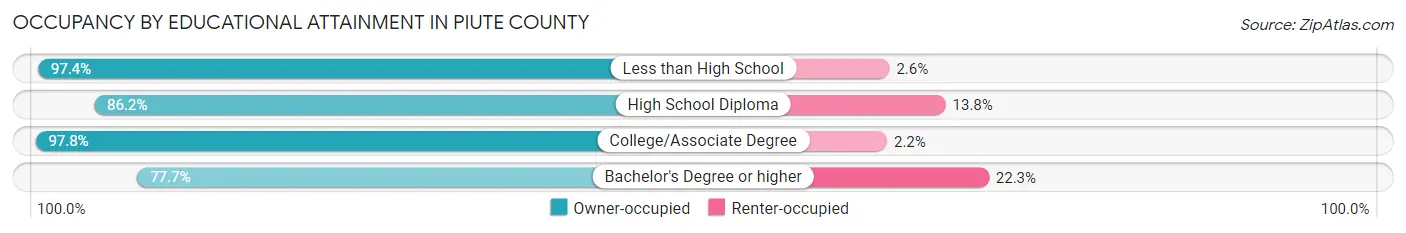
| Household Size | Owner-occupied | Renter-occupied |
| Less than High School | 74 (97.4%) | 2 (2.6%) |
| High School Diploma | 144 (86.2%) | 23 (13.8%) |
| College/Associate Degree | 227 (97.8%) | 5 (2.2%) |
| Bachelor's Degree or higher | 73 (77.7%) | 21 (22.3%) |
Occupancy by Age of Householder in Piute County
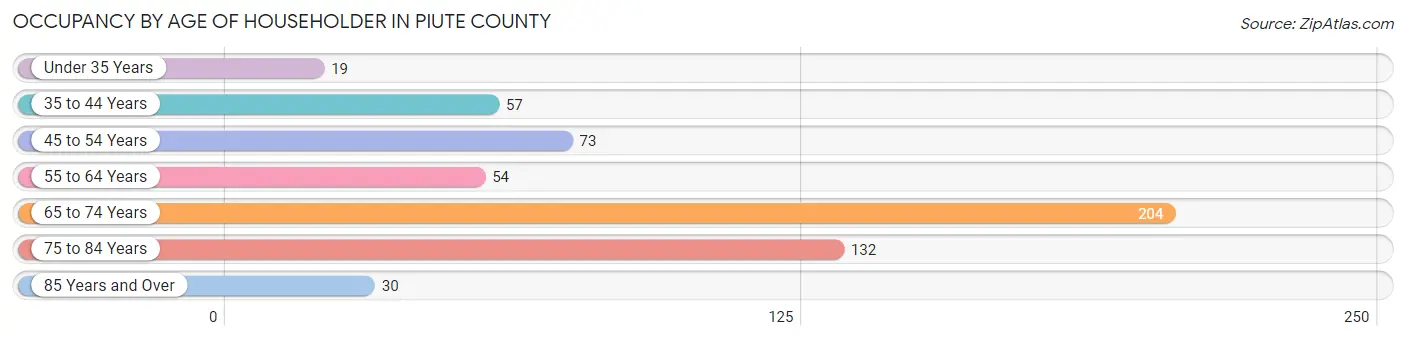
| Age Bracket | # Households | % Households |
| Under 35 Years | 19 | 3.3% |
| 35 to 44 Years | 57 | 10.0% |
| 45 to 54 Years | 73 | 12.8% |
| 55 to 64 Years | 54 | 9.5% |
| 65 to 74 Years | 204 | 35.8% |
| 75 to 84 Years | 132 | 23.2% |
| 85 Years and Over | 30 | 5.3% |
| Total | 569 | 100.0% |
Housing Finances in Piute County
Median Income by Occupancy in Piute County
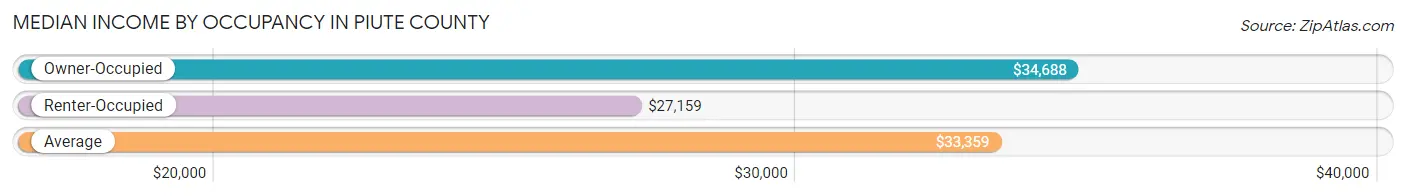
| Occupancy Type | # Households | Median Income |
| Owner-Occupied | 518 (91.0%) | $34,688 |
| Renter-Occupied | 51 (9.0%) | $27,159 |
| Average | 569 (100.0%) | $33,359 |
Occupancy by Householder Income Bracket in Piute County
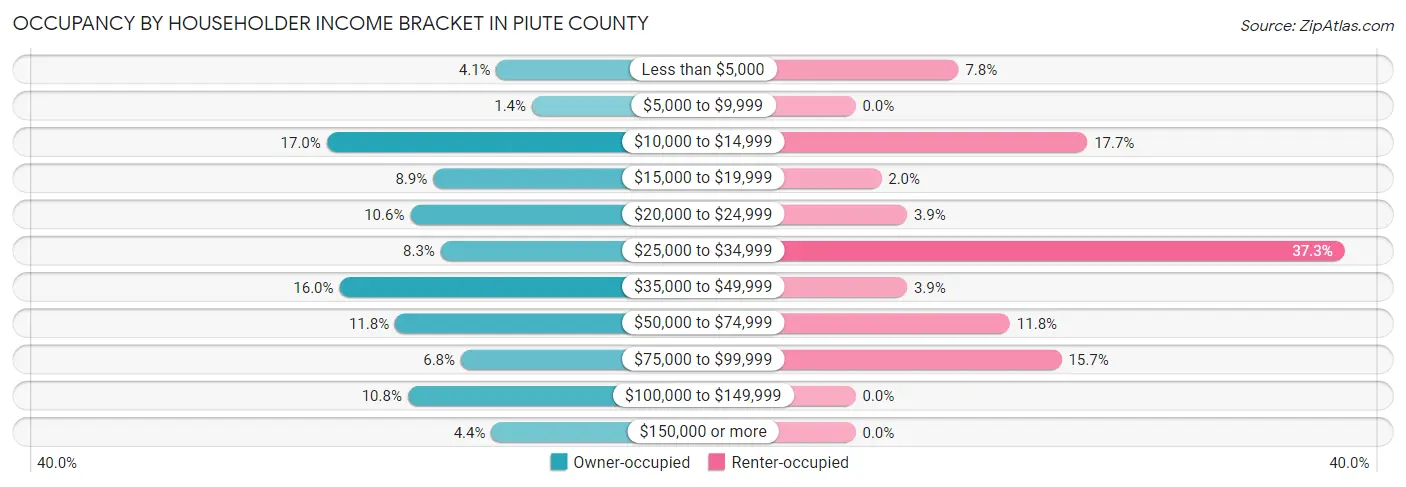
| Income Bracket | Owner-occupied | Renter-occupied |
| Less than $5,000 | 21 (4.1%) | 4 (7.8%) |
| $5,000 to $9,999 | 7 (1.3%) | 0 (0.0%) |
| $10,000 to $14,999 | 88 (17.0%) | 9 (17.6%) |
| $15,000 to $19,999 | 46 (8.9%) | 1 (2.0%) |
| $20,000 to $24,999 | 55 (10.6%) | 2 (3.9%) |
| $25,000 to $34,999 | 43 (8.3%) | 19 (37.2%) |
| $35,000 to $49,999 | 83 (16.0%) | 2 (3.9%) |
| $50,000 to $74,999 | 61 (11.8%) | 6 (11.8%) |
| $75,000 to $99,999 | 35 (6.8%) | 8 (15.7%) |
| $100,000 to $149,999 | 56 (10.8%) | 0 (0.0%) |
| $150,000 or more | 23 (4.4%) | 0 (0.0%) |
| Total | 518 (100.0%) | 51 (100.0%) |
Monthly Housing Cost Tiers in Piute County
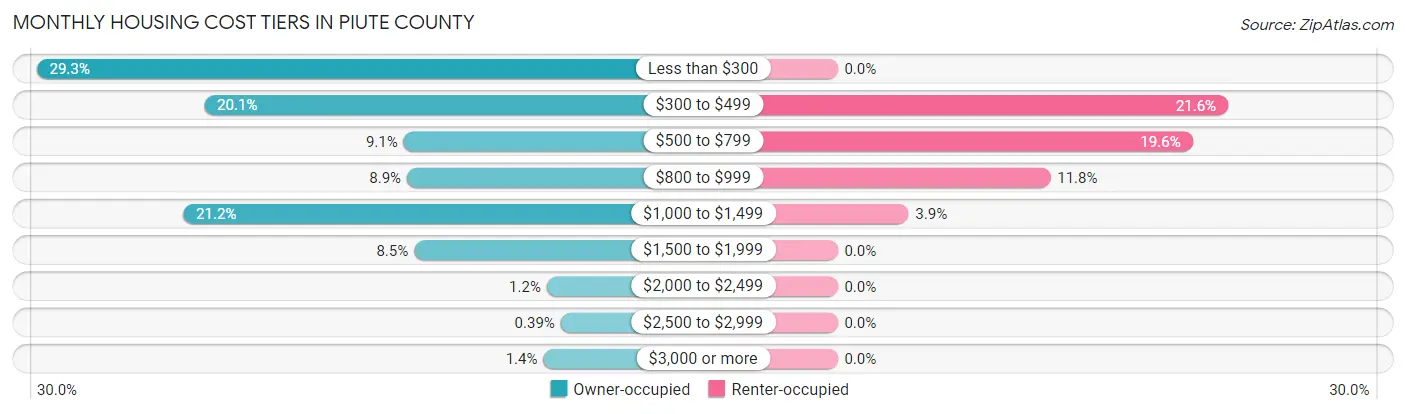
| Monthly Cost | Owner-occupied | Renter-occupied |
| Less than $300 | 152 (29.3%) | 0 (0.0%) |
| $300 to $499 | 104 (20.1%) | 11 (21.6%) |
| $500 to $799 | 47 (9.1%) | 10 (19.6%) |
| $800 to $999 | 46 (8.9%) | 6 (11.8%) |
| $1,000 to $1,499 | 110 (21.2%) | 2 (3.9%) |
| $1,500 to $1,999 | 44 (8.5%) | 0 (0.0%) |
| $2,000 to $2,499 | 6 (1.2%) | 0 (0.0%) |
| $2,500 to $2,999 | 2 (0.4%) | 0 (0.0%) |
| $3,000 or more | 7 (1.3%) | 0 (0.0%) |
| Total | 518 (100.0%) | 51 (100.0%) |
Physical Housing Characteristics in Piute County
Housing Structures in Piute County
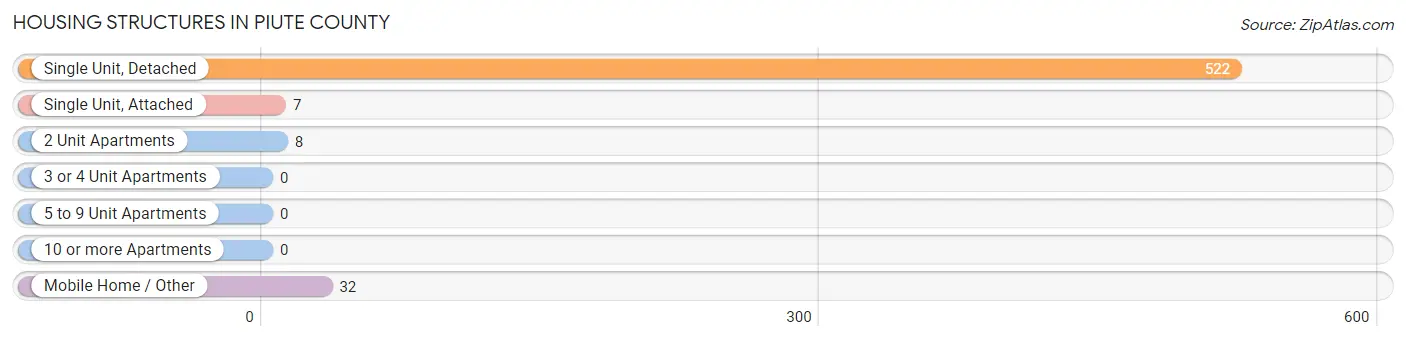
| Structure Type | # Housing Units | % Housing Units |
| Single Unit, Detached | 522 | 91.7% |
| Single Unit, Attached | 7 | 1.2% |
| 2 Unit Apartments | 8 | 1.4% |
| 3 or 4 Unit Apartments | 0 | 0.0% |
| 5 to 9 Unit Apartments | 0 | 0.0% |
| 10 or more Apartments | 0 | 0.0% |
| Mobile Home / Other | 32 | 5.6% |
| Total | 569 | 100.0% |
Housing Structures by Occupancy in Piute County
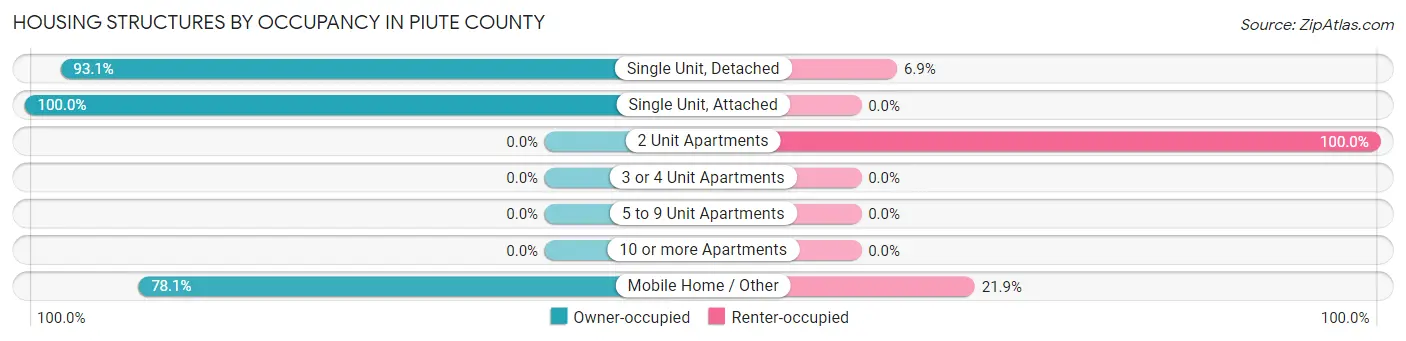
| Structure Type | Owner-occupied | Renter-occupied |
| Single Unit, Detached | 486 (93.1%) | 36 (6.9%) |
| Single Unit, Attached | 7 (100.0%) | 0 (0.0%) |
| 2 Unit Apartments | 0 (0.0%) | 8 (100.0%) |
| 3 or 4 Unit Apartments | 0 (0.0%) | 0 (0.0%) |
| 5 to 9 Unit Apartments | 0 (0.0%) | 0 (0.0%) |
| 10 or more Apartments | 0 (0.0%) | 0 (0.0%) |
| Mobile Home / Other | 25 (78.1%) | 7 (21.9%) |
| Total | 518 (91.0%) | 51 (9.0%) |
Housing Structures by Number of Rooms in Piute County
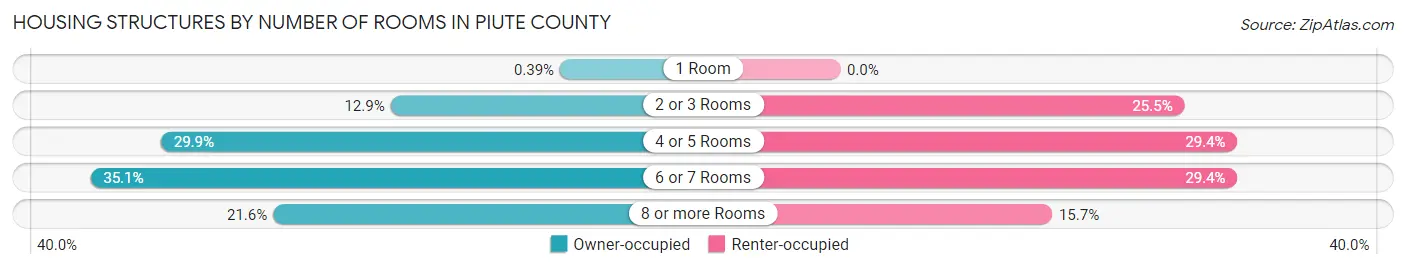
| Number of Rooms | Owner-occupied | Renter-occupied |
| 1 Room | 2 (0.4%) | 0 (0.0%) |
| 2 or 3 Rooms | 67 (12.9%) | 13 (25.5%) |
| 4 or 5 Rooms | 155 (29.9%) | 15 (29.4%) |
| 6 or 7 Rooms | 182 (35.1%) | 15 (29.4%) |
| 8 or more Rooms | 112 (21.6%) | 8 (15.7%) |
| Total | 518 (100.0%) | 51 (100.0%) |
Housing Structure by Heating Type in Piute County
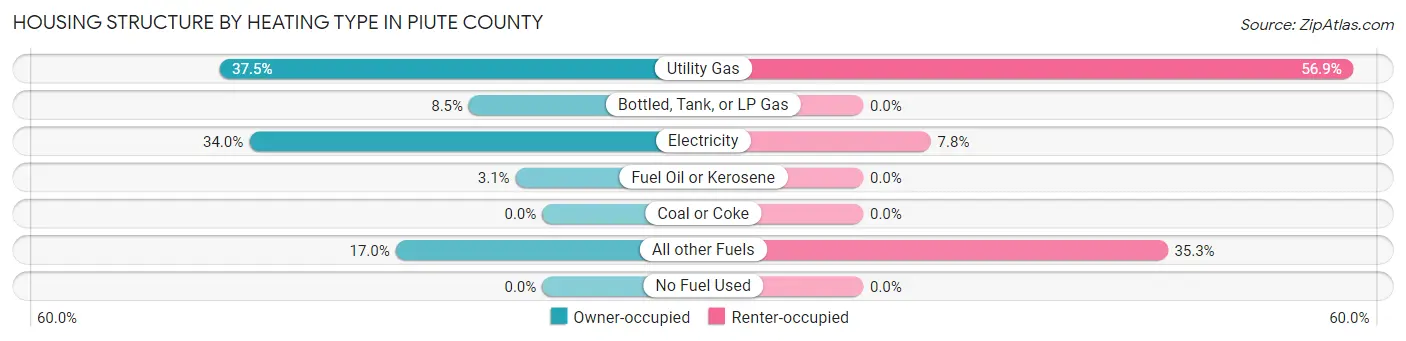
| Heating Type | Owner-occupied | Renter-occupied |
| Utility Gas | 194 (37.4%) | 29 (56.9%) |
| Bottled, Tank, or LP Gas | 44 (8.5%) | 0 (0.0%) |
| Electricity | 176 (34.0%) | 4 (7.8%) |
| Fuel Oil or Kerosene | 16 (3.1%) | 0 (0.0%) |
| Coal or Coke | 0 (0.0%) | 0 (0.0%) |
| All other Fuels | 88 (17.0%) | 18 (35.3%) |
| No Fuel Used | 0 (0.0%) | 0 (0.0%) |
| Total | 518 (100.0%) | 51 (100.0%) |
Household Vehicle Usage in Piute County
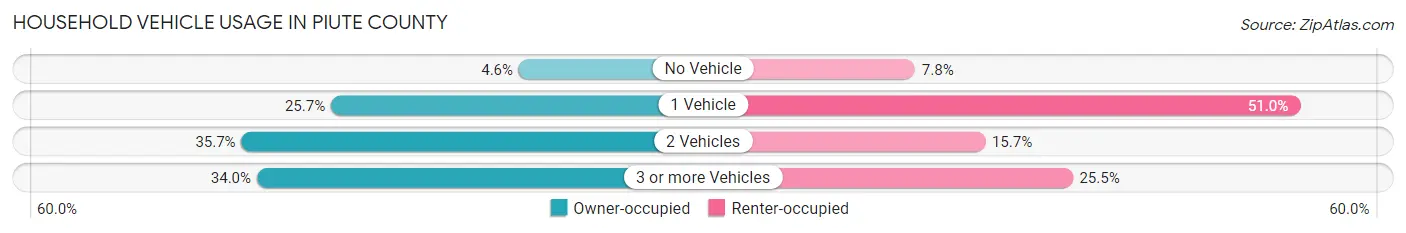
| Vehicles per Household | Owner-occupied | Renter-occupied |
| No Vehicle | 24 (4.6%) | 4 (7.8%) |
| 1 Vehicle | 133 (25.7%) | 26 (51.0%) |
| 2 Vehicles | 185 (35.7%) | 8 (15.7%) |
| 3 or more Vehicles | 176 (34.0%) | 13 (25.5%) |
| Total | 518 (100.0%) | 51 (100.0%) |
Real Estate & Mortgages in Piute County
Real Estate and Mortgage Overview in Piute County
| Characteristic | Without Mortgage | With Mortgage |
| Housing Units | 290 | 228 |
| Median Property Value | $195,500 | $246,400 |
| Median Household Income | $24,444 | $11 |
| Monthly Housing Costs | $293 | $7 |
| Real Estate Taxes | $904 | $0 |
Property Value by Mortgage Status in Piute County
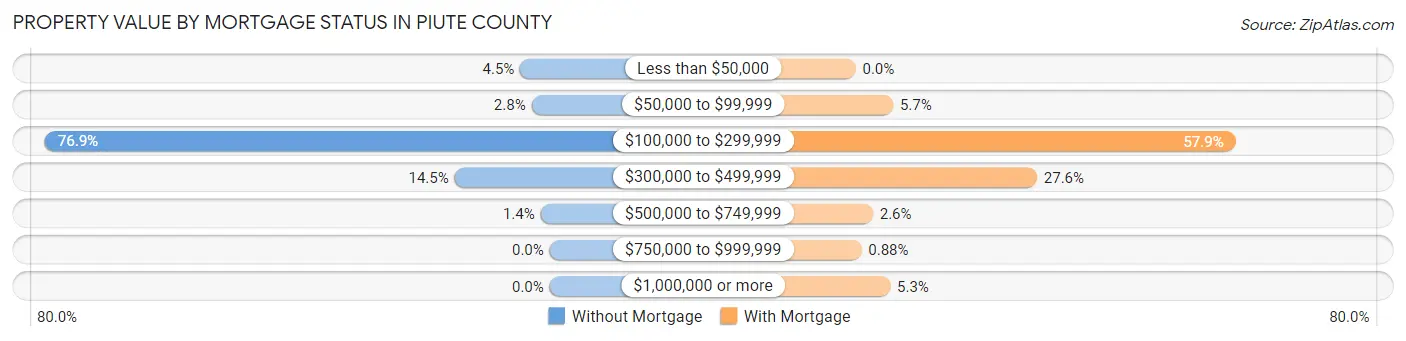
| Property Value | Without Mortgage | With Mortgage |
| Less than $50,000 | 13 (4.5%) | 0 (0.0%) |
| $50,000 to $99,999 | 8 (2.8%) | 13 (5.7%) |
| $100,000 to $299,999 | 223 (76.9%) | 132 (57.9%) |
| $300,000 to $499,999 | 42 (14.5%) | 63 (27.6%) |
| $500,000 to $749,999 | 4 (1.4%) | 6 (2.6%) |
| $750,000 to $999,999 | 0 (0.0%) | 2 (0.9%) |
| $1,000,000 or more | 0 (0.0%) | 12 (5.3%) |
| Total | 290 (100.0%) | 228 (100.0%) |
Household Income by Mortgage Status in Piute County
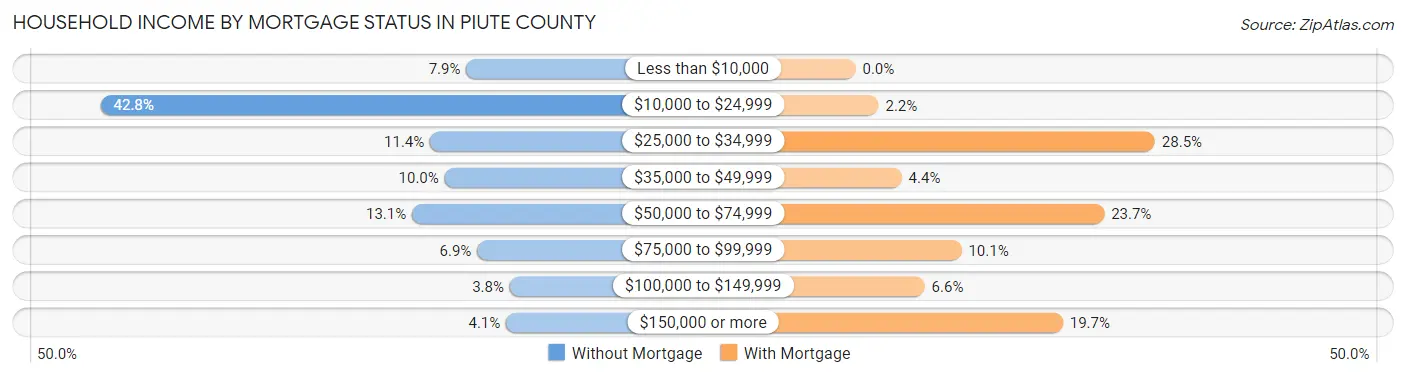
| Household Income | Without Mortgage | With Mortgage |
| Less than $10,000 | 23 (7.9%) | 0 (0.0%) |
| $10,000 to $24,999 | 124 (42.8%) | 5 (2.2%) |
| $25,000 to $34,999 | 33 (11.4%) | 65 (28.5%) |
| $35,000 to $49,999 | 29 (10.0%) | 10 (4.4%) |
| $50,000 to $74,999 | 38 (13.1%) | 54 (23.7%) |
| $75,000 to $99,999 | 20 (6.9%) | 23 (10.1%) |
| $100,000 to $149,999 | 11 (3.8%) | 15 (6.6%) |
| $150,000 or more | 12 (4.1%) | 45 (19.7%) |
| Total | 290 (100.0%) | 228 (100.0%) |
Property Value to Household Income Ratio in Piute County
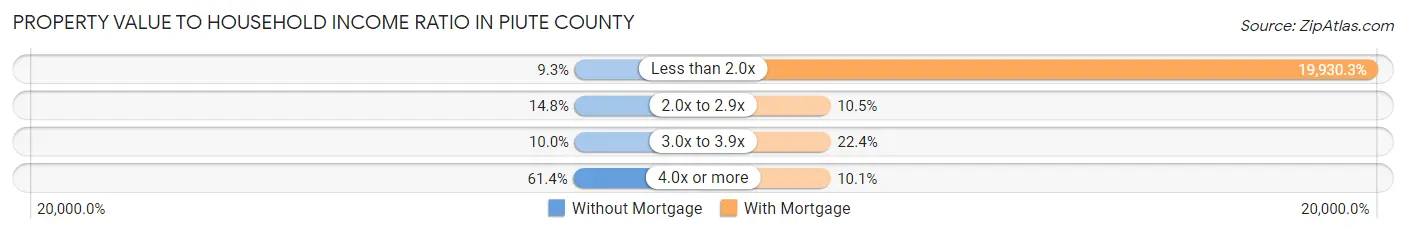
| Value-to-Income Ratio | Without Mortgage | With Mortgage |
| Less than 2.0x | 27 (9.3%) | 45,441 (19,930.3%) |
| 2.0x to 2.9x | 43 (14.8%) | 24 (10.5%) |
| 3.0x to 3.9x | 29 (10.0%) | 51 (22.4%) |
| 4.0x or more | 178 (61.4%) | 23 (10.1%) |
| Total | 290 (100.0%) | 228 (100.0%) |
Real Estate Taxes by Mortgage Status in Piute County
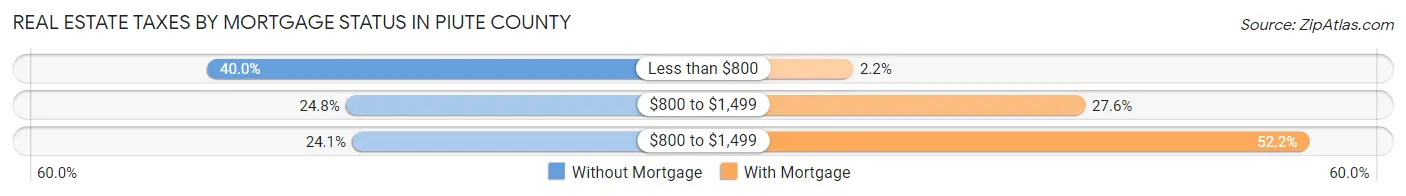
| Property Taxes | Without Mortgage | With Mortgage |
| Less than $800 | 116 (40.0%) | 5 (2.2%) |
| $800 to $1,499 | 72 (24.8%) | 63 (27.6%) |
| $800 to $1,499 | 70 (24.1%) | 119 (52.2%) |
| Total | 290 (100.0%) | 228 (100.0%) |
Health & Disability in Piute County
Health Insurance Coverage by Age in Piute County
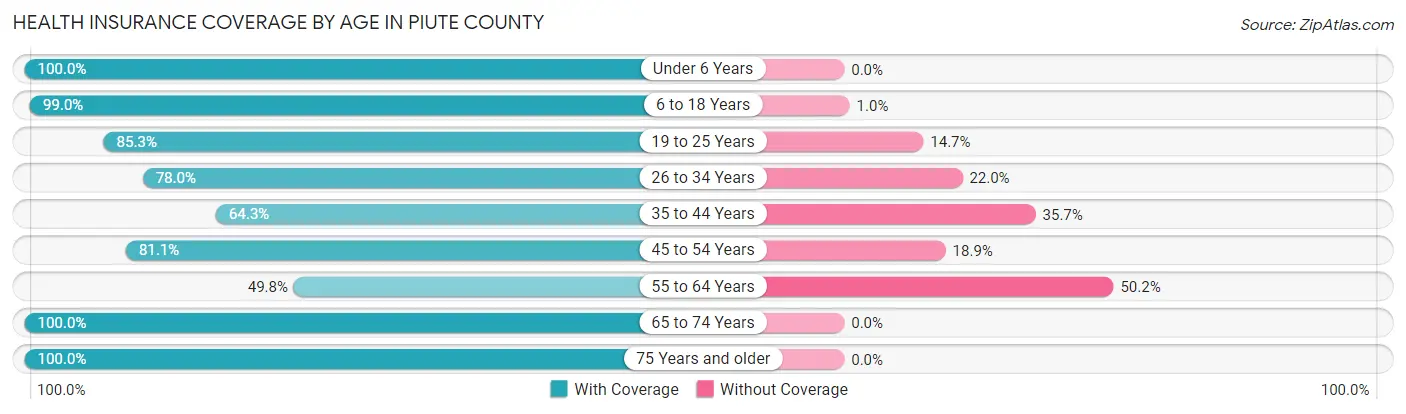
| Age Bracket | With Coverage | Without Coverage |
| Under 6 Years | 56 (100.0%) | 0 (0.0%) |
| 6 to 18 Years | 297 (99.0%) | 3 (1.0%) |
| 19 to 25 Years | 133 (85.3%) | 23 (14.7%) |
| 26 to 34 Years | 46 (78.0%) | 13 (22.0%) |
| 35 to 44 Years | 137 (64.3%) | 76 (35.7%) |
| 45 to 54 Years | 133 (81.1%) | 31 (18.9%) |
| 55 to 64 Years | 126 (49.8%) | 127 (50.2%) |
| 65 to 74 Years | 304 (100.0%) | 0 (0.0%) |
| 75 Years and older | 241 (100.0%) | 0 (0.0%) |
| Total | 1,473 (84.4%) | 273 (15.6%) |
Health Insurance Coverage by Citizenship Status in Piute County
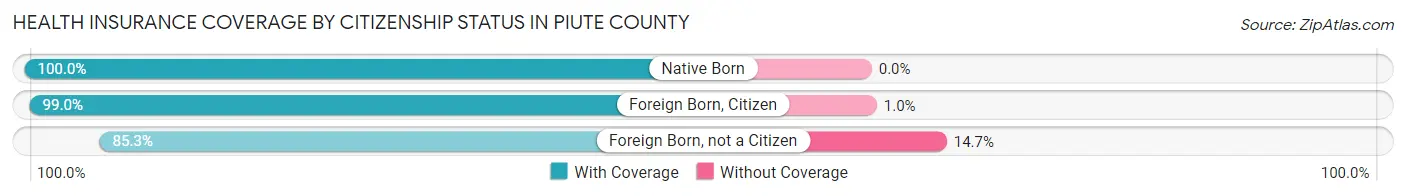
| Citizenship Status | With Coverage | Without Coverage |
| Native Born | 56 (100.0%) | 0 (0.0%) |
| Foreign Born, Citizen | 297 (99.0%) | 3 (1.0%) |
| Foreign Born, not a Citizen | 133 (85.3%) | 23 (14.7%) |
Health Insurance Coverage by Household Income in Piute County
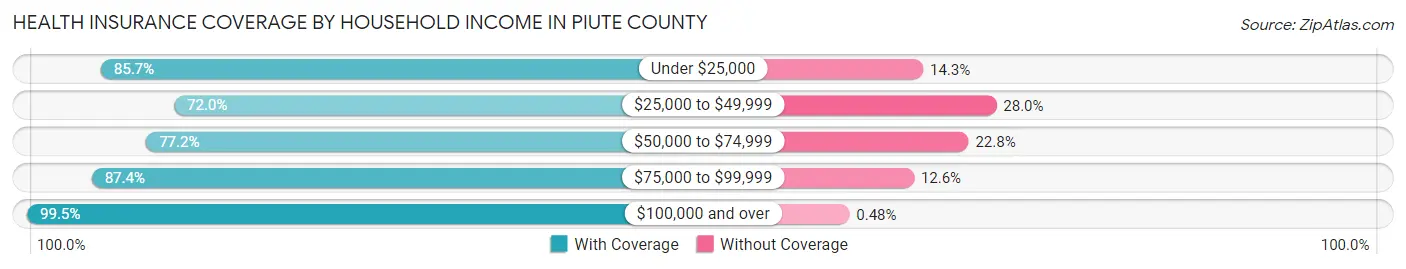
| Household Income | With Coverage | Without Coverage |
| Under $25,000 | 420 (85.7%) | 70 (14.3%) |
| $25,000 to $49,999 | 352 (72.0%) | 137 (28.0%) |
| $50,000 to $74,999 | 149 (77.2%) | 44 (22.8%) |
| $75,000 to $99,999 | 139 (87.4%) | 20 (12.6%) |
| $100,000 and over | 413 (99.5%) | 2 (0.5%) |
Public vs Private Health Insurance Coverage by Age in Piute County
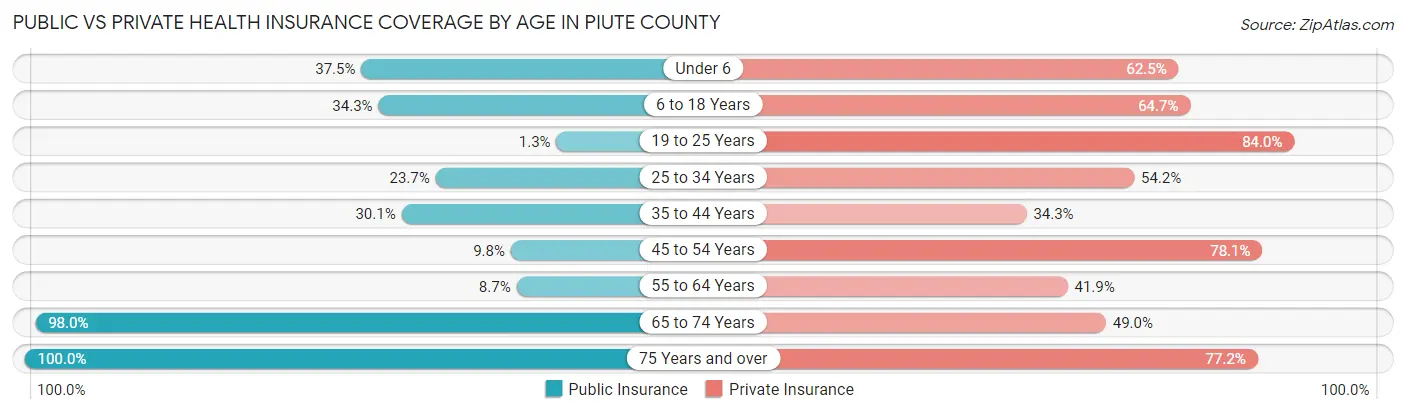
| Age Bracket | Public Insurance | Private Insurance |
| Under 6 | 21 (37.5%) | 35 (62.5%) |
| 6 to 18 Years | 103 (34.3%) | 194 (64.7%) |
| 19 to 25 Years | 2 (1.3%) | 131 (84.0%) |
| 25 to 34 Years | 14 (23.7%) | 32 (54.2%) |
| 35 to 44 Years | 64 (30.0%) | 73 (34.3%) |
| 45 to 54 Years | 16 (9.8%) | 128 (78.0%) |
| 55 to 64 Years | 22 (8.7%) | 106 (41.9%) |
| 65 to 74 Years | 298 (98.0%) | 149 (49.0%) |
| 75 Years and over | 241 (100.0%) | 186 (77.2%) |
| Total | 781 (44.7%) | 1,034 (59.2%) |
Disability Status by Sex by Age in Piute County
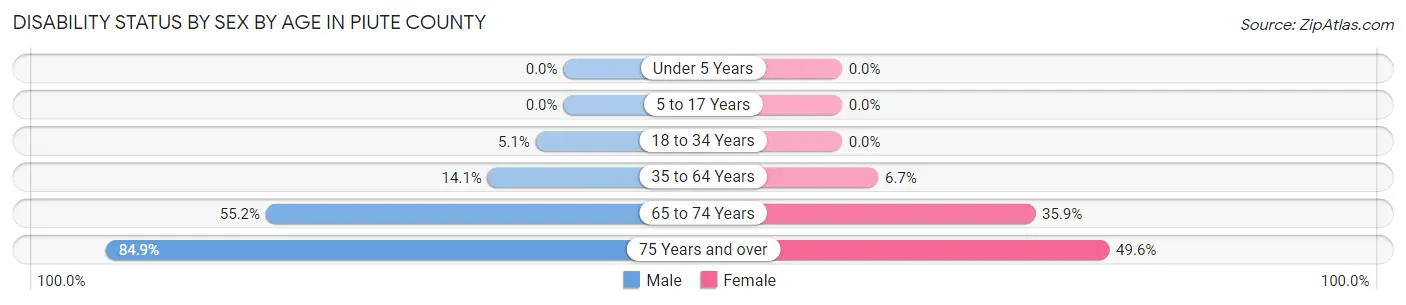
| Age Bracket | Male | Female |
| Under 5 Years | 0 (0.0%) | 0 (0.0%) |
| 5 to 17 Years | 0 (0.0%) | 0 (0.0%) |
| 18 to 34 Years | 8 (5.1%) | 0 (0.0%) |
| 35 to 64 Years | 51 (14.1%) | 18 (6.7%) |
| 65 to 74 Years | 74 (55.2%) | 61 (35.9%) |
| 75 Years and over | 90 (84.9%) | 67 (49.6%) |
Disability Class by Sex by Age in Piute County
Disability Class: Hearing Difficulty
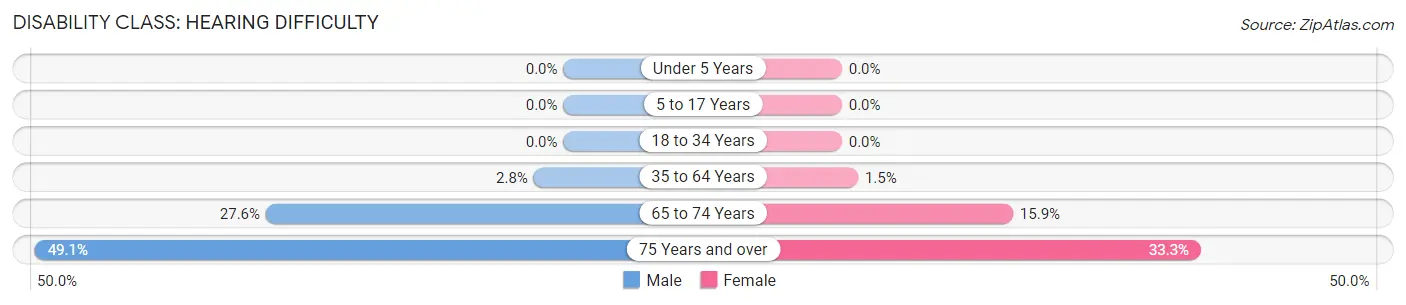
| Age Bracket | Male | Female |
| Under 5 Years | 0 (0.0%) | 0 (0.0%) |
| 5 to 17 Years | 0 (0.0%) | 0 (0.0%) |
| 18 to 34 Years | 0 (0.0%) | 0 (0.0%) |
| 35 to 64 Years | 10 (2.8%) | 4 (1.5%) |
| 65 to 74 Years | 37 (27.6%) | 27 (15.9%) |
| 75 Years and over | 52 (49.1%) | 45 (33.3%) |
Disability Class: Vision Difficulty
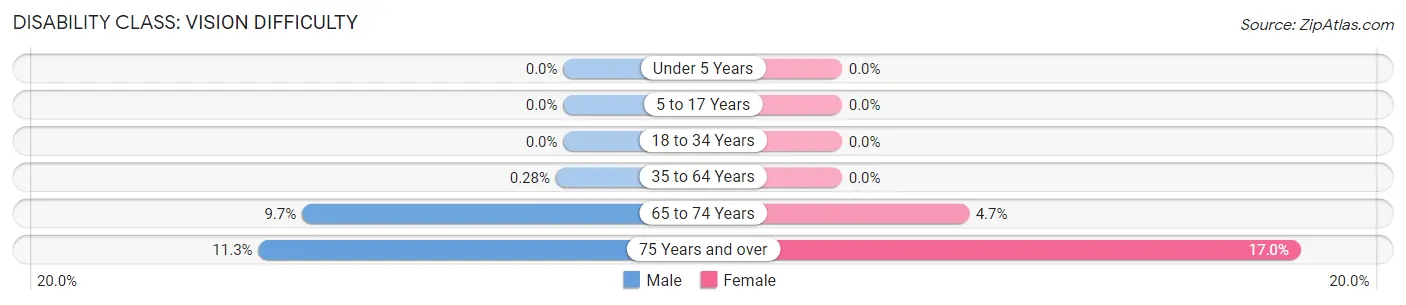
| Age Bracket | Male | Female |
| Under 5 Years | 0 (0.0%) | 0 (0.0%) |
| 5 to 17 Years | 0 (0.0%) | 0 (0.0%) |
| 18 to 34 Years | 0 (0.0%) | 0 (0.0%) |
| 35 to 64 Years | 1 (0.3%) | 0 (0.0%) |
| 65 to 74 Years | 13 (9.7%) | 8 (4.7%) |
| 75 Years and over | 12 (11.3%) | 23 (17.0%) |
Disability Class: Cognitive Difficulty
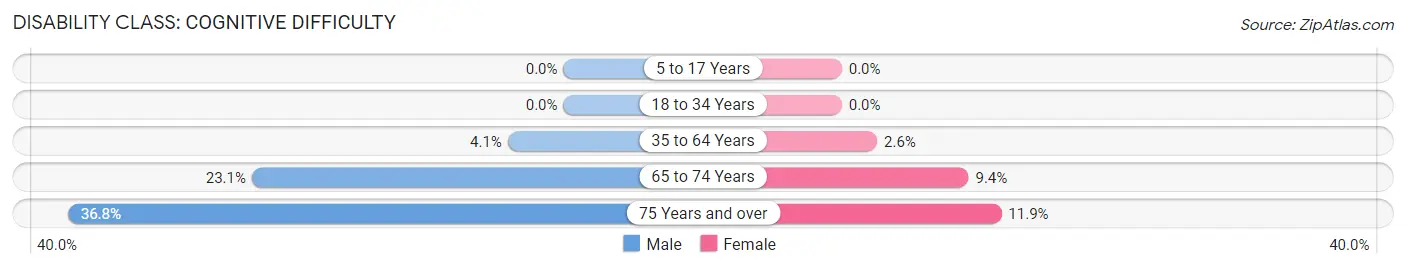
| Age Bracket | Male | Female |
| 5 to 17 Years | 0 (0.0%) | 0 (0.0%) |
| 18 to 34 Years | 0 (0.0%) | 0 (0.0%) |
| 35 to 64 Years | 15 (4.1%) | 7 (2.6%) |
| 65 to 74 Years | 31 (23.1%) | 16 (9.4%) |
| 75 Years and over | 39 (36.8%) | 16 (11.8%) |
Disability Class: Ambulatory Difficulty
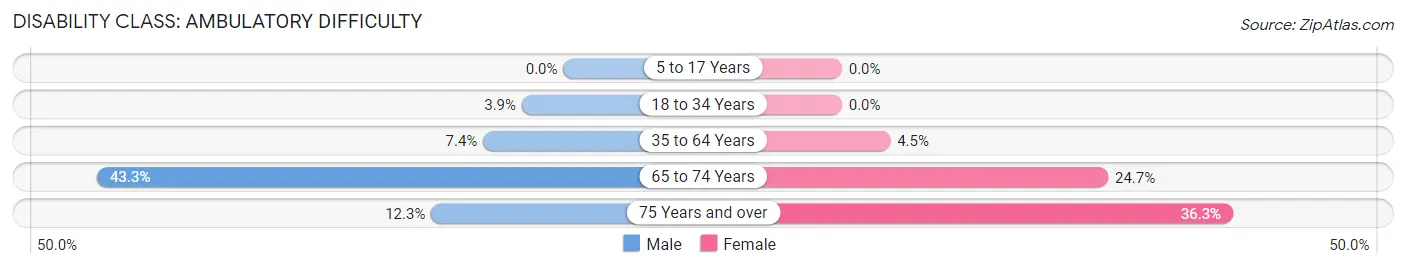
| Age Bracket | Male | Female |
| 5 to 17 Years | 0 (0.0%) | 0 (0.0%) |
| 18 to 34 Years | 6 (3.8%) | 0 (0.0%) |
| 35 to 64 Years | 27 (7.4%) | 12 (4.5%) |
| 65 to 74 Years | 58 (43.3%) | 42 (24.7%) |
| 75 Years and over | 13 (12.3%) | 49 (36.3%) |
Disability Class: Self-Care Difficulty
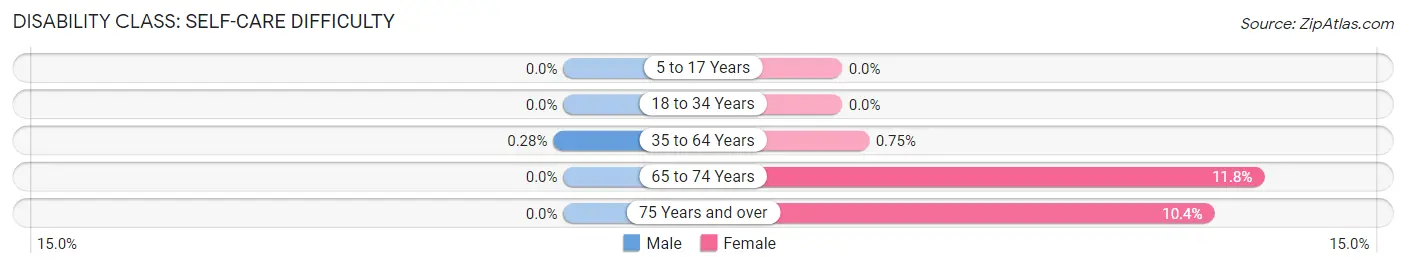
| Age Bracket | Male | Female |
| 5 to 17 Years | 0 (0.0%) | 0 (0.0%) |
| 18 to 34 Years | 0 (0.0%) | 0 (0.0%) |
| 35 to 64 Years | 1 (0.3%) | 2 (0.7%) |
| 65 to 74 Years | 0 (0.0%) | 20 (11.8%) |
| 75 Years and over | 0 (0.0%) | 14 (10.4%) |
Technology Access in Piute County
Computing Device Access in Piute County
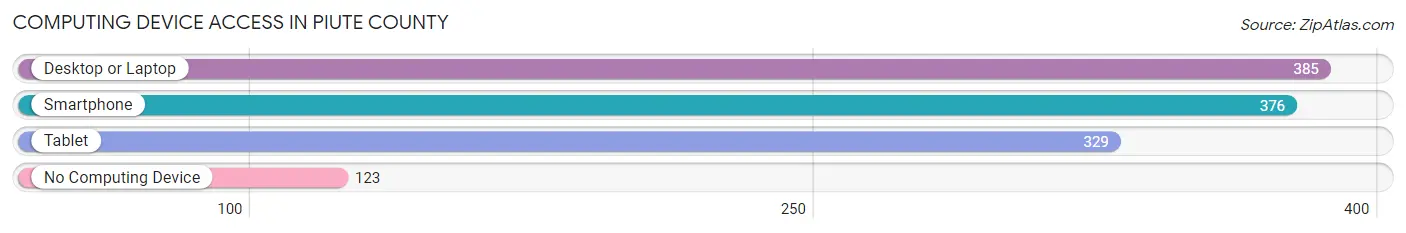
| Device Type | # Households | % Households |
| Desktop or Laptop | 385 | 67.7% |
| Smartphone | 376 | 66.1% |
| Tablet | 329 | 57.8% |
| No Computing Device | 123 | 21.6% |
| Total | 569 | 100.0% |
Internet Access in Piute County
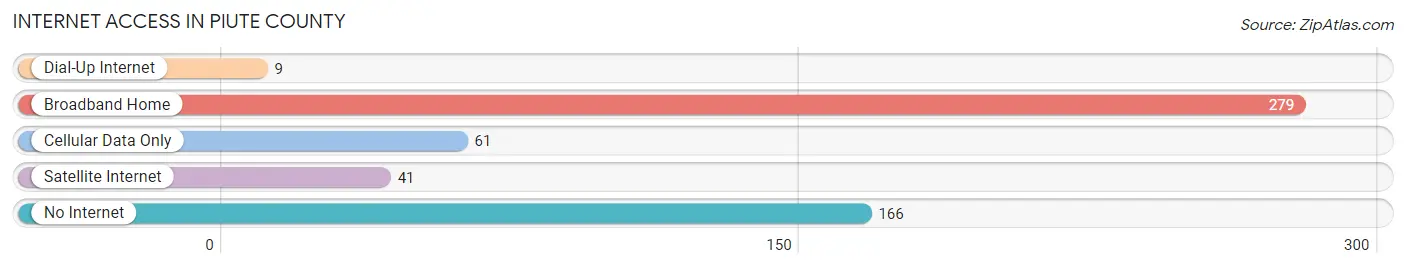
| Internet Type | # Households | % Households |
| Dial-Up Internet | 9 | 1.6% |
| Broadband Home | 279 | 49.0% |
| Cellular Data Only | 61 | 10.7% |
| Satellite Internet | 41 | 7.2% |
| No Internet | 166 | 29.2% |
| Total | 569 | 100.0% |
Piute County Summary
Piute County is located in the south-central region of Utah, and is bordered by Garfield, Wayne, Sevier, and Sanpete Counties. The county seat is Junction, and the largest city is Circleville. The county was established in 1891 and named after the Paiute Native American tribe. As of the 2010 census, the population was 1,556, making it the least populous county in Utah.
Geography
Piute County covers an area of 1,890 square miles, making it the fourth-smallest county in Utah. The county is located in the Basin and Range Province, and is characterized by rugged terrain and numerous mountain ranges. The highest point in the county is the summit of Mount Baldy, which has an elevation of 11,420 feet. The county is drained by the Sevier River, which flows through the county from north to south.
The climate of Piute County is semi-arid, with hot summers and cold winters. The average annual precipitation is 11.5 inches, and the average annual snowfall is 40 inches.
Demographics
As of the 2010 census, there were 1,556 people, 545 households, and 393 families residing in the county. The population density was 0.8 people per square mile. The racial makeup of the county was 97.2% White, 0.2% Black or African American, 0.3% Native American, 0.2% Asian, 0.1% Pacific Islander, 0.7% from other races, and 1.3% from two or more races. Hispanic or Latino of any race were 2.3% of the population.
The median income for a household in the county was $31,250, and the median income for a family was $35,000. The per capita income for the county was $14,845. About 11.2% of families and 14.2% of the population were below the poverty line, including 17.2% of those under age 18 and 8.3% of those age 65 or over.
Economy
The economy of Piute County is largely based on agriculture and tourism. The county is home to several cattle ranches, and the main crops grown in the county are hay, alfalfa, and wheat. The county is also home to several tourist attractions, including the Piute State Park, which offers camping, fishing, and hiking opportunities.
The county is served by two airports, the Circleville Airport and the Junction Airport. The county is also served by two major highways, US-89 and US-6.
Conclusion
Piute County is a small, rural county located in the south-central region of Utah. The county is characterized by rugged terrain and numerous mountain ranges, and has a semi-arid climate. The population of the county is 1,556, and the economy is largely based on agriculture and tourism. The county is served by two airports and two major highways, and is home to several tourist attractions.
Common Questions
What is the Total Population of Piute County?
Total Population of Piute County is 1,764.
What is the Total Male Population of Piute County?
Total Male Population of Piute County is 940.
What is the Total Female Population of Piute County?
Total Female Population of Piute County is 824.
What is the Ratio of Males per 100 Females in Piute County?
There are 114.08 Males per 100 Females in Piute County.
What is the Ratio of Females per 100 Males in Piute County?
There are 87.66 Females per 100 Males in Piute County.
What is the Median Population Age in Piute County?
Median Population Age in Piute County is 49.5 Years.
What is the Average Family Size in Piute County
Average Family Size in Piute County is 4.3 People.
What is the Average Household Size in Piute County
Average Household Size in Piute County is 3.1 People.
What is Per Capita Income in Piute County?
Per Capita income in Piute County is $19,919.
What is the Median Family Income in Piute County?
Median Family Income in Piute County is $44,125.
What is the Median Household income in Piute County?
Median Household Income in Piute County is $33,359.
What is Income or Wage Gap in Piute County?
Income or Wage Gap in Piute County is 50.6%.
Women in Piute County earn 49.4 cents for every dollar earned by a man.
What is Inequality or Gini Index in Piute County?
Inequality or Gini Index in Piute County is 0.48.
How Large is the Labor Force in Piute County?
There are 636 People in the Labor Forcein in Piute County.
What is the Percentage of People in the Labor Force in Piute County?
43.0% of People are in the Labor Force in Piute County.
What is the Unemployment Rate in Piute County?
Unemployment Rate in Piute County is 9.1%.