Morgan County, UT
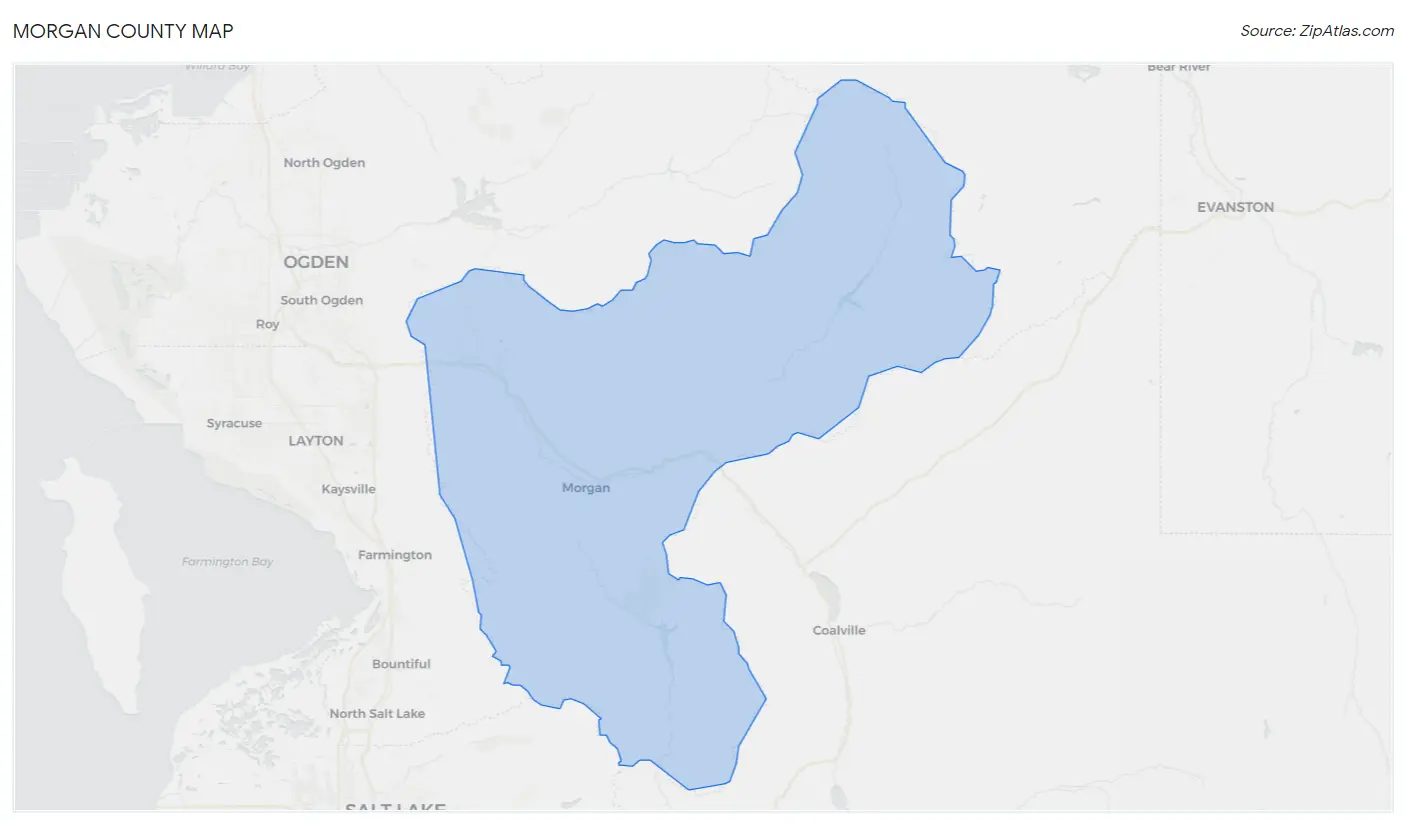
Morgan County Map
Morgan County Overview
12,367
TOTAL POPULATION
6,417
MALE POPULATION
5,950
FEMALE POPULATION
107.85
MALES / 100 FEMALES
92.72
FEMALES / 100 MALES
32.1
MEDIAN AGE
3.8
AVG FAMILY SIZE
3.5
AVG HOUSEHOLD SIZE
$40,485
PER CAPITA INCOME
$127,052
AVG FAMILY INCOME
$120,854
AVG HOUSEHOLD INCOME
72.1%
WAGE / INCOME GAP [ % ]
27.9¢/ $1
WAGE / INCOME GAP [ $ ]
0.37
INEQUALITY / GINI INDEX
5,498
LABOR FORCE [ PEOPLE ]
63.7%
PERCENT IN LABOR FORCE
1.7%
UNEMPLOYMENT RATE
Morgan County Area Codes
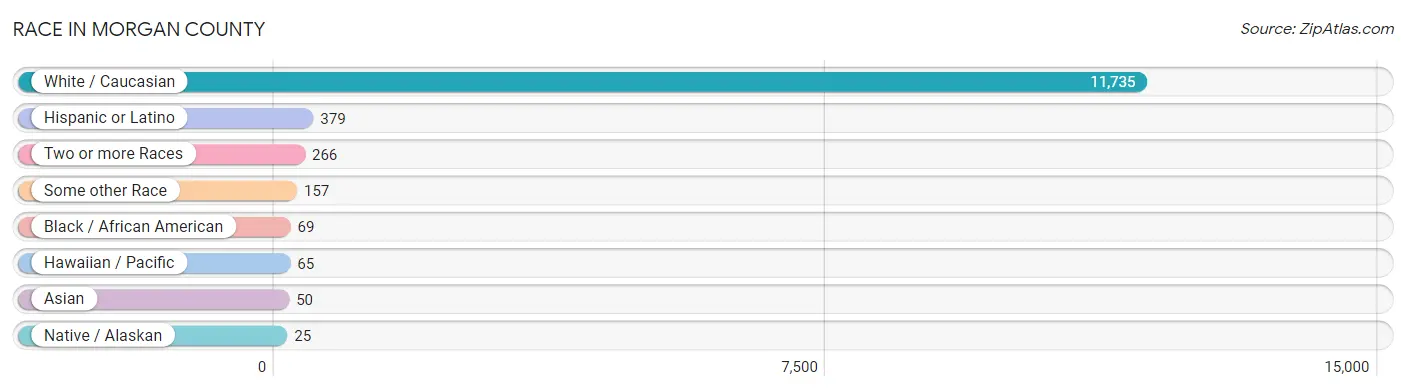
Race in Morgan County
The most populous races in Morgan County are White / Caucasian (11,735 | 94.9%), Hispanic or Latino (379 | 3.1%), and Two or more Races (266 | 2.1%).
| Race | # Population | % Population |
| Asian | 50 | 0.4% |
| Black / African American | 69 | 0.6% |
| Hawaiian / Pacific | 65 | 0.5% |
| Hispanic or Latino | 379 | 3.1% |
| Native / Alaskan | 25 | 0.2% |
| White / Caucasian | 11,735 | 94.9% |
| Two or more Races | 266 | 2.1% |
| Some other Race | 157 | 1.3% |
| Total | 12,367 | 100.0% |
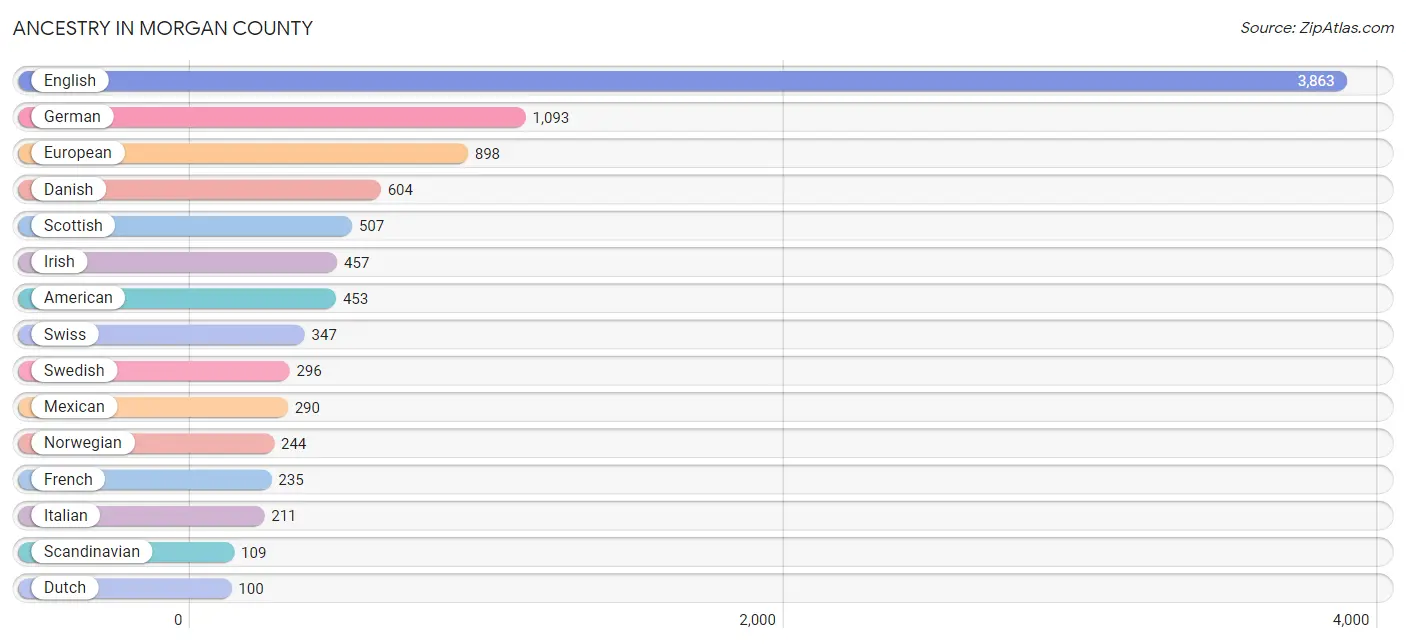
Ancestry in Morgan County
The most populous ancestries reported in Morgan County are English (3,863 | 31.2%), German (1,093 | 8.8%), European (898 | 7.3%), Danish (604 | 4.9%), and Scottish (507 | 4.1%), together accounting for 56.3% of all Morgan County residents.
| Ancestry | # Population | % Population |
| American | 453 | 3.7% |
| Australian | 4 | 0.0% |
| Bhutanese | 89 | 0.7% |
| British | 55 | 0.4% |
| Cuban | 9 | 0.1% |
| Czech | 5 | 0.0% |
| Czechoslovakian | 5 | 0.0% |
| Danish | 604 | 4.9% |
| Dutch | 100 | 0.8% |
| Eastern European | 4 | 0.0% |
| English | 3,863 | 31.2% |
| Estonian | 17 | 0.1% |
| European | 898 | 7.3% |
| Fijian | 5 | 0.0% |
| Finnish | 37 | 0.3% |
| French | 235 | 1.9% |
| French Canadian | 18 | 0.2% |
| German | 1,093 | 8.8% |
| Guamanian / Chamorro | 7 | 0.1% |
| Hungarian | 93 | 0.7% |
| Irish | 457 | 3.7% |
| Italian | 211 | 1.7% |
| Lithuanian | 15 | 0.1% |
| Mexican | 290 | 2.3% |
| Native Hawaiian | 34 | 0.3% |
| Northern European | 33 | 0.3% |
| Norwegian | 244 | 2.0% |
| Pakistani | 50 | 0.4% |
| Paraguayan | 6 | 0.1% |
| Polish | 66 | 0.5% |
| Portuguese | 89 | 0.7% |
| Puerto Rican | 9 | 0.1% |
| Scandinavian | 109 | 0.9% |
| Scotch-Irish | 17 | 0.1% |
| Scottish | 507 | 4.1% |
| Slovak | 8 | 0.1% |
| South American | 60 | 0.5% |
| Spaniard | 4 | 0.0% |
| Spanish | 7 | 0.1% |
| Swedish | 296 | 2.4% |
| Swiss | 347 | 2.8% |
| Tongan | 19 | 0.2% |
| Ukrainian | 16 | 0.1% |
| Uruguayan | 22 | 0.2% |
| Venezuelan | 32 | 0.3% |
| Welsh | 77 | 0.6% | View All 46 Rows |
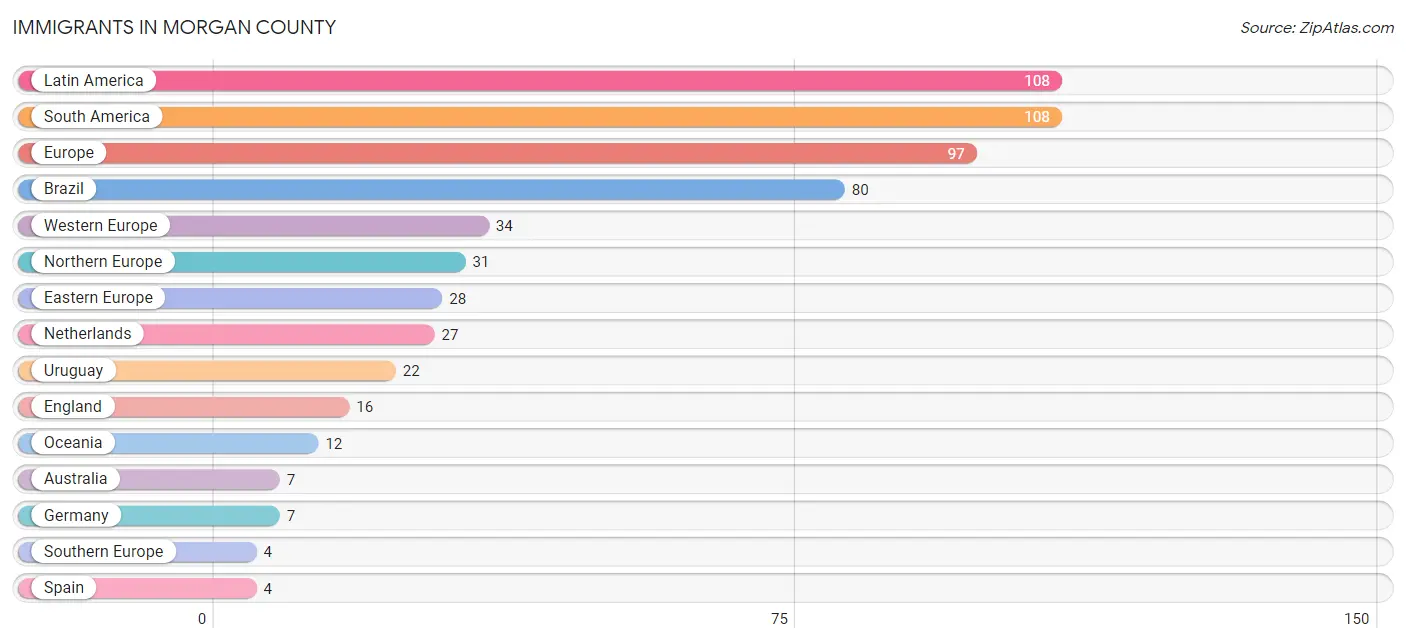
Immigrants in Morgan County
The most numerous immigrant groups reported in Morgan County came from Latin America (108 | 0.9%), South America (108 | 0.9%), Europe (97 | 0.8%), Brazil (80 | 0.6%), and Western Europe (34 | 0.3%), together accounting for 3.4% of all Morgan County residents.
| Immigration Origin | # Population | % Population |
| Australia | 7 | 0.1% |
| Brazil | 80 | 0.6% |
| Eastern Europe | 28 | 0.2% |
| England | 16 | 0.1% |
| Europe | 97 | 0.8% |
| Germany | 7 | 0.1% |
| Latin America | 108 | 0.9% |
| Netherlands | 27 | 0.2% |
| Northern Europe | 31 | 0.3% |
| Oceania | 12 | 0.1% |
| South America | 108 | 0.9% |
| Southern Europe | 4 | 0.0% |
| Spain | 4 | 0.0% |
| Uruguay | 22 | 0.2% |
| Western Europe | 34 | 0.3% | View All 15 Rows |
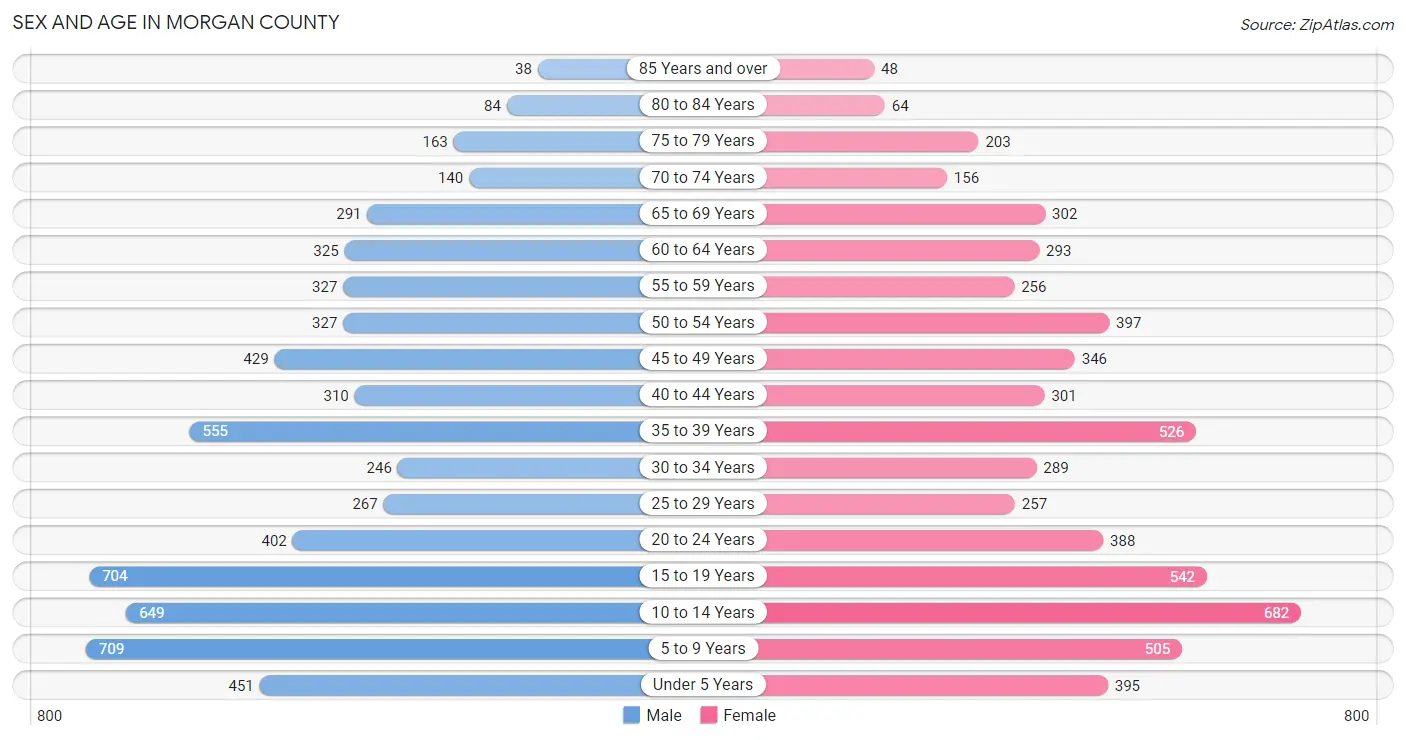
Sex and Age in Morgan County
Sex and Age in Morgan County
The most populous age groups in Morgan County are 5 to 9 Years (709 | 11.1%) for men and 10 to 14 Years (682 | 11.5%) for women.
| Age Bracket | Male | Female |
| Under 5 Years | 451 (7.0%) | 395 (6.6%) |
| 5 to 9 Years | 709 (11.1%) | 505 (8.5%) |
| 10 to 14 Years | 649 (10.1%) | 682 (11.5%) |
| 15 to 19 Years | 704 (11.0%) | 542 (9.1%) |
| 20 to 24 Years | 402 (6.3%) | 388 (6.5%) |
| 25 to 29 Years | 267 (4.2%) | 257 (4.3%) |
| 30 to 34 Years | 246 (3.8%) | 289 (4.9%) |
| 35 to 39 Years | 555 (8.6%) | 526 (8.8%) |
| 40 to 44 Years | 310 (4.8%) | 301 (5.1%) |
| 45 to 49 Years | 429 (6.7%) | 346 (5.8%) |
| 50 to 54 Years | 327 (5.1%) | 397 (6.7%) |
| 55 to 59 Years | 327 (5.1%) | 256 (4.3%) |
| 60 to 64 Years | 325 (5.1%) | 293 (4.9%) |
| 65 to 69 Years | 291 (4.5%) | 302 (5.1%) |
| 70 to 74 Years | 140 (2.2%) | 156 (2.6%) |
| 75 to 79 Years | 163 (2.5%) | 203 (3.4%) |
| 80 to 84 Years | 84 (1.3%) | 64 (1.1%) |
| 85 Years and over | 38 (0.6%) | 48 (0.8%) |
| Total | 6,417 (100.0%) | 5,950 (100.0%) |
Families and Households in Morgan County
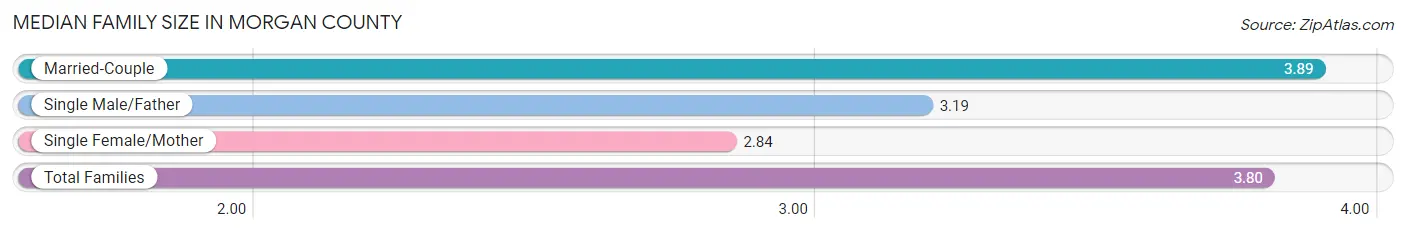
Median Family Size in Morgan County
The median family size in Morgan County is 3.80 persons per family, with married-couple families (2,810 | 89.9%) accounting for the largest median family size of 3.89 persons per family. On the other hand, single female/mother families (201 | 6.4%) represent the smallest median family size with 2.84 persons per family.
| Family Type | # Families | Family Size |
| Married-Couple | 2,810 (89.9%) | 3.89 |
| Single Male/Father | 114 (3.6%) | 3.19 |
| Single Female/Mother | 201 (6.4%) | 2.84 |
| Total Families | 3,125 (100.0%) | 3.80 |
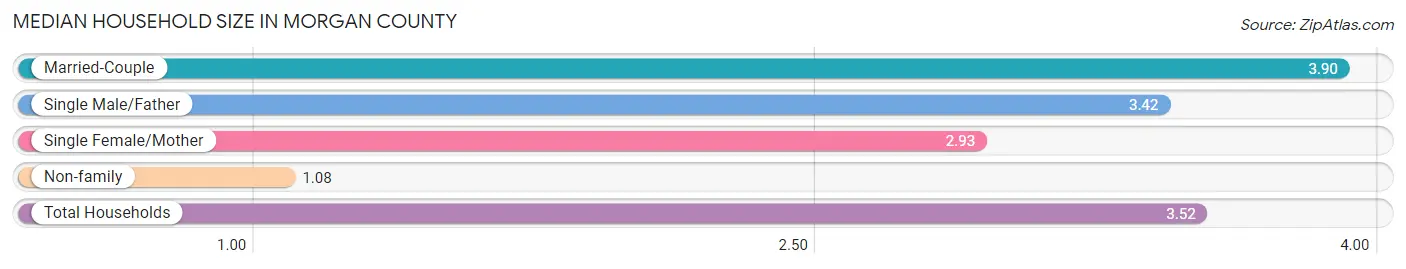
Median Household Size in Morgan County
The median household size in Morgan County is 3.52 persons per household, with married-couple households (2,810 | 80.1%) accounting for the largest median household size of 3.9 persons per household. non-family households (381 | 10.9%) represent the smallest median household size with 1.08 persons per household.
| Household Type | # Households | Household Size |
| Married-Couple | 2,810 (80.1%) | 3.90 |
| Single Male/Father | 114 (3.3%) | 3.42 |
| Single Female/Mother | 201 (5.7%) | 2.93 |
| Non-family | 381 (10.9%) | 1.08 |
| Total Households | 3,506 (100.0%) | 3.52 |
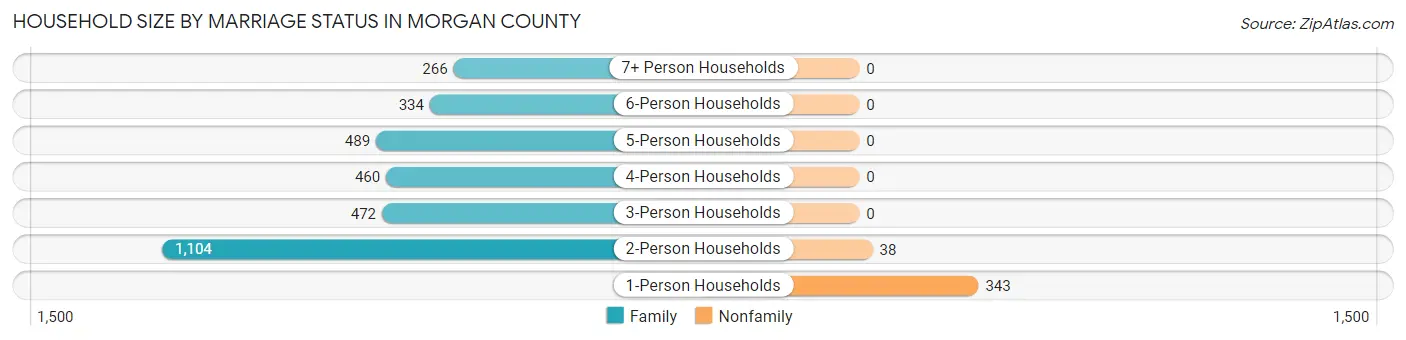
Household Size by Marriage Status in Morgan County
Out of a total of 3,506 households in Morgan County, 3,125 (89.1%) are family households, while 381 (10.9%) are nonfamily households. The most numerous type of family households are 2-person households, comprising 1,104, and the most common type of nonfamily households are 1-person households, comprising 343.
| Household Size | Family Households | Nonfamily Households |
| 1-Person Households | - | 343 (9.8%) |
| 2-Person Households | 1,104 (31.5%) | 38 (1.1%) |
| 3-Person Households | 472 (13.5%) | 0 (0.0%) |
| 4-Person Households | 460 (13.1%) | 0 (0.0%) |
| 5-Person Households | 489 (14.0%) | 0 (0.0%) |
| 6-Person Households | 334 (9.5%) | 0 (0.0%) |
| 7+ Person Households | 266 (7.6%) | 0 (0.0%) |
| Total | 3,125 (89.1%) | 381 (10.9%) |
Female Fertility in Morgan County
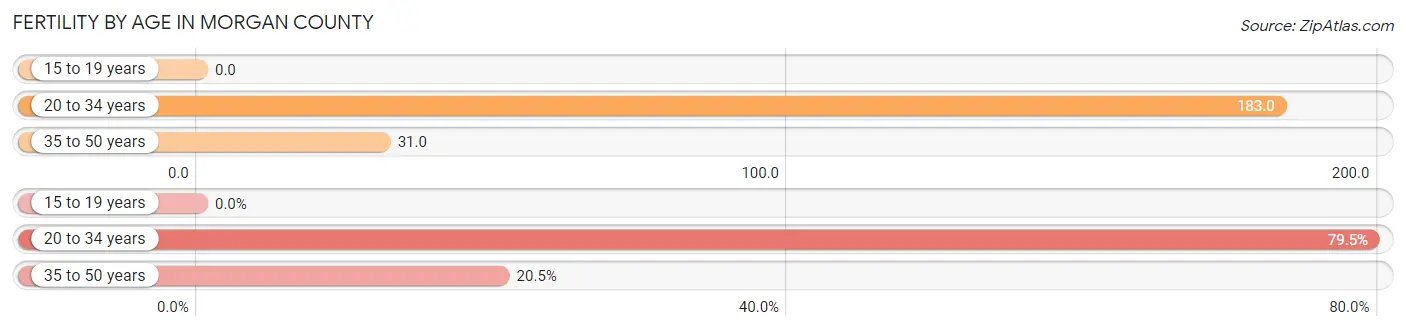
Fertility by Age in Morgan County
Average fertility rate in Morgan County is 74.0 births per 1,000 women. Women in the age bracket of 20 to 34 years have the highest fertility rate with 183.0 births per 1,000 women. Women in the age bracket of 20 to 34 years acount for 79.5% of all women with births.
| Age Bracket | Women with Births | Births / 1,000 Women |
| 15 to 19 years | 0 (0.0%) | 0.0 |
| 20 to 34 years | 171 (79.5%) | 183.0 |
| 35 to 50 years | 44 (20.5%) | 31.0 |
| Total | 215 (100.0%) | 74.0 |
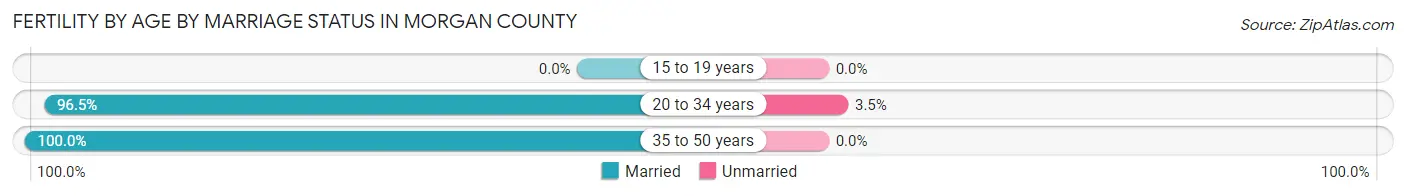
Fertility by Age by Marriage Status in Morgan County
97.2% of women with births (215) in Morgan County are married. The highest percentage of unmarried women with births falls into 20 to 34 years age bracket with 3.5% of them unmarried at the time of birth, while the lowest percentage of unmarried women with births belong to 35 to 50 years age bracket with 0.0% of them unmarried.
| Age Bracket | Married | Unmarried |
| 15 to 19 years | 0 (0.0%) | 0 (0.0%) |
| 20 to 34 years | 165 (96.5%) | 6 (3.5%) |
| 35 to 50 years | 44 (100.0%) | 0 (0.0%) |
| Total | 209 (97.2%) | 6 (2.8%) |
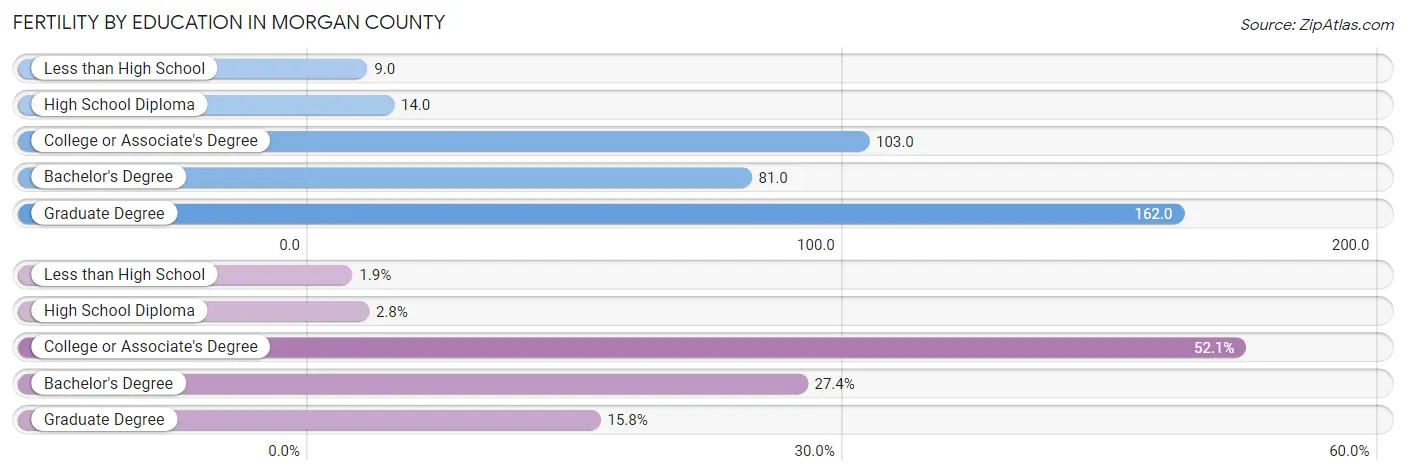
Fertility by Education in Morgan County
Average fertility rate in Morgan County is 74.0 births per 1,000 women. Women with the education attainment of graduate degree have the highest fertility rate of 162.0 births per 1,000 women, while women with the education attainment of less than high school have the lowest fertility at 9.0 births per 1,000 women. Women with the education attainment of college or associate's degree represent 52.1% of all women with births.
| Educational Attainment | Women with Births | Births / 1,000 Women |
| Less than High School | 4 (1.9%) | 9.0 |
| High School Diploma | 6 (2.8%) | 14.0 |
| College or Associate's Degree | 112 (52.1%) | 103.0 |
| Bachelor's Degree | 59 (27.4%) | 81.0 |
| Graduate Degree | 34 (15.8%) | 162.0 |
| Total | 215 (100.0%) | 74.0 |
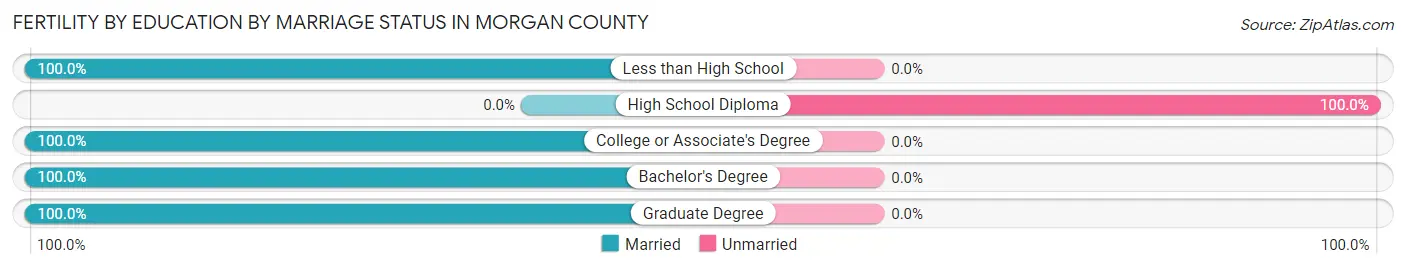
Fertility by Education by Marriage Status in Morgan County
2.8% of women with births in Morgan County are unmarried. Women with the educational attainment of less than high school are most likely to be married with 100.0% of them married at childbirth, while women with the educational attainment of high school diploma are least likely to be married with 100.0% of them unmarried at childbirth.
| Educational Attainment | Married | Unmarried |
| Less than High School | 4 (100.0%) | 0 (0.0%) |
| High School Diploma | 0 (0.0%) | 6 (100.0%) |
| College or Associate's Degree | 112 (100.0%) | 0 (0.0%) |
| Bachelor's Degree | 59 (100.0%) | 0 (0.0%) |
| Graduate Degree | 34 (100.0%) | 0 (0.0%) |
| Total | 209 (97.2%) | 6 (2.8%) |
Income in Morgan County
Income Overview in Morgan County
Per Capita Income in Morgan County is $40,485, while median incomes of families and households are $127,052 and $120,854 respectively.
| Characteristic | Number | Measure |
| Per Capita Income | 12,367 | $40,485 |
| Median Family Income | 3,125 | $127,052 |
| Mean Family Income | 3,125 | $153,347 |
| Median Household Income | 3,506 | $120,854 |
| Mean Household Income | 3,506 | $145,747 |
| Income Deficit | 3,125 | $0 |
| Wage / Income Gap (%) | 12,367 | 72.06% |
| Wage / Income Gap ($) | 12,367 | 27.94¢ per $1 |
| Gini / Inequality Index | 12,367 | 0.37 |
Earnings by Sex in Morgan County
Average Earnings in Morgan County are $48,359, $76,597 for men and $21,403 for women, a difference of 72.1%.
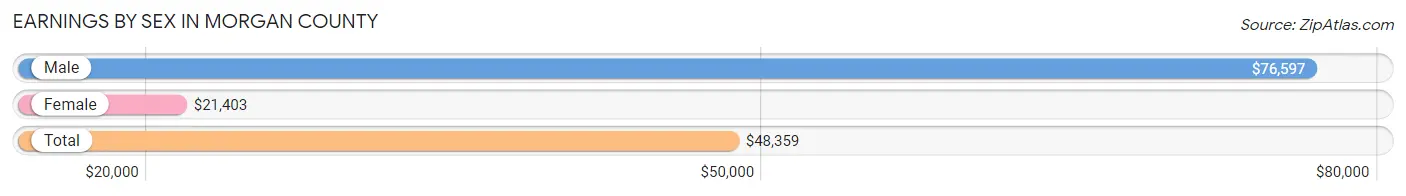
| Sex | Number | Average Earnings |
| Male | 3,335 (55.7%) | $76,597 |
| Female | 2,652 (44.3%) | $21,403 |
| Total | 5,987 (100.0%) | $48,359 |
Earnings by Sex by Income Bracket in Morgan County
The most common earnings brackets in Morgan County are $100,000+ for men (1,324 | 39.7%) and $2,499 or less for women (280 | 10.6%).
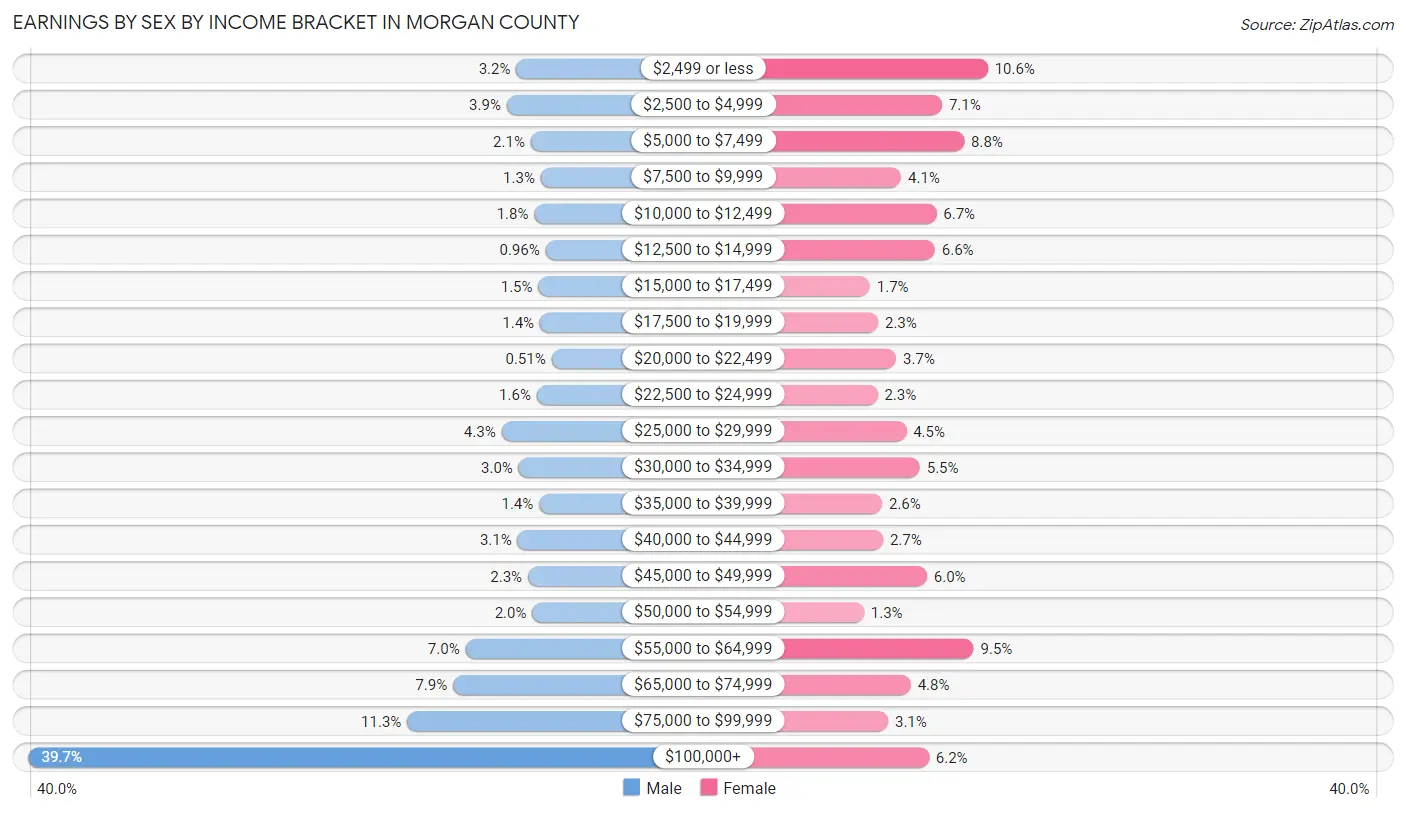
| Income | Male | Female |
| $2,499 or less | 105 (3.2%) | 280 (10.6%) |
| $2,500 to $4,999 | 129 (3.9%) | 189 (7.1%) |
| $5,000 to $7,499 | 69 (2.1%) | 233 (8.8%) |
| $7,500 to $9,999 | 44 (1.3%) | 108 (4.1%) |
| $10,000 to $12,499 | 60 (1.8%) | 178 (6.7%) |
| $12,500 to $14,999 | 32 (1.0%) | 175 (6.6%) |
| $15,000 to $17,499 | 50 (1.5%) | 46 (1.7%) |
| $17,500 to $19,999 | 46 (1.4%) | 62 (2.3%) |
| $20,000 to $22,499 | 17 (0.5%) | 98 (3.7%) |
| $22,500 to $24,999 | 54 (1.6%) | 61 (2.3%) |
| $25,000 to $29,999 | 142 (4.3%) | 118 (4.4%) |
| $30,000 to $34,999 | 99 (3.0%) | 145 (5.5%) |
| $35,000 to $39,999 | 48 (1.4%) | 70 (2.6%) |
| $40,000 to $44,999 | 102 (3.1%) | 72 (2.7%) |
| $45,000 to $49,999 | 76 (2.3%) | 159 (6.0%) |
| $50,000 to $54,999 | 65 (1.9%) | 34 (1.3%) |
| $55,000 to $64,999 | 232 (7.0%) | 252 (9.5%) |
| $65,000 to $74,999 | 263 (7.9%) | 127 (4.8%) |
| $75,000 to $99,999 | 378 (11.3%) | 82 (3.1%) |
| $100,000+ | 1,324 (39.7%) | 163 (6.1%) |
| Total | 3,335 (100.0%) | 2,652 (100.0%) |
Earnings by Sex by Educational Attainment in Morgan County
Average earnings in Morgan County are $97,500 for men and $29,500 for women, a difference of 69.7%. Men with an educational attainment of graduate degree enjoy the highest average annual earnings of $152,500, while those with college or associate's degree education earn the least with $67,500. Women with an educational attainment of graduate degree earn the most with the average annual earnings of $46,657, while those with college or associate's degree education have the smallest earnings of $21,061.
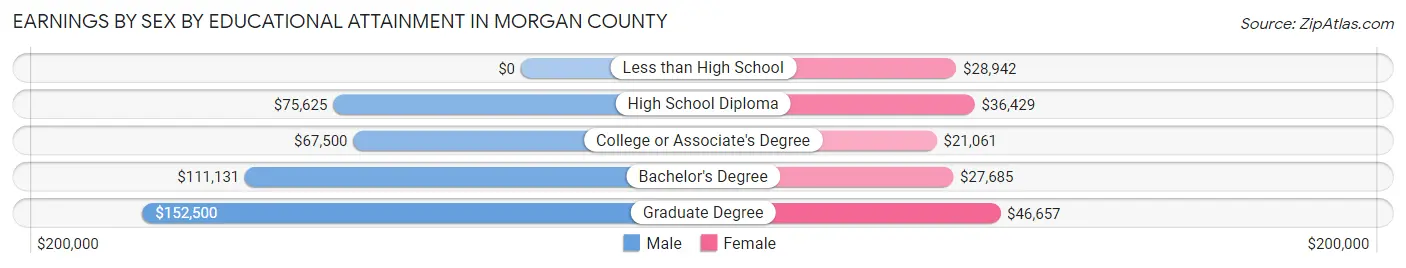
| Educational Attainment | Male Income | Female Income |
| Less than High School | - | - |
| High School Diploma | $75,625 | $36,429 |
| College or Associate's Degree | $67,500 | $21,061 |
| Bachelor's Degree | $111,131 | $27,685 |
| Graduate Degree | $152,500 | $46,657 |
| Total | $97,500 | $29,500 |
Family Income in Morgan County
Family Income Brackets in Morgan County
According to the Morgan County family income data, there are 991 families falling into the $100,000 to $149,999 income range, which is the most common income bracket and makes up 31.7% of all families. Conversely, the $15,000 to $24,999 income bracket is the least frequent group with only 9 families (0.3%) belonging to this category.
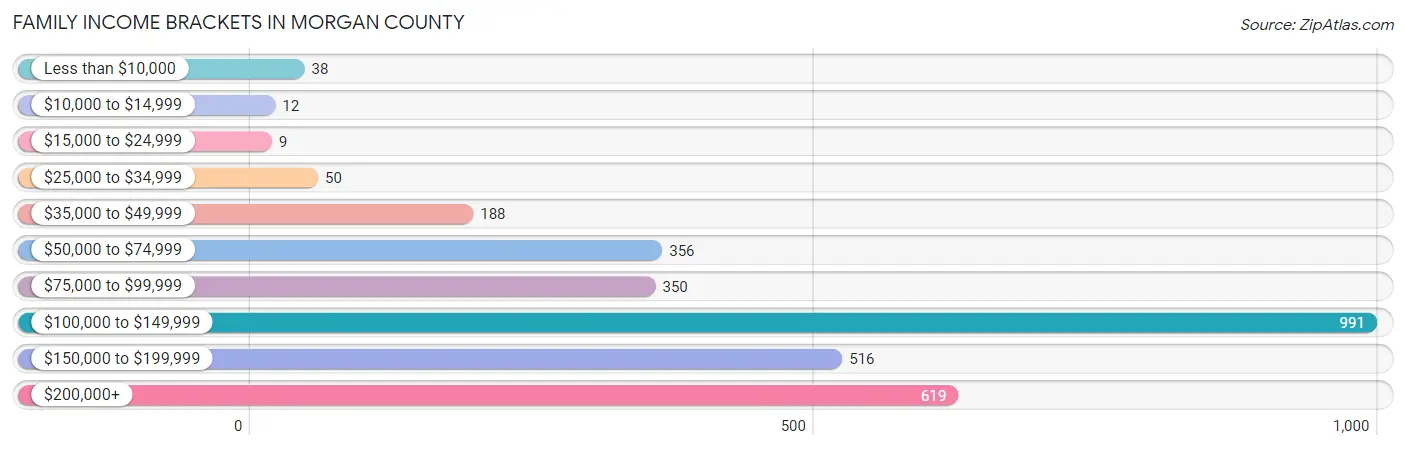
| Income Bracket | # Families | % Families |
| Less than $10,000 | 38 | 1.2% |
| $10,000 to $14,999 | 12 | 0.4% |
| $15,000 to $24,999 | 9 | 0.3% |
| $25,000 to $34,999 | 50 | 1.6% |
| $35,000 to $49,999 | 188 | 6.0% |
| $50,000 to $74,999 | 356 | 11.4% |
| $75,000 to $99,999 | 350 | 11.2% |
| $100,000 to $149,999 | 991 | 31.7% |
| $150,000 to $199,999 | 516 | 16.5% |
| $200,000+ | 619 | 19.8% |
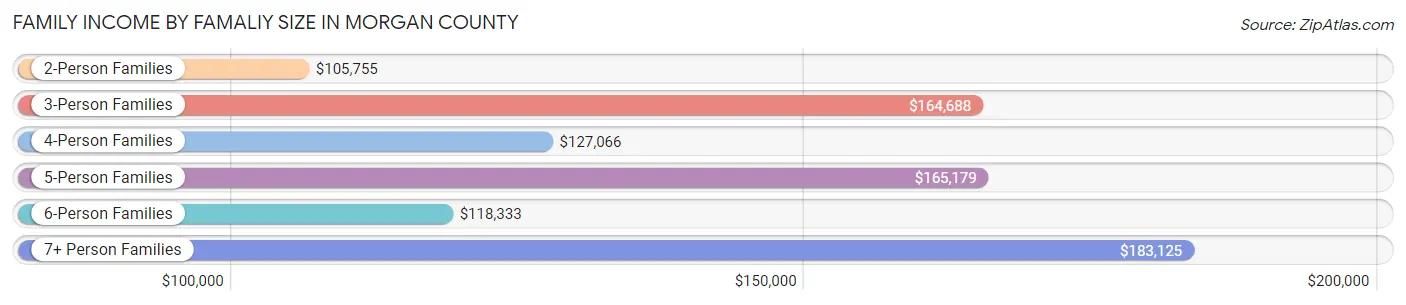
Family Income by Famaliy Size in Morgan County
7+ person families (262 | 8.4%) account for the highest median family income in Morgan County with $183,125 per family, while 3-person families (502 | 16.1%) have the highest median income of $54,896 per family member.
| Income Bracket | # Families | Median Income |
| 2-Person Families | 1,114 (35.6%) | $105,755 |
| 3-Person Families | 502 (16.1%) | $164,688 |
| 4-Person Families | 429 (13.7%) | $127,066 |
| 5-Person Families | 480 (15.4%) | $165,179 |
| 6-Person Families | 338 (10.8%) | $118,333 |
| 7+ Person Families | 262 (8.4%) | $183,125 |
| Total | 3,125 (100.0%) | $127,052 |
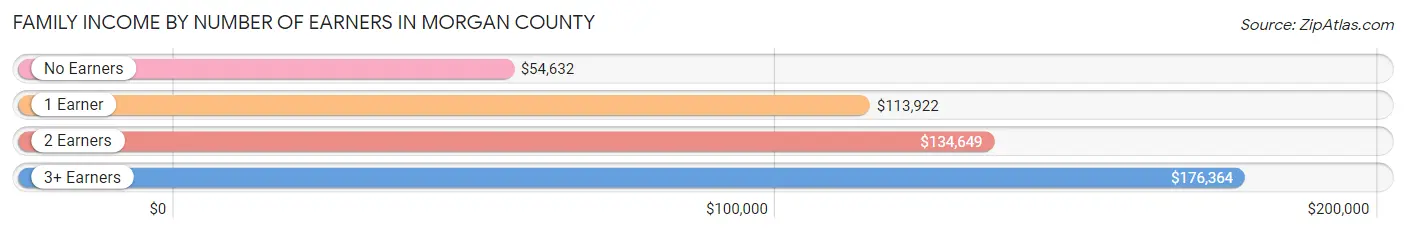
Family Income by Number of Earners in Morgan County
The median family income in Morgan County is $127,052, with families comprising 3+ earners (702) having the highest median family income of $176,364, while families with no earners (371) have the lowest median family income of $54,632, accounting for 22.5% and 11.9% of families, respectively.
| Number of Earners | # Families | Median Income |
| No Earners | 371 (11.9%) | $54,632 |
| 1 Earner | 816 (26.1%) | $113,922 |
| 2 Earners | 1,236 (39.6%) | $134,649 |
| 3+ Earners | 702 (22.5%) | $176,364 |
| Total | 3,125 (100.0%) | $127,052 |
Household Income in Morgan County
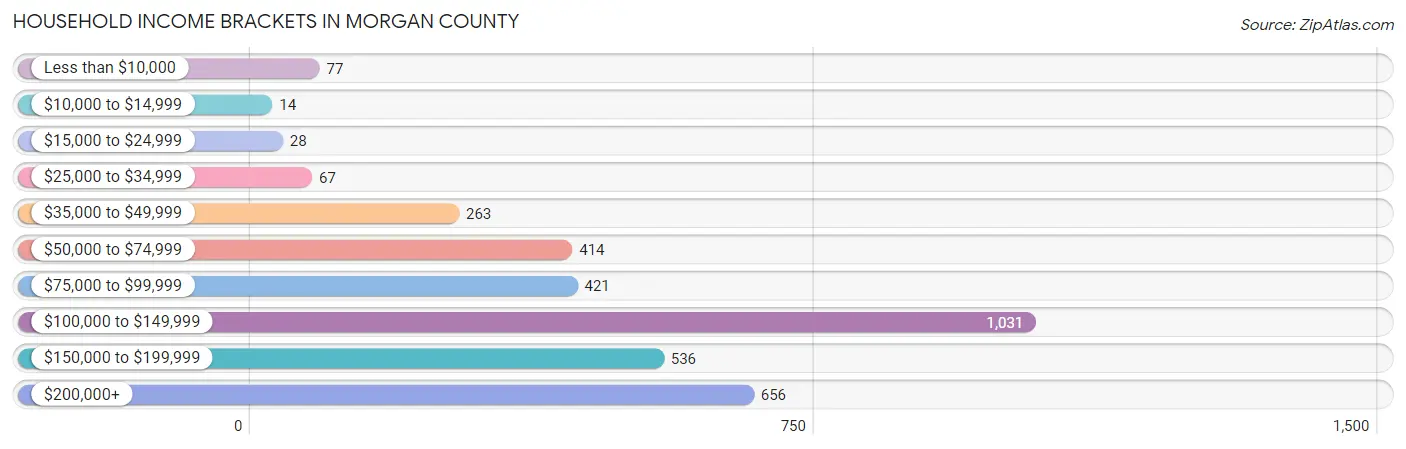
Household Income Brackets in Morgan County
With 1,031 households falling in the category, the $100,000 to $149,999 income range is the most frequent in Morgan County, accounting for 29.4% of all households. In contrast, only 14 households (0.4%) fall into the $10,000 to $14,999 income bracket, making it the least populous group.
| Income Bracket | # Households | % Households |
| Less than $10,000 | 77 | 2.2% |
| $10,000 to $14,999 | 14 | 0.4% |
| $15,000 to $24,999 | 28 | 0.8% |
| $25,000 to $34,999 | 67 | 1.9% |
| $35,000 to $49,999 | 263 | 7.5% |
| $50,000 to $74,999 | 414 | 11.8% |
| $75,000 to $99,999 | 421 | 12.0% |
| $100,000 to $149,999 | 1,031 | 29.4% |
| $150,000 to $199,999 | 536 | 15.3% |
| $200,000+ | 656 | 18.7% |
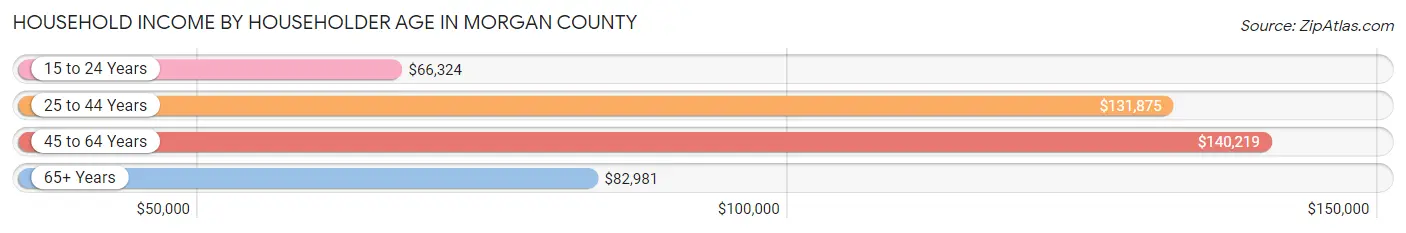
Household Income by Householder Age in Morgan County
The median household income in Morgan County is $120,854, with the highest median household income of $140,219 found in the 45 to 64 years age bracket for the primary householder. A total of 1,544 households (44.0%) fall into this category. Meanwhile, the 15 to 24 years age bracket for the primary householder has the lowest median household income of $66,324, with 60 households (1.7%) in this group.
| Income Bracket | # Households | Median Income |
| 15 to 24 Years | 60 (1.7%) | $66,324 |
| 25 to 44 Years | 1,115 (31.8%) | $131,875 |
| 45 to 64 Years | 1,544 (44.0%) | $140,219 |
| 65+ Years | 787 (22.5%) | $82,981 |
| Total | 3,506 (100.0%) | $120,854 |
Poverty in Morgan County
Income Below Poverty by Sex and Age in Morgan County
With 1.7% poverty level for males and 1.7% for females among the residents of Morgan County, under 5 year old males and 75 year old and over females are the most vulnerable to poverty, with 36 males (8.0%) and 30 females (9.7%) in their respective age groups living below the poverty level.
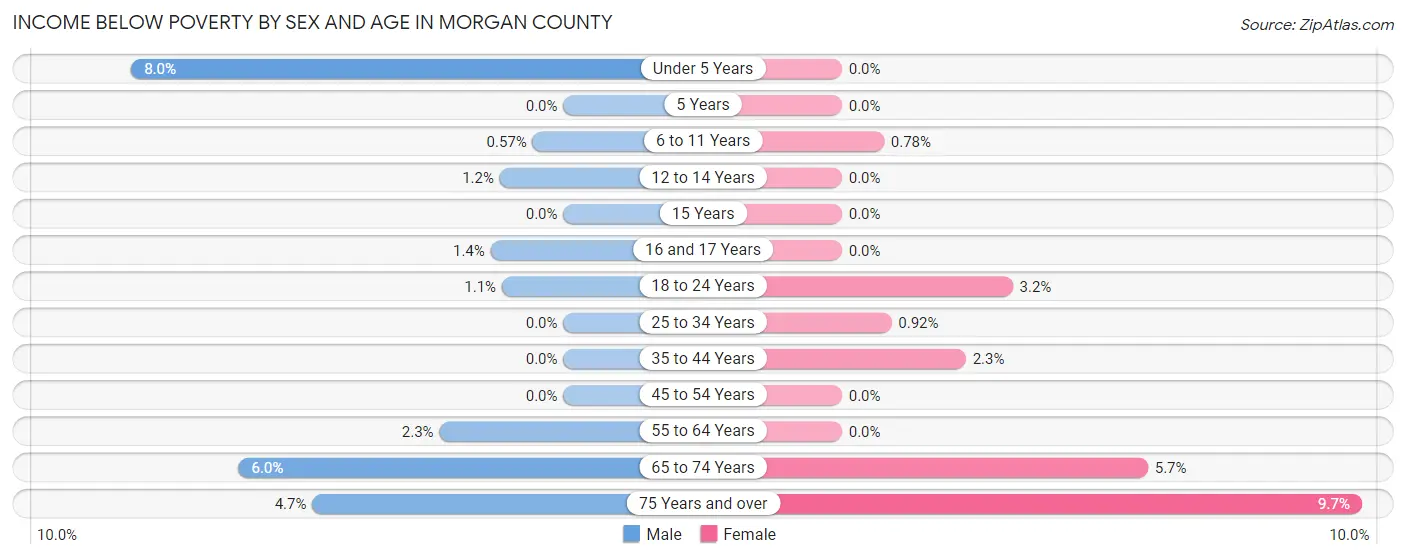
| Age Bracket | Male | Female |
| Under 5 Years | 36 (8.0%) | 0 (0.0%) |
| 5 Years | 0 (0.0%) | 0 (0.0%) |
| 6 to 11 Years | 5 (0.6%) | 5 (0.8%) |
| 12 to 14 Years | 4 (1.2%) | 0 (0.0%) |
| 15 Years | 0 (0.0%) | 0 (0.0%) |
| 16 and 17 Years | 4 (1.3%) | 0 (0.0%) |
| 18 to 24 Years | 7 (1.1%) | 18 (3.2%) |
| 25 to 34 Years | 0 (0.0%) | 5 (0.9%) |
| 35 to 44 Years | 0 (0.0%) | 19 (2.3%) |
| 45 to 54 Years | 0 (0.0%) | 0 (0.0%) |
| 55 to 64 Years | 15 (2.3%) | 0 (0.0%) |
| 65 to 74 Years | 26 (6.0%) | 26 (5.7%) |
| 75 Years and over | 13 (4.7%) | 30 (9.7%) |
| Total | 110 (1.7%) | 103 (1.7%) |
Income Above Poverty by Sex and Age in Morgan County
According to the poverty statistics in Morgan County, males aged 5 years and females aged under 5 years are the age groups that are most secure financially, with 100.0% of males and 100.0% of females in these age groups living above the poverty line.
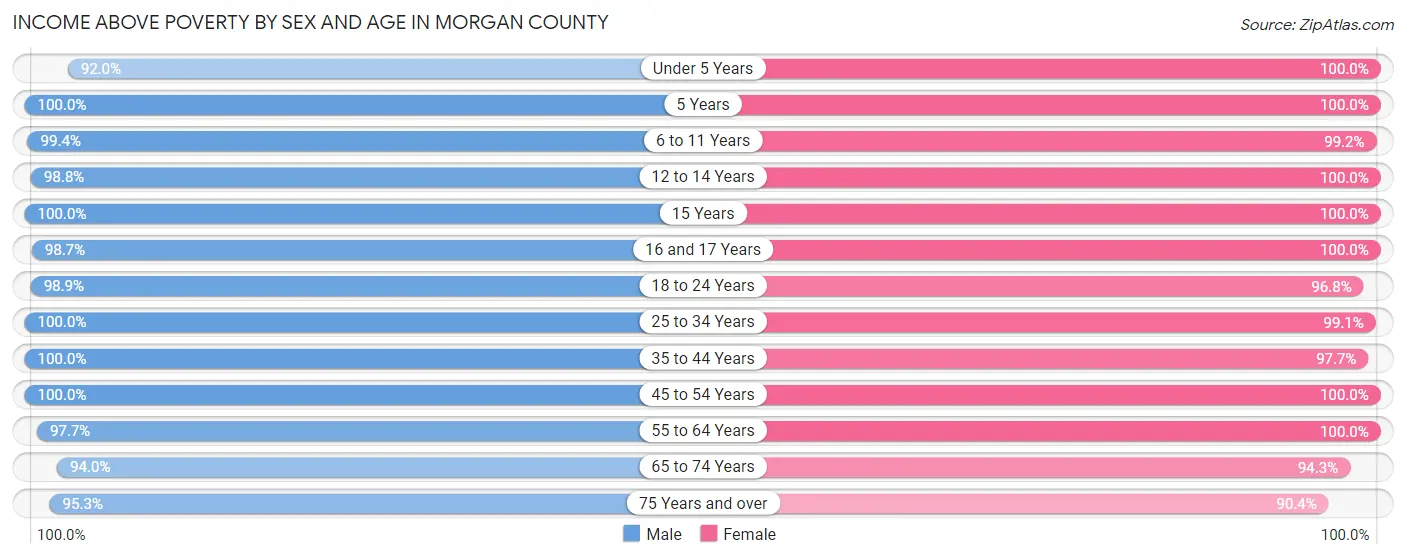
| Age Bracket | Male | Female |
| Under 5 Years | 413 (92.0%) | 395 (100.0%) |
| 5 Years | 137 (100.0%) | 68 (100.0%) |
| 6 to 11 Years | 877 (99.4%) | 639 (99.2%) |
| 12 to 14 Years | 335 (98.8%) | 475 (100.0%) |
| 15 Years | 196 (100.0%) | 149 (100.0%) |
| 16 and 17 Years | 293 (98.7%) | 214 (100.0%) |
| 18 to 24 Years | 606 (98.9%) | 549 (96.8%) |
| 25 to 34 Years | 513 (100.0%) | 541 (99.1%) |
| 35 to 44 Years | 865 (100.0%) | 808 (97.7%) |
| 45 to 54 Years | 756 (100.0%) | 743 (100.0%) |
| 55 to 64 Years | 637 (97.7%) | 549 (100.0%) |
| 65 to 74 Years | 405 (94.0%) | 432 (94.3%) |
| 75 Years and over | 266 (95.3%) | 281 (90.3%) |
| Total | 6,299 (98.3%) | 5,843 (98.3%) |
Income Below Poverty Among Married-Couple Families in Morgan County
The poverty statistics for married-couple families in Morgan County show that 0.9% or 26 of the total 2,810 families live below the poverty line. Families with no children have the highest poverty rate of 2.0%, comprising of 26 families. On the other hand, families with 1 or 2 children have the lowest poverty rate of 0.0%, which includes 0 families.
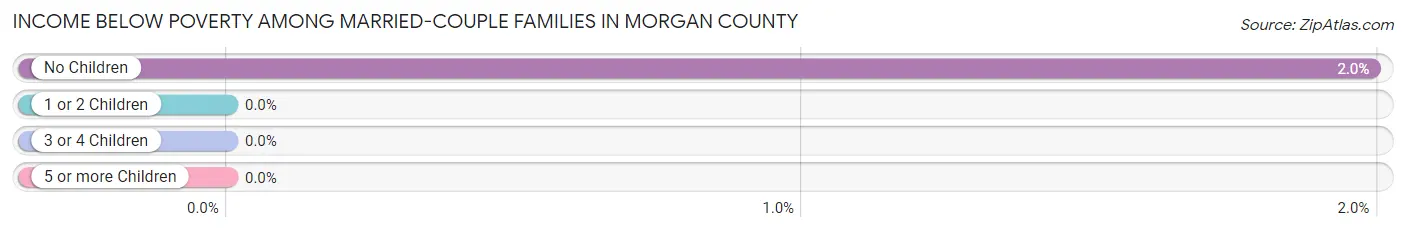
| Children | Above Poverty | Below Poverty |
| No Children | 1,283 (98.0%) | 26 (2.0%) |
| 1 or 2 Children | 724 (100.0%) | 0 (0.0%) |
| 3 or 4 Children | 642 (100.0%) | 0 (0.0%) |
| 5 or more Children | 135 (100.0%) | 0 (0.0%) |
| Total | 2,784 (99.1%) | 26 (0.9%) |
Income Below Poverty Among Single-Parent Households in Morgan County
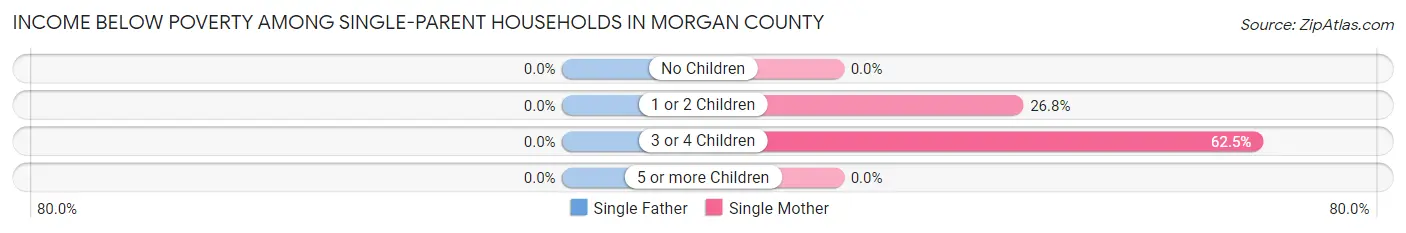
| Children | Single Father | Single Mother |
| No Children | 0 (0.0%) | 0 (0.0%) |
| 1 or 2 Children | 0 (0.0%) | 19 (26.8%) |
| 3 or 4 Children | 0 (0.0%) | 5 (62.5%) |
| 5 or more Children | 0 (0.0%) | 0 (0.0%) |
| Total | 0 (0.0%) | 24 (11.9%) |
Income Below Poverty Among Married-Couple vs Single-Parent Households in Morgan County
The poverty data for Morgan County shows that 26 of the married-couple family households (0.9%) and 24 of the single-parent households (7.6%) are living below the poverty level. Within the married-couple family households, those with no children have the highest poverty rate, with 26 households (2.0%) falling below the poverty line. Among the single-parent households, those with 3 or 4 children have the highest poverty rate, with 5 household (33.3%) living below poverty.
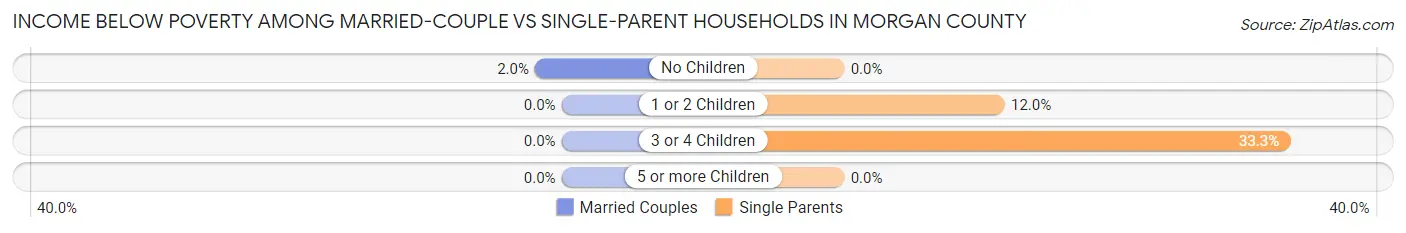
| Children | Married-Couple Families | Single-Parent Households |
| No Children | 26 (2.0%) | 0 (0.0%) |
| 1 or 2 Children | 0 (0.0%) | 19 (11.9%) |
| 3 or 4 Children | 0 (0.0%) | 5 (33.3%) |
| 5 or more Children | 0 (0.0%) | 0 (0.0%) |
| Total | 26 (0.9%) | 24 (7.6%) |
Employment Characteristics in Morgan County
Employment by Class of Employer in Morgan County
Among the 5,292 employed individuals in Morgan County, private company employees (3,287 | 62.1%), self-employed (incorporated) (491 | 9.3%), and local government employees (435 | 8.2%) make up the most common classes of employment.
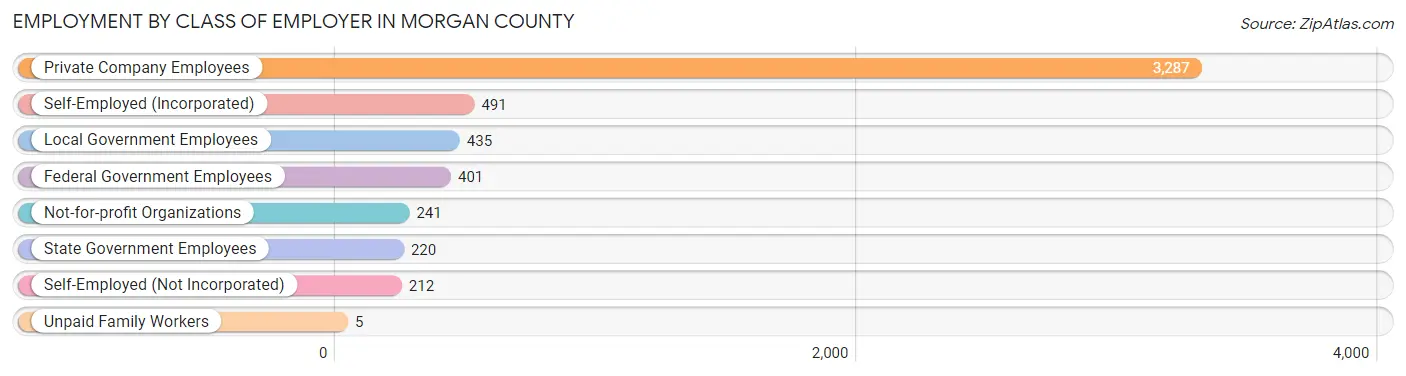
| Employer Class | # Employees | % Employees |
| Private Company Employees | 3,287 | 62.1% |
| Self-Employed (Incorporated) | 491 | 9.3% |
| Self-Employed (Not Incorporated) | 212 | 4.0% |
| Not-for-profit Organizations | 241 | 4.5% |
| Local Government Employees | 435 | 8.2% |
| State Government Employees | 220 | 4.2% |
| Federal Government Employees | 401 | 7.6% |
| Unpaid Family Workers | 5 | 0.1% |
| Total | 5,292 | 100.0% |
Employment Status by Age in Morgan County
According to the labor force statistics for Morgan County, out of the total population over 16 years of age (8,631), 63.7% or 5,498 individuals are in the labor force, with 1.7% or 93 of them unemployed. The age group with the highest labor force participation rate is 20 to 24 years, with 91.9% or 726 individuals in the labor force. Within the labor force, the 25 to 29 years age range has the highest percentage of unemployed individuals, with 8.2% or 27 of them being unemployed.
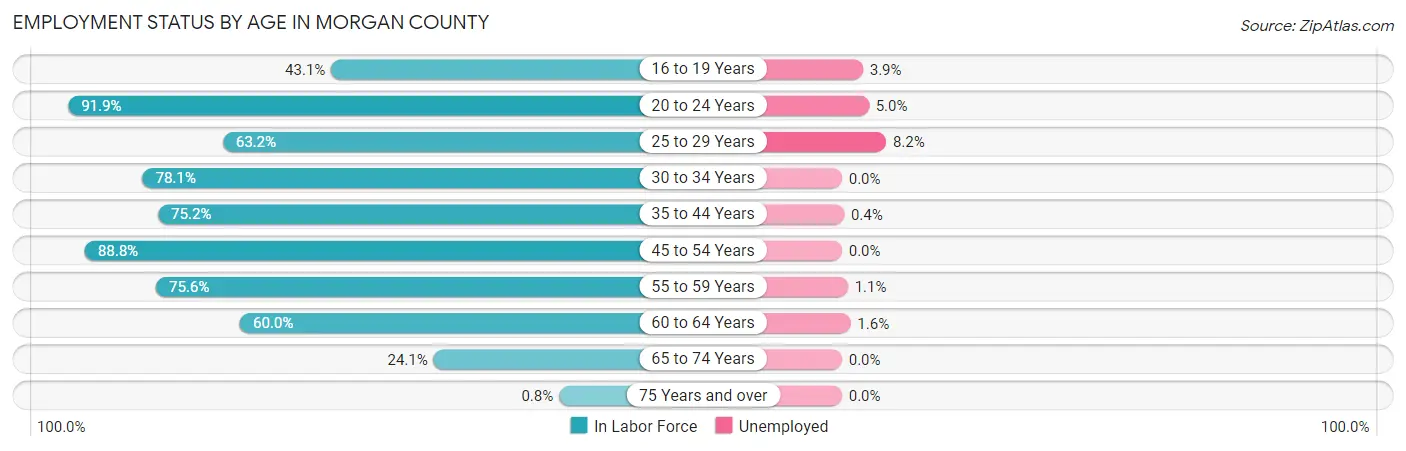
| Age Bracket | In Labor Force | Unemployed |
| 16 to 19 Years | 388 (43.1%) | 15 (3.9%) |
| 20 to 24 Years | 726 (91.9%) | 36 (5.0%) |
| 25 to 29 Years | 331 (63.2%) | 27 (8.2%) |
| 30 to 34 Years | 418 (78.1%) | 0 (0.0%) |
| 35 to 44 Years | 1,272 (75.2%) | 5 (0.4%) |
| 45 to 54 Years | 1,331 (88.8%) | 0 (0.0%) |
| 55 to 59 Years | 441 (75.6%) | 5 (1.1%) |
| 60 to 64 Years | 371 (60.0%) | 6 (1.6%) |
| 65 to 74 Years | 214 (24.1%) | 0 (0.0%) |
| 75 Years and over | 5 (0.8%) | 0 (0.0%) |
| Total | 5,498 (63.7%) | 93 (1.7%) |
Employment Status by Educational Attainment in Morgan County
According to labor force statistics for Morgan County, 76.4% of individuals (4,165) out of the total population between 25 and 64 years of age (5,451) are in the labor force, with 1.0% or 42 of them being unemployed. The group with the highest labor force participation rate are those with the educational attainment of bachelor's degree or higher, with 90.9% or 1,935 individuals in the labor force. Within the labor force, individuals with less than high school education have the highest percentage of unemployment, with 44.3% or 27 of them being unemployed.
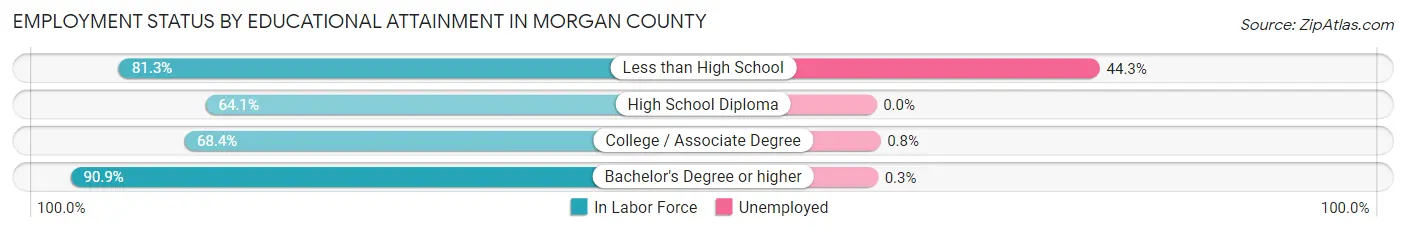
| Educational Attainment | In Labor Force | Unemployed |
| Less than High School | 61 (81.3%) | 33 (44.3%) |
| High School Diploma | 763 (64.1%) | 0 (0.0%) |
| College / Associate Degree | 1,406 (68.4%) | 16 (0.8%) |
| Bachelor's Degree or higher | 1,935 (90.9%) | 6 (0.3%) |
| Total | 4,165 (76.4%) | 55 (1.0%) |
Employment Occupations by Sex in Morgan County
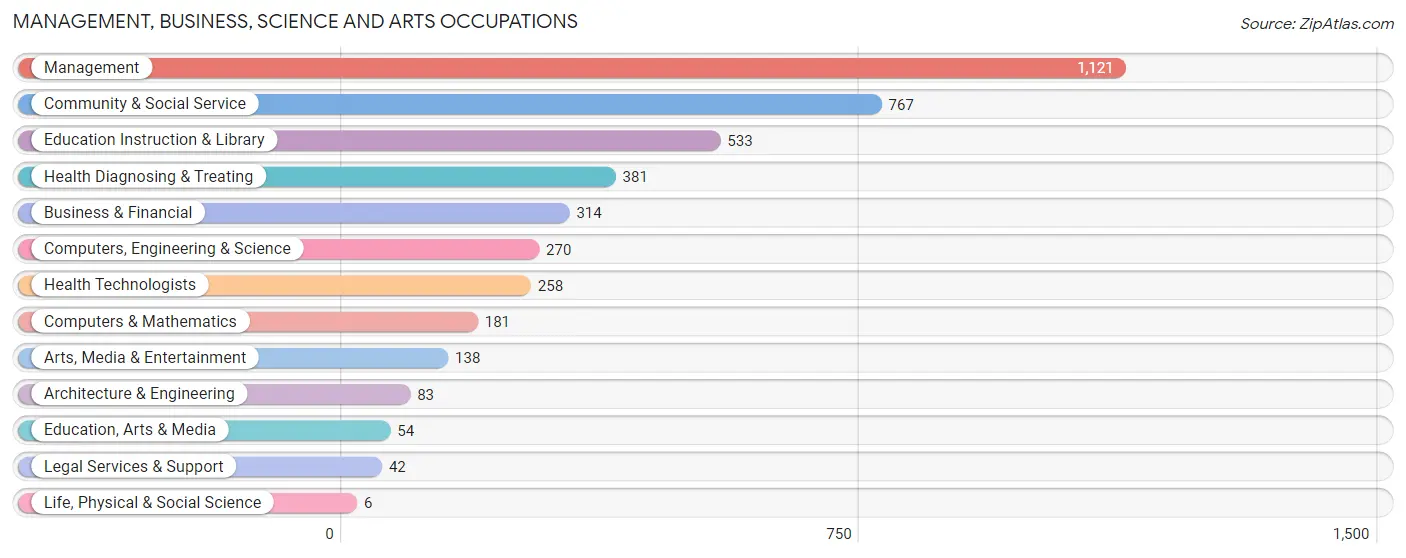
Management, Business, Science and Arts Occupations
The most common Management, Business, Science and Arts occupations in Morgan County are Management (1,121 | 20.7%), Community & Social Service (767 | 14.2%), Education Instruction & Library (533 | 9.9%), Health Diagnosing & Treating (381 | 7.0%), and Business & Financial (314 | 5.8%).
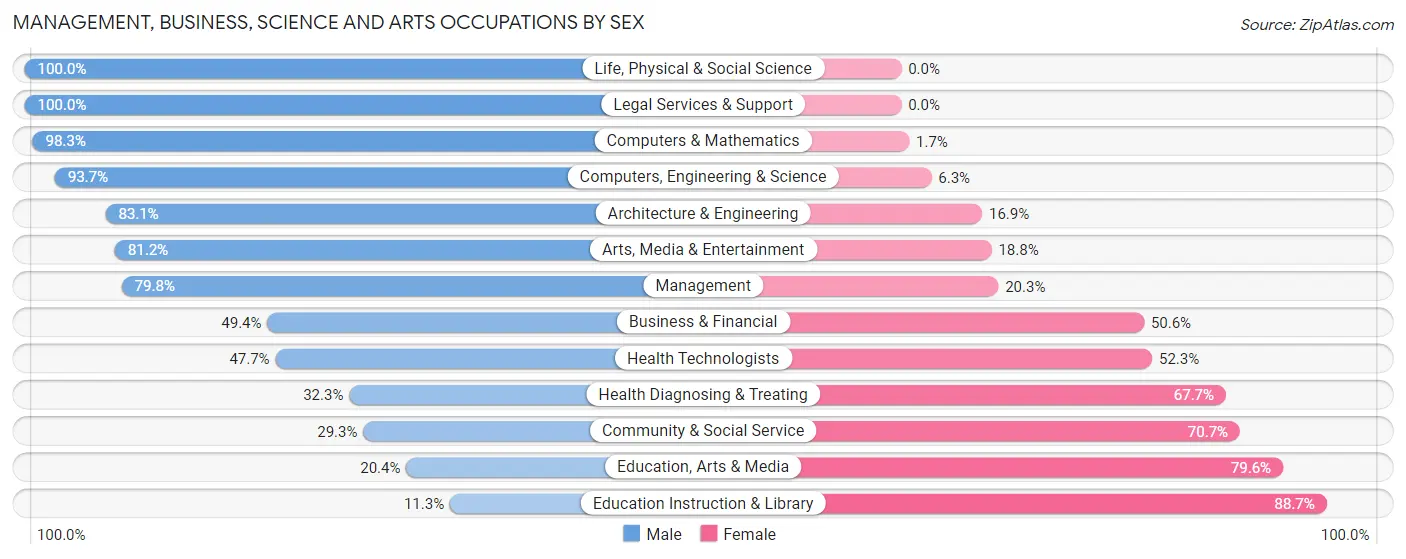
Management, Business, Science and Arts Occupations by Sex
Within the Management, Business, Science and Arts occupations in Morgan County, the most male-oriented occupations are Life, Physical & Social Science (100.0%), Legal Services & Support (100.0%), and Computers & Mathematics (98.3%), while the most female-oriented occupations are Education Instruction & Library (88.7%), Education, Arts & Media (79.6%), and Community & Social Service (70.7%).
| Occupation | Male | Female |
| Management | 894 (79.7%) | 227 (20.3%) |
| Business & Financial | 155 (49.4%) | 159 (50.6%) |
| Computers, Engineering & Science | 253 (93.7%) | 17 (6.3%) |
| Computers & Mathematics | 178 (98.3%) | 3 (1.7%) |
| Architecture & Engineering | 69 (83.1%) | 14 (16.9%) |
| Life, Physical & Social Science | 6 (100.0%) | 0 (0.0%) |
| Community & Social Service | 225 (29.3%) | 542 (70.7%) |
| Education, Arts & Media | 11 (20.4%) | 43 (79.6%) |
| Legal Services & Support | 42 (100.0%) | 0 (0.0%) |
| Education Instruction & Library | 60 (11.3%) | 473 (88.7%) |
| Arts, Media & Entertainment | 112 (81.2%) | 26 (18.8%) |
| Health Diagnosing & Treating | 123 (32.3%) | 258 (67.7%) |
| Health Technologists | 123 (47.7%) | 135 (52.3%) |
| Total (Category) | 1,650 (57.8%) | 1,203 (42.2%) |
| Total (Overall) | 3,117 (57.7%) | 2,287 (42.3%) |
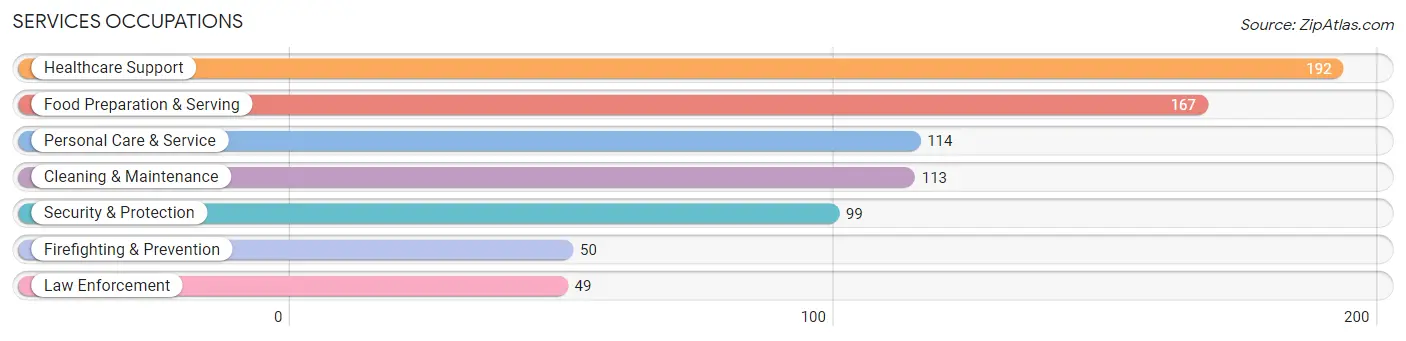
Services Occupations
The most common Services occupations in Morgan County are Healthcare Support (192 | 3.5%), Food Preparation & Serving (167 | 3.1%), Personal Care & Service (114 | 2.1%), Cleaning & Maintenance (113 | 2.1%), and Security & Protection (99 | 1.8%).
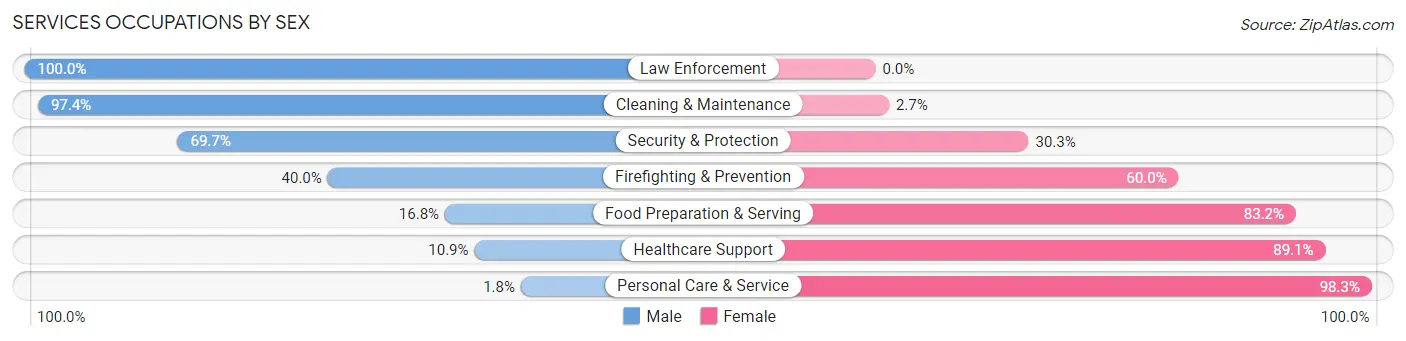
Services Occupations by Sex
Within the Services occupations in Morgan County, the most male-oriented occupations are Law Enforcement (100.0%), Cleaning & Maintenance (97.4%), and Security & Protection (69.7%), while the most female-oriented occupations are Personal Care & Service (98.3%), Healthcare Support (89.1%), and Food Preparation & Serving (83.2%).
| Occupation | Male | Female |
| Healthcare Support | 21 (10.9%) | 171 (89.1%) |
| Security & Protection | 69 (69.7%) | 30 (30.3%) |
| Firefighting & Prevention | 20 (40.0%) | 30 (60.0%) |
| Law Enforcement | 49 (100.0%) | 0 (0.0%) |
| Food Preparation & Serving | 28 (16.8%) | 139 (83.2%) |
| Cleaning & Maintenance | 110 (97.4%) | 3 (2.6%) |
| Personal Care & Service | 2 (1.8%) | 112 (98.3%) |
| Total (Category) | 230 (33.6%) | 455 (66.4%) |
| Total (Overall) | 3,117 (57.7%) | 2,287 (42.3%) |
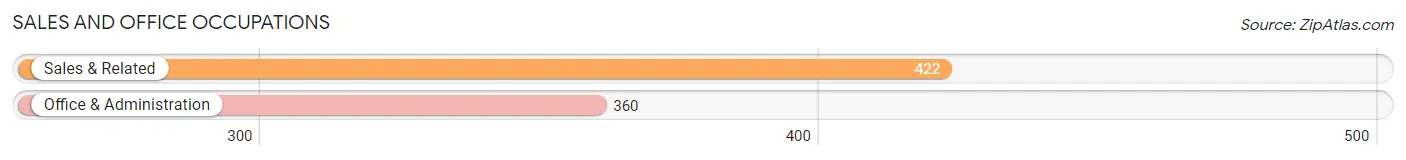
Sales and Office Occupations
The most common Sales and Office occupations in Morgan County are Sales & Related (422 | 7.8%), and Office & Administration (360 | 6.7%).
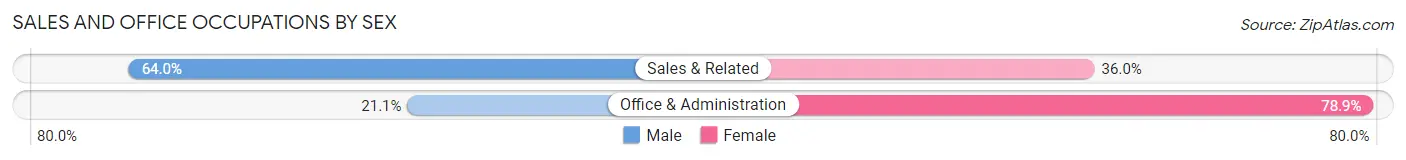
Sales and Office Occupations by Sex
| Occupation | Male | Female |
| Sales & Related | 270 (64.0%) | 152 (36.0%) |
| Office & Administration | 76 (21.1%) | 284 (78.9%) |
| Total (Category) | 346 (44.3%) | 436 (55.7%) |
| Total (Overall) | 3,117 (57.7%) | 2,287 (42.3%) |
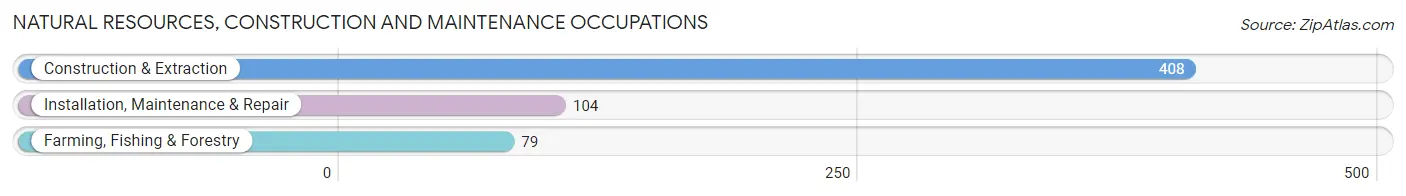
Natural Resources, Construction and Maintenance Occupations
The most common Natural Resources, Construction and Maintenance occupations in Morgan County are Construction & Extraction (408 | 7.5%), Installation, Maintenance & Repair (104 | 1.9%), and Farming, Fishing & Forestry (79 | 1.5%).
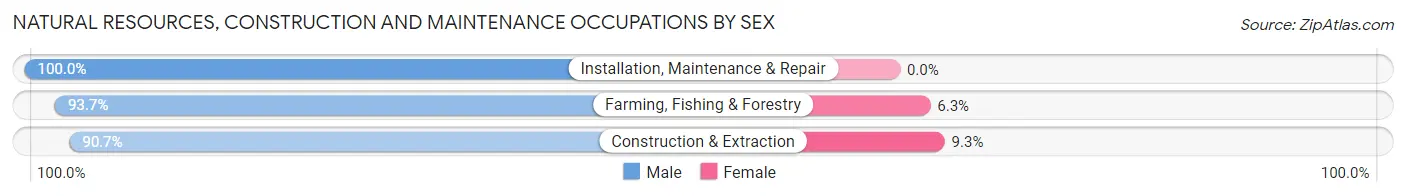
Natural Resources, Construction and Maintenance Occupations by Sex
| Occupation | Male | Female |
| Farming, Fishing & Forestry | 74 (93.7%) | 5 (6.3%) |
| Construction & Extraction | 370 (90.7%) | 38 (9.3%) |
| Installation, Maintenance & Repair | 104 (100.0%) | 0 (0.0%) |
| Total (Category) | 548 (92.7%) | 43 (7.3%) |
| Total (Overall) | 3,117 (57.7%) | 2,287 (42.3%) |
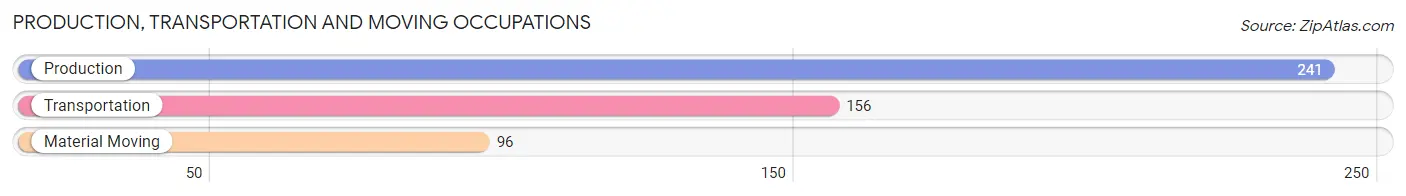
Production, Transportation and Moving Occupations
The most common Production, Transportation and Moving occupations in Morgan County are Production (241 | 4.5%), Transportation (156 | 2.9%), and Material Moving (96 | 1.8%).
Production, Transportation and Moving Occupations by Sex
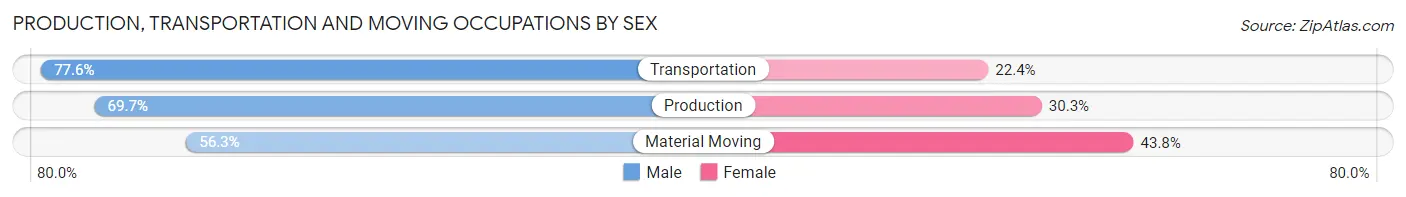
| Occupation | Male | Female |
| Production | 168 (69.7%) | 73 (30.3%) |
| Transportation | 121 (77.6%) | 35 (22.4%) |
| Material Moving | 54 (56.2%) | 42 (43.8%) |
| Total (Category) | 343 (69.6%) | 150 (30.4%) |
| Total (Overall) | 3,117 (57.7%) | 2,287 (42.3%) |
Employment Industries by Sex in Morgan County
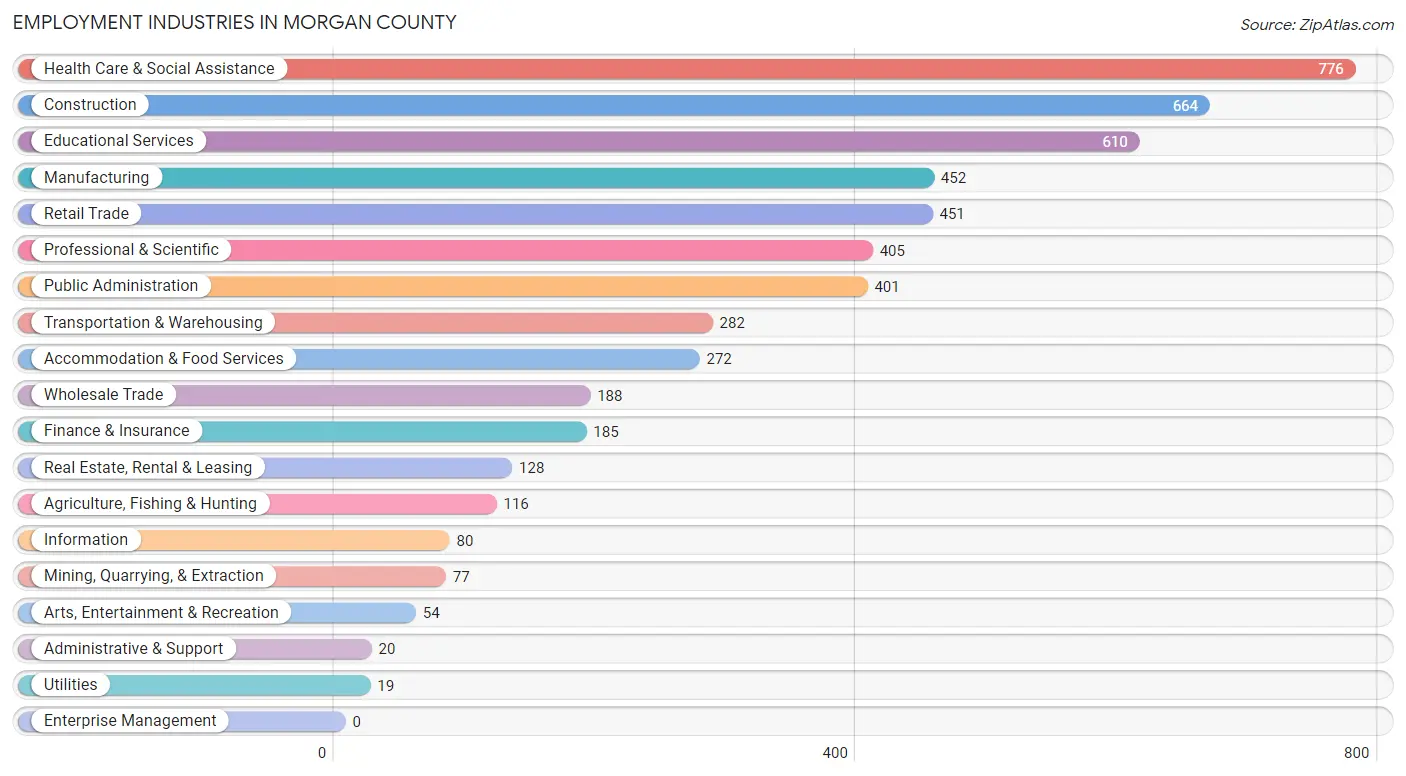
Employment Industries in Morgan County
The major employment industries in Morgan County include Health Care & Social Assistance (776 | 14.4%), Construction (664 | 12.3%), Educational Services (610 | 11.3%), Manufacturing (452 | 8.4%), and Retail Trade (451 | 8.4%).
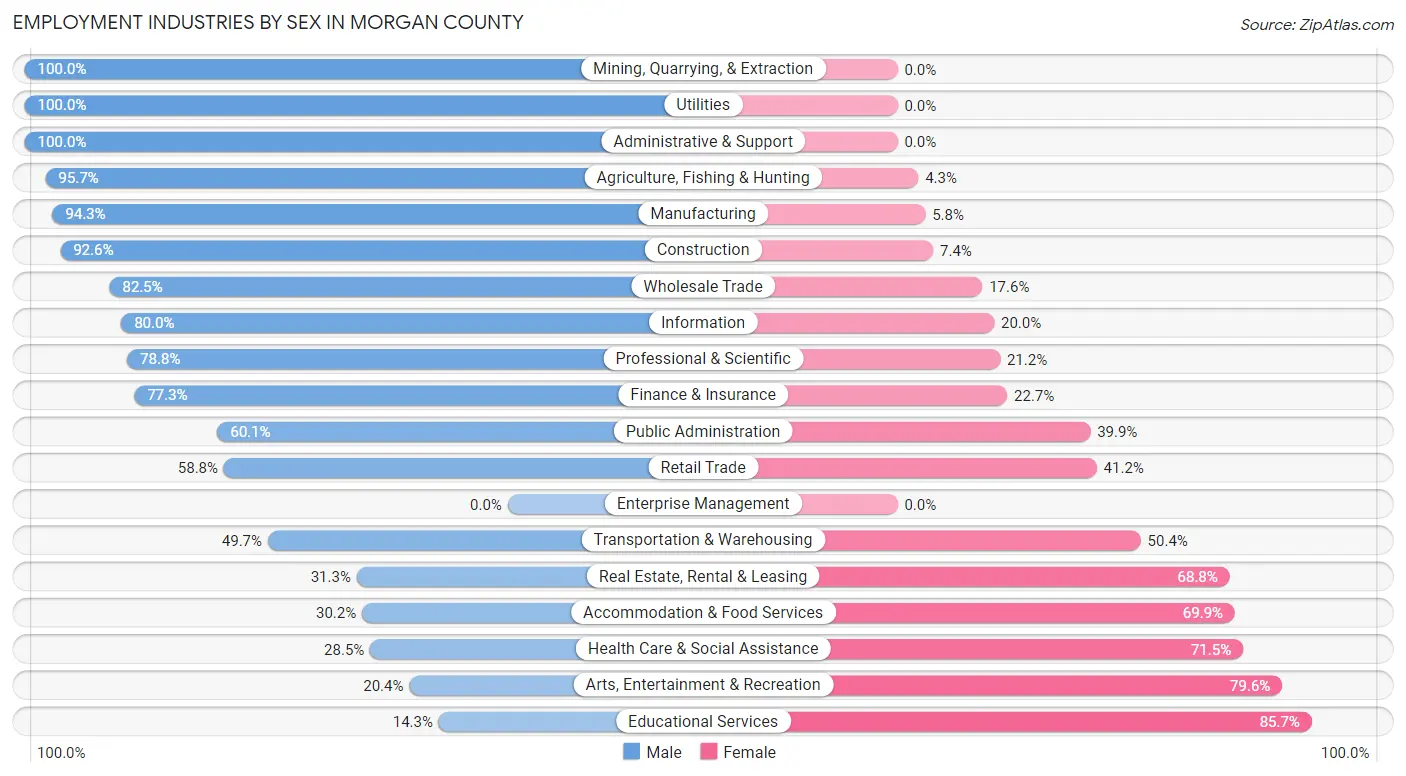
Employment Industries by Sex in Morgan County
The Morgan County industries that see more men than women are Mining, Quarrying, & Extraction (100.0%), Utilities (100.0%), and Administrative & Support (100.0%), whereas the industries that tend to have a higher number of women are Educational Services (85.7%), Arts, Entertainment & Recreation (79.6%), and Health Care & Social Assistance (71.5%).
| Industry | Male | Female |
| Agriculture, Fishing & Hunting | 111 (95.7%) | 5 (4.3%) |
| Mining, Quarrying, & Extraction | 77 (100.0%) | 0 (0.0%) |
| Construction | 615 (92.6%) | 49 (7.4%) |
| Manufacturing | 426 (94.3%) | 26 (5.8%) |
| Wholesale Trade | 155 (82.5%) | 33 (17.5%) |
| Retail Trade | 265 (58.8%) | 186 (41.2%) |
| Transportation & Warehousing | 140 (49.6%) | 142 (50.3%) |
| Utilities | 19 (100.0%) | 0 (0.0%) |
| Information | 64 (80.0%) | 16 (20.0%) |
| Finance & Insurance | 143 (77.3%) | 42 (22.7%) |
| Real Estate, Rental & Leasing | 40 (31.2%) | 88 (68.8%) |
| Professional & Scientific | 319 (78.8%) | 86 (21.2%) |
| Enterprise Management | 0 (0.0%) | 0 (0.0%) |
| Administrative & Support | 20 (100.0%) | 0 (0.0%) |
| Educational Services | 87 (14.3%) | 523 (85.7%) |
| Health Care & Social Assistance | 221 (28.5%) | 555 (71.5%) |
| Arts, Entertainment & Recreation | 11 (20.4%) | 43 (79.6%) |
| Accommodation & Food Services | 82 (30.1%) | 190 (69.9%) |
| Public Administration | 241 (60.1%) | 160 (39.9%) |
| Total | 3,117 (57.7%) | 2,287 (42.3%) |
Education in Morgan County
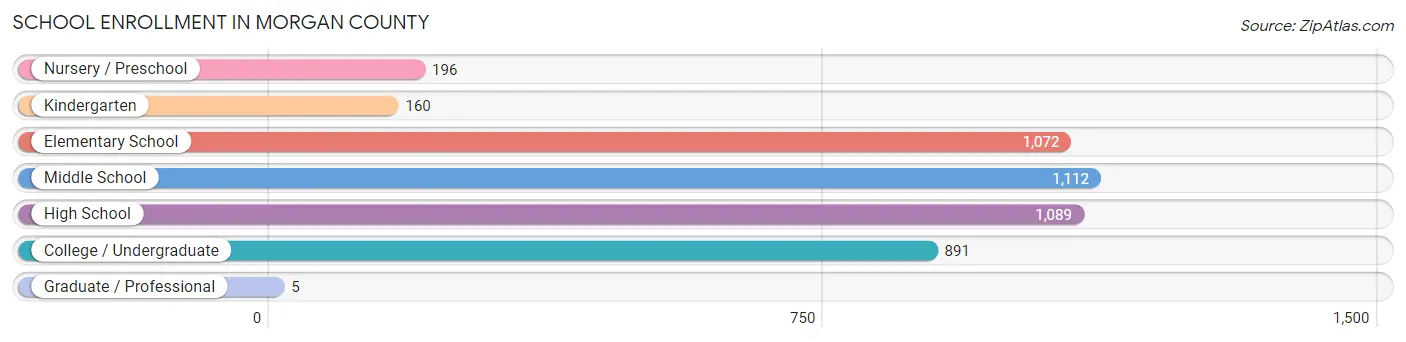
School Enrollment in Morgan County
The most common levels of schooling among the 4,525 students in Morgan County are middle school (1,112 | 24.6%), high school (1,089 | 24.1%), and elementary school (1,072 | 23.7%).
| School Level | # Students | % Students |
| Nursery / Preschool | 196 | 4.3% |
| Kindergarten | 160 | 3.5% |
| Elementary School | 1,072 | 23.7% |
| Middle School | 1,112 | 24.6% |
| High School | 1,089 | 24.1% |
| College / Undergraduate | 891 | 19.7% |
| Graduate / Professional | 5 | 0.1% |
| Total | 4,525 | 100.0% |
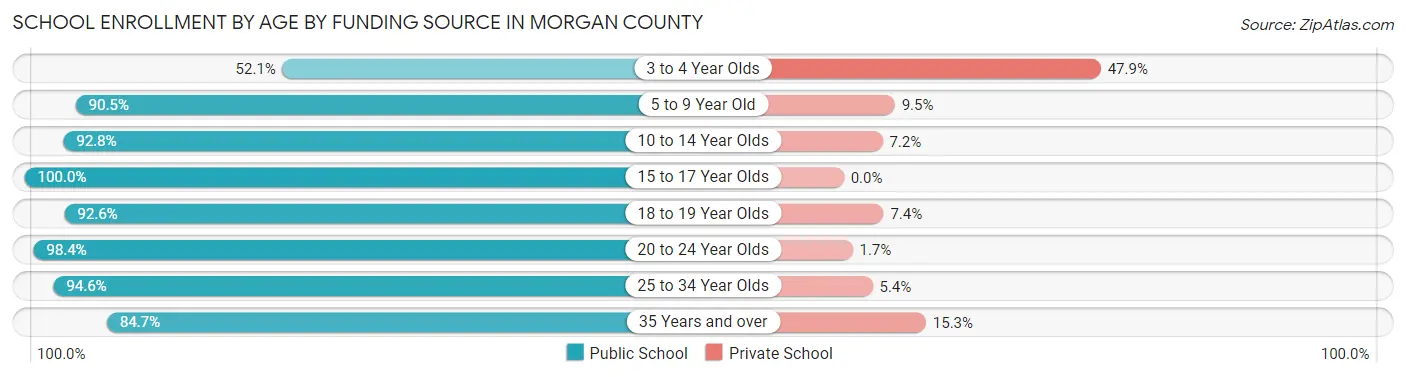
School Enrollment by Age by Funding Source in Morgan County
Out of a total of 4,525 students who are enrolled in schools in Morgan County, 335 (7.4%) attend a private institution, while the remaining 4,190 (92.6%) are enrolled in public schools. The age group of 3 to 4 year olds has the highest likelihood of being enrolled in private schools, with 79 (47.9% in the age bracket) enrolled. Conversely, the age group of 15 to 17 year olds has the lowest likelihood of being enrolled in a private school, with 856 (100.0% in the age bracket) attending a public institution.
| Age Bracket | Public School | Private School |
| 3 to 4 Year Olds | 86 (52.1%) | 79 (47.9%) |
| 5 to 9 Year Old | 1,018 (90.5%) | 107 (9.5%) |
| 10 to 14 Year Olds | 1,208 (92.8%) | 94 (7.2%) |
| 15 to 17 Year Olds | 856 (100.0%) | 0 (0.0%) |
| 18 to 19 Year Olds | 262 (92.6%) | 21 (7.4%) |
| 20 to 24 Year Olds | 538 (98.4%) | 9 (1.7%) |
| 25 to 34 Year Olds | 141 (94.6%) | 8 (5.4%) |
| 35 Years and over | 83 (84.7%) | 15 (15.3%) |
| Total | 4,190 (92.6%) | 335 (7.4%) |
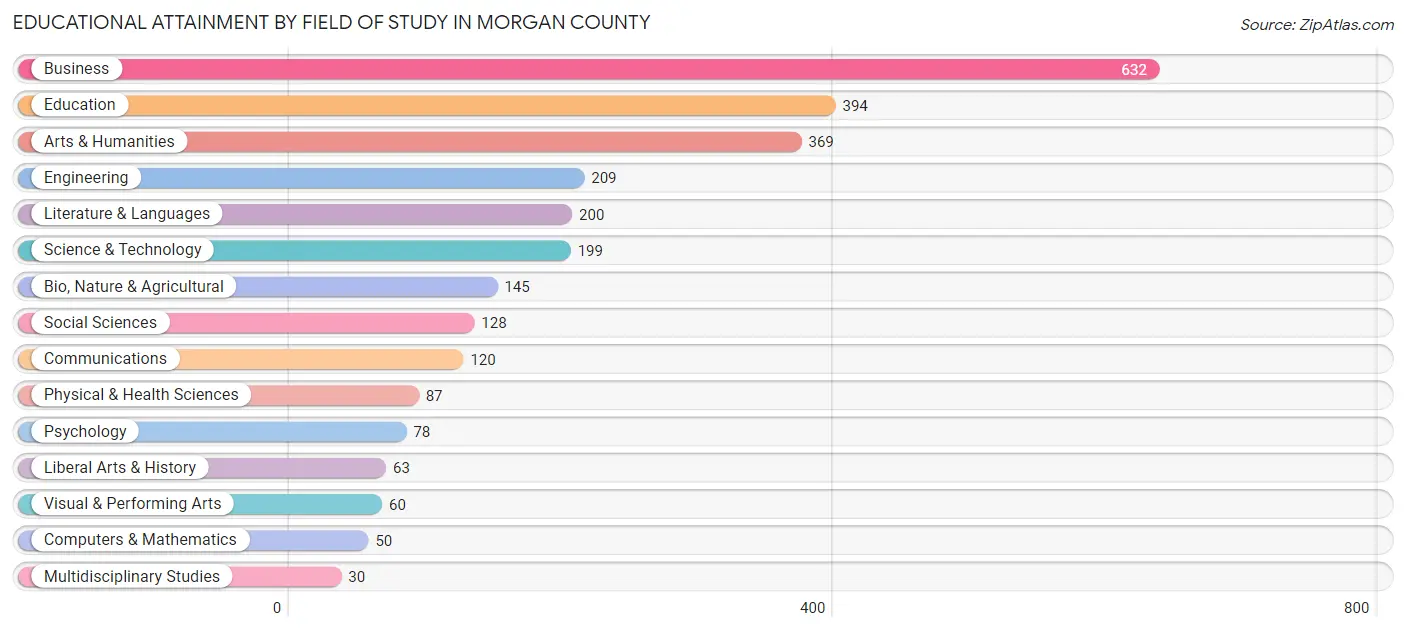
Educational Attainment by Field of Study in Morgan County
Business (632 | 22.9%), education (394 | 14.2%), arts & humanities (369 | 13.4%), engineering (209 | 7.6%), and literature & languages (200 | 7.2%) are the most common fields of study among 2,764 individuals in Morgan County who have obtained a bachelor's degree or higher.
| Field of Study | # Graduates | % Graduates |
| Computers & Mathematics | 50 | 1.8% |
| Bio, Nature & Agricultural | 145 | 5.2% |
| Physical & Health Sciences | 87 | 3.2% |
| Psychology | 78 | 2.8% |
| Social Sciences | 128 | 4.6% |
| Engineering | 209 | 7.6% |
| Multidisciplinary Studies | 30 | 1.1% |
| Science & Technology | 199 | 7.2% |
| Business | 632 | 22.9% |
| Education | 394 | 14.2% |
| Literature & Languages | 200 | 7.2% |
| Liberal Arts & History | 63 | 2.3% |
| Visual & Performing Arts | 60 | 2.2% |
| Communications | 120 | 4.3% |
| Arts & Humanities | 369 | 13.4% |
| Total | 2,764 | 100.0% |
Transportation & Commute in Morgan County
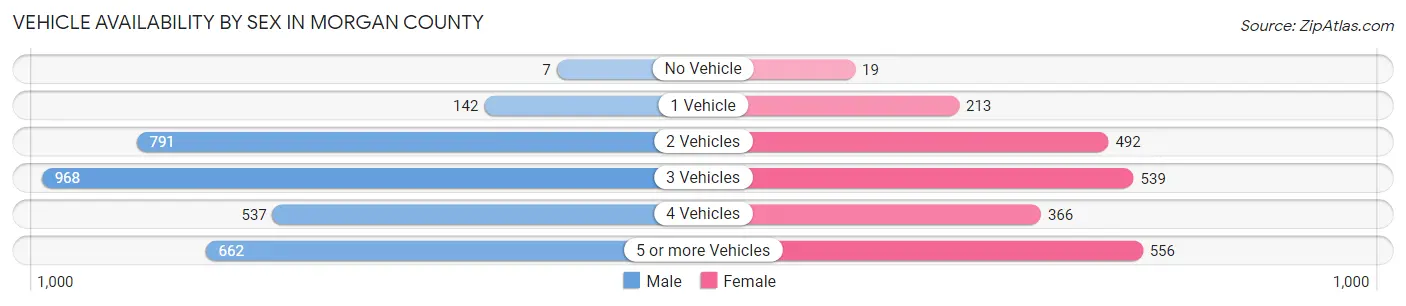
Vehicle Availability by Sex in Morgan County
The most prevalent vehicle ownership categories in Morgan County are males with 3 vehicles (968, accounting for 31.2%) and females with 3 vehicles (539, making up 44.3%).
| Vehicles Available | Male | Female |
| No Vehicle | 7 (0.2%) | 19 (0.9%) |
| 1 Vehicle | 142 (4.6%) | 213 (9.8%) |
| 2 Vehicles | 791 (25.5%) | 492 (22.5%) |
| 3 Vehicles | 968 (31.2%) | 539 (24.7%) |
| 4 Vehicles | 537 (17.3%) | 366 (16.8%) |
| 5 or more Vehicles | 662 (21.3%) | 556 (25.5%) |
| Total | 3,107 (100.0%) | 2,185 (100.0%) |
Commute Time in Morgan County
The most frequently occuring commute durations in Morgan County are 30 to 34 minutes (846 commuters, 17.7%), 20 to 24 minutes (567 commuters, 11.9%), and less than 5 minutes (445 commuters, 9.3%).
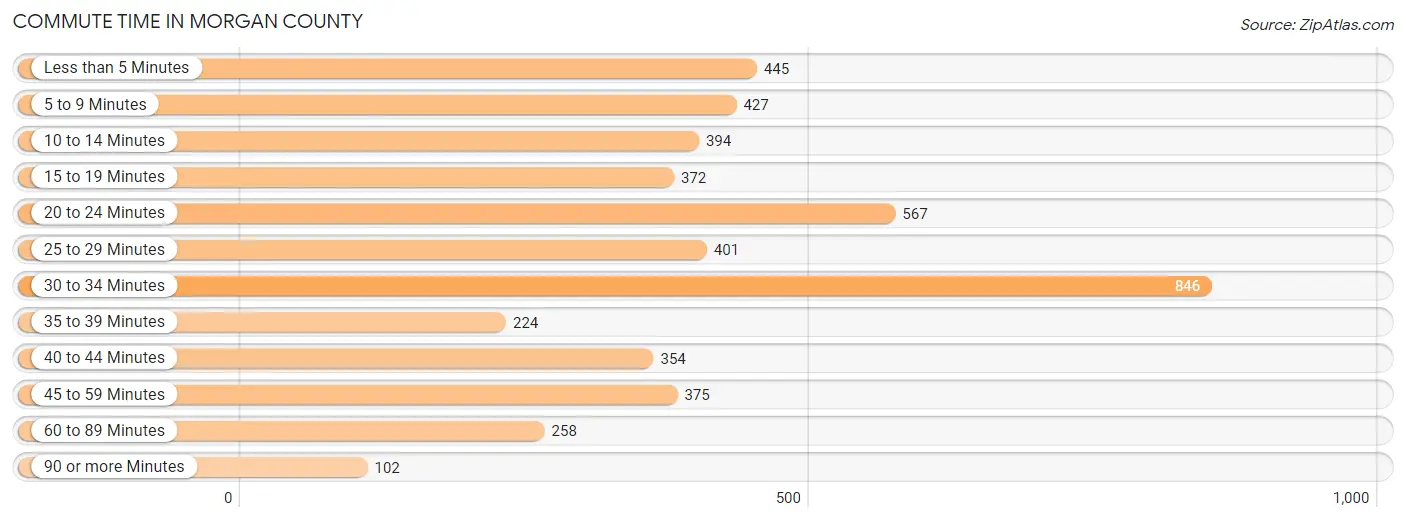
| Commute Time | # Commuters | % Commuters |
| Less than 5 Minutes | 445 | 9.3% |
| 5 to 9 Minutes | 427 | 9.0% |
| 10 to 14 Minutes | 394 | 8.3% |
| 15 to 19 Minutes | 372 | 7.8% |
| 20 to 24 Minutes | 567 | 11.9% |
| 25 to 29 Minutes | 401 | 8.4% |
| 30 to 34 Minutes | 846 | 17.7% |
| 35 to 39 Minutes | 224 | 4.7% |
| 40 to 44 Minutes | 354 | 7.4% |
| 45 to 59 Minutes | 375 | 7.9% |
| 60 to 89 Minutes | 258 | 5.4% |
| 90 or more Minutes | 102 | 2.1% |
Commute Time by Sex in Morgan County
The most common commute times in Morgan County are 30 to 34 minutes (516 commuters, 18.1%) for males and 30 to 34 minutes (330 commuters, 17.3%) for females.
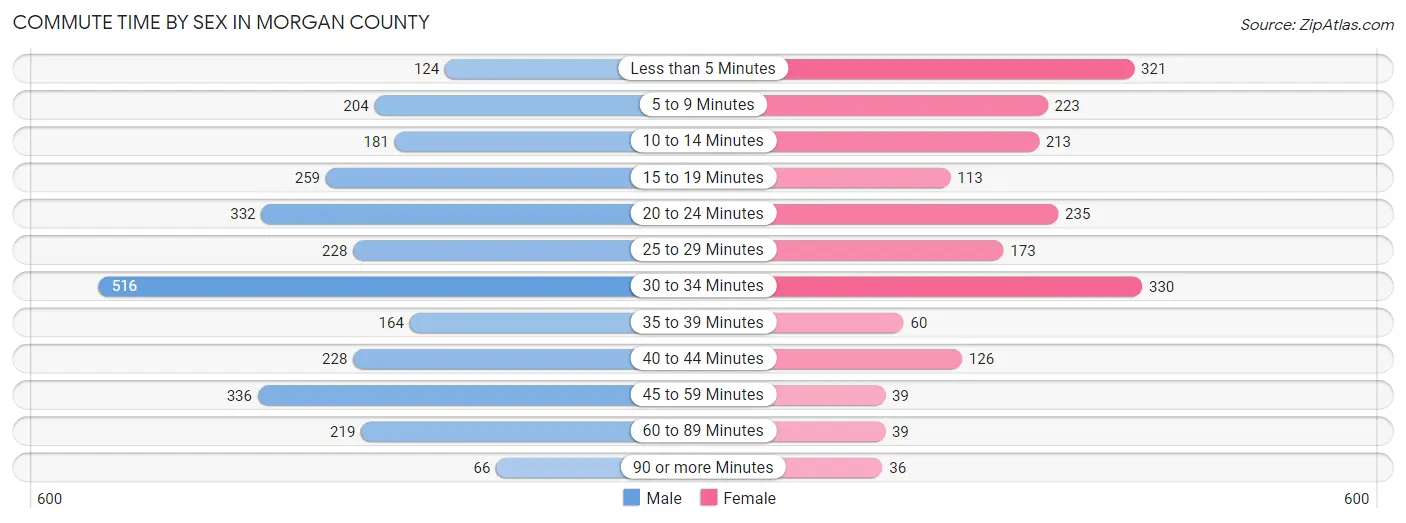
| Commute Time | Male | Female |
| Less than 5 Minutes | 124 (4.3%) | 321 (16.8%) |
| 5 to 9 Minutes | 204 (7.1%) | 223 (11.7%) |
| 10 to 14 Minutes | 181 (6.3%) | 213 (11.2%) |
| 15 to 19 Minutes | 259 (9.1%) | 113 (5.9%) |
| 20 to 24 Minutes | 332 (11.6%) | 235 (12.3%) |
| 25 to 29 Minutes | 228 (8.0%) | 173 (9.1%) |
| 30 to 34 Minutes | 516 (18.1%) | 330 (17.3%) |
| 35 to 39 Minutes | 164 (5.7%) | 60 (3.1%) |
| 40 to 44 Minutes | 228 (8.0%) | 126 (6.6%) |
| 45 to 59 Minutes | 336 (11.8%) | 39 (2.0%) |
| 60 to 89 Minutes | 219 (7.7%) | 39 (2.0%) |
| 90 or more Minutes | 66 (2.3%) | 36 (1.9%) |
Time of Departure to Work by Sex in Morgan County
The most frequent times of departure to work in Morgan County are 7:00 AM to 7:29 AM (483, 16.9%) for males and 7:30 AM to 7:59 AM (345, 18.1%) for females.
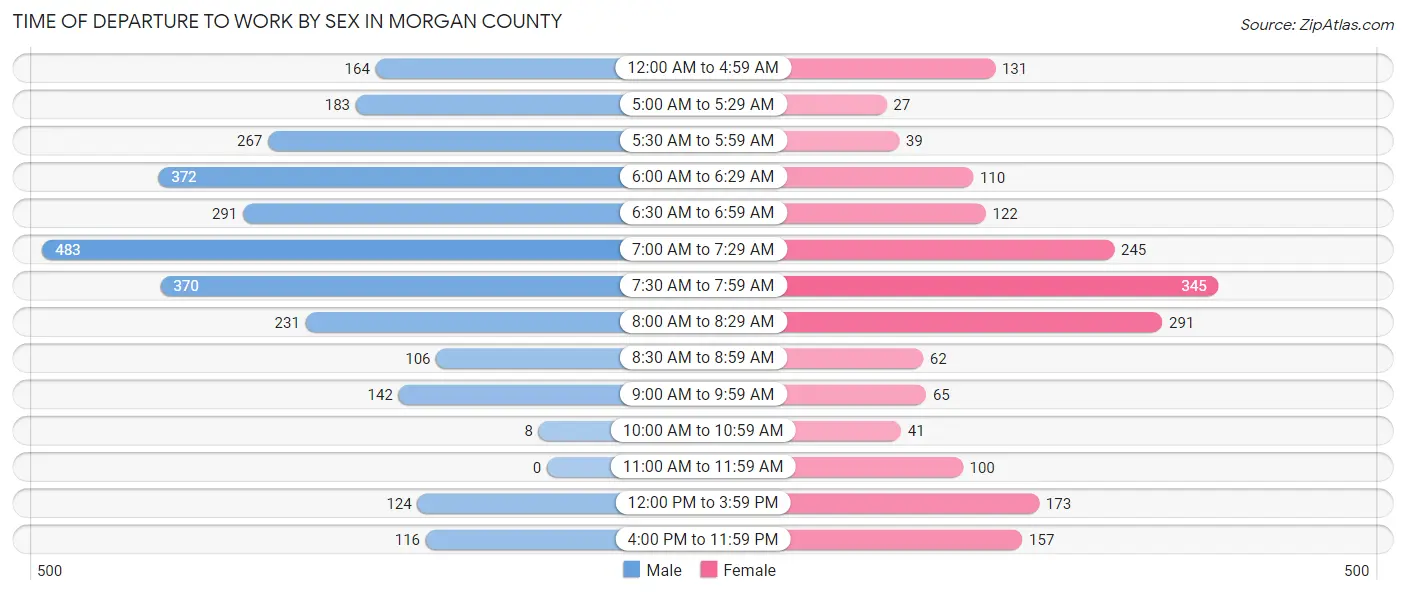
| Time of Departure | Male | Female |
| 12:00 AM to 4:59 AM | 164 (5.7%) | 131 (6.9%) |
| 5:00 AM to 5:29 AM | 183 (6.4%) | 27 (1.4%) |
| 5:30 AM to 5:59 AM | 267 (9.3%) | 39 (2.0%) |
| 6:00 AM to 6:29 AM | 372 (13.0%) | 110 (5.8%) |
| 6:30 AM to 6:59 AM | 291 (10.2%) | 122 (6.4%) |
| 7:00 AM to 7:29 AM | 483 (16.9%) | 245 (12.8%) |
| 7:30 AM to 7:59 AM | 370 (13.0%) | 345 (18.1%) |
| 8:00 AM to 8:29 AM | 231 (8.1%) | 291 (15.2%) |
| 8:30 AM to 8:59 AM | 106 (3.7%) | 62 (3.3%) |
| 9:00 AM to 9:59 AM | 142 (5.0%) | 65 (3.4%) |
| 10:00 AM to 10:59 AM | 8 (0.3%) | 41 (2.1%) |
| 11:00 AM to 11:59 AM | 0 (0.0%) | 100 (5.2%) |
| 12:00 PM to 3:59 PM | 124 (4.3%) | 173 (9.1%) |
| 4:00 PM to 11:59 PM | 116 (4.1%) | 157 (8.2%) |
| Total | 2,857 (100.0%) | 1,908 (100.0%) |
Housing Occupancy in Morgan County
Occupancy by Ownership in Morgan County
Of the total 3,506 dwellings in Morgan County, owner-occupied units account for 3,048 (86.9%), while renter-occupied units make up 458 (13.1%).
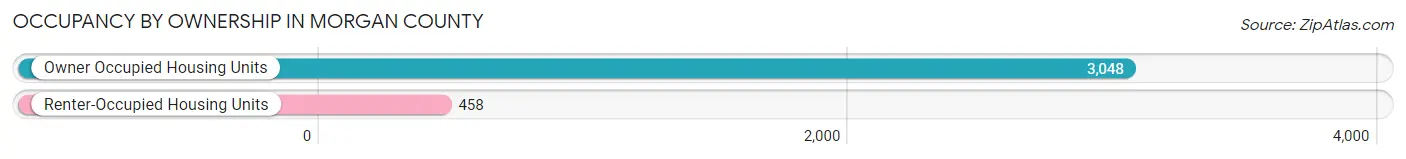
| Occupancy | # Housing Units | % Housing Units |
| Owner Occupied Housing Units | 3,048 | 86.9% |
| Renter-Occupied Housing Units | 458 | 13.1% |
| Total Occupied Housing Units | 3,506 | 100.0% |
Occupancy by Household Size in Morgan County
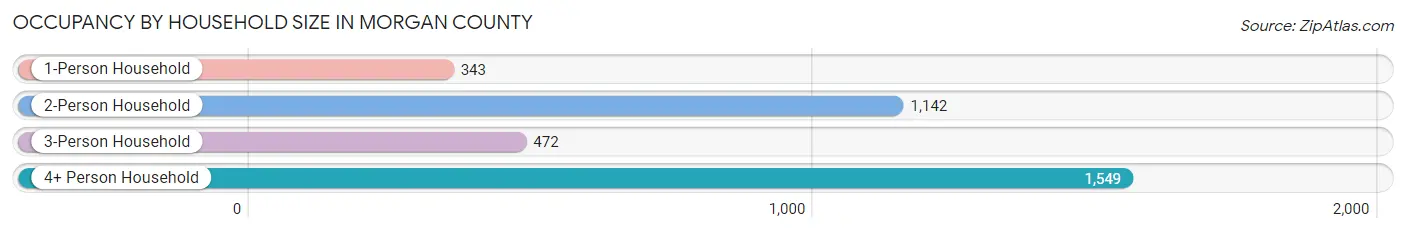
| Household Size | # Housing Units | % Housing Units |
| 1-Person Household | 343 | 9.8% |
| 2-Person Household | 1,142 | 32.6% |
| 3-Person Household | 472 | 13.5% |
| 4+ Person Household | 1,549 | 44.2% |
| Total Housing Units | 3,506 | 100.0% |
Occupancy by Ownership by Household Size in Morgan County
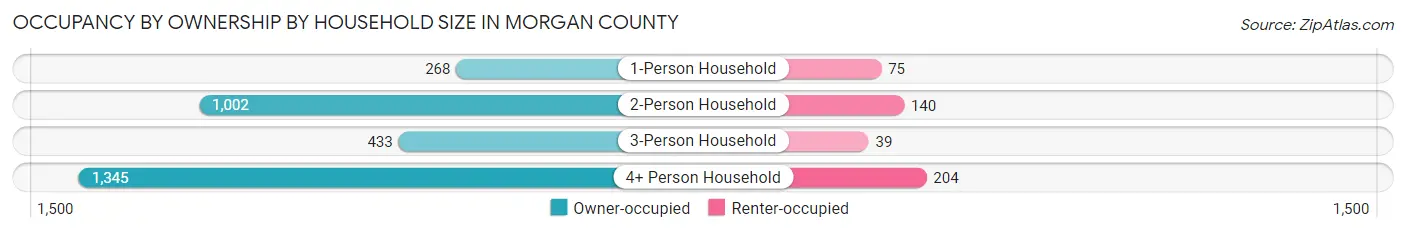
| Household Size | Owner-occupied | Renter-occupied |
| 1-Person Household | 268 (78.1%) | 75 (21.9%) |
| 2-Person Household | 1,002 (87.7%) | 140 (12.3%) |
| 3-Person Household | 433 (91.7%) | 39 (8.3%) |
| 4+ Person Household | 1,345 (86.8%) | 204 (13.2%) |
| Total Housing Units | 3,048 (86.9%) | 458 (13.1%) |
Occupancy by Educational Attainment in Morgan County
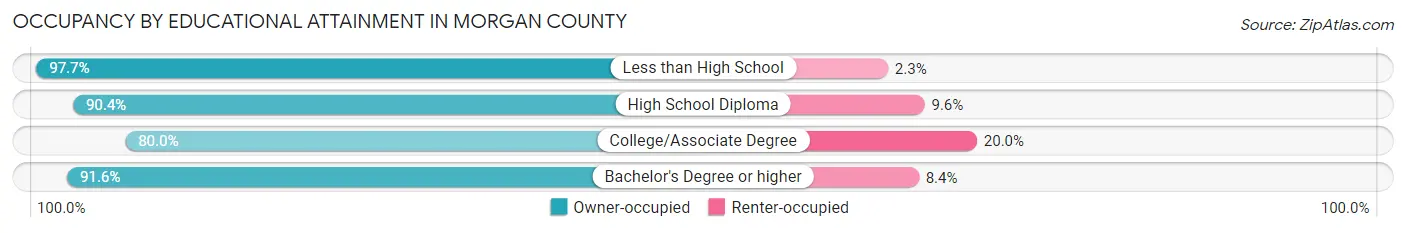
| Household Size | Owner-occupied | Renter-occupied |
| Less than High School | 42 (97.7%) | 1 (2.3%) |
| High School Diploma | 660 (90.4%) | 70 (9.6%) |
| College/Associate Degree | 1,087 (80.0%) | 271 (20.0%) |
| Bachelor's Degree or higher | 1,259 (91.6%) | 116 (8.4%) |
Occupancy by Age of Householder in Morgan County
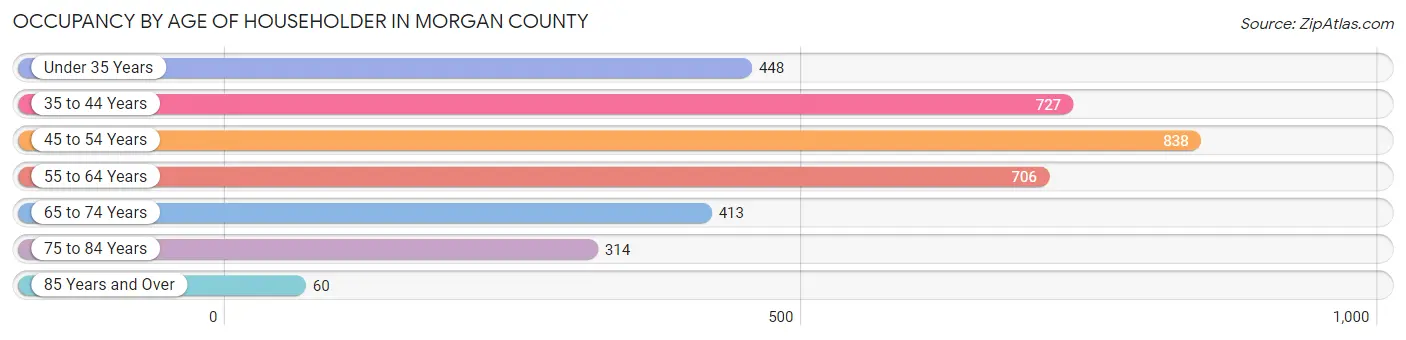
| Age Bracket | # Households | % Households |
| Under 35 Years | 448 | 12.8% |
| 35 to 44 Years | 727 | 20.7% |
| 45 to 54 Years | 838 | 23.9% |
| 55 to 64 Years | 706 | 20.1% |
| 65 to 74 Years | 413 | 11.8% |
| 75 to 84 Years | 314 | 9.0% |
| 85 Years and Over | 60 | 1.7% |
| Total | 3,506 | 100.0% |
Housing Finances in Morgan County
Median Income by Occupancy in Morgan County
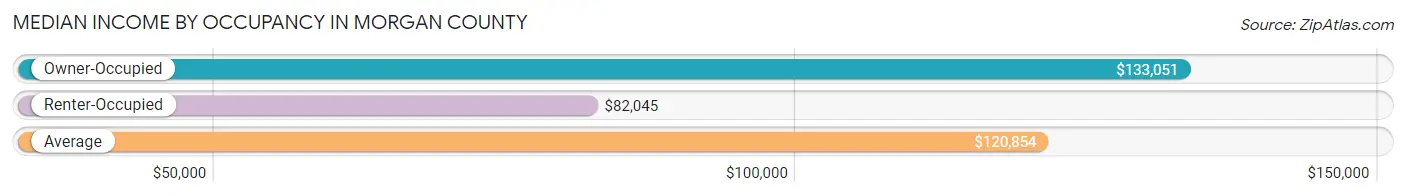
| Occupancy Type | # Households | Median Income |
| Owner-Occupied | 3,048 (86.9%) | $133,051 |
| Renter-Occupied | 458 (13.1%) | $82,045 |
| Average | 3,506 (100.0%) | $120,854 |
Occupancy by Householder Income Bracket in Morgan County
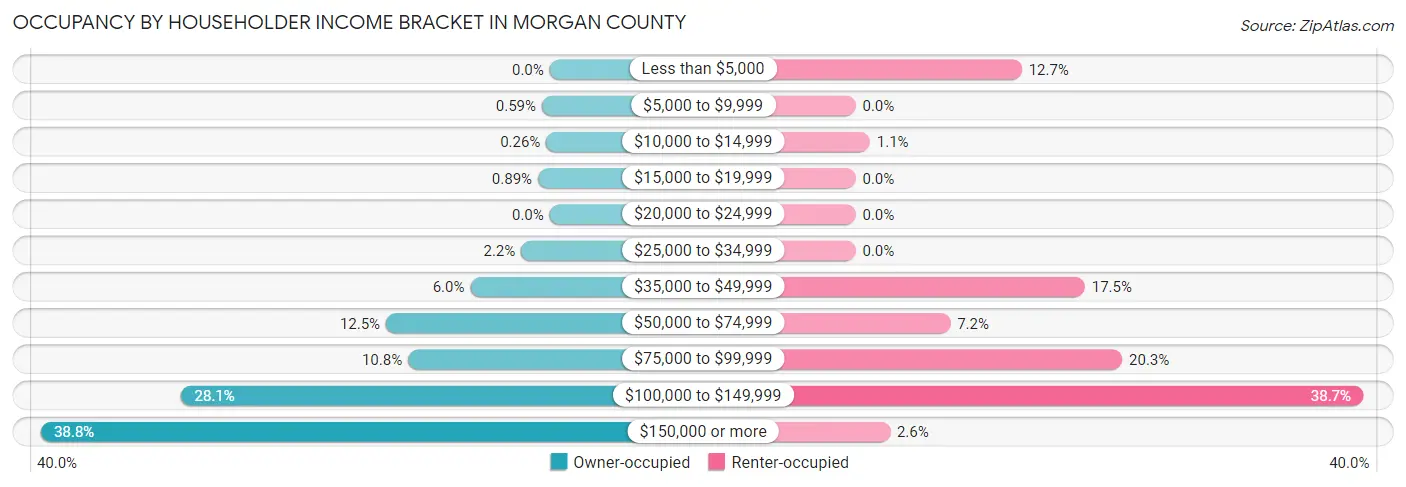
| Income Bracket | Owner-occupied | Renter-occupied |
| Less than $5,000 | 0 (0.0%) | 58 (12.7%) |
| $5,000 to $9,999 | 18 (0.6%) | 0 (0.0%) |
| $10,000 to $14,999 | 8 (0.3%) | 5 (1.1%) |
| $15,000 to $19,999 | 27 (0.9%) | 0 (0.0%) |
| $20,000 to $24,999 | 0 (0.0%) | 0 (0.0%) |
| $25,000 to $34,999 | 66 (2.2%) | 0 (0.0%) |
| $35,000 to $49,999 | 184 (6.0%) | 80 (17.5%) |
| $50,000 to $74,999 | 380 (12.5%) | 33 (7.2%) |
| $75,000 to $99,999 | 329 (10.8%) | 93 (20.3%) |
| $100,000 to $149,999 | 855 (28.1%) | 177 (38.7%) |
| $150,000 or more | 1,181 (38.8%) | 12 (2.6%) |
| Total | 3,048 (100.0%) | 458 (100.0%) |
Monthly Housing Cost Tiers in Morgan County
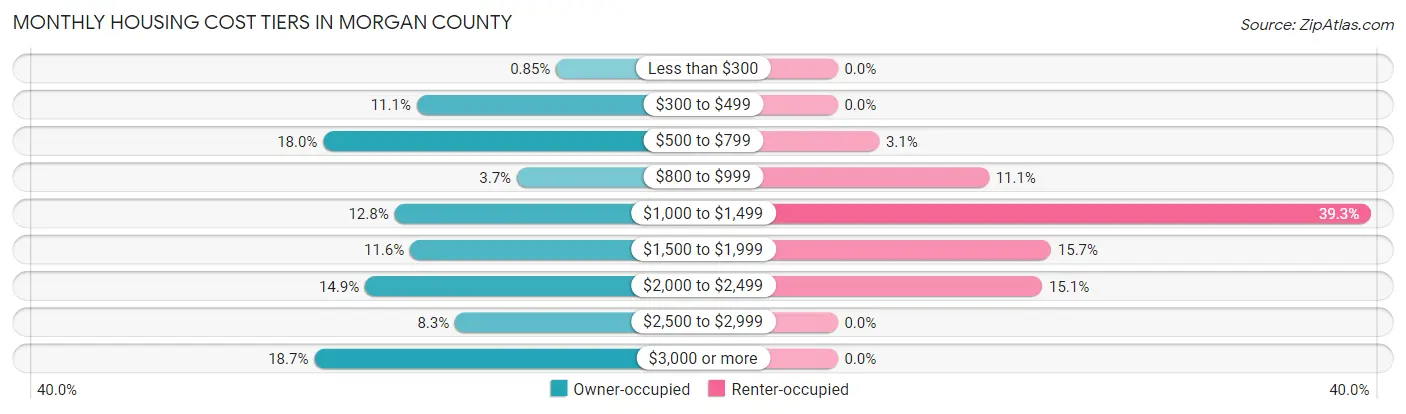
| Monthly Cost | Owner-occupied | Renter-occupied |
| Less than $300 | 26 (0.9%) | 0 (0.0%) |
| $300 to $499 | 339 (11.1%) | 0 (0.0%) |
| $500 to $799 | 549 (18.0%) | 14 (3.1%) |
| $800 to $999 | 114 (3.7%) | 51 (11.1%) |
| $1,000 to $1,499 | 389 (12.8%) | 180 (39.3%) |
| $1,500 to $1,999 | 354 (11.6%) | 72 (15.7%) |
| $2,000 to $2,499 | 455 (14.9%) | 69 (15.1%) |
| $2,500 to $2,999 | 253 (8.3%) | 0 (0.0%) |
| $3,000 or more | 569 (18.7%) | 0 (0.0%) |
| Total | 3,048 (100.0%) | 458 (100.0%) |
Physical Housing Characteristics in Morgan County
Housing Structures in Morgan County
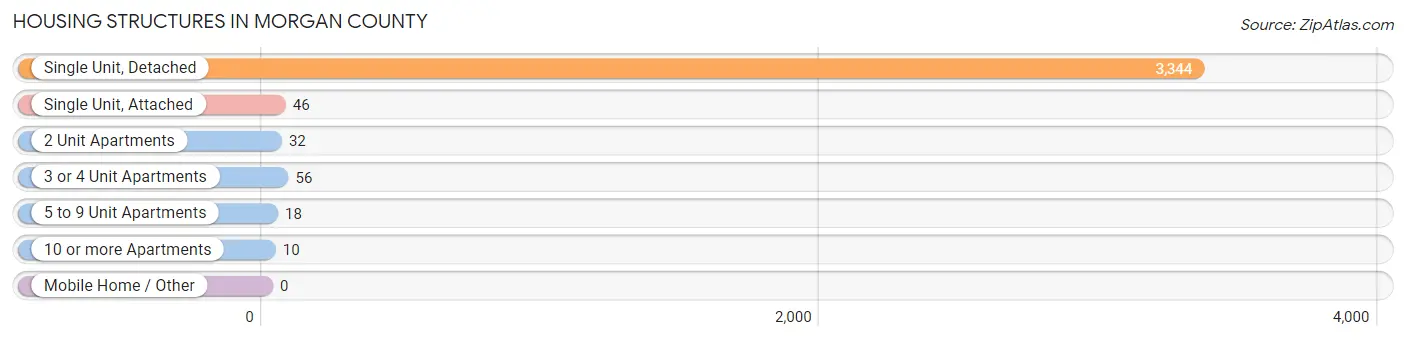
| Structure Type | # Housing Units | % Housing Units |
| Single Unit, Detached | 3,344 | 95.4% |
| Single Unit, Attached | 46 | 1.3% |
| 2 Unit Apartments | 32 | 0.9% |
| 3 or 4 Unit Apartments | 56 | 1.6% |
| 5 to 9 Unit Apartments | 18 | 0.5% |
| 10 or more Apartments | 10 | 0.3% |
| Mobile Home / Other | 0 | 0.0% |
| Total | 3,506 | 100.0% |
Housing Structures by Occupancy in Morgan County
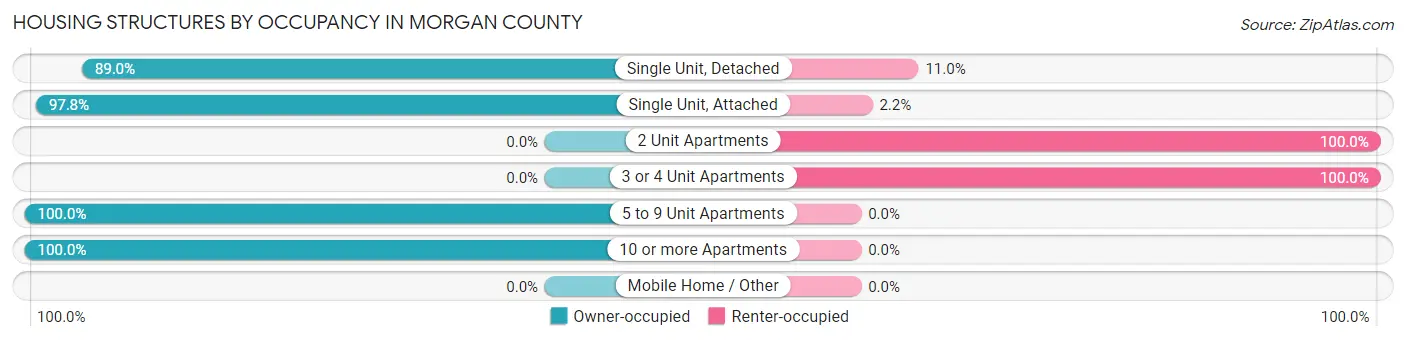
| Structure Type | Owner-occupied | Renter-occupied |
| Single Unit, Detached | 2,975 (89.0%) | 369 (11.0%) |
| Single Unit, Attached | 45 (97.8%) | 1 (2.2%) |
| 2 Unit Apartments | 0 (0.0%) | 32 (100.0%) |
| 3 or 4 Unit Apartments | 0 (0.0%) | 56 (100.0%) |
| 5 to 9 Unit Apartments | 18 (100.0%) | 0 (0.0%) |
| 10 or more Apartments | 10 (100.0%) | 0 (0.0%) |
| Mobile Home / Other | 0 (0.0%) | 0 (0.0%) |
| Total | 3,048 (86.9%) | 458 (13.1%) |
Housing Structures by Number of Rooms in Morgan County
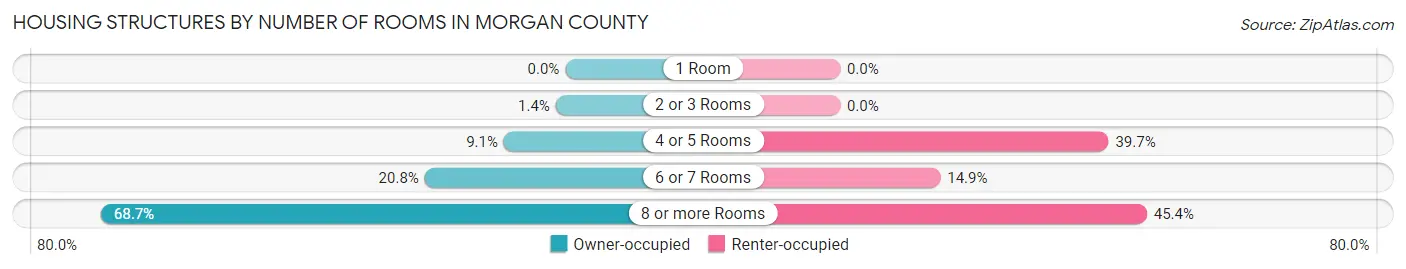
| Number of Rooms | Owner-occupied | Renter-occupied |
| 1 Room | 0 (0.0%) | 0 (0.0%) |
| 2 or 3 Rooms | 43 (1.4%) | 0 (0.0%) |
| 4 or 5 Rooms | 277 (9.1%) | 182 (39.7%) |
| 6 or 7 Rooms | 634 (20.8%) | 68 (14.8%) |
| 8 or more Rooms | 2,094 (68.7%) | 208 (45.4%) |
| Total | 3,048 (100.0%) | 458 (100.0%) |
Housing Structure by Heating Type in Morgan County
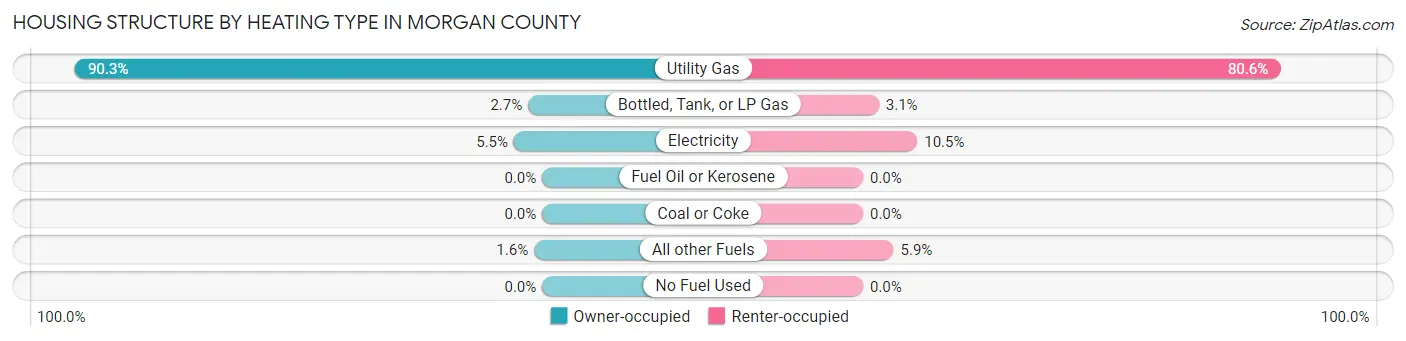
| Heating Type | Owner-occupied | Renter-occupied |
| Utility Gas | 2,751 (90.3%) | 369 (80.6%) |
| Bottled, Tank, or LP Gas | 83 (2.7%) | 14 (3.1%) |
| Electricity | 166 (5.4%) | 48 (10.5%) |
| Fuel Oil or Kerosene | 0 (0.0%) | 0 (0.0%) |
| Coal or Coke | 0 (0.0%) | 0 (0.0%) |
| All other Fuels | 48 (1.6%) | 27 (5.9%) |
| No Fuel Used | 0 (0.0%) | 0 (0.0%) |
| Total | 3,048 (100.0%) | 458 (100.0%) |
Household Vehicle Usage in Morgan County
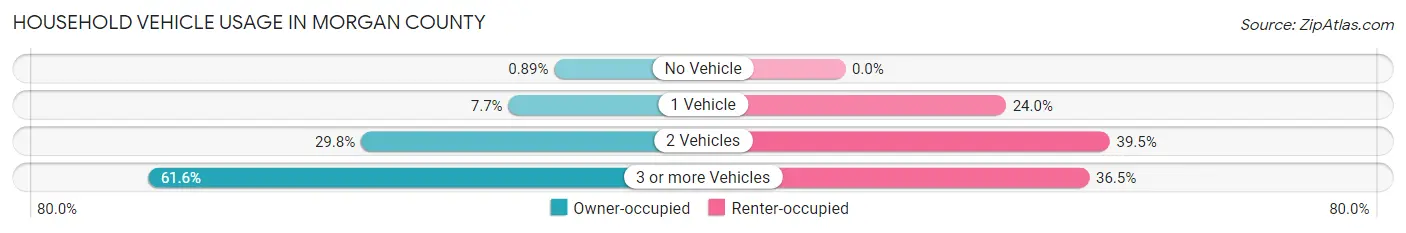
| Vehicles per Household | Owner-occupied | Renter-occupied |
| No Vehicle | 27 (0.9%) | 0 (0.0%) |
| 1 Vehicle | 236 (7.7%) | 110 (24.0%) |
| 2 Vehicles | 907 (29.8%) | 181 (39.5%) |
| 3 or more Vehicles | 1,878 (61.6%) | 167 (36.5%) |
| Total | 3,048 (100.0%) | 458 (100.0%) |
Real Estate & Mortgages in Morgan County
Real Estate and Mortgage Overview in Morgan County
| Characteristic | Without Mortgage | With Mortgage |
| Housing Units | 1,061 | 1,987 |
| Median Property Value | $489,500 | $577,300 |
| Median Household Income | $107,295 | $786 |
| Monthly Housing Costs | $561 | $569 |
| Real Estate Taxes | $2,804 | $54 |
Property Value by Mortgage Status in Morgan County
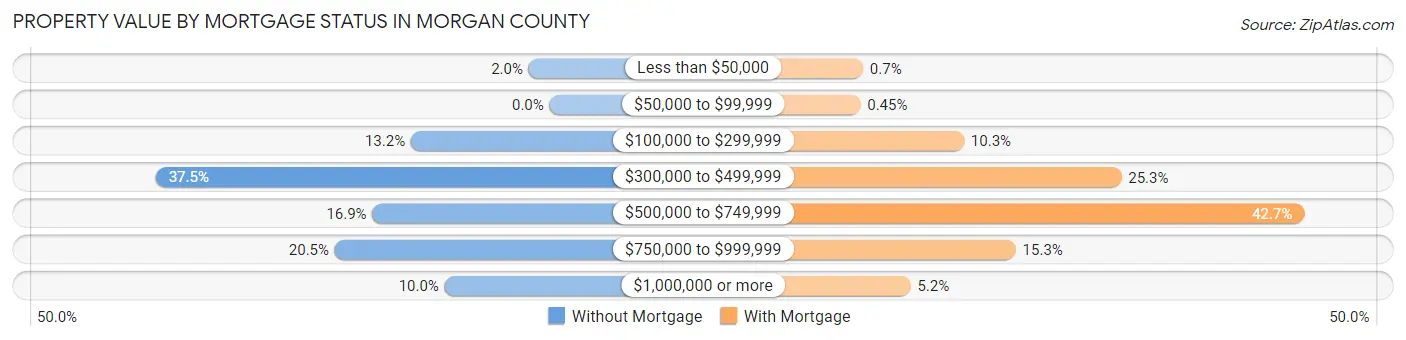
| Property Value | Without Mortgage | With Mortgage |
| Less than $50,000 | 21 (2.0%) | 14 (0.7%) |
| $50,000 to $99,999 | 0 (0.0%) | 9 (0.4%) |
| $100,000 to $299,999 | 140 (13.2%) | 205 (10.3%) |
| $300,000 to $499,999 | 398 (37.5%) | 503 (25.3%) |
| $500,000 to $749,999 | 179 (16.9%) | 849 (42.7%) |
| $750,000 to $999,999 | 217 (20.4%) | 303 (15.2%) |
| $1,000,000 or more | 106 (10.0%) | 104 (5.2%) |
| Total | 1,061 (100.0%) | 1,987 (100.0%) |
Household Income by Mortgage Status in Morgan County
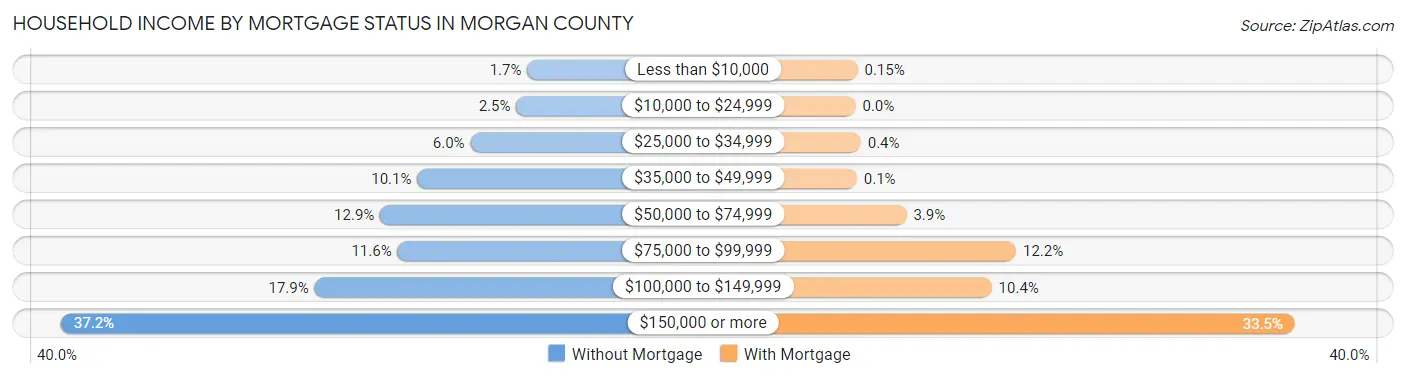
| Household Income | Without Mortgage | With Mortgage |
| Less than $10,000 | 18 (1.7%) | 3 (0.2%) |
| $10,000 to $24,999 | 27 (2.5%) | 0 (0.0%) |
| $25,000 to $34,999 | 64 (6.0%) | 8 (0.4%) |
| $35,000 to $49,999 | 107 (10.1%) | 2 (0.1%) |
| $50,000 to $74,999 | 137 (12.9%) | 77 (3.9%) |
| $75,000 to $99,999 | 123 (11.6%) | 243 (12.2%) |
| $100,000 to $149,999 | 190 (17.9%) | 206 (10.4%) |
| $150,000 or more | 395 (37.2%) | 665 (33.5%) |
| Total | 1,061 (100.0%) | 1,987 (100.0%) |
Property Value to Household Income Ratio in Morgan County
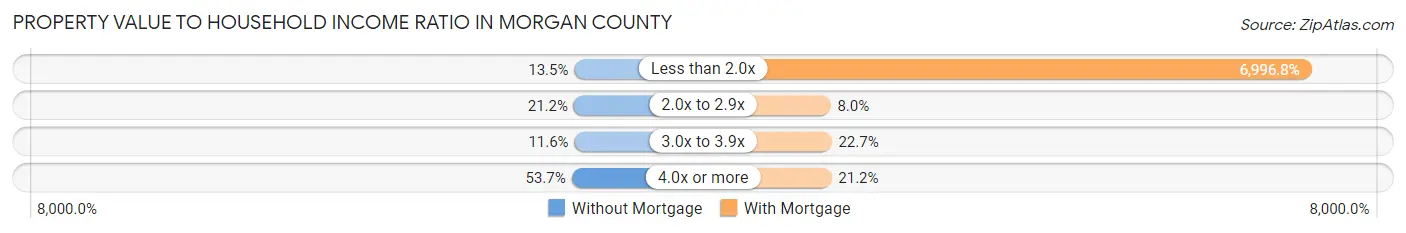
| Value-to-Income Ratio | Without Mortgage | With Mortgage |
| Less than 2.0x | 143 (13.5%) | 139,026 (6,996.8%) |
| 2.0x to 2.9x | 225 (21.2%) | 159 (8.0%) |
| 3.0x to 3.9x | 123 (11.6%) | 451 (22.7%) |
| 4.0x or more | 570 (53.7%) | 422 (21.2%) |
| Total | 1,061 (100.0%) | 1,987 (100.0%) |
Real Estate Taxes by Mortgage Status in Morgan County
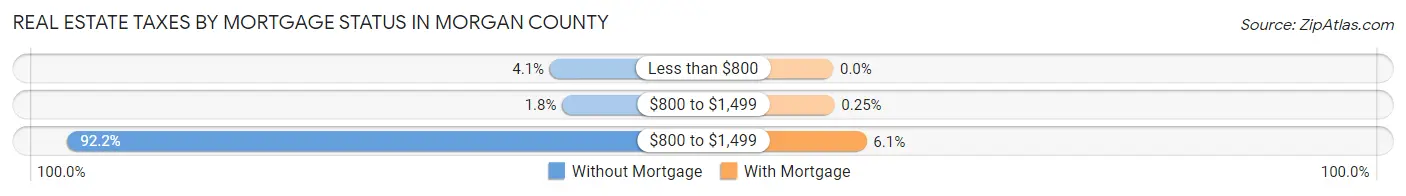
| Property Taxes | Without Mortgage | With Mortgage |
| Less than $800 | 43 (4.1%) | 0 (0.0%) |
| $800 to $1,499 | 19 (1.8%) | 5 (0.3%) |
| $800 to $1,499 | 978 (92.2%) | 121 (6.1%) |
| Total | 1,061 (100.0%) | 1,987 (100.0%) |
Health & Disability in Morgan County
Health Insurance Coverage by Age in Morgan County
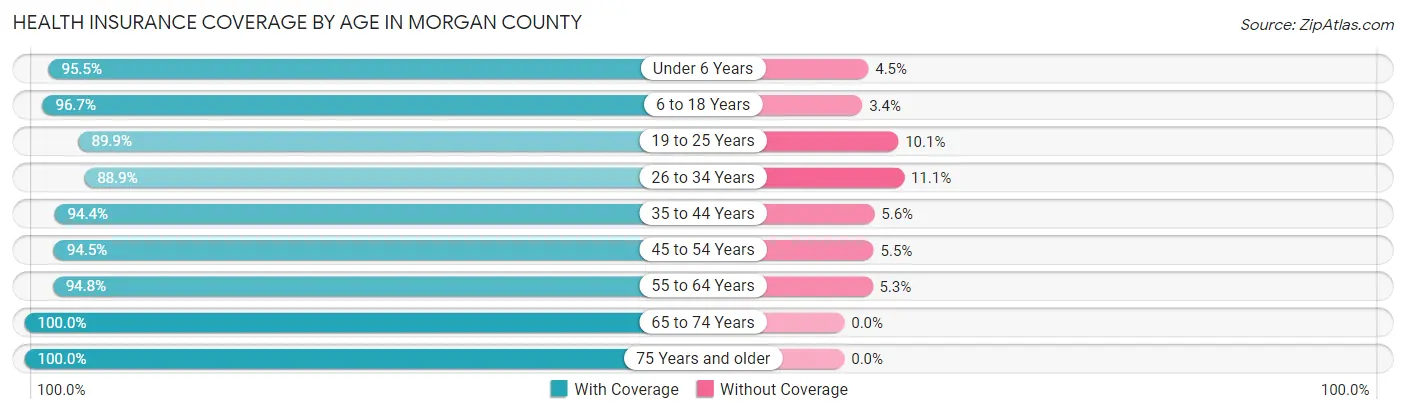
| Age Bracket | With Coverage | Without Coverage |
| Under 6 Years | 1,004 (95.5%) | 47 (4.5%) |
| 6 to 18 Years | 3,350 (96.7%) | 116 (3.4%) |
| 19 to 25 Years | 858 (89.9%) | 96 (10.1%) |
| 26 to 34 Years | 902 (88.9%) | 113 (11.1%) |
| 35 to 44 Years | 1,597 (94.4%) | 95 (5.6%) |
| 45 to 54 Years | 1,417 (94.5%) | 82 (5.5%) |
| 55 to 64 Years | 1,138 (94.8%) | 63 (5.2%) |
| 65 to 74 Years | 889 (100.0%) | 0 (0.0%) |
| 75 Years and older | 590 (100.0%) | 0 (0.0%) |
| Total | 11,745 (95.1%) | 612 (5.0%) |
Health Insurance Coverage by Citizenship Status in Morgan County
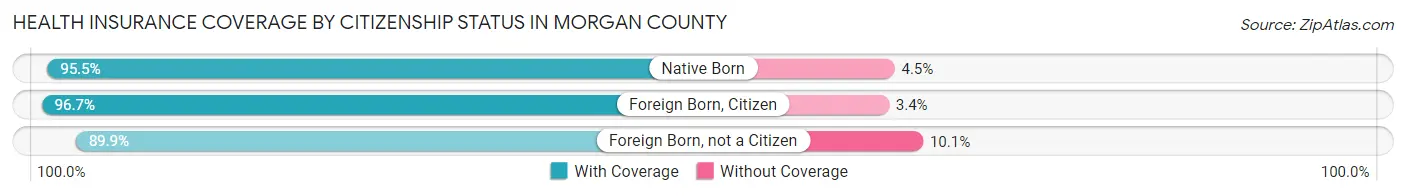
| Citizenship Status | With Coverage | Without Coverage |
| Native Born | 1,004 (95.5%) | 47 (4.5%) |
| Foreign Born, Citizen | 3,350 (96.7%) | 116 (3.4%) |
| Foreign Born, not a Citizen | 858 (89.9%) | 96 (10.1%) |
Health Insurance Coverage by Household Income in Morgan County
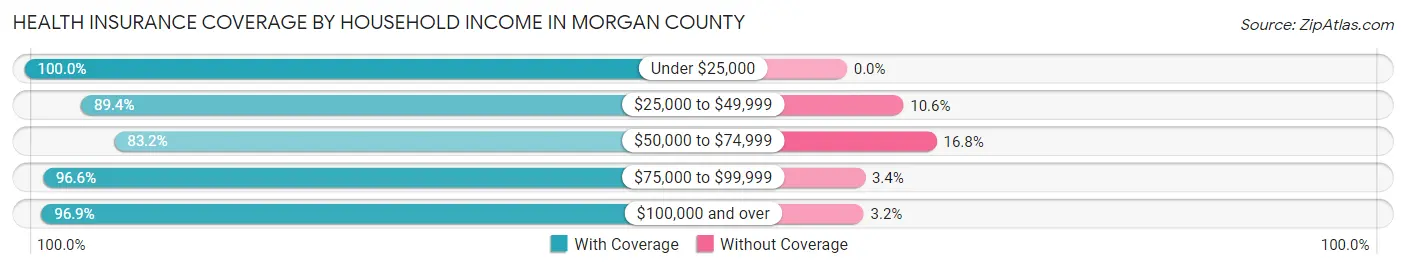
| Household Income | With Coverage | Without Coverage |
| Under $25,000 | 156 (100.0%) | 0 (0.0%) |
| $25,000 to $49,999 | 651 (89.4%) | 77 (10.6%) |
| $50,000 to $74,999 | 1,034 (83.2%) | 209 (16.8%) |
| $75,000 to $99,999 | 1,358 (96.6%) | 48 (3.4%) |
| $100,000 and over | 8,546 (96.9%) | 278 (3.2%) |
Public vs Private Health Insurance Coverage by Age in Morgan County
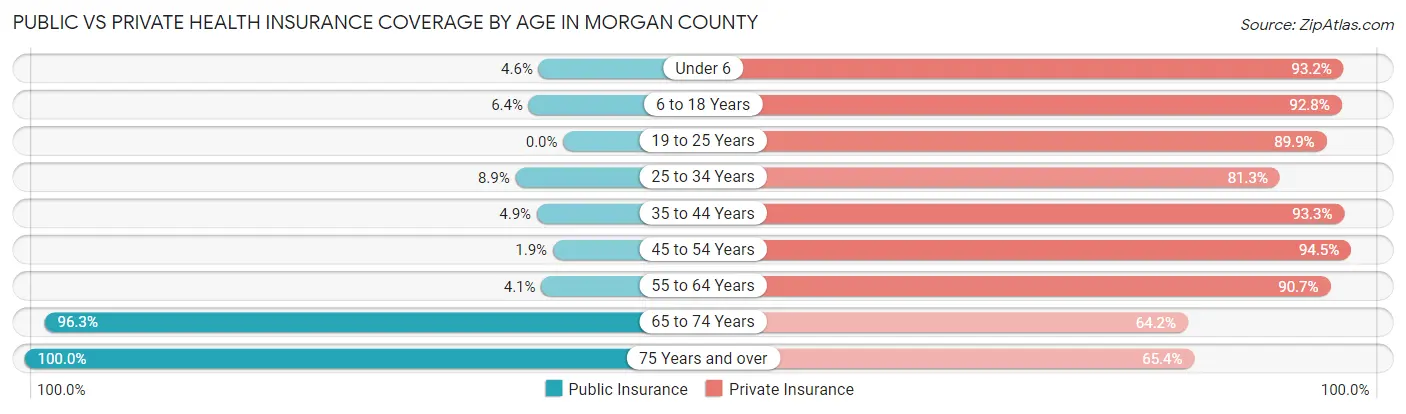
| Age Bracket | Public Insurance | Private Insurance |
| Under 6 | 48 (4.6%) | 979 (93.1%) |
| 6 to 18 Years | 222 (6.4%) | 3,215 (92.8%) |
| 19 to 25 Years | 0 (0.0%) | 858 (89.9%) |
| 25 to 34 Years | 90 (8.9%) | 825 (81.3%) |
| 35 to 44 Years | 83 (4.9%) | 1,578 (93.3%) |
| 45 to 54 Years | 29 (1.9%) | 1,417 (94.5%) |
| 55 to 64 Years | 49 (4.1%) | 1,089 (90.7%) |
| 65 to 74 Years | 856 (96.3%) | 571 (64.2%) |
| 75 Years and over | 590 (100.0%) | 386 (65.4%) |
| Total | 1,967 (15.9%) | 10,918 (88.3%) |
Disability Status by Sex by Age in Morgan County
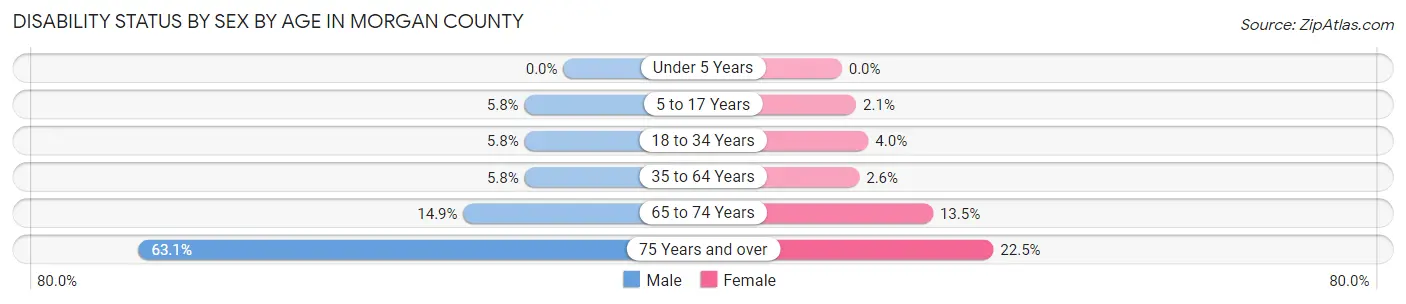
| Age Bracket | Male | Female |
| Under 5 Years | 0 (0.0%) | 0 (0.0%) |
| 5 to 17 Years | 107 (5.8%) | 33 (2.1%) |
| 18 to 34 Years | 65 (5.8%) | 44 (4.0%) |
| 35 to 64 Years | 131 (5.8%) | 55 (2.6%) |
| 65 to 74 Years | 64 (14.8%) | 62 (13.5%) |
| 75 Years and over | 176 (63.1%) | 70 (22.5%) |
Disability Class by Sex by Age in Morgan County
Disability Class: Hearing Difficulty
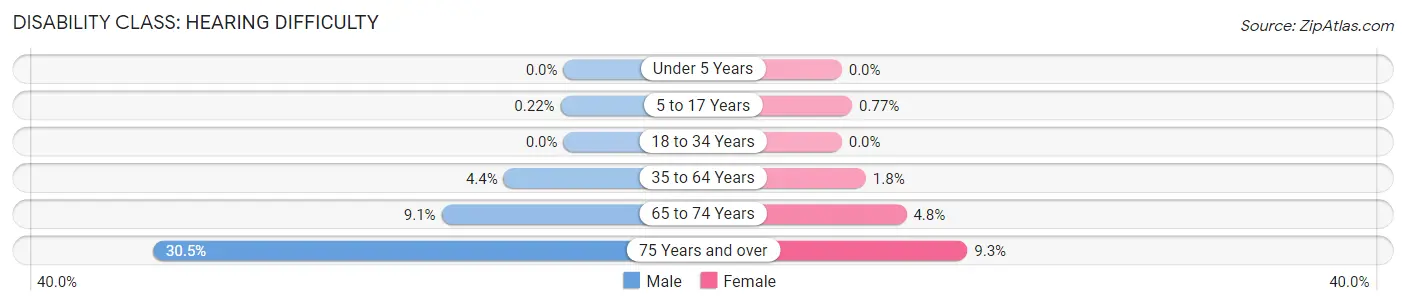
| Age Bracket | Male | Female |
| Under 5 Years | 0 (0.0%) | 0 (0.0%) |
| 5 to 17 Years | 4 (0.2%) | 12 (0.8%) |
| 18 to 34 Years | 0 (0.0%) | 0 (0.0%) |
| 35 to 64 Years | 101 (4.4%) | 38 (1.8%) |
| 65 to 74 Years | 39 (9.0%) | 22 (4.8%) |
| 75 Years and over | 85 (30.5%) | 29 (9.3%) |
Disability Class: Vision Difficulty
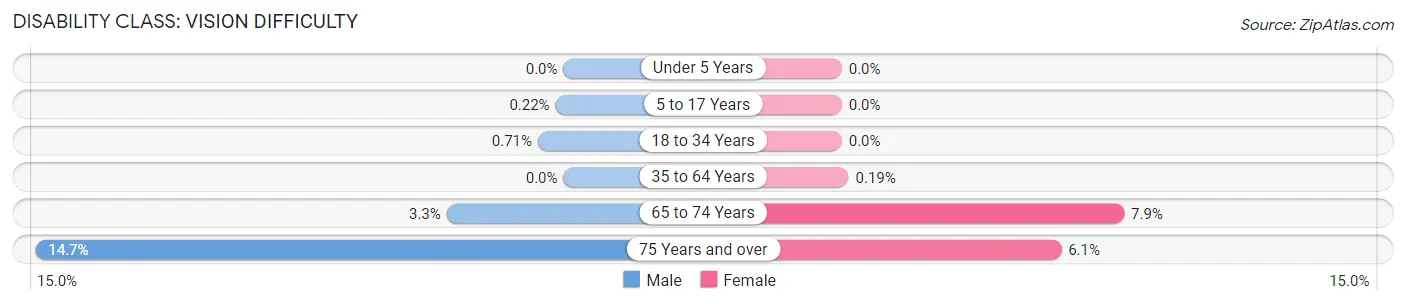
| Age Bracket | Male | Female |
| Under 5 Years | 0 (0.0%) | 0 (0.0%) |
| 5 to 17 Years | 4 (0.2%) | 0 (0.0%) |
| 18 to 34 Years | 8 (0.7%) | 0 (0.0%) |
| 35 to 64 Years | 0 (0.0%) | 4 (0.2%) |
| 65 to 74 Years | 14 (3.3%) | 36 (7.9%) |
| 75 Years and over | 41 (14.7%) | 19 (6.1%) |
Disability Class: Cognitive Difficulty
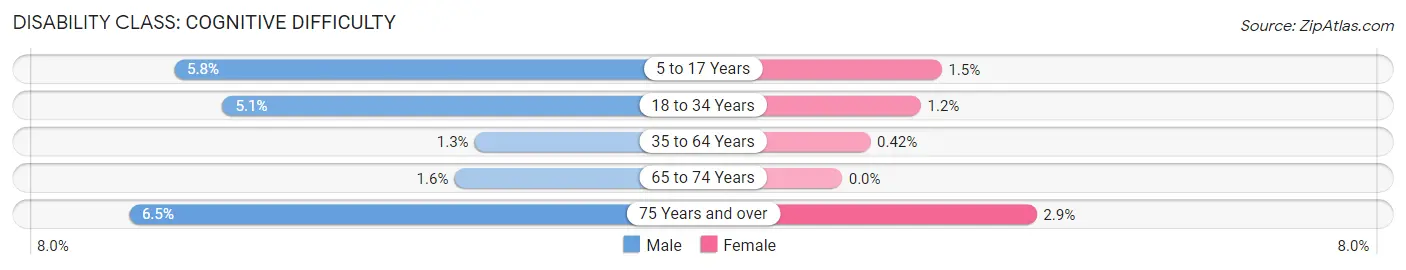
| Age Bracket | Male | Female |
| 5 to 17 Years | 107 (5.8%) | 23 (1.5%) |
| 18 to 34 Years | 57 (5.1%) | 13 (1.2%) |
| 35 to 64 Years | 30 (1.3%) | 9 (0.4%) |
| 65 to 74 Years | 7 (1.6%) | 0 (0.0%) |
| 75 Years and over | 18 (6.5%) | 9 (2.9%) |
Disability Class: Ambulatory Difficulty
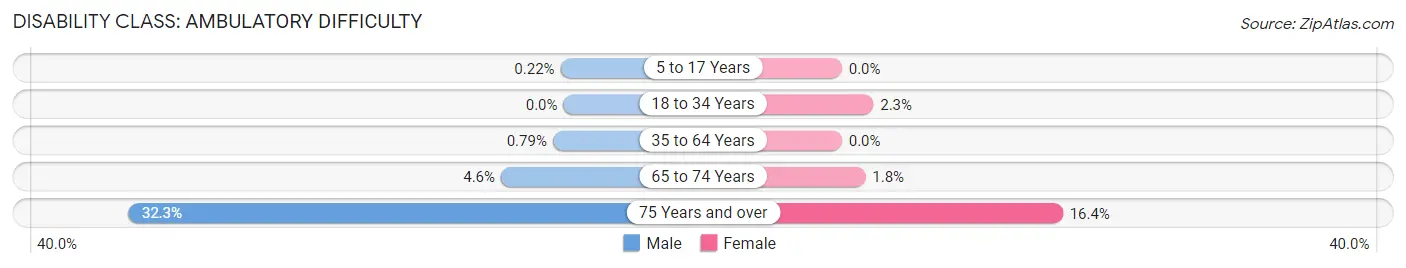
| Age Bracket | Male | Female |
| 5 to 17 Years | 4 (0.2%) | 0 (0.0%) |
| 18 to 34 Years | 0 (0.0%) | 26 (2.3%) |
| 35 to 64 Years | 18 (0.8%) | 0 (0.0%) |
| 65 to 74 Years | 20 (4.6%) | 8 (1.8%) |
| 75 Years and over | 90 (32.3%) | 51 (16.4%) |
Disability Class: Self-Care Difficulty
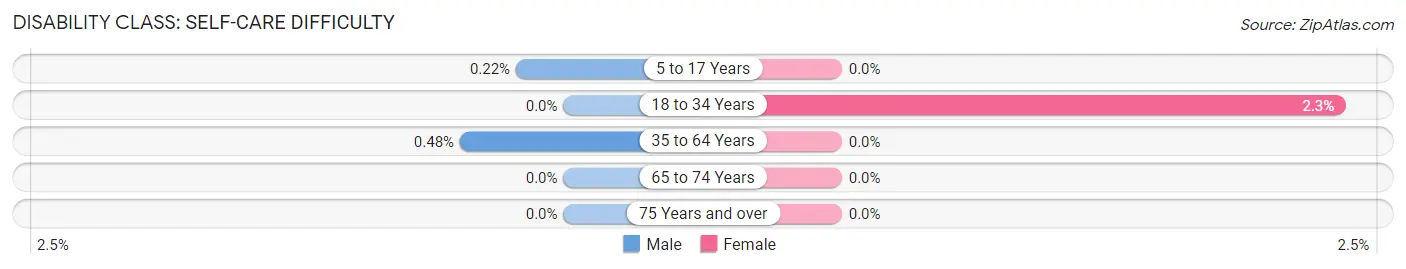
| Age Bracket | Male | Female |
| 5 to 17 Years | 4 (0.2%) | 0 (0.0%) |
| 18 to 34 Years | 0 (0.0%) | 26 (2.3%) |
| 35 to 64 Years | 11 (0.5%) | 0 (0.0%) |
| 65 to 74 Years | 0 (0.0%) | 0 (0.0%) |
| 75 Years and over | 0 (0.0%) | 0 (0.0%) |
Technology Access in Morgan County
Computing Device Access in Morgan County
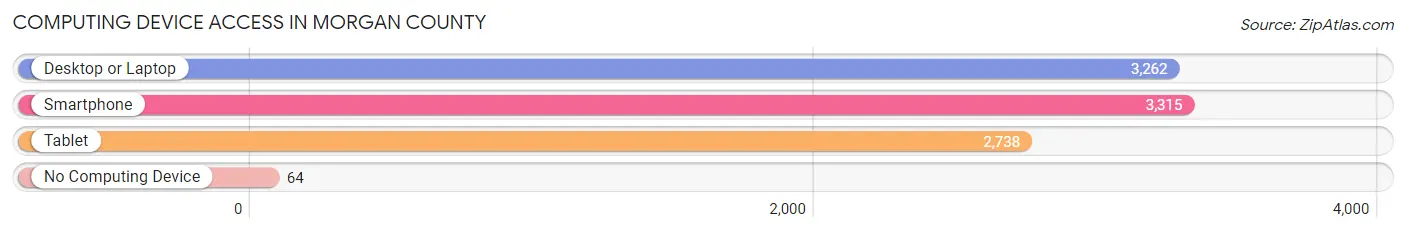
| Device Type | # Households | % Households |
| Desktop or Laptop | 3,262 | 93.0% |
| Smartphone | 3,315 | 94.6% |
| Tablet | 2,738 | 78.1% |
| No Computing Device | 64 | 1.8% |
| Total | 3,506 | 100.0% |
Internet Access in Morgan County
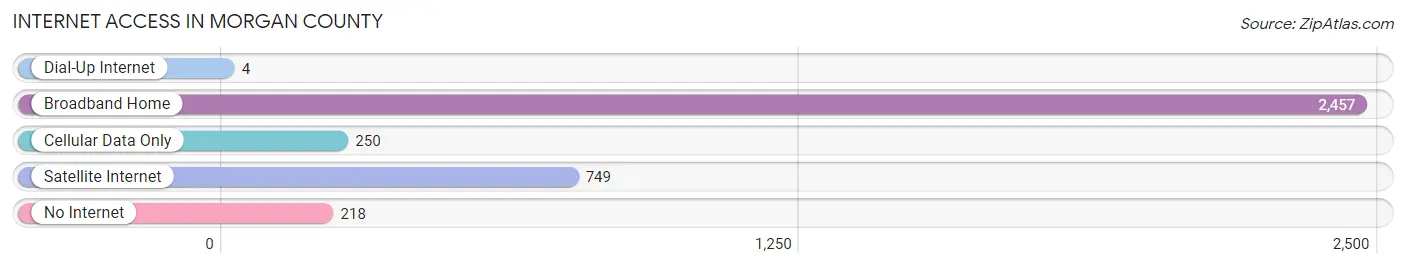
| Internet Type | # Households | % Households |
| Dial-Up Internet | 4 | 0.1% |
| Broadband Home | 2,457 | 70.1% |
| Cellular Data Only | 250 | 7.1% |
| Satellite Internet | 749 | 21.4% |
| No Internet | 218 | 6.2% |
| Total | 3,506 | 100.0% |
Morgan County Summary
Morgan County is located in the northern part of Utah, and is bordered by Weber County to the north, Summit County to the east, Rich County to the south, and Cache County to the west. The county seat is Morgan, and the largest city is Mountain Green. The county was named after Jedediah Morgan Grant, an early leader in The Church of Jesus Christ of Latter-day Saints.
History
The area that is now Morgan County was first inhabited by the Ute Indians, who lived in the area for centuries before the arrival of European settlers. The first white settlers arrived in the area in 1855, and the county was officially established in 1862. The county was originally part of Weber County, but was split off in 1875.
The county was largely agricultural in its early years, with the main crops being wheat, oats, and hay. The county also had a thriving dairy industry, and the first cheese factory in the state was established in Morgan County in 1882.
Geography
Morgan County covers an area of 1,072 square miles, and is located in the Wasatch Range of the Rocky Mountains. The county is mostly mountainous, with elevations ranging from 4,000 to 10,000 feet. The highest point in the county is Mount Ogden, which has an elevation of 10,921 feet.
The county is home to several rivers and streams, including the Weber River, the Ogden River, and the Bear River. The county also contains several reservoirs, including the Pineview Reservoir, the Echo Reservoir, and the Causey Reservoir.
Economy
The economy of Morgan County is largely based on agriculture and tourism. The county is home to several ski resorts, including Snowbasin, Powder Mountain, and Wolf Mountain. The county also has several state parks, including the Wasatch-Cache National Forest, the Morgan-Monroe State Forest, and the Wasatch Mountain State Park.
The county is also home to several manufacturing companies, including the Morgan Valley Cheese Factory, the Morgan Valley Winery, and the Morgan Valley Brewing Company.
Demographics
As of the 2010 census, the population of Morgan County was 9,469. The racial makeup of the county was 94.3% White, 0.3% African American, 0.4% Native American, 0.5% Asian, 0.1% Pacific Islander, 2.7% from other races, and 1.7% from two or more races. Hispanic or Latino of any race were 5.2% of the population.
The median income for a household in the county was $50,945, and the median income for a family was $58,945. The per capita income for the county was $22,945. About 8.3% of families and 10.3% of the population were below the poverty line, including 13.2% of those under age 18 and 6.2% of those age 65 or over.
Common Questions
What is the Total Population of Morgan County?
Total Population of Morgan County is 12,367.
What is the Total Male Population of Morgan County?
Total Male Population of Morgan County is 6,417.
What is the Total Female Population of Morgan County?
Total Female Population of Morgan County is 5,950.
What is the Ratio of Males per 100 Females in Morgan County?
There are 107.85 Males per 100 Females in Morgan County.
What is the Ratio of Females per 100 Males in Morgan County?
There are 92.72 Females per 100 Males in Morgan County.
What is the Median Population Age in Morgan County?
Median Population Age in Morgan County is 32.1 Years.
What is the Average Family Size in Morgan County
Average Family Size in Morgan County is 3.8 People.
What is the Average Household Size in Morgan County
Average Household Size in Morgan County is 3.5 People.
What is Per Capita Income in Morgan County?
Per Capita income in Morgan County is $40,485.
What is the Median Family Income in Morgan County?
Median Family Income in Morgan County is $127,052.
What is the Median Household income in Morgan County?
Median Household Income in Morgan County is $120,854.
What is Income or Wage Gap in Morgan County?
Income or Wage Gap in Morgan County is 72.1%.
Women in Morgan County earn 27.9 cents for every dollar earned by a man.
What is Inequality or Gini Index in Morgan County?
Inequality or Gini Index in Morgan County is 0.37.
How Large is the Labor Force in Morgan County?
There are 5,498 People in the Labor Forcein in Morgan County.
What is the Percentage of People in the Labor Force in Morgan County?
63.7% of People are in the Labor Force in Morgan County.
What is the Unemployment Rate in Morgan County?
Unemployment Rate in Morgan County is 1.7%.