Millard County, UT
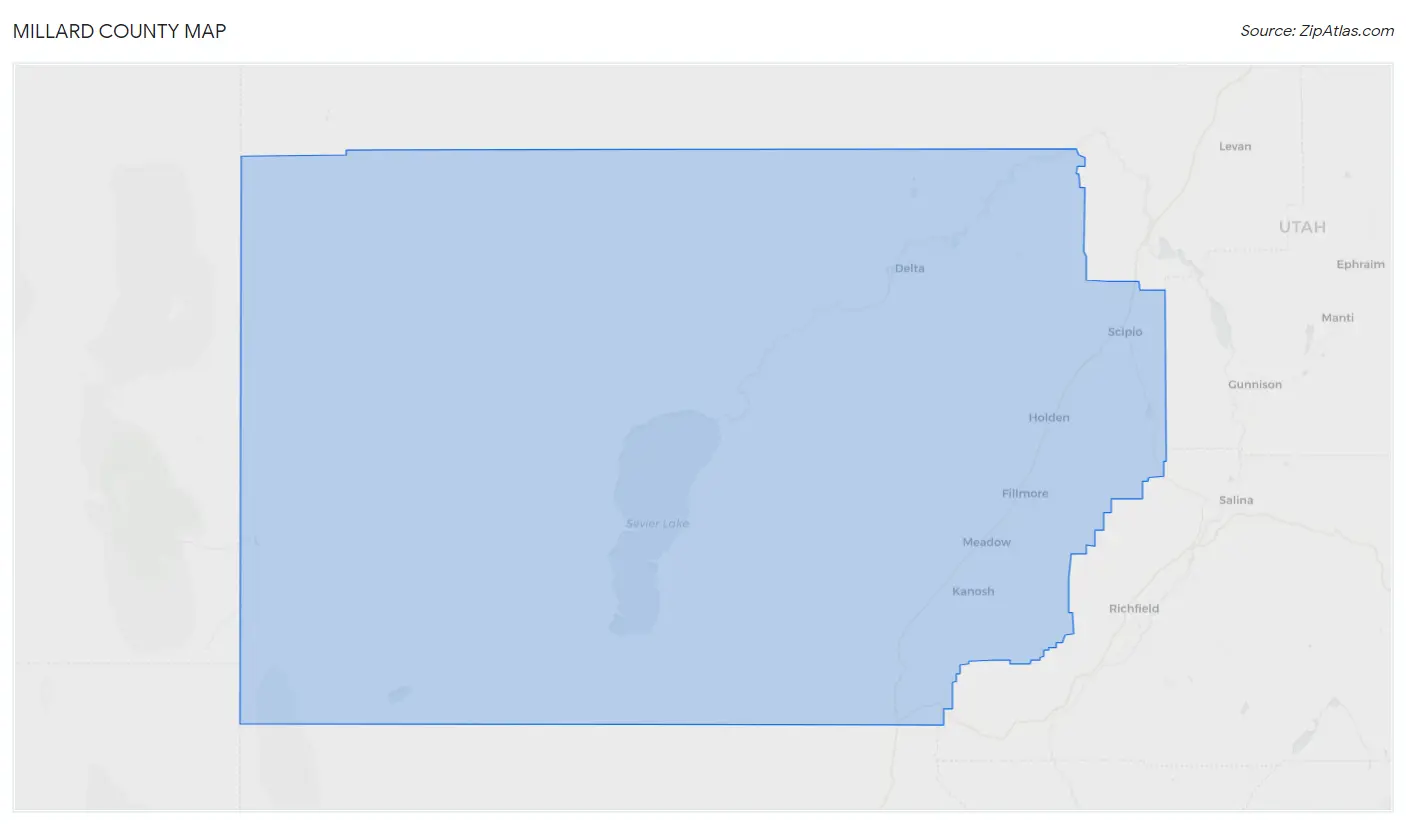
Millard County Map
Millard County Overview
13,027
TOTAL POPULATION
6,703
MALE POPULATION
6,324
FEMALE POPULATION
105.99
MALES / 100 FEMALES
94.35
FEMALES / 100 MALES
34.4
MEDIAN AGE
3.6
AVG FAMILY SIZE
3.1
AVG HOUSEHOLD SIZE
$27,757
PER CAPITA INCOME
$76,734
AVG FAMILY INCOME
$69,403
AVG HOUSEHOLD INCOME
56.5%
WAGE / INCOME GAP [ % ]
43.5¢/ $1
WAGE / INCOME GAP [ $ ]
$7,242
FAMILY INCOME DEFICIT
0.39
INEQUALITY / GINI INDEX
5,642
LABOR FORCE [ PEOPLE ]
60.1%
PERCENT IN LABOR FORCE
4.4%
UNEMPLOYMENT RATE
Millard County Area Codes
Race in Millard County
The most populous races in Millard County are White / Caucasian (11,189 | 85.9%), Hispanic or Latino (1,657 | 12.7%), and Some other Race (840 | 6.5%).
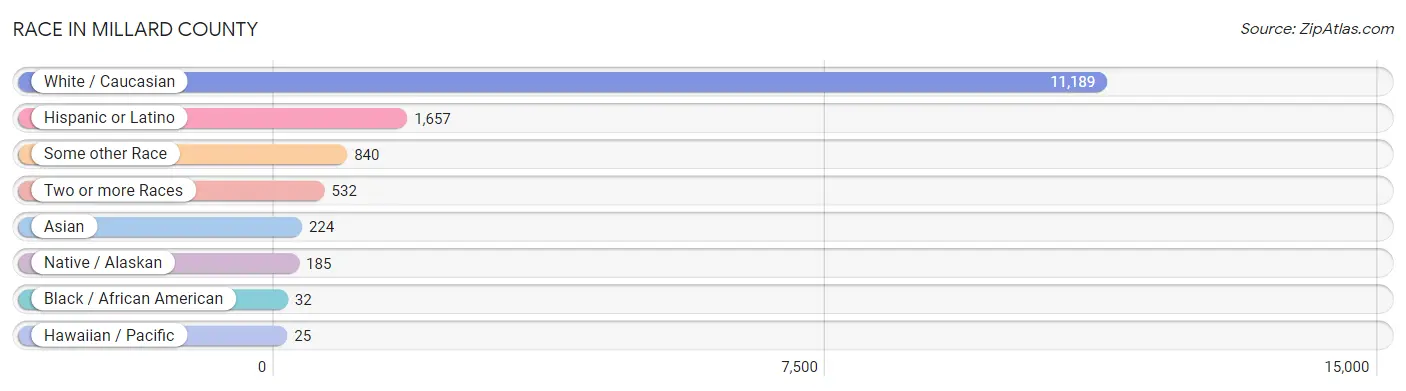
| Race | # Population | % Population |
| Asian | 224 | 1.7% |
| Black / African American | 32 | 0.3% |
| Hawaiian / Pacific | 25 | 0.2% |
| Hispanic or Latino | 1,657 | 12.7% |
| Native / Alaskan | 185 | 1.4% |
| White / Caucasian | 11,189 | 85.9% |
| Two or more Races | 532 | 4.1% |
| Some other Race | 840 | 6.5% |
| Total | 13,027 | 100.0% |
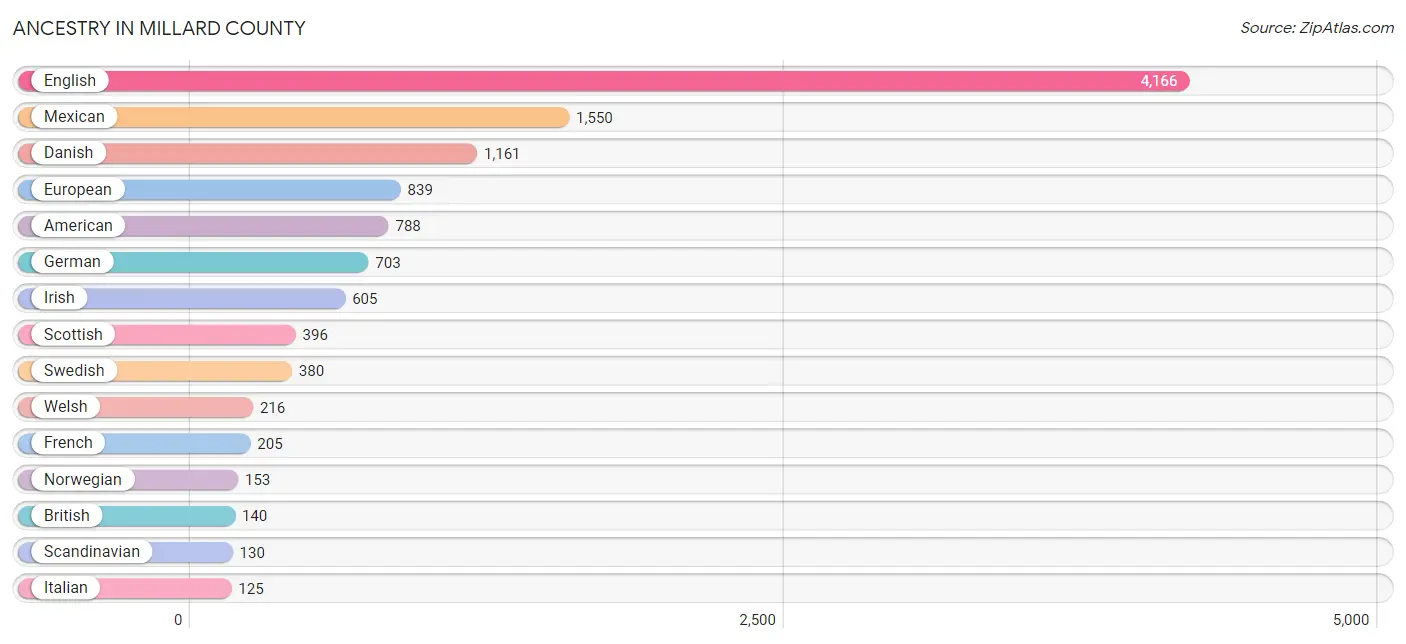
Ancestry in Millard County
The most populous ancestries reported in Millard County are English (4,166 | 32.0%), Mexican (1,550 | 11.9%), Danish (1,161 | 8.9%), European (839 | 6.4%), and American (788 | 6.0%), together accounting for 65.3% of all Millard County residents.
| Ancestry | # Population | % Population |
| American | 788 | 6.0% |
| Arab | 6 | 0.1% |
| Armenian | 5 | 0.0% |
| Bangladeshi | 45 | 0.4% |
| Bhutanese | 6 | 0.1% |
| Brazilian | 4 | 0.0% |
| British | 140 | 1.1% |
| Burmese | 70 | 0.5% |
| Canadian | 55 | 0.4% |
| Central American | 44 | 0.3% |
| Cherokee | 12 | 0.1% |
| Chippewa | 3 | 0.0% |
| Choctaw | 6 | 0.1% |
| Cree | 4 | 0.0% |
| Czech | 3 | 0.0% |
| Danish | 1,161 | 8.9% |
| Dutch | 119 | 0.9% |
| Ecuadorian | 3 | 0.0% |
| English | 4,166 | 32.0% |
| European | 839 | 6.4% |
| Finnish | 4 | 0.0% |
| French | 205 | 1.6% |
| German | 703 | 5.4% |
| Guamanian / Chamorro | 7 | 0.1% |
| Guatemalan | 40 | 0.3% |
| Icelander | 33 | 0.3% |
| Indian (Asian) | 73 | 0.6% |
| Irish | 605 | 4.6% |
| Italian | 125 | 1.0% |
| Japanese | 2 | 0.0% |
| Korean | 7 | 0.1% |
| Malaysian | 12 | 0.1% |
| Mexican | 1,550 | 11.9% |
| Mexican American Indian | 6 | 0.1% |
| Navajo | 16 | 0.1% |
| Northern European | 13 | 0.1% |
| Norwegian | 153 | 1.2% |
| Paiute | 83 | 0.6% |
| Palestinian | 6 | 0.1% |
| Peruvian | 3 | 0.0% |
| Polish | 21 | 0.2% |
| Portuguese | 10 | 0.1% |
| Puerto Rican | 14 | 0.1% |
| Russian | 58 | 0.4% |
| Salvadoran | 4 | 0.0% |
| Samoan | 59 | 0.4% |
| Scandinavian | 130 | 1.0% |
| Scotch-Irish | 115 | 0.9% |
| Scottish | 396 | 3.0% |
| Shoshone | 5 | 0.0% |
| South African | 4 | 0.0% |
| South American | 6 | 0.1% |
| Spaniard | 4 | 0.0% |
| Subsaharan African | 4 | 0.0% |
| Swedish | 380 | 2.9% |
| Swiss | 36 | 0.3% |
| Thai | 12 | 0.1% |
| Welsh | 216 | 1.7% | View All 58 Rows |
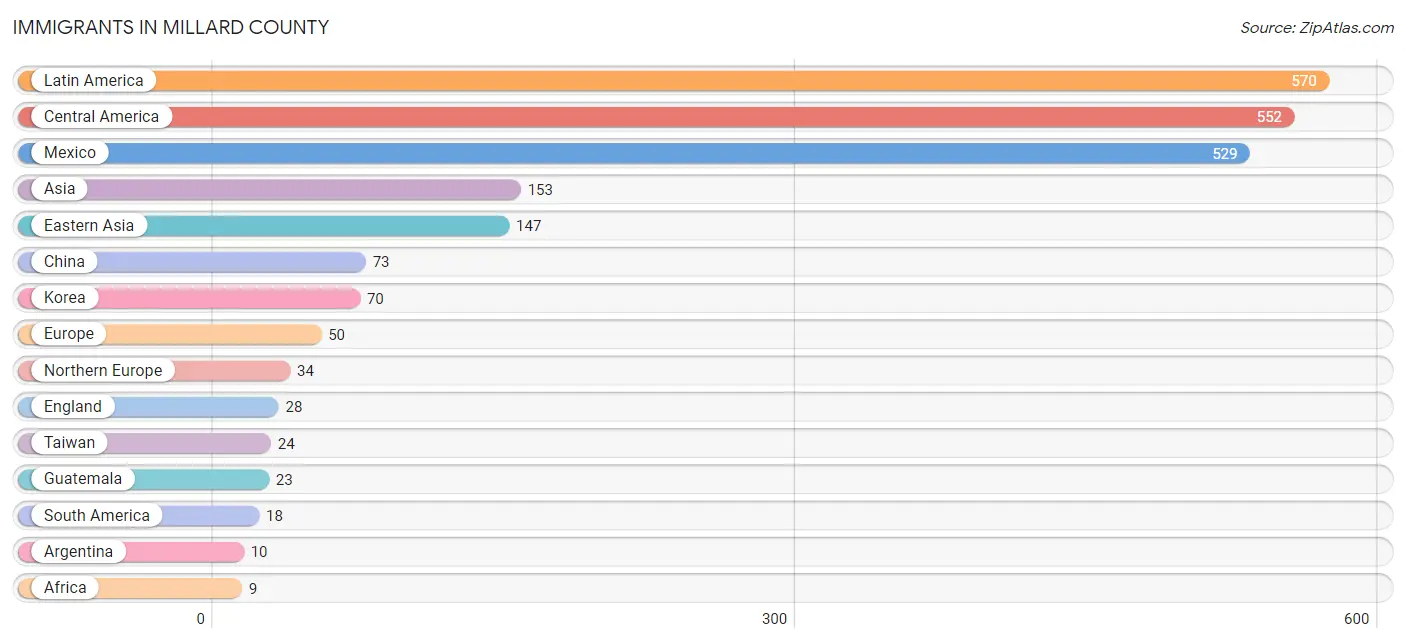
Immigrants in Millard County
The most numerous immigrant groups reported in Millard County came from Latin America (570 | 4.4%), Central America (552 | 4.2%), Mexico (529 | 4.1%), Asia (153 | 1.2%), and Eastern Asia (147 | 1.1%), together accounting for 15.0% of all Millard County residents.
| Immigration Origin | # Population | % Population |
| Africa | 9 | 0.1% |
| Argentina | 10 | 0.1% |
| Asia | 153 | 1.2% |
| Azores | 6 | 0.1% |
| Brazil | 4 | 0.0% |
| Canada | 3 | 0.0% |
| Central America | 552 | 4.2% |
| China | 73 | 0.6% |
| Eastern Africa | 5 | 0.0% |
| Eastern Asia | 147 | 1.1% |
| Eastern Europe | 1 | 0.0% |
| Ecuador | 1 | 0.0% |
| England | 28 | 0.2% |
| Europe | 50 | 0.4% |
| Germany | 5 | 0.0% |
| Guatemala | 23 | 0.2% |
| Ireland | 5 | 0.0% |
| Japan | 4 | 0.0% |
| Korea | 70 | 0.5% |
| Latin America | 570 | 4.4% |
| Mexico | 529 | 4.1% |
| Netherlands | 4 | 0.0% |
| Northern Europe | 34 | 0.3% |
| Norway | 1 | 0.0% |
| Oceania | 4 | 0.0% |
| Peru | 3 | 0.0% |
| Philippines | 4 | 0.0% |
| Portugal | 6 | 0.1% |
| Russia | 1 | 0.0% |
| South Africa | 4 | 0.0% |
| South America | 18 | 0.1% |
| South Eastern Asia | 6 | 0.1% |
| Southern Europe | 6 | 0.1% |
| Taiwan | 24 | 0.2% |
| Thailand | 2 | 0.0% |
| Western Europe | 9 | 0.1% | View All 36 Rows |
Sex and Age in Millard County
Sex and Age in Millard County
The most populous age groups in Millard County are 10 to 14 Years (718 | 10.7%) for men and 10 to 14 Years (592 | 9.4%) for women.
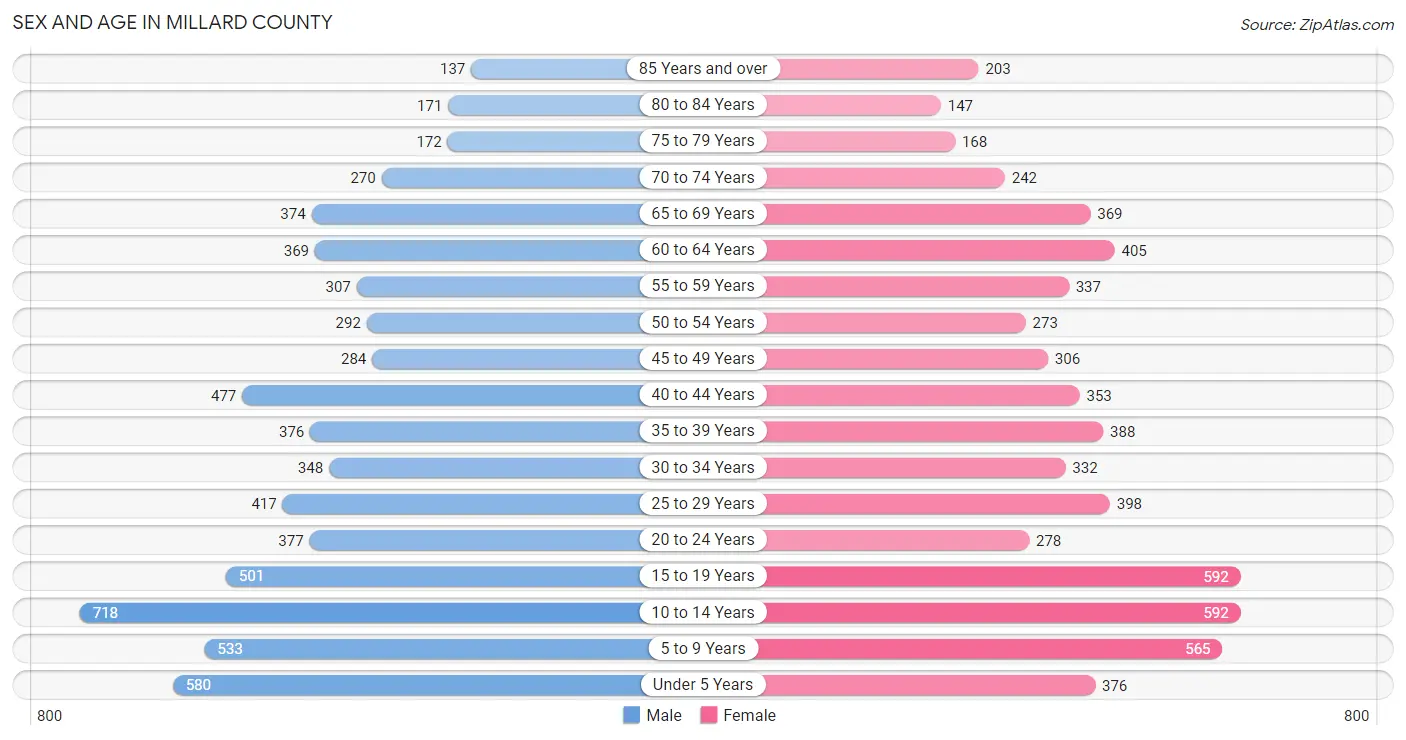
| Age Bracket | Male | Female |
| Under 5 Years | 580 (8.6%) | 376 (5.9%) |
| 5 to 9 Years | 533 (8.0%) | 565 (8.9%) |
| 10 to 14 Years | 718 (10.7%) | 592 (9.4%) |
| 15 to 19 Years | 501 (7.5%) | 592 (9.4%) |
| 20 to 24 Years | 377 (5.6%) | 278 (4.4%) |
| 25 to 29 Years | 417 (6.2%) | 398 (6.3%) |
| 30 to 34 Years | 348 (5.2%) | 332 (5.2%) |
| 35 to 39 Years | 376 (5.6%) | 388 (6.1%) |
| 40 to 44 Years | 477 (7.1%) | 353 (5.6%) |
| 45 to 49 Years | 284 (4.2%) | 306 (4.8%) |
| 50 to 54 Years | 292 (4.4%) | 273 (4.3%) |
| 55 to 59 Years | 307 (4.6%) | 337 (5.3%) |
| 60 to 64 Years | 369 (5.5%) | 405 (6.4%) |
| 65 to 69 Years | 374 (5.6%) | 369 (5.8%) |
| 70 to 74 Years | 270 (4.0%) | 242 (3.8%) |
| 75 to 79 Years | 172 (2.6%) | 168 (2.7%) |
| 80 to 84 Years | 171 (2.5%) | 147 (2.3%) |
| 85 Years and over | 137 (2.0%) | 203 (3.2%) |
| Total | 6,703 (100.0%) | 6,324 (100.0%) |
Families and Households in Millard County
Median Family Size in Millard County
The median family size in Millard County is 3.58 persons per family, with married-couple families (2,675 | 82.0%) accounting for the largest median family size of 3.68 persons per family. On the other hand, single male/father families (199 | 6.1%) represent the smallest median family size with 2.47 persons per family.
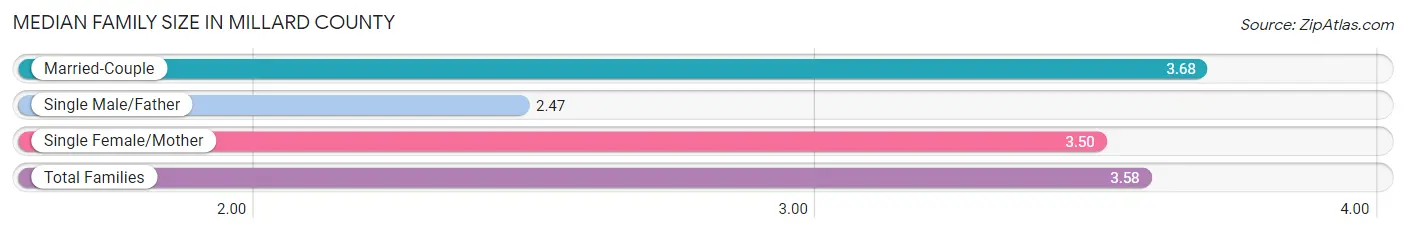
| Family Type | # Families | Family Size |
| Married-Couple | 2,675 (82.0%) | 3.68 |
| Single Male/Father | 199 (6.1%) | 2.47 |
| Single Female/Mother | 390 (11.9%) | 3.50 |
| Total Families | 3,264 (100.0%) | 3.58 |
Median Household Size in Millard County
The median household size in Millard County is 3.07 persons per household, with married-couple households (2,675 | 64.0%) accounting for the largest median household size of 3.69 persons per household. non-family households (913 | 21.9%) represent the smallest median household size with 1.10 persons per household.
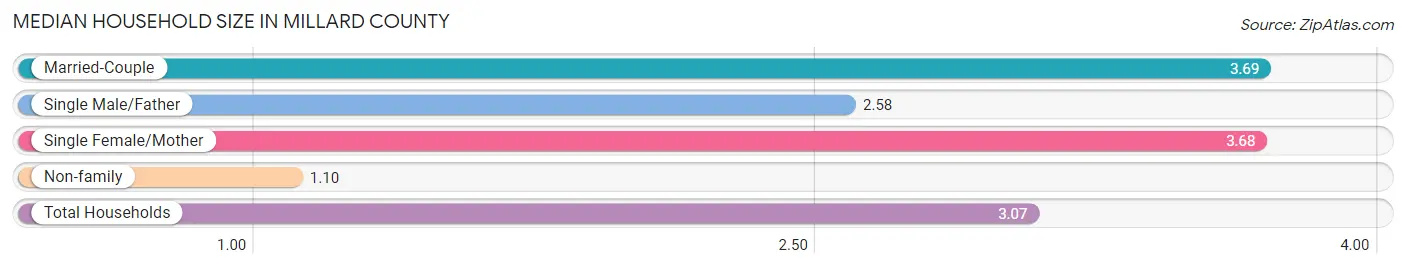
| Household Type | # Households | Household Size |
| Married-Couple | 2,675 (64.0%) | 3.69 |
| Single Male/Father | 199 (4.8%) | 2.58 |
| Single Female/Mother | 390 (9.3%) | 3.68 |
| Non-family | 913 (21.9%) | 1.10 |
| Total Households | 4,177 (100.0%) | 3.07 |
Household Size by Marriage Status in Millard County
Out of a total of 4,177 households in Millard County, 3,264 (78.1%) are family households, while 913 (21.9%) are nonfamily households. The most numerous type of family households are 2-person households, comprising 1,459, and the most common type of nonfamily households are 1-person households, comprising 864.
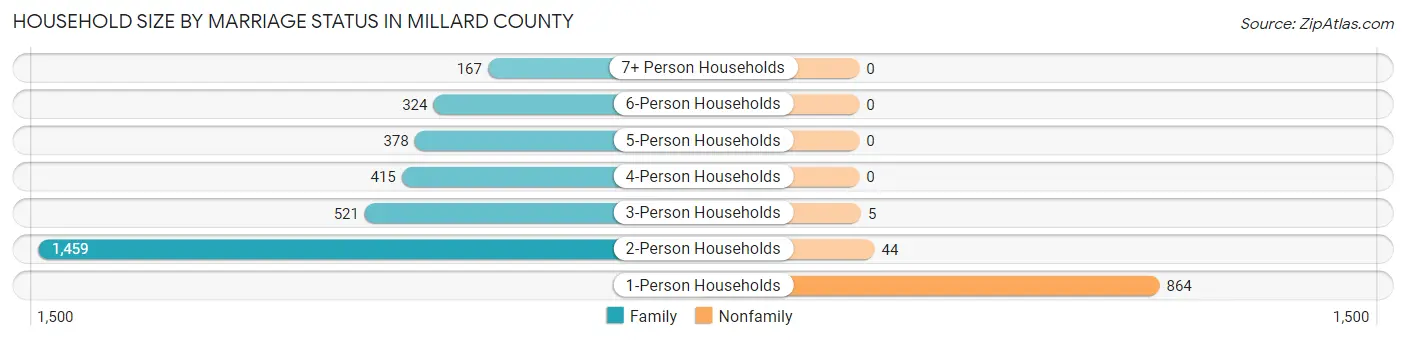
| Household Size | Family Households | Nonfamily Households |
| 1-Person Households | - | 864 (20.7%) |
| 2-Person Households | 1,459 (34.9%) | 44 (1.1%) |
| 3-Person Households | 521 (12.5%) | 5 (0.1%) |
| 4-Person Households | 415 (9.9%) | 0 (0.0%) |
| 5-Person Households | 378 (9.0%) | 0 (0.0%) |
| 6-Person Households | 324 (7.8%) | 0 (0.0%) |
| 7+ Person Households | 167 (4.0%) | 0 (0.0%) |
| Total | 3,264 (78.1%) | 913 (21.9%) |
Female Fertility in Millard County
Fertility by Age in Millard County
Average fertility rate in Millard County is 77.0 births per 1,000 women. Women in the age bracket of 20 to 34 years have the highest fertility rate with 162.0 births per 1,000 women. Women in the age bracket of 20 to 34 years acount for 78.4% of all women with births.
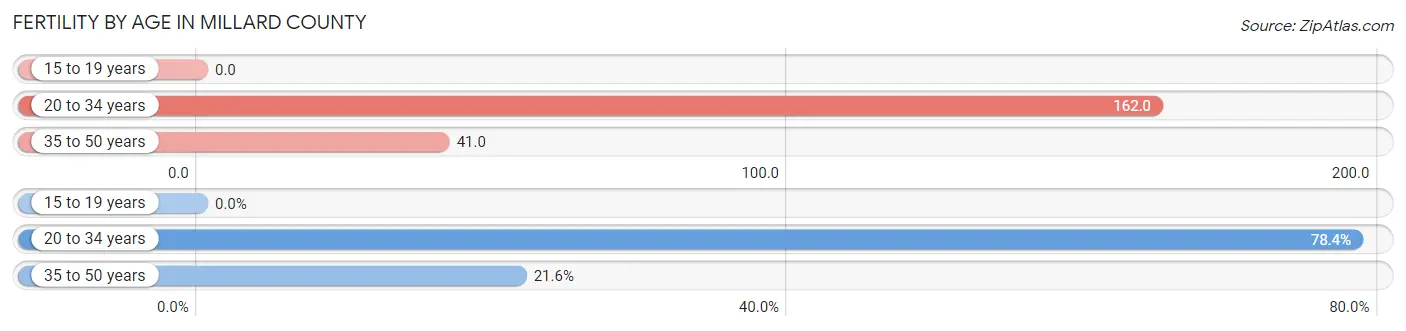
| Age Bracket | Women with Births | Births / 1,000 Women |
| 15 to 19 years | 0 (0.0%) | 0.0 |
| 20 to 34 years | 163 (78.4%) | 162.0 |
| 35 to 50 years | 45 (21.6%) | 41.0 |
| Total | 208 (100.0%) | 77.0 |
Fertility by Age by Marriage Status in Millard County
99.5% of women with births (208) in Millard County are married. The highest percentage of unmarried women with births falls into 20 to 34 years age bracket with 0.6% of them unmarried at the time of birth, while the lowest percentage of unmarried women with births belong to 35 to 50 years age bracket with 0.0% of them unmarried.
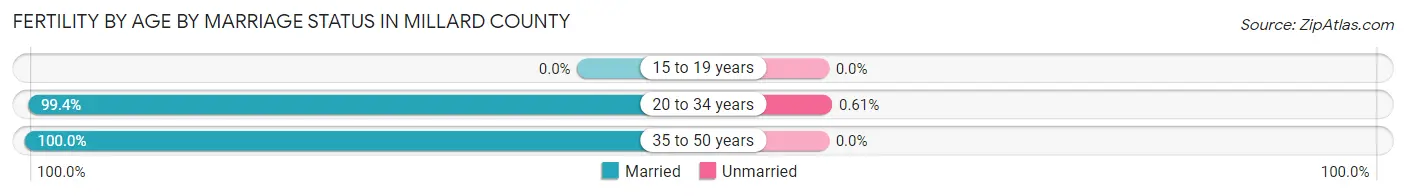
| Age Bracket | Married | Unmarried |
| 15 to 19 years | 0 (0.0%) | 0 (0.0%) |
| 20 to 34 years | 162 (99.4%) | 1 (0.6%) |
| 35 to 50 years | 45 (100.0%) | 0 (0.0%) |
| Total | 207 (99.5%) | 1 (0.5%) |
Fertility by Education in Millard County
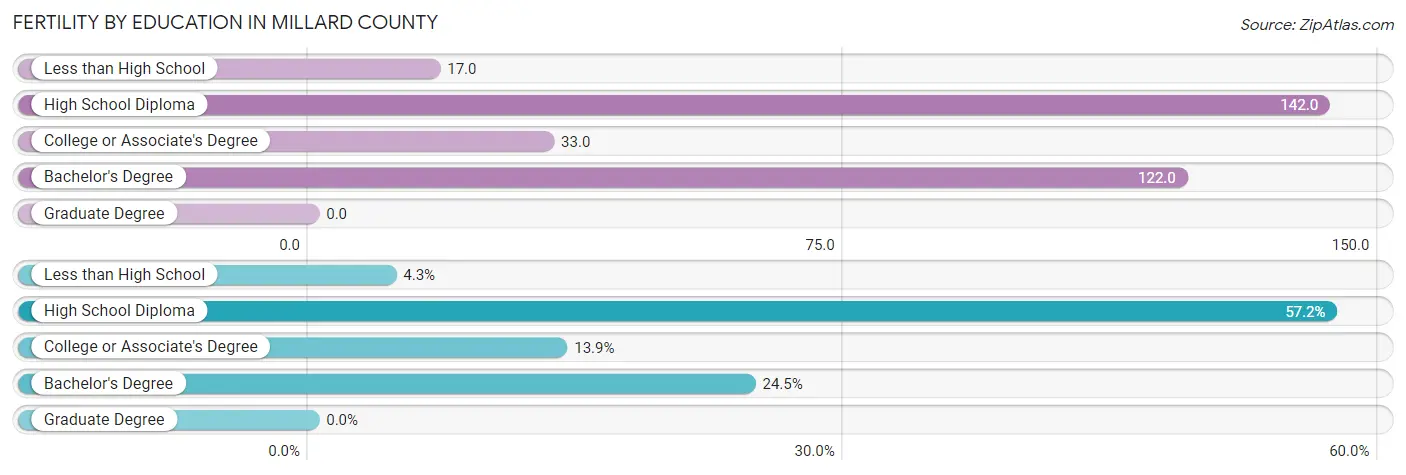
| Educational Attainment | Women with Births | Births / 1,000 Women |
| Less than High School | 9 (4.3%) | 17.0 |
| High School Diploma | 119 (57.2%) | 142.0 |
| College or Associate's Degree | 29 (13.9%) | 33.0 |
| Bachelor's Degree | 51 (24.5%) | 122.0 |
| Graduate Degree | 0 (0.0%) | 0.0 |
| Total | 208 (100.0%) | 77.0 |
Fertility by Education by Marriage Status in Millard County
0.5% of women with births in Millard County are unmarried. Women with the educational attainment of less than high school are most likely to be married with 100.0% of them married at childbirth, while women with the educational attainment of college or associate's degree are least likely to be married with 3.5% of them unmarried at childbirth.
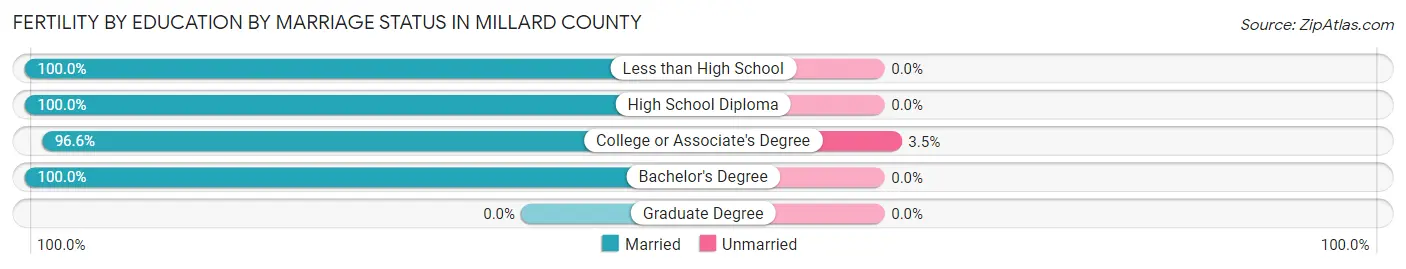
| Educational Attainment | Married | Unmarried |
| Less than High School | 9 (100.0%) | 0 (0.0%) |
| High School Diploma | 119 (100.0%) | 0 (0.0%) |
| College or Associate's Degree | 28 (96.6%) | 1 (3.5%) |
| Bachelor's Degree | 51 (100.0%) | 0 (0.0%) |
| Graduate Degree | 0 (0.0%) | 0 (0.0%) |
| Total | 207 (99.5%) | 1 (0.5%) |
Income in Millard County
Income Overview in Millard County
Per Capita Income in Millard County is $27,757, while median incomes of families and households are $76,734 and $69,403 respectively.
| Characteristic | Number | Measure |
| Per Capita Income | 13,027 | $27,757 |
| Median Family Income | 3,264 | $76,734 |
| Mean Family Income | 3,264 | $91,977 |
| Median Household Income | 4,177 | $69,403 |
| Mean Household Income | 4,177 | $82,688 |
| Income Deficit | 3,264 | $7,242 |
| Wage / Income Gap (%) | 13,027 | 56.54% |
| Wage / Income Gap ($) | 13,027 | 43.46¢ per $1 |
| Gini / Inequality Index | 13,027 | 0.39 |
Earnings by Sex in Millard County
Average Earnings in Millard County are $30,104, $42,301 for men and $18,384 for women, a difference of 56.5%.
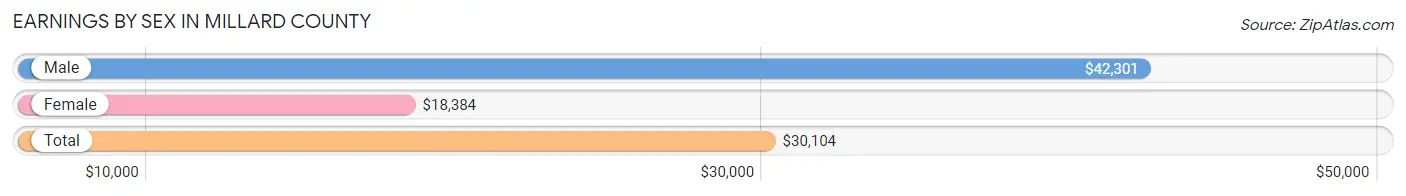
| Sex | Number | Average Earnings |
| Male | 3,419 (56.4%) | $42,301 |
| Female | 2,646 (43.6%) | $18,384 |
| Total | 6,065 (100.0%) | $30,104 |
Earnings by Sex by Income Bracket in Millard County
The most common earnings brackets in Millard County are $100,000+ for men (495 | 14.5%) and $2,499 or less for women (321 | 12.1%).
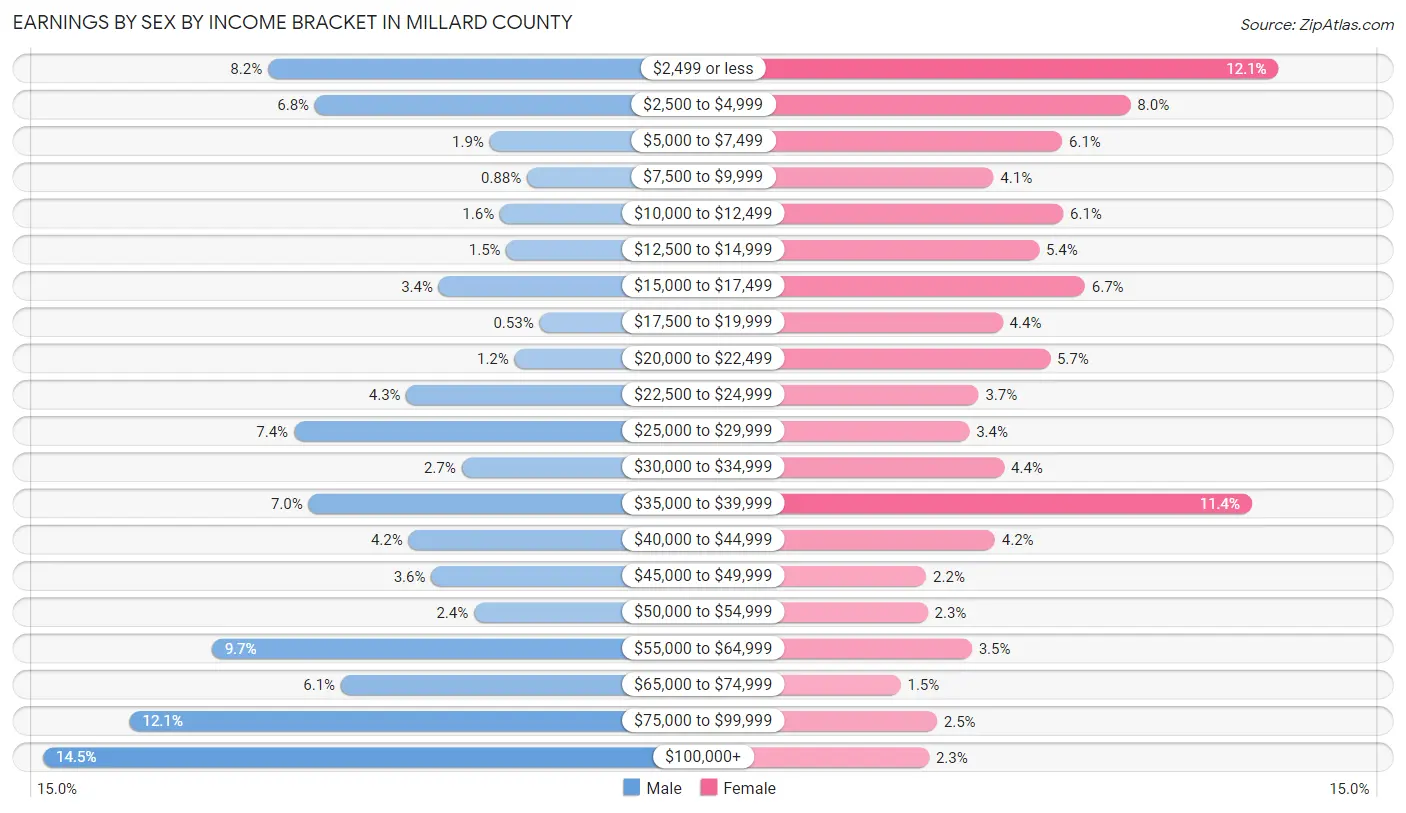
| Income | Male | Female |
| $2,499 or less | 279 (8.2%) | 321 (12.1%) |
| $2,500 to $4,999 | 234 (6.8%) | 211 (8.0%) |
| $5,000 to $7,499 | 66 (1.9%) | 160 (6.0%) |
| $7,500 to $9,999 | 30 (0.9%) | 109 (4.1%) |
| $10,000 to $12,499 | 56 (1.6%) | 161 (6.1%) |
| $12,500 to $14,999 | 50 (1.5%) | 143 (5.4%) |
| $15,000 to $17,499 | 115 (3.4%) | 177 (6.7%) |
| $17,500 to $19,999 | 18 (0.5%) | 116 (4.4%) |
| $20,000 to $22,499 | 42 (1.2%) | 151 (5.7%) |
| $22,500 to $24,999 | 146 (4.3%) | 98 (3.7%) |
| $25,000 to $29,999 | 254 (7.4%) | 91 (3.4%) |
| $30,000 to $34,999 | 93 (2.7%) | 117 (4.4%) |
| $35,000 to $39,999 | 240 (7.0%) | 301 (11.4%) |
| $40,000 to $44,999 | 144 (4.2%) | 110 (4.2%) |
| $45,000 to $49,999 | 122 (3.6%) | 59 (2.2%) |
| $50,000 to $54,999 | 81 (2.4%) | 60 (2.3%) |
| $55,000 to $64,999 | 333 (9.7%) | 93 (3.5%) |
| $65,000 to $74,999 | 209 (6.1%) | 40 (1.5%) |
| $75,000 to $99,999 | 412 (12.0%) | 67 (2.5%) |
| $100,000+ | 495 (14.5%) | 61 (2.3%) |
| Total | 3,419 (100.0%) | 2,646 (100.0%) |
Earnings by Sex by Educational Attainment in Millard County
Average earnings in Millard County are $55,838 for men and $21,360 for women, a difference of 61.8%. Men with an educational attainment of graduate degree enjoy the highest average annual earnings of $92,386, while those with less than high school education earn the least with $34,844. Women with an educational attainment of graduate degree earn the most with the average annual earnings of $69,107, while those with high school diploma education have the smallest earnings of $17,775.
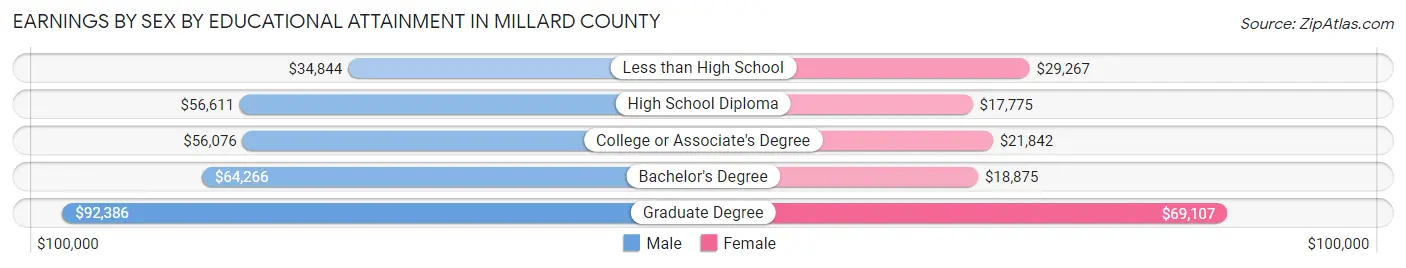
| Educational Attainment | Male Income | Female Income |
| Less than High School | $34,844 | $29,267 |
| High School Diploma | $56,611 | $17,775 |
| College or Associate's Degree | $56,076 | $21,842 |
| Bachelor's Degree | $64,266 | $18,875 |
| Graduate Degree | $92,386 | $69,107 |
| Total | $55,838 | $21,360 |
Family Income in Millard County
Family Income Brackets in Millard County
According to the Millard County family income data, there are 636 families falling into the $50,000 to $74,999 income range, which is the most common income bracket and makes up 19.5% of all families. Conversely, the less than $10,000 income bracket is the least frequent group with only 20 families (0.6%) belonging to this category.
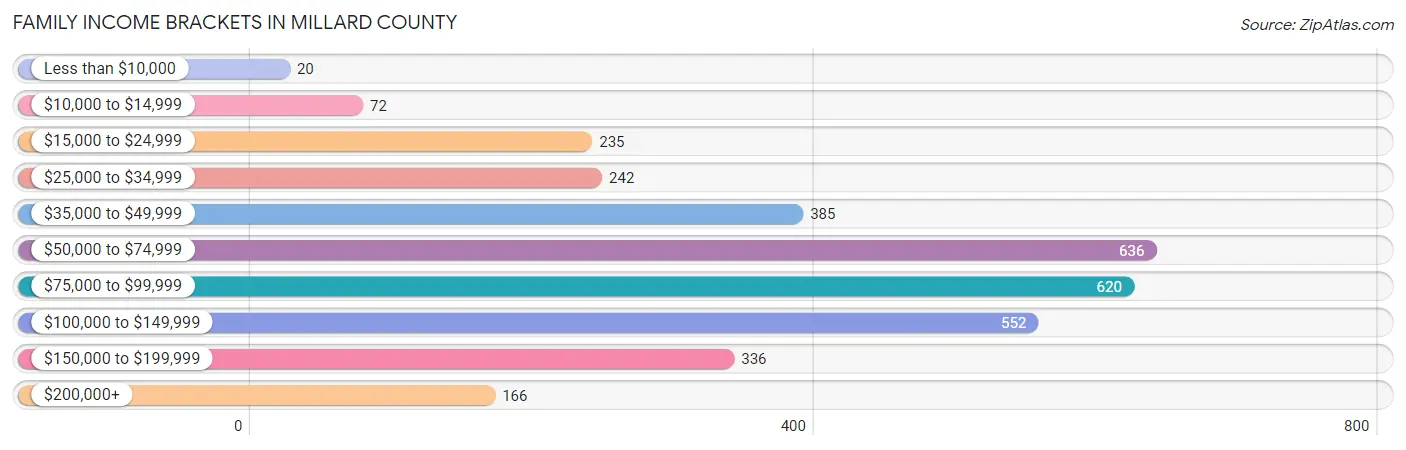
| Income Bracket | # Families | % Families |
| Less than $10,000 | 20 | 0.6% |
| $10,000 to $14,999 | 72 | 2.2% |
| $15,000 to $24,999 | 235 | 7.2% |
| $25,000 to $34,999 | 242 | 7.4% |
| $35,000 to $49,999 | 385 | 11.8% |
| $50,000 to $74,999 | 636 | 19.5% |
| $75,000 to $99,999 | 620 | 19.0% |
| $100,000 to $149,999 | 552 | 16.9% |
| $150,000 to $199,999 | 336 | 10.3% |
| $200,000+ | 166 | 5.1% |
Family Income by Famaliy Size in Millard County
7+ person families (167 | 5.1%) account for the highest median family income in Millard County with $128,092 per family, while 2-person families (1,509 | 46.2%) have the highest median income of $35,741 per family member.
| Income Bracket | # Families | Median Income |
| 2-Person Families | 1,509 (46.2%) | $71,482 |
| 3-Person Families | 547 (16.8%) | $68,681 |
| 4-Person Families | 349 (10.7%) | $89,844 |
| 5-Person Families | 368 (11.3%) | $93,750 |
| 6-Person Families | 324 (9.9%) | $96,875 |
| 7+ Person Families | 167 (5.1%) | $128,092 |
| Total | 3,264 (100.0%) | $76,734 |
Family Income by Number of Earners in Millard County
The median family income in Millard County is $76,734, with families comprising 3+ earners (501) having the highest median family income of $130,938, while families with 1 earner (886) have the lowest median family income of $59,138, accounting for 15.3% and 27.1% of families, respectively.
| Number of Earners | # Families | Median Income |
| No Earners | 697 (21.3%) | $68,794 |
| 1 Earner | 886 (27.1%) | $59,138 |
| 2 Earners | 1,180 (36.1%) | $89,375 |
| 3+ Earners | 501 (15.3%) | $130,938 |
| Total | 3,264 (100.0%) | $76,734 |
Household Income in Millard County
Household Income Brackets in Millard County
With 819 households falling in the category, the $50,000 to $74,999 income range is the most frequent in Millard County, accounting for 19.6% of all households. In contrast, only 96 households (2.3%) fall into the $10,000 to $14,999 income bracket, making it the least populous group.
| Income Bracket | # Households | % Households |
| Less than $10,000 | 117 | 2.8% |
| $10,000 to $14,999 | 96 | 2.3% |
| $15,000 to $24,999 | 405 | 9.7% |
| $25,000 to $34,999 | 267 | 6.4% |
| $35,000 to $49,999 | 614 | 14.7% |
| $50,000 to $74,999 | 819 | 19.6% |
| $75,000 to $99,999 | 727 | 17.4% |
| $100,000 to $149,999 | 627 | 15.0% |
| $150,000 to $199,999 | 334 | 8.0% |
| $200,000+ | 167 | 4.0% |
Household Income by Householder Age in Millard County
The median household income in Millard County is $69,403, with the highest median household income of $83,130 found in the 45 to 64 years age bracket for the primary householder. A total of 1,362 households (32.6%) fall into this category. Meanwhile, the 15 to 24 years age bracket for the primary householder has the lowest median household income of $32,500, with 150 households (3.6%) in this group.
| Income Bracket | # Households | Median Income |
| 15 to 24 Years | 150 (3.6%) | $32,500 |
| 25 to 44 Years | 1,386 (33.2%) | $66,563 |
| 45 to 64 Years | 1,362 (32.6%) | $83,130 |
| 65+ Years | 1,279 (30.6%) | $63,950 |
| Total | 4,177 (100.0%) | $69,403 |
Poverty in Millard County
Income Below Poverty by Sex and Age in Millard County
With 10.3% poverty level for males and 12.1% for females among the residents of Millard County, under 5 year old males and 5 year old females are the most vulnerable to poverty, with 209 males (36.0%) and 82 females (49.4%) in their respective age groups living below the poverty level.
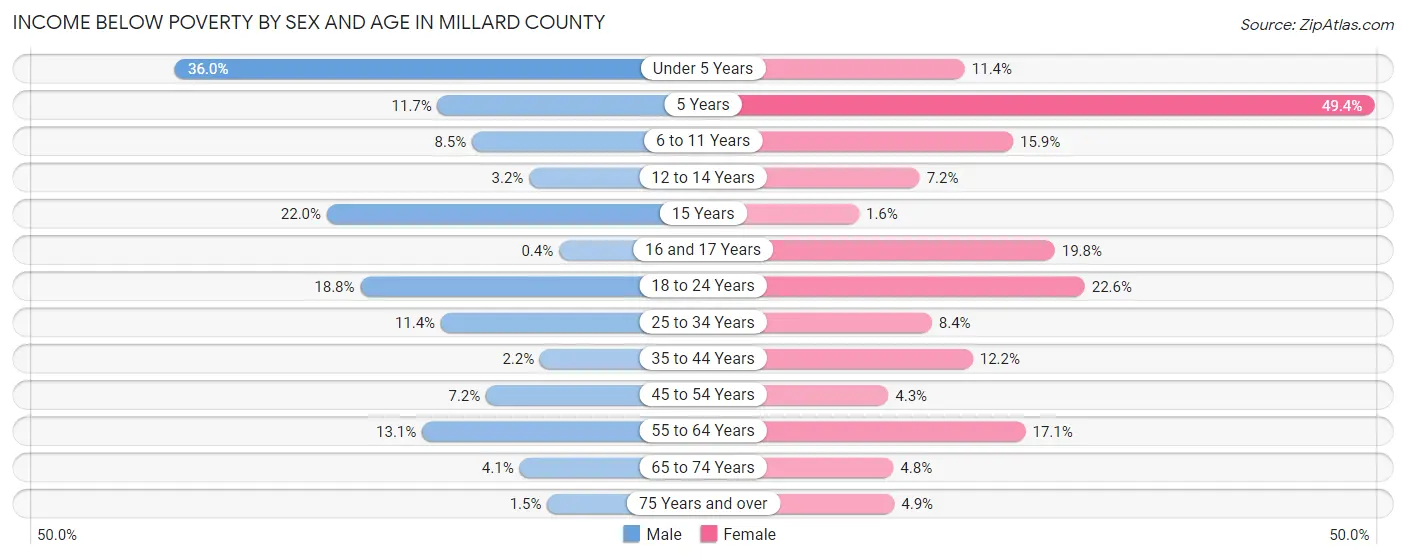
| Age Bracket | Male | Female |
| Under 5 Years | 209 (36.0%) | 41 (11.4%) |
| 5 Years | 14 (11.7%) | 82 (49.4%) |
| 6 to 11 Years | 60 (8.5%) | 107 (15.9%) |
| 12 to 14 Years | 13 (3.2%) | 23 (7.2%) |
| 15 Years | 18 (22.0%) | 3 (1.6%) |
| 16 and 17 Years | 1 (0.4%) | 34 (19.8%) |
| 18 to 24 Years | 101 (18.8%) | 115 (22.6%) |
| 25 to 34 Years | 85 (11.4%) | 61 (8.4%) |
| 35 to 44 Years | 18 (2.2%) | 90 (12.2%) |
| 45 to 54 Years | 41 (7.2%) | 25 (4.3%) |
| 55 to 64 Years | 88 (13.1%) | 125 (17.1%) |
| 65 to 74 Years | 26 (4.1%) | 29 (4.8%) |
| 75 Years and over | 7 (1.5%) | 23 (4.9%) |
| Total | 681 (10.3%) | 758 (12.1%) |
Income Above Poverty by Sex and Age in Millard County
According to the poverty statistics in Millard County, males aged 16 and 17 years and females aged 15 years are the age groups that are most secure financially, with 99.6% of males and 98.4% of females in these age groups living above the poverty line.
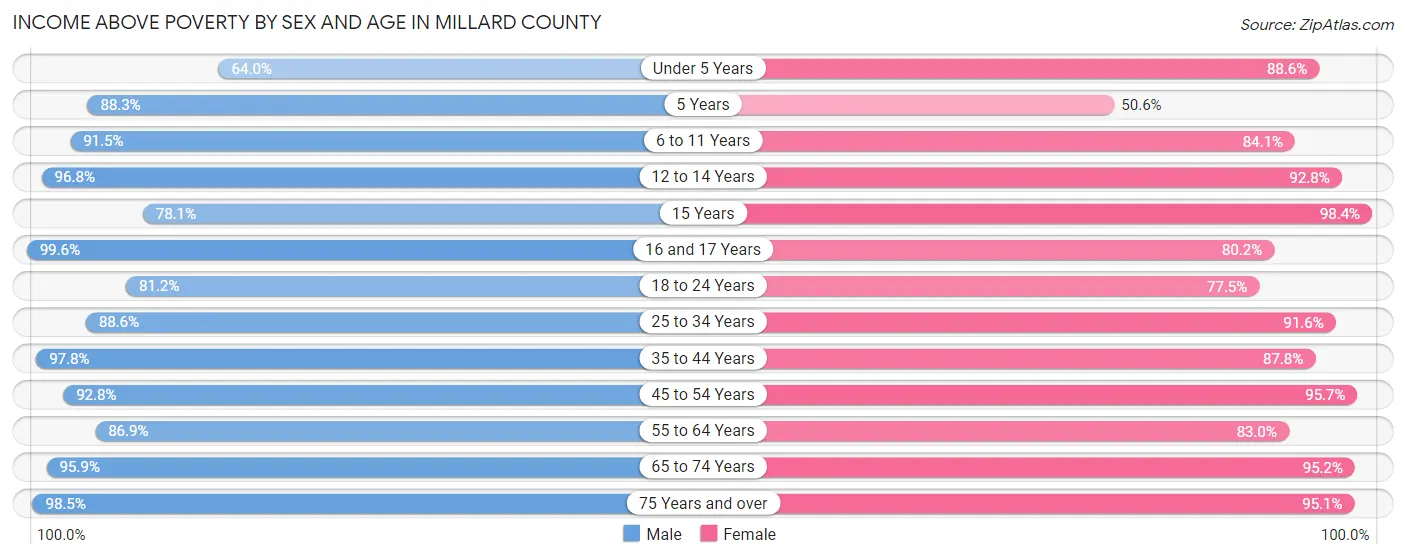
| Age Bracket | Male | Female |
| Under 5 Years | 371 (64.0%) | 318 (88.6%) |
| 5 Years | 106 (88.3%) | 84 (50.6%) |
| 6 to 11 Years | 648 (91.5%) | 566 (84.1%) |
| 12 to 14 Years | 397 (96.8%) | 295 (92.8%) |
| 15 Years | 64 (78.0%) | 185 (98.4%) |
| 16 and 17 Years | 246 (99.6%) | 138 (80.2%) |
| 18 to 24 Years | 435 (81.2%) | 395 (77.4%) |
| 25 to 34 Years | 663 (88.6%) | 669 (91.6%) |
| 35 to 44 Years | 817 (97.8%) | 650 (87.8%) |
| 45 to 54 Years | 531 (92.8%) | 554 (95.7%) |
| 55 to 64 Years | 583 (86.9%) | 608 (83.0%) |
| 65 to 74 Years | 613 (95.9%) | 576 (95.2%) |
| 75 Years and over | 463 (98.5%) | 448 (95.1%) |
| Total | 5,937 (89.7%) | 5,486 (87.9%) |
Income Below Poverty Among Married-Couple Families in Millard County
The poverty statistics for married-couple families in Millard County show that 8.2% or 220 of the total 2,675 families live below the poverty line. Families with 3 or 4 children have the highest poverty rate of 19.6%, comprising of 106 families. On the other hand, families with 1 or 2 children have the lowest poverty rate of 1.7%, which includes 10 families.
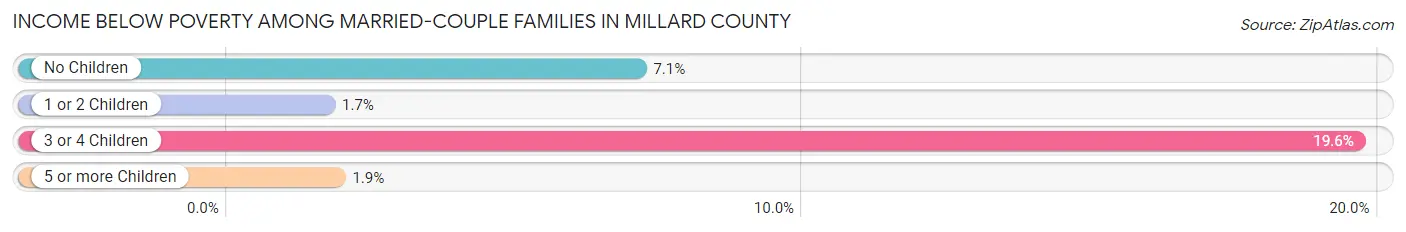
| Children | Above Poverty | Below Poverty |
| No Children | 1,333 (92.9%) | 102 (7.1%) |
| 1 or 2 Children | 583 (98.3%) | 10 (1.7%) |
| 3 or 4 Children | 434 (80.4%) | 106 (19.6%) |
| 5 or more Children | 105 (98.1%) | 2 (1.9%) |
| Total | 2,455 (91.8%) | 220 (8.2%) |
Income Below Poverty Among Single-Parent Households in Millard County
According to the poverty data in Millard County, 11.6% or 23 single-father households and 24.6% or 96 single-mother households are living below the poverty line. Among single-father households, those with 3 or 4 children have the highest poverty rate, with 2 households (100.0%) experiencing poverty. Likewise, among single-mother households, those with 3 or 4 children have the highest poverty rate, with 17 households (47.2%) falling below the poverty line.
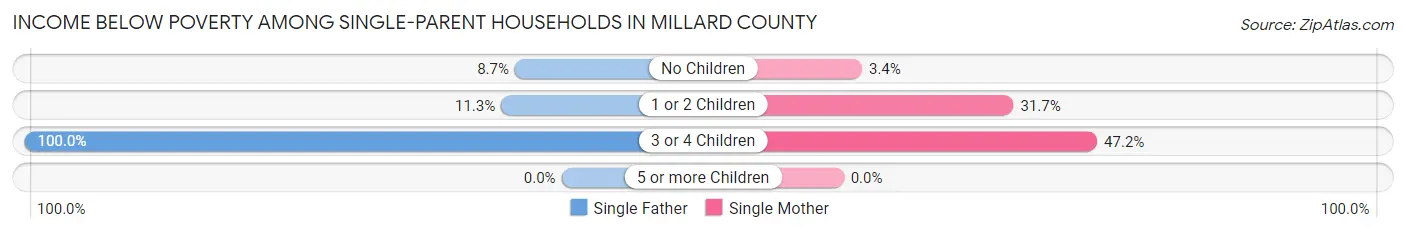
| Children | Single Father | Single Mother |
| No Children | 4 (8.7%) | 4 (3.4%) |
| 1 or 2 Children | 17 (11.3%) | 75 (31.7%) |
| 3 or 4 Children | 2 (100.0%) | 17 (47.2%) |
| 5 or more Children | 0 (0.0%) | 0 (0.0%) |
| Total | 23 (11.6%) | 96 (24.6%) |
Income Below Poverty Among Married-Couple vs Single-Parent Households in Millard County
The poverty data for Millard County shows that 220 of the married-couple family households (8.2%) and 119 of the single-parent households (20.2%) are living below the poverty level. Within the married-couple family households, those with 3 or 4 children have the highest poverty rate, with 106 households (19.6%) falling below the poverty line. Among the single-parent households, those with 3 or 4 children have the highest poverty rate, with 19 household (50.0%) living below poverty.
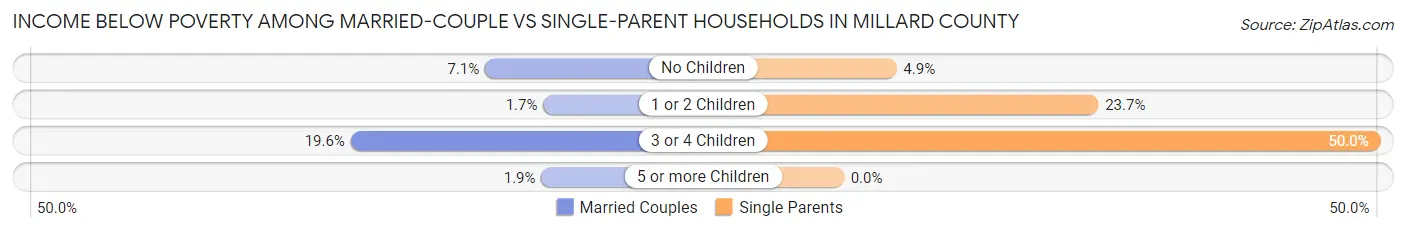
| Children | Married-Couple Families | Single-Parent Households |
| No Children | 102 (7.1%) | 8 (4.9%) |
| 1 or 2 Children | 10 (1.7%) | 92 (23.7%) |
| 3 or 4 Children | 106 (19.6%) | 19 (50.0%) |
| 5 or more Children | 2 (1.9%) | 0 (0.0%) |
| Total | 220 (8.2%) | 119 (20.2%) |
Employment Characteristics in Millard County
Employment by Class of Employer in Millard County
Among the 5,230 employed individuals in Millard County, private company employees (3,375 | 64.5%), local government employees (612 | 11.7%), and self-employed (not incorporated) (378 | 7.2%) make up the most common classes of employment.
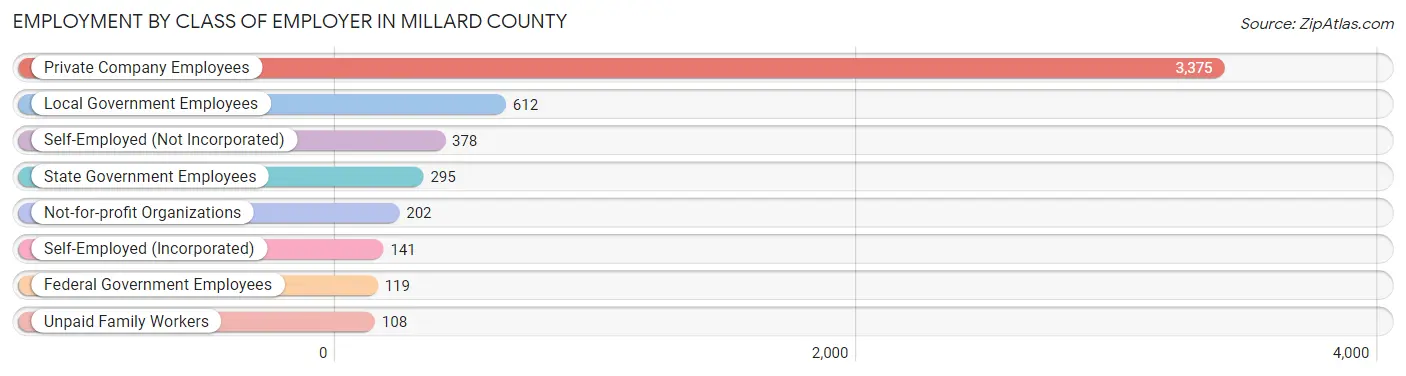
| Employer Class | # Employees | % Employees |
| Private Company Employees | 3,375 | 64.5% |
| Self-Employed (Incorporated) | 141 | 2.7% |
| Self-Employed (Not Incorporated) | 378 | 7.2% |
| Not-for-profit Organizations | 202 | 3.9% |
| Local Government Employees | 612 | 11.7% |
| State Government Employees | 295 | 5.6% |
| Federal Government Employees | 119 | 2.3% |
| Unpaid Family Workers | 108 | 2.1% |
| Total | 5,230 | 100.0% |
Employment Status by Age in Millard County
According to the labor force statistics for Millard County, out of the total population over 16 years of age (9,387), 60.1% or 5,642 individuals are in the labor force, with 4.4% or 248 of them unemployed. The age group with the highest labor force participation rate is 25 to 29 years, with 84.3% or 687 individuals in the labor force. Within the labor force, the 20 to 24 years age range has the highest percentage of unemployed individuals, with 17.2% or 78 of them being unemployed.
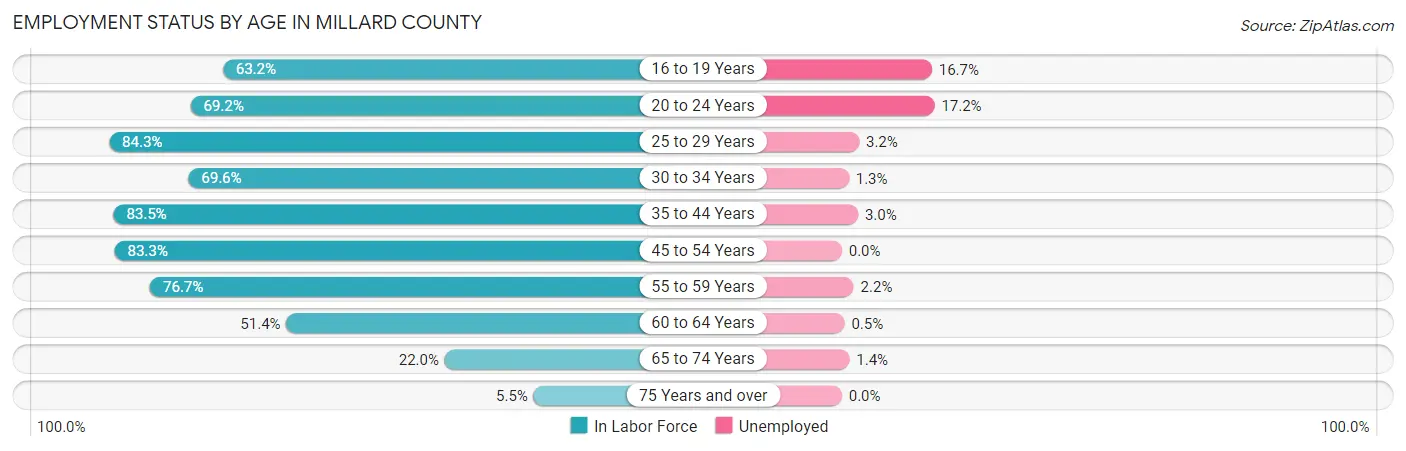
| Age Bracket | In Labor Force | Unemployed |
| 16 to 19 Years | 516 (63.2%) | 86 (16.7%) |
| 20 to 24 Years | 453 (69.2%) | 78 (17.2%) |
| 25 to 29 Years | 687 (84.3%) | 22 (3.2%) |
| 30 to 34 Years | 473 (69.6%) | 6 (1.3%) |
| 35 to 44 Years | 1,331 (83.5%) | 40 (3.0%) |
| 45 to 54 Years | 962 (83.3%) | 0 (0.0%) |
| 55 to 59 Years | 494 (76.7%) | 11 (2.2%) |
| 60 to 64 Years | 398 (51.4%) | 2 (0.5%) |
| 65 to 74 Years | 276 (22.0%) | 4 (1.4%) |
| 75 Years and over | 55 (5.5%) | 0 (0.0%) |
| Total | 5,642 (60.1%) | 248 (4.4%) |
Employment Status by Educational Attainment in Millard County
According to labor force statistics for Millard County, 76.7% of individuals (4,343) out of the total population between 25 and 64 years of age (5,662) are in the labor force, with 1.9% or 83 of them being unemployed. The group with the highest labor force participation rate are those with the educational attainment of college / associate degree, with 81.5% or 1,500 individuals in the labor force. Within the labor force, individuals with college / associate degree education have the highest percentage of unemployment, with 4.1% or 62 of them being unemployed.
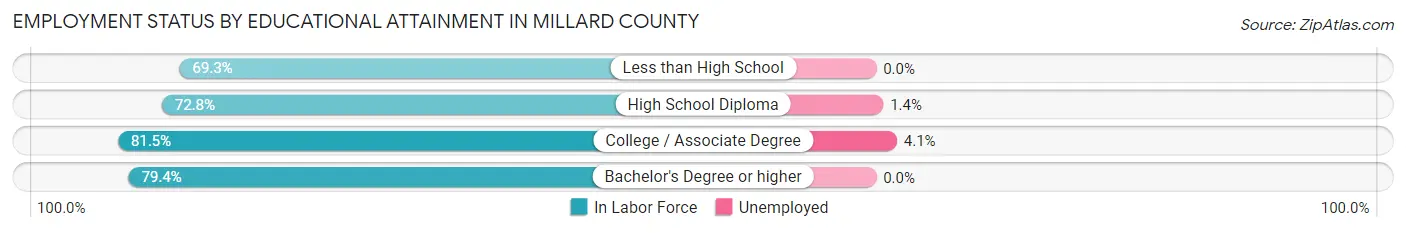
| Educational Attainment | In Labor Force | Unemployed |
| Less than High School | 436 (69.3%) | 0 (0.0%) |
| High School Diploma | 1,387 (72.8%) | 27 (1.4%) |
| College / Associate Degree | 1,500 (81.5%) | 75 (4.1%) |
| Bachelor's Degree or higher | 1,023 (79.4%) | 0 (0.0%) |
| Total | 4,343 (76.7%) | 108 (1.9%) |
Employment Occupations by Sex in Millard County
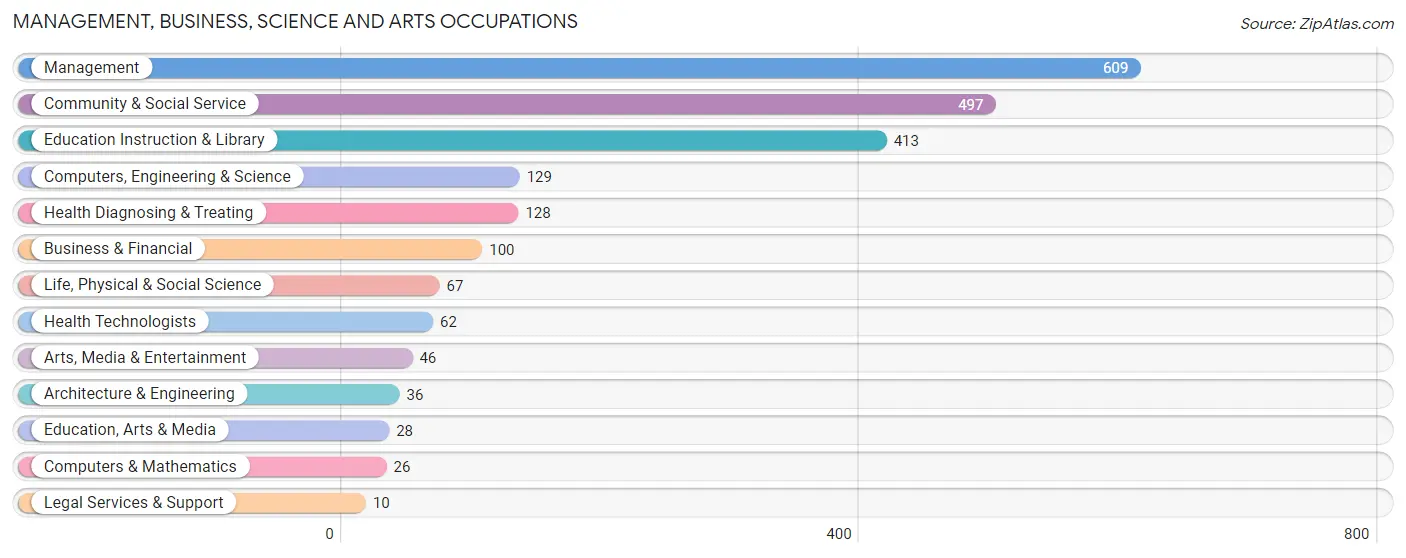
Management, Business, Science and Arts Occupations
The most common Management, Business, Science and Arts occupations in Millard County are Management (609 | 11.3%), Community & Social Service (497 | 9.2%), Education Instruction & Library (413 | 7.7%), Computers, Engineering & Science (129 | 2.4%), and Health Diagnosing & Treating (128 | 2.4%).
Management, Business, Science and Arts Occupations by Sex
Within the Management, Business, Science and Arts occupations in Millard County, the most male-oriented occupations are Architecture & Engineering (100.0%), Computers, Engineering & Science (80.6%), and Management (78.3%), while the most female-oriented occupations are Legal Services & Support (100.0%), Education Instruction & Library (83.3%), and Community & Social Service (81.5%).
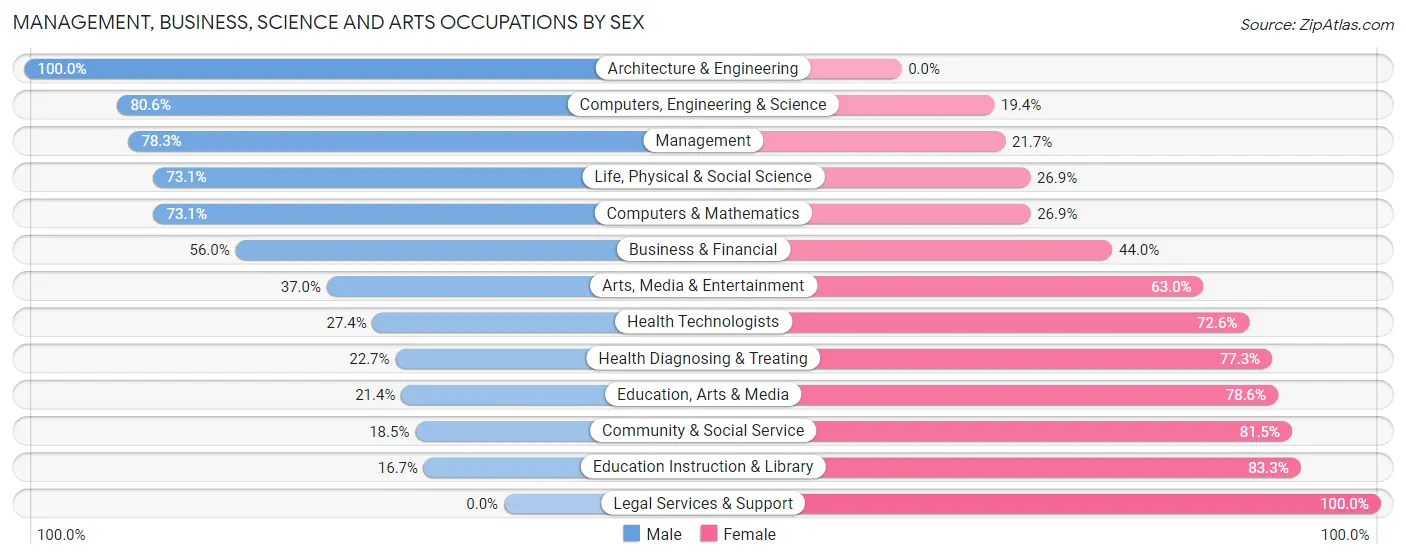
| Occupation | Male | Female |
| Management | 477 (78.3%) | 132 (21.7%) |
| Business & Financial | 56 (56.0%) | 44 (44.0%) |
| Computers, Engineering & Science | 104 (80.6%) | 25 (19.4%) |
| Computers & Mathematics | 19 (73.1%) | 7 (26.9%) |
| Architecture & Engineering | 36 (100.0%) | 0 (0.0%) |
| Life, Physical & Social Science | 49 (73.1%) | 18 (26.9%) |
| Community & Social Service | 92 (18.5%) | 405 (81.5%) |
| Education, Arts & Media | 6 (21.4%) | 22 (78.6%) |
| Legal Services & Support | 0 (0.0%) | 10 (100.0%) |
| Education Instruction & Library | 69 (16.7%) | 344 (83.3%) |
| Arts, Media & Entertainment | 17 (37.0%) | 29 (63.0%) |
| Health Diagnosing & Treating | 29 (22.7%) | 99 (77.3%) |
| Health Technologists | 17 (27.4%) | 45 (72.6%) |
| Total (Category) | 758 (51.8%) | 705 (48.2%) |
| Total (Overall) | 3,018 (55.9%) | 2,377 (44.1%) |
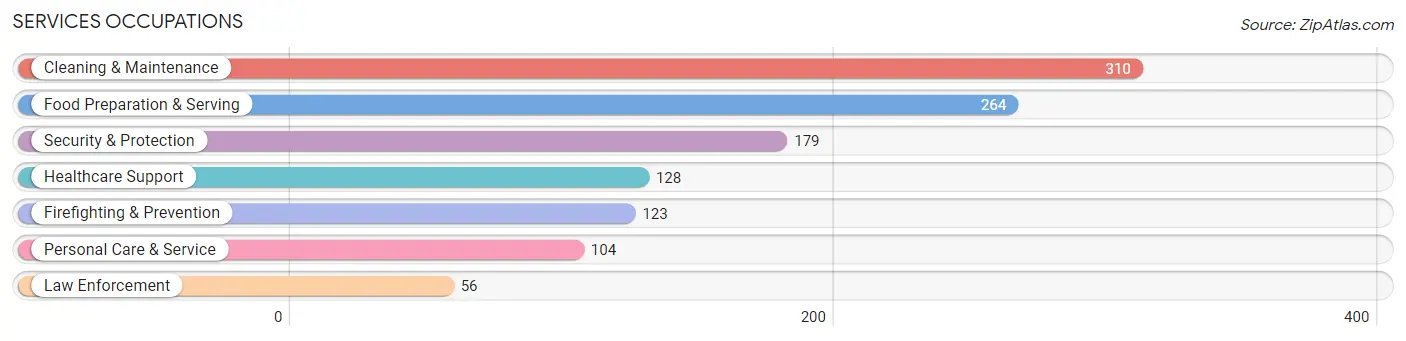
Services Occupations
The most common Services occupations in Millard County are Cleaning & Maintenance (310 | 5.8%), Food Preparation & Serving (264 | 4.9%), Security & Protection (179 | 3.3%), Healthcare Support (128 | 2.4%), and Firefighting & Prevention (123 | 2.3%).
Services Occupations by Sex
Within the Services occupations in Millard County, the most male-oriented occupations are Law Enforcement (100.0%), Security & Protection (66.5%), and Firefighting & Prevention (51.2%), while the most female-oriented occupations are Healthcare Support (100.0%), Personal Care & Service (94.2%), and Food Preparation & Serving (54.5%).
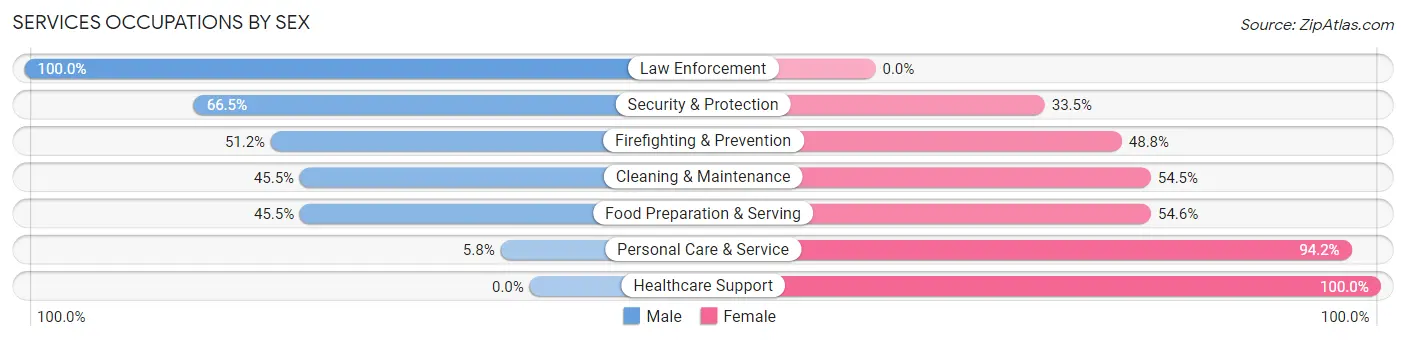
| Occupation | Male | Female |
| Healthcare Support | 0 (0.0%) | 128 (100.0%) |
| Security & Protection | 119 (66.5%) | 60 (33.5%) |
| Firefighting & Prevention | 63 (51.2%) | 60 (48.8%) |
| Law Enforcement | 56 (100.0%) | 0 (0.0%) |
| Food Preparation & Serving | 120 (45.5%) | 144 (54.5%) |
| Cleaning & Maintenance | 141 (45.5%) | 169 (54.5%) |
| Personal Care & Service | 6 (5.8%) | 98 (94.2%) |
| Total (Category) | 386 (39.2%) | 599 (60.8%) |
| Total (Overall) | 3,018 (55.9%) | 2,377 (44.1%) |
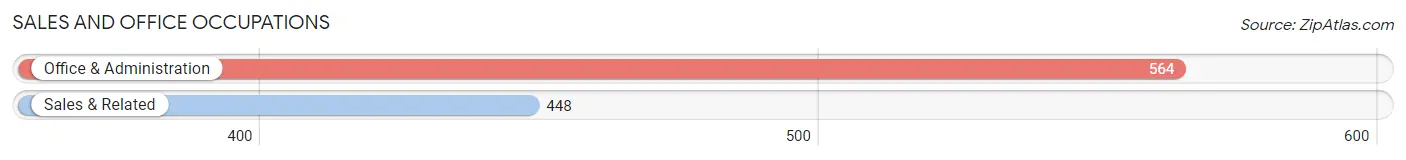
Sales and Office Occupations
The most common Sales and Office occupations in Millard County are Office & Administration (564 | 10.4%), and Sales & Related (448 | 8.3%).
Sales and Office Occupations by Sex
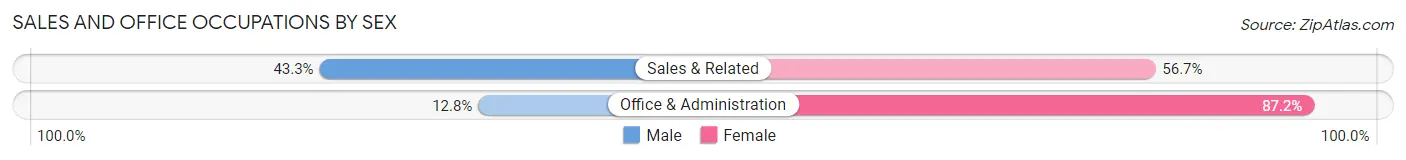
| Occupation | Male | Female |
| Sales & Related | 194 (43.3%) | 254 (56.7%) |
| Office & Administration | 72 (12.8%) | 492 (87.2%) |
| Total (Category) | 266 (26.3%) | 746 (73.7%) |
| Total (Overall) | 3,018 (55.9%) | 2,377 (44.1%) |
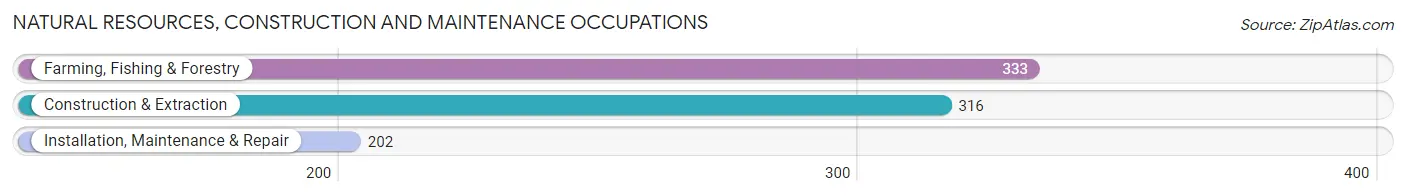
Natural Resources, Construction and Maintenance Occupations
The most common Natural Resources, Construction and Maintenance occupations in Millard County are Farming, Fishing & Forestry (333 | 6.2%), Construction & Extraction (316 | 5.9%), and Installation, Maintenance & Repair (202 | 3.7%).
Natural Resources, Construction and Maintenance Occupations by Sex
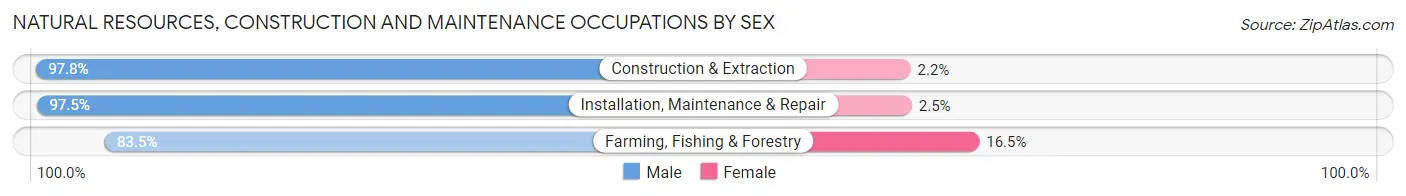
| Occupation | Male | Female |
| Farming, Fishing & Forestry | 278 (83.5%) | 55 (16.5%) |
| Construction & Extraction | 309 (97.8%) | 7 (2.2%) |
| Installation, Maintenance & Repair | 197 (97.5%) | 5 (2.5%) |
| Total (Category) | 784 (92.1%) | 67 (7.9%) |
| Total (Overall) | 3,018 (55.9%) | 2,377 (44.1%) |
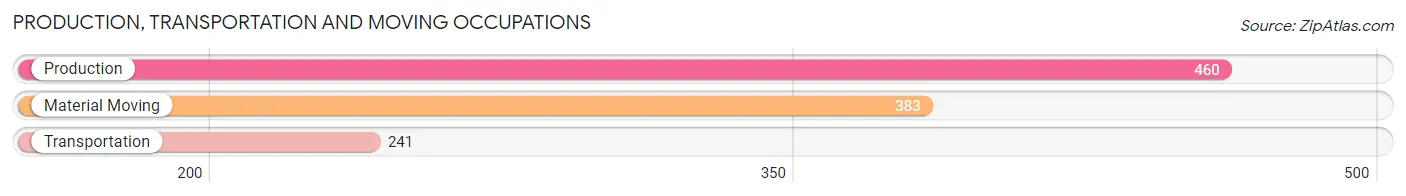
Production, Transportation and Moving Occupations
The most common Production, Transportation and Moving occupations in Millard County are Production (460 | 8.5%), Material Moving (383 | 7.1%), and Transportation (241 | 4.5%).
Production, Transportation and Moving Occupations by Sex
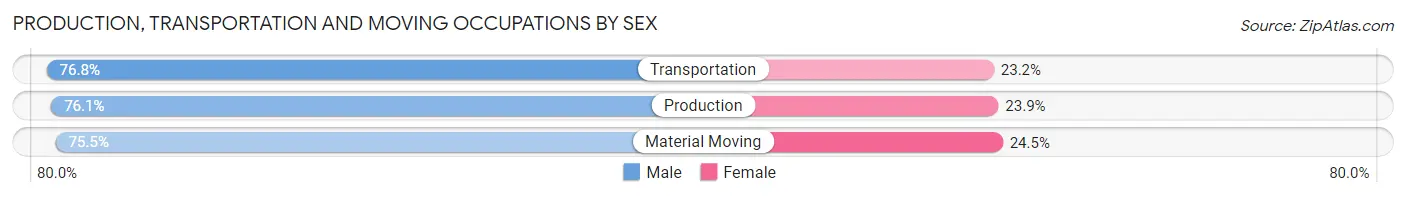
| Occupation | Male | Female |
| Production | 350 (76.1%) | 110 (23.9%) |
| Transportation | 185 (76.8%) | 56 (23.2%) |
| Material Moving | 289 (75.5%) | 94 (24.5%) |
| Total (Category) | 824 (76.0%) | 260 (24.0%) |
| Total (Overall) | 3,018 (55.9%) | 2,377 (44.1%) |
Employment Industries by Sex in Millard County
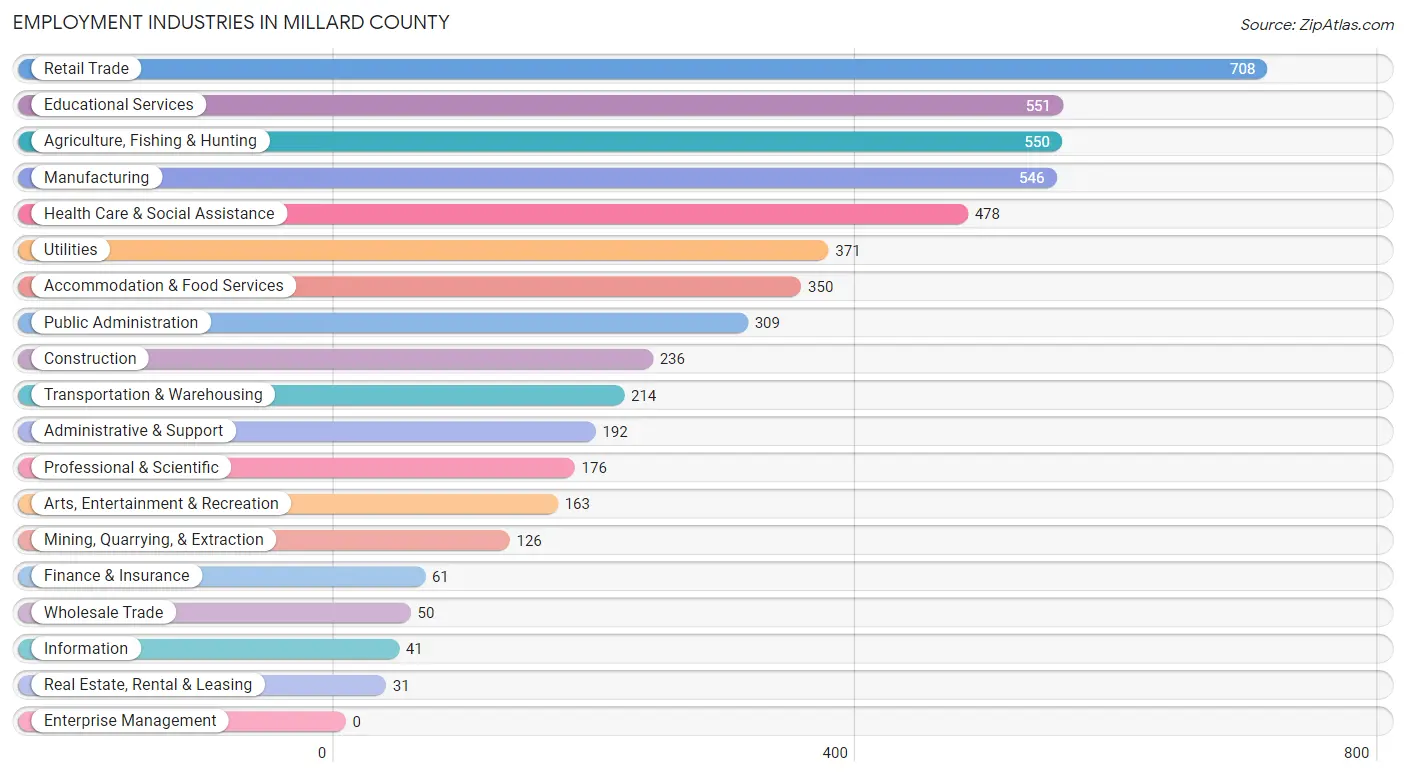
Employment Industries in Millard County
The major employment industries in Millard County include Retail Trade (708 | 13.1%), Educational Services (551 | 10.2%), Agriculture, Fishing & Hunting (550 | 10.2%), Manufacturing (546 | 10.1%), and Health Care & Social Assistance (478 | 8.9%).
Employment Industries by Sex in Millard County
The Millard County industries that see more men than women are Construction (99.6%), Utilities (94.3%), and Mining, Quarrying, & Extraction (89.7%), whereas the industries that tend to have a higher number of women are Health Care & Social Assistance (85.4%), Finance & Insurance (82.0%), and Educational Services (81.5%).
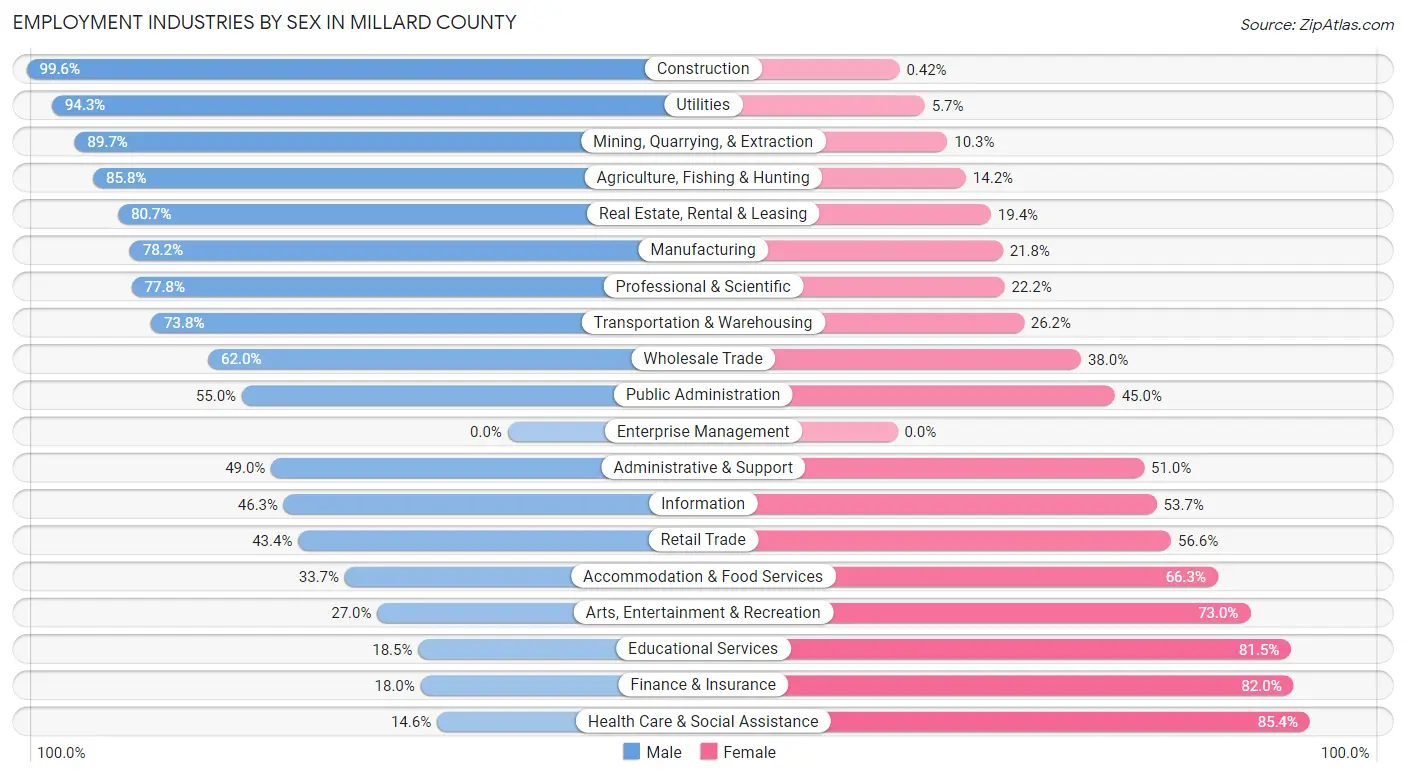
| Industry | Male | Female |
| Agriculture, Fishing & Hunting | 472 (85.8%) | 78 (14.2%) |
| Mining, Quarrying, & Extraction | 113 (89.7%) | 13 (10.3%) |
| Construction | 235 (99.6%) | 1 (0.4%) |
| Manufacturing | 427 (78.2%) | 119 (21.8%) |
| Wholesale Trade | 31 (62.0%) | 19 (38.0%) |
| Retail Trade | 307 (43.4%) | 401 (56.6%) |
| Transportation & Warehousing | 158 (73.8%) | 56 (26.2%) |
| Utilities | 350 (94.3%) | 21 (5.7%) |
| Information | 19 (46.3%) | 22 (53.7%) |
| Finance & Insurance | 11 (18.0%) | 50 (82.0%) |
| Real Estate, Rental & Leasing | 25 (80.6%) | 6 (19.4%) |
| Professional & Scientific | 137 (77.8%) | 39 (22.2%) |
| Enterprise Management | 0 (0.0%) | 0 (0.0%) |
| Administrative & Support | 94 (49.0%) | 98 (51.0%) |
| Educational Services | 102 (18.5%) | 449 (81.5%) |
| Health Care & Social Assistance | 70 (14.6%) | 408 (85.4%) |
| Arts, Entertainment & Recreation | 44 (27.0%) | 119 (73.0%) |
| Accommodation & Food Services | 118 (33.7%) | 232 (66.3%) |
| Public Administration | 170 (55.0%) | 139 (45.0%) |
| Total | 3,018 (55.9%) | 2,377 (44.1%) |
Education in Millard County
School Enrollment in Millard County
The most common levels of schooling among the 3,810 students in Millard County are high school (1,034 | 27.1%), middle school (975 | 25.6%), and elementary school (974 | 25.6%).
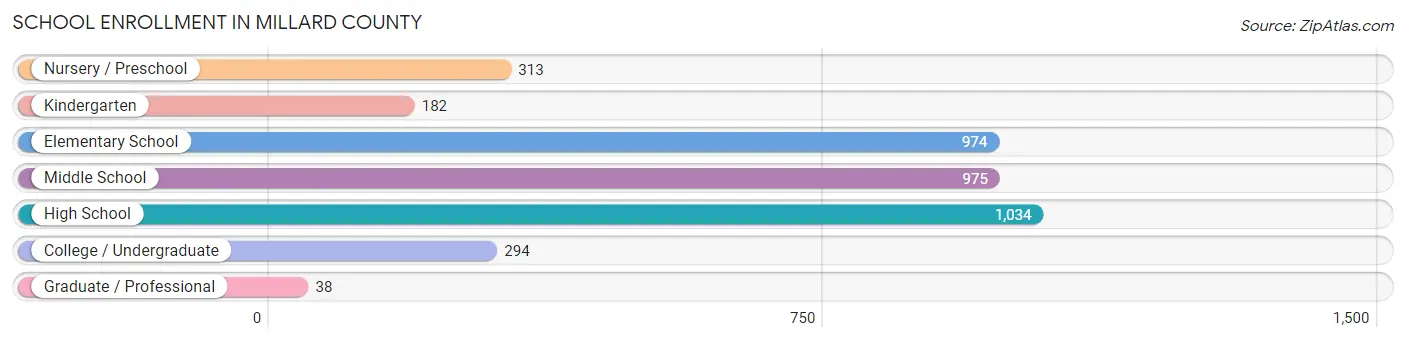
| School Level | # Students | % Students |
| Nursery / Preschool | 313 | 8.2% |
| Kindergarten | 182 | 4.8% |
| Elementary School | 974 | 25.6% |
| Middle School | 975 | 25.6% |
| High School | 1,034 | 27.1% |
| College / Undergraduate | 294 | 7.7% |
| Graduate / Professional | 38 | 1.0% |
| Total | 3,810 | 100.0% |
School Enrollment by Age by Funding Source in Millard County
Out of a total of 3,810 students who are enrolled in schools in Millard County, 351 (9.2%) attend a private institution, while the remaining 3,459 (90.8%) are enrolled in public schools. The age group of 35 years and over has the highest likelihood of being enrolled in private schools, with 32 (25.2% in the age bracket) enrolled. Conversely, the age group of 5 to 9 year old has the lowest likelihood of being enrolled in a private school, with 992 (94.6% in the age bracket) attending a public institution.
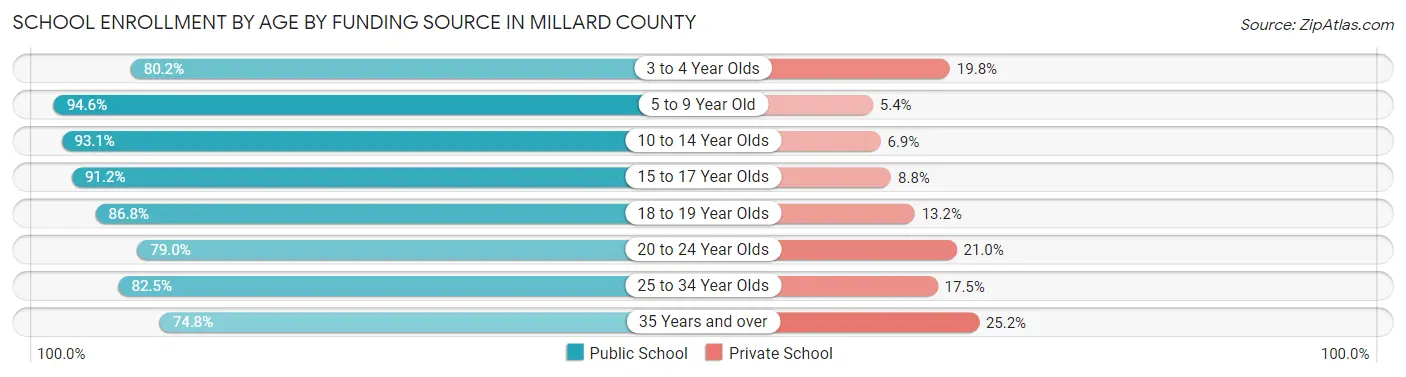
| Age Bracket | Public School | Private School |
| 3 to 4 Year Olds | 150 (80.2%) | 37 (19.8%) |
| 5 to 9 Year Old | 992 (94.6%) | 57 (5.4%) |
| 10 to 14 Year Olds | 1,220 (93.1%) | 90 (6.9%) |
| 15 to 17 Year Olds | 640 (91.2%) | 62 (8.8%) |
| 18 to 19 Year Olds | 190 (86.8%) | 29 (13.2%) |
| 20 to 24 Year Olds | 139 (79.0%) | 37 (21.0%) |
| 25 to 34 Year Olds | 33 (82.5%) | 7 (17.5%) |
| 35 Years and over | 95 (74.8%) | 32 (25.2%) |
| Total | 3,459 (90.8%) | 351 (9.2%) |
Educational Attainment by Field of Study in Millard County
Education (514 | 26.0%), business (348 | 17.6%), bio, nature & agricultural (191 | 9.7%), arts & humanities (159 | 8.0%), and literature & languages (120 | 6.1%) are the most common fields of study among 1,977 individuals in Millard County who have obtained a bachelor's degree or higher.
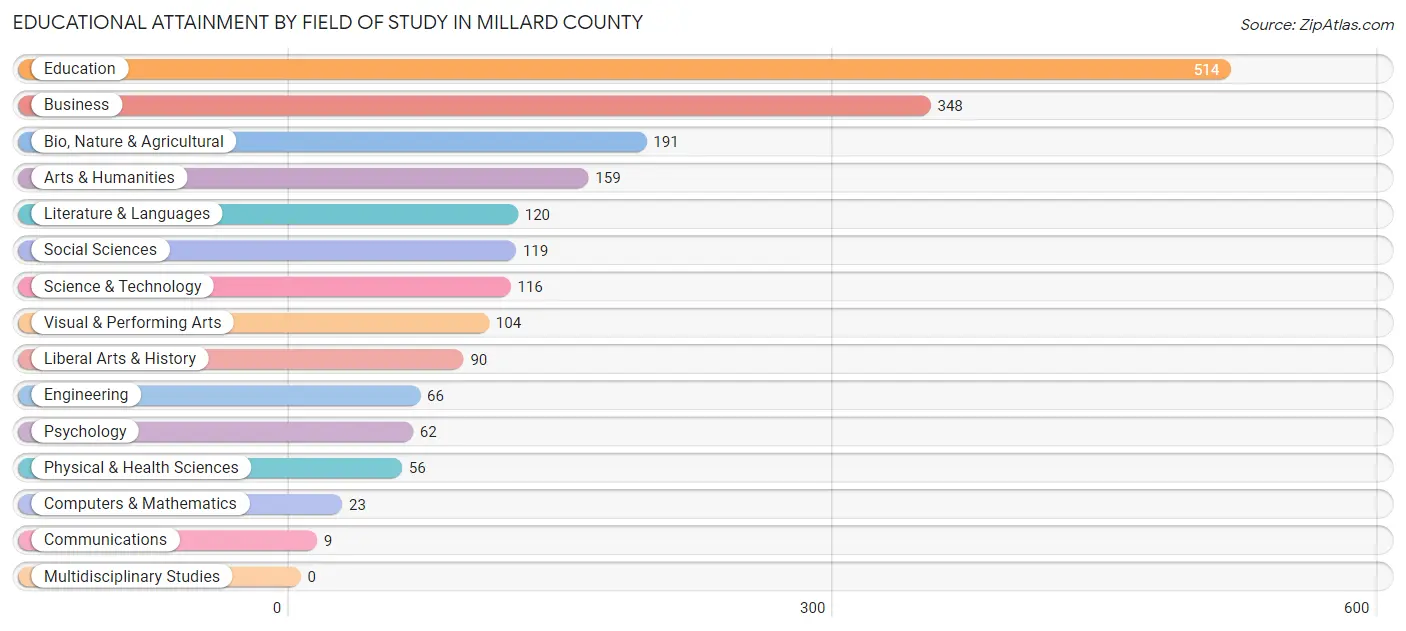
| Field of Study | # Graduates | % Graduates |
| Computers & Mathematics | 23 | 1.2% |
| Bio, Nature & Agricultural | 191 | 9.7% |
| Physical & Health Sciences | 56 | 2.8% |
| Psychology | 62 | 3.1% |
| Social Sciences | 119 | 6.0% |
| Engineering | 66 | 3.3% |
| Multidisciplinary Studies | 0 | 0.0% |
| Science & Technology | 116 | 5.9% |
| Business | 348 | 17.6% |
| Education | 514 | 26.0% |
| Literature & Languages | 120 | 6.1% |
| Liberal Arts & History | 90 | 4.5% |
| Visual & Performing Arts | 104 | 5.3% |
| Communications | 9 | 0.5% |
| Arts & Humanities | 159 | 8.0% |
| Total | 1,977 | 100.0% |
Transportation & Commute in Millard County
Vehicle Availability by Sex in Millard County
The most prevalent vehicle ownership categories in Millard County are males with 3 vehicles (979, accounting for 34.0%) and females with 3 vehicles (773, making up 42.4%).
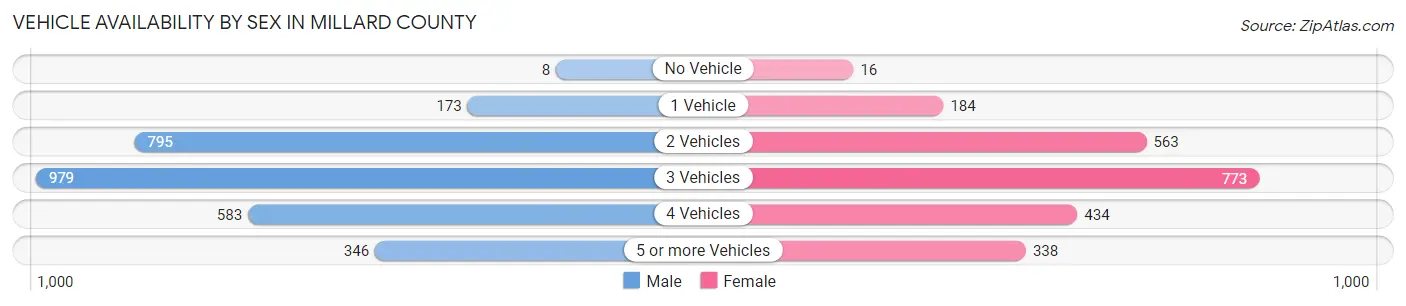
| Vehicles Available | Male | Female |
| No Vehicle | 8 (0.3%) | 16 (0.7%) |
| 1 Vehicle | 173 (6.0%) | 184 (8.0%) |
| 2 Vehicles | 795 (27.6%) | 563 (24.4%) |
| 3 Vehicles | 979 (34.0%) | 773 (33.5%) |
| 4 Vehicles | 583 (20.2%) | 434 (18.8%) |
| 5 or more Vehicles | 346 (12.0%) | 338 (14.6%) |
| Total | 2,884 (100.0%) | 2,308 (100.0%) |
Commute Time in Millard County
The most frequently occuring commute durations in Millard County are 5 to 9 minutes (1,203 commuters, 24.5%), 10 to 14 minutes (876 commuters, 17.8%), and less than 5 minutes (805 commuters, 16.4%).
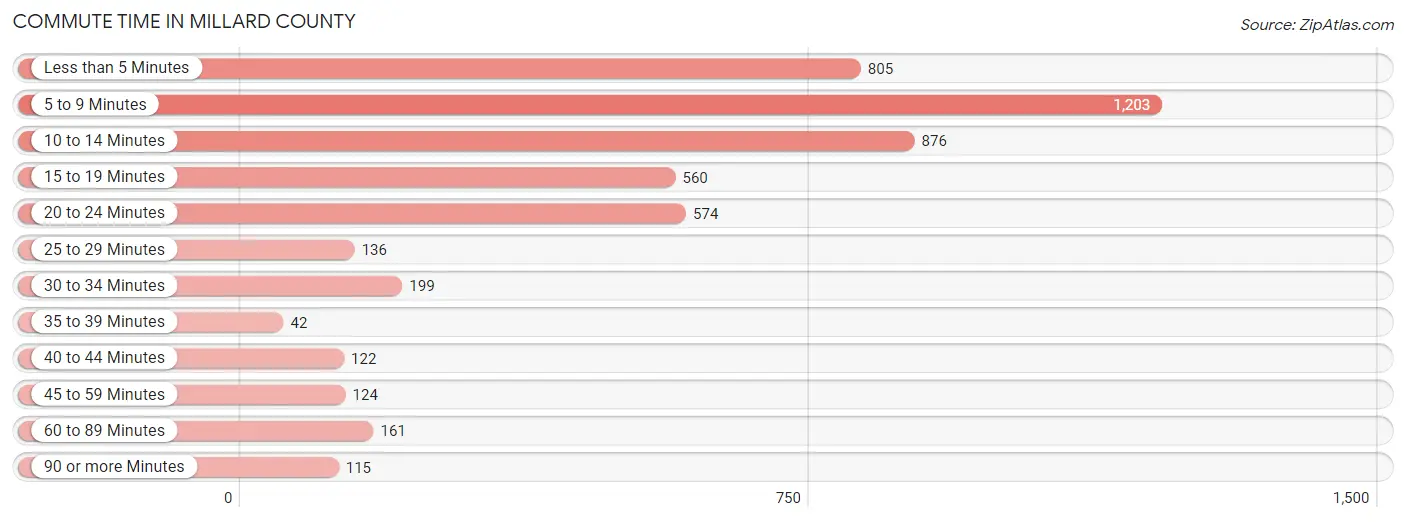
| Commute Time | # Commuters | % Commuters |
| Less than 5 Minutes | 805 | 16.4% |
| 5 to 9 Minutes | 1,203 | 24.5% |
| 10 to 14 Minutes | 876 | 17.8% |
| 15 to 19 Minutes | 560 | 11.4% |
| 20 to 24 Minutes | 574 | 11.7% |
| 25 to 29 Minutes | 136 | 2.8% |
| 30 to 34 Minutes | 199 | 4.1% |
| 35 to 39 Minutes | 42 | 0.9% |
| 40 to 44 Minutes | 122 | 2.5% |
| 45 to 59 Minutes | 124 | 2.5% |
| 60 to 89 Minutes | 161 | 3.3% |
| 90 or more Minutes | 115 | 2.3% |
Commute Time by Sex in Millard County
The most common commute times in Millard County are 5 to 9 minutes (586 commuters, 21.5%) for males and 5 to 9 minutes (617 commuters, 28.1%) for females.
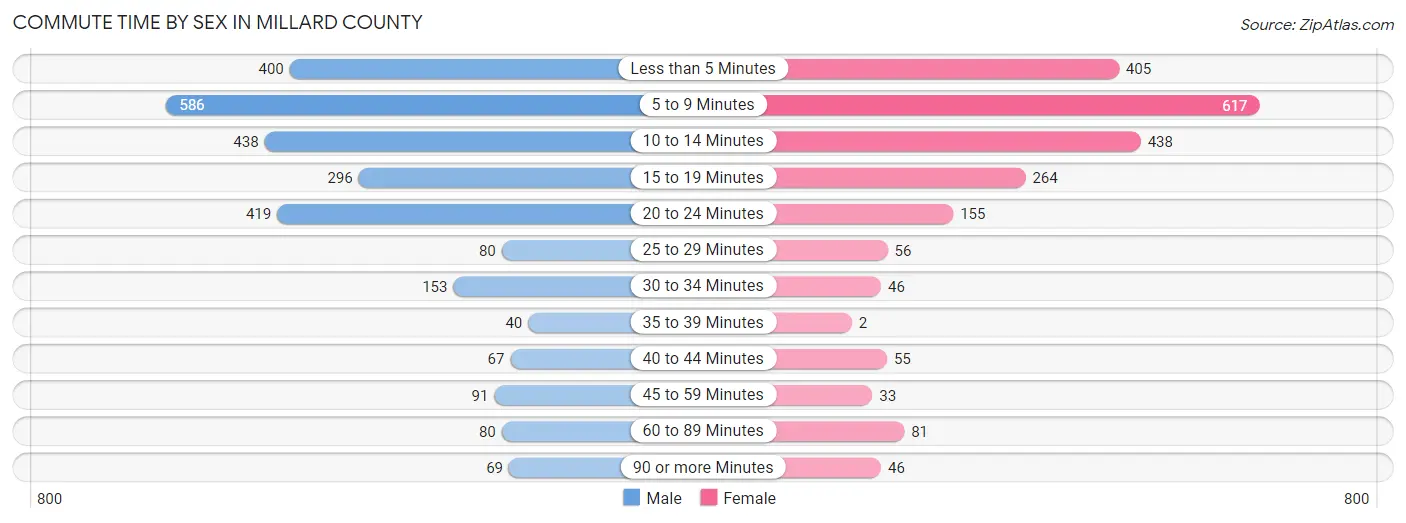
| Commute Time | Male | Female |
| Less than 5 Minutes | 400 (14.7%) | 405 (18.4%) |
| 5 to 9 Minutes | 586 (21.5%) | 617 (28.1%) |
| 10 to 14 Minutes | 438 (16.1%) | 438 (19.9%) |
| 15 to 19 Minutes | 296 (10.9%) | 264 (12.0%) |
| 20 to 24 Minutes | 419 (15.4%) | 155 (7.0%) |
| 25 to 29 Minutes | 80 (2.9%) | 56 (2.5%) |
| 30 to 34 Minutes | 153 (5.6%) | 46 (2.1%) |
| 35 to 39 Minutes | 40 (1.5%) | 2 (0.1%) |
| 40 to 44 Minutes | 67 (2.5%) | 55 (2.5%) |
| 45 to 59 Minutes | 91 (3.4%) | 33 (1.5%) |
| 60 to 89 Minutes | 80 (2.9%) | 81 (3.7%) |
| 90 or more Minutes | 69 (2.5%) | 46 (2.1%) |
Time of Departure to Work by Sex in Millard County
The most frequent times of departure to work in Millard County are 12:00 AM to 4:59 AM (417, 15.3%) for males and 7:30 AM to 7:59 AM (498, 22.7%) for females.
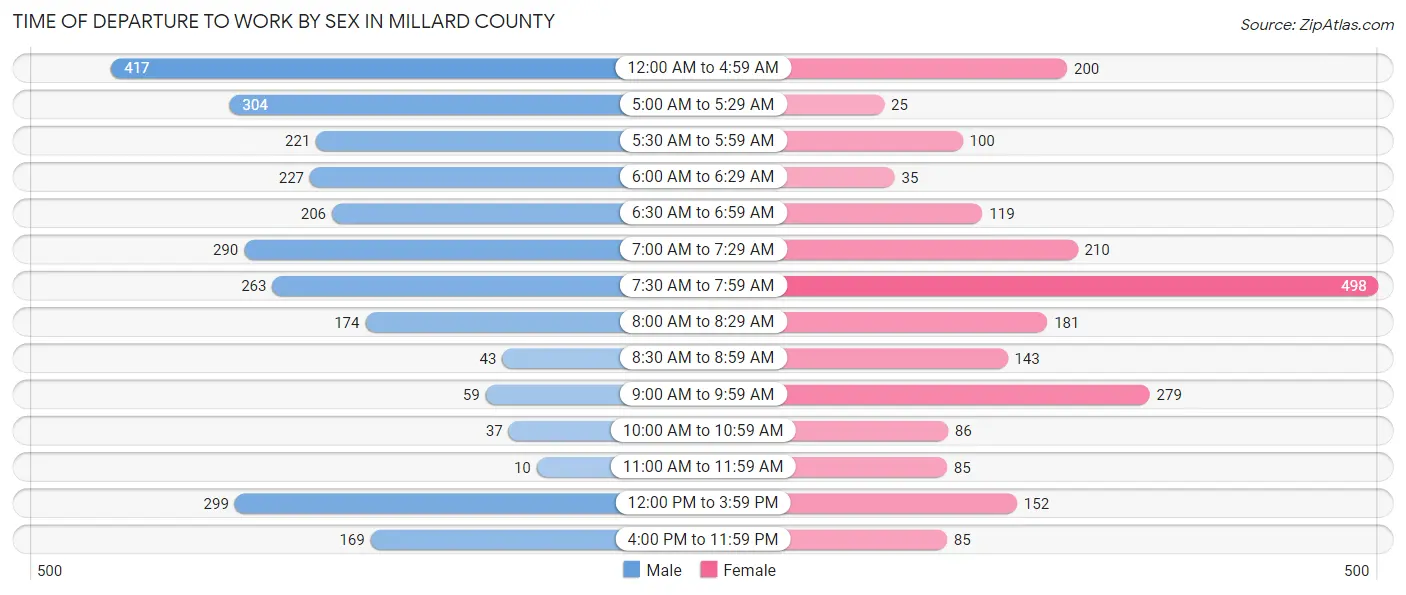
| Time of Departure | Male | Female |
| 12:00 AM to 4:59 AM | 417 (15.3%) | 200 (9.1%) |
| 5:00 AM to 5:29 AM | 304 (11.2%) | 25 (1.1%) |
| 5:30 AM to 5:59 AM | 221 (8.1%) | 100 (4.5%) |
| 6:00 AM to 6:29 AM | 227 (8.4%) | 35 (1.6%) |
| 6:30 AM to 6:59 AM | 206 (7.6%) | 119 (5.4%) |
| 7:00 AM to 7:29 AM | 290 (10.7%) | 210 (9.6%) |
| 7:30 AM to 7:59 AM | 263 (9.7%) | 498 (22.7%) |
| 8:00 AM to 8:29 AM | 174 (6.4%) | 181 (8.2%) |
| 8:30 AM to 8:59 AM | 43 (1.6%) | 143 (6.5%) |
| 9:00 AM to 9:59 AM | 59 (2.2%) | 279 (12.7%) |
| 10:00 AM to 10:59 AM | 37 (1.4%) | 86 (3.9%) |
| 11:00 AM to 11:59 AM | 10 (0.4%) | 85 (3.9%) |
| 12:00 PM to 3:59 PM | 299 (11.0%) | 152 (6.9%) |
| 4:00 PM to 11:59 PM | 169 (6.2%) | 85 (3.9%) |
| Total | 2,719 (100.0%) | 2,198 (100.0%) |
Housing Occupancy in Millard County
Occupancy by Ownership in Millard County
Of the total 4,177 dwellings in Millard County, owner-occupied units account for 3,173 (76.0%), while renter-occupied units make up 1,004 (24.0%).
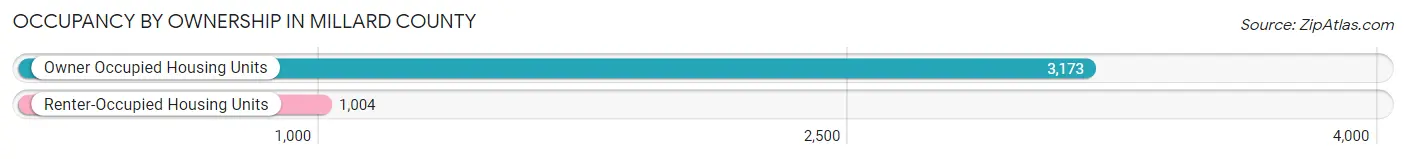
| Occupancy | # Housing Units | % Housing Units |
| Owner Occupied Housing Units | 3,173 | 76.0% |
| Renter-Occupied Housing Units | 1,004 | 24.0% |
| Total Occupied Housing Units | 4,177 | 100.0% |
Occupancy by Household Size in Millard County
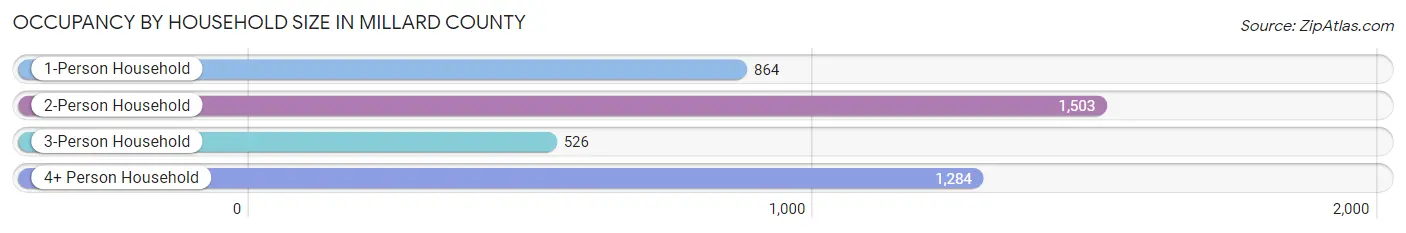
| Household Size | # Housing Units | % Housing Units |
| 1-Person Household | 864 | 20.7% |
| 2-Person Household | 1,503 | 36.0% |
| 3-Person Household | 526 | 12.6% |
| 4+ Person Household | 1,284 | 30.7% |
| Total Housing Units | 4,177 | 100.0% |
Occupancy by Ownership by Household Size in Millard County
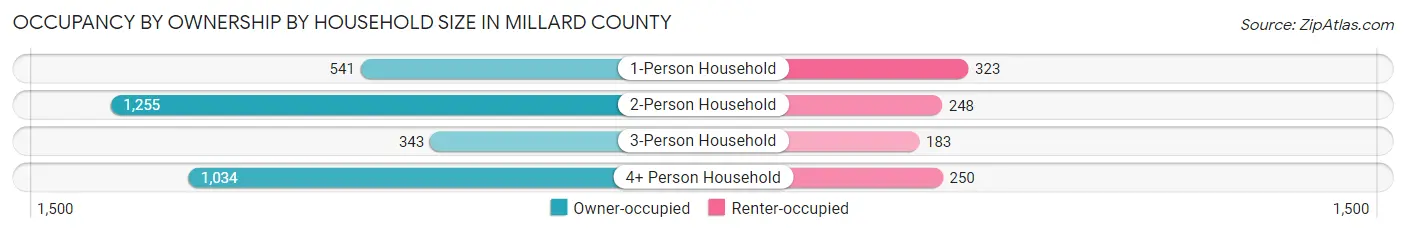
| Household Size | Owner-occupied | Renter-occupied |
| 1-Person Household | 541 (62.6%) | 323 (37.4%) |
| 2-Person Household | 1,255 (83.5%) | 248 (16.5%) |
| 3-Person Household | 343 (65.2%) | 183 (34.8%) |
| 4+ Person Household | 1,034 (80.5%) | 250 (19.5%) |
| Total Housing Units | 3,173 (76.0%) | 1,004 (24.0%) |
Occupancy by Educational Attainment in Millard County
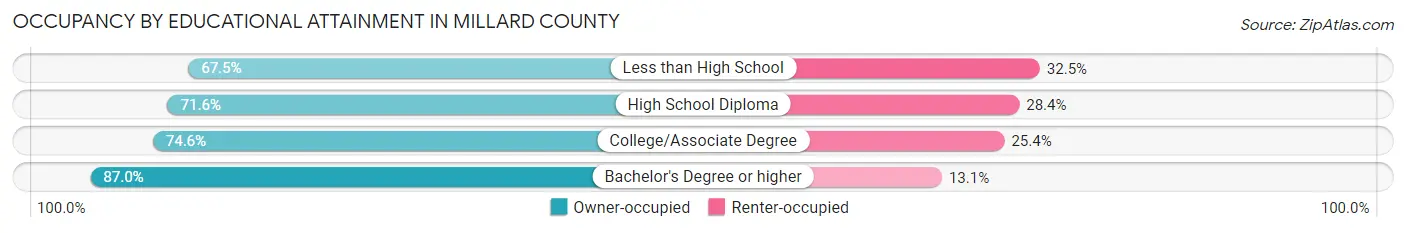
| Household Size | Owner-occupied | Renter-occupied |
| Less than High School | 231 (67.5%) | 111 (32.5%) |
| High School Diploma | 952 (71.6%) | 377 (28.4%) |
| College/Associate Degree | 1,137 (74.6%) | 388 (25.4%) |
| Bachelor's Degree or higher | 853 (87.0%) | 128 (13.1%) |
Occupancy by Age of Householder in Millard County
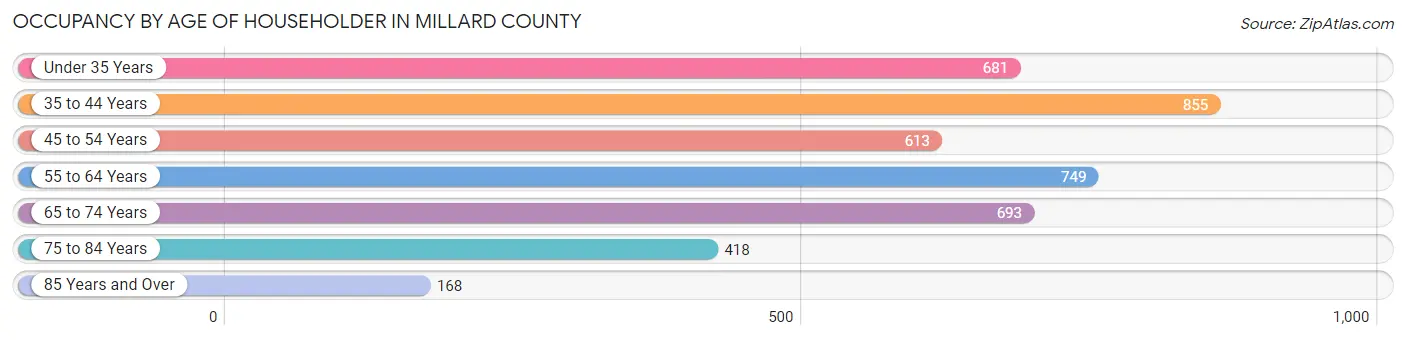
| Age Bracket | # Households | % Households |
| Under 35 Years | 681 | 16.3% |
| 35 to 44 Years | 855 | 20.5% |
| 45 to 54 Years | 613 | 14.7% |
| 55 to 64 Years | 749 | 17.9% |
| 65 to 74 Years | 693 | 16.6% |
| 75 to 84 Years | 418 | 10.0% |
| 85 Years and Over | 168 | 4.0% |
| Total | 4,177 | 100.0% |
Housing Finances in Millard County
Median Income by Occupancy in Millard County
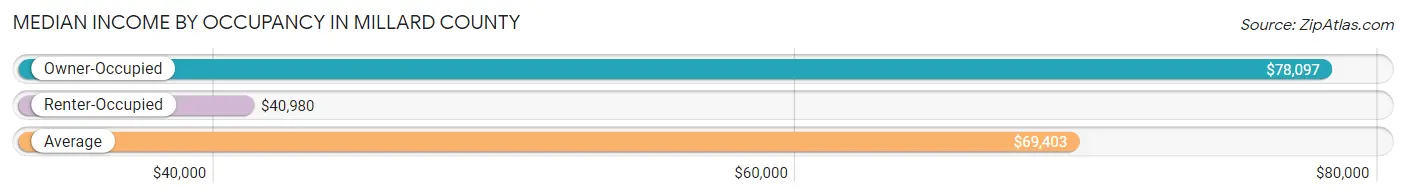
| Occupancy Type | # Households | Median Income |
| Owner-Occupied | 3,173 (76.0%) | $78,097 |
| Renter-Occupied | 1,004 (24.0%) | $40,980 |
| Average | 4,177 (100.0%) | $69,403 |
Occupancy by Householder Income Bracket in Millard County
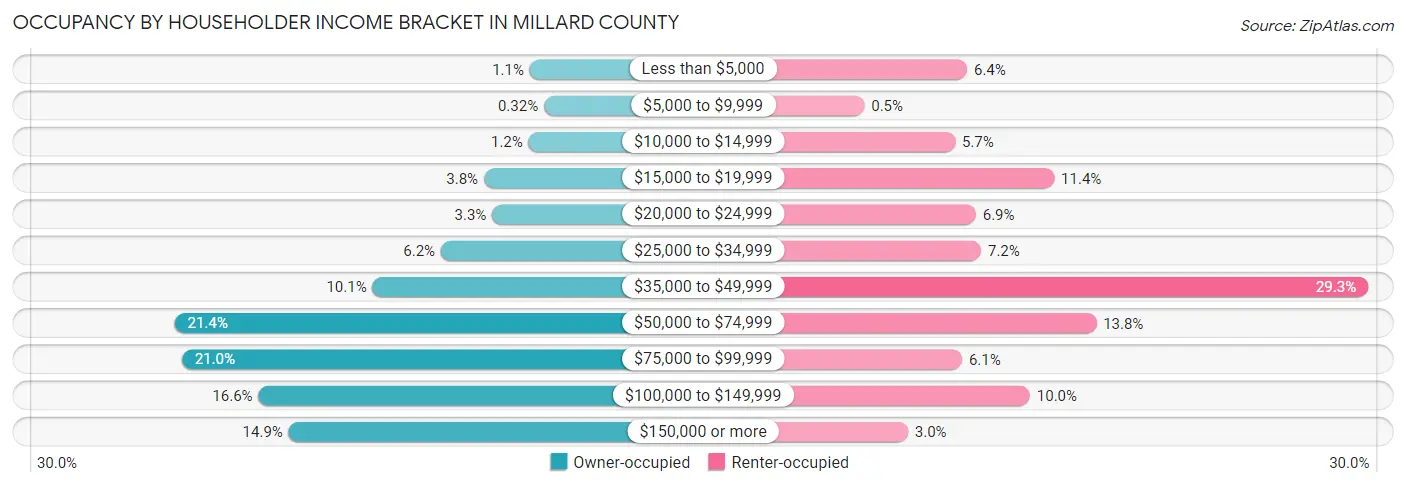
| Income Bracket | Owner-occupied | Renter-occupied |
| Less than $5,000 | 36 (1.1%) | 64 (6.4%) |
| $5,000 to $9,999 | 10 (0.3%) | 5 (0.5%) |
| $10,000 to $14,999 | 38 (1.2%) | 57 (5.7%) |
| $15,000 to $19,999 | 119 (3.7%) | 114 (11.4%) |
| $20,000 to $24,999 | 104 (3.3%) | 69 (6.9%) |
| $25,000 to $34,999 | 197 (6.2%) | 72 (7.2%) |
| $35,000 to $49,999 | 321 (10.1%) | 294 (29.3%) |
| $50,000 to $74,999 | 680 (21.4%) | 138 (13.8%) |
| $75,000 to $99,999 | 667 (21.0%) | 61 (6.1%) |
| $100,000 to $149,999 | 528 (16.6%) | 100 (10.0%) |
| $150,000 or more | 473 (14.9%) | 30 (3.0%) |
| Total | 3,173 (100.0%) | 1,004 (100.0%) |
Monthly Housing Cost Tiers in Millard County
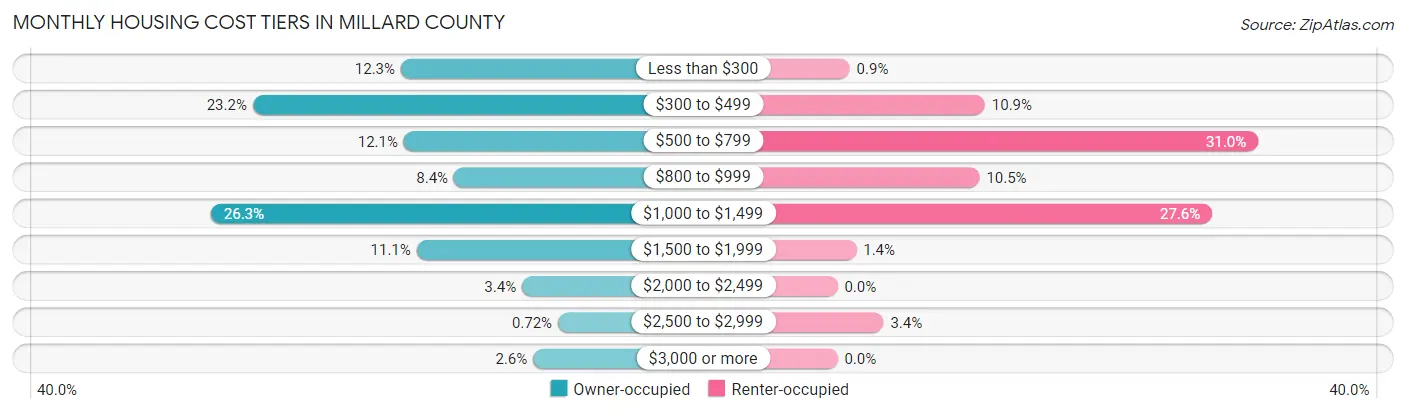
| Monthly Cost | Owner-occupied | Renter-occupied |
| Less than $300 | 390 (12.3%) | 9 (0.9%) |
| $300 to $499 | 736 (23.2%) | 109 (10.9%) |
| $500 to $799 | 383 (12.1%) | 311 (31.0%) |
| $800 to $999 | 266 (8.4%) | 105 (10.5%) |
| $1,000 to $1,499 | 834 (26.3%) | 277 (27.6%) |
| $1,500 to $1,999 | 353 (11.1%) | 14 (1.4%) |
| $2,000 to $2,499 | 107 (3.4%) | 0 (0.0%) |
| $2,500 to $2,999 | 23 (0.7%) | 34 (3.4%) |
| $3,000 or more | 81 (2.5%) | 0 (0.0%) |
| Total | 3,173 (100.0%) | 1,004 (100.0%) |
Physical Housing Characteristics in Millard County
Housing Structures in Millard County
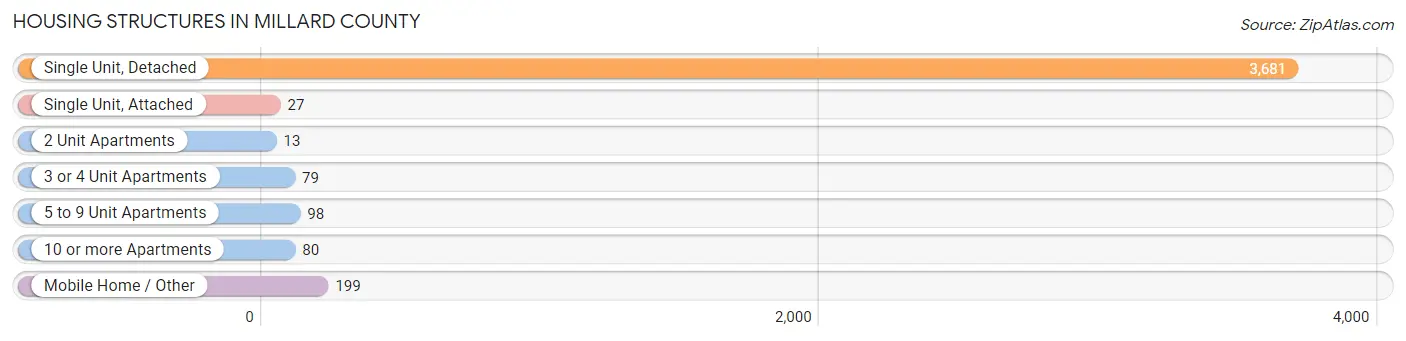
| Structure Type | # Housing Units | % Housing Units |
| Single Unit, Detached | 3,681 | 88.1% |
| Single Unit, Attached | 27 | 0.6% |
| 2 Unit Apartments | 13 | 0.3% |
| 3 or 4 Unit Apartments | 79 | 1.9% |
| 5 to 9 Unit Apartments | 98 | 2.4% |
| 10 or more Apartments | 80 | 1.9% |
| Mobile Home / Other | 199 | 4.8% |
| Total | 4,177 | 100.0% |
Housing Structures by Occupancy in Millard County
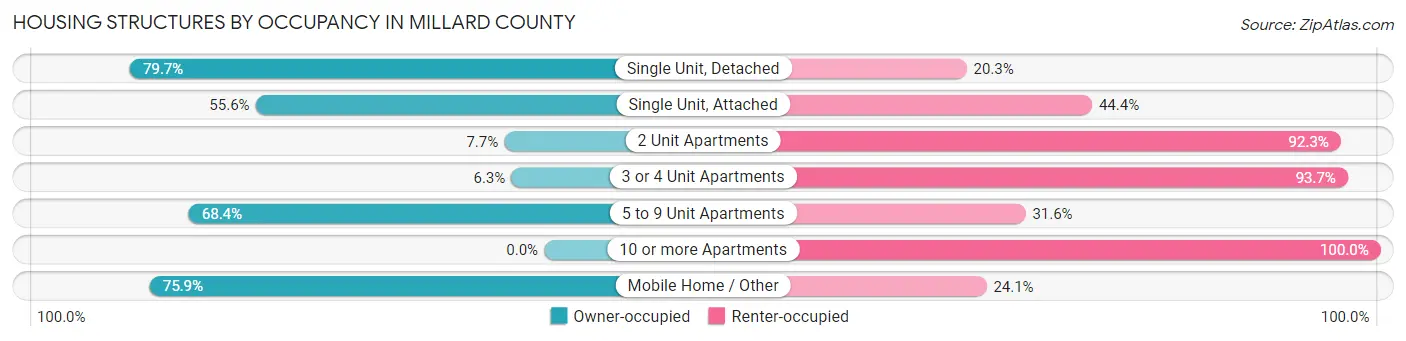
| Structure Type | Owner-occupied | Renter-occupied |
| Single Unit, Detached | 2,934 (79.7%) | 747 (20.3%) |
| Single Unit, Attached | 15 (55.6%) | 12 (44.4%) |
| 2 Unit Apartments | 1 (7.7%) | 12 (92.3%) |
| 3 or 4 Unit Apartments | 5 (6.3%) | 74 (93.7%) |
| 5 to 9 Unit Apartments | 67 (68.4%) | 31 (31.6%) |
| 10 or more Apartments | 0 (0.0%) | 80 (100.0%) |
| Mobile Home / Other | 151 (75.9%) | 48 (24.1%) |
| Total | 3,173 (76.0%) | 1,004 (24.0%) |
Housing Structures by Number of Rooms in Millard County
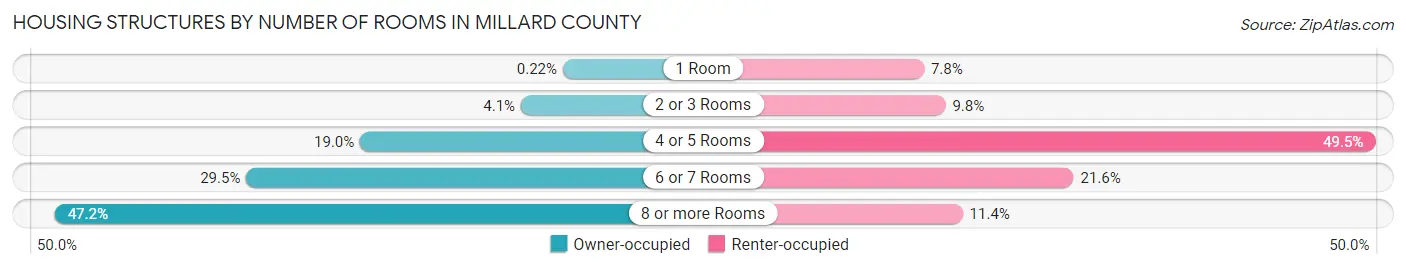
| Number of Rooms | Owner-occupied | Renter-occupied |
| 1 Room | 7 (0.2%) | 78 (7.8%) |
| 2 or 3 Rooms | 130 (4.1%) | 98 (9.8%) |
| 4 or 5 Rooms | 602 (19.0%) | 497 (49.5%) |
| 6 or 7 Rooms | 936 (29.5%) | 217 (21.6%) |
| 8 or more Rooms | 1,498 (47.2%) | 114 (11.4%) |
| Total | 3,173 (100.0%) | 1,004 (100.0%) |
Housing Structure by Heating Type in Millard County
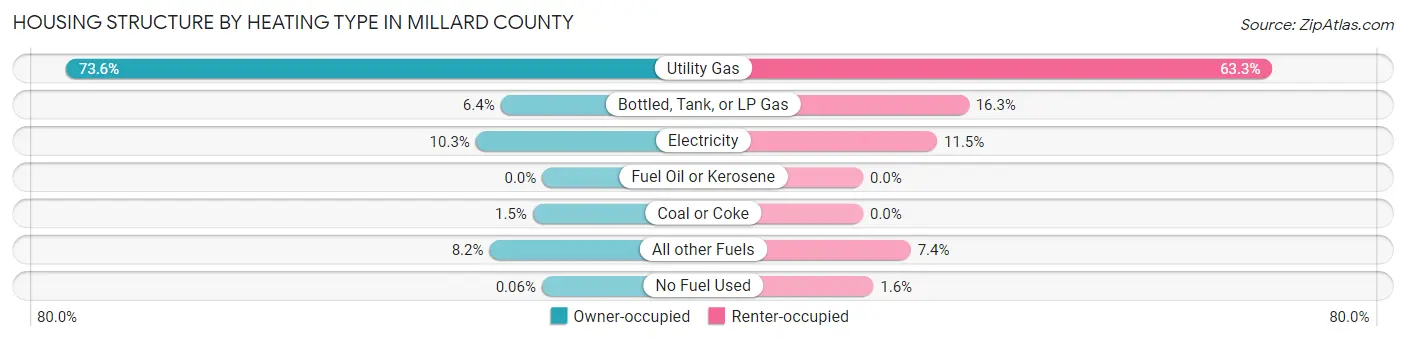
| Heating Type | Owner-occupied | Renter-occupied |
| Utility Gas | 2,336 (73.6%) | 635 (63.2%) |
| Bottled, Tank, or LP Gas | 204 (6.4%) | 164 (16.3%) |
| Electricity | 326 (10.3%) | 115 (11.5%) |
| Fuel Oil or Kerosene | 0 (0.0%) | 0 (0.0%) |
| Coal or Coke | 46 (1.5%) | 0 (0.0%) |
| All other Fuels | 259 (8.2%) | 74 (7.4%) |
| No Fuel Used | 2 (0.1%) | 16 (1.6%) |
| Total | 3,173 (100.0%) | 1,004 (100.0%) |
Household Vehicle Usage in Millard County
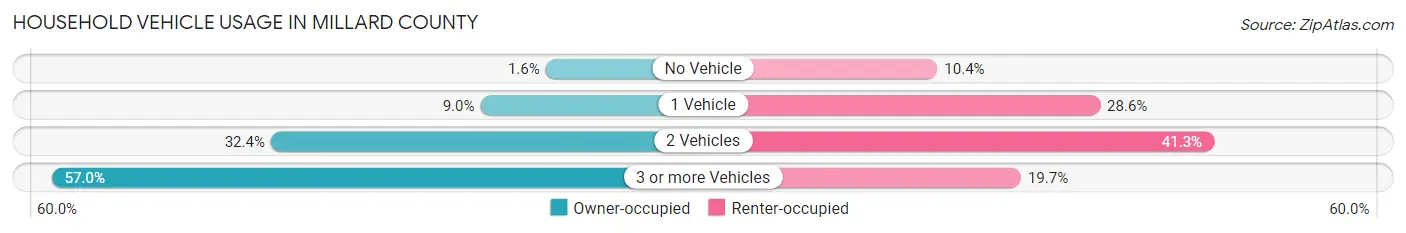
| Vehicles per Household | Owner-occupied | Renter-occupied |
| No Vehicle | 52 (1.6%) | 104 (10.4%) |
| 1 Vehicle | 284 (8.9%) | 287 (28.6%) |
| 2 Vehicles | 1,029 (32.4%) | 415 (41.3%) |
| 3 or more Vehicles | 1,808 (57.0%) | 198 (19.7%) |
| Total | 3,173 (100.0%) | 1,004 (100.0%) |
Real Estate & Mortgages in Millard County
Real Estate and Mortgage Overview in Millard County
| Characteristic | Without Mortgage | With Mortgage |
| Housing Units | 1,404 | 1,769 |
| Median Property Value | $215,000 | $234,500 |
| Median Household Income | $69,637 | $350 |
| Monthly Housing Costs | $362 | $81 |
| Real Estate Taxes | $1,054 | $58 |
Property Value by Mortgage Status in Millard County
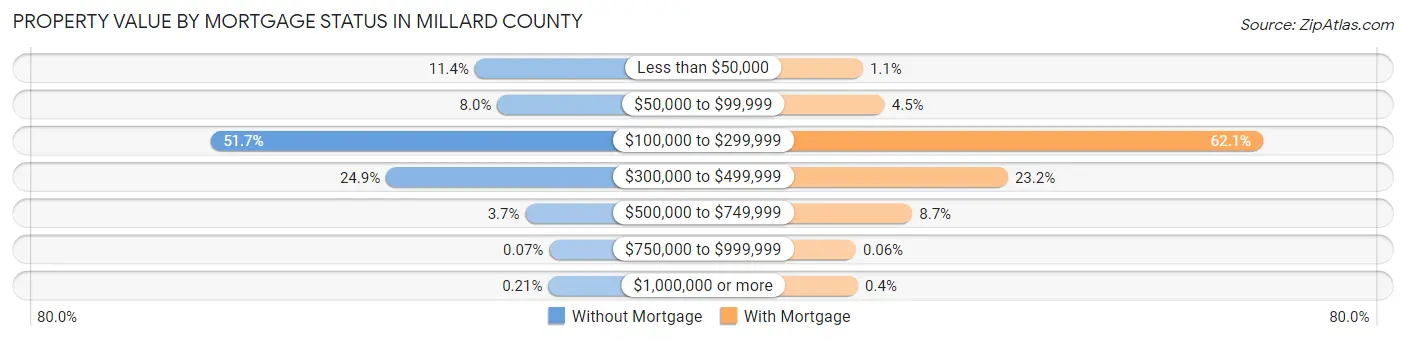
| Property Value | Without Mortgage | With Mortgage |
| Less than $50,000 | 160 (11.4%) | 20 (1.1%) |
| $50,000 to $99,999 | 112 (8.0%) | 79 (4.5%) |
| $100,000 to $299,999 | 726 (51.7%) | 1,098 (62.1%) |
| $300,000 to $499,999 | 350 (24.9%) | 411 (23.2%) |
| $500,000 to $749,999 | 52 (3.7%) | 153 (8.6%) |
| $750,000 to $999,999 | 1 (0.1%) | 1 (0.1%) |
| $1,000,000 or more | 3 (0.2%) | 7 (0.4%) |
| Total | 1,404 (100.0%) | 1,769 (100.0%) |
Household Income by Mortgage Status in Millard County
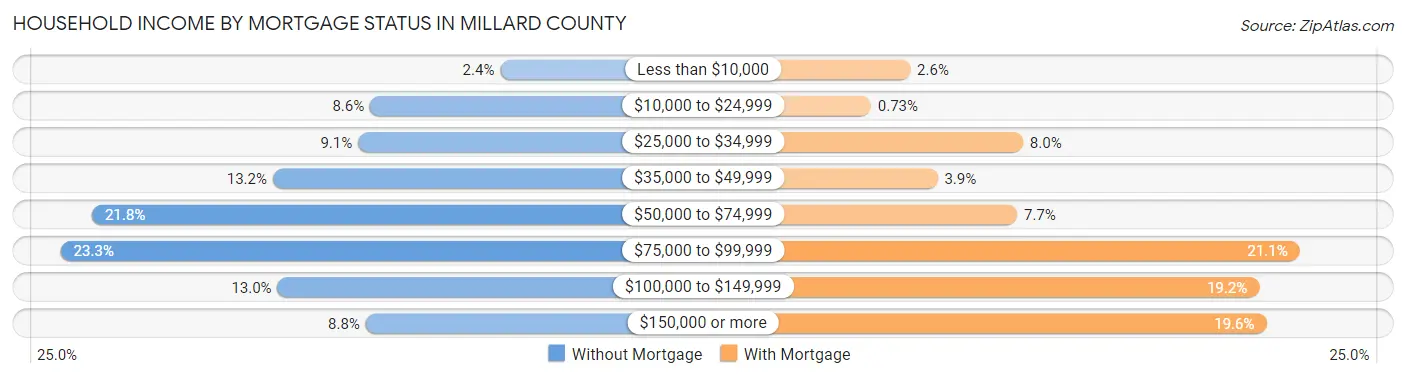
| Household Income | Without Mortgage | With Mortgage |
| Less than $10,000 | 33 (2.4%) | 46 (2.6%) |
| $10,000 to $24,999 | 120 (8.6%) | 13 (0.7%) |
| $25,000 to $34,999 | 128 (9.1%) | 141 (8.0%) |
| $35,000 to $49,999 | 185 (13.2%) | 69 (3.9%) |
| $50,000 to $74,999 | 306 (21.8%) | 136 (7.7%) |
| $75,000 to $99,999 | 327 (23.3%) | 374 (21.1%) |
| $100,000 to $149,999 | 182 (13.0%) | 340 (19.2%) |
| $150,000 or more | 123 (8.8%) | 346 (19.6%) |
| Total | 1,404 (100.0%) | 1,769 (100.0%) |
Property Value to Household Income Ratio in Millard County
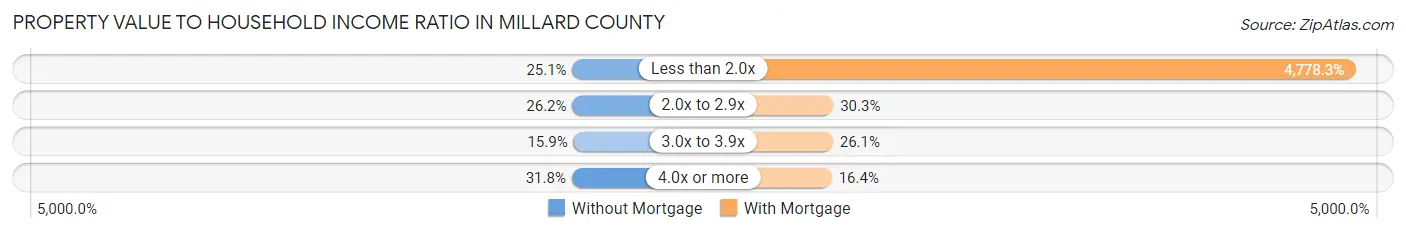
| Value-to-Income Ratio | Without Mortgage | With Mortgage |
| Less than 2.0x | 353 (25.1%) | 84,528 (4,778.3%) |
| 2.0x to 2.9x | 368 (26.2%) | 536 (30.3%) |
| 3.0x to 3.9x | 223 (15.9%) | 462 (26.1%) |
| 4.0x or more | 447 (31.8%) | 290 (16.4%) |
| Total | 1,404 (100.0%) | 1,769 (100.0%) |
Real Estate Taxes by Mortgage Status in Millard County
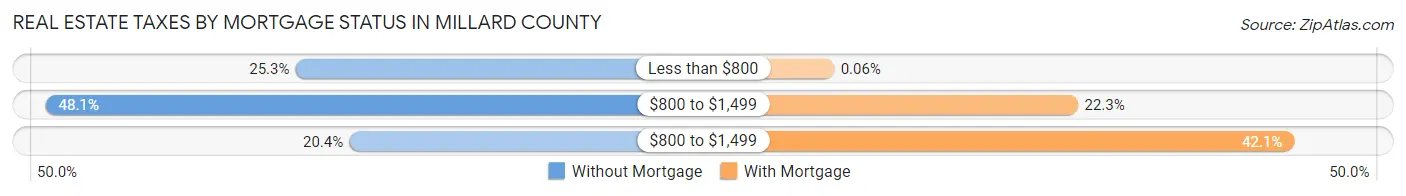
| Property Taxes | Without Mortgage | With Mortgage |
| Less than $800 | 355 (25.3%) | 1 (0.1%) |
| $800 to $1,499 | 675 (48.1%) | 395 (22.3%) |
| $800 to $1,499 | 286 (20.4%) | 745 (42.1%) |
| Total | 1,404 (100.0%) | 1,769 (100.0%) |
Health & Disability in Millard County
Health Insurance Coverage by Age in Millard County
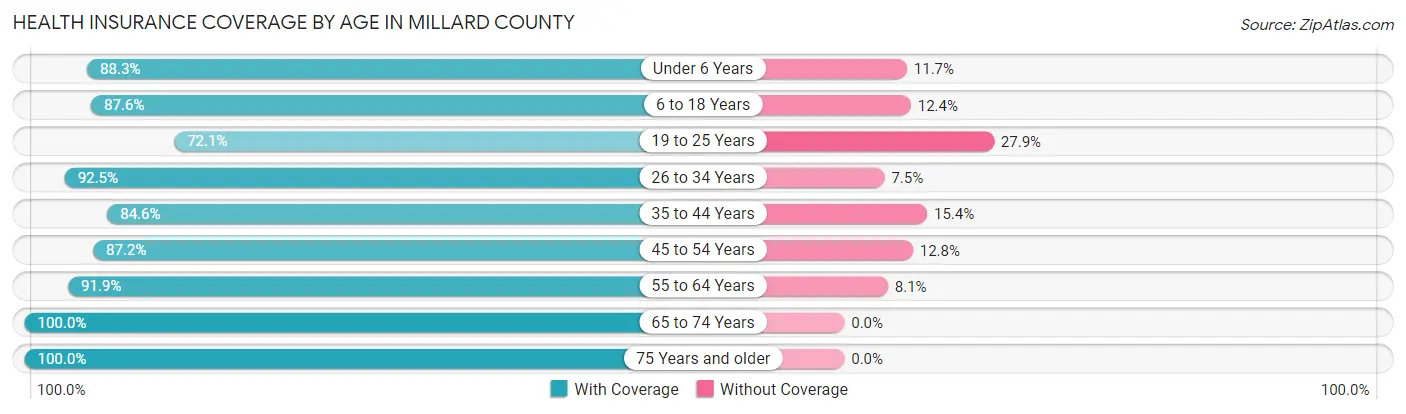
| Age Bracket | With Coverage | Without Coverage |
| Under 6 Years | 1,097 (88.3%) | 145 (11.7%) |
| 6 to 18 Years | 2,643 (87.6%) | 374 (12.4%) |
| 19 to 25 Years | 814 (72.1%) | 315 (27.9%) |
| 26 to 34 Years | 1,087 (92.5%) | 88 (7.5%) |
| 35 to 44 Years | 1,332 (84.6%) | 243 (15.4%) |
| 45 to 54 Years | 1,004 (87.2%) | 147 (12.8%) |
| 55 to 64 Years | 1,290 (91.9%) | 114 (8.1%) |
| 65 to 74 Years | 1,244 (100.0%) | 0 (0.0%) |
| 75 Years and older | 941 (100.0%) | 0 (0.0%) |
| Total | 11,452 (88.9%) | 1,426 (11.1%) |
Health Insurance Coverage by Citizenship Status in Millard County
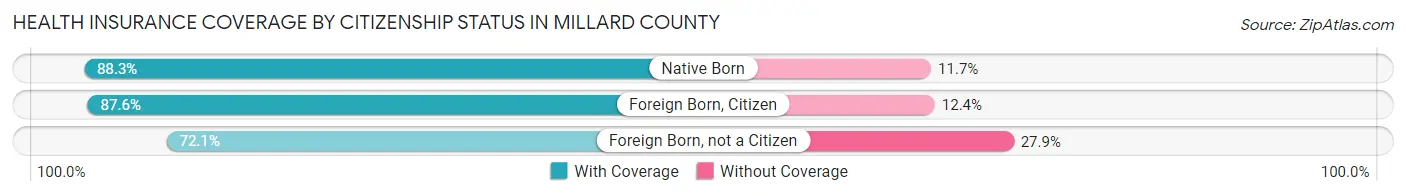
| Citizenship Status | With Coverage | Without Coverage |
| Native Born | 1,097 (88.3%) | 145 (11.7%) |
| Foreign Born, Citizen | 2,643 (87.6%) | 374 (12.4%) |
| Foreign Born, not a Citizen | 814 (72.1%) | 315 (27.9%) |
Health Insurance Coverage by Household Income in Millard County
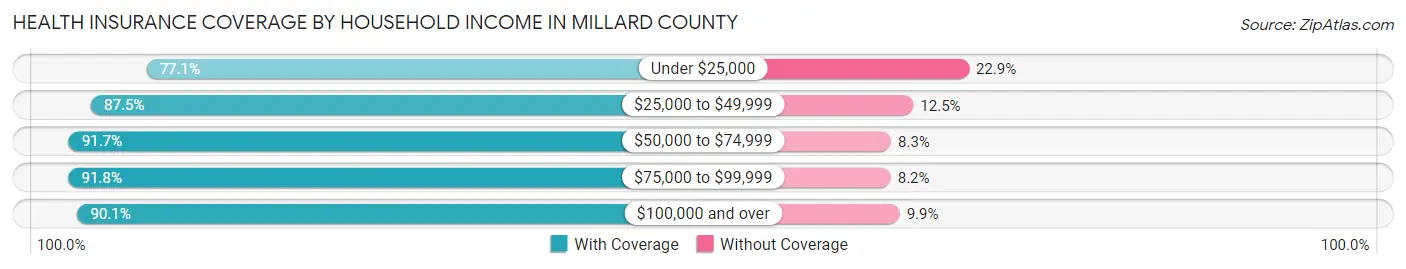
| Household Income | With Coverage | Without Coverage |
| Under $25,000 | 970 (77.1%) | 288 (22.9%) |
| $25,000 to $49,999 | 1,922 (87.5%) | 274 (12.5%) |
| $50,000 to $74,999 | 2,209 (91.7%) | 200 (8.3%) |
| $75,000 to $99,999 | 2,172 (91.8%) | 195 (8.2%) |
| $100,000 and over | 4,135 (90.1%) | 455 (9.9%) |
Public vs Private Health Insurance Coverage by Age in Millard County
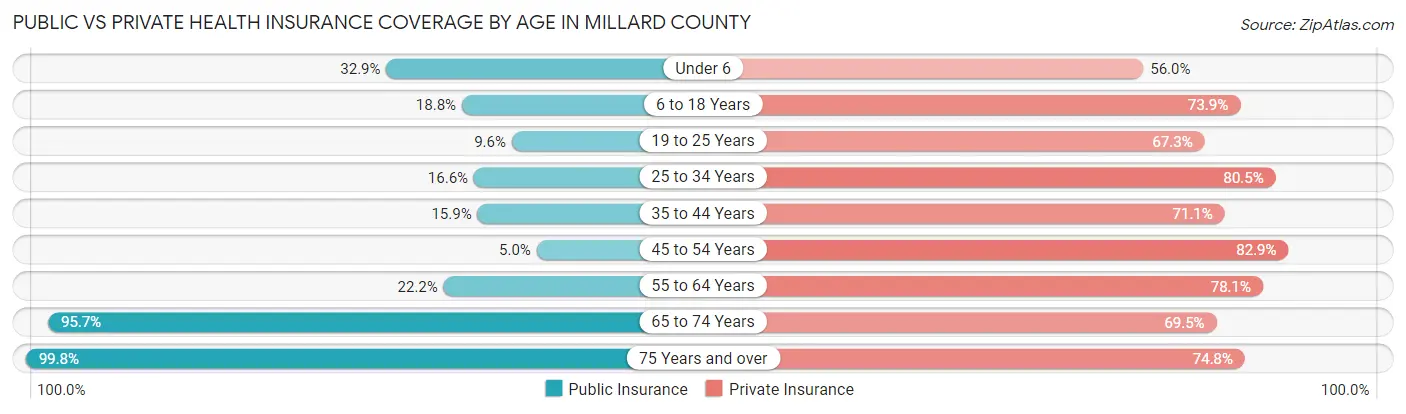
| Age Bracket | Public Insurance | Private Insurance |
| Under 6 | 408 (32.9%) | 695 (56.0%) |
| 6 to 18 Years | 568 (18.8%) | 2,230 (73.9%) |
| 19 to 25 Years | 108 (9.6%) | 760 (67.3%) |
| 25 to 34 Years | 195 (16.6%) | 946 (80.5%) |
| 35 to 44 Years | 251 (15.9%) | 1,119 (71.1%) |
| 45 to 54 Years | 57 (5.0%) | 954 (82.9%) |
| 55 to 64 Years | 312 (22.2%) | 1,097 (78.1%) |
| 65 to 74 Years | 1,190 (95.7%) | 865 (69.5%) |
| 75 Years and over | 939 (99.8%) | 704 (74.8%) |
| Total | 4,028 (31.3%) | 9,370 (72.8%) |
Disability Status by Sex by Age in Millard County
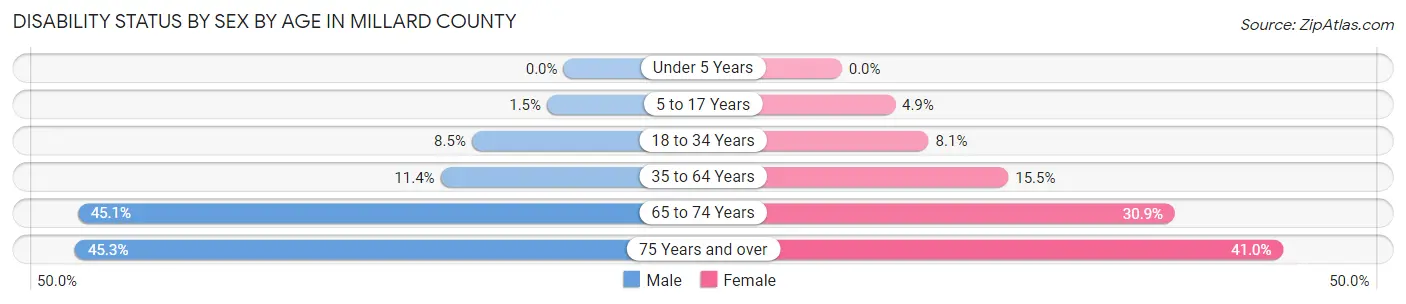
| Age Bracket | Male | Female |
| Under 5 Years | 0 (0.0%) | 0 (0.0%) |
| 5 to 17 Years | 24 (1.5%) | 75 (4.9%) |
| 18 to 34 Years | 109 (8.5%) | 100 (8.1%) |
| 35 to 64 Years | 237 (11.4%) | 317 (15.4%) |
| 65 to 74 Years | 288 (45.1%) | 187 (30.9%) |
| 75 Years and over | 213 (45.3%) | 193 (41.0%) |
Disability Class by Sex by Age in Millard County
Disability Class: Hearing Difficulty
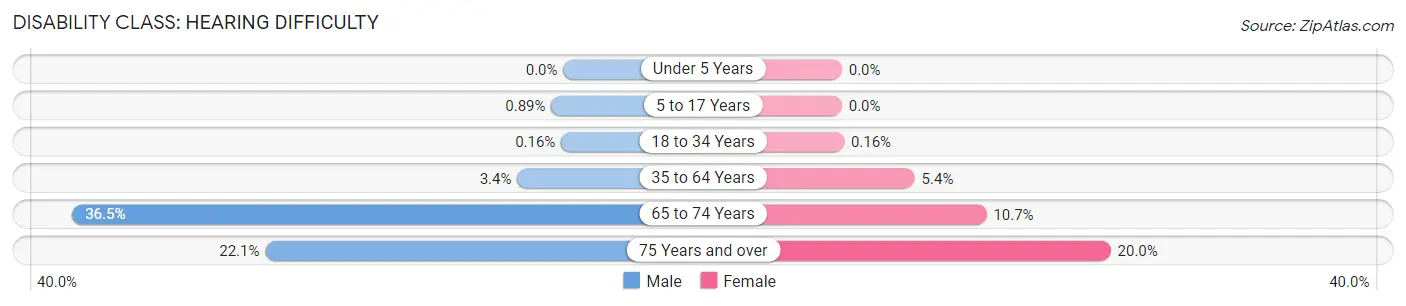
| Age Bracket | Male | Female |
| Under 5 Years | 0 (0.0%) | 0 (0.0%) |
| 5 to 17 Years | 14 (0.9%) | 0 (0.0%) |
| 18 to 34 Years | 2 (0.2%) | 2 (0.2%) |
| 35 to 64 Years | 71 (3.4%) | 111 (5.4%) |
| 65 to 74 Years | 233 (36.5%) | 65 (10.7%) |
| 75 Years and over | 104 (22.1%) | 94 (20.0%) |
Disability Class: Vision Difficulty
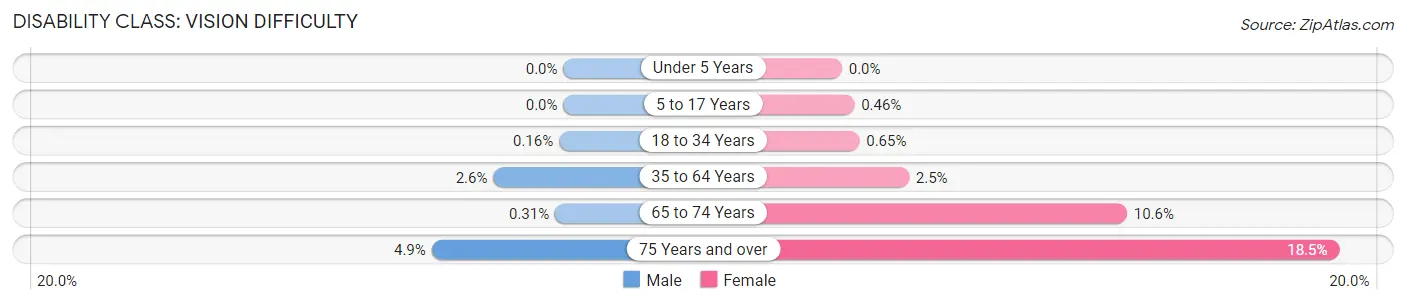
| Age Bracket | Male | Female |
| Under 5 Years | 0 (0.0%) | 0 (0.0%) |
| 5 to 17 Years | 0 (0.0%) | 7 (0.5%) |
| 18 to 34 Years | 2 (0.2%) | 8 (0.6%) |
| 35 to 64 Years | 54 (2.6%) | 51 (2.5%) |
| 65 to 74 Years | 2 (0.3%) | 64 (10.6%) |
| 75 Years and over | 23 (4.9%) | 87 (18.5%) |
Disability Class: Cognitive Difficulty
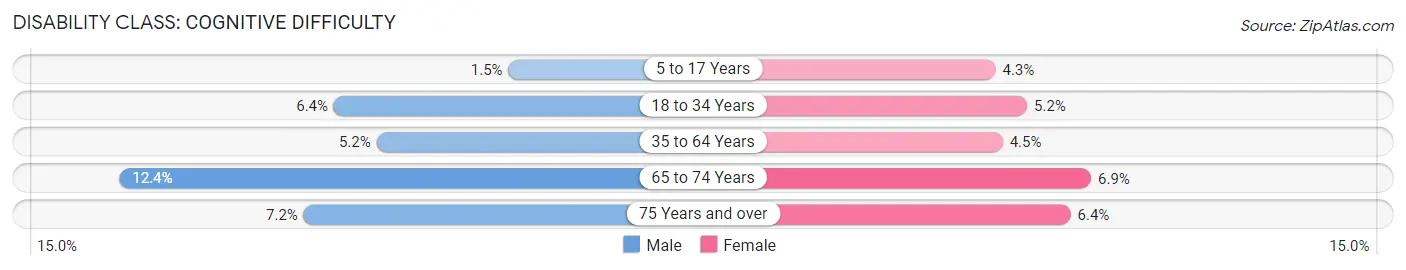
| Age Bracket | Male | Female |
| 5 to 17 Years | 24 (1.5%) | 65 (4.3%) |
| 18 to 34 Years | 82 (6.4%) | 64 (5.2%) |
| 35 to 64 Years | 108 (5.2%) | 92 (4.5%) |
| 65 to 74 Years | 79 (12.4%) | 42 (6.9%) |
| 75 Years and over | 34 (7.2%) | 30 (6.4%) |
Disability Class: Ambulatory Difficulty
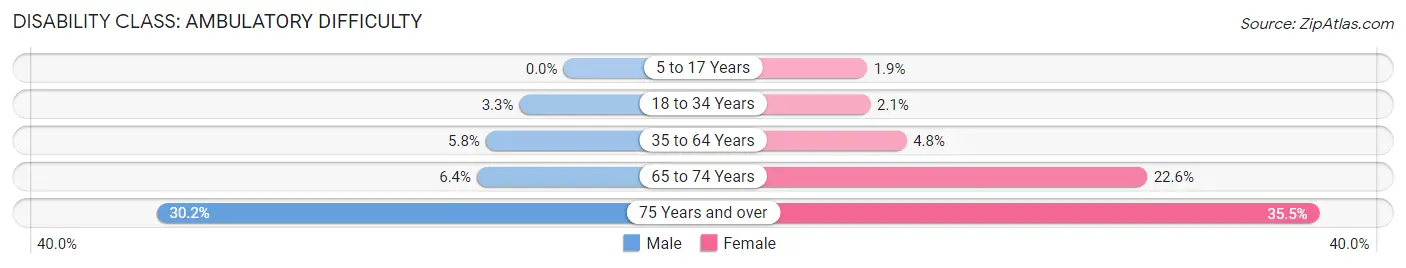
| Age Bracket | Male | Female |
| 5 to 17 Years | 0 (0.0%) | 28 (1.8%) |
| 18 to 34 Years | 42 (3.3%) | 26 (2.1%) |
| 35 to 64 Years | 120 (5.8%) | 98 (4.8%) |
| 65 to 74 Years | 41 (6.4%) | 137 (22.6%) |
| 75 Years and over | 142 (30.2%) | 167 (35.5%) |
Disability Class: Self-Care Difficulty
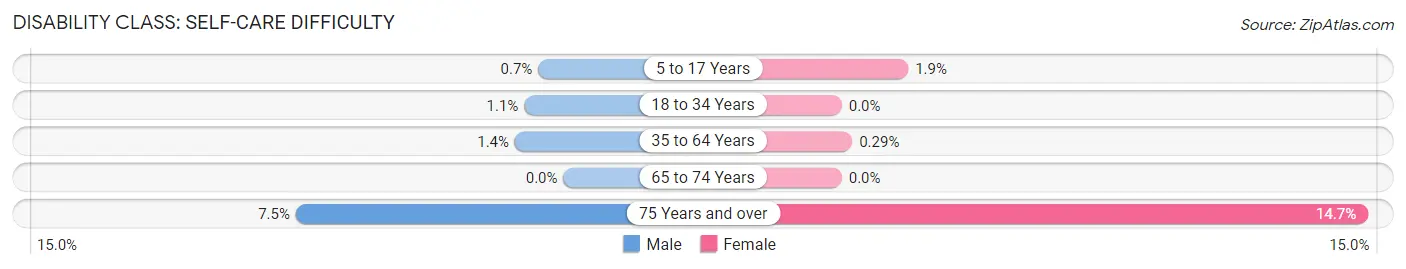
| Age Bracket | Male | Female |
| 5 to 17 Years | 11 (0.7%) | 28 (1.8%) |
| 18 to 34 Years | 14 (1.1%) | 0 (0.0%) |
| 35 to 64 Years | 28 (1.3%) | 6 (0.3%) |
| 65 to 74 Years | 0 (0.0%) | 0 (0.0%) |
| 75 Years and over | 35 (7.4%) | 69 (14.6%) |
Technology Access in Millard County
Computing Device Access in Millard County
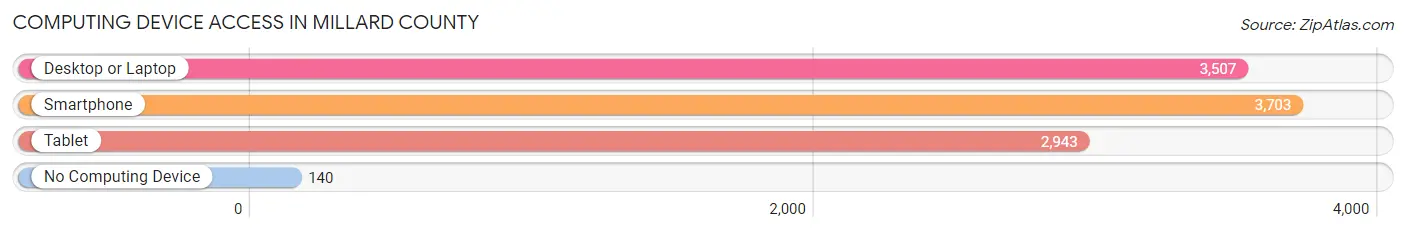
| Device Type | # Households | % Households |
| Desktop or Laptop | 3,507 | 84.0% |
| Smartphone | 3,703 | 88.6% |
| Tablet | 2,943 | 70.5% |
| No Computing Device | 140 | 3.4% |
| Total | 4,177 | 100.0% |
Internet Access in Millard County
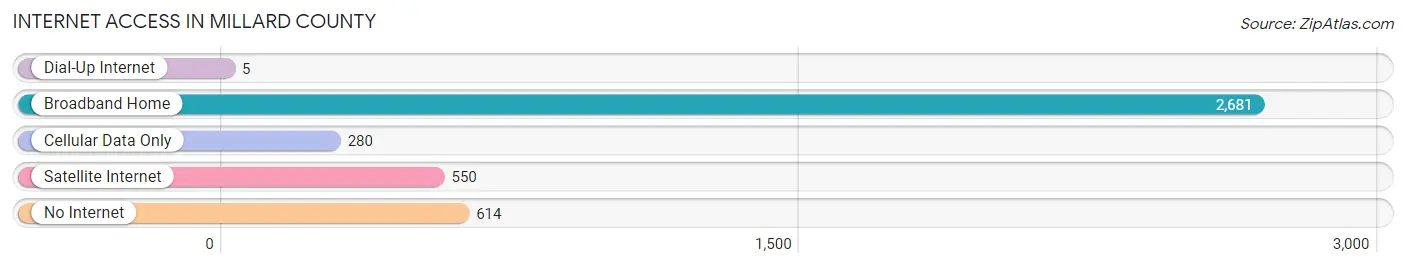
| Internet Type | # Households | % Households |
| Dial-Up Internet | 5 | 0.1% |
| Broadband Home | 2,681 | 64.2% |
| Cellular Data Only | 280 | 6.7% |
| Satellite Internet | 550 | 13.2% |
| No Internet | 614 | 14.7% |
| Total | 4,177 | 100.0% |
Millard County Summary
Millard County is located in the south-central region of Utah, and is bordered by Beaver County to the north, Sevier County to the east, Juab County to the south, and Iron County to the west. The county seat is Fillmore, and the largest city is Delta. The county was named after Millard Fillmore, the 13th President of the United States.
Geography
Millard County covers an area of 5,924 square miles, making it the fourth largest county in Utah. The county is located in the Great Basin region of the state, and is characterized by flat, arid terrain. The Sevier River runs through the county, and is the main source of water for the area. The county is also home to the Great Salt Lake Desert, which is the largest salt flat in the United States.
The highest point in the county is the summit of Notch Peak, which has an elevation of 9,658 feet. The lowest point is the Sevier River, which has an elevation of 4,000 feet.
Climate
Millard County has a semi-arid climate, with hot summers and cold winters. The average annual temperature is 54°F, and the average annual precipitation is 8.5 inches.
Demographics
As of the 2010 United States Census, there were 12,503 people, 4,072 households, and 3,072 families living in the county. The population density was 2.1 people per square mile. The racial makeup of the county was 91.2% White, 0.7% Black or African American, 0.7% Native American, 0.4% Asian, 0.1% Pacific Islander, 5.2% from other races, and 1.7% from two or more races. 11.3% of the population were Hispanic or Latino of any race.
The median income for a household in the county was $41,945, and the median income for a family was $48,945. The per capita income for the county was $17,845.
Economy
The economy of Millard County is largely based on agriculture and mining. The county is home to several large farms, which produce a variety of crops, including alfalfa, corn, wheat, and hay. The county is also home to several large mining operations, which produce copper, gold, silver, and other minerals.
The county is also home to several manufacturing companies, which produce a variety of products, including furniture, clothing, and electronics. The county is also home to several retail stores, which sell a variety of goods, including food, clothing, and electronics.
The county is also home to several tourist attractions, including the Great Salt Lake Desert, the Notch Peak National Wildlife Refuge, and the Millard County Historical Museum.
Conclusion
Millard County is a large, rural county located in the south-central region of Utah. The county is characterized by flat, arid terrain, and is home to several large farms, mining operations, and manufacturing companies. The county is also home to several tourist attractions, and is a popular destination for outdoor recreation. The county has a semi-arid climate, and the population is largely white and Hispanic. The economy of the county is largely based on agriculture and mining, and the median income for a household is $41,945.
Common Questions
What is the Total Population of Millard County?
Total Population of Millard County is 13,027.
What is the Total Male Population of Millard County?
Total Male Population of Millard County is 6,703.
What is the Total Female Population of Millard County?
Total Female Population of Millard County is 6,324.
What is the Ratio of Males per 100 Females in Millard County?
There are 105.99 Males per 100 Females in Millard County.
What is the Ratio of Females per 100 Males in Millard County?
There are 94.35 Females per 100 Males in Millard County.
What is the Median Population Age in Millard County?
Median Population Age in Millard County is 34.4 Years.
What is the Average Family Size in Millard County
Average Family Size in Millard County is 3.6 People.
What is the Average Household Size in Millard County
Average Household Size in Millard County is 3.1 People.
What is Per Capita Income in Millard County?
Per Capita income in Millard County is $27,757.
What is the Median Family Income in Millard County?
Median Family Income in Millard County is $76,734.
What is the Median Household income in Millard County?
Median Household Income in Millard County is $69,403.
What is Income or Wage Gap in Millard County?
Income or Wage Gap in Millard County is 56.5%.
Women in Millard County earn 43.5 cents for every dollar earned by a man.
What is Family Income Deficit in Millard County?
Family Income Deficit in Millard County is $7,242.
Families that are below poverty line in Millard County earn $7,242 less on average than the poverty threshold level.
What is Inequality or Gini Index in Millard County?
Inequality or Gini Index in Millard County is 0.39.
How Large is the Labor Force in Millard County?
There are 5,642 People in the Labor Forcein in Millard County.
What is the Percentage of People in the Labor Force in Millard County?
60.1% of People are in the Labor Force in Millard County.
What is the Unemployment Rate in Millard County?
Unemployment Rate in Millard County is 4.4%.