Kane County, UT
Kane County Map
Kane County Overview
7,814
TOTAL POPULATION
3,897
MALE POPULATION
3,917
FEMALE POPULATION
99.49
MALES / 100 FEMALES
100.51
FEMALES / 100 MALES
42.9
MEDIAN AGE
3.0
AVG FAMILY SIZE
2.3
AVG HOUSEHOLD SIZE
$36,941
PER CAPITA INCOME
$97,132
AVG FAMILY INCOME
$70,327
AVG HOUSEHOLD INCOME
11.3%
WAGE / INCOME GAP [ % ]
88.7¢/ $1
WAGE / INCOME GAP [ $ ]
$8,819
FAMILY INCOME DEFICIT
0.46
INEQUALITY / GINI INDEX
3,618
LABOR FORCE [ PEOPLE ]
58.1%
PERCENT IN LABOR FORCE
3.5%
UNEMPLOYMENT RATE
Kane County Area Codes
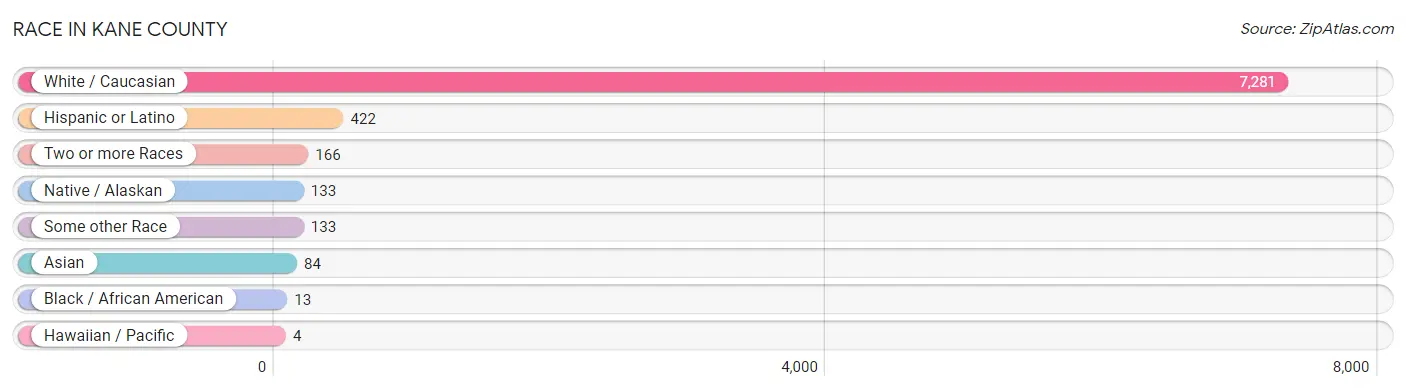
Race in Kane County
The most populous races in Kane County are White / Caucasian (7,281 | 93.2%), Hispanic or Latino (422 | 5.4%), and Two or more Races (166 | 2.1%).
| Race | # Population | % Population |
| Asian | 84 | 1.1% |
| Black / African American | 13 | 0.2% |
| Hawaiian / Pacific | 4 | 0.1% |
| Hispanic or Latino | 422 | 5.4% |
| Native / Alaskan | 133 | 1.7% |
| White / Caucasian | 7,281 | 93.2% |
| Two or more Races | 166 | 2.1% |
| Some other Race | 133 | 1.7% |
| Total | 7,814 | 100.0% |
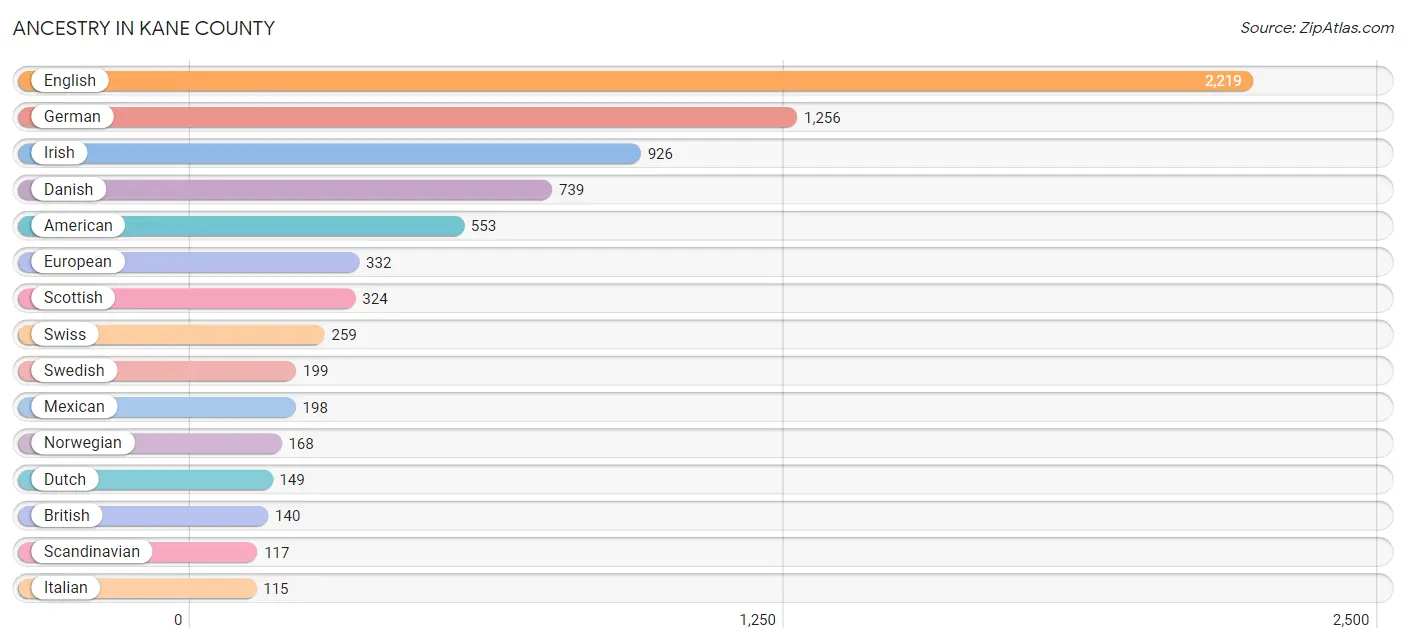
Ancestry in Kane County
The most populous ancestries reported in Kane County are English (2,219 | 28.4%), German (1,256 | 16.1%), Irish (926 | 11.8%), Danish (739 | 9.5%), and American (553 | 7.1%), together accounting for 72.9% of all Kane County residents.
| Ancestry | # Population | % Population |
| American | 553 | 7.1% |
| Arab | 89 | 1.1% |
| Armenian | 22 | 0.3% |
| Bhutanese | 13 | 0.2% |
| Brazilian | 39 | 0.5% |
| British | 140 | 1.8% |
| Cambodian | 5 | 0.1% |
| Canadian | 31 | 0.4% |
| Central American | 18 | 0.2% |
| Cuban | 74 | 0.9% |
| Czechoslovakian | 13 | 0.2% |
| Danish | 739 | 9.5% |
| Dutch | 149 | 1.9% |
| English | 2,219 | 28.4% |
| European | 332 | 4.3% |
| Finnish | 9 | 0.1% |
| French | 109 | 1.4% |
| French Canadian | 25 | 0.3% |
| German | 1,256 | 16.1% |
| Greek | 45 | 0.6% |
| Guatemalan | 6 | 0.1% |
| Indian (Asian) | 5 | 0.1% |
| Irish | 926 | 11.8% |
| Italian | 115 | 1.5% |
| Jordanian | 1 | 0.0% |
| Lebanese | 74 | 0.9% |
| Lithuanian | 14 | 0.2% |
| Luxembourger | 12 | 0.2% |
| Mexican | 198 | 2.5% |
| Navajo | 19 | 0.2% |
| Norwegian | 168 | 2.1% |
| Paiute | 5 | 0.1% |
| Peruvian | 31 | 0.4% |
| Polish | 76 | 1.0% |
| Portuguese | 19 | 0.2% |
| Puerto Rican | 9 | 0.1% |
| Romanian | 5 | 0.1% |
| Russian | 17 | 0.2% |
| Salvadoran | 12 | 0.2% |
| Samoan | 4 | 0.1% |
| Scandinavian | 117 | 1.5% |
| Scotch-Irish | 68 | 0.9% |
| Scottish | 324 | 4.2% |
| Slovak | 23 | 0.3% |
| South American | 31 | 0.4% |
| Spaniard | 7 | 0.1% |
| Spanish | 85 | 1.1% |
| Sri Lankan | 74 | 0.9% |
| Swedish | 199 | 2.5% |
| Swiss | 259 | 3.3% |
| Syrian | 14 | 0.2% |
| Tongan | 4 | 0.1% |
| Ukrainian | 19 | 0.2% |
| Welsh | 111 | 1.4% | View All 54 Rows |
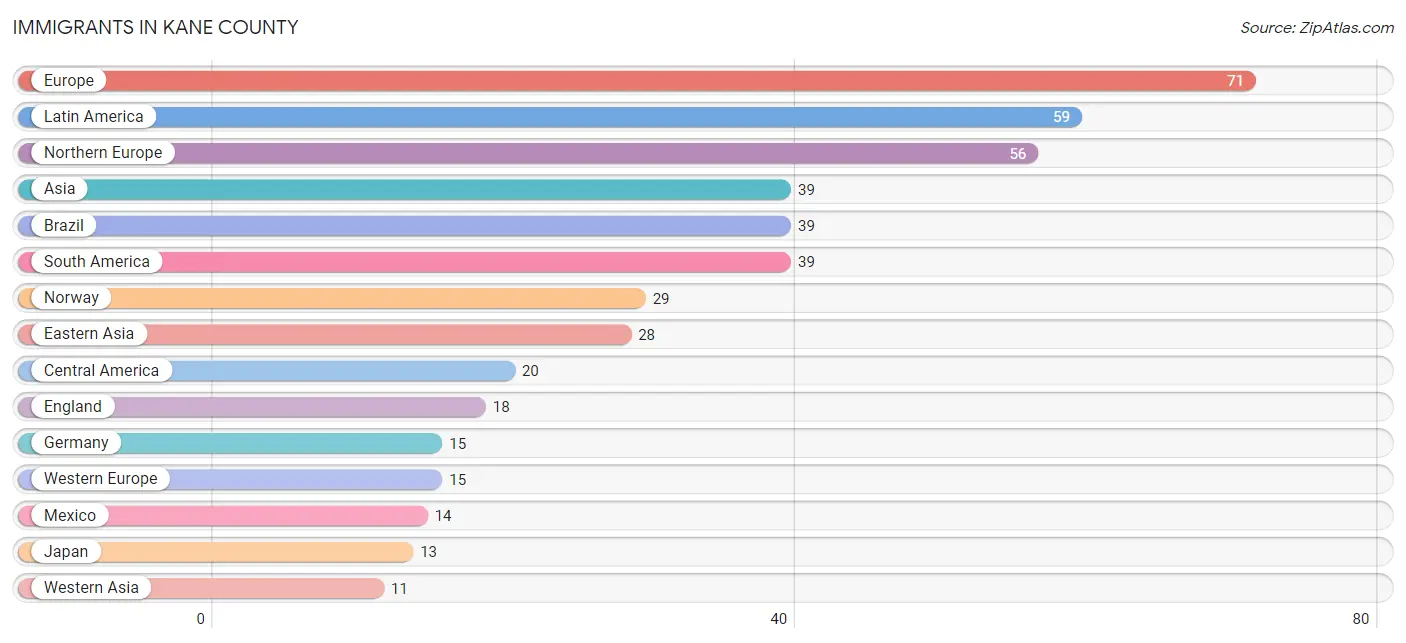
Immigrants in Kane County
The most numerous immigrant groups reported in Kane County came from Europe (71 | 0.9%), Latin America (59 | 0.8%), Northern Europe (56 | 0.7%), Asia (39 | 0.5%), and Brazil (39 | 0.5%), together accounting for 3.4% of all Kane County residents.
| Immigration Origin | # Population | % Population |
| Africa | 5 | 0.1% |
| Asia | 39 | 0.5% |
| Brazil | 39 | 0.5% |
| Central America | 20 | 0.3% |
| China | 5 | 0.1% |
| Eastern Asia | 28 | 0.4% |
| England | 18 | 0.2% |
| Europe | 71 | 0.9% |
| Germany | 15 | 0.2% |
| Guatemala | 6 | 0.1% |
| Japan | 13 | 0.2% |
| Jordan | 1 | 0.0% |
| Latin America | 59 | 0.8% |
| Mexico | 14 | 0.2% |
| Nigeria | 5 | 0.1% |
| Northern Europe | 56 | 0.7% |
| Norway | 29 | 0.4% |
| South America | 39 | 0.5% |
| Turkey | 10 | 0.1% |
| Western Africa | 5 | 0.1% |
| Western Asia | 11 | 0.1% |
| Western Europe | 15 | 0.2% | View All 22 Rows |
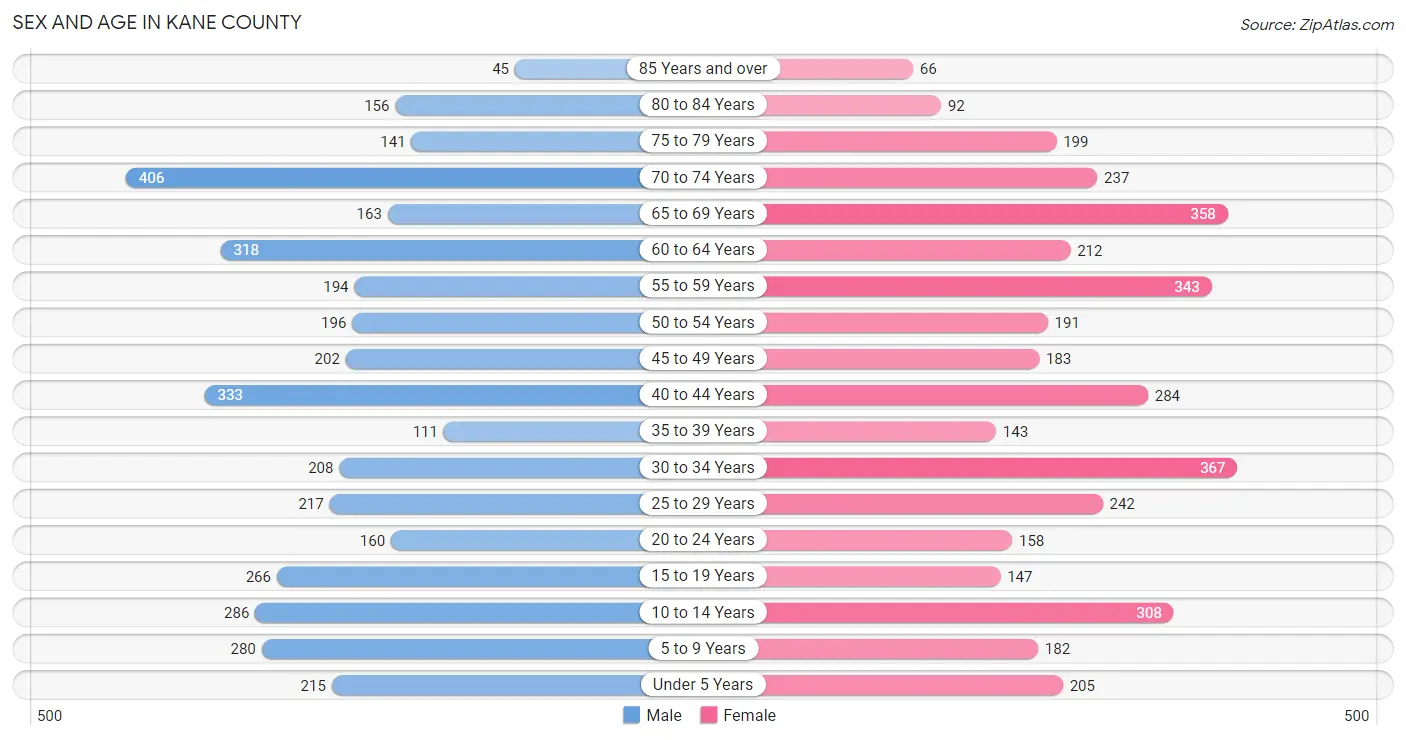
Sex and Age in Kane County
Sex and Age in Kane County
The most populous age groups in Kane County are 70 to 74 Years (406 | 10.4%) for men and 30 to 34 Years (367 | 9.4%) for women.
| Age Bracket | Male | Female |
| Under 5 Years | 215 (5.5%) | 205 (5.2%) |
| 5 to 9 Years | 280 (7.2%) | 182 (4.6%) |
| 10 to 14 Years | 286 (7.3%) | 308 (7.9%) |
| 15 to 19 Years | 266 (6.8%) | 147 (3.7%) |
| 20 to 24 Years | 160 (4.1%) | 158 (4.0%) |
| 25 to 29 Years | 217 (5.6%) | 242 (6.2%) |
| 30 to 34 Years | 208 (5.3%) | 367 (9.4%) |
| 35 to 39 Years | 111 (2.9%) | 143 (3.6%) |
| 40 to 44 Years | 333 (8.6%) | 284 (7.2%) |
| 45 to 49 Years | 202 (5.2%) | 183 (4.7%) |
| 50 to 54 Years | 196 (5.0%) | 191 (4.9%) |
| 55 to 59 Years | 194 (5.0%) | 343 (8.8%) |
| 60 to 64 Years | 318 (8.2%) | 212 (5.4%) |
| 65 to 69 Years | 163 (4.2%) | 358 (9.1%) |
| 70 to 74 Years | 406 (10.4%) | 237 (6.0%) |
| 75 to 79 Years | 141 (3.6%) | 199 (5.1%) |
| 80 to 84 Years | 156 (4.0%) | 92 (2.4%) |
| 85 Years and over | 45 (1.1%) | 66 (1.7%) |
| Total | 3,897 (100.0%) | 3,917 (100.0%) |
Families and Households in Kane County
Median Family Size in Kane County
The median family size in Kane County is 3.02 persons per family, with single female/mother families (202 | 10.5%) accounting for the largest median family size of 3.72 persons per family. On the other hand, single male/father families (43 | 2.2%) represent the smallest median family size with 2.02 persons per family.
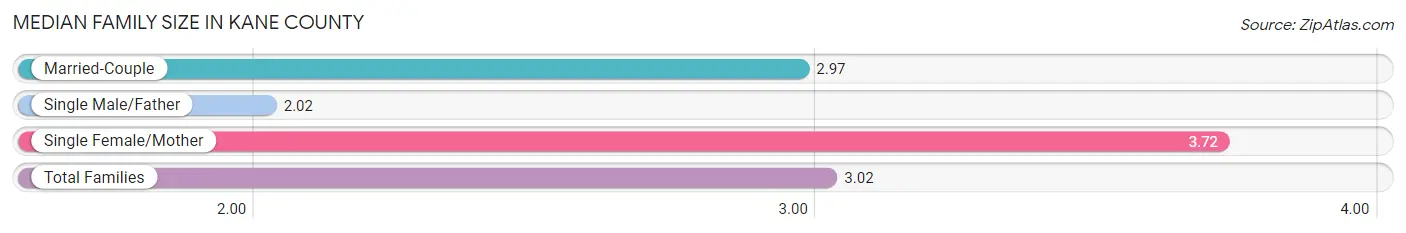
| Family Type | # Families | Family Size |
| Married-Couple | 1,672 (87.2%) | 2.97 |
| Single Male/Father | 43 (2.2%) | 2.02 |
| Single Female/Mother | 202 (10.5%) | 3.72 |
| Total Families | 1,917 (100.0%) | 3.02 |
Median Household Size in Kane County
The median household size in Kane County is 2.34 persons per household, with single female/mother households (202 | 6.3%) accounting for the largest median household size of 4.09 persons per household. non-family households (1,308 | 40.6%) represent the smallest median household size with 1.24 persons per household.
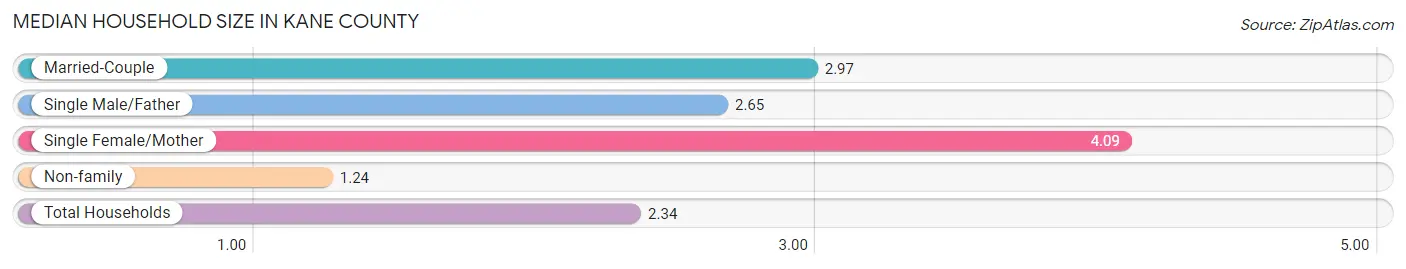
| Household Type | # Households | Household Size |
| Married-Couple | 1,672 (51.8%) | 2.97 |
| Single Male/Father | 43 (1.3%) | 2.65 |
| Single Female/Mother | 202 (6.3%) | 4.09 |
| Non-family | 1,308 (40.6%) | 1.24 |
| Total Households | 3,225 (100.0%) | 2.34 |
Household Size by Marriage Status in Kane County
Out of a total of 3,225 households in Kane County, 1,917 (59.4%) are family households, while 1,308 (40.6%) are nonfamily households. The most numerous type of family households are 2-person households, comprising 1,067, and the most common type of nonfamily households are 1-person households, comprising 1,115.
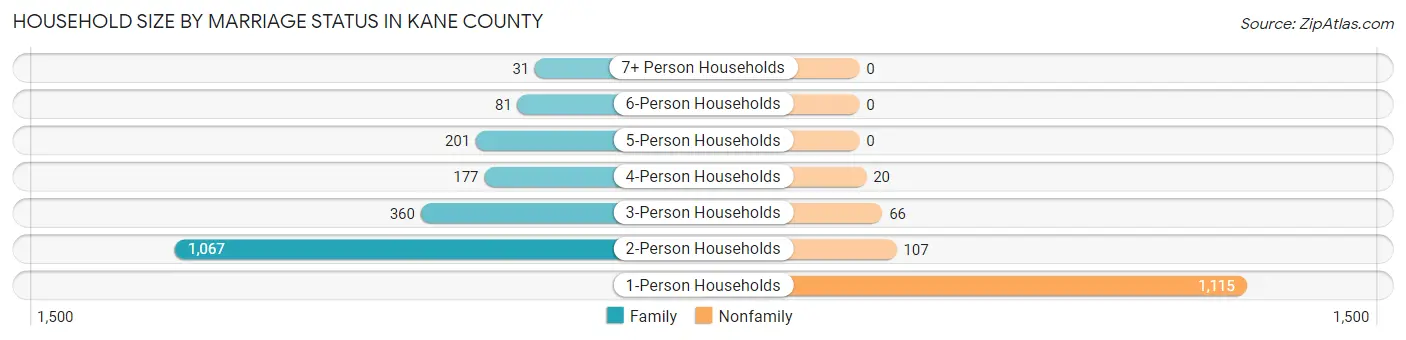
| Household Size | Family Households | Nonfamily Households |
| 1-Person Households | - | 1,115 (34.6%) |
| 2-Person Households | 1,067 (33.1%) | 107 (3.3%) |
| 3-Person Households | 360 (11.2%) | 66 (2.1%) |
| 4-Person Households | 177 (5.5%) | 20 (0.6%) |
| 5-Person Households | 201 (6.2%) | 0 (0.0%) |
| 6-Person Households | 81 (2.5%) | 0 (0.0%) |
| 7+ Person Households | 31 (1.0%) | 0 (0.0%) |
| Total | 1,917 (59.4%) | 1,308 (40.6%) |
Female Fertility in Kane County
Fertility by Age in Kane County
Average fertility rate in Kane County is 56.0 births per 1,000 women. Women in the age bracket of 20 to 34 years have the highest fertility rate with 111.0 births per 1,000 women. Women in the age bracket of 20 to 34 years acount for 97.7% of all women with births.
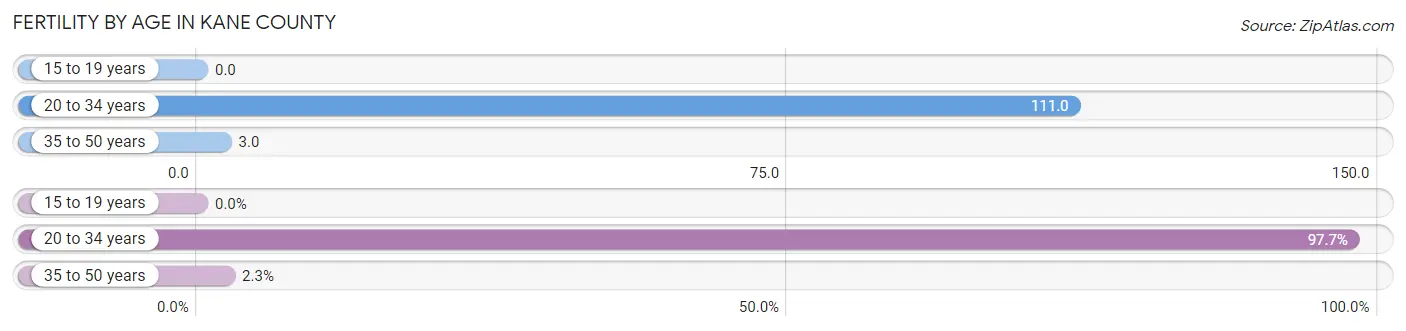
| Age Bracket | Women with Births | Births / 1,000 Women |
| 15 to 19 years | 0 (0.0%) | 0.0 |
| 20 to 34 years | 85 (97.7%) | 111.0 |
| 35 to 50 years | 2 (2.3%) | 3.0 |
| Total | 87 (100.0%) | 56.0 |
Fertility by Age by Marriage Status in Kane County
93.1% of women with births (87) in Kane County are married. The highest percentage of unmarried women with births falls into 20 to 34 years age bracket with 7.1% of them unmarried at the time of birth, while the lowest percentage of unmarried women with births belong to 35 to 50 years age bracket with 0.0% of them unmarried.
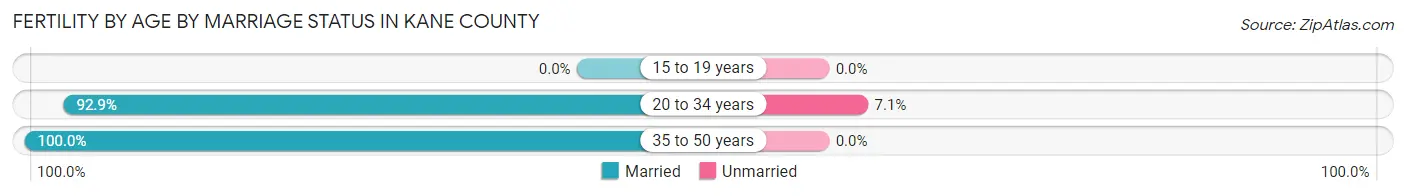
| Age Bracket | Married | Unmarried |
| 15 to 19 years | 0 (0.0%) | 0 (0.0%) |
| 20 to 34 years | 79 (92.9%) | 6 (7.1%) |
| 35 to 50 years | 2 (100.0%) | 0 (0.0%) |
| Total | 81 (93.1%) | 6 (6.9%) |
Fertility by Education in Kane County
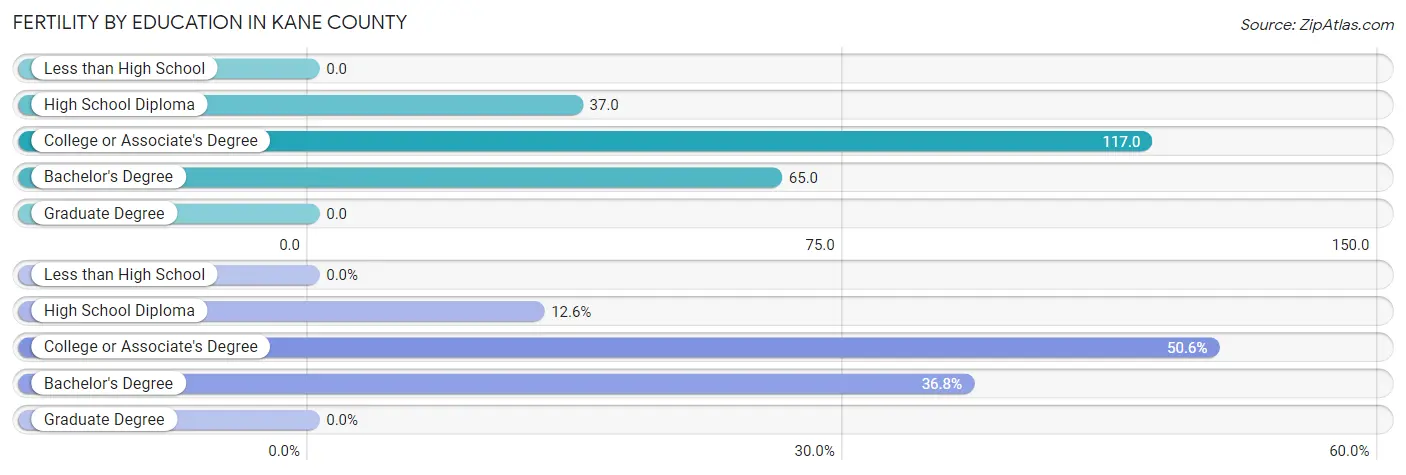
| Educational Attainment | Women with Births | Births / 1,000 Women |
| Less than High School | 0 (0.0%) | 0.0 |
| High School Diploma | 11 (12.6%) | 37.0 |
| College or Associate's Degree | 44 (50.6%) | 117.0 |
| Bachelor's Degree | 32 (36.8%) | 65.0 |
| Graduate Degree | 0 (0.0%) | 0.0 |
| Total | 87 (100.0%) | 56.0 |
Fertility by Education by Marriage Status in Kane County
6.9% of women with births in Kane County are unmarried. Women with the educational attainment of college or associate's degree are most likely to be married with 100.0% of them married at childbirth, while women with the educational attainment of high school diploma are least likely to be married with 54.5% of them unmarried at childbirth.
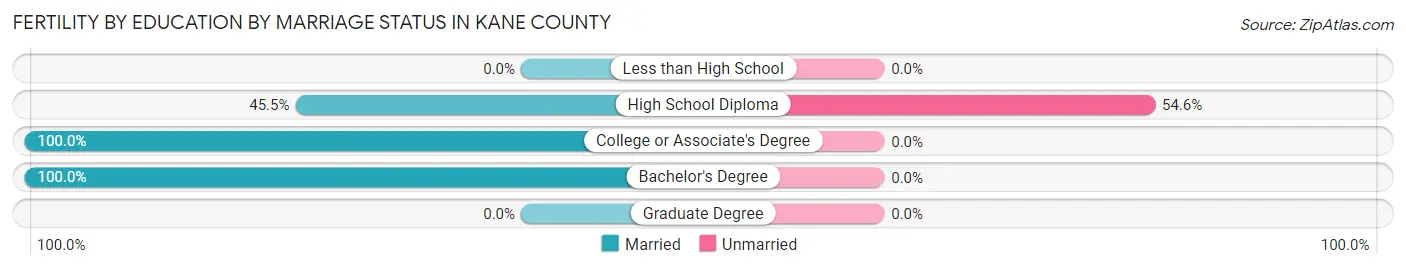
| Educational Attainment | Married | Unmarried |
| Less than High School | 0 (0.0%) | 0 (0.0%) |
| High School Diploma | 5 (45.5%) | 6 (54.5%) |
| College or Associate's Degree | 44 (100.0%) | 0 (0.0%) |
| Bachelor's Degree | 32 (100.0%) | 0 (0.0%) |
| Graduate Degree | 0 (0.0%) | 0 (0.0%) |
| Total | 81 (93.1%) | 6 (6.9%) |
Income in Kane County
Income Overview in Kane County
Per Capita Income in Kane County is $36,941, while median incomes of families and households are $97,132 and $70,327 respectively.
| Characteristic | Number | Measure |
| Per Capita Income | 7,814 | $36,941 |
| Median Family Income | 1,917 | $97,132 |
| Mean Family Income | 1,917 | $117,238 |
| Median Household Income | 3,225 | $70,327 |
| Mean Household Income | 3,225 | $89,463 |
| Income Deficit | 1,917 | $8,819 |
| Wage / Income Gap (%) | 7,814 | 11.25% |
| Wage / Income Gap ($) | 7,814 | 88.75¢ per $1 |
| Gini / Inequality Index | 7,814 | 0.46 |
Earnings by Sex in Kane County
Average Earnings in Kane County are $37,016, $40,327 for men and $35,789 for women, a difference of 11.3%.
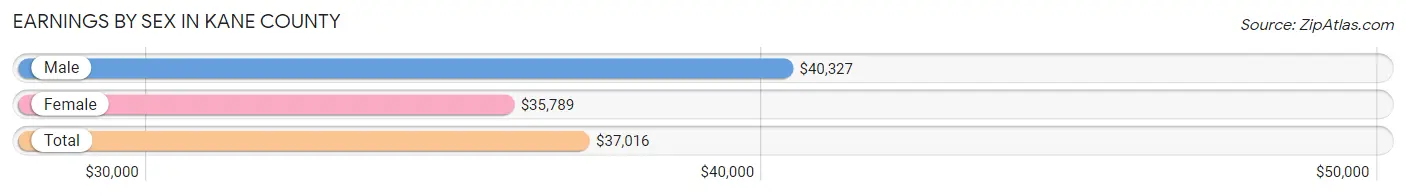
| Sex | Number | Average Earnings |
| Male | 1,979 (49.8%) | $40,327 |
| Female | 1,998 (50.2%) | $35,789 |
| Total | 3,977 (100.0%) | $37,016 |
Earnings by Sex by Income Bracket in Kane County
The most common earnings brackets in Kane County are $75,000 to $99,999 for men (322 | 16.3%) and $55,000 to $64,999 for women (191 | 9.6%).
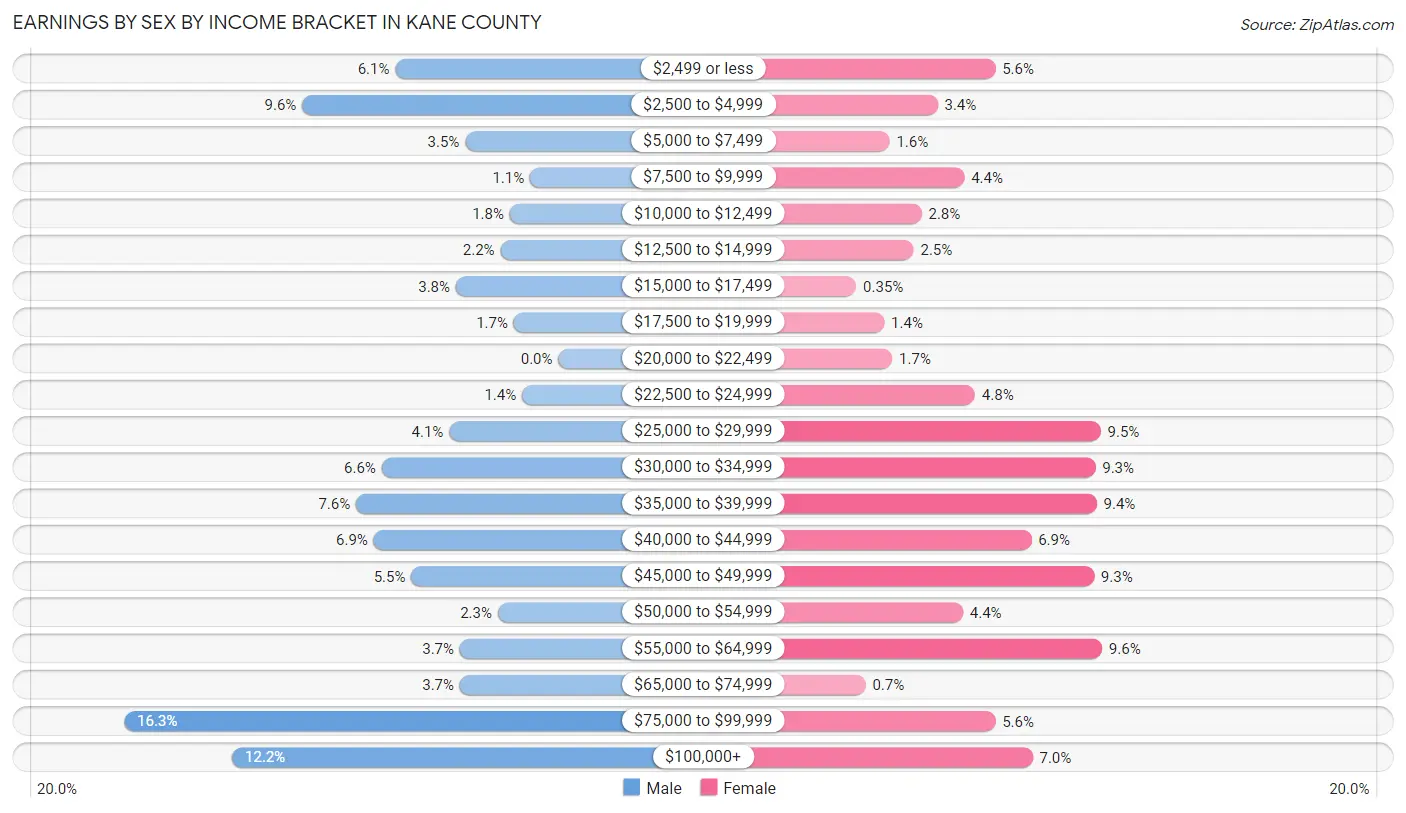
| Income | Male | Female |
| $2,499 or less | 121 (6.1%) | 111 (5.6%) |
| $2,500 to $4,999 | 190 (9.6%) | 68 (3.4%) |
| $5,000 to $7,499 | 69 (3.5%) | 32 (1.6%) |
| $7,500 to $9,999 | 21 (1.1%) | 88 (4.4%) |
| $10,000 to $12,499 | 36 (1.8%) | 56 (2.8%) |
| $12,500 to $14,999 | 43 (2.2%) | 50 (2.5%) |
| $15,000 to $17,499 | 76 (3.8%) | 7 (0.4%) |
| $17,500 to $19,999 | 33 (1.7%) | 28 (1.4%) |
| $20,000 to $22,499 | 0 (0.0%) | 34 (1.7%) |
| $22,500 to $24,999 | 27 (1.4%) | 96 (4.8%) |
| $25,000 to $29,999 | 81 (4.1%) | 190 (9.5%) |
| $30,000 to $34,999 | 131 (6.6%) | 186 (9.3%) |
| $35,000 to $39,999 | 150 (7.6%) | 187 (9.4%) |
| $40,000 to $44,999 | 137 (6.9%) | 138 (6.9%) |
| $45,000 to $49,999 | 109 (5.5%) | 185 (9.3%) |
| $50,000 to $54,999 | 45 (2.3%) | 87 (4.3%) |
| $55,000 to $64,999 | 73 (3.7%) | 191 (9.6%) |
| $65,000 to $74,999 | 73 (3.7%) | 14 (0.7%) |
| $75,000 to $99,999 | 322 (16.3%) | 111 (5.6%) |
| $100,000+ | 242 (12.2%) | 139 (7.0%) |
| Total | 1,979 (100.0%) | 1,998 (100.0%) |
Earnings by Sex by Educational Attainment in Kane County
Average earnings in Kane County are $45,000 for men and $36,695 for women, a difference of 18.5%. Men with an educational attainment of bachelor's degree enjoy the highest average annual earnings of $57,708, while those with college or associate's degree education earn the least with $38,906. Women with an educational attainment of graduate degree earn the most with the average annual earnings of $56,563, while those with high school diploma education have the smallest earnings of $34,447.
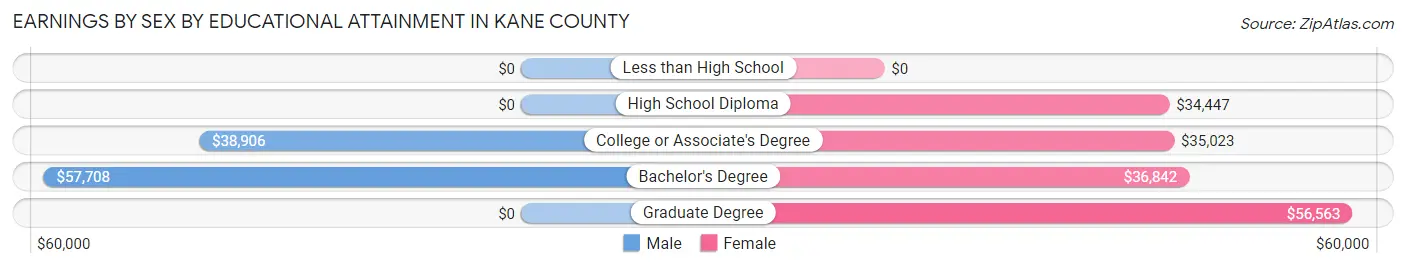
| Educational Attainment | Male Income | Female Income |
| Less than High School | - | - |
| High School Diploma | - | - |
| College or Associate's Degree | $38,906 | $35,023 |
| Bachelor's Degree | $57,708 | $36,842 |
| Graduate Degree | - | - |
| Total | $45,000 | $36,695 |
Family Income in Kane County
Family Income Brackets in Kane County
According to the Kane County family income data, there are 541 families falling into the $100,000 to $149,999 income range, which is the most common income bracket and makes up 28.2% of all families. Conversely, the less than $10,000 income bracket is the least frequent group with only 31 families (1.6%) belonging to this category.
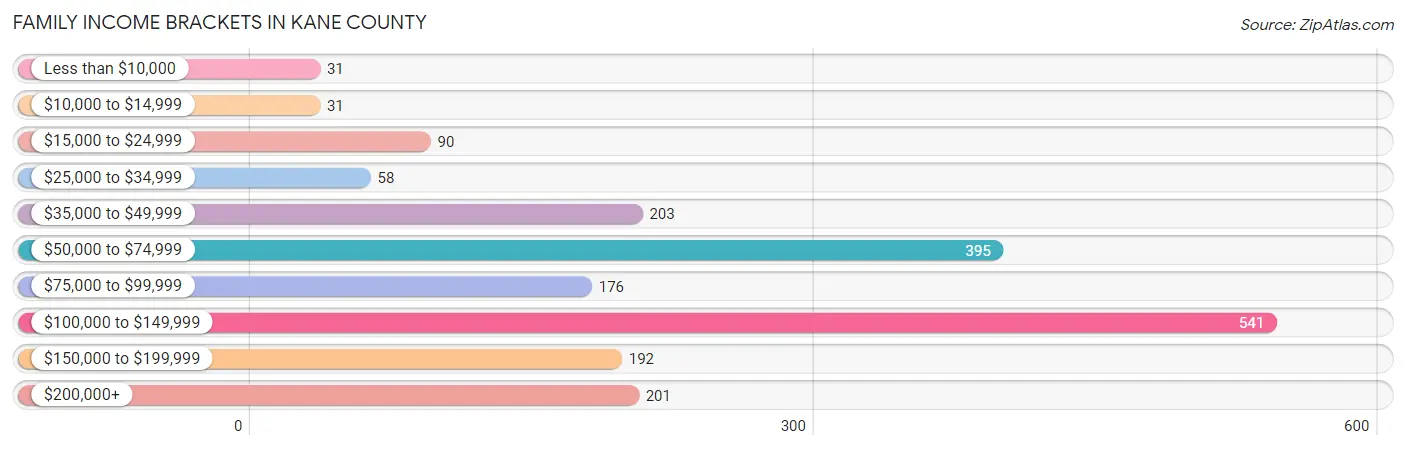
| Income Bracket | # Families | % Families |
| Less than $10,000 | 31 | 1.6% |
| $10,000 to $14,999 | 31 | 1.6% |
| $15,000 to $24,999 | 90 | 4.7% |
| $25,000 to $34,999 | 58 | 3.0% |
| $35,000 to $49,999 | 203 | 10.6% |
| $50,000 to $74,999 | 395 | 20.6% |
| $75,000 to $99,999 | 176 | 9.2% |
| $100,000 to $149,999 | 541 | 28.2% |
| $150,000 to $199,999 | 192 | 10.0% |
| $200,000+ | 201 | 10.5% |
Family Income by Famaliy Size in Kane County
5-person families (201 | 10.5%) account for the highest median family income in Kane County with $120,694 per family, while 3-person families (326 | 17.0%) have the highest median income of $37,756 per family member.
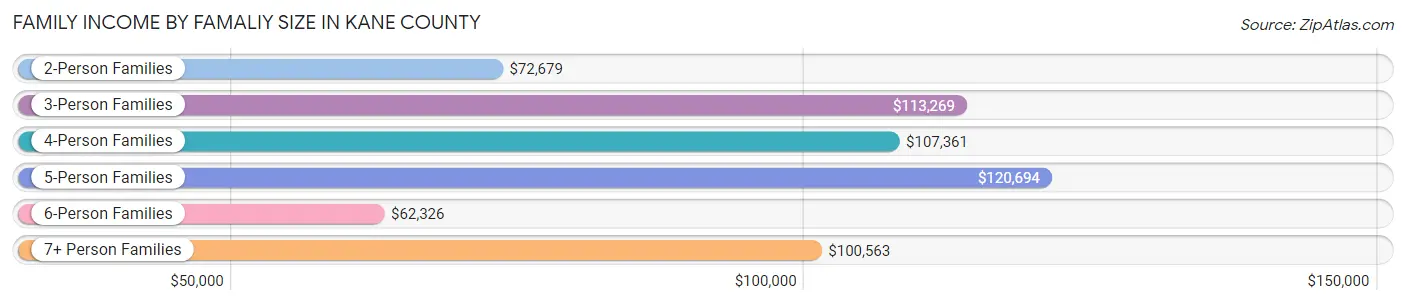
| Income Bracket | # Families | Median Income |
| 2-Person Families | 1,119 (58.4%) | $72,679 |
| 3-Person Families | 326 (17.0%) | $113,269 |
| 4-Person Families | 159 (8.3%) | $107,361 |
| 5-Person Families | 201 (10.5%) | $120,694 |
| 6-Person Families | 81 (4.2%) | $62,326 |
| 7+ Person Families | 31 (1.6%) | $100,563 |
| Total | 1,917 (100.0%) | $97,132 |
Family Income by Number of Earners in Kane County
The median family income in Kane County is $97,132, with families comprising 3+ earners (264) having the highest median family income of $133,617, while families with no earners (416) have the lowest median family income of $52,244, accounting for 13.8% and 21.7% of families, respectively.
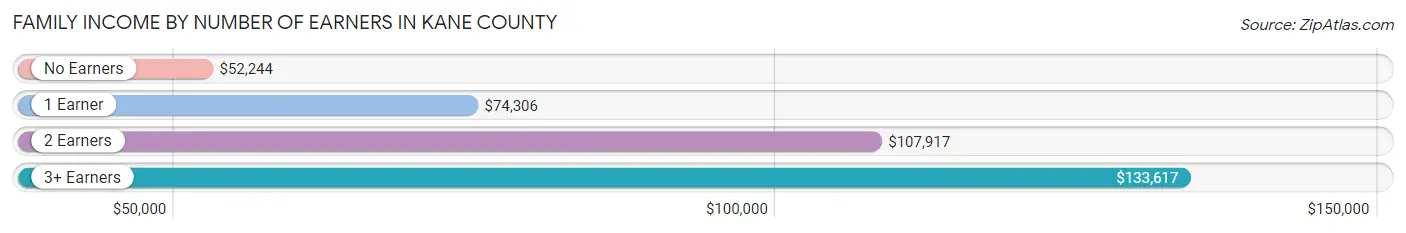
| Number of Earners | # Families | Median Income |
| No Earners | 416 (21.7%) | $52,244 |
| 1 Earner | 397 (20.7%) | $74,306 |
| 2 Earners | 840 (43.8%) | $107,917 |
| 3+ Earners | 264 (13.8%) | $133,617 |
| Total | 1,917 (100.0%) | $97,132 |
Household Income in Kane County
Household Income Brackets in Kane County
With 619 households falling in the category, the $100,000 to $149,999 income range is the most frequent in Kane County, accounting for 19.2% of all households. In contrast, only 152 households (4.7%) fall into the $15,000 to $24,999 income bracket, making it the least populous group.
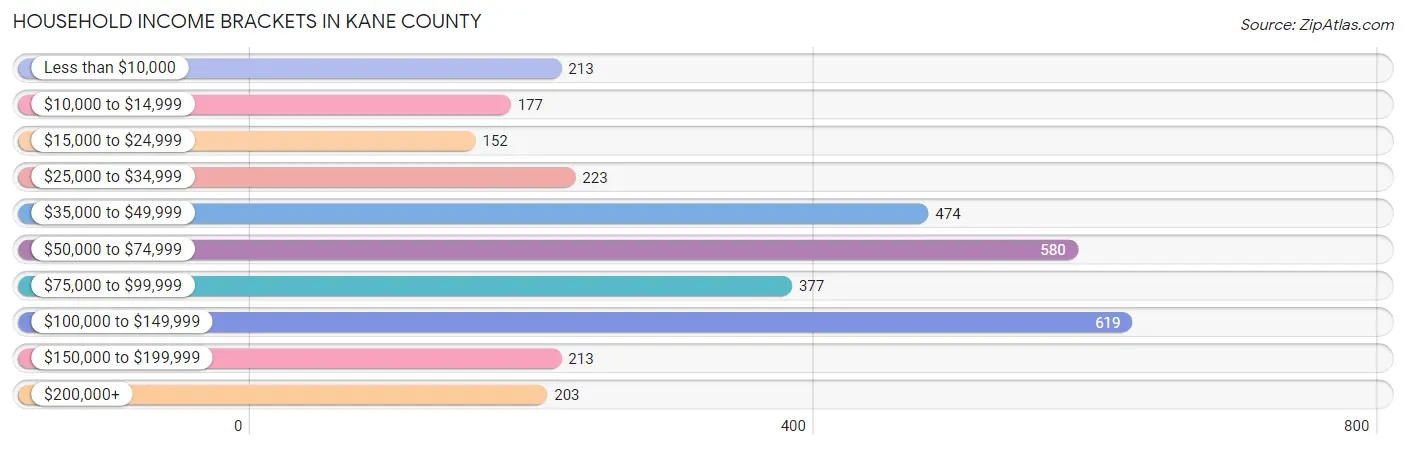
| Income Bracket | # Households | % Households |
| Less than $10,000 | 213 | 6.6% |
| $10,000 to $14,999 | 177 | 5.5% |
| $15,000 to $24,999 | 152 | 4.7% |
| $25,000 to $34,999 | 223 | 6.9% |
| $35,000 to $49,999 | 474 | 14.7% |
| $50,000 to $74,999 | 580 | 18.0% |
| $75,000 to $99,999 | 377 | 11.7% |
| $100,000 to $149,999 | 619 | 19.2% |
| $150,000 to $199,999 | 213 | 6.6% |
| $200,000+ | 203 | 6.3% |
Household Income by Householder Age in Kane County
The median household income in Kane County is $70,327, with the highest median household income of $95,781 found in the 45 to 64 years age bracket for the primary householder. A total of 1,096 households (34.0%) fall into this category. Meanwhile, the 65+ years age bracket for the primary householder has the lowest median household income of $50,737, with 1,105 households (34.3%) in this group.
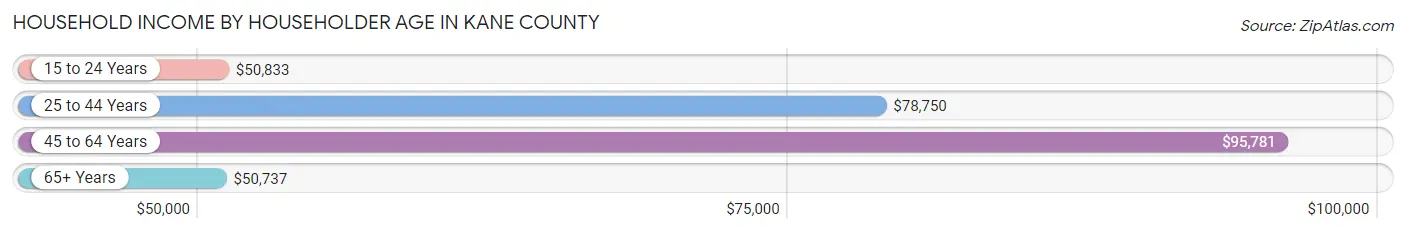
| Income Bracket | # Households | Median Income |
| 15 to 24 Years | 58 (1.8%) | $50,833 |
| 25 to 44 Years | 966 (29.9%) | $78,750 |
| 45 to 64 Years | 1,096 (34.0%) | $95,781 |
| 65+ Years | 1,105 (34.3%) | $50,737 |
| Total | 3,225 (100.0%) | $70,327 |
Poverty in Kane County
Income Below Poverty by Sex and Age in Kane County
With 13.0% poverty level for males and 12.8% for females among the residents of Kane County, 55 to 64 year old males and 6 to 11 year old females are the most vulnerable to poverty, with 162 males (32.5%) and 63 females (28.4%) in their respective age groups living below the poverty level.
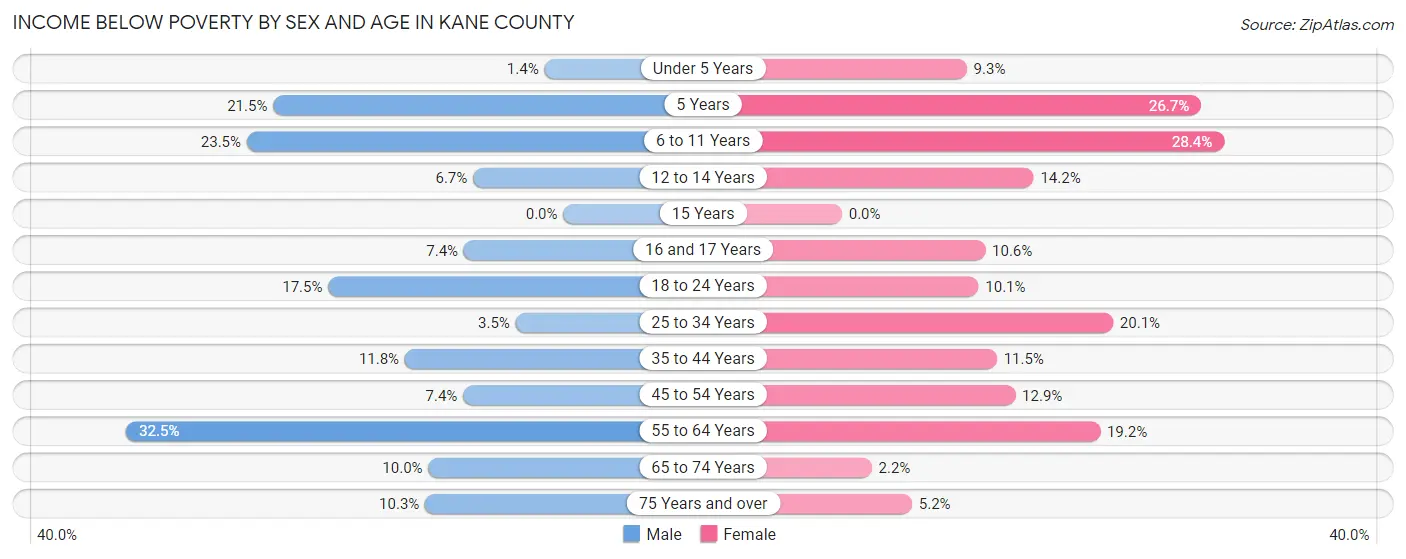
| Age Bracket | Male | Female |
| Under 5 Years | 3 (1.4%) | 19 (9.3%) |
| 5 Years | 14 (21.5%) | 4 (26.7%) |
| 6 to 11 Years | 55 (23.5%) | 63 (28.4%) |
| 12 to 14 Years | 14 (6.7%) | 36 (14.2%) |
| 15 Years | 0 (0.0%) | 0 (0.0%) |
| 16 and 17 Years | 11 (7.4%) | 5 (10.6%) |
| 18 to 24 Years | 41 (17.4%) | 15 (10.1%) |
| 25 to 34 Years | 14 (3.5%) | 121 (20.1%) |
| 35 to 44 Years | 48 (11.8%) | 49 (11.5%) |
| 45 to 54 Years | 27 (7.4%) | 48 (12.9%) |
| 55 to 64 Years | 162 (32.5%) | 106 (19.2%) |
| 65 to 74 Years | 57 (10.0%) | 13 (2.2%) |
| 75 Years and over | 35 (10.3%) | 18 (5.2%) |
| Total | 481 (13.0%) | 497 (12.8%) |
Income Above Poverty by Sex and Age in Kane County
According to the poverty statistics in Kane County, males aged 15 years and females aged 15 years are the age groups that are most secure financially, with 100.0% of males and 100.0% of females in these age groups living above the poverty line.
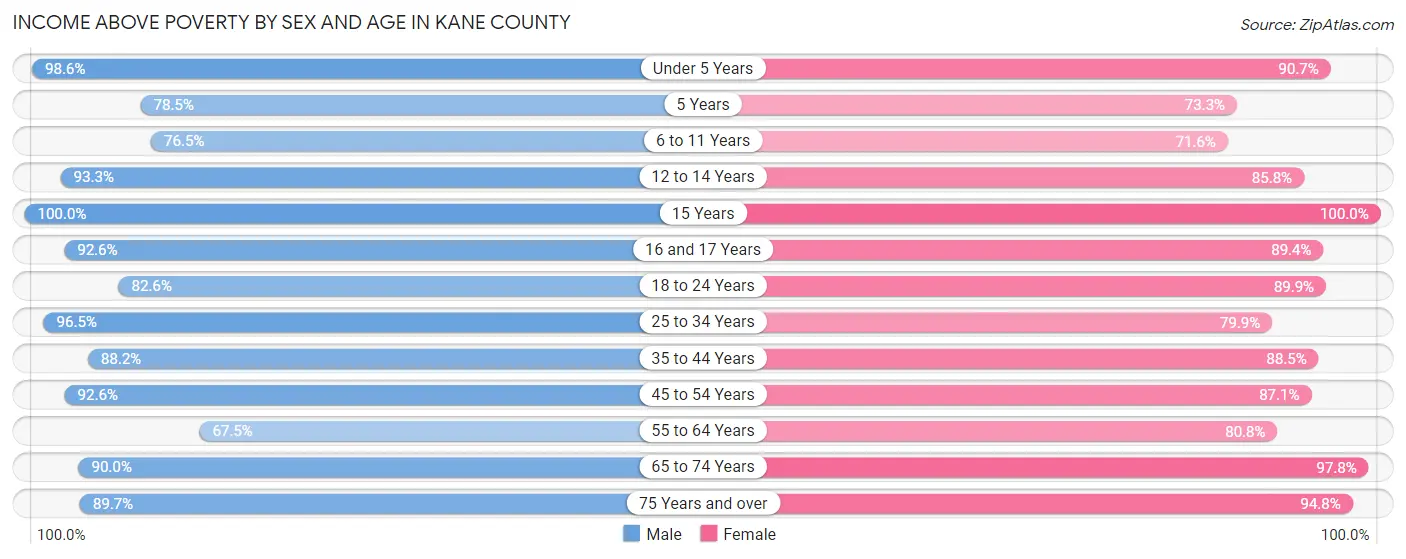
| Age Bracket | Male | Female |
| Under 5 Years | 212 (98.6%) | 186 (90.7%) |
| 5 Years | 51 (78.5%) | 11 (73.3%) |
| 6 to 11 Years | 179 (76.5%) | 159 (71.6%) |
| 12 to 14 Years | 195 (93.3%) | 217 (85.8%) |
| 15 Years | 10 (100.0%) | 100 (100.0%) |
| 16 and 17 Years | 138 (92.6%) | 42 (89.4%) |
| 18 to 24 Years | 194 (82.6%) | 133 (89.9%) |
| 25 to 34 Years | 382 (96.5%) | 480 (79.9%) |
| 35 to 44 Years | 360 (88.2%) | 377 (88.5%) |
| 45 to 54 Years | 336 (92.6%) | 325 (87.1%) |
| 55 to 64 Years | 337 (67.5%) | 447 (80.8%) |
| 65 to 74 Years | 512 (90.0%) | 576 (97.8%) |
| 75 Years and over | 306 (89.7%) | 328 (94.8%) |
| Total | 3,212 (87.0%) | 3,381 (87.2%) |
Income Below Poverty Among Married-Couple Families in Kane County
The poverty statistics for married-couple families in Kane County show that 5.8% or 97 of the total 1,672 families live below the poverty line. Families with 5 or more children have the highest poverty rate of 72.7%, comprising of 8 families. On the other hand, families with 1 or 2 children have the lowest poverty rate of 0.9%, which includes 3 families.
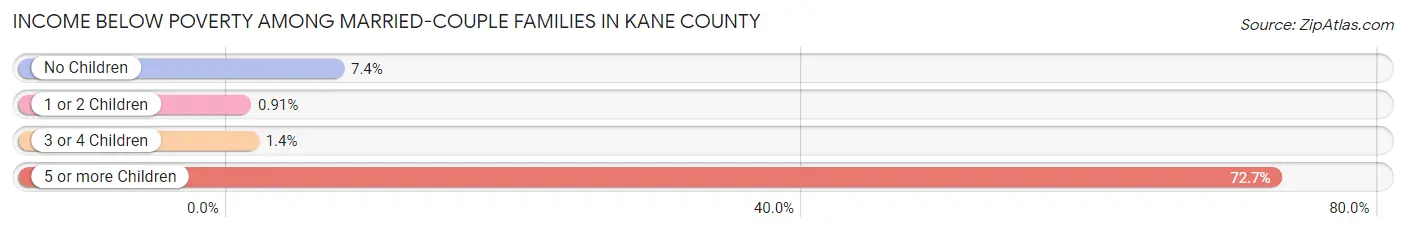
| Children | Above Poverty | Below Poverty |
| No Children | 1,041 (92.6%) | 83 (7.4%) |
| 1 or 2 Children | 326 (99.1%) | 3 (0.9%) |
| 3 or 4 Children | 205 (98.6%) | 3 (1.4%) |
| 5 or more Children | 3 (27.3%) | 8 (72.7%) |
| Total | 1,575 (94.2%) | 97 (5.8%) |
Income Below Poverty Among Single-Parent Households in Kane County
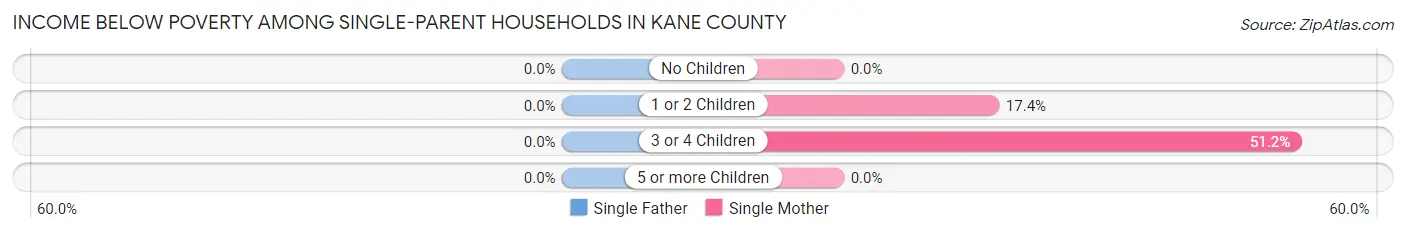
| Children | Single Father | Single Mother |
| No Children | 0 (0.0%) | 0 (0.0%) |
| 1 or 2 Children | 0 (0.0%) | 17 (17.3%) |
| 3 or 4 Children | 0 (0.0%) | 21 (51.2%) |
| 5 or more Children | 0 (0.0%) | 0 (0.0%) |
| Total | 0 (0.0%) | 38 (18.8%) |
Income Below Poverty Among Married-Couple vs Single-Parent Households in Kane County
The poverty data for Kane County shows that 97 of the married-couple family households (5.8%) and 38 of the single-parent households (15.5%) are living below the poverty level. Within the married-couple family households, those with 5 or more children have the highest poverty rate, with 8 households (72.7%) falling below the poverty line. Among the single-parent households, those with 3 or 4 children have the highest poverty rate, with 21 household (51.2%) living below poverty.
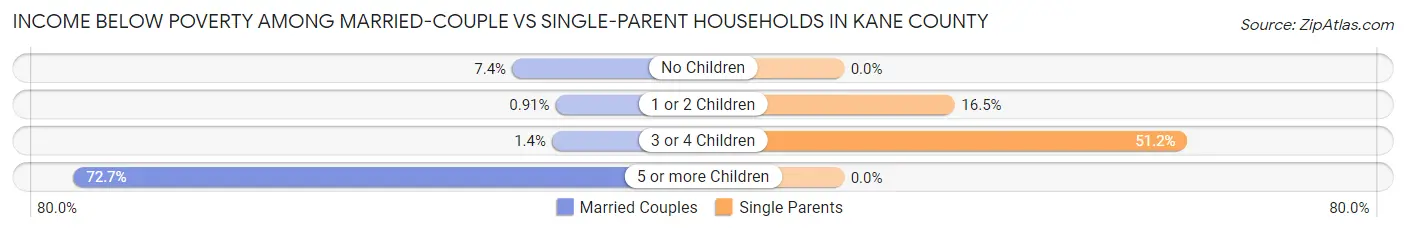
| Children | Married-Couple Families | Single-Parent Households |
| No Children | 83 (7.4%) | 0 (0.0%) |
| 1 or 2 Children | 3 (0.9%) | 17 (16.5%) |
| 3 or 4 Children | 3 (1.4%) | 21 (51.2%) |
| 5 or more Children | 8 (72.7%) | 0 (0.0%) |
| Total | 97 (5.8%) | 38 (15.5%) |
Employment Characteristics in Kane County
Employment by Class of Employer in Kane County
Among the 3,422 employed individuals in Kane County, private company employees (1,697 | 49.6%), not-for-profit organizations (759 | 22.2%), and local government employees (348 | 10.2%) make up the most common classes of employment.
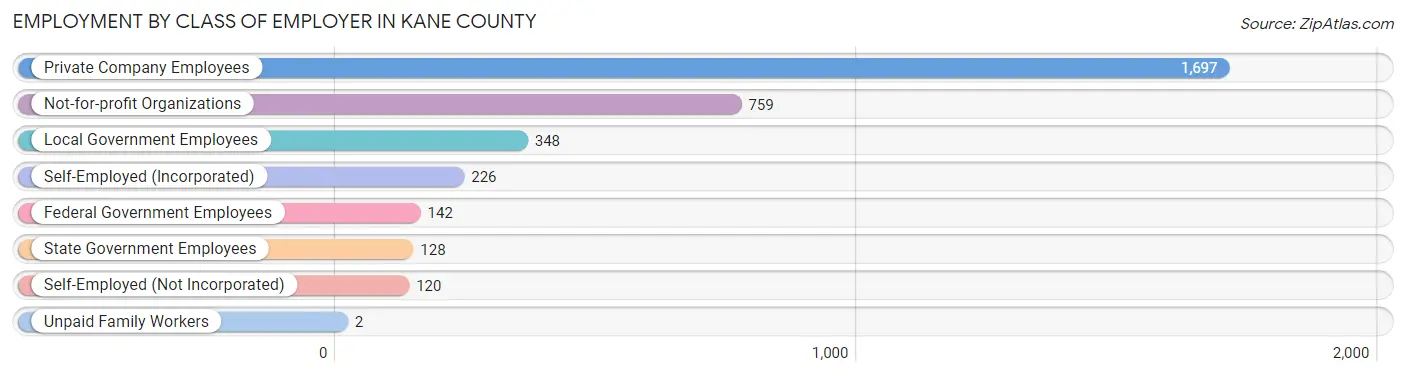
| Employer Class | # Employees | % Employees |
| Private Company Employees | 1,697 | 49.6% |
| Self-Employed (Incorporated) | 226 | 6.6% |
| Self-Employed (Not Incorporated) | 120 | 3.5% |
| Not-for-profit Organizations | 759 | 22.2% |
| Local Government Employees | 348 | 10.2% |
| State Government Employees | 128 | 3.7% |
| Federal Government Employees | 142 | 4.2% |
| Unpaid Family Workers | 2 | 0.1% |
| Total | 3,422 | 100.0% |
Employment Status by Age in Kane County
According to the labor force statistics for Kane County, out of the total population over 16 years of age (6,228), 58.1% or 3,618 individuals are in the labor force, with 3.5% or 127 of them unemployed. The age group with the highest labor force participation rate is 25 to 29 years, with 81.9% or 376 individuals in the labor force. Within the labor force, the 55 to 59 years age range has the highest percentage of unemployed individuals, with 10.1% or 43 of them being unemployed.
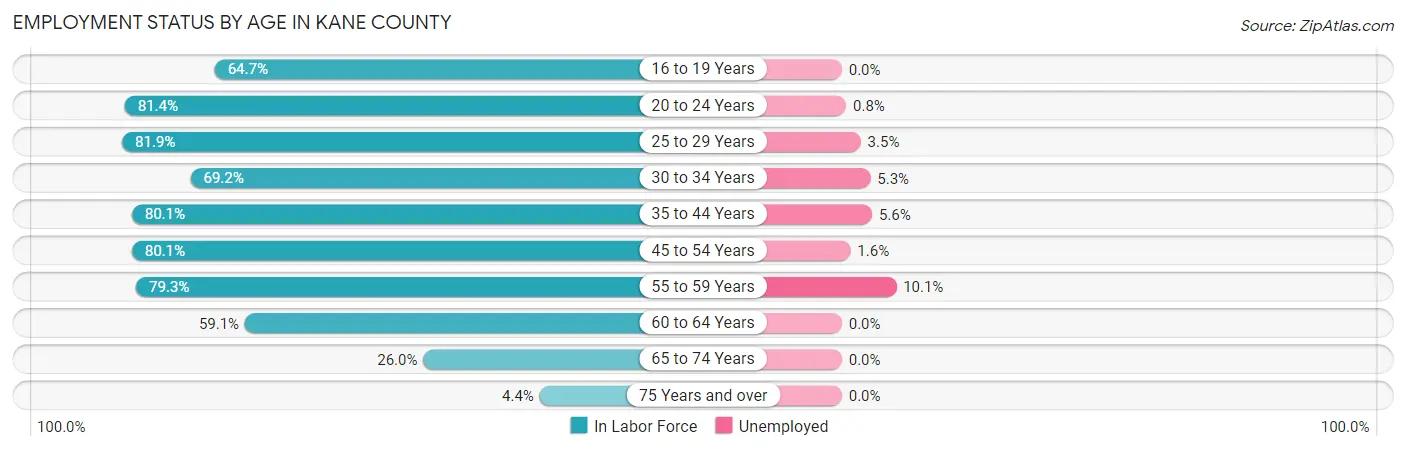
| Age Bracket | In Labor Force | Unemployed |
| 16 to 19 Years | 196 (64.7%) | 0 (0.0%) |
| 20 to 24 Years | 259 (81.4%) | 2 (0.8%) |
| 25 to 29 Years | 376 (81.9%) | 13 (3.5%) |
| 30 to 34 Years | 398 (69.2%) | 21 (5.3%) |
| 35 to 44 Years | 698 (80.1%) | 39 (5.6%) |
| 45 to 54 Years | 618 (80.1%) | 10 (1.6%) |
| 55 to 59 Years | 426 (79.3%) | 43 (10.1%) |
| 60 to 64 Years | 313 (59.1%) | 0 (0.0%) |
| 65 to 74 Years | 303 (26.0%) | 0 (0.0%) |
| 75 Years and over | 31 (4.4%) | 0 (0.0%) |
| Total | 3,618 (58.1%) | 127 (3.5%) |
Employment Status by Educational Attainment in Kane County
According to labor force statistics for Kane County, 75.6% of individuals (2,830) out of the total population between 25 and 64 years of age (3,744) are in the labor force, with 4.4% or 125 of them being unemployed. The group with the highest labor force participation rate are those with the educational attainment of bachelor's degree or higher, with 87.5% or 1,065 individuals in the labor force. Within the labor force, individuals with less than high school education have the highest percentage of unemployment, with 15.6% or 7 of them being unemployed.
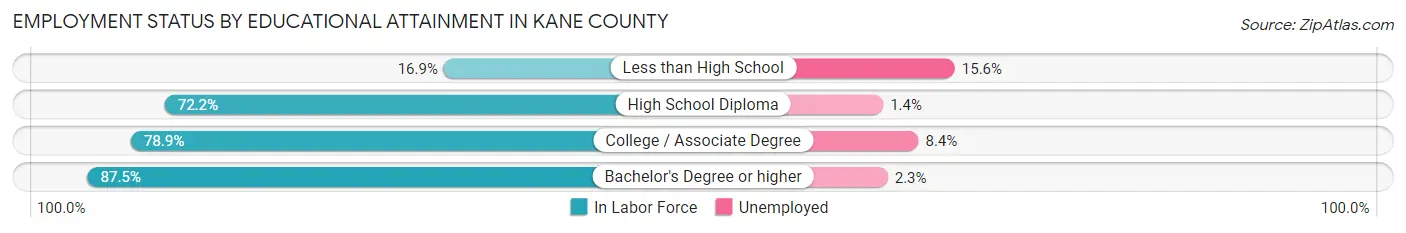
| Educational Attainment | In Labor Force | Unemployed |
| Less than High School | 45 (16.9%) | 41 (15.6%) |
| High School Diploma | 700 (72.2%) | 14 (1.4%) |
| College / Associate Degree | 1,019 (78.9%) | 109 (8.4%) |
| Bachelor's Degree or higher | 1,065 (87.5%) | 28 (2.3%) |
| Total | 2,830 (75.6%) | 165 (4.4%) |
Employment Occupations by Sex in Kane County
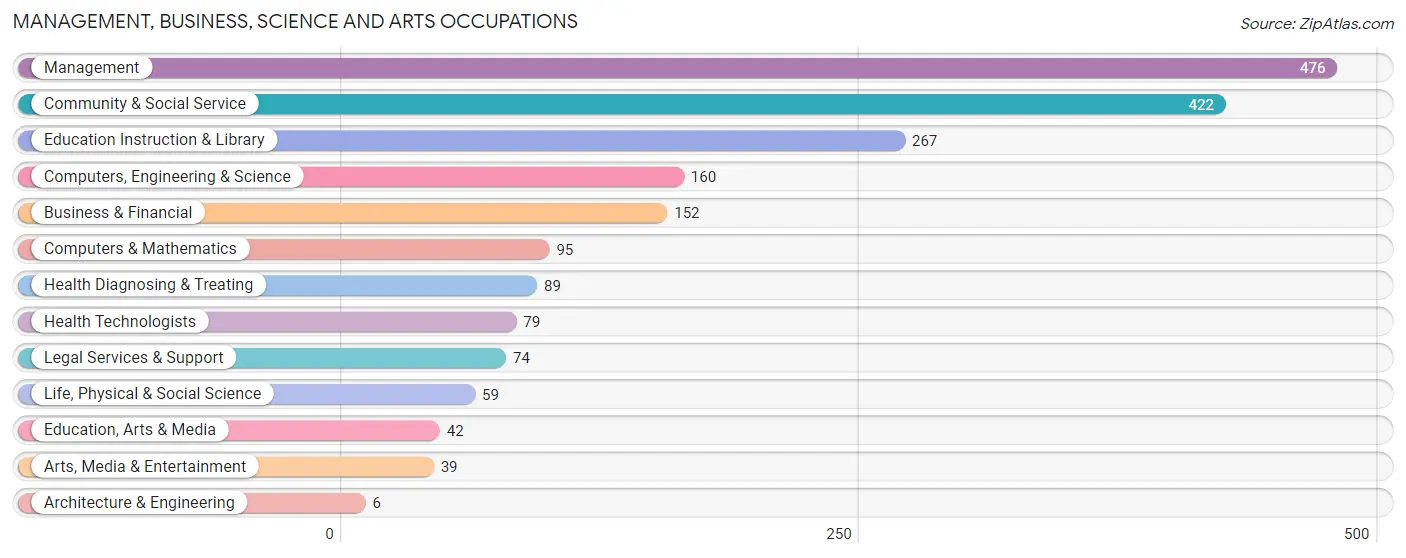
Management, Business, Science and Arts Occupations
The most common Management, Business, Science and Arts occupations in Kane County are Management (476 | 13.7%), Community & Social Service (422 | 12.2%), Education Instruction & Library (267 | 7.7%), Computers, Engineering & Science (160 | 4.6%), and Business & Financial (152 | 4.4%).
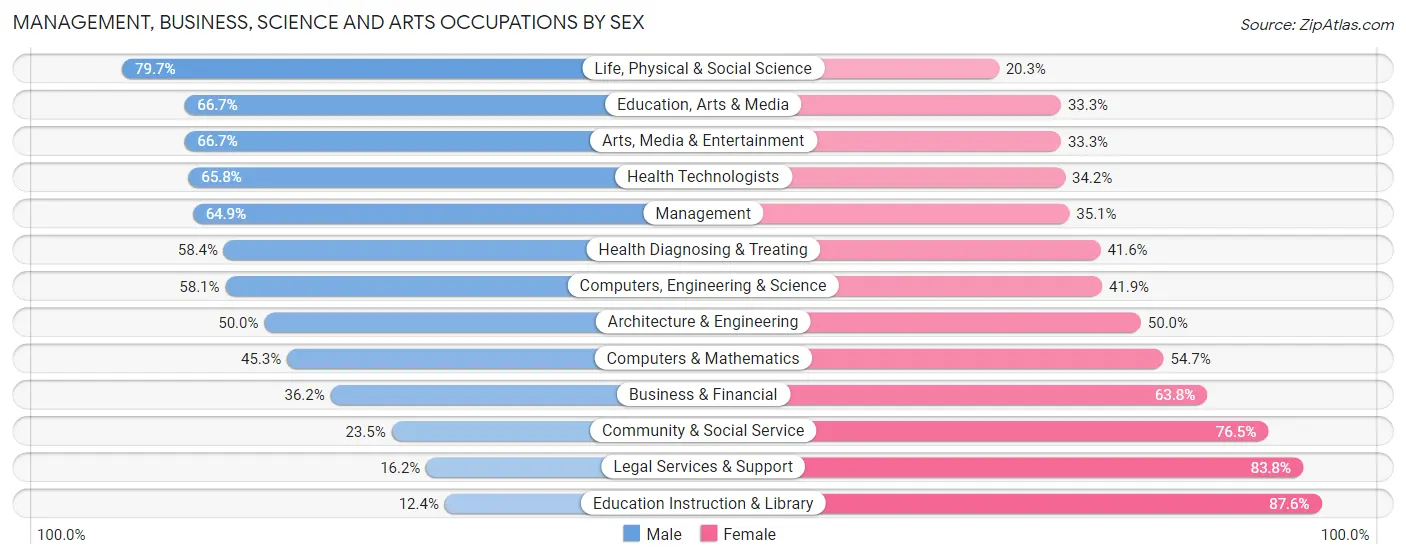
Management, Business, Science and Arts Occupations by Sex
Within the Management, Business, Science and Arts occupations in Kane County, the most male-oriented occupations are Life, Physical & Social Science (79.7%), Education, Arts & Media (66.7%), and Arts, Media & Entertainment (66.7%), while the most female-oriented occupations are Education Instruction & Library (87.6%), Legal Services & Support (83.8%), and Community & Social Service (76.5%).
| Occupation | Male | Female |
| Management | 309 (64.9%) | 167 (35.1%) |
| Business & Financial | 55 (36.2%) | 97 (63.8%) |
| Computers, Engineering & Science | 93 (58.1%) | 67 (41.9%) |
| Computers & Mathematics | 43 (45.3%) | 52 (54.7%) |
| Architecture & Engineering | 3 (50.0%) | 3 (50.0%) |
| Life, Physical & Social Science | 47 (79.7%) | 12 (20.3%) |
| Community & Social Service | 99 (23.5%) | 323 (76.5%) |
| Education, Arts & Media | 28 (66.7%) | 14 (33.3%) |
| Legal Services & Support | 12 (16.2%) | 62 (83.8%) |
| Education Instruction & Library | 33 (12.4%) | 234 (87.6%) |
| Arts, Media & Entertainment | 26 (66.7%) | 13 (33.3%) |
| Health Diagnosing & Treating | 52 (58.4%) | 37 (41.6%) |
| Health Technologists | 52 (65.8%) | 27 (34.2%) |
| Total (Category) | 608 (46.8%) | 691 (53.2%) |
| Total (Overall) | 1,672 (48.2%) | 1,799 (51.8%) |
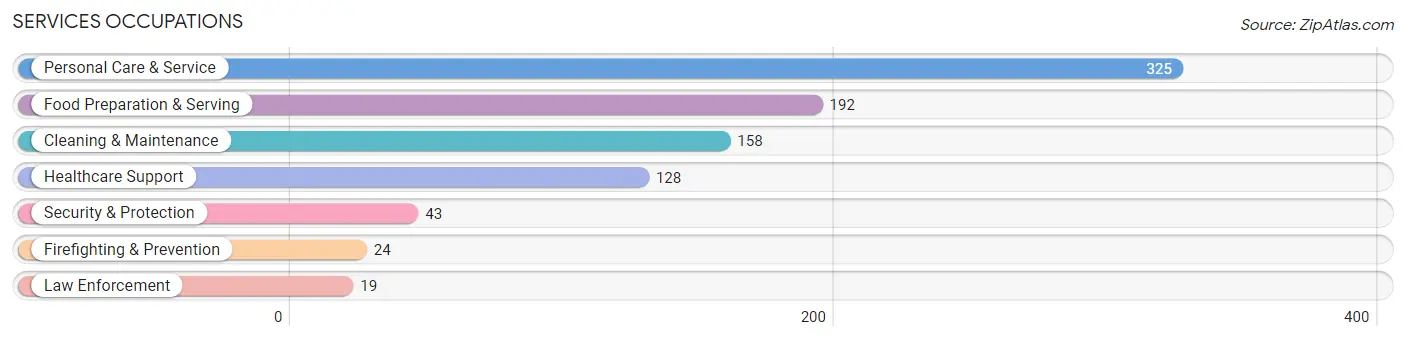
Services Occupations
The most common Services occupations in Kane County are Personal Care & Service (325 | 9.4%), Food Preparation & Serving (192 | 5.5%), Cleaning & Maintenance (158 | 4.5%), Healthcare Support (128 | 3.7%), and Security & Protection (43 | 1.2%).
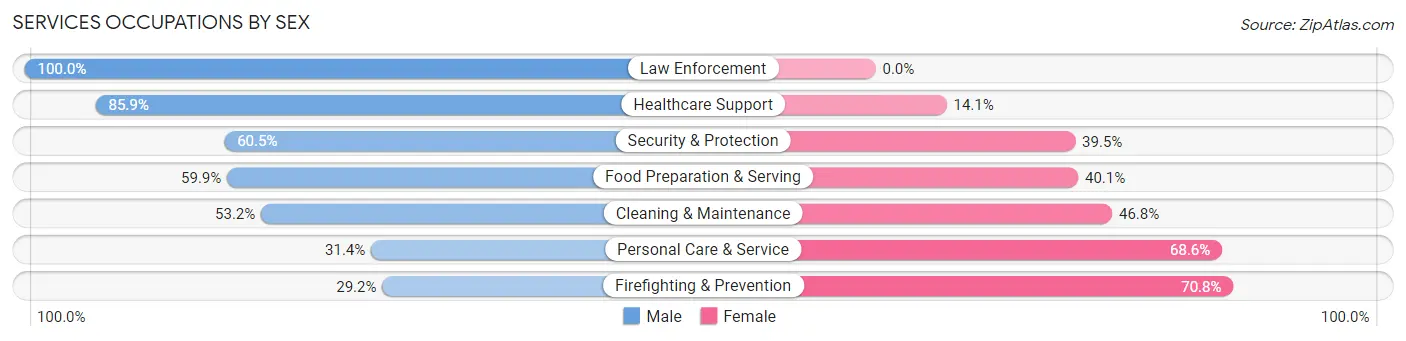
Services Occupations by Sex
Within the Services occupations in Kane County, the most male-oriented occupations are Law Enforcement (100.0%), Healthcare Support (85.9%), and Security & Protection (60.5%), while the most female-oriented occupations are Firefighting & Prevention (70.8%), Personal Care & Service (68.6%), and Cleaning & Maintenance (46.8%).
| Occupation | Male | Female |
| Healthcare Support | 110 (85.9%) | 18 (14.1%) |
| Security & Protection | 26 (60.5%) | 17 (39.5%) |
| Firefighting & Prevention | 7 (29.2%) | 17 (70.8%) |
| Law Enforcement | 19 (100.0%) | 0 (0.0%) |
| Food Preparation & Serving | 115 (59.9%) | 77 (40.1%) |
| Cleaning & Maintenance | 84 (53.2%) | 74 (46.8%) |
| Personal Care & Service | 102 (31.4%) | 223 (68.6%) |
| Total (Category) | 437 (51.6%) | 409 (48.3%) |
| Total (Overall) | 1,672 (48.2%) | 1,799 (51.8%) |
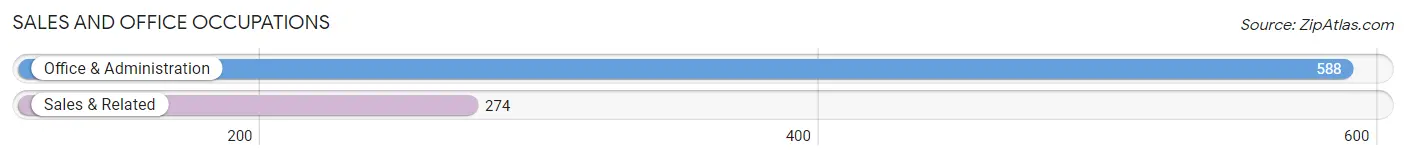
Sales and Office Occupations
The most common Sales and Office occupations in Kane County are Office & Administration (588 | 16.9%), and Sales & Related (274 | 7.9%).
Sales and Office Occupations by Sex

| Occupation | Male | Female |
| Sales & Related | 127 (46.4%) | 147 (53.6%) |
| Office & Administration | 88 (15.0%) | 500 (85.0%) |
| Total (Category) | 215 (24.9%) | 647 (75.1%) |
| Total (Overall) | 1,672 (48.2%) | 1,799 (51.8%) |
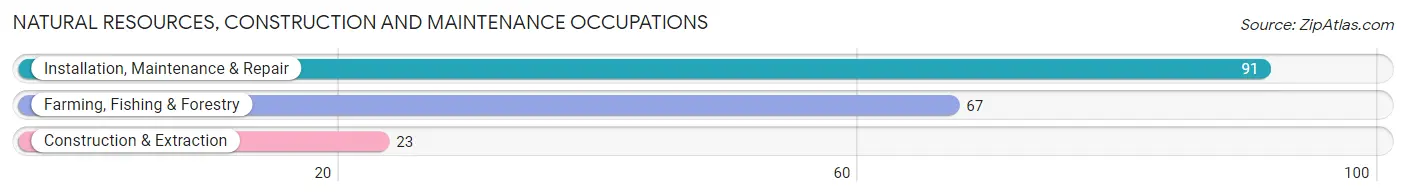
Natural Resources, Construction and Maintenance Occupations
The most common Natural Resources, Construction and Maintenance occupations in Kane County are Installation, Maintenance & Repair (91 | 2.6%), Farming, Fishing & Forestry (67 | 1.9%), and Construction & Extraction (23 | 0.7%).
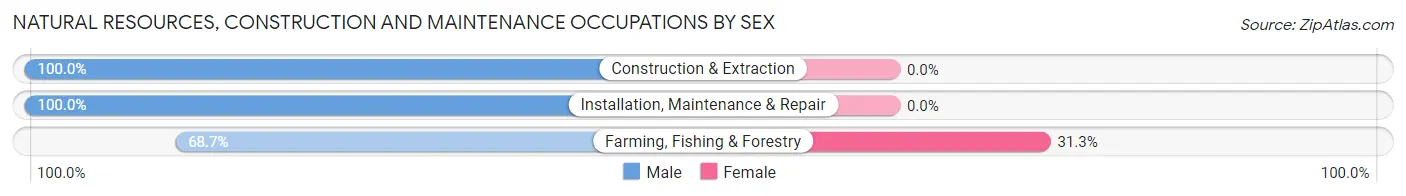
Natural Resources, Construction and Maintenance Occupations by Sex
| Occupation | Male | Female |
| Farming, Fishing & Forestry | 46 (68.7%) | 21 (31.3%) |
| Construction & Extraction | 23 (100.0%) | 0 (0.0%) |
| Installation, Maintenance & Repair | 91 (100.0%) | 0 (0.0%) |
| Total (Category) | 160 (88.4%) | 21 (11.6%) |
| Total (Overall) | 1,672 (48.2%) | 1,799 (51.8%) |
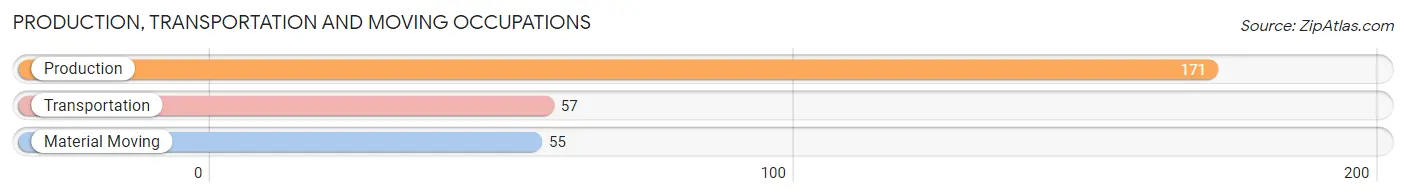
Production, Transportation and Moving Occupations
The most common Production, Transportation and Moving occupations in Kane County are Production (171 | 4.9%), Transportation (57 | 1.6%), and Material Moving (55 | 1.6%).
Production, Transportation and Moving Occupations by Sex
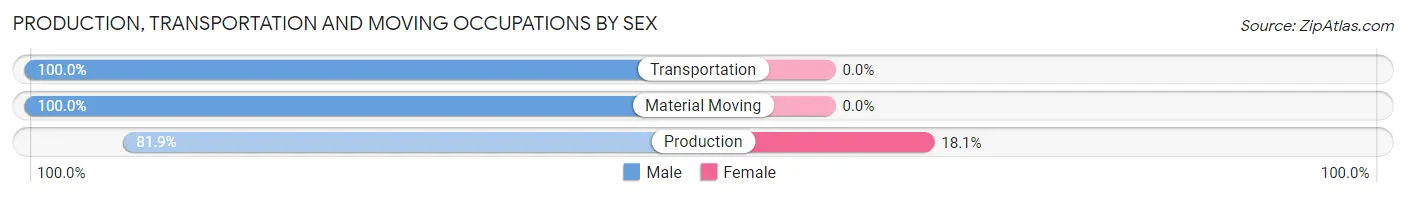
| Occupation | Male | Female |
| Production | 140 (81.9%) | 31 (18.1%) |
| Transportation | 57 (100.0%) | 0 (0.0%) |
| Material Moving | 55 (100.0%) | 0 (0.0%) |
| Total (Category) | 252 (89.0%) | 31 (11.0%) |
| Total (Overall) | 1,672 (48.2%) | 1,799 (51.8%) |
Employment Industries by Sex in Kane County
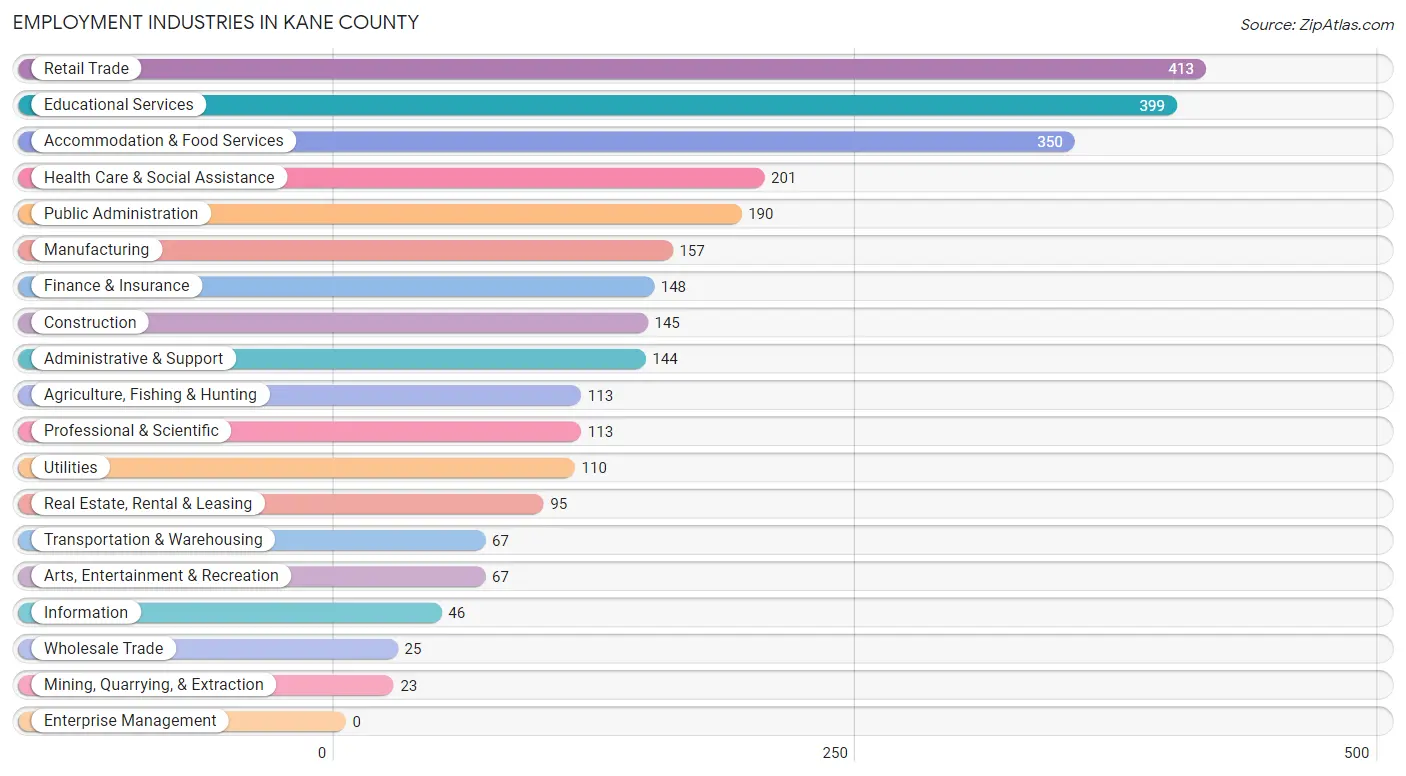
Employment Industries in Kane County
The major employment industries in Kane County include Retail Trade (413 | 11.9%), Educational Services (399 | 11.5%), Accommodation & Food Services (350 | 10.1%), Health Care & Social Assistance (201 | 5.8%), and Public Administration (190 | 5.5%).
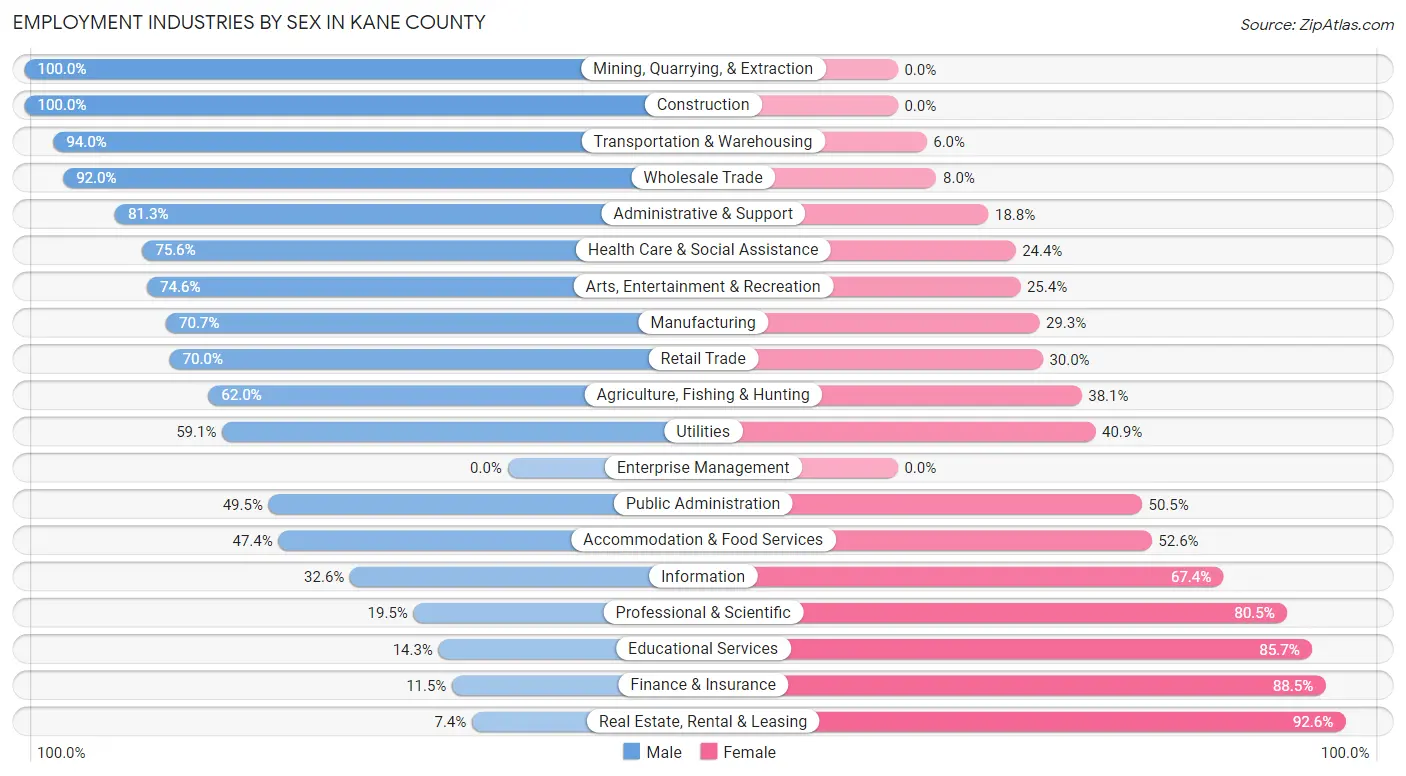
Employment Industries by Sex in Kane County
The Kane County industries that see more men than women are Mining, Quarrying, & Extraction (100.0%), Construction (100.0%), and Transportation & Warehousing (94.0%), whereas the industries that tend to have a higher number of women are Real Estate, Rental & Leasing (92.6%), Finance & Insurance (88.5%), and Educational Services (85.7%).
| Industry | Male | Female |
| Agriculture, Fishing & Hunting | 70 (62.0%) | 43 (38.1%) |
| Mining, Quarrying, & Extraction | 23 (100.0%) | 0 (0.0%) |
| Construction | 145 (100.0%) | 0 (0.0%) |
| Manufacturing | 111 (70.7%) | 46 (29.3%) |
| Wholesale Trade | 23 (92.0%) | 2 (8.0%) |
| Retail Trade | 289 (70.0%) | 124 (30.0%) |
| Transportation & Warehousing | 63 (94.0%) | 4 (6.0%) |
| Utilities | 65 (59.1%) | 45 (40.9%) |
| Information | 15 (32.6%) | 31 (67.4%) |
| Finance & Insurance | 17 (11.5%) | 131 (88.5%) |
| Real Estate, Rental & Leasing | 7 (7.4%) | 88 (92.6%) |
| Professional & Scientific | 22 (19.5%) | 91 (80.5%) |
| Enterprise Management | 0 (0.0%) | 0 (0.0%) |
| Administrative & Support | 117 (81.2%) | 27 (18.8%) |
| Educational Services | 57 (14.3%) | 342 (85.7%) |
| Health Care & Social Assistance | 152 (75.6%) | 49 (24.4%) |
| Arts, Entertainment & Recreation | 50 (74.6%) | 17 (25.4%) |
| Accommodation & Food Services | 166 (47.4%) | 184 (52.6%) |
| Public Administration | 94 (49.5%) | 96 (50.5%) |
| Total | 1,672 (48.2%) | 1,799 (51.8%) |
Education in Kane County
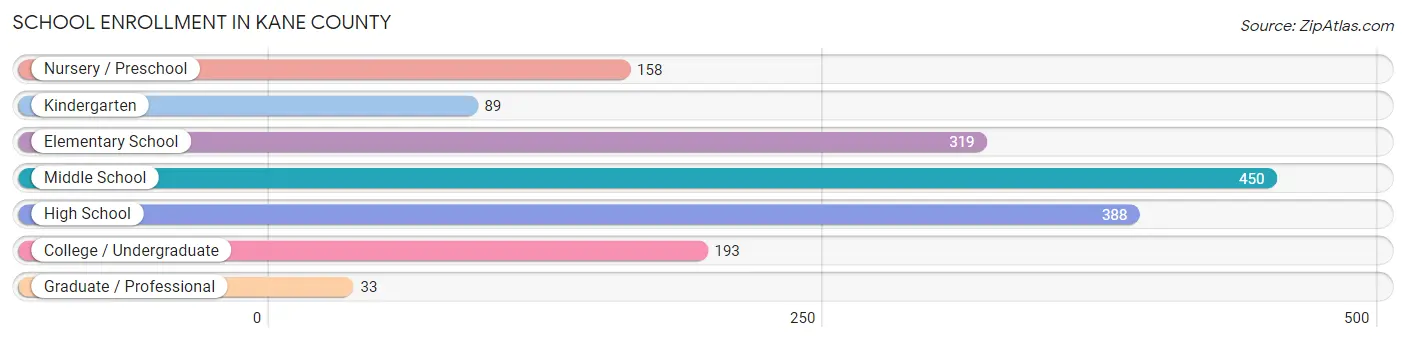
School Enrollment in Kane County
The most common levels of schooling among the 1,630 students in Kane County are middle school (450 | 27.6%), high school (388 | 23.8%), and elementary school (319 | 19.6%).
| School Level | # Students | % Students |
| Nursery / Preschool | 158 | 9.7% |
| Kindergarten | 89 | 5.5% |
| Elementary School | 319 | 19.6% |
| Middle School | 450 | 27.6% |
| High School | 388 | 23.8% |
| College / Undergraduate | 193 | 11.8% |
| Graduate / Professional | 33 | 2.0% |
| Total | 1,630 | 100.0% |
School Enrollment by Age by Funding Source in Kane County
Out of a total of 1,630 students who are enrolled in schools in Kane County, 204 (12.5%) attend a private institution, while the remaining 1,426 (87.5%) are enrolled in public schools. The age group of 25 to 34 year olds has the highest likelihood of being enrolled in private schools, with 79 (68.1% in the age bracket) enrolled. Conversely, the age group of 5 to 9 year old has the lowest likelihood of being enrolled in a private school, with 455 (100.0% in the age bracket) attending a public institution.
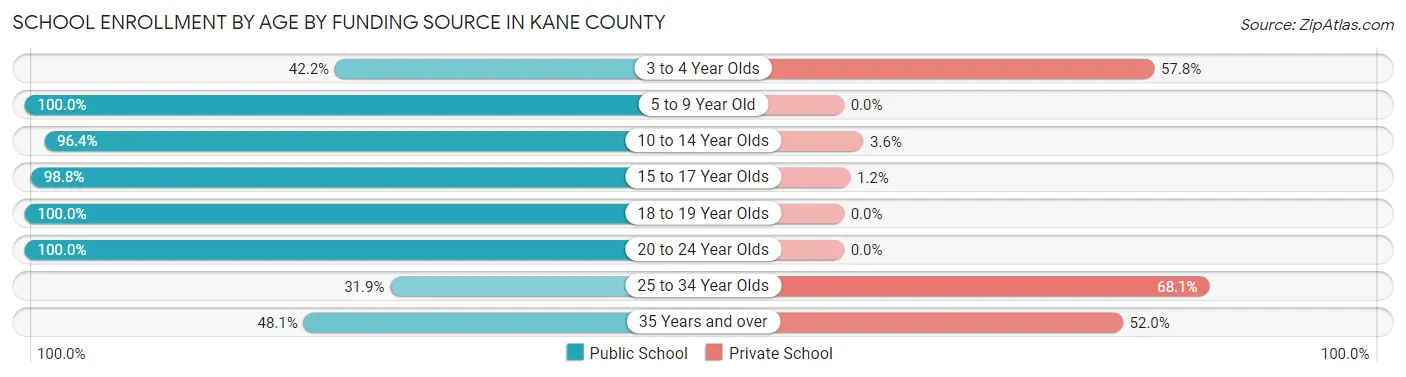
| Age Bracket | Public School | Private School |
| 3 to 4 Year Olds | 46 (42.2%) | 63 (57.8%) |
| 5 to 9 Year Old | 455 (100.0%) | 0 (0.0%) |
| 10 to 14 Year Olds | 505 (96.4%) | 19 (3.6%) |
| 15 to 17 Year Olds | 252 (98.8%) | 3 (1.2%) |
| 18 to 19 Year Olds | 47 (100.0%) | 0 (0.0%) |
| 20 to 24 Year Olds | 47 (100.0%) | 0 (0.0%) |
| 25 to 34 Year Olds | 37 (31.9%) | 79 (68.1%) |
| 35 Years and over | 37 (48.0%) | 40 (51.9%) |
| Total | 1,426 (87.5%) | 204 (12.5%) |
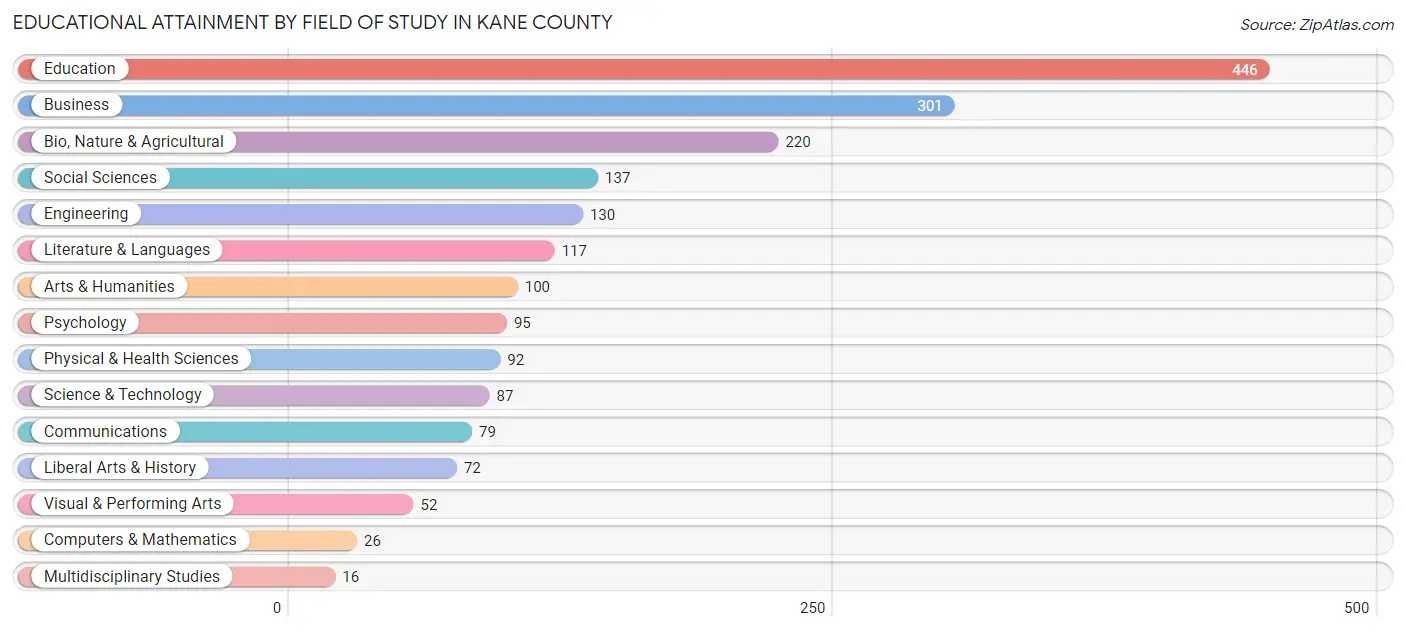
Educational Attainment by Field of Study in Kane County
Education (446 | 22.6%), business (301 | 15.3%), bio, nature & agricultural (220 | 11.2%), social sciences (137 | 7.0%), and engineering (130 | 6.6%) are the most common fields of study among 1,970 individuals in Kane County who have obtained a bachelor's degree or higher.
| Field of Study | # Graduates | % Graduates |
| Computers & Mathematics | 26 | 1.3% |
| Bio, Nature & Agricultural | 220 | 11.2% |
| Physical & Health Sciences | 92 | 4.7% |
| Psychology | 95 | 4.8% |
| Social Sciences | 137 | 7.0% |
| Engineering | 130 | 6.6% |
| Multidisciplinary Studies | 16 | 0.8% |
| Science & Technology | 87 | 4.4% |
| Business | 301 | 15.3% |
| Education | 446 | 22.6% |
| Literature & Languages | 117 | 5.9% |
| Liberal Arts & History | 72 | 3.6% |
| Visual & Performing Arts | 52 | 2.6% |
| Communications | 79 | 4.0% |
| Arts & Humanities | 100 | 5.1% |
| Total | 1,970 | 100.0% |
Transportation & Commute in Kane County
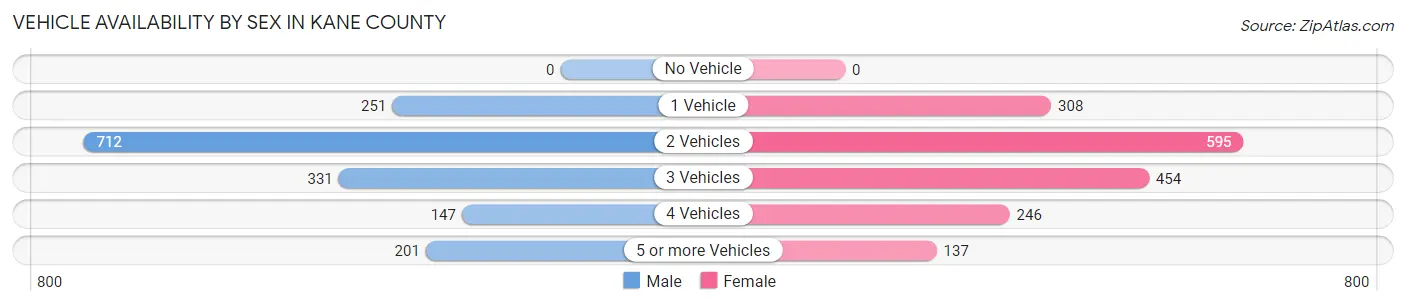
Vehicle Availability by Sex in Kane County
The most prevalent vehicle ownership categories in Kane County are males with 2 vehicles (712, accounting for 43.4%) and females with 2 vehicles (595, making up 40.9%).
| Vehicles Available | Male | Female |
| No Vehicle | 0 (0.0%) | 0 (0.0%) |
| 1 Vehicle | 251 (15.3%) | 308 (17.7%) |
| 2 Vehicles | 712 (43.4%) | 595 (34.2%) |
| 3 Vehicles | 331 (20.2%) | 454 (26.1%) |
| 4 Vehicles | 147 (8.9%) | 246 (14.1%) |
| 5 or more Vehicles | 201 (12.2%) | 137 (7.9%) |
| Total | 1,642 (100.0%) | 1,740 (100.0%) |
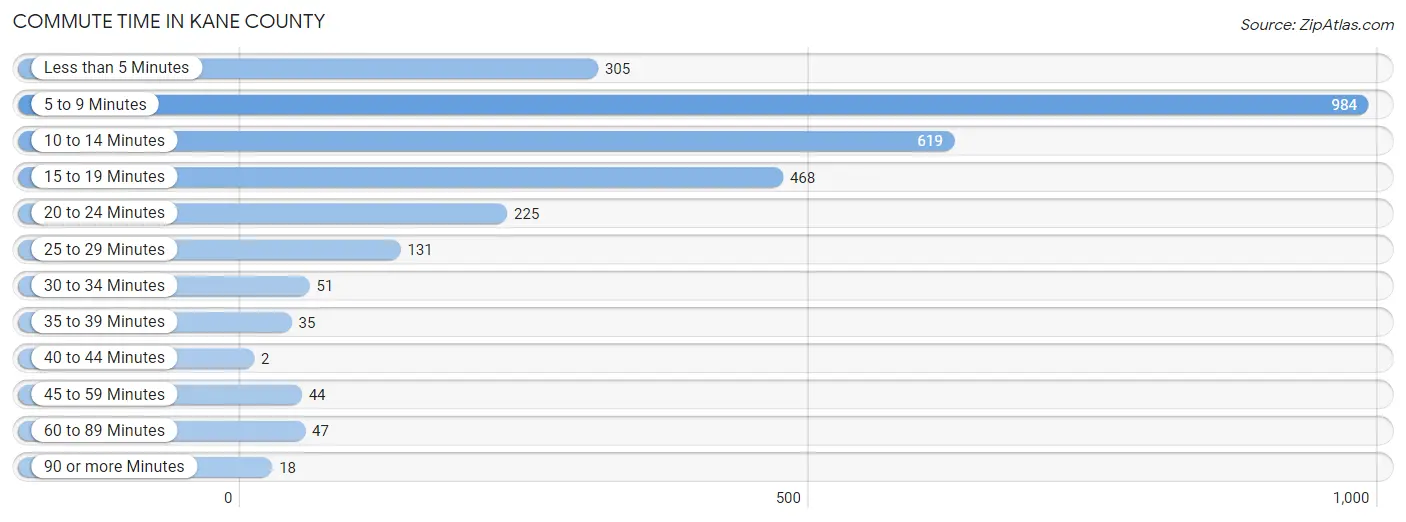
Commute Time in Kane County
The most frequently occuring commute durations in Kane County are 5 to 9 minutes (984 commuters, 33.6%), 10 to 14 minutes (619 commuters, 21.1%), and 15 to 19 minutes (468 commuters, 16.0%).
| Commute Time | # Commuters | % Commuters |
| Less than 5 Minutes | 305 | 10.4% |
| 5 to 9 Minutes | 984 | 33.6% |
| 10 to 14 Minutes | 619 | 21.1% |
| 15 to 19 Minutes | 468 | 16.0% |
| 20 to 24 Minutes | 225 | 7.7% |
| 25 to 29 Minutes | 131 | 4.5% |
| 30 to 34 Minutes | 51 | 1.7% |
| 35 to 39 Minutes | 35 | 1.2% |
| 40 to 44 Minutes | 2 | 0.1% |
| 45 to 59 Minutes | 44 | 1.5% |
| 60 to 89 Minutes | 47 | 1.6% |
| 90 or more Minutes | 18 | 0.6% |
Commute Time by Sex in Kane County
The most common commute times in Kane County are 5 to 9 minutes (511 commuters, 35.9%) for males and 5 to 9 minutes (473 commuters, 31.4%) for females.
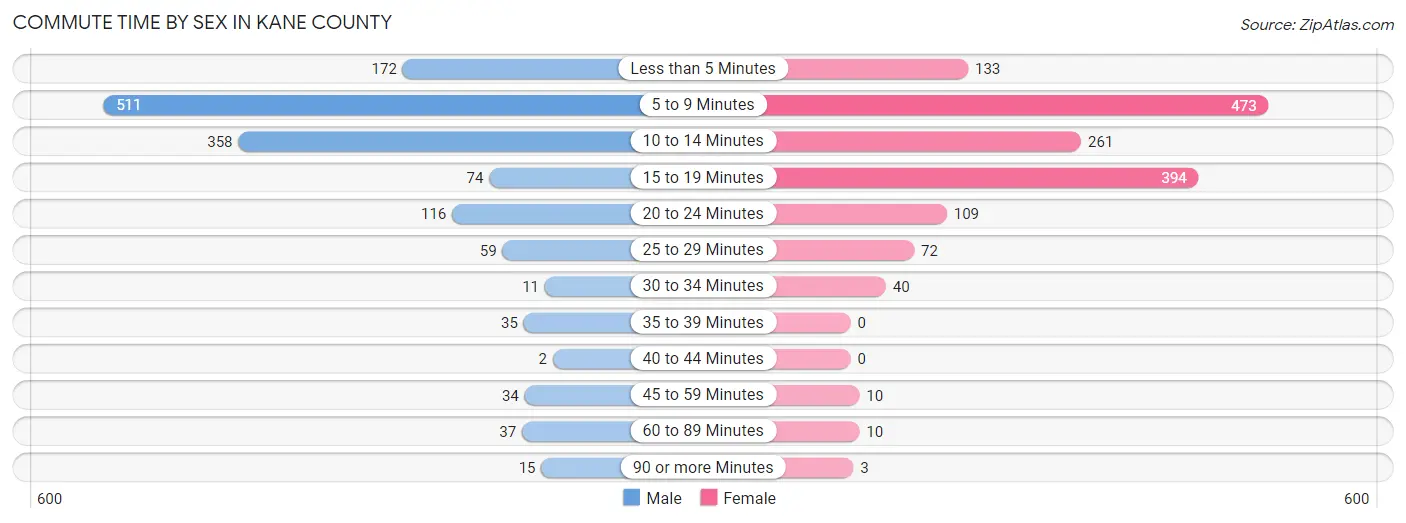
| Commute Time | Male | Female |
| Less than 5 Minutes | 172 (12.1%) | 133 (8.8%) |
| 5 to 9 Minutes | 511 (35.9%) | 473 (31.4%) |
| 10 to 14 Minutes | 358 (25.1%) | 261 (17.3%) |
| 15 to 19 Minutes | 74 (5.2%) | 394 (26.2%) |
| 20 to 24 Minutes | 116 (8.2%) | 109 (7.2%) |
| 25 to 29 Minutes | 59 (4.1%) | 72 (4.8%) |
| 30 to 34 Minutes | 11 (0.8%) | 40 (2.7%) |
| 35 to 39 Minutes | 35 (2.5%) | 0 (0.0%) |
| 40 to 44 Minutes | 2 (0.1%) | 0 (0.0%) |
| 45 to 59 Minutes | 34 (2.4%) | 10 (0.7%) |
| 60 to 89 Minutes | 37 (2.6%) | 10 (0.7%) |
| 90 or more Minutes | 15 (1.1%) | 3 (0.2%) |
Time of Departure to Work by Sex in Kane County
The most frequent times of departure to work in Kane County are 8:00 AM to 8:29 AM (214, 15.0%) for males and 7:30 AM to 7:59 AM (316, 21.0%) for females.
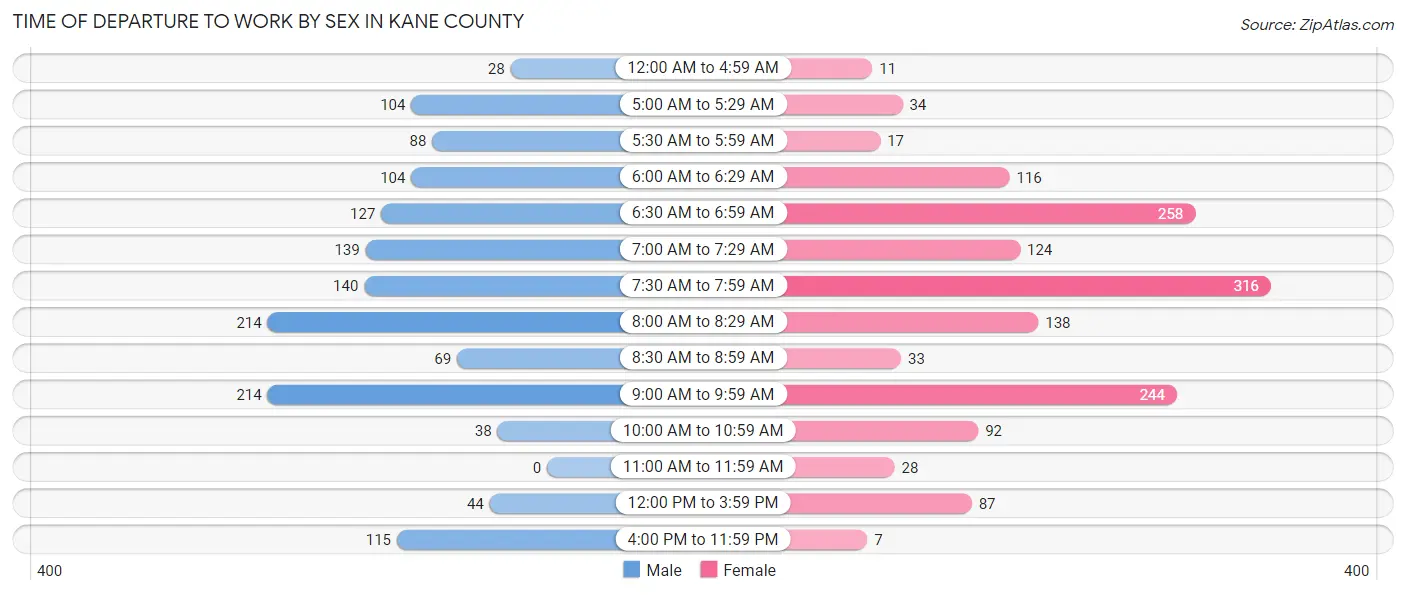
| Time of Departure | Male | Female |
| 12:00 AM to 4:59 AM | 28 (2.0%) | 11 (0.7%) |
| 5:00 AM to 5:29 AM | 104 (7.3%) | 34 (2.3%) |
| 5:30 AM to 5:59 AM | 88 (6.2%) | 17 (1.1%) |
| 6:00 AM to 6:29 AM | 104 (7.3%) | 116 (7.7%) |
| 6:30 AM to 6:59 AM | 127 (8.9%) | 258 (17.1%) |
| 7:00 AM to 7:29 AM | 139 (9.8%) | 124 (8.2%) |
| 7:30 AM to 7:59 AM | 140 (9.8%) | 316 (21.0%) |
| 8:00 AM to 8:29 AM | 214 (15.0%) | 138 (9.2%) |
| 8:30 AM to 8:59 AM | 69 (4.9%) | 33 (2.2%) |
| 9:00 AM to 9:59 AM | 214 (15.0%) | 244 (16.2%) |
| 10:00 AM to 10:59 AM | 38 (2.7%) | 92 (6.1%) |
| 11:00 AM to 11:59 AM | 0 (0.0%) | 28 (1.9%) |
| 12:00 PM to 3:59 PM | 44 (3.1%) | 87 (5.8%) |
| 4:00 PM to 11:59 PM | 115 (8.1%) | 7 (0.5%) |
| Total | 1,424 (100.0%) | 1,505 (100.0%) |
Housing Occupancy in Kane County
Occupancy by Ownership in Kane County
Of the total 3,225 dwellings in Kane County, owner-occupied units account for 2,514 (77.9%), while renter-occupied units make up 711 (22.1%).
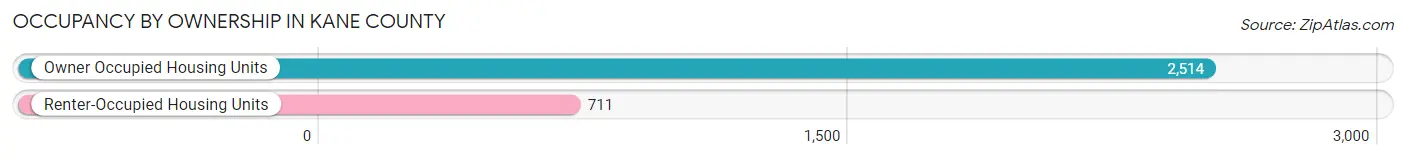
| Occupancy | # Housing Units | % Housing Units |
| Owner Occupied Housing Units | 2,514 | 77.9% |
| Renter-Occupied Housing Units | 711 | 22.1% |
| Total Occupied Housing Units | 3,225 | 100.0% |
Occupancy by Household Size in Kane County
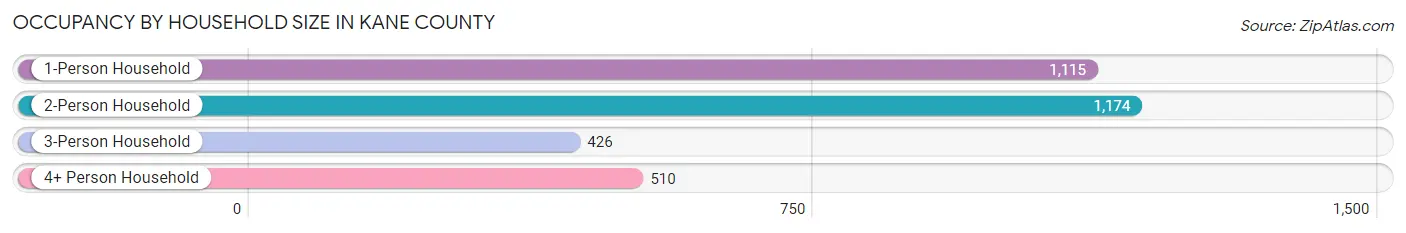
| Household Size | # Housing Units | % Housing Units |
| 1-Person Household | 1,115 | 34.6% |
| 2-Person Household | 1,174 | 36.4% |
| 3-Person Household | 426 | 13.2% |
| 4+ Person Household | 510 | 15.8% |
| Total Housing Units | 3,225 | 100.0% |
Occupancy by Ownership by Household Size in Kane County
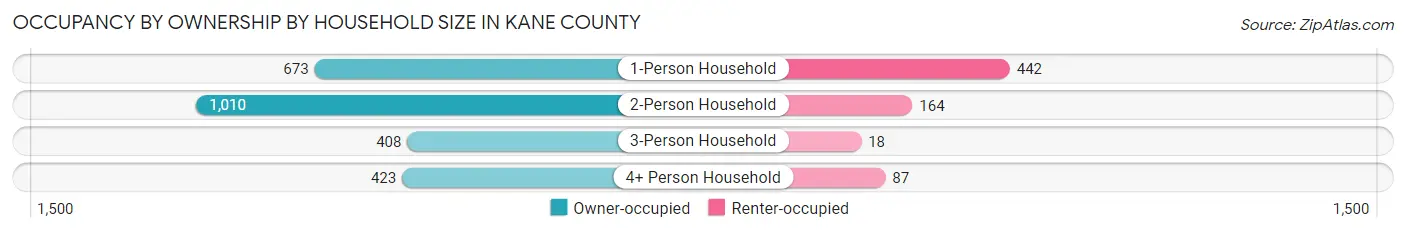
| Household Size | Owner-occupied | Renter-occupied |
| 1-Person Household | 673 (60.4%) | 442 (39.6%) |
| 2-Person Household | 1,010 (86.0%) | 164 (14.0%) |
| 3-Person Household | 408 (95.8%) | 18 (4.2%) |
| 4+ Person Household | 423 (82.9%) | 87 (17.1%) |
| Total Housing Units | 2,514 (77.9%) | 711 (22.1%) |
Occupancy by Educational Attainment in Kane County
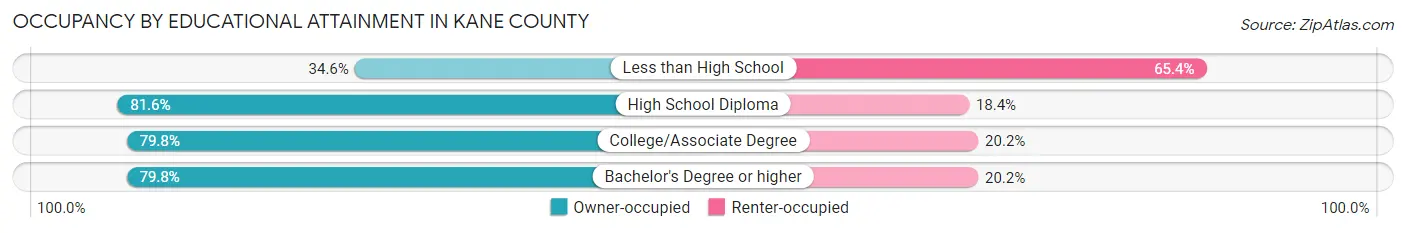
| Household Size | Owner-occupied | Renter-occupied |
| Less than High School | 56 (34.6%) | 106 (65.4%) |
| High School Diploma | 630 (81.6%) | 142 (18.4%) |
| College/Associate Degree | 876 (79.8%) | 222 (20.2%) |
| Bachelor's Degree or higher | 952 (79.8%) | 241 (20.2%) |
Occupancy by Age of Householder in Kane County
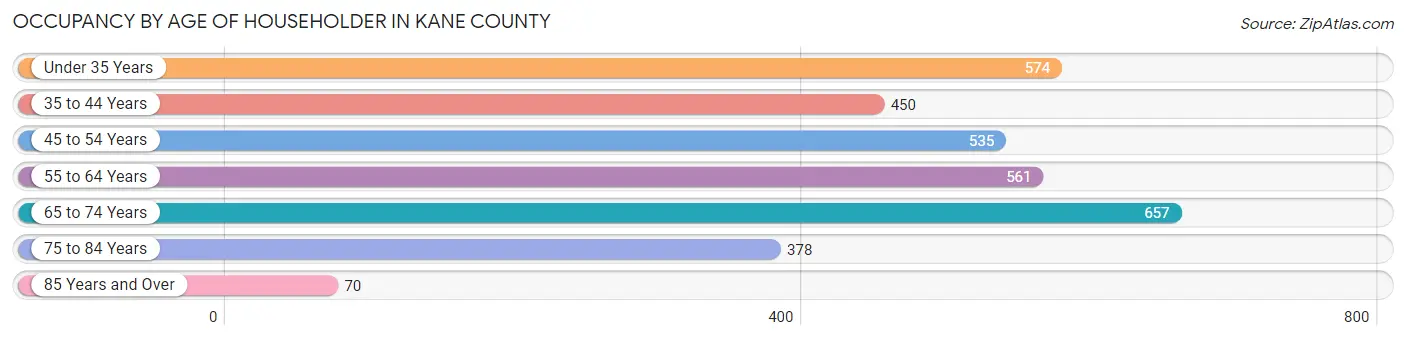
| Age Bracket | # Households | % Households |
| Under 35 Years | 574 | 17.8% |
| 35 to 44 Years | 450 | 14.0% |
| 45 to 54 Years | 535 | 16.6% |
| 55 to 64 Years | 561 | 17.4% |
| 65 to 74 Years | 657 | 20.4% |
| 75 to 84 Years | 378 | 11.7% |
| 85 Years and Over | 70 | 2.2% |
| Total | 3,225 | 100.0% |
Housing Finances in Kane County
Median Income by Occupancy in Kane County
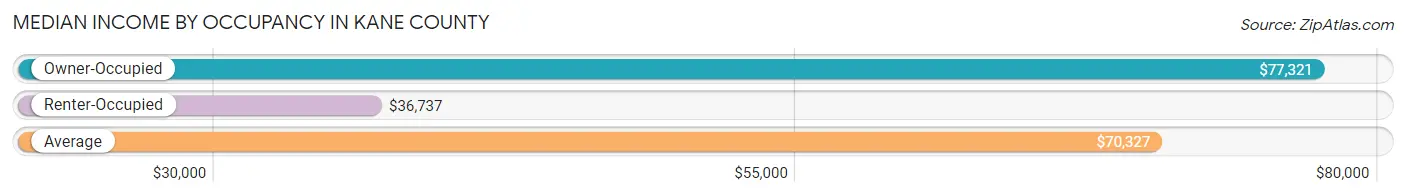
| Occupancy Type | # Households | Median Income |
| Owner-Occupied | 2,514 (77.9%) | $77,321 |
| Renter-Occupied | 711 (22.1%) | $36,737 |
| Average | 3,225 (100.0%) | $70,327 |
Occupancy by Householder Income Bracket in Kane County
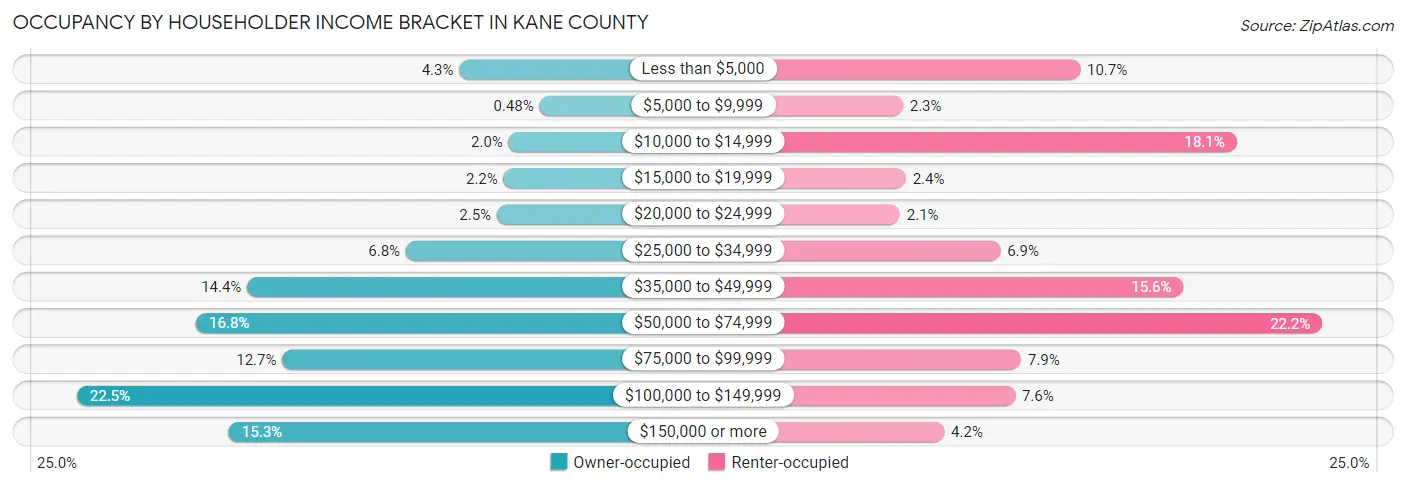
| Income Bracket | Owner-occupied | Renter-occupied |
| Less than $5,000 | 108 (4.3%) | 76 (10.7%) |
| $5,000 to $9,999 | 12 (0.5%) | 16 (2.2%) |
| $10,000 to $14,999 | 49 (1.9%) | 129 (18.1%) |
| $15,000 to $19,999 | 55 (2.2%) | 17 (2.4%) |
| $20,000 to $24,999 | 63 (2.5%) | 15 (2.1%) |
| $25,000 to $34,999 | 172 (6.8%) | 49 (6.9%) |
| $35,000 to $49,999 | 362 (14.4%) | 111 (15.6%) |
| $50,000 to $74,999 | 423 (16.8%) | 158 (22.2%) |
| $75,000 to $99,999 | 320 (12.7%) | 56 (7.9%) |
| $100,000 to $149,999 | 566 (22.5%) | 54 (7.6%) |
| $150,000 or more | 384 (15.3%) | 30 (4.2%) |
| Total | 2,514 (100.0%) | 711 (100.0%) |
Monthly Housing Cost Tiers in Kane County
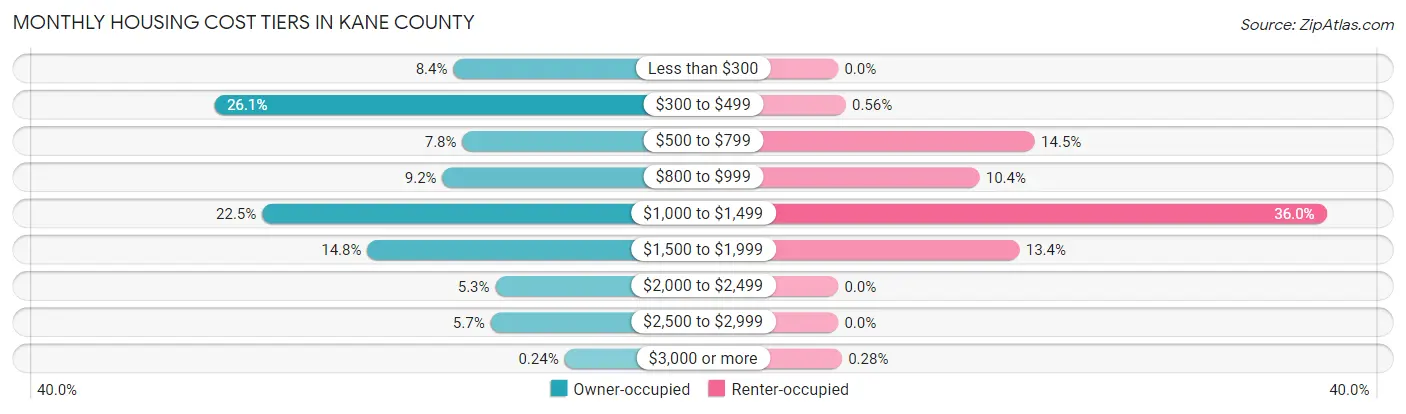
| Monthly Cost | Owner-occupied | Renter-occupied |
| Less than $300 | 212 (8.4%) | 0 (0.0%) |
| $300 to $499 | 655 (26.1%) | 4 (0.6%) |
| $500 to $799 | 195 (7.8%) | 103 (14.5%) |
| $800 to $999 | 232 (9.2%) | 74 (10.4%) |
| $1,000 to $1,499 | 566 (22.5%) | 256 (36.0%) |
| $1,500 to $1,999 | 371 (14.8%) | 95 (13.4%) |
| $2,000 to $2,499 | 134 (5.3%) | 0 (0.0%) |
| $2,500 to $2,999 | 143 (5.7%) | 0 (0.0%) |
| $3,000 or more | 6 (0.2%) | 2 (0.3%) |
| Total | 2,514 (100.0%) | 711 (100.0%) |
Physical Housing Characteristics in Kane County
Housing Structures in Kane County
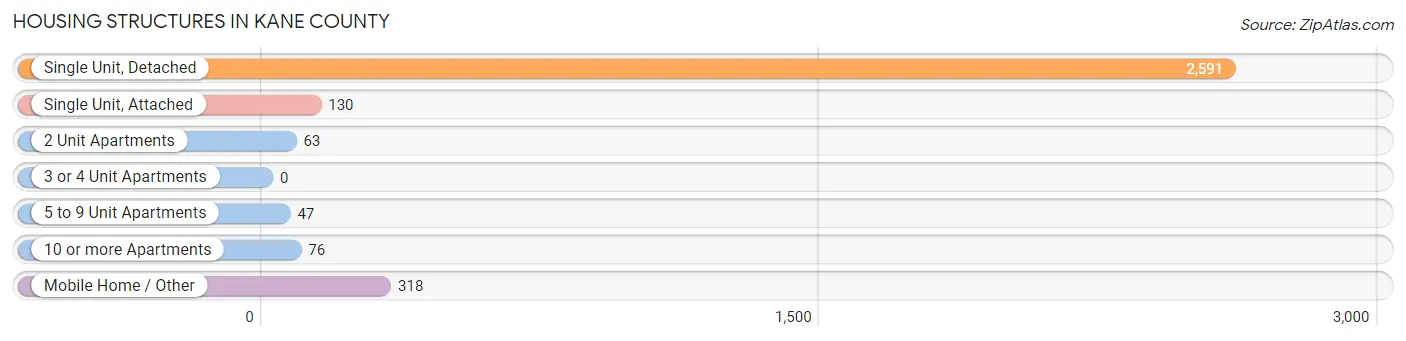
| Structure Type | # Housing Units | % Housing Units |
| Single Unit, Detached | 2,591 | 80.3% |
| Single Unit, Attached | 130 | 4.0% |
| 2 Unit Apartments | 63 | 1.9% |
| 3 or 4 Unit Apartments | 0 | 0.0% |
| 5 to 9 Unit Apartments | 47 | 1.5% |
| 10 or more Apartments | 76 | 2.4% |
| Mobile Home / Other | 318 | 9.9% |
| Total | 3,225 | 100.0% |
Housing Structures by Occupancy in Kane County
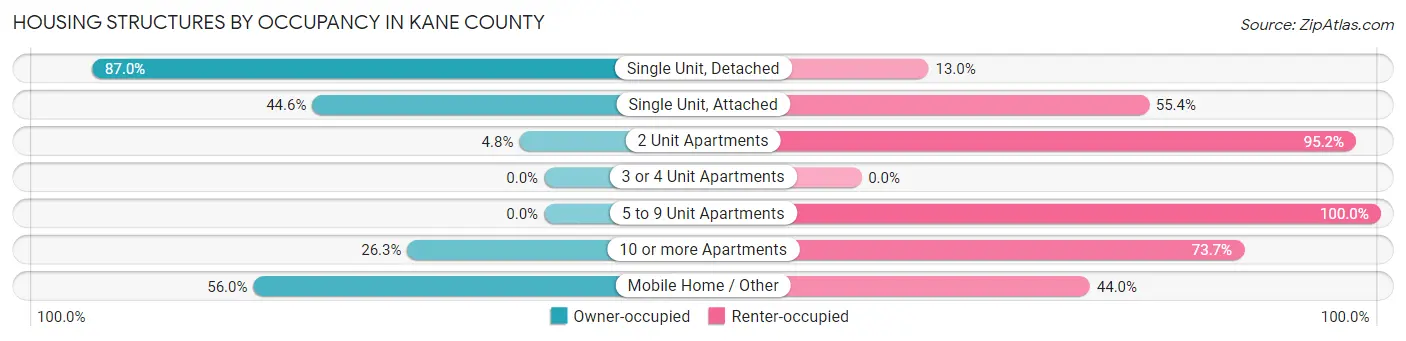
| Structure Type | Owner-occupied | Renter-occupied |
| Single Unit, Detached | 2,255 (87.0%) | 336 (13.0%) |
| Single Unit, Attached | 58 (44.6%) | 72 (55.4%) |
| 2 Unit Apartments | 3 (4.8%) | 60 (95.2%) |
| 3 or 4 Unit Apartments | 0 (0.0%) | 0 (0.0%) |
| 5 to 9 Unit Apartments | 0 (0.0%) | 47 (100.0%) |
| 10 or more Apartments | 20 (26.3%) | 56 (73.7%) |
| Mobile Home / Other | 178 (56.0%) | 140 (44.0%) |
| Total | 2,514 (77.9%) | 711 (22.1%) |
Housing Structures by Number of Rooms in Kane County
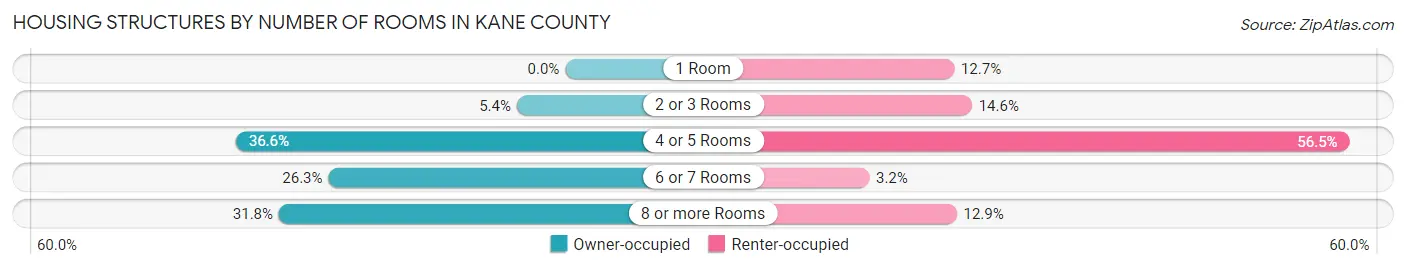
| Number of Rooms | Owner-occupied | Renter-occupied |
| 1 Room | 0 (0.0%) | 90 (12.7%) |
| 2 or 3 Rooms | 135 (5.4%) | 104 (14.6%) |
| 4 or 5 Rooms | 919 (36.6%) | 402 (56.5%) |
| 6 or 7 Rooms | 661 (26.3%) | 23 (3.2%) |
| 8 or more Rooms | 799 (31.8%) | 92 (12.9%) |
| Total | 2,514 (100.0%) | 711 (100.0%) |
Housing Structure by Heating Type in Kane County
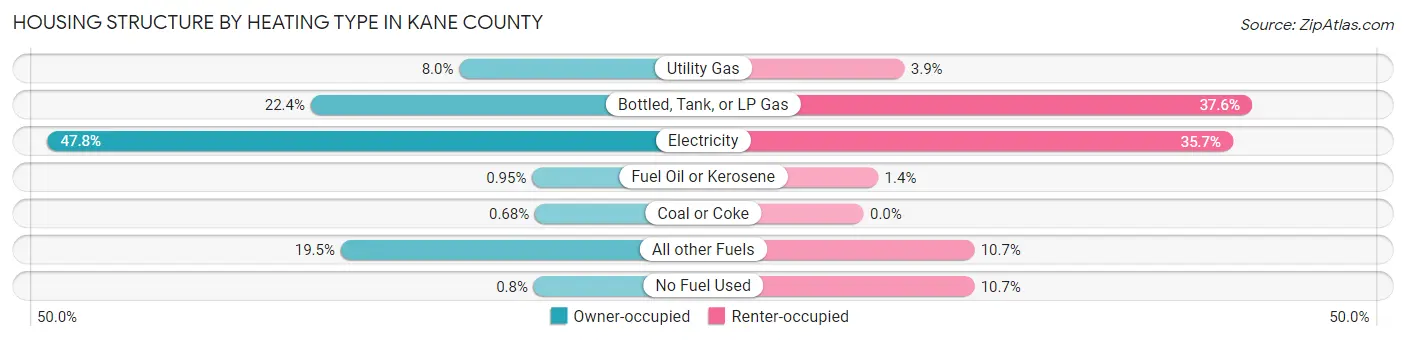
| Heating Type | Owner-occupied | Renter-occupied |
| Utility Gas | 201 (8.0%) | 28 (3.9%) |
| Bottled, Tank, or LP Gas | 562 (22.4%) | 267 (37.6%) |
| Electricity | 1,201 (47.8%) | 254 (35.7%) |
| Fuel Oil or Kerosene | 24 (0.9%) | 10 (1.4%) |
| Coal or Coke | 17 (0.7%) | 0 (0.0%) |
| All other Fuels | 489 (19.5%) | 76 (10.7%) |
| No Fuel Used | 20 (0.8%) | 76 (10.7%) |
| Total | 2,514 (100.0%) | 711 (100.0%) |
Household Vehicle Usage in Kane County
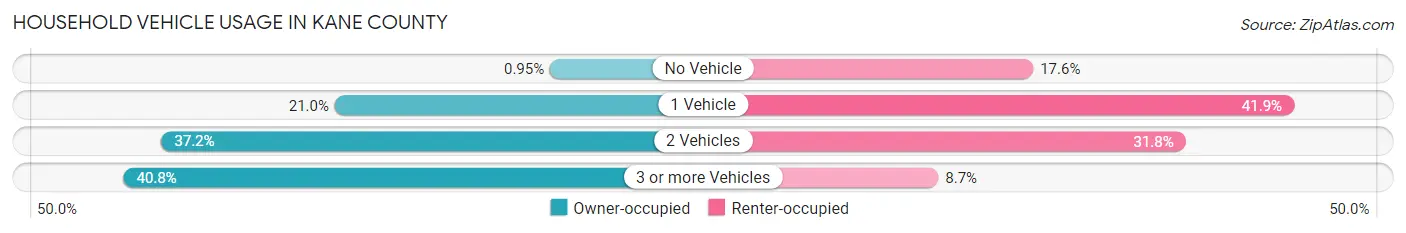
| Vehicles per Household | Owner-occupied | Renter-occupied |
| No Vehicle | 24 (0.9%) | 125 (17.6%) |
| 1 Vehicle | 529 (21.0%) | 298 (41.9%) |
| 2 Vehicles | 936 (37.2%) | 226 (31.8%) |
| 3 or more Vehicles | 1,025 (40.8%) | 62 (8.7%) |
| Total | 2,514 (100.0%) | 711 (100.0%) |
Real Estate & Mortgages in Kane County
Real Estate and Mortgage Overview in Kane County
| Characteristic | Without Mortgage | With Mortgage |
| Housing Units | 1,075 | 1,439 |
| Median Property Value | $330,200 | $286,500 |
| Median Household Income | $70,391 | $229 |
| Monthly Housing Costs | $386 | $6 |
| Real Estate Taxes | $1,408 | $57 |
Property Value by Mortgage Status in Kane County
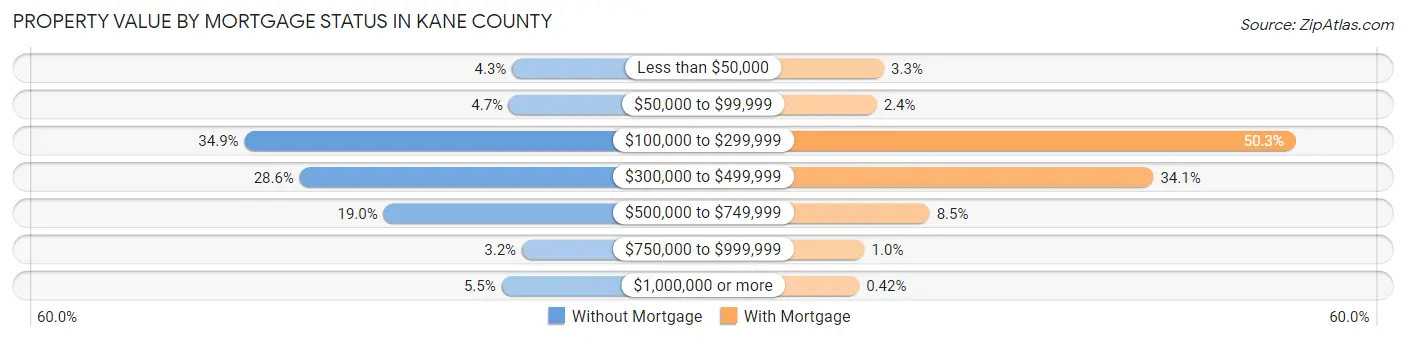
| Property Value | Without Mortgage | With Mortgage |
| Less than $50,000 | 46 (4.3%) | 47 (3.3%) |
| $50,000 to $99,999 | 50 (4.6%) | 35 (2.4%) |
| $100,000 to $299,999 | 375 (34.9%) | 724 (50.3%) |
| $300,000 to $499,999 | 307 (28.6%) | 490 (34.1%) |
| $500,000 to $749,999 | 204 (19.0%) | 122 (8.5%) |
| $750,000 to $999,999 | 34 (3.2%) | 15 (1.0%) |
| $1,000,000 or more | 59 (5.5%) | 6 (0.4%) |
| Total | 1,075 (100.0%) | 1,439 (100.0%) |
Household Income by Mortgage Status in Kane County
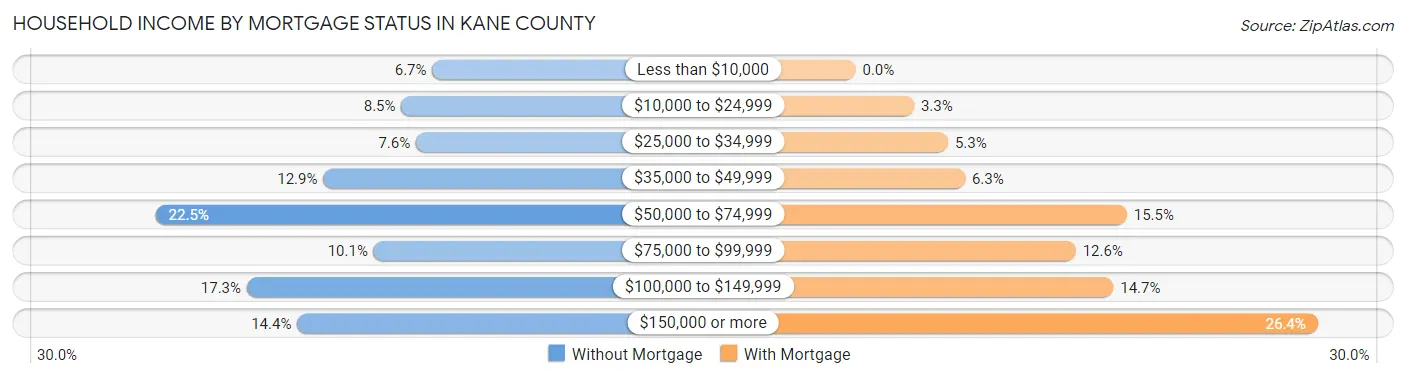
| Household Income | Without Mortgage | With Mortgage |
| Less than $10,000 | 72 (6.7%) | 0 (0.0%) |
| $10,000 to $24,999 | 91 (8.5%) | 48 (3.3%) |
| $25,000 to $34,999 | 82 (7.6%) | 76 (5.3%) |
| $35,000 to $49,999 | 139 (12.9%) | 90 (6.2%) |
| $50,000 to $74,999 | 242 (22.5%) | 223 (15.5%) |
| $75,000 to $99,999 | 108 (10.1%) | 181 (12.6%) |
| $100,000 to $149,999 | 186 (17.3%) | 212 (14.7%) |
| $150,000 or more | 155 (14.4%) | 380 (26.4%) |
| Total | 1,075 (100.0%) | 1,439 (100.0%) |
Property Value to Household Income Ratio in Kane County
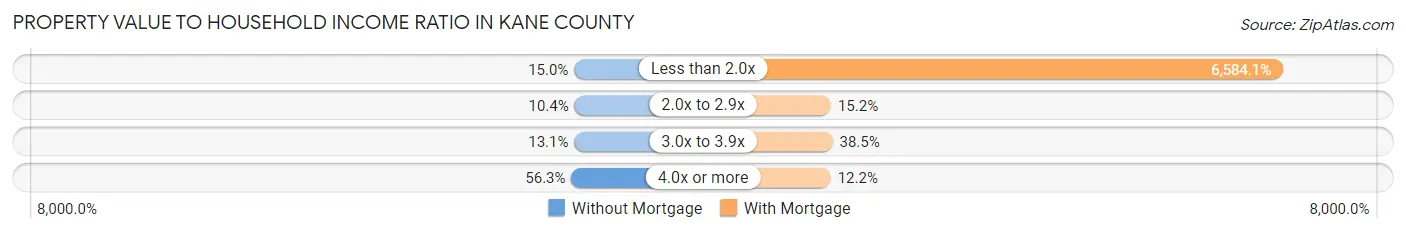
| Value-to-Income Ratio | Without Mortgage | With Mortgage |
| Less than 2.0x | 161 (15.0%) | 94,745 (6,584.1%) |
| 2.0x to 2.9x | 112 (10.4%) | 218 (15.1%) |
| 3.0x to 3.9x | 141 (13.1%) | 554 (38.5%) |
| 4.0x or more | 605 (56.3%) | 175 (12.2%) |
| Total | 1,075 (100.0%) | 1,439 (100.0%) |
Real Estate Taxes by Mortgage Status in Kane County
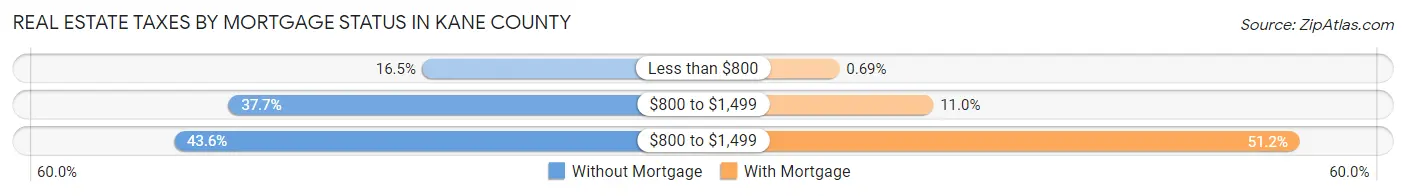
| Property Taxes | Without Mortgage | With Mortgage |
| Less than $800 | 177 (16.5%) | 10 (0.7%) |
| $800 to $1,499 | 405 (37.7%) | 158 (11.0%) |
| $800 to $1,499 | 469 (43.6%) | 736 (51.1%) |
| Total | 1,075 (100.0%) | 1,439 (100.0%) |
Health & Disability in Kane County
Health Insurance Coverage by Age in Kane County
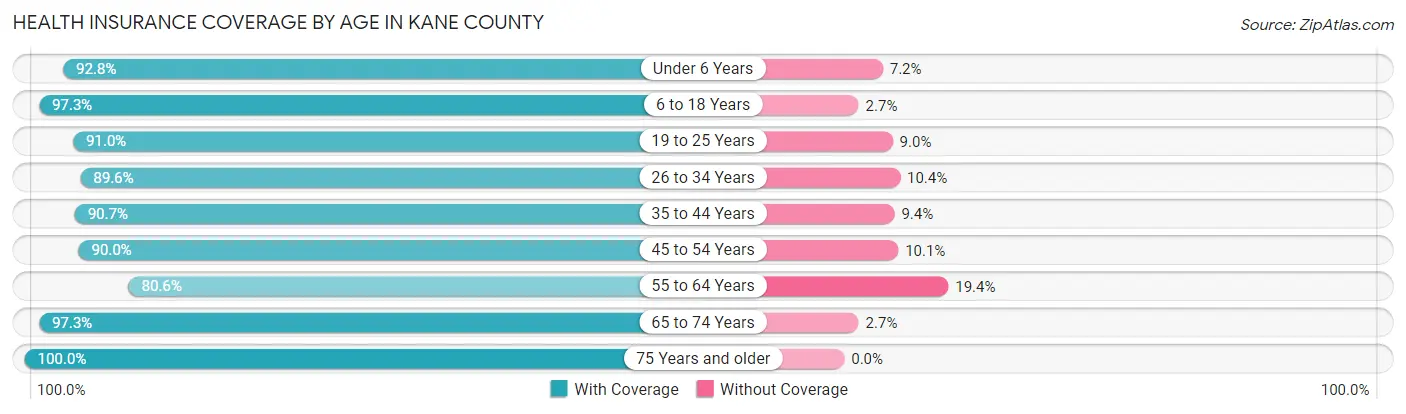
| Age Bracket | With Coverage | Without Coverage |
| Under 6 Years | 491 (92.8%) | 38 (7.2%) |
| 6 to 18 Years | 1,270 (97.3%) | 35 (2.7%) |
| 19 to 25 Years | 333 (91.0%) | 33 (9.0%) |
| 26 to 34 Years | 844 (89.6%) | 98 (10.4%) |
| 35 to 44 Years | 756 (90.6%) | 78 (9.3%) |
| 45 to 54 Years | 662 (89.9%) | 74 (10.1%) |
| 55 to 64 Years | 848 (80.6%) | 204 (19.4%) |
| 65 to 74 Years | 1,127 (97.3%) | 31 (2.7%) |
| 75 Years and older | 687 (100.0%) | 0 (0.0%) |
| Total | 7,018 (92.2%) | 591 (7.8%) |
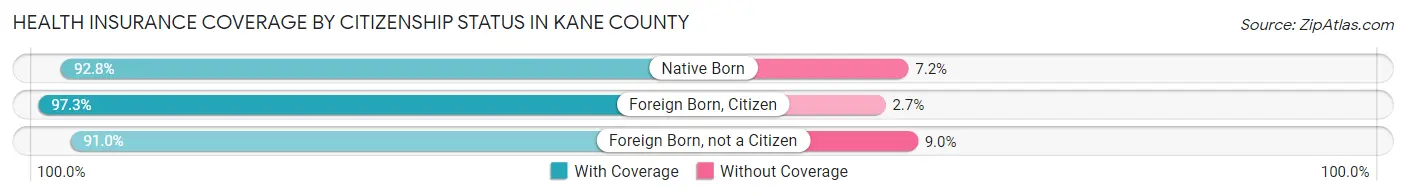
Health Insurance Coverage by Citizenship Status in Kane County
| Citizenship Status | With Coverage | Without Coverage |
| Native Born | 491 (92.8%) | 38 (7.2%) |
| Foreign Born, Citizen | 1,270 (97.3%) | 35 (2.7%) |
| Foreign Born, not a Citizen | 333 (91.0%) | 33 (9.0%) |
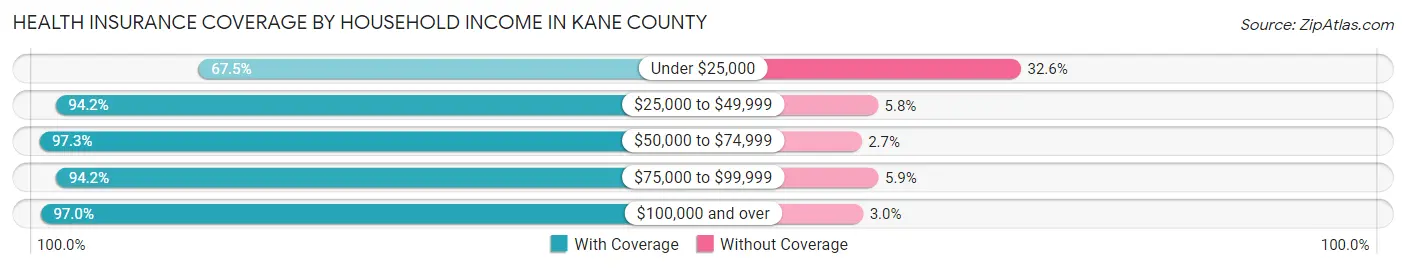
Health Insurance Coverage by Household Income in Kane County
| Household Income | With Coverage | Without Coverage |
| Under $25,000 | 547 (67.4%) | 264 (32.6%) |
| $25,000 to $49,999 | 1,225 (94.2%) | 75 (5.8%) |
| $50,000 to $74,999 | 1,547 (97.3%) | 43 (2.7%) |
| $75,000 to $99,999 | 788 (94.2%) | 49 (5.9%) |
| $100,000 and over | 2,894 (97.0%) | 89 (3.0%) |
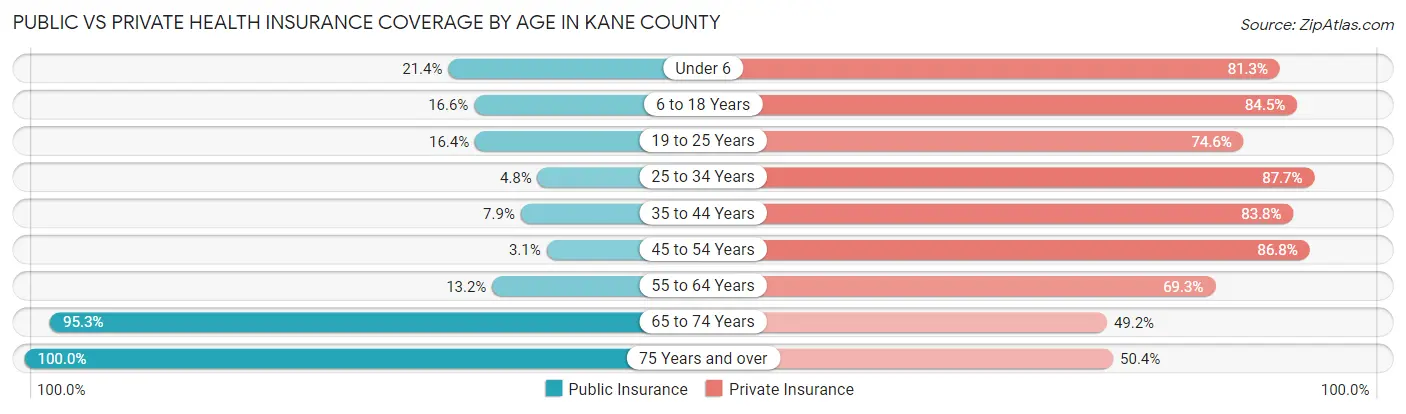
Public vs Private Health Insurance Coverage by Age in Kane County
| Age Bracket | Public Insurance | Private Insurance |
| Under 6 | 113 (21.4%) | 430 (81.3%) |
| 6 to 18 Years | 216 (16.6%) | 1,103 (84.5%) |
| 19 to 25 Years | 60 (16.4%) | 273 (74.6%) |
| 25 to 34 Years | 45 (4.8%) | 826 (87.7%) |
| 35 to 44 Years | 66 (7.9%) | 699 (83.8%) |
| 45 to 54 Years | 23 (3.1%) | 639 (86.8%) |
| 55 to 64 Years | 139 (13.2%) | 729 (69.3%) |
| 65 to 74 Years | 1,103 (95.3%) | 570 (49.2%) |
| 75 Years and over | 687 (100.0%) | 346 (50.4%) |
| Total | 2,452 (32.2%) | 5,615 (73.8%) |
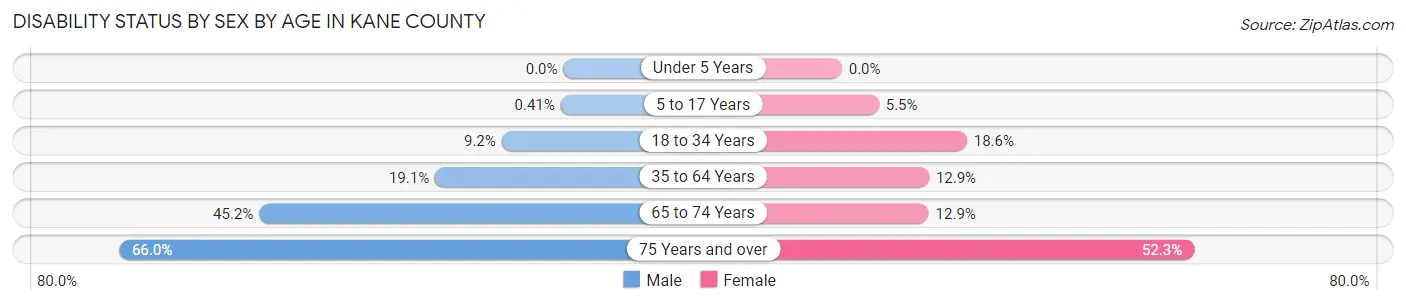
Disability Status by Sex by Age in Kane County
| Age Bracket | Male | Female |
| Under 5 Years | 0 (0.0%) | 0 (0.0%) |
| 5 to 17 Years | 3 (0.4%) | 35 (5.5%) |
| 18 to 34 Years | 56 (9.2%) | 139 (18.6%) |
| 35 to 64 Years | 242 (19.1%) | 175 (12.9%) |
| 65 to 74 Years | 257 (45.2%) | 76 (12.9%) |
| 75 Years and over | 225 (66.0%) | 181 (52.3%) |
Disability Class by Sex by Age in Kane County
Disability Class: Hearing Difficulty
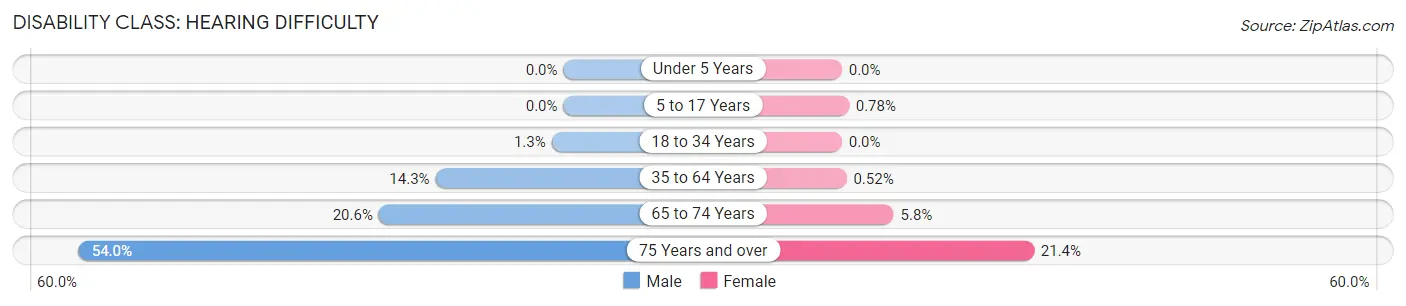
| Age Bracket | Male | Female |
| Under 5 Years | 0 (0.0%) | 0 (0.0%) |
| 5 to 17 Years | 0 (0.0%) | 5 (0.8%) |
| 18 to 34 Years | 8 (1.3%) | 0 (0.0%) |
| 35 to 64 Years | 181 (14.2%) | 7 (0.5%) |
| 65 to 74 Years | 117 (20.6%) | 34 (5.8%) |
| 75 Years and over | 184 (54.0%) | 74 (21.4%) |
Disability Class: Vision Difficulty
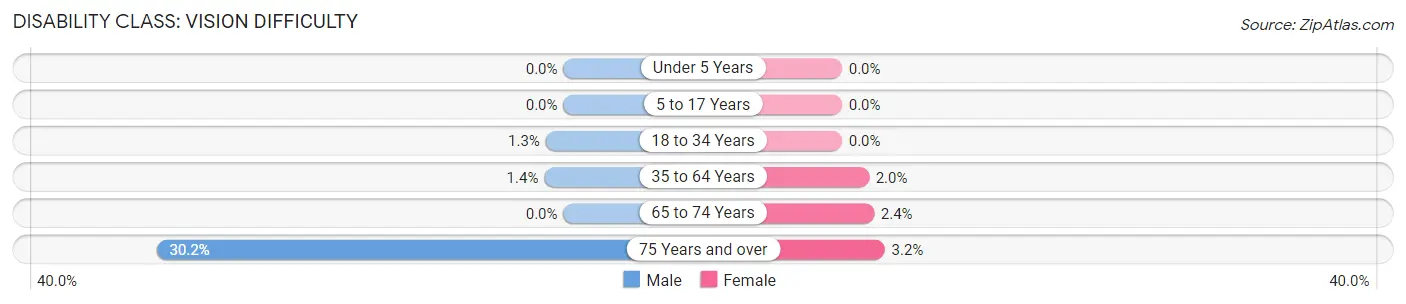
| Age Bracket | Male | Female |
| Under 5 Years | 0 (0.0%) | 0 (0.0%) |
| 5 to 17 Years | 0 (0.0%) | 0 (0.0%) |
| 18 to 34 Years | 8 (1.3%) | 0 (0.0%) |
| 35 to 64 Years | 18 (1.4%) | 27 (2.0%) |
| 65 to 74 Years | 0 (0.0%) | 14 (2.4%) |
| 75 Years and over | 103 (30.2%) | 11 (3.2%) |
Disability Class: Cognitive Difficulty
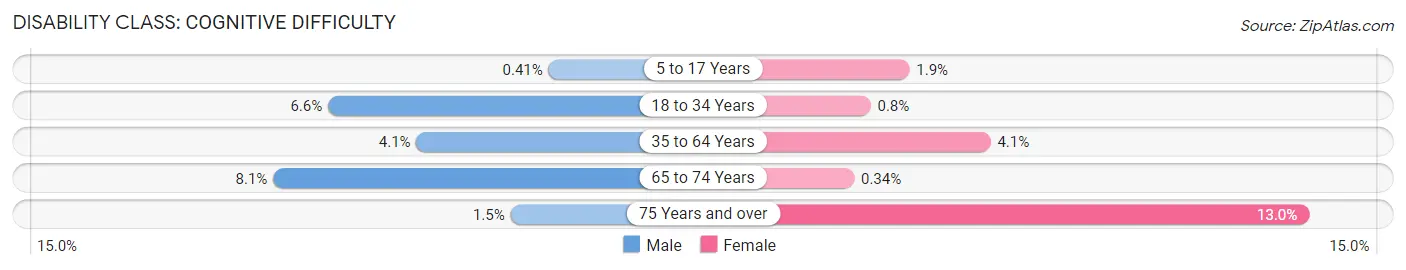
| Age Bracket | Male | Female |
| 5 to 17 Years | 3 (0.4%) | 12 (1.9%) |
| 18 to 34 Years | 40 (6.6%) | 6 (0.8%) |
| 35 to 64 Years | 52 (4.1%) | 56 (4.1%) |
| 65 to 74 Years | 46 (8.1%) | 2 (0.3%) |
| 75 Years and over | 5 (1.5%) | 45 (13.0%) |
Disability Class: Ambulatory Difficulty
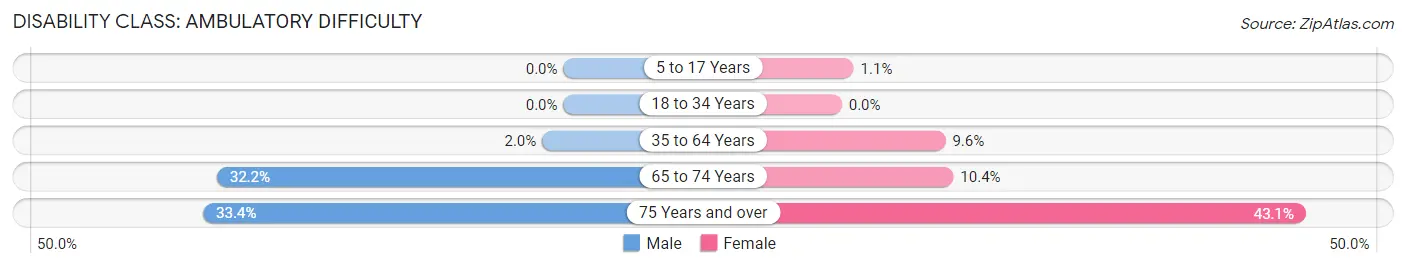
| Age Bracket | Male | Female |
| 5 to 17 Years | 0 (0.0%) | 7 (1.1%) |
| 18 to 34 Years | 0 (0.0%) | 0 (0.0%) |
| 35 to 64 Years | 25 (2.0%) | 130 (9.6%) |
| 65 to 74 Years | 183 (32.2%) | 61 (10.4%) |
| 75 Years and over | 114 (33.4%) | 149 (43.1%) |
Disability Class: Self-Care Difficulty
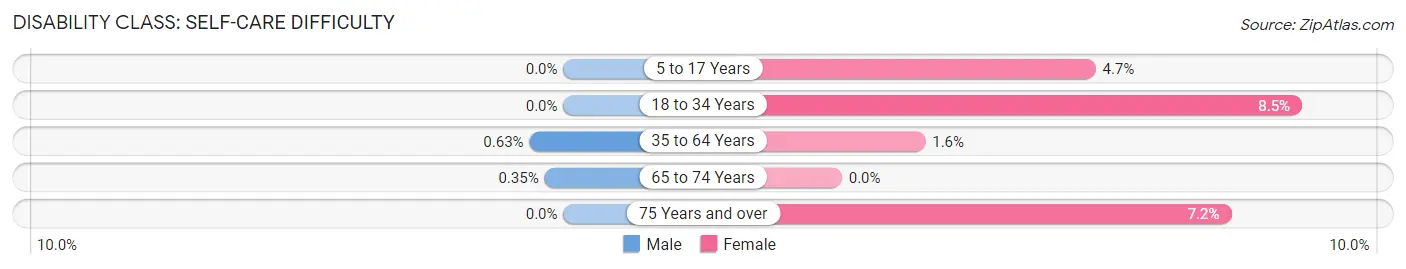
| Age Bracket | Male | Female |
| 5 to 17 Years | 0 (0.0%) | 30 (4.7%) |
| 18 to 34 Years | 0 (0.0%) | 64 (8.5%) |
| 35 to 64 Years | 8 (0.6%) | 21 (1.5%) |
| 65 to 74 Years | 2 (0.4%) | 0 (0.0%) |
| 75 Years and over | 0 (0.0%) | 25 (7.2%) |
Technology Access in Kane County
Computing Device Access in Kane County
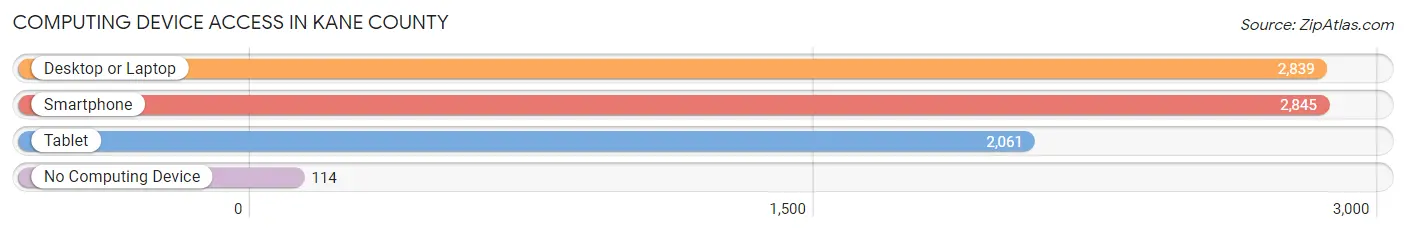
| Device Type | # Households | % Households |
| Desktop or Laptop | 2,839 | 88.0% |
| Smartphone | 2,845 | 88.2% |
| Tablet | 2,061 | 63.9% |
| No Computing Device | 114 | 3.5% |
| Total | 3,225 | 100.0% |
Internet Access in Kane County
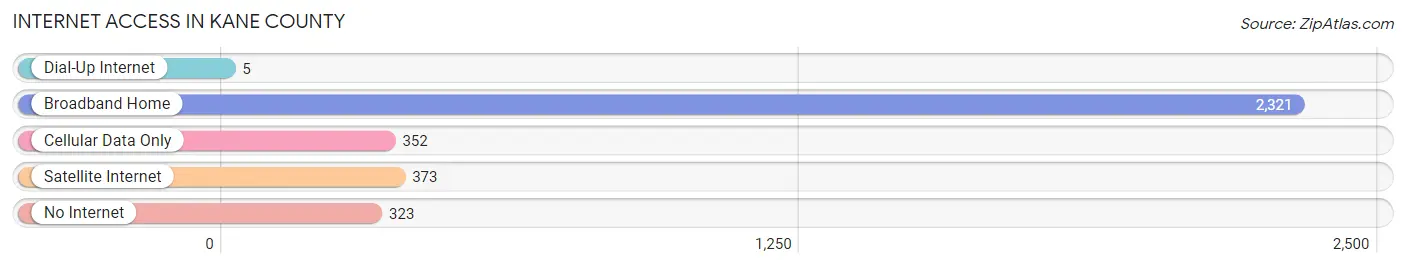
| Internet Type | # Households | % Households |
| Dial-Up Internet | 5 | 0.2% |
| Broadband Home | 2,321 | 72.0% |
| Cellular Data Only | 352 | 10.9% |
| Satellite Internet | 373 | 11.6% |
| No Internet | 323 | 10.0% |
| Total | 3,225 | 100.0% |
Kane County Summary
Kane County is located in the southwestern corner of Utah, and is bordered by the states of Arizona and Nevada. It is the second-largest county in the state, with an area of 4,109 square miles. The county seat is Kanab, and the population was 7,125 at the 2010 census.
Kane County was created in 1864, and was named after Col. Thomas L. Kane, a friend of the Mormon settlers. The county was originally part of Iron County, and was created to provide better access to the Grand Canyon.
Geography
Kane County is located in the Colorado Plateau region of Utah, and is characterized by its rugged terrain and spectacular scenery. The county is home to several national parks and monuments, including Zion National Park, Bryce Canyon National Park, and Grand Staircase-Escalante National Monument. The county is also home to the Grand Canyon-Parashant National Monument, which is managed by the Bureau of Land Management.
The county is divided into two distinct regions: the high plateau and the canyonlands. The high plateau is characterized by its rolling hills and wide open spaces, while the canyonlands are characterized by their deep canyons and dramatic cliffs.
The county is home to several rivers, including the Virgin River, the Escalante River, and the Paria River. The county is also home to several lakes, including Lake Powell, which is the second-largest man-made lake in the United States.
Economy
Kane County is largely rural, and the economy is largely based on agriculture and tourism. The county is home to several large cattle ranches, and the county is also home to several large farms that produce hay, alfalfa, and other crops.
Tourism is a major part of the economy, and the county is home to several national parks and monuments, including Zion National Park, Bryce Canyon National Park, and Grand Staircase-Escalante National Monument. The county is also home to several popular tourist attractions, including the Grand Canyon-Parashant National Monument, Lake Powell, and the Coral Pink Sand Dunes State Park.
Demographics
As of the 2010 census, the population of Kane County was 7,125. The population was spread out, with 24.3% under the age of 18, 8.2% from 18 to 24, 24.3% from 25 to 44, 28.2% from 45 to 64, and 14.0% who were 65 years of age or older. The median age was 40.4 years.
The racial makeup of the county was 94.2% White, 0.3% African American, 0.7% Native American, 0.3% Asian, 0.1% Pacific Islander, 2.7% from other races, and 1.7% from two or more races. Hispanic or Latino of any race were 6.2% of the population.
The median income for a household in the county was $41,945, and the median income for a family was $48,958. Males had a median income of $37,917 versus $25,917 for females. The per capita income for the county was $20,945. About 8.2% of families and 11.2% of the population were below the poverty line, including 14.2% of those under age 18 and 6.2% of those age 65 or over.
Common Questions
What is the Total Population of Kane County?
Total Population of Kane County is 7,814.
What is the Total Male Population of Kane County?
Total Male Population of Kane County is 3,897.
What is the Total Female Population of Kane County?
Total Female Population of Kane County is 3,917.
What is the Ratio of Males per 100 Females in Kane County?
There are 99.49 Males per 100 Females in Kane County.
What is the Ratio of Females per 100 Males in Kane County?
There are 100.51 Females per 100 Males in Kane County.
What is the Median Population Age in Kane County?
Median Population Age in Kane County is 42.9 Years.
What is the Average Family Size in Kane County
Average Family Size in Kane County is 3.0 People.
What is the Average Household Size in Kane County
Average Household Size in Kane County is 2.3 People.
What is Per Capita Income in Kane County?
Per Capita income in Kane County is $36,941.
What is the Median Family Income in Kane County?
Median Family Income in Kane County is $97,132.
What is the Median Household income in Kane County?
Median Household Income in Kane County is $70,327.
What is Income or Wage Gap in Kane County?
Income or Wage Gap in Kane County is 11.3%.
Women in Kane County earn 88.7 cents for every dollar earned by a man.
What is Family Income Deficit in Kane County?
Family Income Deficit in Kane County is $8,819.
Families that are below poverty line in Kane County earn $8,819 less on average than the poverty threshold level.
What is Inequality or Gini Index in Kane County?
Inequality or Gini Index in Kane County is 0.46.
How Large is the Labor Force in Kane County?
There are 3,618 People in the Labor Forcein in Kane County.
What is the Percentage of People in the Labor Force in Kane County?
58.1% of People are in the Labor Force in Kane County.
What is the Unemployment Rate in Kane County?
Unemployment Rate in Kane County is 3.5%.