Juab County, UT
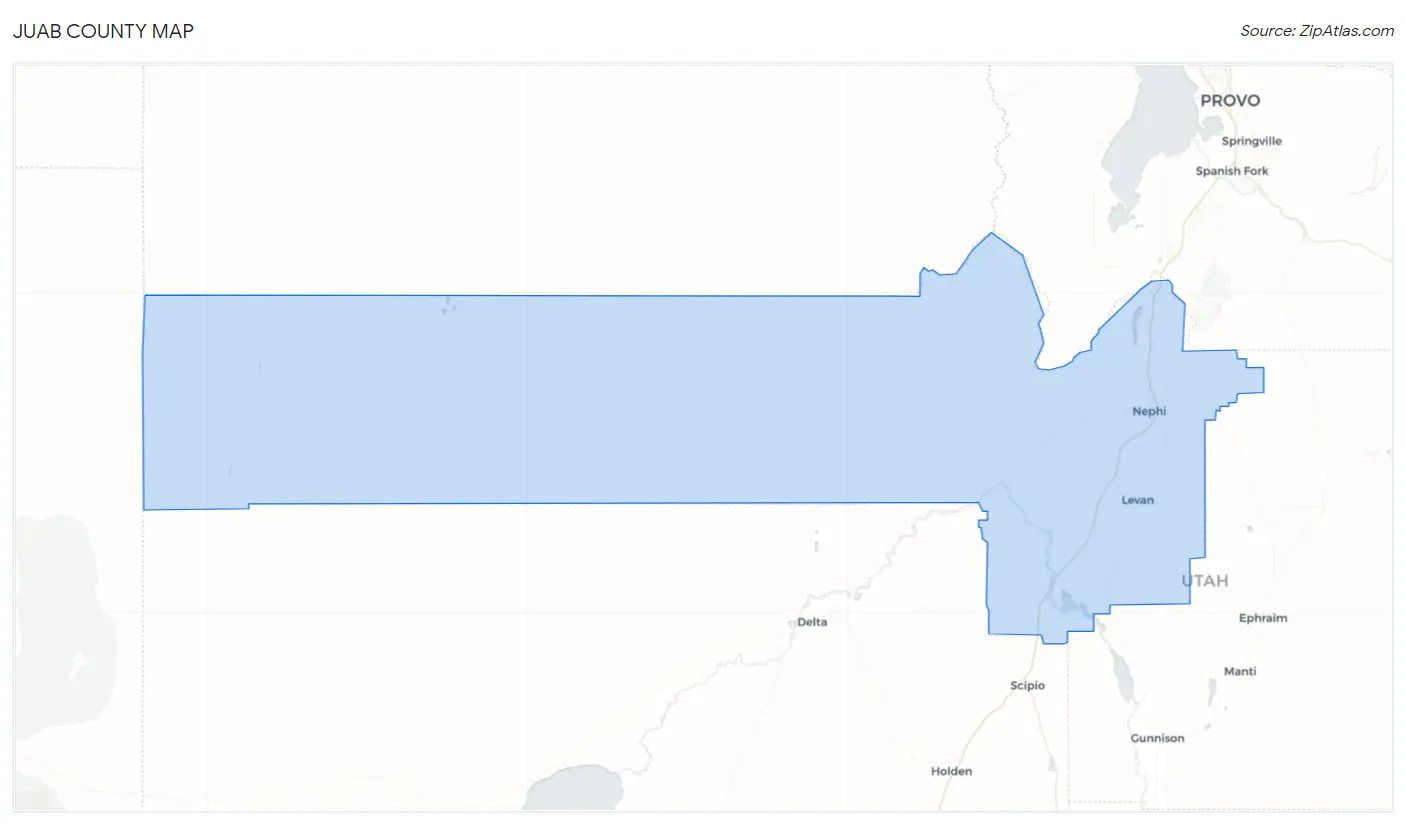
Juab County Map
Juab County Overview
11,943
TOTAL POPULATION
6,287
MALE POPULATION
5,656
FEMALE POPULATION
111.16
MALES / 100 FEMALES
89.96
FEMALES / 100 MALES
30.1
MEDIAN AGE
3.7
AVG FAMILY SIZE
3.3
AVG HOUSEHOLD SIZE
$31,545
PER CAPITA INCOME
$96,812
AVG FAMILY INCOME
$88,048
AVG HOUSEHOLD INCOME
37.7%
WAGE / INCOME GAP [ % ]
62.3¢/ $1
WAGE / INCOME GAP [ $ ]
$10,919
FAMILY INCOME DEFICIT
0.38
INEQUALITY / GINI INDEX
5,605
LABOR FORCE [ PEOPLE ]
66.4%
PERCENT IN LABOR FORCE
1.9%
UNEMPLOYMENT RATE
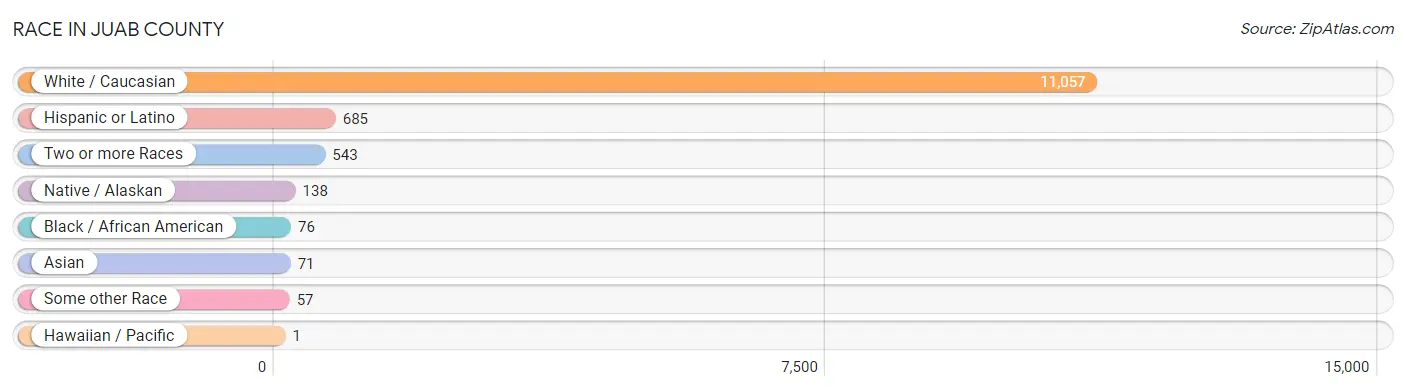
Race in Juab County
The most populous races in Juab County are White / Caucasian (11,057 | 92.6%), Hispanic or Latino (685 | 5.7%), and Two or more Races (543 | 4.5%).
| Race | # Population | % Population |
| Asian | 71 | 0.6% |
| Black / African American | 76 | 0.6% |
| Hawaiian / Pacific | 1 | 0.0% |
| Hispanic or Latino | 685 | 5.7% |
| Native / Alaskan | 138 | 1.2% |
| White / Caucasian | 11,057 | 92.6% |
| Two or more Races | 543 | 4.5% |
| Some other Race | 57 | 0.5% |
| Total | 11,943 | 100.0% |
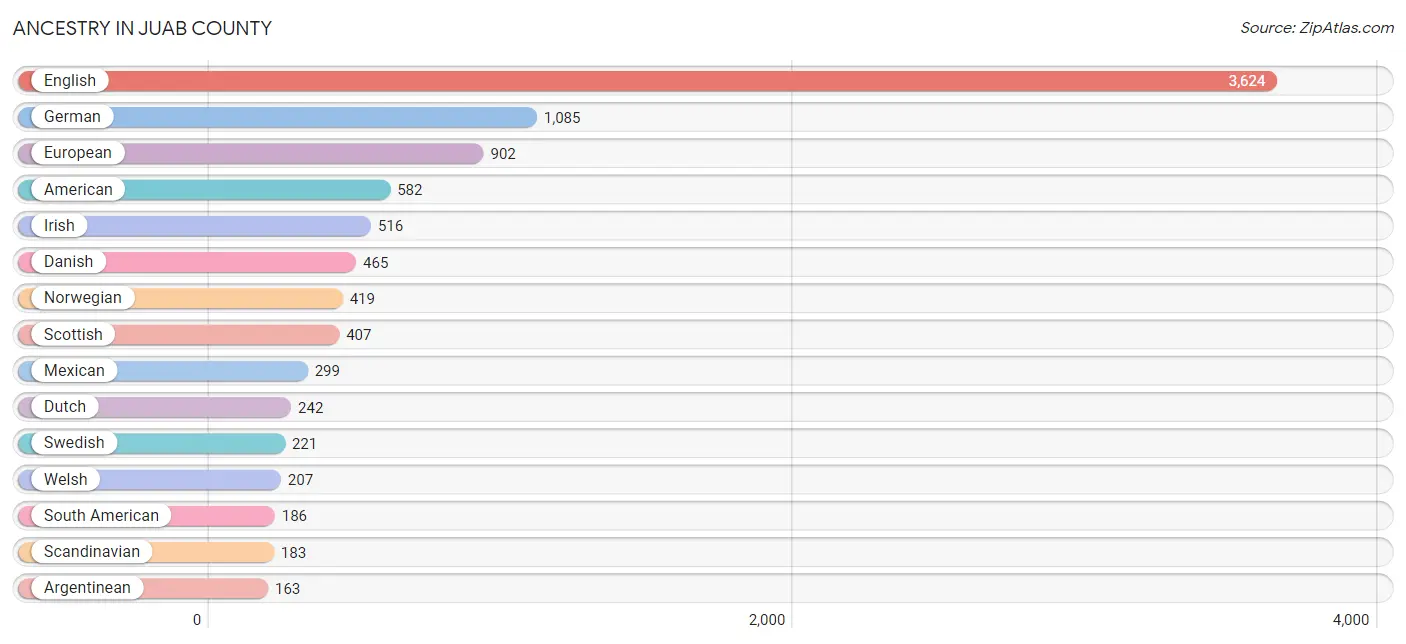
Ancestry in Juab County
The most populous ancestries reported in Juab County are English (3,624 | 30.3%), German (1,085 | 9.1%), European (902 | 7.5%), American (582 | 4.9%), and Irish (516 | 4.3%), together accounting for 56.2% of all Juab County residents.
| Ancestry | # Population | % Population |
| American | 582 | 4.9% |
| Arapaho | 3 | 0.0% |
| Argentinean | 163 | 1.4% |
| Austrian | 4 | 0.0% |
| Belgian | 53 | 0.4% |
| Bhutanese | 75 | 0.6% |
| British | 153 | 1.3% |
| Canadian | 51 | 0.4% |
| Central American | 12 | 0.1% |
| Chickasaw | 8 | 0.1% |
| Czech | 26 | 0.2% |
| Danish | 465 | 3.9% |
| Dutch | 242 | 2.0% |
| Ecuadorian | 23 | 0.2% |
| English | 3,624 | 30.3% |
| European | 902 | 7.5% |
| Finnish | 21 | 0.2% |
| French | 114 | 0.9% |
| French Canadian | 6 | 0.1% |
| German | 1,085 | 9.1% |
| Greek | 84 | 0.7% |
| Guatemalan | 6 | 0.1% |
| Honduran | 6 | 0.1% |
| Hopi | 3 | 0.0% |
| Icelander | 24 | 0.2% |
| Irish | 516 | 4.3% |
| Italian | 154 | 1.3% |
| Korean | 95 | 0.8% |
| Lumbee | 36 | 0.3% |
| Mexican | 299 | 2.5% |
| Mexican American Indian | 62 | 0.5% |
| Native Hawaiian | 1 | 0.0% |
| Navajo | 86 | 0.7% |
| Northern European | 100 | 0.8% |
| Norwegian | 419 | 3.5% |
| Paiute | 5 | 0.0% |
| Polish | 34 | 0.3% |
| Portuguese | 4 | 0.0% |
| Pueblo | 7 | 0.1% |
| Russian | 2 | 0.0% |
| Samoan | 5 | 0.0% |
| Scandinavian | 183 | 1.5% |
| Scotch-Irish | 59 | 0.5% |
| Scottish | 407 | 3.4% |
| Shoshone | 26 | 0.2% |
| Sioux | 8 | 0.1% |
| Slavic | 8 | 0.1% |
| South American | 186 | 1.6% |
| Spaniard | 135 | 1.1% |
| Spanish | 34 | 0.3% |
| Spanish American Indian | 7 | 0.1% |
| Swedish | 221 | 1.8% |
| Swiss | 67 | 0.6% |
| Tongan | 1 | 0.0% |
| Ute | 8 | 0.1% |
| Welsh | 207 | 1.7% | View All 56 Rows |
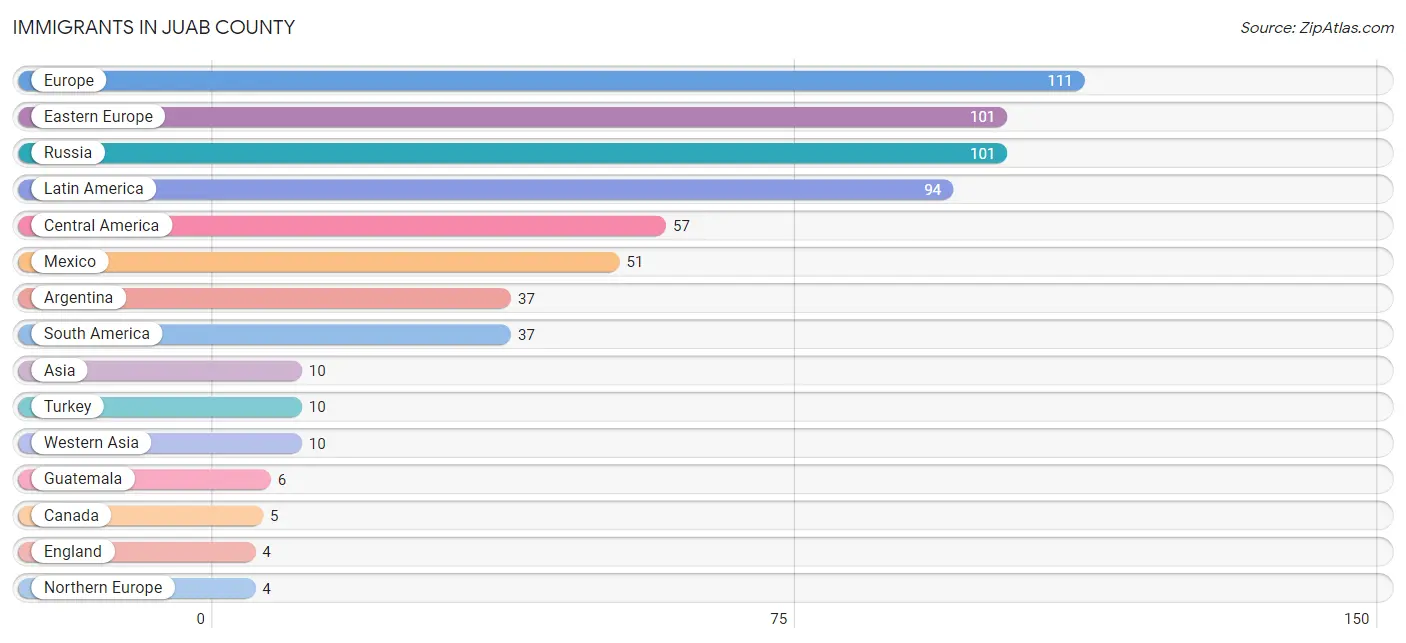
Immigrants in Juab County
The most numerous immigrant groups reported in Juab County came from Europe (111 | 0.9%), Eastern Europe (101 | 0.9%), Russia (101 | 0.9%), Latin America (94 | 0.8%), and Central America (57 | 0.5%), together accounting for 3.9% of all Juab County residents.
| Immigration Origin | # Population | % Population |
| Argentina | 37 | 0.3% |
| Asia | 10 | 0.1% |
| Canada | 5 | 0.0% |
| Central America | 57 | 0.5% |
| Eastern Europe | 101 | 0.9% |
| England | 4 | 0.0% |
| Europe | 111 | 0.9% |
| Germany | 2 | 0.0% |
| Guatemala | 6 | 0.1% |
| Latin America | 94 | 0.8% |
| Mexico | 51 | 0.4% |
| Northern Europe | 4 | 0.0% |
| Oceania | 1 | 0.0% |
| Russia | 101 | 0.9% |
| South America | 37 | 0.3% |
| Turkey | 10 | 0.1% |
| Western Asia | 10 | 0.1% |
| Western Europe | 2 | 0.0% | View All 18 Rows |
Sex and Age in Juab County
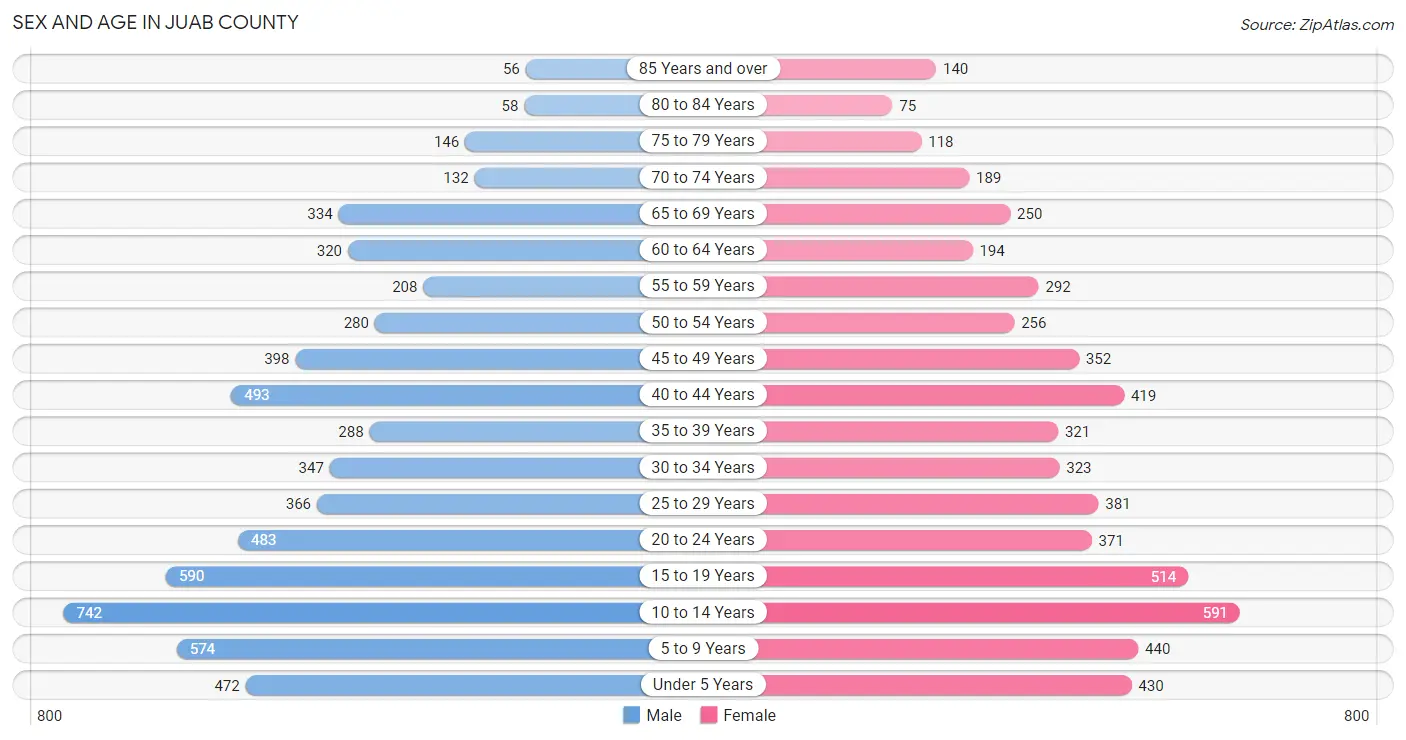
Sex and Age in Juab County
The most populous age groups in Juab County are 10 to 14 Years (742 | 11.8%) for men and 10 to 14 Years (591 | 10.4%) for women.
| Age Bracket | Male | Female |
| Under 5 Years | 472 (7.5%) | 430 (7.6%) |
| 5 to 9 Years | 574 (9.1%) | 440 (7.8%) |
| 10 to 14 Years | 742 (11.8%) | 591 (10.4%) |
| 15 to 19 Years | 590 (9.4%) | 514 (9.1%) |
| 20 to 24 Years | 483 (7.7%) | 371 (6.6%) |
| 25 to 29 Years | 366 (5.8%) | 381 (6.7%) |
| 30 to 34 Years | 347 (5.5%) | 323 (5.7%) |
| 35 to 39 Years | 288 (4.6%) | 321 (5.7%) |
| 40 to 44 Years | 493 (7.8%) | 419 (7.4%) |
| 45 to 49 Years | 398 (6.3%) | 352 (6.2%) |
| 50 to 54 Years | 280 (4.4%) | 256 (4.5%) |
| 55 to 59 Years | 208 (3.3%) | 292 (5.2%) |
| 60 to 64 Years | 320 (5.1%) | 194 (3.4%) |
| 65 to 69 Years | 334 (5.3%) | 250 (4.4%) |
| 70 to 74 Years | 132 (2.1%) | 189 (3.3%) |
| 75 to 79 Years | 146 (2.3%) | 118 (2.1%) |
| 80 to 84 Years | 58 (0.9%) | 75 (1.3%) |
| 85 Years and over | 56 (0.9%) | 140 (2.5%) |
| Total | 6,287 (100.0%) | 5,656 (100.0%) |
Families and Households in Juab County
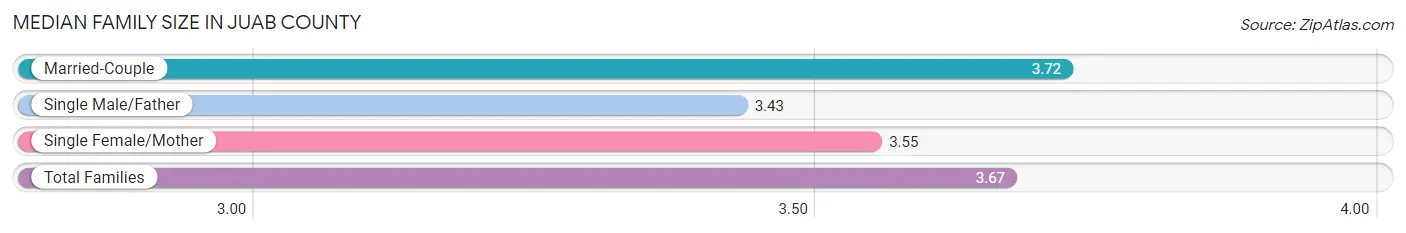
Median Family Size in Juab County
The median family size in Juab County is 3.67 persons per family, with married-couple families (2,423 | 82.0%) accounting for the largest median family size of 3.72 persons per family. On the other hand, single male/father families (264 | 8.9%) represent the smallest median family size with 3.43 persons per family.
| Family Type | # Families | Family Size |
| Married-Couple | 2,423 (82.0%) | 3.72 |
| Single Male/Father | 264 (8.9%) | 3.43 |
| Single Female/Mother | 269 (9.1%) | 3.55 |
| Total Families | 2,956 (100.0%) | 3.67 |
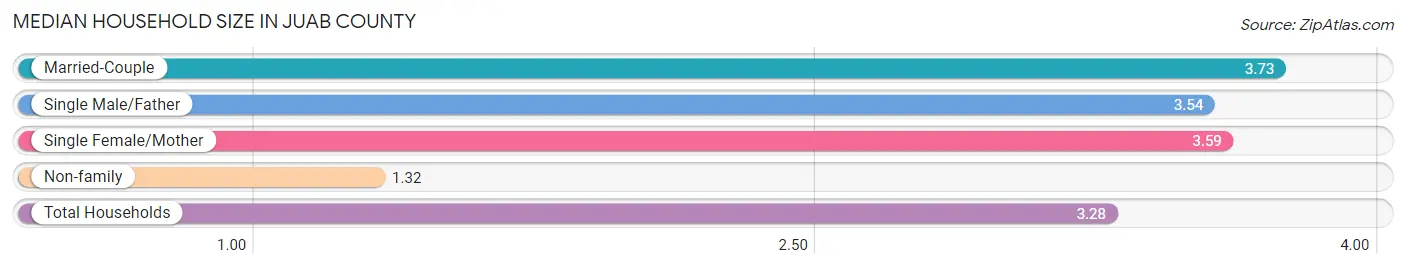
Median Household Size in Juab County
The median household size in Juab County is 3.28 persons per household, with married-couple households (2,423 | 67.4%) accounting for the largest median household size of 3.73 persons per household. non-family households (638 | 17.7%) represent the smallest median household size with 1.32 persons per household.
| Household Type | # Households | Household Size |
| Married-Couple | 2,423 (67.4%) | 3.73 |
| Single Male/Father | 264 (7.3%) | 3.54 |
| Single Female/Mother | 269 (7.5%) | 3.59 |
| Non-family | 638 (17.7%) | 1.32 |
| Total Households | 3,594 (100.0%) | 3.28 |
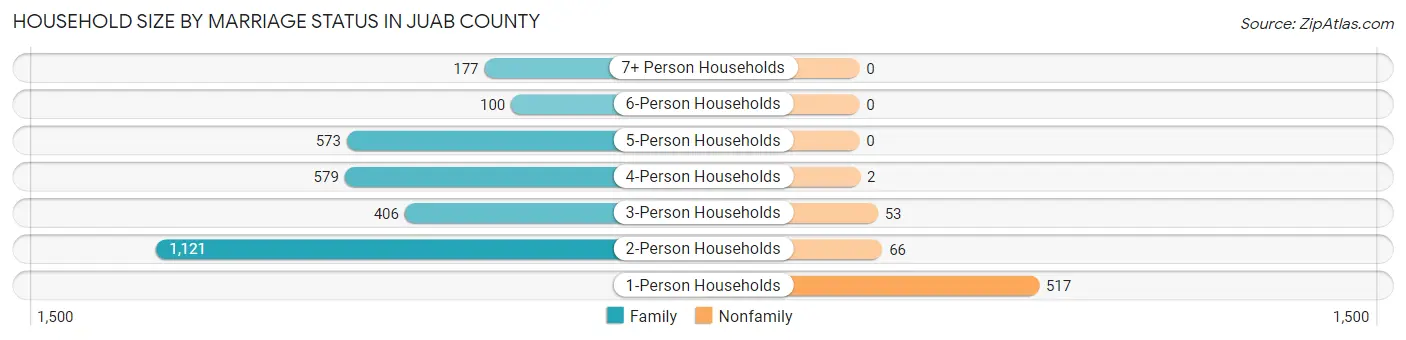
Household Size by Marriage Status in Juab County
Out of a total of 3,594 households in Juab County, 2,956 (82.3%) are family households, while 638 (17.7%) are nonfamily households. The most numerous type of family households are 2-person households, comprising 1,121, and the most common type of nonfamily households are 1-person households, comprising 517.
| Household Size | Family Households | Nonfamily Households |
| 1-Person Households | - | 517 (14.4%) |
| 2-Person Households | 1,121 (31.2%) | 66 (1.8%) |
| 3-Person Households | 406 (11.3%) | 53 (1.5%) |
| 4-Person Households | 579 (16.1%) | 2 (0.1%) |
| 5-Person Households | 573 (15.9%) | 0 (0.0%) |
| 6-Person Households | 100 (2.8%) | 0 (0.0%) |
| 7+ Person Households | 177 (4.9%) | 0 (0.0%) |
| Total | 2,956 (82.3%) | 638 (17.7%) |
Female Fertility in Juab County
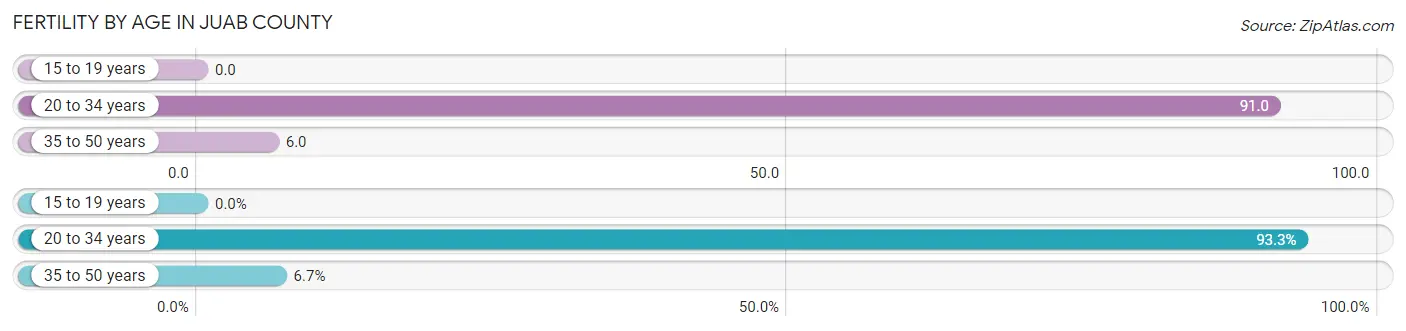
Fertility by Age in Juab County
Average fertility rate in Juab County is 39.0 births per 1,000 women. Women in the age bracket of 20 to 34 years have the highest fertility rate with 91.0 births per 1,000 women. Women in the age bracket of 20 to 34 years acount for 93.3% of all women with births.
| Age Bracket | Women with Births | Births / 1,000 Women |
| 15 to 19 years | 0 (0.0%) | 0.0 |
| 20 to 34 years | 98 (93.3%) | 91.0 |
| 35 to 50 years | 7 (6.7%) | 6.0 |
| Total | 105 (100.0%) | 39.0 |
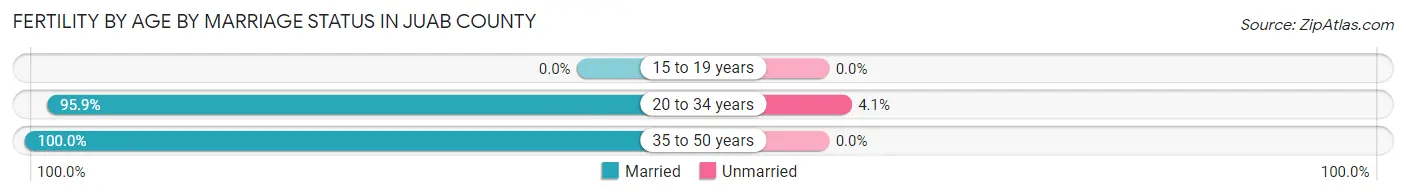
Fertility by Age by Marriage Status in Juab County
96.2% of women with births (105) in Juab County are married. The highest percentage of unmarried women with births falls into 20 to 34 years age bracket with 4.1% of them unmarried at the time of birth, while the lowest percentage of unmarried women with births belong to 35 to 50 years age bracket with 0.0% of them unmarried.
| Age Bracket | Married | Unmarried |
| 15 to 19 years | 0 (0.0%) | 0 (0.0%) |
| 20 to 34 years | 94 (95.9%) | 4 (4.1%) |
| 35 to 50 years | 7 (100.0%) | 0 (0.0%) |
| Total | 101 (96.2%) | 4 (3.8%) |
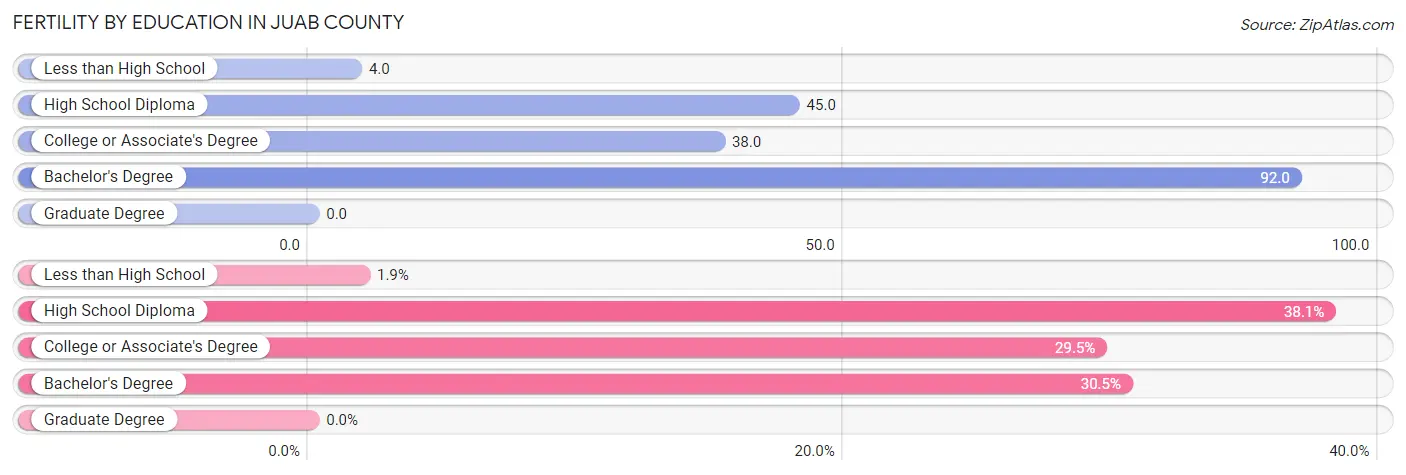
Fertility by Education in Juab County
| Educational Attainment | Women with Births | Births / 1,000 Women |
| Less than High School | 2 (1.9%) | 4.0 |
| High School Diploma | 40 (38.1%) | 45.0 |
| College or Associate's Degree | 31 (29.5%) | 38.0 |
| Bachelor's Degree | 32 (30.5%) | 92.0 |
| Graduate Degree | 0 (0.0%) | 0.0 |
| Total | 105 (100.0%) | 39.0 |
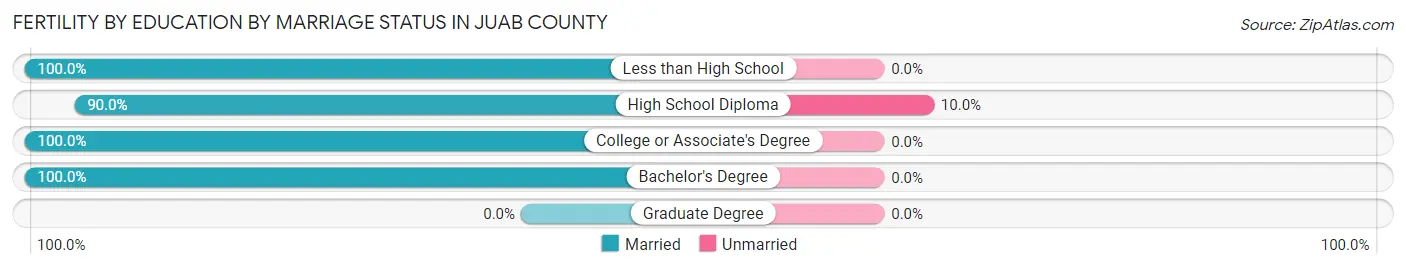
Fertility by Education by Marriage Status in Juab County
3.8% of women with births in Juab County are unmarried. Women with the educational attainment of less than high school are most likely to be married with 100.0% of them married at childbirth, while women with the educational attainment of high school diploma are least likely to be married with 10.0% of them unmarried at childbirth.
| Educational Attainment | Married | Unmarried |
| Less than High School | 2 (100.0%) | 0 (0.0%) |
| High School Diploma | 36 (90.0%) | 4 (10.0%) |
| College or Associate's Degree | 31 (100.0%) | 0 (0.0%) |
| Bachelor's Degree | 32 (100.0%) | 0 (0.0%) |
| Graduate Degree | 0 (0.0%) | 0 (0.0%) |
| Total | 101 (96.2%) | 4 (3.8%) |
Income in Juab County
Income Overview in Juab County
Per Capita Income in Juab County is $31,545, while median incomes of families and households are $96,812 and $88,048 respectively.
| Characteristic | Number | Measure |
| Per Capita Income | 11,943 | $31,545 |
| Median Family Income | 2,956 | $96,812 |
| Mean Family Income | 2,956 | $108,422 |
| Median Household Income | 3,594 | $88,048 |
| Mean Household Income | 3,594 | $99,208 |
| Income Deficit | 2,956 | $10,919 |
| Wage / Income Gap (%) | 11,943 | 37.69% |
| Wage / Income Gap ($) | 11,943 | 62.31¢ per $1 |
| Gini / Inequality Index | 11,943 | 0.38 |
Earnings by Sex in Juab County
Average Earnings in Juab County are $36,311, $50,463 for men and $31,443 for women, a difference of 37.7%.
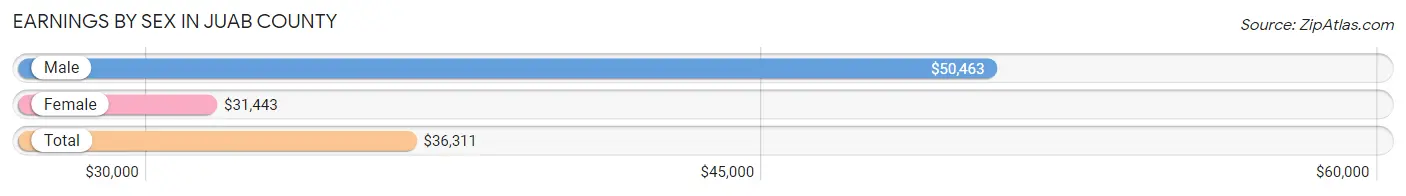
| Sex | Number | Average Earnings |
| Male | 3,208 (53.5%) | $50,463 |
| Female | 2,784 (46.5%) | $31,443 |
| Total | 5,992 (100.0%) | $36,311 |
Earnings by Sex by Income Bracket in Juab County
The most common earnings brackets in Juab County are $100,000+ for men (576 | 18.0%) and $30,000 to $34,999 for women (396 | 14.2%).
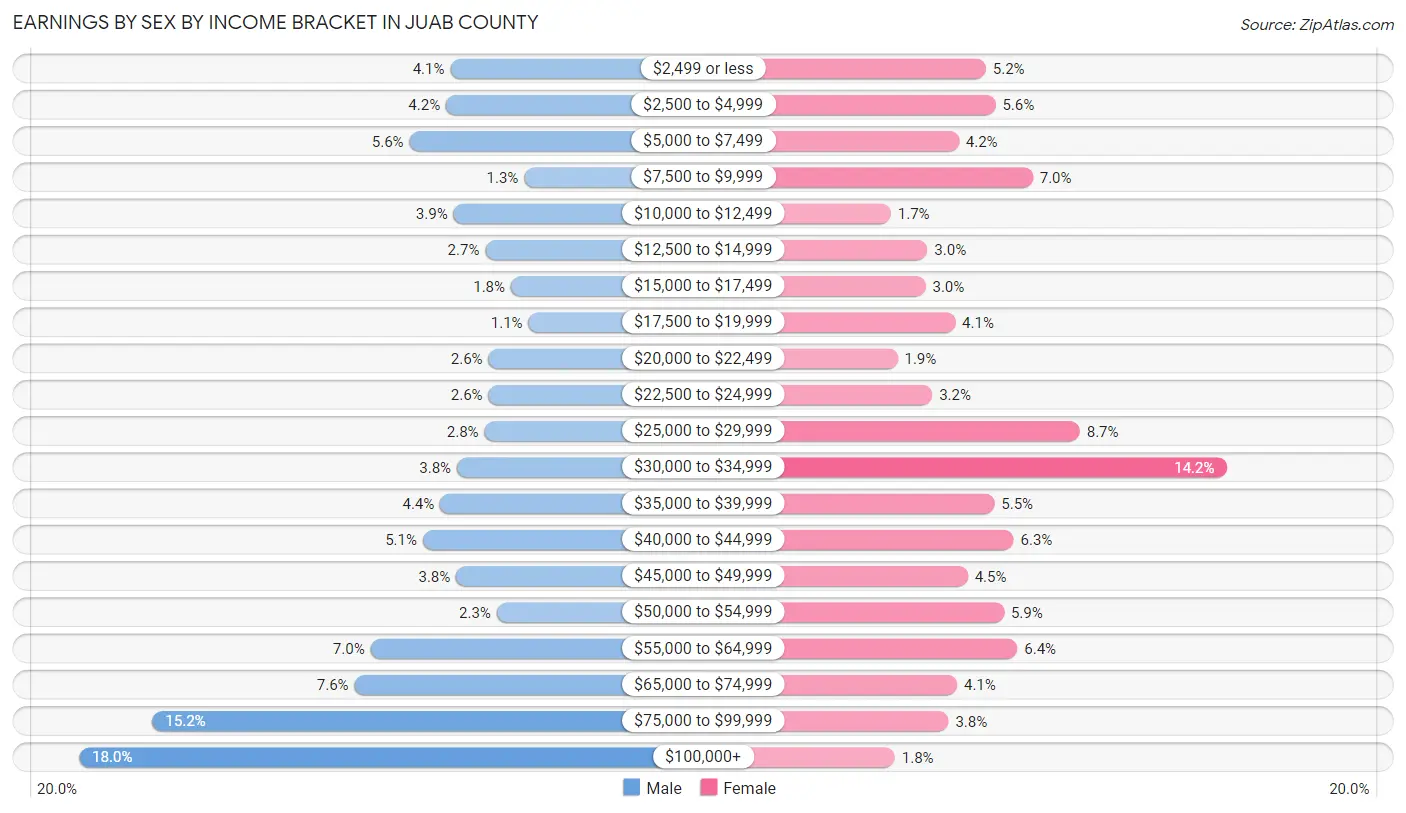
| Income | Male | Female |
| $2,499 or less | 130 (4.1%) | 145 (5.2%) |
| $2,500 to $4,999 | 135 (4.2%) | 155 (5.6%) |
| $5,000 to $7,499 | 179 (5.6%) | 117 (4.2%) |
| $7,500 to $9,999 | 41 (1.3%) | 194 (7.0%) |
| $10,000 to $12,499 | 126 (3.9%) | 46 (1.7%) |
| $12,500 to $14,999 | 88 (2.7%) | 84 (3.0%) |
| $15,000 to $17,499 | 57 (1.8%) | 82 (2.9%) |
| $17,500 to $19,999 | 36 (1.1%) | 113 (4.1%) |
| $20,000 to $22,499 | 84 (2.6%) | 53 (1.9%) |
| $22,500 to $24,999 | 84 (2.6%) | 89 (3.2%) |
| $25,000 to $29,999 | 89 (2.8%) | 243 (8.7%) |
| $30,000 to $34,999 | 122 (3.8%) | 396 (14.2%) |
| $35,000 to $39,999 | 142 (4.4%) | 154 (5.5%) |
| $40,000 to $44,999 | 163 (5.1%) | 174 (6.2%) |
| $45,000 to $49,999 | 123 (3.8%) | 126 (4.5%) |
| $50,000 to $54,999 | 74 (2.3%) | 164 (5.9%) |
| $55,000 to $64,999 | 226 (7.0%) | 178 (6.4%) |
| $65,000 to $74,999 | 245 (7.6%) | 115 (4.1%) |
| $75,000 to $99,999 | 488 (15.2%) | 106 (3.8%) |
| $100,000+ | 576 (18.0%) | 50 (1.8%) |
| Total | 3,208 (100.0%) | 2,784 (100.0%) |
Earnings by Sex by Educational Attainment in Juab County
Average earnings in Juab County are $68,531 for men and $33,588 for women, a difference of 51.0%. Men with an educational attainment of graduate degree enjoy the highest average annual earnings of $102,083, while those with less than high school education earn the least with $42,188. Women with an educational attainment of graduate degree earn the most with the average annual earnings of $61,217, while those with high school diploma education have the smallest earnings of $30,152.
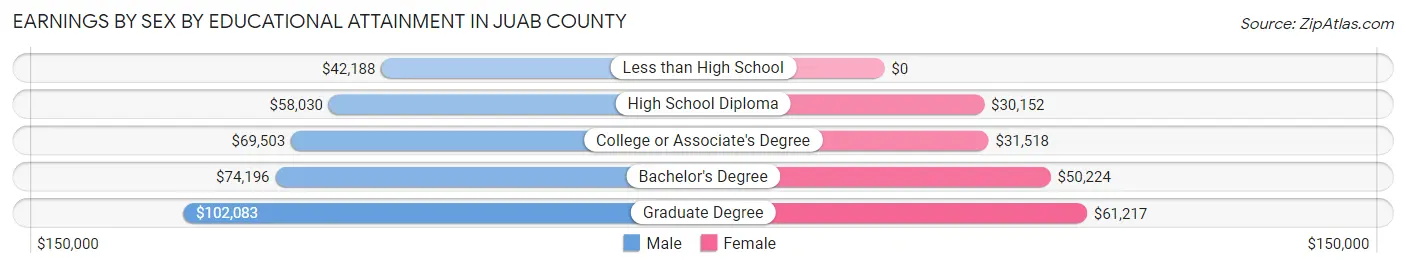
| Educational Attainment | Male Income | Female Income |
| Less than High School | $42,188 | $0 |
| High School Diploma | $58,030 | $30,152 |
| College or Associate's Degree | $69,503 | $31,518 |
| Bachelor's Degree | $74,196 | $50,224 |
| Graduate Degree | $102,083 | $61,217 |
| Total | $68,531 | $33,588 |
Family Income in Juab County
Family Income Brackets in Juab County
According to the Juab County family income data, there are 860 families falling into the $100,000 to $149,999 income range, which is the most common income bracket and makes up 29.1% of all families. Conversely, the $10,000 to $14,999 income bracket is the least frequent group with only 47 families (1.6%) belonging to this category.
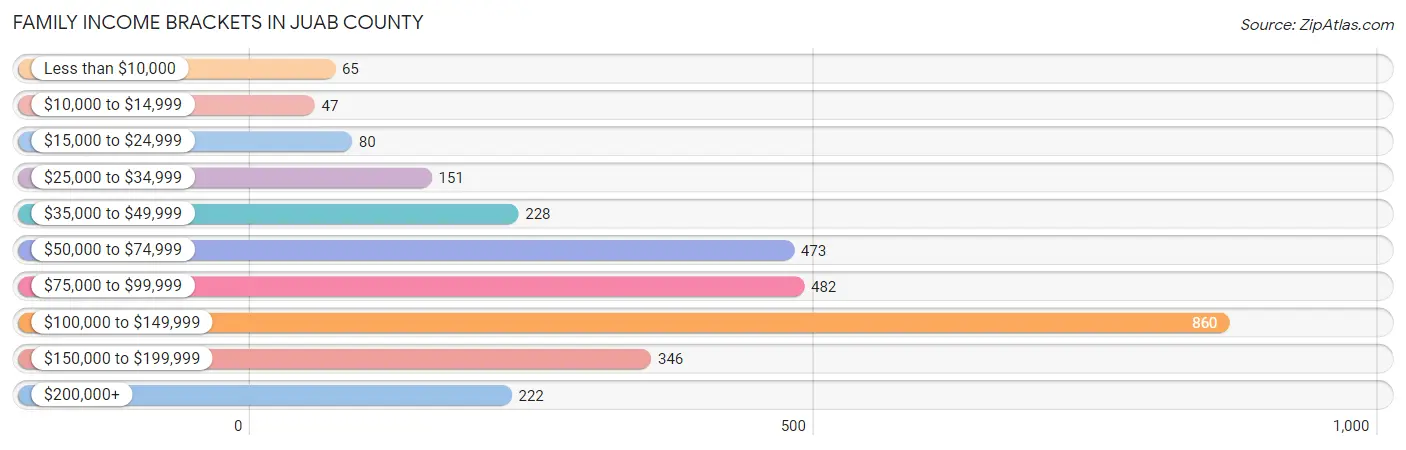
| Income Bracket | # Families | % Families |
| Less than $10,000 | 65 | 2.2% |
| $10,000 to $14,999 | 47 | 1.6% |
| $15,000 to $24,999 | 80 | 2.7% |
| $25,000 to $34,999 | 151 | 5.1% |
| $35,000 to $49,999 | 228 | 7.7% |
| $50,000 to $74,999 | 473 | 16.0% |
| $75,000 to $99,999 | 482 | 16.3% |
| $100,000 to $149,999 | 860 | 29.1% |
| $150,000 to $199,999 | 346 | 11.7% |
| $200,000+ | 222 | 7.5% |
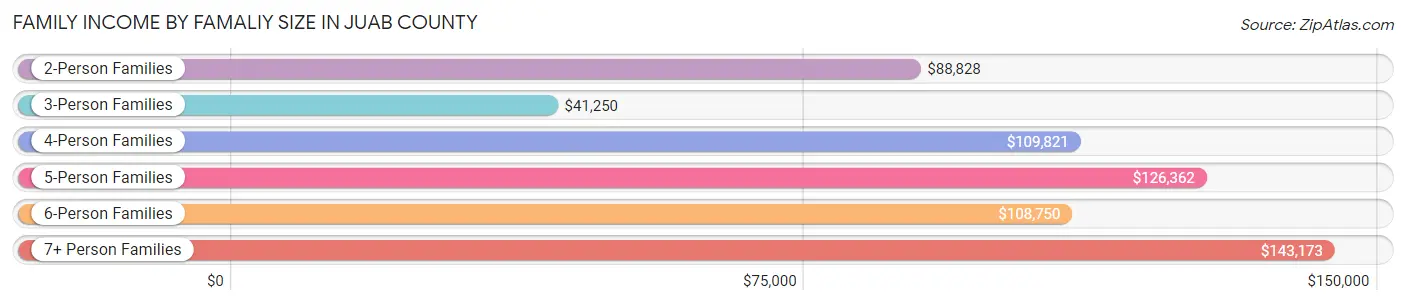
Family Income by Famaliy Size in Juab County
7+ person families (177 | 6.0%) account for the highest median family income in Juab County with $143,173 per family, while 2-person families (1,131 | 38.3%) have the highest median income of $44,414 per family member.
| Income Bracket | # Families | Median Income |
| 2-Person Families | 1,131 (38.3%) | $88,828 |
| 3-Person Families | 431 (14.6%) | $41,250 |
| 4-Person Families | 566 (19.2%) | $109,821 |
| 5-Person Families | 551 (18.6%) | $126,362 |
| 6-Person Families | 100 (3.4%) | $108,750 |
| 7+ Person Families | 177 (6.0%) | $143,173 |
| Total | 2,956 (100.0%) | $96,812 |
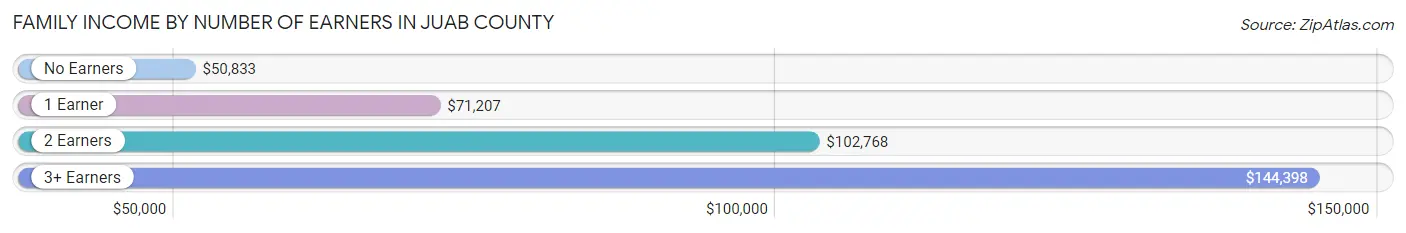
Family Income by Number of Earners in Juab County
The median family income in Juab County is $96,812, with families comprising 3+ earners (601) having the highest median family income of $144,398, while families with no earners (330) have the lowest median family income of $50,833, accounting for 20.3% and 11.2% of families, respectively.
| Number of Earners | # Families | Median Income |
| No Earners | 330 (11.2%) | $50,833 |
| 1 Earner | 788 (26.7%) | $71,207 |
| 2 Earners | 1,237 (41.8%) | $102,768 |
| 3+ Earners | 601 (20.3%) | $144,398 |
| Total | 2,956 (100.0%) | $96,812 |
Household Income in Juab County
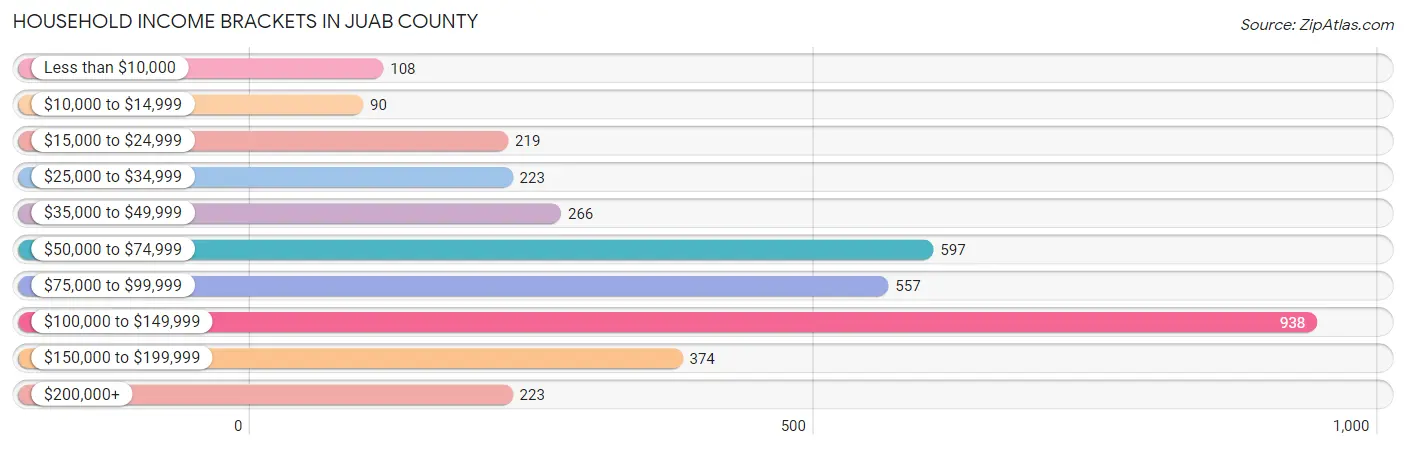
Household Income Brackets in Juab County
With 938 households falling in the category, the $100,000 to $149,999 income range is the most frequent in Juab County, accounting for 26.1% of all households. In contrast, only 90 households (2.5%) fall into the $10,000 to $14,999 income bracket, making it the least populous group.
| Income Bracket | # Households | % Households |
| Less than $10,000 | 108 | 3.0% |
| $10,000 to $14,999 | 90 | 2.5% |
| $15,000 to $24,999 | 219 | 6.1% |
| $25,000 to $34,999 | 223 | 6.2% |
| $35,000 to $49,999 | 266 | 7.4% |
| $50,000 to $74,999 | 597 | 16.6% |
| $75,000 to $99,999 | 557 | 15.5% |
| $100,000 to $149,999 | 938 | 26.1% |
| $150,000 to $199,999 | 374 | 10.4% |
| $200,000+ | 223 | 6.2% |
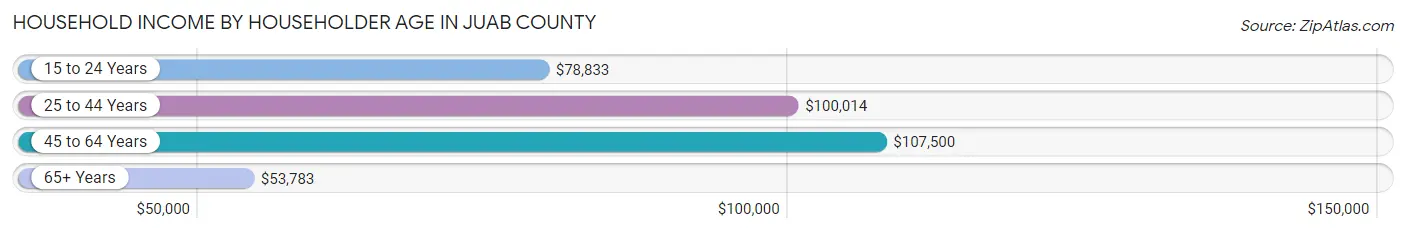
Household Income by Householder Age in Juab County
The median household income in Juab County is $88,048, with the highest median household income of $107,500 found in the 45 to 64 years age bracket for the primary householder. A total of 1,208 households (33.6%) fall into this category. Meanwhile, the 65+ years age bracket for the primary householder has the lowest median household income of $53,783, with 913 households (25.4%) in this group.
| Income Bracket | # Households | Median Income |
| 15 to 24 Years | 102 (2.8%) | $78,833 |
| 25 to 44 Years | 1,371 (38.2%) | $100,014 |
| 45 to 64 Years | 1,208 (33.6%) | $107,500 |
| 65+ Years | 913 (25.4%) | $53,783 |
| Total | 3,594 (100.0%) | $88,048 |
Poverty in Juab County
Income Below Poverty by Sex and Age in Juab County
With 7.0% poverty level for males and 10.3% for females among the residents of Juab County, under 5 year old males and 16 and 17 year old females are the most vulnerable to poverty, with 51 males (10.8%) and 52 females (23.3%) in their respective age groups living below the poverty level.
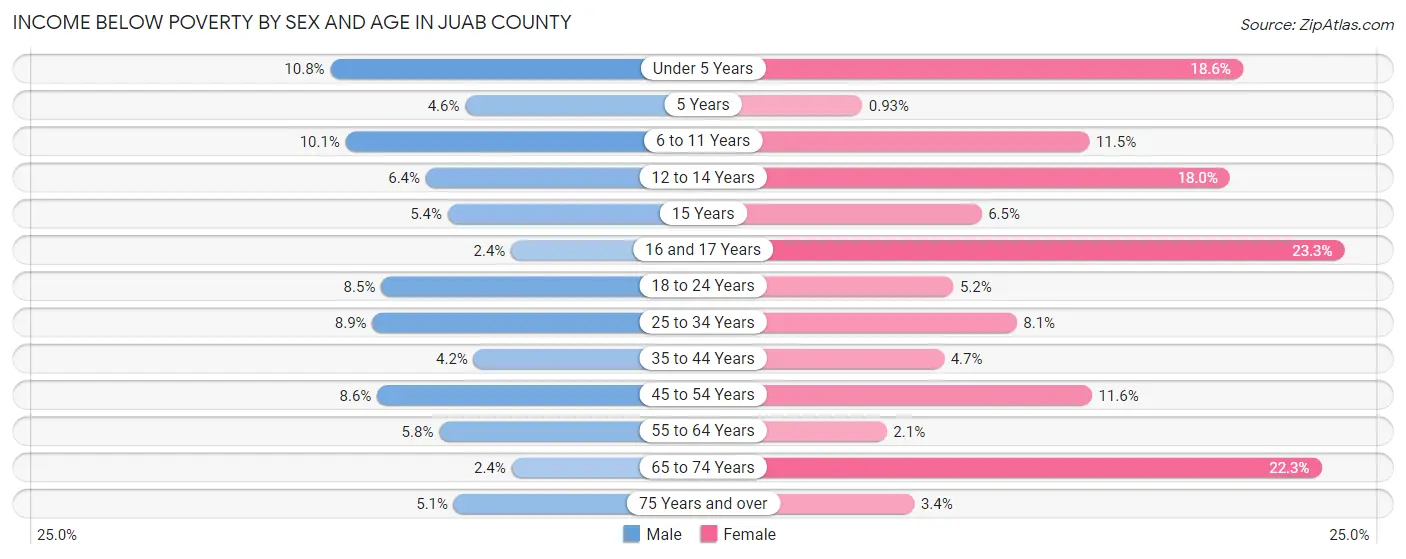
| Age Bracket | Male | Female |
| Under 5 Years | 51 (10.8%) | 80 (18.6%) |
| 5 Years | 3 (4.5%) | 1 (0.9%) |
| 6 to 11 Years | 69 (10.1%) | 57 (11.5%) |
| 12 to 14 Years | 34 (6.4%) | 74 (18.0%) |
| 15 Years | 6 (5.4%) | 9 (6.5%) |
| 16 and 17 Years | 7 (2.4%) | 52 (23.3%) |
| 18 to 24 Years | 55 (8.5%) | 27 (5.2%) |
| 25 to 34 Years | 62 (8.9%) | 57 (8.1%) |
| 35 to 44 Years | 32 (4.2%) | 35 (4.7%) |
| 45 to 54 Years | 56 (8.6%) | 70 (11.6%) |
| 55 to 64 Years | 30 (5.8%) | 10 (2.1%) |
| 65 to 74 Years | 11 (2.4%) | 97 (22.3%) |
| 75 Years and over | 13 (5.1%) | 11 (3.4%) |
| Total | 429 (7.0%) | 580 (10.3%) |
Income Above Poverty by Sex and Age in Juab County
According to the poverty statistics in Juab County, males aged 65 to 74 years and females aged 5 years are the age groups that are most secure financially, with 97.6% of males and 99.1% of females in these age groups living above the poverty line.
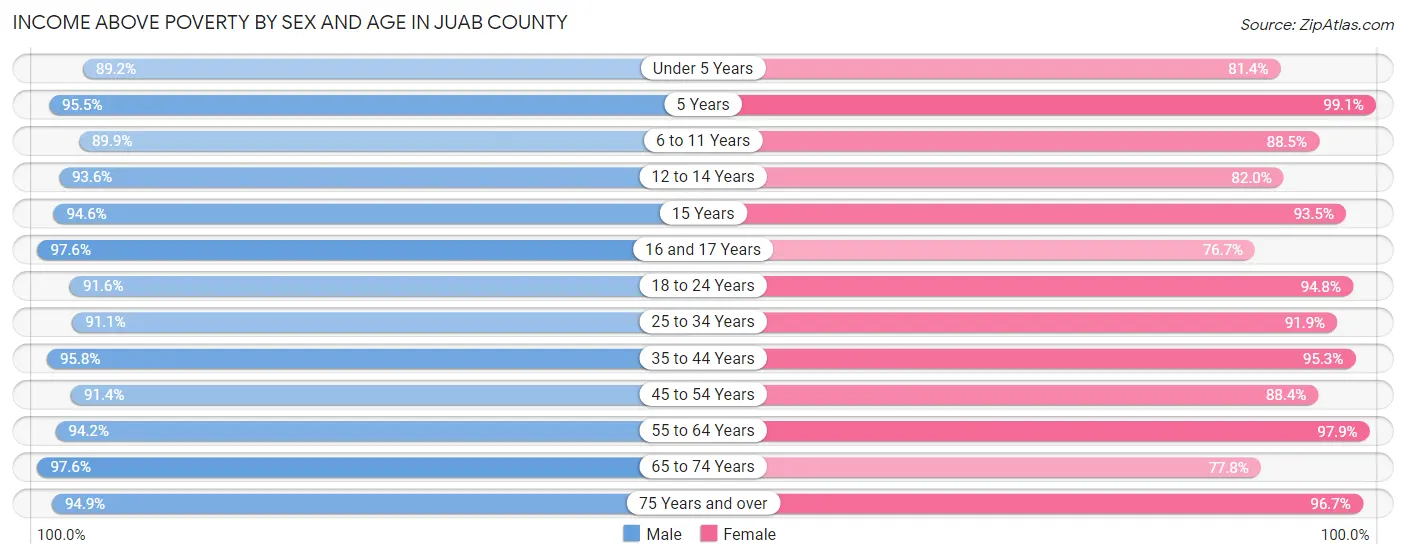
| Age Bracket | Male | Female |
| Under 5 Years | 421 (89.2%) | 350 (81.4%) |
| 5 Years | 63 (95.5%) | 107 (99.1%) |
| 6 to 11 Years | 614 (89.9%) | 440 (88.5%) |
| 12 to 14 Years | 499 (93.6%) | 337 (82.0%) |
| 15 Years | 106 (94.6%) | 130 (93.5%) |
| 16 and 17 Years | 282 (97.6%) | 171 (76.7%) |
| 18 to 24 Years | 596 (91.5%) | 496 (94.8%) |
| 25 to 34 Years | 638 (91.1%) | 647 (91.9%) |
| 35 to 44 Years | 737 (95.8%) | 705 (95.3%) |
| 45 to 54 Years | 592 (91.4%) | 534 (88.4%) |
| 55 to 64 Years | 491 (94.2%) | 473 (97.9%) |
| 65 to 74 Years | 447 (97.6%) | 339 (77.7%) |
| 75 Years and over | 243 (94.9%) | 317 (96.7%) |
| Total | 5,729 (93.0%) | 5,046 (89.7%) |
Income Below Poverty Among Married-Couple Families in Juab County
The poverty statistics for married-couple families in Juab County show that 3.0% or 72 of the total 2,423 families live below the poverty line. Families with 3 or 4 children have the highest poverty rate of 4.0%, comprising of 18 families. On the other hand, families with 5 or more children have the lowest poverty rate of 0.0%, which includes 0 families.
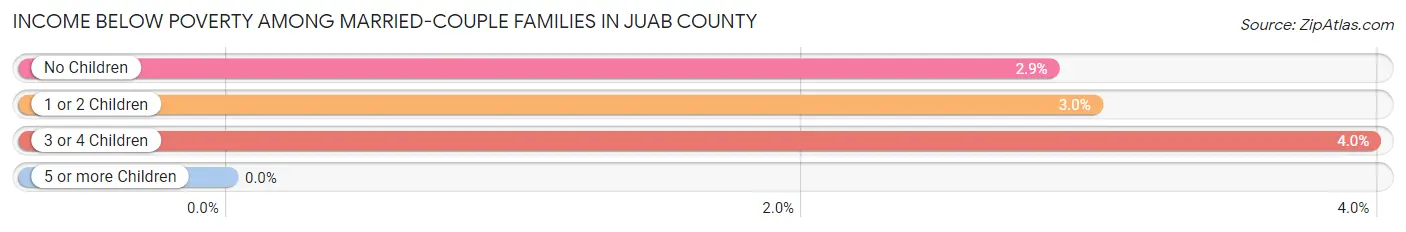
| Children | Above Poverty | Below Poverty |
| No Children | 1,087 (97.1%) | 32 (2.9%) |
| 1 or 2 Children | 709 (97.0%) | 22 (3.0%) |
| 3 or 4 Children | 434 (96.0%) | 18 (4.0%) |
| 5 or more Children | 121 (100.0%) | 0 (0.0%) |
| Total | 2,351 (97.0%) | 72 (3.0%) |
Income Below Poverty Among Single-Parent Households in Juab County
According to the poverty data in Juab County, 18.2% or 48 single-father households and 27.5% or 74 single-mother households are living below the poverty line. Among single-father households, those with 1 or 2 children have the highest poverty rate, with 47 households (56.6%) experiencing poverty. Likewise, among single-mother households, those with 5 or more children have the highest poverty rate, with 13 households (100.0%) falling below the poverty line.
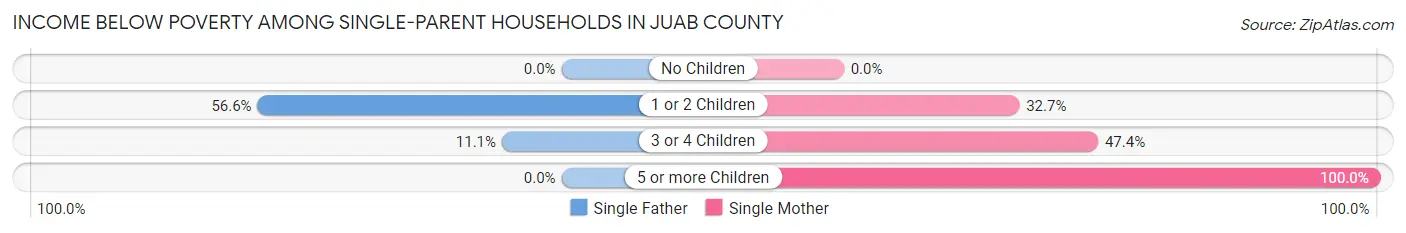
| Children | Single Father | Single Mother |
| No Children | 0 (0.0%) | 0 (0.0%) |
| 1 or 2 Children | 47 (56.6%) | 52 (32.7%) |
| 3 or 4 Children | 1 (11.1%) | 9 (47.4%) |
| 5 or more Children | 0 (0.0%) | 13 (100.0%) |
| Total | 48 (18.2%) | 74 (27.5%) |
Income Below Poverty Among Married-Couple vs Single-Parent Households in Juab County
The poverty data for Juab County shows that 72 of the married-couple family households (3.0%) and 122 of the single-parent households (22.9%) are living below the poverty level. Within the married-couple family households, those with 3 or 4 children have the highest poverty rate, with 18 households (4.0%) falling below the poverty line. Among the single-parent households, those with 5 or more children have the highest poverty rate, with 13 household (100.0%) living below poverty.
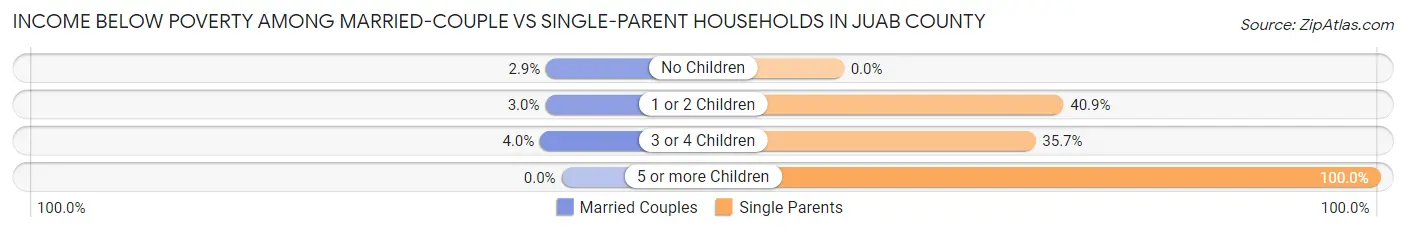
| Children | Married-Couple Families | Single-Parent Households |
| No Children | 32 (2.9%) | 0 (0.0%) |
| 1 or 2 Children | 22 (3.0%) | 99 (40.9%) |
| 3 or 4 Children | 18 (4.0%) | 10 (35.7%) |
| 5 or more Children | 0 (0.0%) | 13 (100.0%) |
| Total | 72 (3.0%) | 122 (22.9%) |
Employment Characteristics in Juab County
Employment by Class of Employer in Juab County
Among the 5,412 employed individuals in Juab County, private company employees (3,580 | 66.1%), local government employees (434 | 8.0%), and state government employees (427 | 7.9%) make up the most common classes of employment.
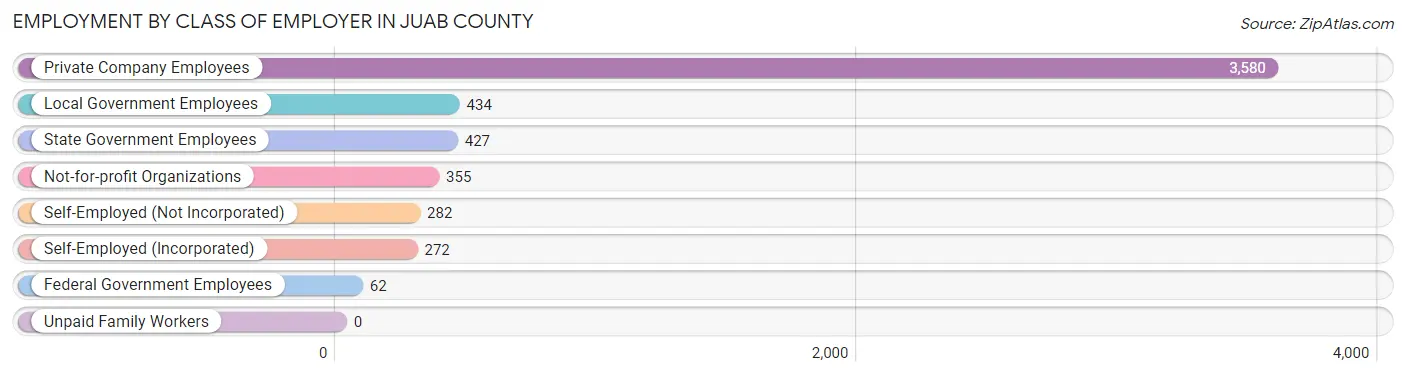
| Employer Class | # Employees | % Employees |
| Private Company Employees | 3,580 | 66.1% |
| Self-Employed (Incorporated) | 272 | 5.0% |
| Self-Employed (Not Incorporated) | 282 | 5.2% |
| Not-for-profit Organizations | 355 | 6.6% |
| Local Government Employees | 434 | 8.0% |
| State Government Employees | 427 | 7.9% |
| Federal Government Employees | 62 | 1.1% |
| Unpaid Family Workers | 0 | 0.0% |
| Total | 5,412 | 100.0% |
Employment Status by Age in Juab County
According to the labor force statistics for Juab County, out of the total population over 16 years of age (8,442), 66.4% or 5,605 individuals are in the labor force, with 1.9% or 106 of them unemployed. The age group with the highest labor force participation rate is 20 to 24 years, with 87.0% or 743 individuals in the labor force. Within the labor force, the 20 to 24 years age range has the highest percentage of unemployed individuals, with 5.2% or 39 of them being unemployed.
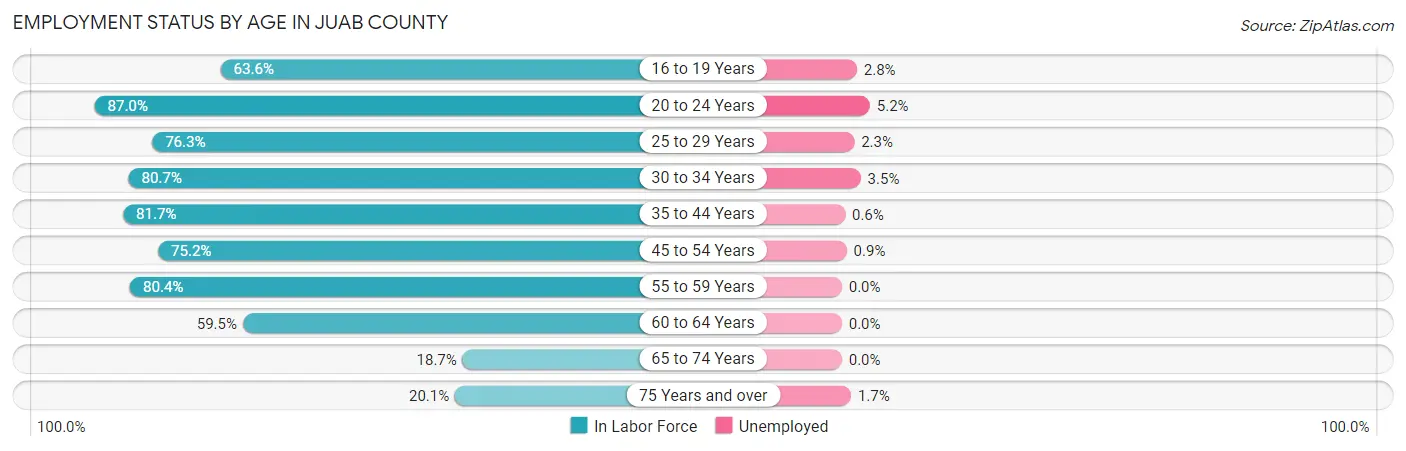
| Age Bracket | In Labor Force | Unemployed |
| 16 to 19 Years | 542 (63.6%) | 15 (2.8%) |
| 20 to 24 Years | 743 (87.0%) | 39 (5.2%) |
| 25 to 29 Years | 570 (76.3%) | 13 (2.3%) |
| 30 to 34 Years | 541 (80.7%) | 19 (3.5%) |
| 35 to 44 Years | 1,243 (81.7%) | 7 (0.6%) |
| 45 to 54 Years | 967 (75.2%) | 9 (0.9%) |
| 55 to 59 Years | 402 (80.4%) | 0 (0.0%) |
| 60 to 64 Years | 306 (59.5%) | 0 (0.0%) |
| 65 to 74 Years | 169 (18.7%) | 0 (0.0%) |
| 75 Years and over | 119 (20.1%) | 2 (1.7%) |
| Total | 5,605 (66.4%) | 106 (1.9%) |
Employment Status by Educational Attainment in Juab County
According to labor force statistics for Juab County, 76.9% of individuals (4,028) out of the total population between 25 and 64 years of age (5,238) are in the labor force, with 1.2% or 48 of them being unemployed. The group with the highest labor force participation rate are those with the educational attainment of college / associate degree, with 87.1% or 1,648 individuals in the labor force. Within the labor force, individuals with less than high school education have the highest percentage of unemployment, with 6.8% or 13 of them being unemployed.
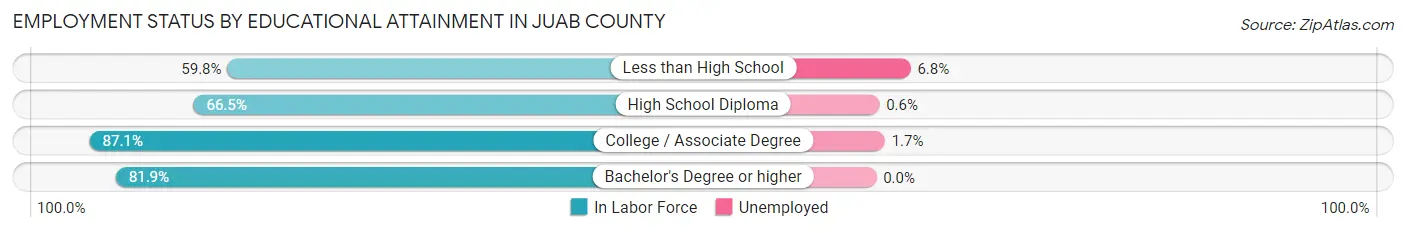
| Educational Attainment | In Labor Force | Unemployed |
| Less than High School | 192 (59.8%) | 22 (6.8%) |
| High School Diploma | 1,240 (66.5%) | 11 (0.6%) |
| College / Associate Degree | 1,648 (87.1%) | 32 (1.7%) |
| Bachelor's Degree or higher | 951 (81.9%) | 0 (0.0%) |
| Total | 4,028 (76.9%) | 63 (1.2%) |
Employment Occupations by Sex in Juab County
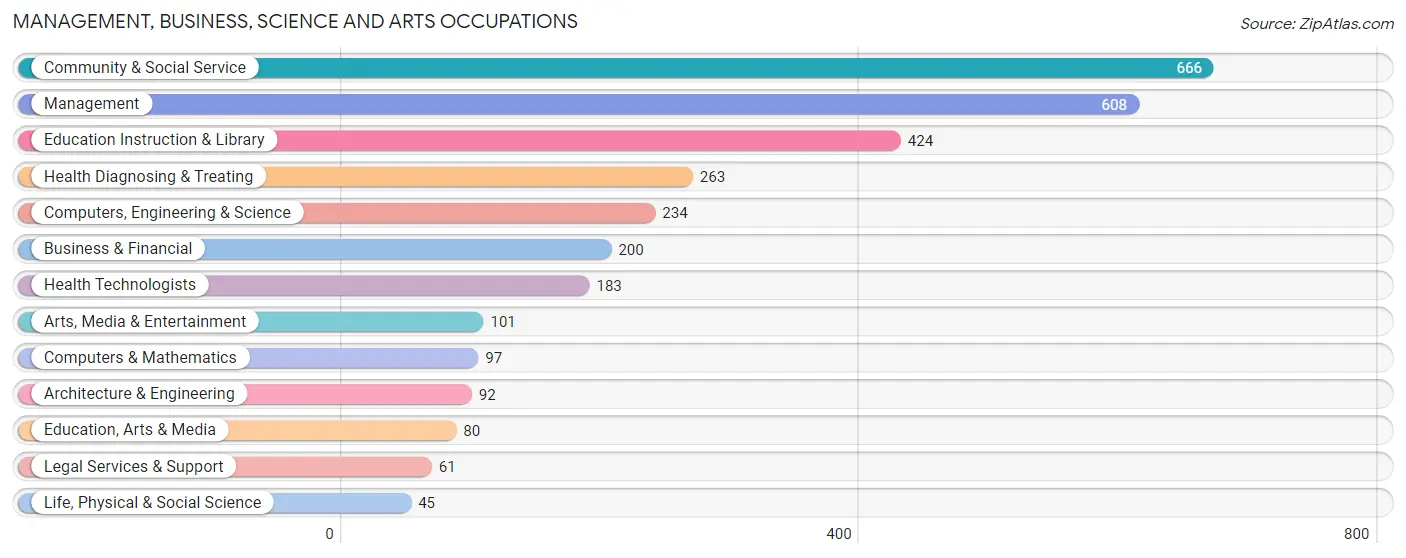
Management, Business, Science and Arts Occupations
The most common Management, Business, Science and Arts occupations in Juab County are Community & Social Service (666 | 12.1%), Management (608 | 11.1%), Education Instruction & Library (424 | 7.7%), Health Diagnosing & Treating (263 | 4.8%), and Computers, Engineering & Science (234 | 4.3%).
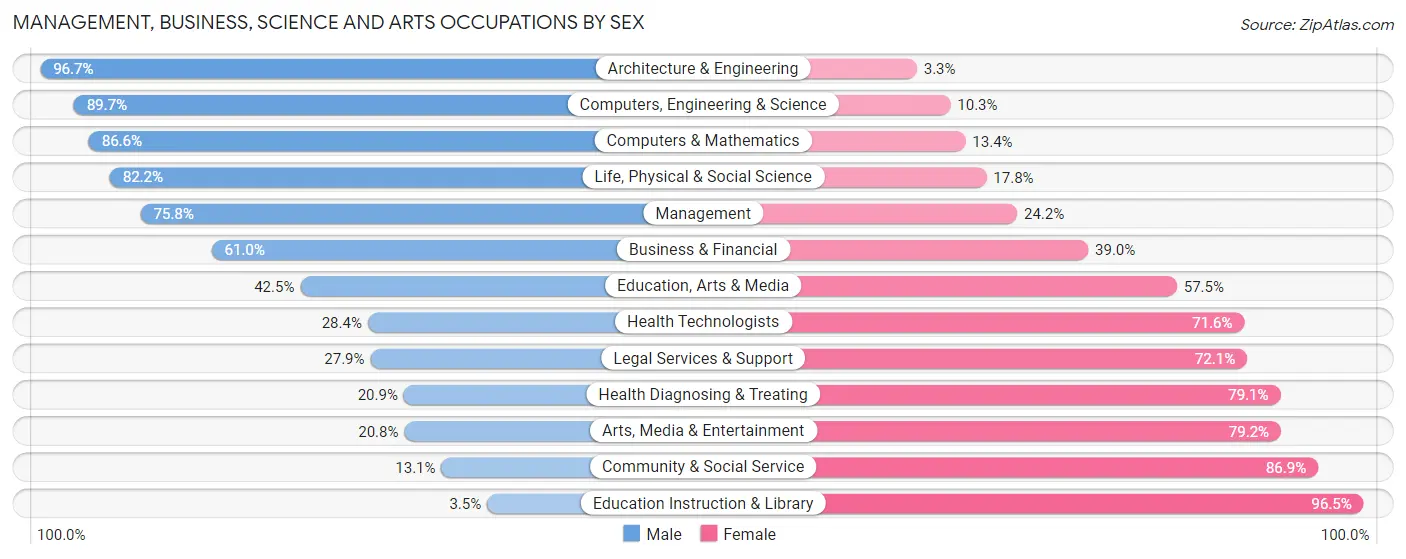
Management, Business, Science and Arts Occupations by Sex
Within the Management, Business, Science and Arts occupations in Juab County, the most male-oriented occupations are Architecture & Engineering (96.7%), Computers, Engineering & Science (89.7%), and Computers & Mathematics (86.6%), while the most female-oriented occupations are Education Instruction & Library (96.5%), Community & Social Service (86.9%), and Arts, Media & Entertainment (79.2%).
| Occupation | Male | Female |
| Management | 461 (75.8%) | 147 (24.2%) |
| Business & Financial | 122 (61.0%) | 78 (39.0%) |
| Computers, Engineering & Science | 210 (89.7%) | 24 (10.3%) |
| Computers & Mathematics | 84 (86.6%) | 13 (13.4%) |
| Architecture & Engineering | 89 (96.7%) | 3 (3.3%) |
| Life, Physical & Social Science | 37 (82.2%) | 8 (17.8%) |
| Community & Social Service | 87 (13.1%) | 579 (86.9%) |
| Education, Arts & Media | 34 (42.5%) | 46 (57.5%) |
| Legal Services & Support | 17 (27.9%) | 44 (72.1%) |
| Education Instruction & Library | 15 (3.5%) | 409 (96.5%) |
| Arts, Media & Entertainment | 21 (20.8%) | 80 (79.2%) |
| Health Diagnosing & Treating | 55 (20.9%) | 208 (79.1%) |
| Health Technologists | 52 (28.4%) | 131 (71.6%) |
| Total (Category) | 935 (47.4%) | 1,036 (52.6%) |
| Total (Overall) | 3,015 (54.9%) | 2,472 (45.1%) |
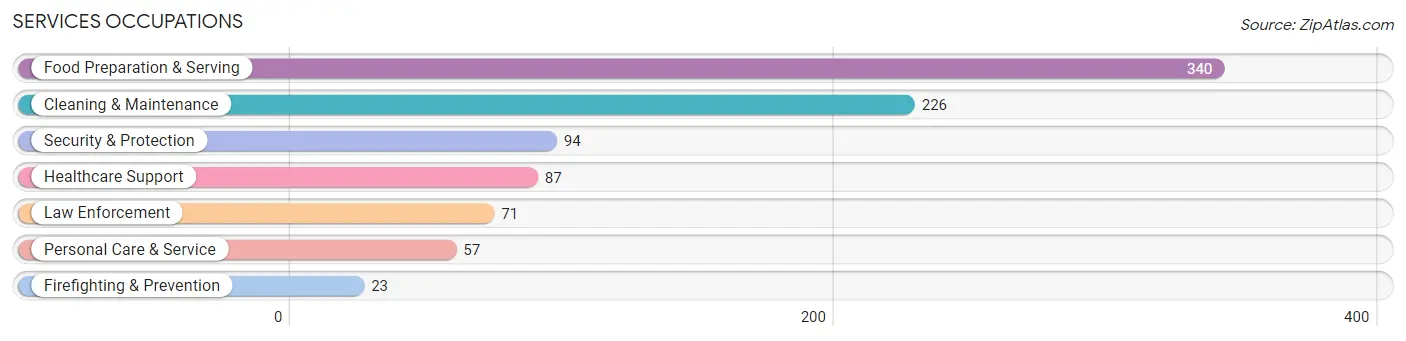
Services Occupations
The most common Services occupations in Juab County are Food Preparation & Serving (340 | 6.2%), Cleaning & Maintenance (226 | 4.1%), Security & Protection (94 | 1.7%), Healthcare Support (87 | 1.6%), and Law Enforcement (71 | 1.3%).
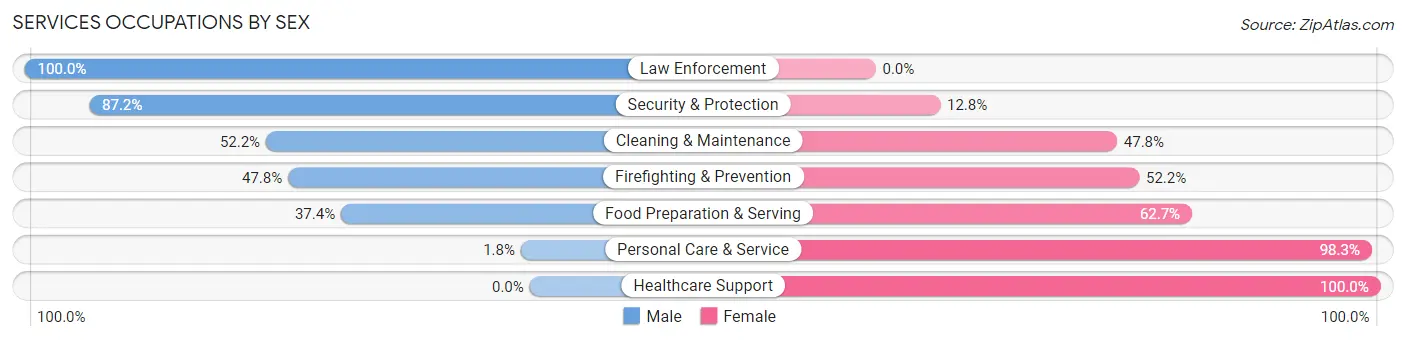
Services Occupations by Sex
Within the Services occupations in Juab County, the most male-oriented occupations are Law Enforcement (100.0%), Security & Protection (87.2%), and Cleaning & Maintenance (52.2%), while the most female-oriented occupations are Healthcare Support (100.0%), Personal Care & Service (98.3%), and Food Preparation & Serving (62.6%).
| Occupation | Male | Female |
| Healthcare Support | 0 (0.0%) | 87 (100.0%) |
| Security & Protection | 82 (87.2%) | 12 (12.8%) |
| Firefighting & Prevention | 11 (47.8%) | 12 (52.2%) |
| Law Enforcement | 71 (100.0%) | 0 (0.0%) |
| Food Preparation & Serving | 127 (37.3%) | 213 (62.6%) |
| Cleaning & Maintenance | 118 (52.2%) | 108 (47.8%) |
| Personal Care & Service | 1 (1.8%) | 56 (98.3%) |
| Total (Category) | 328 (40.8%) | 476 (59.2%) |
| Total (Overall) | 3,015 (54.9%) | 2,472 (45.1%) |
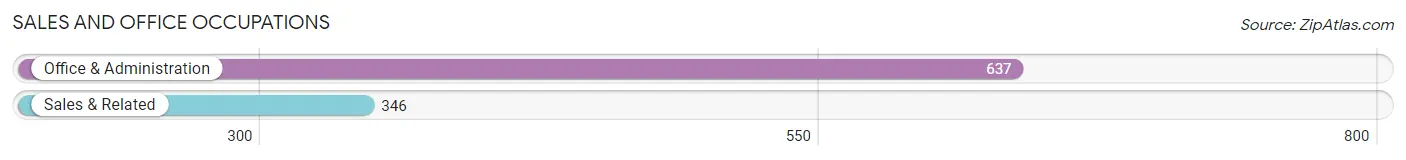
Sales and Office Occupations
The most common Sales and Office occupations in Juab County are Office & Administration (637 | 11.6%), and Sales & Related (346 | 6.3%).
Sales and Office Occupations by Sex
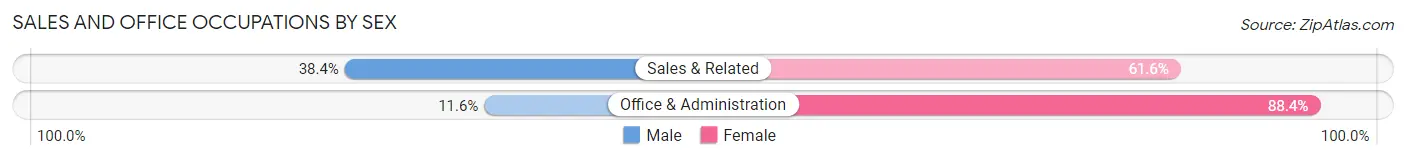
| Occupation | Male | Female |
| Sales & Related | 133 (38.4%) | 213 (61.6%) |
| Office & Administration | 74 (11.6%) | 563 (88.4%) |
| Total (Category) | 207 (21.1%) | 776 (78.9%) |
| Total (Overall) | 3,015 (54.9%) | 2,472 (45.1%) |
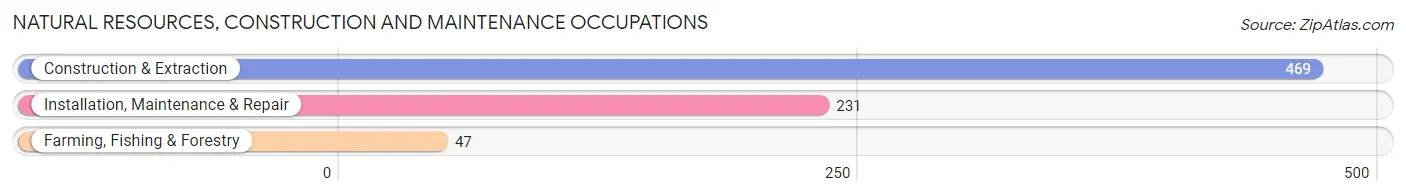
Natural Resources, Construction and Maintenance Occupations
The most common Natural Resources, Construction and Maintenance occupations in Juab County are Construction & Extraction (469 | 8.6%), Installation, Maintenance & Repair (231 | 4.2%), and Farming, Fishing & Forestry (47 | 0.9%).
Natural Resources, Construction and Maintenance Occupations by Sex
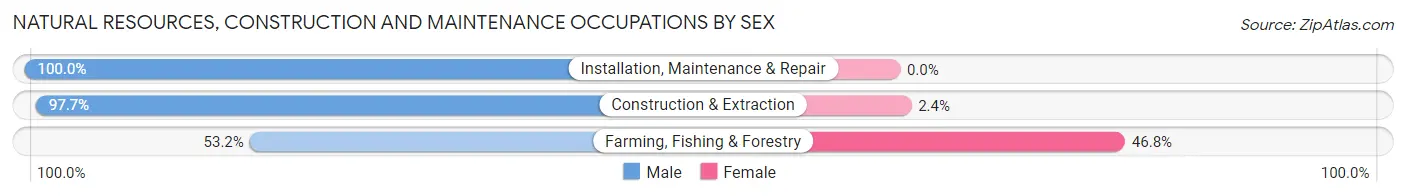
| Occupation | Male | Female |
| Farming, Fishing & Forestry | 25 (53.2%) | 22 (46.8%) |
| Construction & Extraction | 458 (97.7%) | 11 (2.4%) |
| Installation, Maintenance & Repair | 231 (100.0%) | 0 (0.0%) |
| Total (Category) | 714 (95.6%) | 33 (4.4%) |
| Total (Overall) | 3,015 (54.9%) | 2,472 (45.1%) |
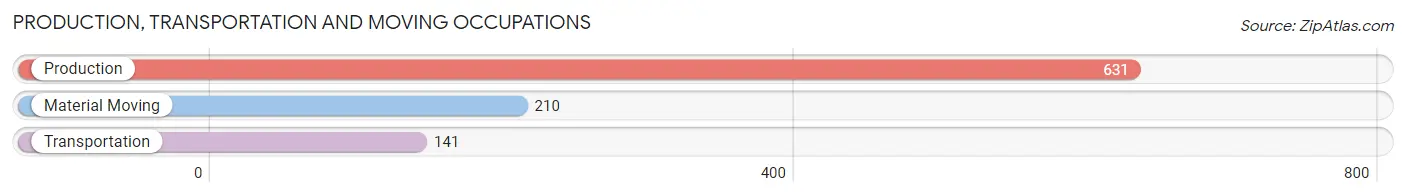
Production, Transportation and Moving Occupations
The most common Production, Transportation and Moving occupations in Juab County are Production (631 | 11.5%), Material Moving (210 | 3.8%), and Transportation (141 | 2.6%).
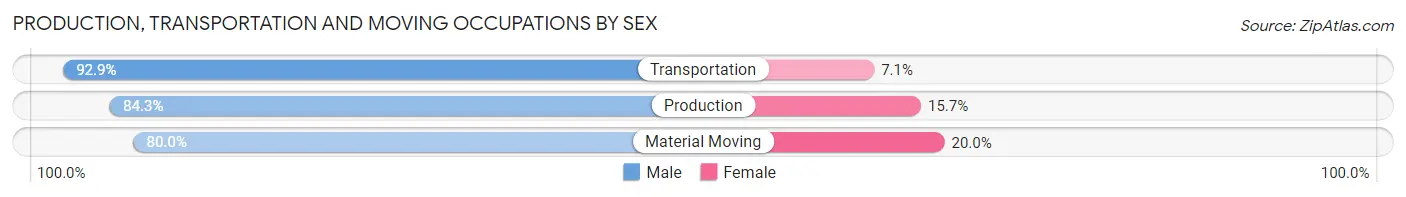
Production, Transportation and Moving Occupations by Sex
| Occupation | Male | Female |
| Production | 532 (84.3%) | 99 (15.7%) |
| Transportation | 131 (92.9%) | 10 (7.1%) |
| Material Moving | 168 (80.0%) | 42 (20.0%) |
| Total (Category) | 831 (84.6%) | 151 (15.4%) |
| Total (Overall) | 3,015 (54.9%) | 2,472 (45.1%) |
Employment Industries by Sex in Juab County
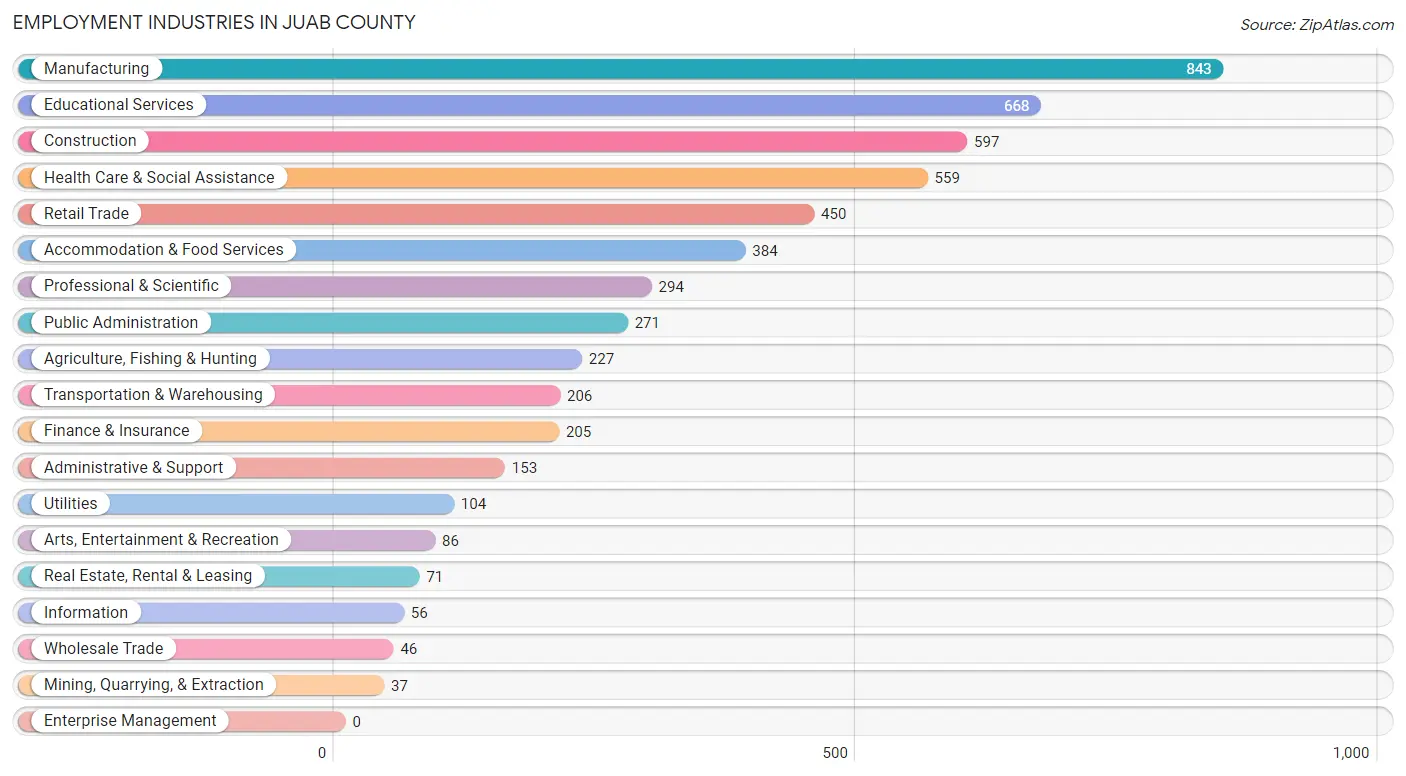
Employment Industries in Juab County
The major employment industries in Juab County include Manufacturing (843 | 15.4%), Educational Services (668 | 12.2%), Construction (597 | 10.9%), Health Care & Social Assistance (559 | 10.2%), and Retail Trade (450 | 8.2%).
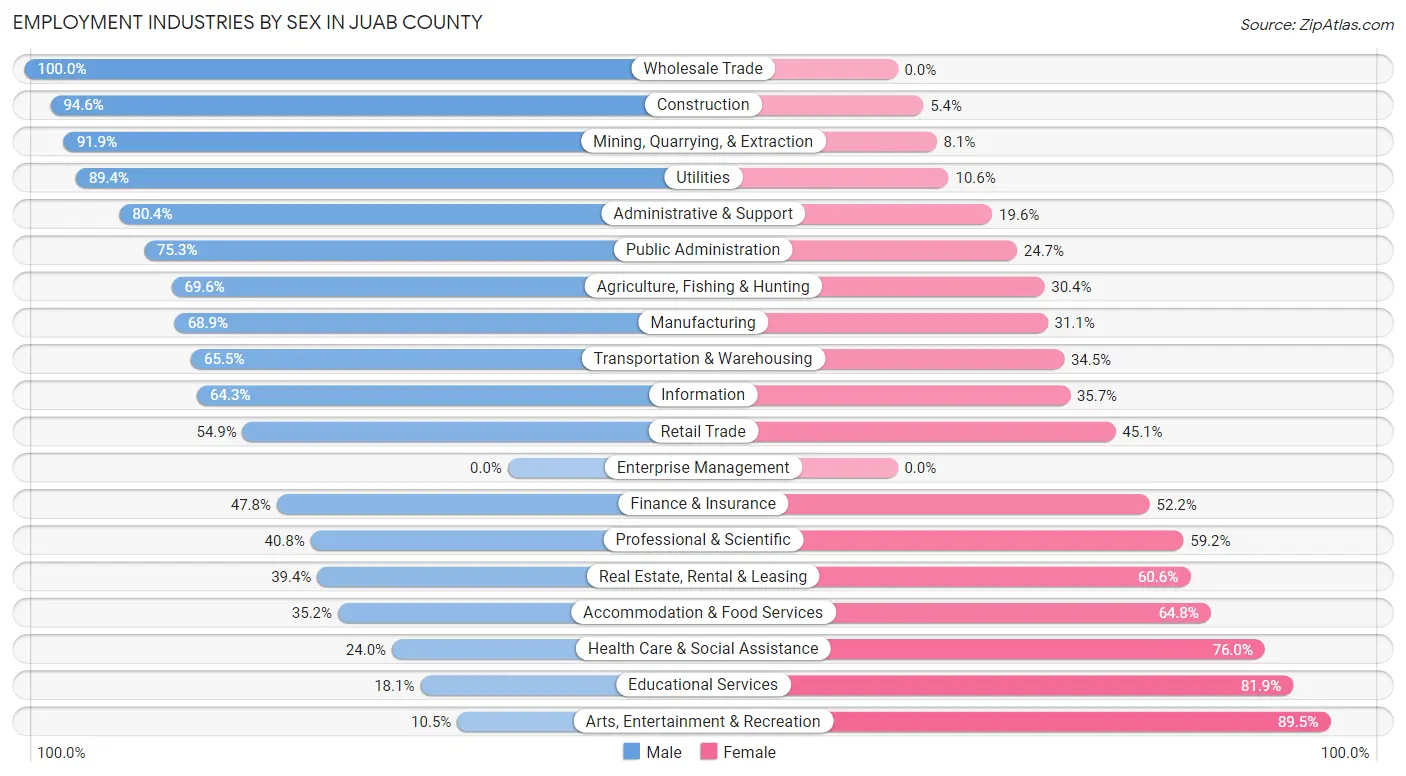
Employment Industries by Sex in Juab County
The Juab County industries that see more men than women are Wholesale Trade (100.0%), Construction (94.6%), and Mining, Quarrying, & Extraction (91.9%), whereas the industries that tend to have a higher number of women are Arts, Entertainment & Recreation (89.5%), Educational Services (81.9%), and Health Care & Social Assistance (76.0%).
| Industry | Male | Female |
| Agriculture, Fishing & Hunting | 158 (69.6%) | 69 (30.4%) |
| Mining, Quarrying, & Extraction | 34 (91.9%) | 3 (8.1%) |
| Construction | 565 (94.6%) | 32 (5.4%) |
| Manufacturing | 581 (68.9%) | 262 (31.1%) |
| Wholesale Trade | 46 (100.0%) | 0 (0.0%) |
| Retail Trade | 247 (54.9%) | 203 (45.1%) |
| Transportation & Warehousing | 135 (65.5%) | 71 (34.5%) |
| Utilities | 93 (89.4%) | 11 (10.6%) |
| Information | 36 (64.3%) | 20 (35.7%) |
| Finance & Insurance | 98 (47.8%) | 107 (52.2%) |
| Real Estate, Rental & Leasing | 28 (39.4%) | 43 (60.6%) |
| Professional & Scientific | 120 (40.8%) | 174 (59.2%) |
| Enterprise Management | 0 (0.0%) | 0 (0.0%) |
| Administrative & Support | 123 (80.4%) | 30 (19.6%) |
| Educational Services | 121 (18.1%) | 547 (81.9%) |
| Health Care & Social Assistance | 134 (24.0%) | 425 (76.0%) |
| Arts, Entertainment & Recreation | 9 (10.5%) | 77 (89.5%) |
| Accommodation & Food Services | 135 (35.2%) | 249 (64.8%) |
| Public Administration | 204 (75.3%) | 67 (24.7%) |
| Total | 3,015 (54.9%) | 2,472 (45.1%) |
Education in Juab County
School Enrollment in Juab County
The most common levels of schooling among the 3,763 students in Juab County are high school (1,073 | 28.5%), middle school (1,024 | 27.2%), and elementary school (835 | 22.2%).
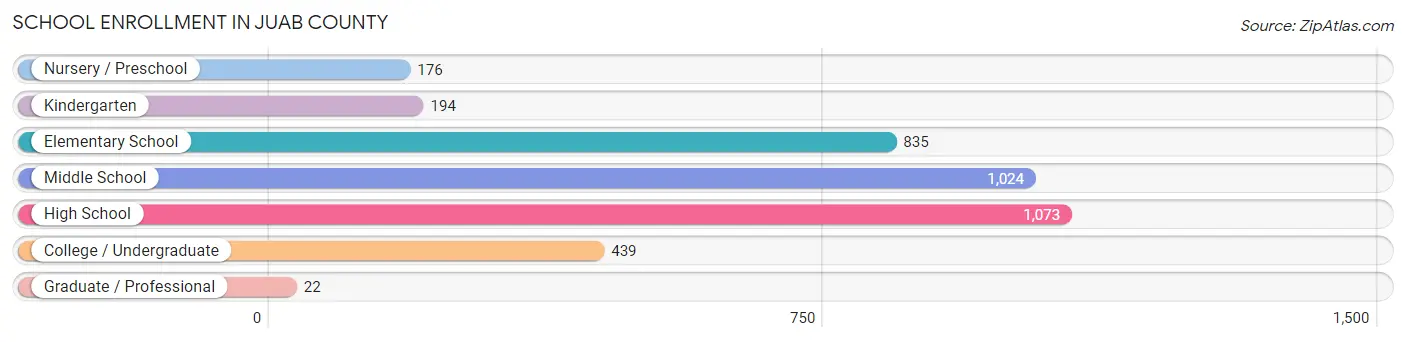
| School Level | # Students | % Students |
| Nursery / Preschool | 176 | 4.7% |
| Kindergarten | 194 | 5.2% |
| Elementary School | 835 | 22.2% |
| Middle School | 1,024 | 27.2% |
| High School | 1,073 | 28.5% |
| College / Undergraduate | 439 | 11.7% |
| Graduate / Professional | 22 | 0.6% |
| Total | 3,763 | 100.0% |
School Enrollment by Age by Funding Source in Juab County
Out of a total of 3,763 students who are enrolled in schools in Juab County, 361 (9.6%) attend a private institution, while the remaining 3,402 (90.4%) are enrolled in public schools. The age group of 3 to 4 year olds has the highest likelihood of being enrolled in private schools, with 38 (27.7% in the age bracket) enrolled. Conversely, the age group of 15 to 17 year olds has the lowest likelihood of being enrolled in a private school, with 719 (94.6% in the age bracket) attending a public institution.
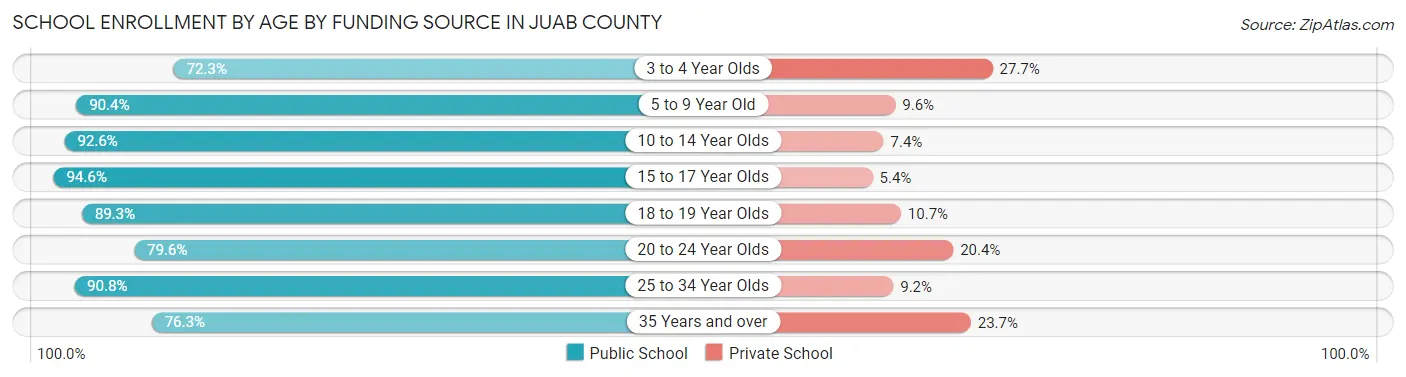
| Age Bracket | Public School | Private School |
| 3 to 4 Year Olds | 99 (72.3%) | 38 (27.7%) |
| 5 to 9 Year Old | 864 (90.4%) | 92 (9.6%) |
| 10 to 14 Year Olds | 1,209 (92.6%) | 97 (7.4%) |
| 15 to 17 Year Olds | 719 (94.6%) | 41 (5.4%) |
| 18 to 19 Year Olds | 176 (89.3%) | 21 (10.7%) |
| 20 to 24 Year Olds | 199 (79.6%) | 51 (20.4%) |
| 25 to 34 Year Olds | 108 (90.8%) | 11 (9.2%) |
| 35 Years and over | 29 (76.3%) | 9 (23.7%) |
| Total | 3,402 (90.4%) | 361 (9.6%) |
Educational Attainment by Field of Study in Juab County
Education (448 | 30.2%), arts & humanities (234 | 15.8%), science & technology (219 | 14.8%), business (180 | 12.1%), and engineering (98 | 6.6%) are the most common fields of study among 1,481 individuals in Juab County who have obtained a bachelor's degree or higher.
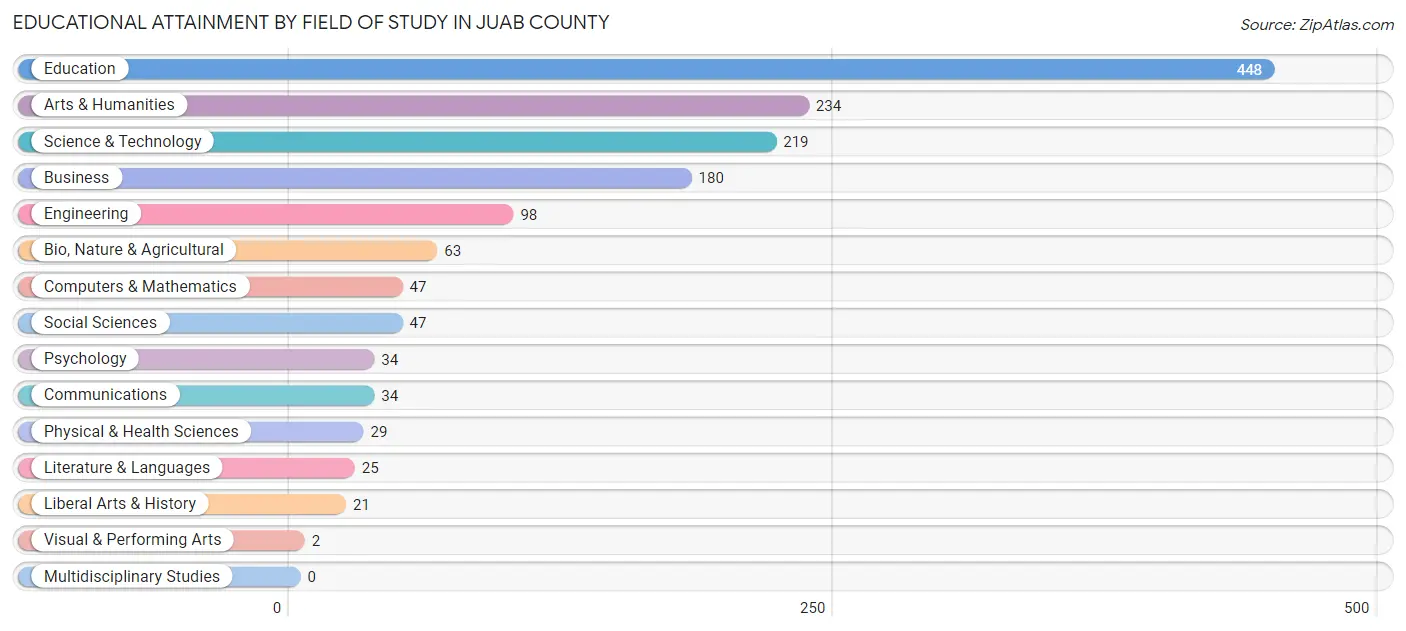
| Field of Study | # Graduates | % Graduates |
| Computers & Mathematics | 47 | 3.2% |
| Bio, Nature & Agricultural | 63 | 4.3% |
| Physical & Health Sciences | 29 | 2.0% |
| Psychology | 34 | 2.3% |
| Social Sciences | 47 | 3.2% |
| Engineering | 98 | 6.6% |
| Multidisciplinary Studies | 0 | 0.0% |
| Science & Technology | 219 | 14.8% |
| Business | 180 | 12.1% |
| Education | 448 | 30.2% |
| Literature & Languages | 25 | 1.7% |
| Liberal Arts & History | 21 | 1.4% |
| Visual & Performing Arts | 2 | 0.1% |
| Communications | 34 | 2.3% |
| Arts & Humanities | 234 | 15.8% |
| Total | 1,481 | 100.0% |
Transportation & Commute in Juab County
Vehicle Availability by Sex in Juab County
The most prevalent vehicle ownership categories in Juab County are males with 3 vehicles (954, accounting for 32.0%) and females with 3 vehicles (793, making up 39.4%).
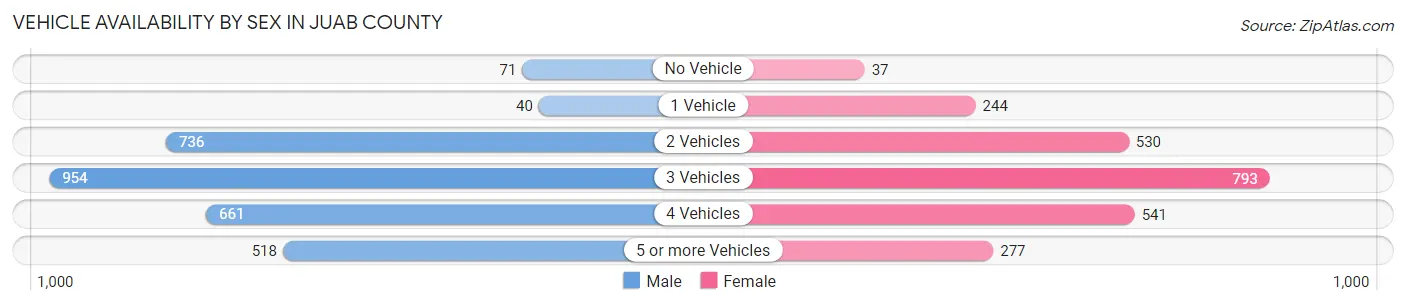
| Vehicles Available | Male | Female |
| No Vehicle | 71 (2.4%) | 37 (1.5%) |
| 1 Vehicle | 40 (1.3%) | 244 (10.1%) |
| 2 Vehicles | 736 (24.7%) | 530 (21.9%) |
| 3 Vehicles | 954 (32.0%) | 793 (32.7%) |
| 4 Vehicles | 661 (22.2%) | 541 (22.3%) |
| 5 or more Vehicles | 518 (17.4%) | 277 (11.4%) |
| Total | 2,980 (100.0%) | 2,422 (100.0%) |
Commute Time in Juab County
The most frequently occuring commute durations in Juab County are less than 5 minutes (979 commuters, 19.9%), 5 to 9 minutes (839 commuters, 17.1%), and 30 to 34 minutes (534 commuters, 10.9%).
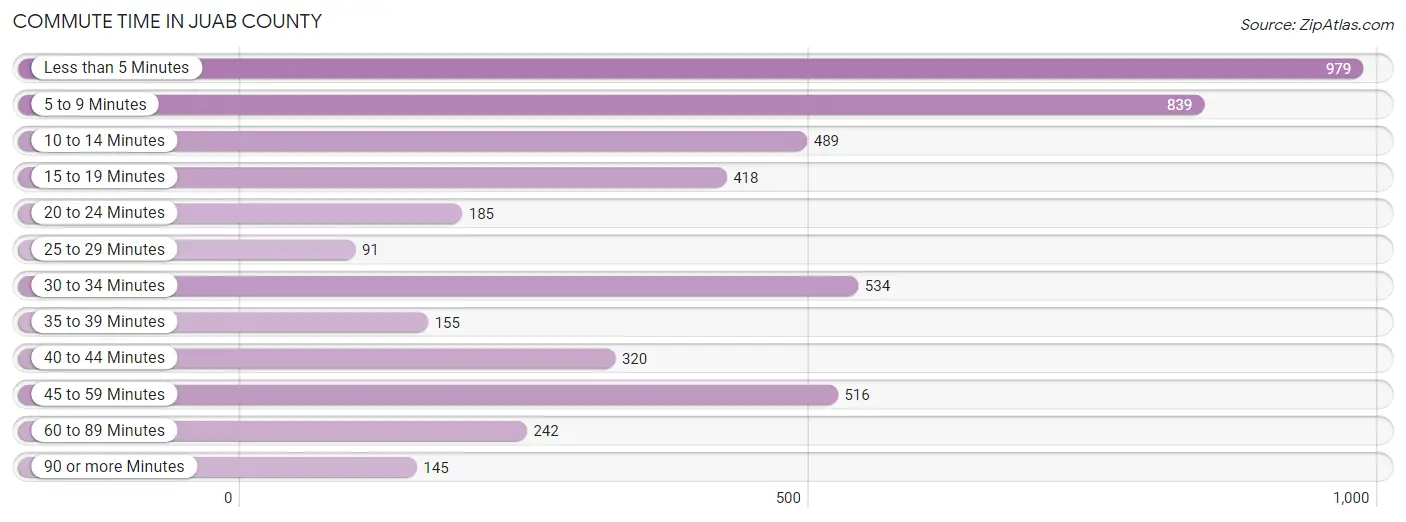
| Commute Time | # Commuters | % Commuters |
| Less than 5 Minutes | 979 | 19.9% |
| 5 to 9 Minutes | 839 | 17.1% |
| 10 to 14 Minutes | 489 | 10.0% |
| 15 to 19 Minutes | 418 | 8.5% |
| 20 to 24 Minutes | 185 | 3.8% |
| 25 to 29 Minutes | 91 | 1.8% |
| 30 to 34 Minutes | 534 | 10.9% |
| 35 to 39 Minutes | 155 | 3.2% |
| 40 to 44 Minutes | 320 | 6.5% |
| 45 to 59 Minutes | 516 | 10.5% |
| 60 to 89 Minutes | 242 | 4.9% |
| 90 or more Minutes | 145 | 2.9% |
Commute Time by Sex in Juab County
The most common commute times in Juab County are 30 to 34 minutes (425 commuters, 15.0%) for males and less than 5 minutes (558 commuters, 26.7%) for females.
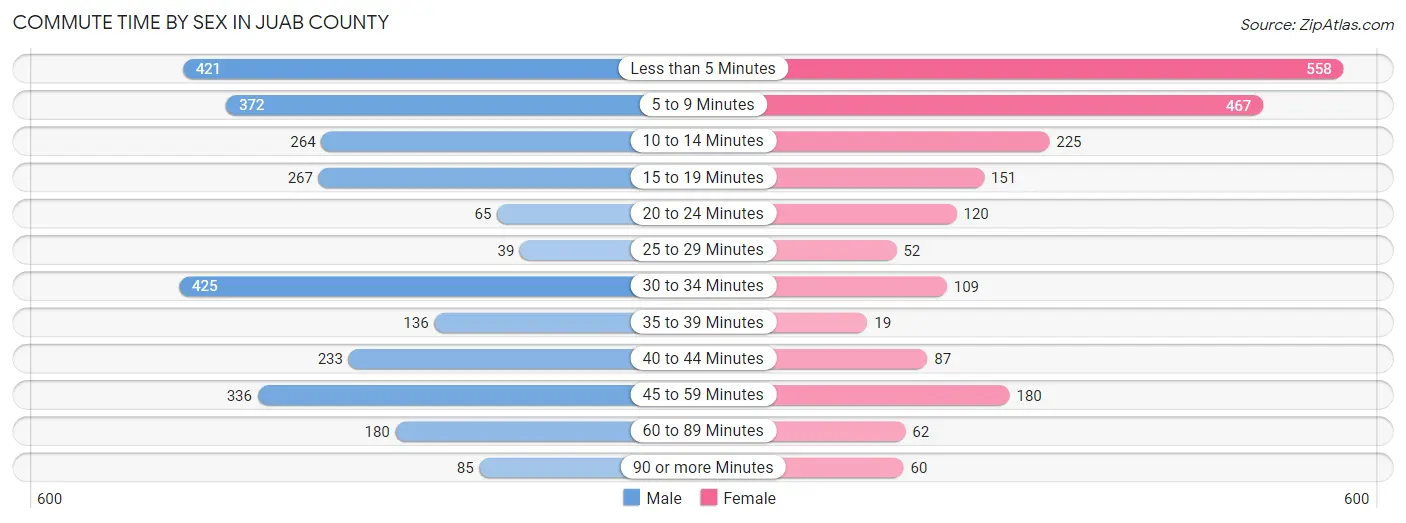
| Commute Time | Male | Female |
| Less than 5 Minutes | 421 (14.9%) | 558 (26.7%) |
| 5 to 9 Minutes | 372 (13.2%) | 467 (22.3%) |
| 10 to 14 Minutes | 264 (9.3%) | 225 (10.8%) |
| 15 to 19 Minutes | 267 (9.5%) | 151 (7.2%) |
| 20 to 24 Minutes | 65 (2.3%) | 120 (5.7%) |
| 25 to 29 Minutes | 39 (1.4%) | 52 (2.5%) |
| 30 to 34 Minutes | 425 (15.0%) | 109 (5.2%) |
| 35 to 39 Minutes | 136 (4.8%) | 19 (0.9%) |
| 40 to 44 Minutes | 233 (8.3%) | 87 (4.2%) |
| 45 to 59 Minutes | 336 (11.9%) | 180 (8.6%) |
| 60 to 89 Minutes | 180 (6.4%) | 62 (3.0%) |
| 90 or more Minutes | 85 (3.0%) | 60 (2.9%) |
Time of Departure to Work by Sex in Juab County
The most frequent times of departure to work in Juab County are 8:00 AM to 8:29 AM (368, 13.0%) for males and 7:00 AM to 7:29 AM (434, 20.8%) for females.
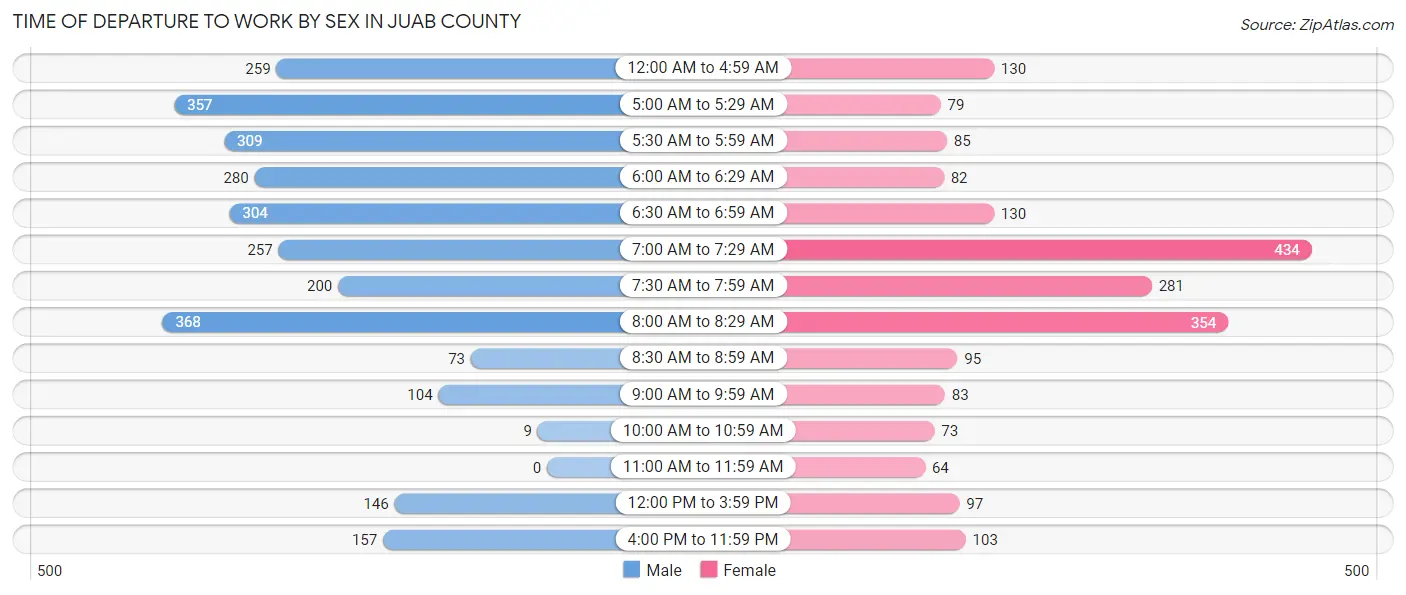
| Time of Departure | Male | Female |
| 12:00 AM to 4:59 AM | 259 (9.2%) | 130 (6.2%) |
| 5:00 AM to 5:29 AM | 357 (12.7%) | 79 (3.8%) |
| 5:30 AM to 5:59 AM | 309 (11.0%) | 85 (4.1%) |
| 6:00 AM to 6:29 AM | 280 (9.9%) | 82 (3.9%) |
| 6:30 AM to 6:59 AM | 304 (10.8%) | 130 (6.2%) |
| 7:00 AM to 7:29 AM | 257 (9.1%) | 434 (20.8%) |
| 7:30 AM to 7:59 AM | 200 (7.1%) | 281 (13.4%) |
| 8:00 AM to 8:29 AM | 368 (13.0%) | 354 (16.9%) |
| 8:30 AM to 8:59 AM | 73 (2.6%) | 95 (4.5%) |
| 9:00 AM to 9:59 AM | 104 (3.7%) | 83 (4.0%) |
| 10:00 AM to 10:59 AM | 9 (0.3%) | 73 (3.5%) |
| 11:00 AM to 11:59 AM | 0 (0.0%) | 64 (3.1%) |
| 12:00 PM to 3:59 PM | 146 (5.2%) | 97 (4.6%) |
| 4:00 PM to 11:59 PM | 157 (5.6%) | 103 (4.9%) |
| Total | 2,823 (100.0%) | 2,090 (100.0%) |
Housing Occupancy in Juab County
Occupancy by Ownership in Juab County
Of the total 3,594 dwellings in Juab County, owner-occupied units account for 2,862 (79.6%), while renter-occupied units make up 732 (20.4%).
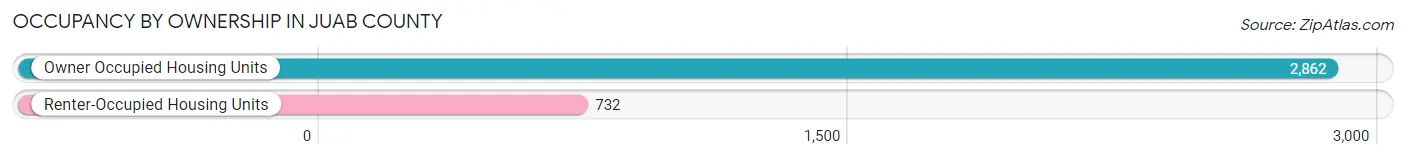
| Occupancy | # Housing Units | % Housing Units |
| Owner Occupied Housing Units | 2,862 | 79.6% |
| Renter-Occupied Housing Units | 732 | 20.4% |
| Total Occupied Housing Units | 3,594 | 100.0% |
Occupancy by Household Size in Juab County
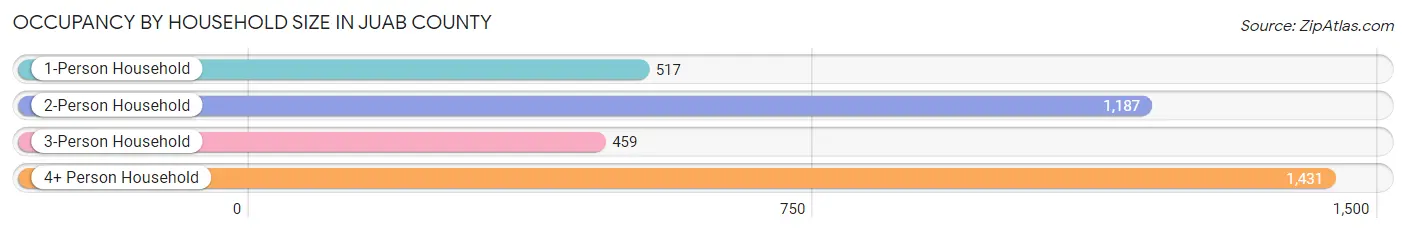
| Household Size | # Housing Units | % Housing Units |
| 1-Person Household | 517 | 14.4% |
| 2-Person Household | 1,187 | 33.0% |
| 3-Person Household | 459 | 12.8% |
| 4+ Person Household | 1,431 | 39.8% |
| Total Housing Units | 3,594 | 100.0% |
Occupancy by Ownership by Household Size in Juab County
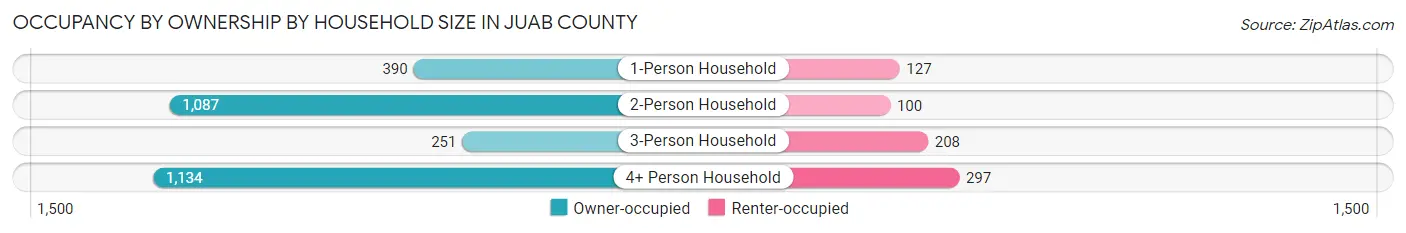
| Household Size | Owner-occupied | Renter-occupied |
| 1-Person Household | 390 (75.4%) | 127 (24.6%) |
| 2-Person Household | 1,087 (91.6%) | 100 (8.4%) |
| 3-Person Household | 251 (54.7%) | 208 (45.3%) |
| 4+ Person Household | 1,134 (79.2%) | 297 (20.7%) |
| Total Housing Units | 2,862 (79.6%) | 732 (20.4%) |
Occupancy by Educational Attainment in Juab County
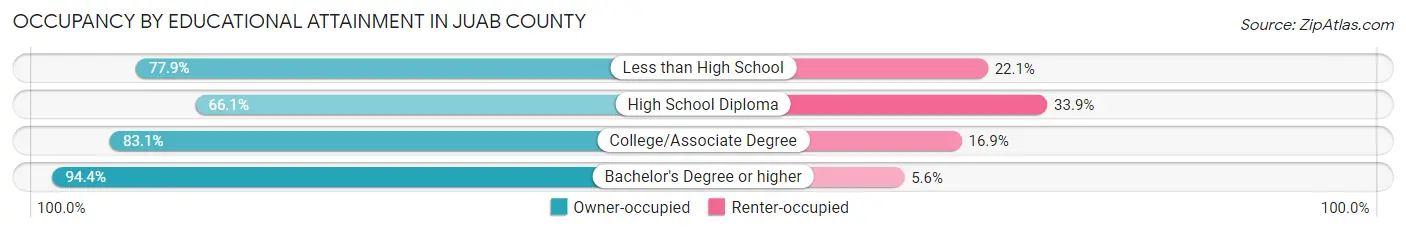
| Household Size | Owner-occupied | Renter-occupied |
| Less than High School | 148 (77.9%) | 42 (22.1%) |
| High School Diploma | 778 (66.1%) | 399 (33.9%) |
| College/Associate Degree | 1,222 (83.1%) | 249 (16.9%) |
| Bachelor's Degree or higher | 714 (94.4%) | 42 (5.6%) |
Occupancy by Age of Householder in Juab County
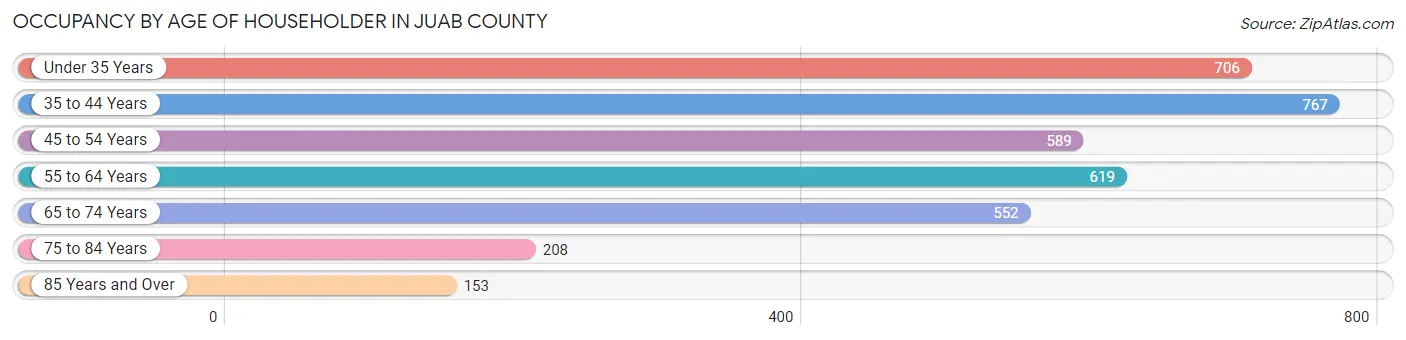
| Age Bracket | # Households | % Households |
| Under 35 Years | 706 | 19.6% |
| 35 to 44 Years | 767 | 21.3% |
| 45 to 54 Years | 589 | 16.4% |
| 55 to 64 Years | 619 | 17.2% |
| 65 to 74 Years | 552 | 15.4% |
| 75 to 84 Years | 208 | 5.8% |
| 85 Years and Over | 153 | 4.3% |
| Total | 3,594 | 100.0% |
Housing Finances in Juab County
Median Income by Occupancy in Juab County
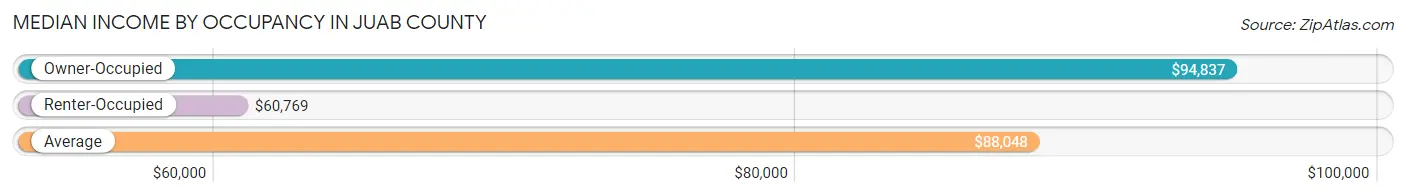
| Occupancy Type | # Households | Median Income |
| Owner-Occupied | 2,862 (79.6%) | $94,837 |
| Renter-Occupied | 732 (20.4%) | $60,769 |
| Average | 3,594 (100.0%) | $88,048 |
Occupancy by Householder Income Bracket in Juab County
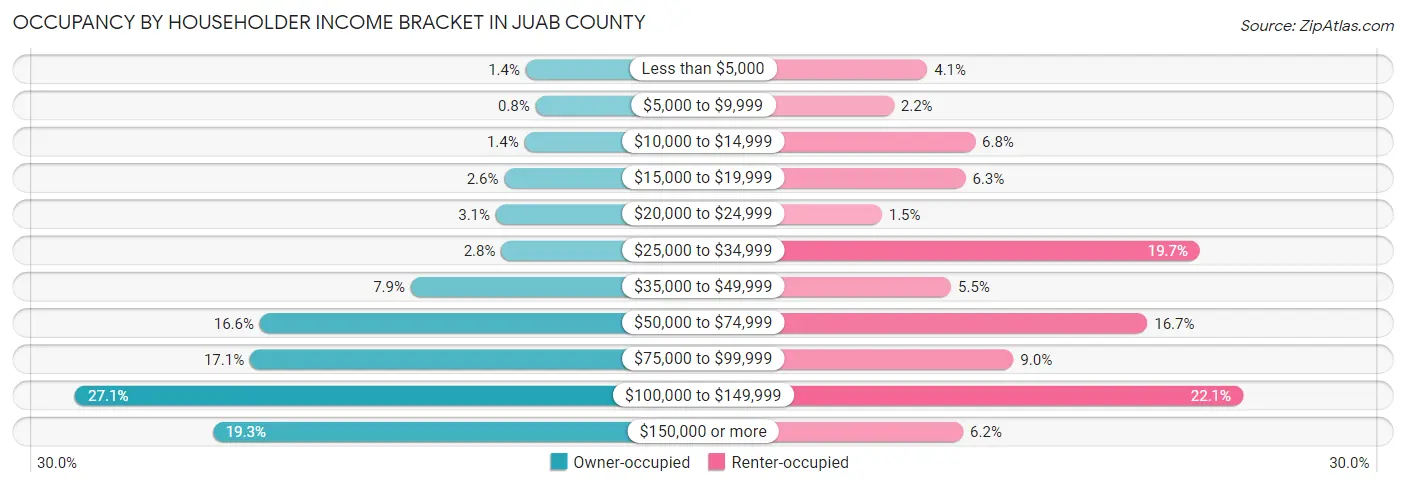
| Income Bracket | Owner-occupied | Renter-occupied |
| Less than $5,000 | 39 (1.4%) | 30 (4.1%) |
| $5,000 to $9,999 | 23 (0.8%) | 16 (2.2%) |
| $10,000 to $14,999 | 41 (1.4%) | 50 (6.8%) |
| $15,000 to $19,999 | 74 (2.6%) | 46 (6.3%) |
| $20,000 to $24,999 | 88 (3.1%) | 11 (1.5%) |
| $25,000 to $34,999 | 79 (2.8%) | 144 (19.7%) |
| $35,000 to $49,999 | 227 (7.9%) | 40 (5.5%) |
| $50,000 to $74,999 | 474 (16.6%) | 122 (16.7%) |
| $75,000 to $99,999 | 490 (17.1%) | 66 (9.0%) |
| $100,000 to $149,999 | 776 (27.1%) | 162 (22.1%) |
| $150,000 or more | 551 (19.3%) | 45 (6.1%) |
| Total | 2,862 (100.0%) | 732 (100.0%) |
Monthly Housing Cost Tiers in Juab County
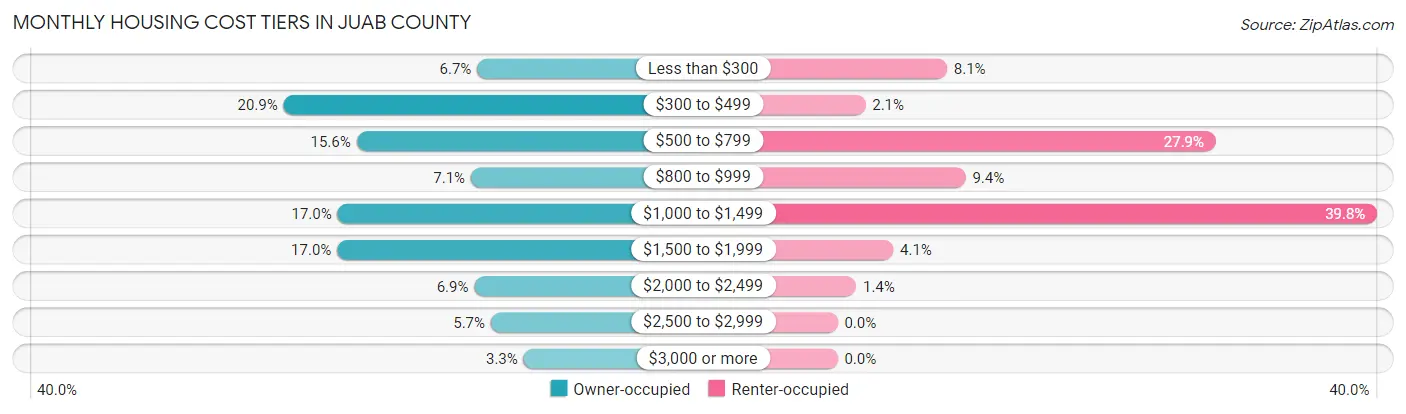
| Monthly Cost | Owner-occupied | Renter-occupied |
| Less than $300 | 191 (6.7%) | 59 (8.1%) |
| $300 to $499 | 599 (20.9%) | 15 (2.1%) |
| $500 to $799 | 445 (15.5%) | 204 (27.9%) |
| $800 to $999 | 204 (7.1%) | 69 (9.4%) |
| $1,000 to $1,499 | 485 (17.0%) | 291 (39.8%) |
| $1,500 to $1,999 | 486 (17.0%) | 30 (4.1%) |
| $2,000 to $2,499 | 197 (6.9%) | 10 (1.4%) |
| $2,500 to $2,999 | 162 (5.7%) | 0 (0.0%) |
| $3,000 or more | 93 (3.3%) | 0 (0.0%) |
| Total | 2,862 (100.0%) | 732 (100.0%) |
Physical Housing Characteristics in Juab County
Housing Structures in Juab County
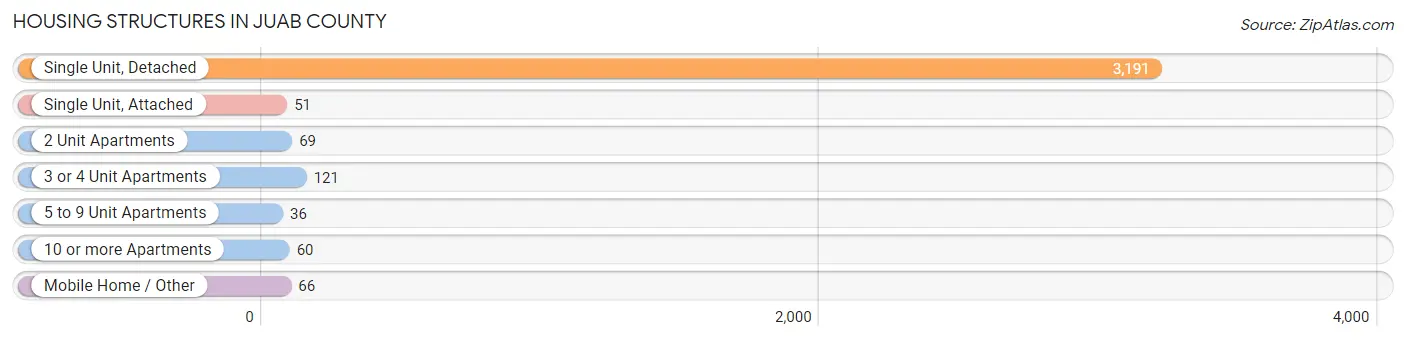
| Structure Type | # Housing Units | % Housing Units |
| Single Unit, Detached | 3,191 | 88.8% |
| Single Unit, Attached | 51 | 1.4% |
| 2 Unit Apartments | 69 | 1.9% |
| 3 or 4 Unit Apartments | 121 | 3.4% |
| 5 to 9 Unit Apartments | 36 | 1.0% |
| 10 or more Apartments | 60 | 1.7% |
| Mobile Home / Other | 66 | 1.8% |
| Total | 3,594 | 100.0% |
Housing Structures by Occupancy in Juab County
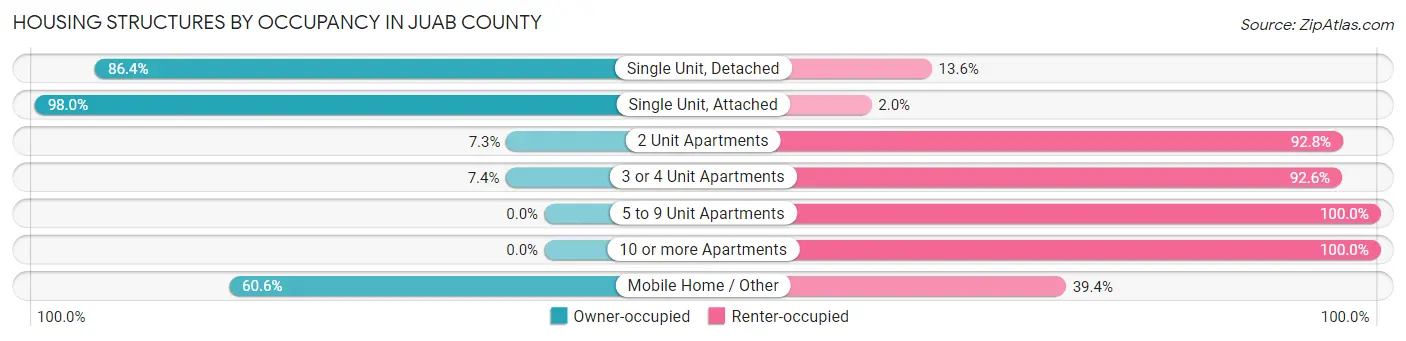
| Structure Type | Owner-occupied | Renter-occupied |
| Single Unit, Detached | 2,758 (86.4%) | 433 (13.6%) |
| Single Unit, Attached | 50 (98.0%) | 1 (2.0%) |
| 2 Unit Apartments | 5 (7.2%) | 64 (92.7%) |
| 3 or 4 Unit Apartments | 9 (7.4%) | 112 (92.6%) |
| 5 to 9 Unit Apartments | 0 (0.0%) | 36 (100.0%) |
| 10 or more Apartments | 0 (0.0%) | 60 (100.0%) |
| Mobile Home / Other | 40 (60.6%) | 26 (39.4%) |
| Total | 2,862 (79.6%) | 732 (20.4%) |
Housing Structures by Number of Rooms in Juab County
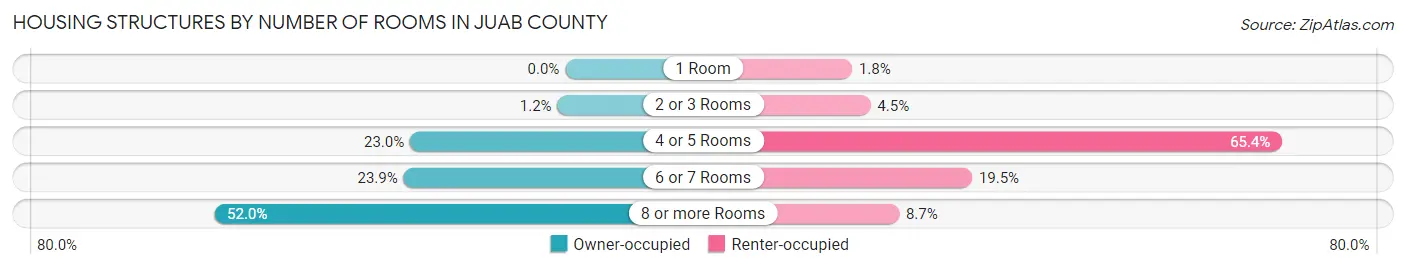
| Number of Rooms | Owner-occupied | Renter-occupied |
| 1 Room | 0 (0.0%) | 13 (1.8%) |
| 2 or 3 Rooms | 33 (1.1%) | 33 (4.5%) |
| 4 or 5 Rooms | 657 (23.0%) | 479 (65.4%) |
| 6 or 7 Rooms | 685 (23.9%) | 143 (19.5%) |
| 8 or more Rooms | 1,487 (52.0%) | 64 (8.7%) |
| Total | 2,862 (100.0%) | 732 (100.0%) |
Housing Structure by Heating Type in Juab County
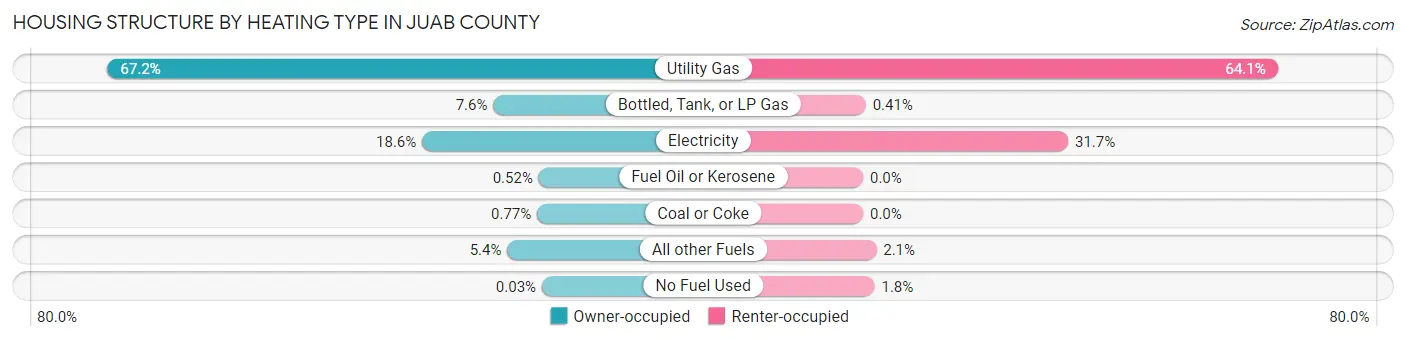
| Heating Type | Owner-occupied | Renter-occupied |
| Utility Gas | 1,923 (67.2%) | 469 (64.1%) |
| Bottled, Tank, or LP Gas | 216 (7.5%) | 3 (0.4%) |
| Electricity | 531 (18.5%) | 232 (31.7%) |
| Fuel Oil or Kerosene | 15 (0.5%) | 0 (0.0%) |
| Coal or Coke | 22 (0.8%) | 0 (0.0%) |
| All other Fuels | 154 (5.4%) | 15 (2.1%) |
| No Fuel Used | 1 (0.0%) | 13 (1.8%) |
| Total | 2,862 (100.0%) | 732 (100.0%) |
Household Vehicle Usage in Juab County
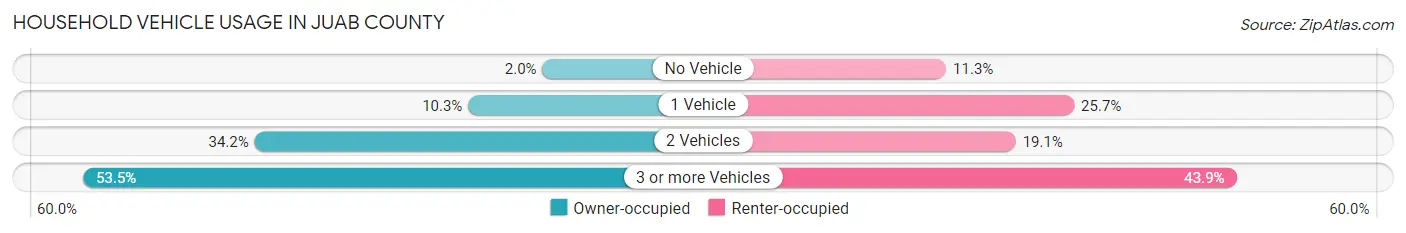
| Vehicles per Household | Owner-occupied | Renter-occupied |
| No Vehicle | 57 (2.0%) | 83 (11.3%) |
| 1 Vehicle | 295 (10.3%) | 188 (25.7%) |
| 2 Vehicles | 980 (34.2%) | 140 (19.1%) |
| 3 or more Vehicles | 1,530 (53.5%) | 321 (43.9%) |
| Total | 2,862 (100.0%) | 732 (100.0%) |
Real Estate & Mortgages in Juab County
Real Estate and Mortgage Overview in Juab County
| Characteristic | Without Mortgage | With Mortgage |
| Housing Units | 1,105 | 1,757 |
| Median Property Value | $305,400 | $330,100 |
| Median Household Income | $67,338 | $365 |
| Monthly Housing Costs | $406 | $93 |
| Real Estate Taxes | $1,566 | $49 |
Property Value by Mortgage Status in Juab County
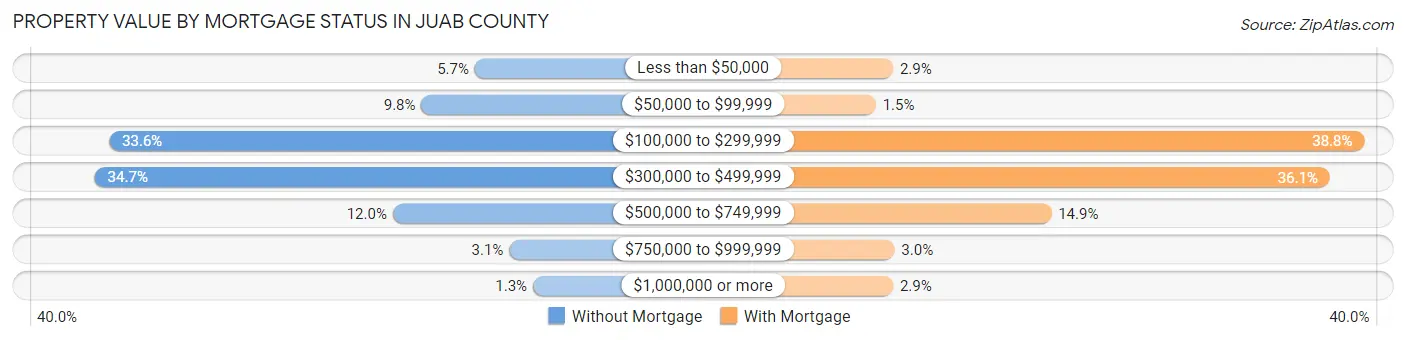
| Property Value | Without Mortgage | With Mortgage |
| Less than $50,000 | 63 (5.7%) | 50 (2.9%) |
| $50,000 to $99,999 | 108 (9.8%) | 27 (1.5%) |
| $100,000 to $299,999 | 371 (33.6%) | 681 (38.8%) |
| $300,000 to $499,999 | 383 (34.7%) | 635 (36.1%) |
| $500,000 to $749,999 | 132 (11.9%) | 262 (14.9%) |
| $750,000 to $999,999 | 34 (3.1%) | 52 (3.0%) |
| $1,000,000 or more | 14 (1.3%) | 50 (2.9%) |
| Total | 1,105 (100.0%) | 1,757 (100.0%) |
Household Income by Mortgage Status in Juab County
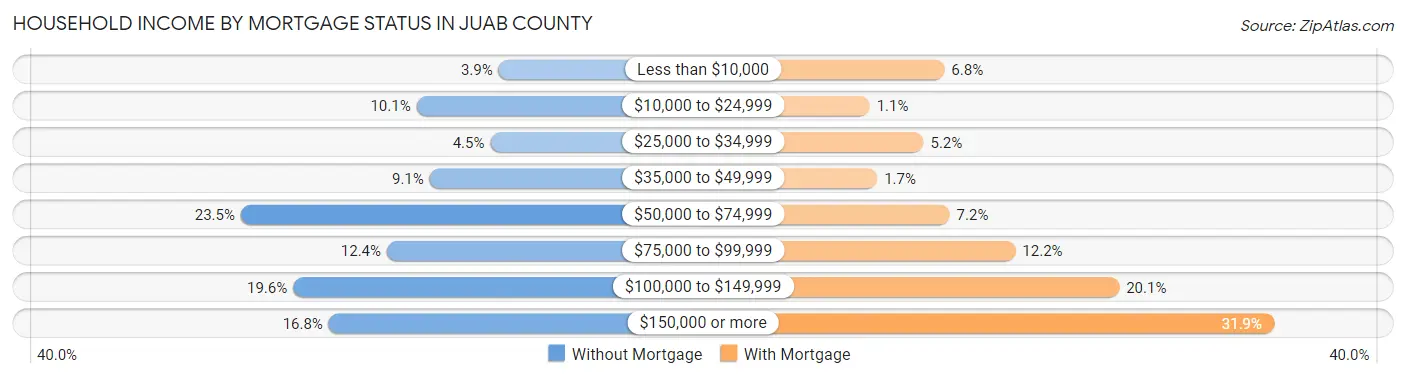
| Household Income | Without Mortgage | With Mortgage |
| Less than $10,000 | 43 (3.9%) | 119 (6.8%) |
| $10,000 to $24,999 | 112 (10.1%) | 19 (1.1%) |
| $25,000 to $34,999 | 50 (4.5%) | 91 (5.2%) |
| $35,000 to $49,999 | 101 (9.1%) | 29 (1.7%) |
| $50,000 to $74,999 | 260 (23.5%) | 126 (7.2%) |
| $75,000 to $99,999 | 137 (12.4%) | 214 (12.2%) |
| $100,000 to $149,999 | 216 (19.6%) | 353 (20.1%) |
| $150,000 or more | 186 (16.8%) | 560 (31.9%) |
| Total | 1,105 (100.0%) | 1,757 (100.0%) |
Property Value to Household Income Ratio in Juab County
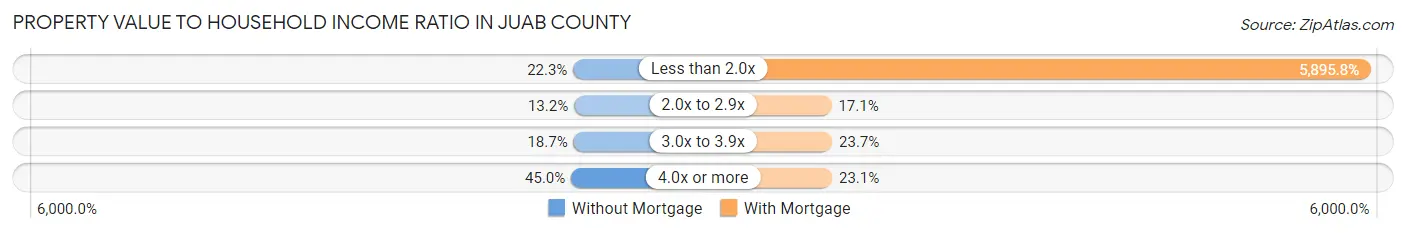
| Value-to-Income Ratio | Without Mortgage | With Mortgage |
| Less than 2.0x | 246 (22.3%) | 103,589 (5,895.8%) |
| 2.0x to 2.9x | 146 (13.2%) | 300 (17.1%) |
| 3.0x to 3.9x | 207 (18.7%) | 417 (23.7%) |
| 4.0x or more | 497 (45.0%) | 406 (23.1%) |
| Total | 1,105 (100.0%) | 1,757 (100.0%) |
Real Estate Taxes by Mortgage Status in Juab County
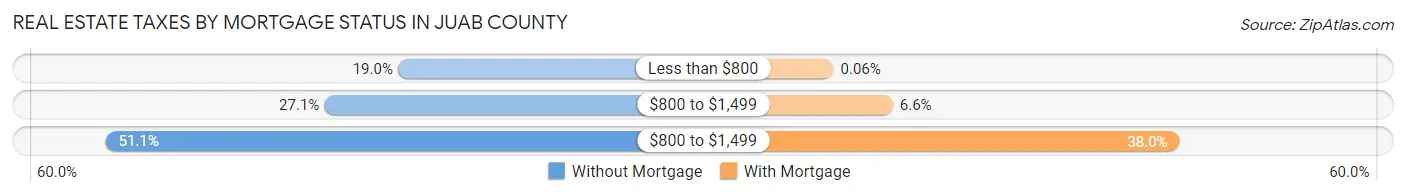
| Property Taxes | Without Mortgage | With Mortgage |
| Less than $800 | 210 (19.0%) | 1 (0.1%) |
| $800 to $1,499 | 299 (27.1%) | 115 (6.6%) |
| $800 to $1,499 | 565 (51.1%) | 667 (38.0%) |
| Total | 1,105 (100.0%) | 1,757 (100.0%) |
Health & Disability in Juab County
Health Insurance Coverage by Age in Juab County
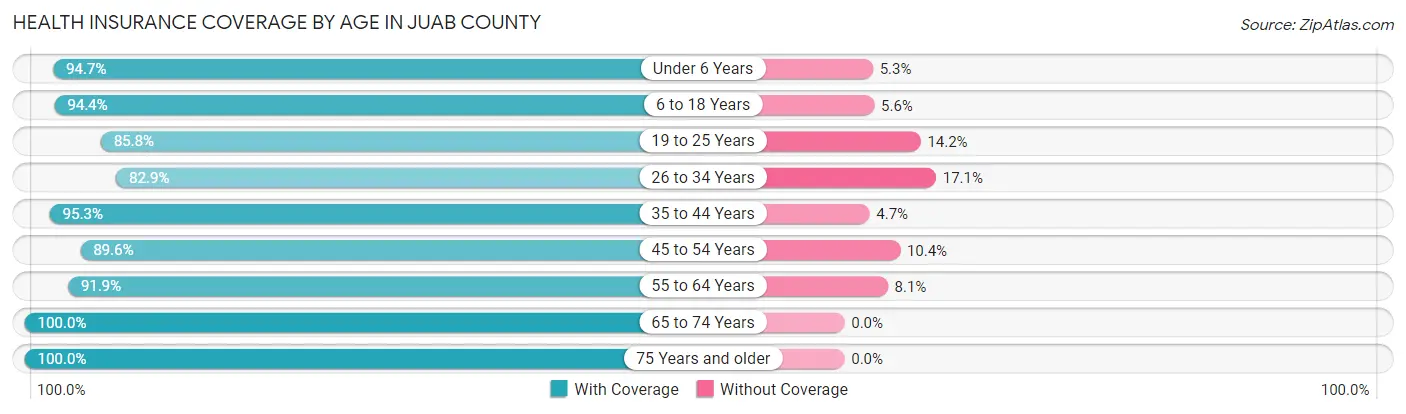
| Age Bracket | With Coverage | Without Coverage |
| Under 6 Years | 1,019 (94.7%) | 57 (5.3%) |
| 6 to 18 Years | 2,937 (94.4%) | 173 (5.6%) |
| 19 to 25 Years | 961 (85.8%) | 159 (14.2%) |
| 26 to 34 Years | 1,065 (82.9%) | 219 (17.1%) |
| 35 to 44 Years | 1,429 (95.3%) | 70 (4.7%) |
| 45 to 54 Years | 1,122 (89.6%) | 130 (10.4%) |
| 55 to 64 Years | 923 (91.9%) | 81 (8.1%) |
| 65 to 74 Years | 894 (100.0%) | 0 (0.0%) |
| 75 Years and older | 584 (100.0%) | 0 (0.0%) |
| Total | 10,934 (92.5%) | 889 (7.5%) |
Health Insurance Coverage by Citizenship Status in Juab County
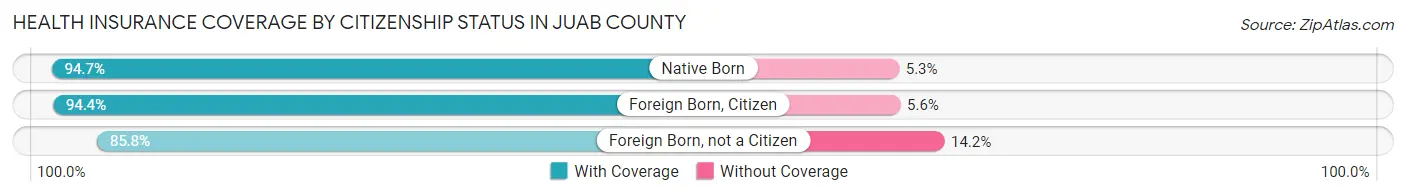
| Citizenship Status | With Coverage | Without Coverage |
| Native Born | 1,019 (94.7%) | 57 (5.3%) |
| Foreign Born, Citizen | 2,937 (94.4%) | 173 (5.6%) |
| Foreign Born, not a Citizen | 961 (85.8%) | 159 (14.2%) |
Health Insurance Coverage by Household Income in Juab County
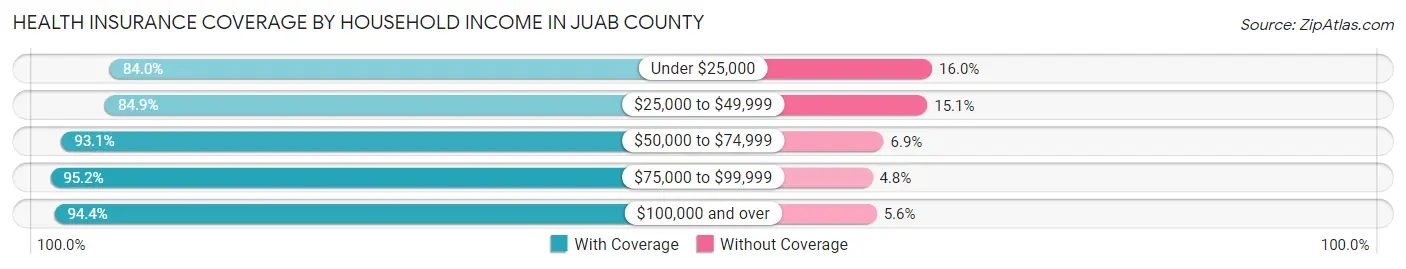
| Household Income | With Coverage | Without Coverage |
| Under $25,000 | 678 (84.0%) | 129 (16.0%) |
| $25,000 to $49,999 | 1,154 (84.9%) | 205 (15.1%) |
| $50,000 to $74,999 | 1,554 (93.1%) | 115 (6.9%) |
| $75,000 to $99,999 | 1,763 (95.2%) | 89 (4.8%) |
| $100,000 and over | 5,747 (94.4%) | 341 (5.6%) |
Public vs Private Health Insurance Coverage by Age in Juab County
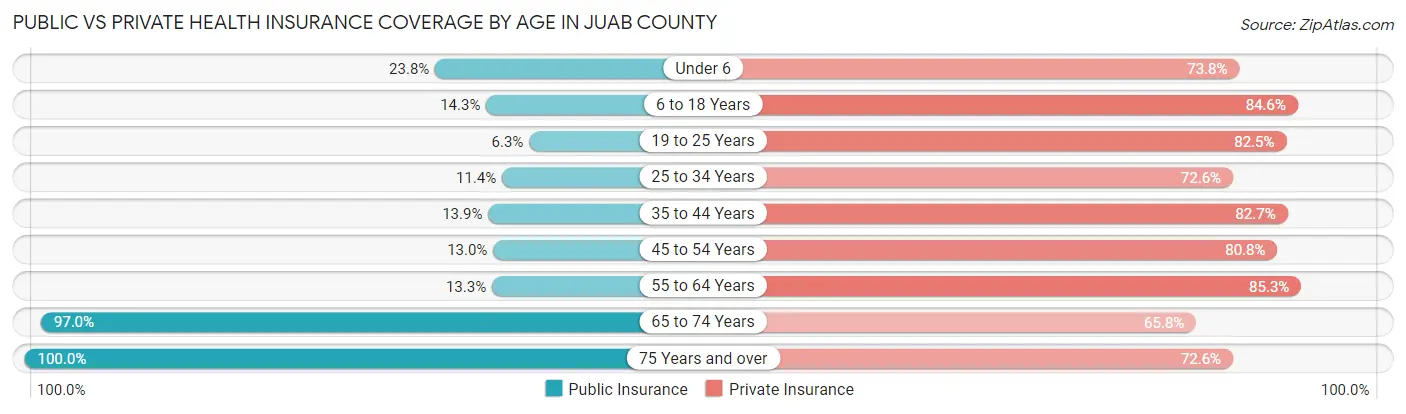
| Age Bracket | Public Insurance | Private Insurance |
| Under 6 | 256 (23.8%) | 794 (73.8%) |
| 6 to 18 Years | 445 (14.3%) | 2,632 (84.6%) |
| 19 to 25 Years | 71 (6.3%) | 924 (82.5%) |
| 25 to 34 Years | 146 (11.4%) | 932 (72.6%) |
| 35 to 44 Years | 209 (13.9%) | 1,240 (82.7%) |
| 45 to 54 Years | 163 (13.0%) | 1,012 (80.8%) |
| 55 to 64 Years | 133 (13.3%) | 856 (85.3%) |
| 65 to 74 Years | 867 (97.0%) | 588 (65.8%) |
| 75 Years and over | 584 (100.0%) | 424 (72.6%) |
| Total | 2,874 (24.3%) | 9,402 (79.5%) |
Disability Status by Sex by Age in Juab County
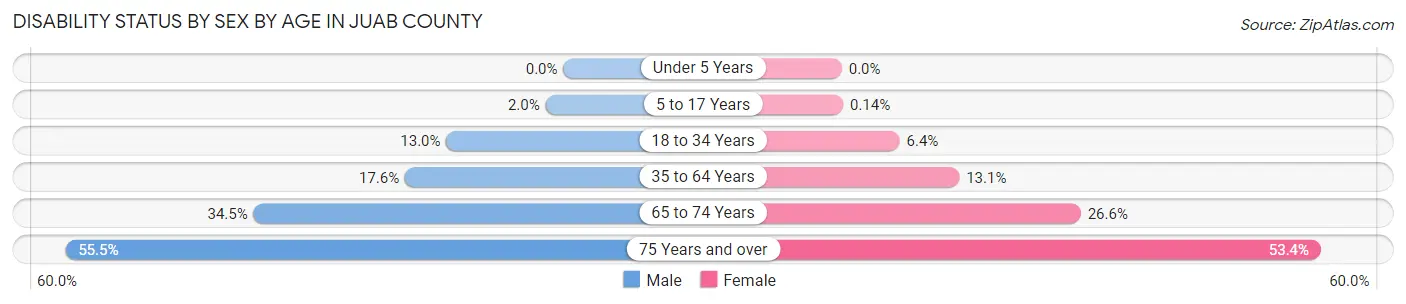
| Age Bracket | Male | Female |
| Under 5 Years | 0 (0.0%) | 0 (0.0%) |
| 5 to 17 Years | 34 (2.0%) | 2 (0.1%) |
| 18 to 34 Years | 176 (13.0%) | 79 (6.4%) |
| 35 to 64 Years | 340 (17.6%) | 239 (13.1%) |
| 65 to 74 Years | 158 (34.5%) | 116 (26.6%) |
| 75 Years and over | 142 (55.5%) | 175 (53.3%) |
Disability Class by Sex by Age in Juab County
Disability Class: Hearing Difficulty
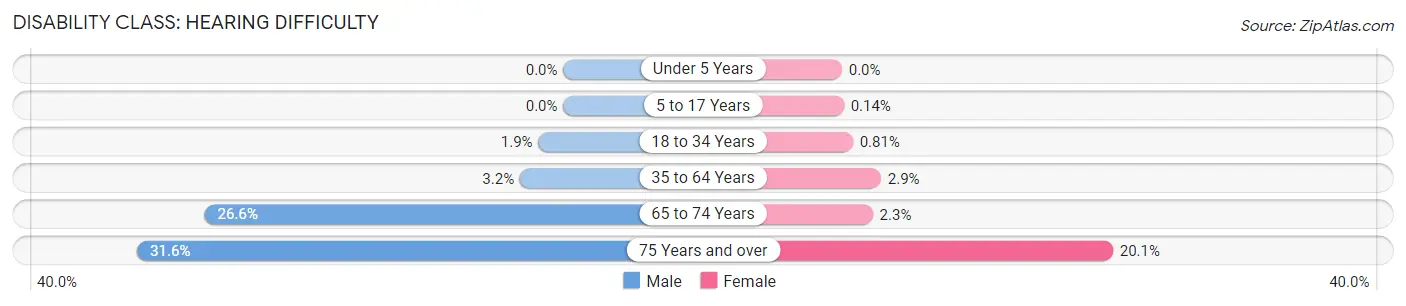
| Age Bracket | Male | Female |
| Under 5 Years | 0 (0.0%) | 0 (0.0%) |
| 5 to 17 Years | 0 (0.0%) | 2 (0.1%) |
| 18 to 34 Years | 25 (1.8%) | 10 (0.8%) |
| 35 to 64 Years | 62 (3.2%) | 53 (2.9%) |
| 65 to 74 Years | 122 (26.6%) | 10 (2.3%) |
| 75 Years and over | 81 (31.6%) | 66 (20.1%) |
Disability Class: Vision Difficulty
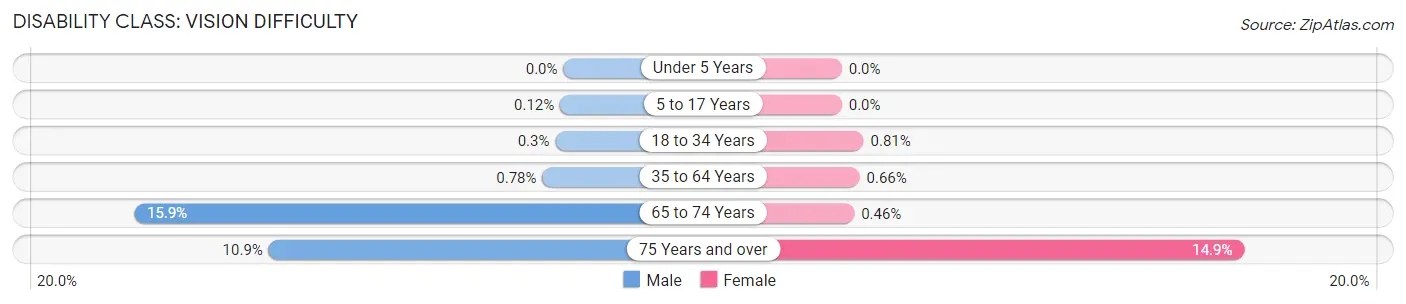
| Age Bracket | Male | Female |
| Under 5 Years | 0 (0.0%) | 0 (0.0%) |
| 5 to 17 Years | 2 (0.1%) | 0 (0.0%) |
| 18 to 34 Years | 4 (0.3%) | 10 (0.8%) |
| 35 to 64 Years | 15 (0.8%) | 12 (0.7%) |
| 65 to 74 Years | 73 (15.9%) | 2 (0.5%) |
| 75 Years and over | 28 (10.9%) | 49 (14.9%) |
Disability Class: Cognitive Difficulty
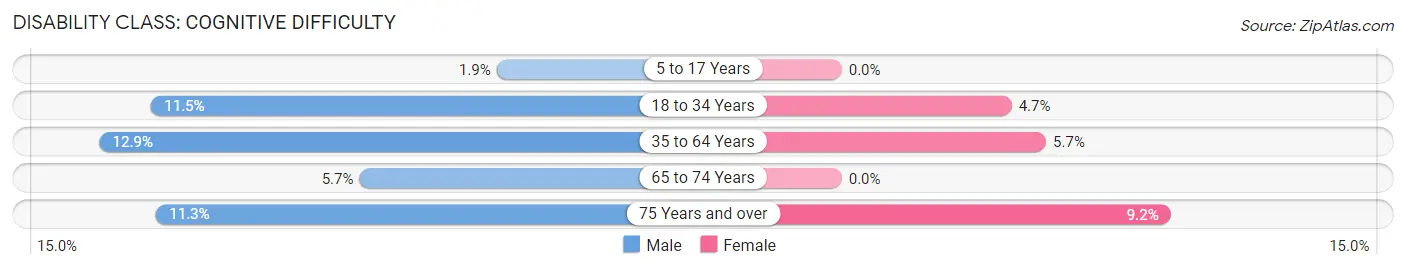
| Age Bracket | Male | Female |
| 5 to 17 Years | 32 (1.9%) | 0 (0.0%) |
| 18 to 34 Years | 155 (11.5%) | 58 (4.7%) |
| 35 to 64 Years | 249 (12.9%) | 104 (5.7%) |
| 65 to 74 Years | 26 (5.7%) | 0 (0.0%) |
| 75 Years and over | 29 (11.3%) | 30 (9.1%) |
Disability Class: Ambulatory Difficulty

| Age Bracket | Male | Female |
| 5 to 17 Years | 7 (0.4%) | 0 (0.0%) |
| 18 to 34 Years | 20 (1.5%) | 0 (0.0%) |
| 35 to 64 Years | 22 (1.1%) | 90 (4.9%) |
| 65 to 74 Years | 125 (27.3%) | 106 (24.3%) |
| 75 Years and over | 101 (39.5%) | 145 (44.2%) |
Disability Class: Self-Care Difficulty
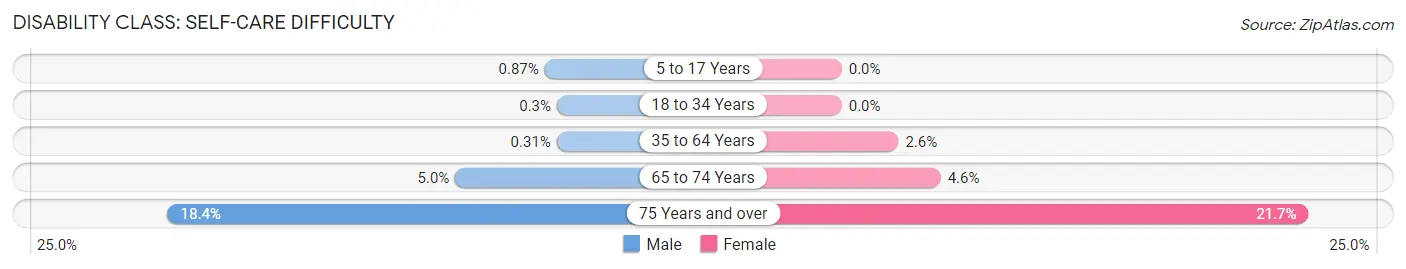
| Age Bracket | Male | Female |
| 5 to 17 Years | 15 (0.9%) | 0 (0.0%) |
| 18 to 34 Years | 4 (0.3%) | 0 (0.0%) |
| 35 to 64 Years | 6 (0.3%) | 48 (2.6%) |
| 65 to 74 Years | 23 (5.0%) | 20 (4.6%) |
| 75 Years and over | 47 (18.4%) | 71 (21.6%) |
Technology Access in Juab County
Computing Device Access in Juab County
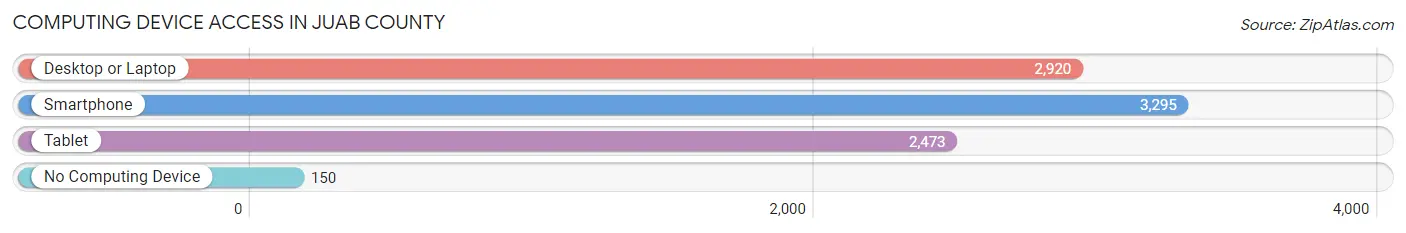
| Device Type | # Households | % Households |
| Desktop or Laptop | 2,920 | 81.2% |
| Smartphone | 3,295 | 91.7% |
| Tablet | 2,473 | 68.8% |
| No Computing Device | 150 | 4.2% |
| Total | 3,594 | 100.0% |
Internet Access in Juab County
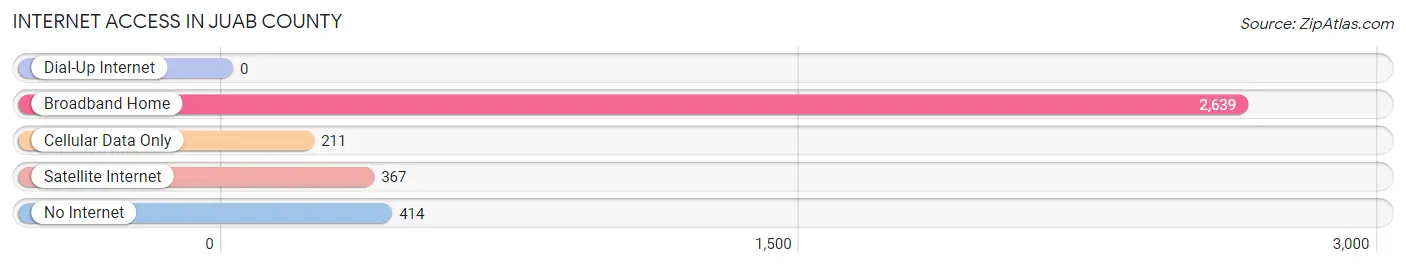
| Internet Type | # Households | % Households |
| Dial-Up Internet | 0 | 0.0% |
| Broadband Home | 2,639 | 73.4% |
| Cellular Data Only | 211 | 5.9% |
| Satellite Internet | 367 | 10.2% |
| No Internet | 414 | 11.5% |
| Total | 3,594 | 100.0% |
Juab County Summary
Juab County is located in the central part of Utah, and is bordered by Utah, Millard, Sanpete, Sevier, and Tooele counties. It is part of the Provo-Orem Metropolitan Statistical Area. The county seat is Nephi, and the largest city is Nephi. As of the 2010 census, the population was 10,246.
History
Juab County was created in 1852 as part of the Utah Territory. It was named after the Juab Valley, which was named after the Native American tribe that lived in the area. The first settlers in the area were Mormon pioneers, who arrived in 1851. The county was initially part of Utah County, but was split off in 1856.
Geography
Juab County covers an area of 2,717 square miles, making it the fourth-largest county in Utah. The county is located in the Great Basin region of the state, and is mostly made up of desert and semi-arid land. The county is bordered by the Wasatch Mountains to the east, the Tintic Mountains to the west, and the San Pitch Mountains to the south. The highest point in the county is Mount Nebo, which has an elevation of 11,928 feet.
The county is home to several rivers and streams, including the Sevier River, the San Pitch River, and the Juab River. The county also contains several reservoirs, including the Yuba Reservoir, the Mona Reservoir, and the Nephi Reservoir.
Economy
The economy of Juab County is largely based on agriculture and mining. The county is home to several large farms, which produce a variety of crops, including hay, alfalfa, wheat, and corn. The county is also home to several large mining operations, which produce copper, gold, silver, and other minerals.
The county is also home to several manufacturing companies, which produce a variety of products, including furniture, clothing, and electronics. The county is also home to several retail stores, restaurants, and other businesses.
Demographics
As of the 2010 census, the population of Juab County was 10,246. The population was spread out, with 25.3% under the age of 18, 8.2% from 18 to 24, 24.2% from 25 to 44, 28.2% from 45 to 64, and 14.1% who were 65 years of age or older. The median age was 38.4 years.
The racial makeup of the county was 91.2% White, 0.3% African American, 0.7% Native American, 0.3% Asian, 0.1% Pacific Islander, 5.3% from other races, and 2.2% from two or more races. Hispanic or Latino of any race were 11.2% of the population.
The median income for a household in the county was $45,945, and the median income for a family was $51,945. The per capita income for the county was $20,945. About 8.2% of families and 10.3% of the population were below the poverty line, including 13.2% of those under age 18 and 8.2% of those age 65 or over.
Common Questions
What is the Total Population of Juab County?
Total Population of Juab County is 11,943.
What is the Total Male Population of Juab County?
Total Male Population of Juab County is 6,287.
What is the Total Female Population of Juab County?
Total Female Population of Juab County is 5,656.
What is the Ratio of Males per 100 Females in Juab County?
There are 111.16 Males per 100 Females in Juab County.
What is the Ratio of Females per 100 Males in Juab County?
There are 89.96 Females per 100 Males in Juab County.
What is the Median Population Age in Juab County?
Median Population Age in Juab County is 30.1 Years.
What is the Average Family Size in Juab County
Average Family Size in Juab County is 3.7 People.
What is the Average Household Size in Juab County
Average Household Size in Juab County is 3.3 People.
What is Per Capita Income in Juab County?
Per Capita income in Juab County is $31,545.
What is the Median Family Income in Juab County?
Median Family Income in Juab County is $96,812.
What is the Median Household income in Juab County?
Median Household Income in Juab County is $88,048.
What is Income or Wage Gap in Juab County?
Income or Wage Gap in Juab County is 37.7%.
Women in Juab County earn 62.3 cents for every dollar earned by a man.
What is Family Income Deficit in Juab County?
Family Income Deficit in Juab County is $10,919.
Families that are below poverty line in Juab County earn $10,919 less on average than the poverty threshold level.
What is Inequality or Gini Index in Juab County?
Inequality or Gini Index in Juab County is 0.38.
How Large is the Labor Force in Juab County?
There are 5,605 People in the Labor Forcein in Juab County.
What is the Percentage of People in the Labor Force in Juab County?
66.4% of People are in the Labor Force in Juab County.
What is the Unemployment Rate in Juab County?
Unemployment Rate in Juab County is 1.9%.