Iron County, UT
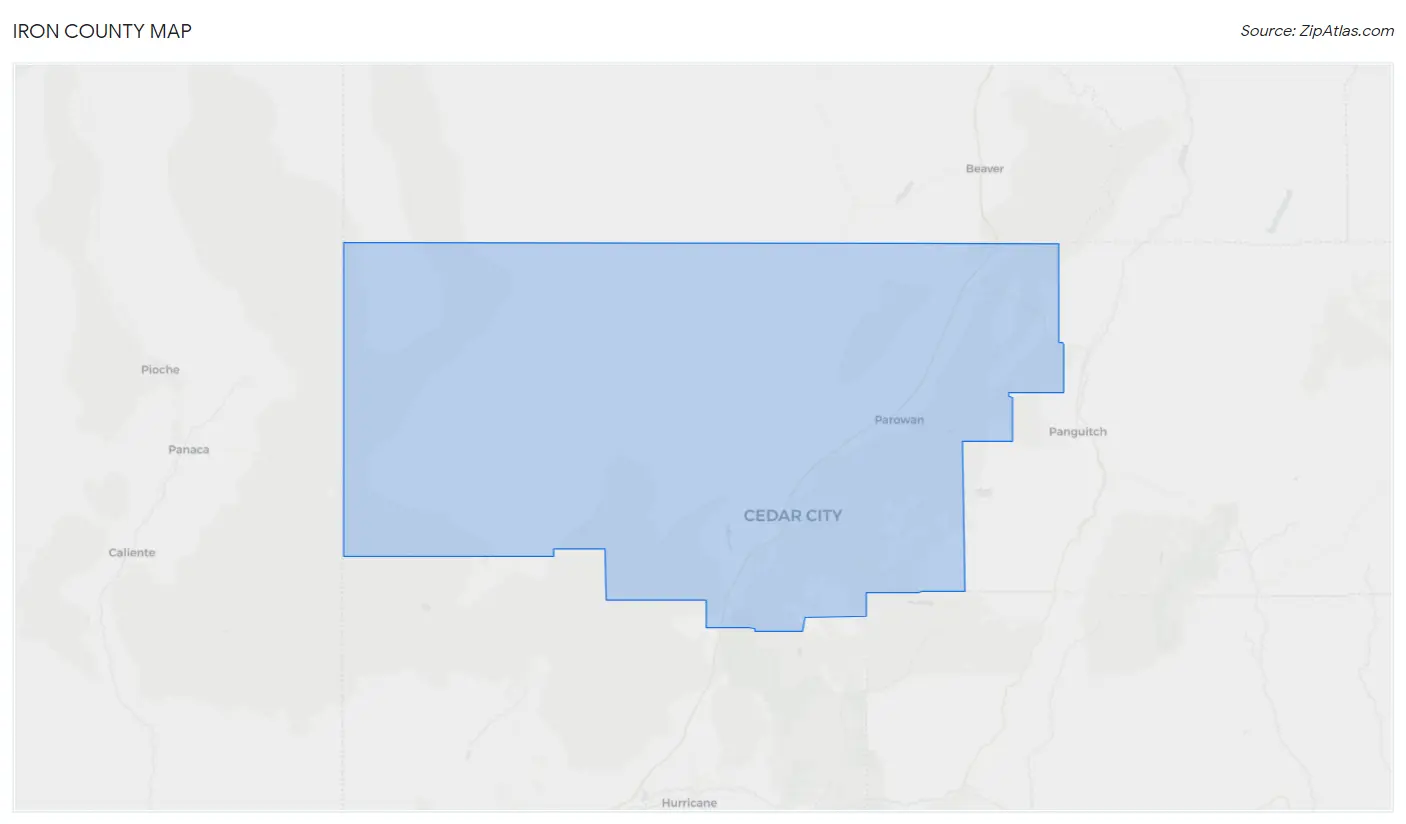
Iron County Map
Iron County Overview
58,068
TOTAL POPULATION
29,210
MALE POPULATION
28,858
FEMALE POPULATION
101.22
MALES / 100 FEMALES
98.79
FEMALES / 100 MALES
29.5
MEDIAN AGE
3.6
AVG FAMILY SIZE
3.1
AVG HOUSEHOLD SIZE
$26,650
PER CAPITA INCOME
$78,002
AVG FAMILY INCOME
$63,005
AVG HOUSEHOLD INCOME
54.7%
WAGE / INCOME GAP [ % ]
45.3¢/ $1
WAGE / INCOME GAP [ $ ]
$9,260
FAMILY INCOME DEFICIT
0.42
INEQUALITY / GINI INDEX
28,214
LABOR FORCE [ PEOPLE ]
64.4%
PERCENT IN LABOR FORCE
3.3%
UNEMPLOYMENT RATE
Iron County Area Codes
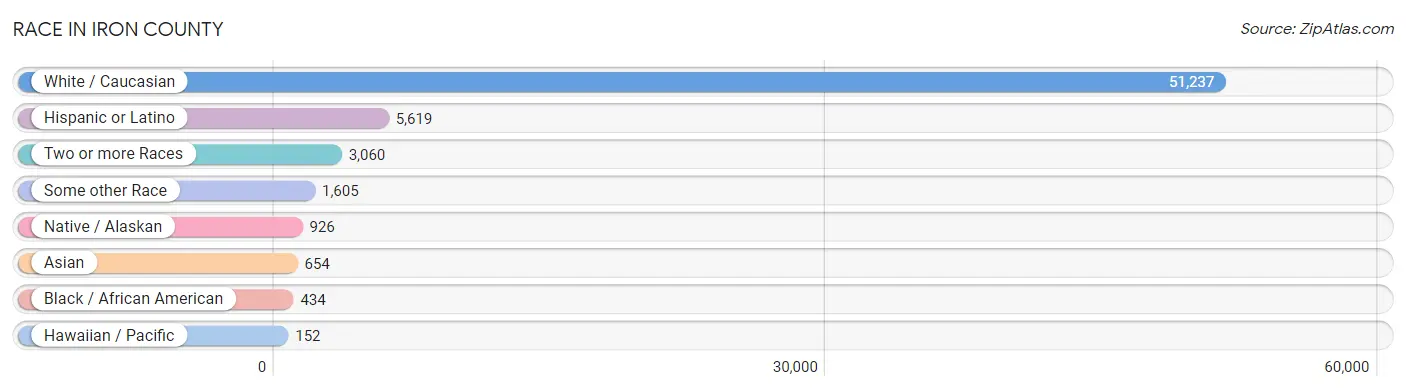
Race in Iron County
The most populous races in Iron County are White / Caucasian (51,237 | 88.2%), Hispanic or Latino (5,619 | 9.7%), and Two or more Races (3,060 | 5.3%).
| Race | # Population | % Population |
| Asian | 654 | 1.1% |
| Black / African American | 434 | 0.7% |
| Hawaiian / Pacific | 152 | 0.3% |
| Hispanic or Latino | 5,619 | 9.7% |
| Native / Alaskan | 926 | 1.6% |
| White / Caucasian | 51,237 | 88.2% |
| Two or more Races | 3,060 | 5.3% |
| Some other Race | 1,605 | 2.8% |
| Total | 58,068 | 100.0% |
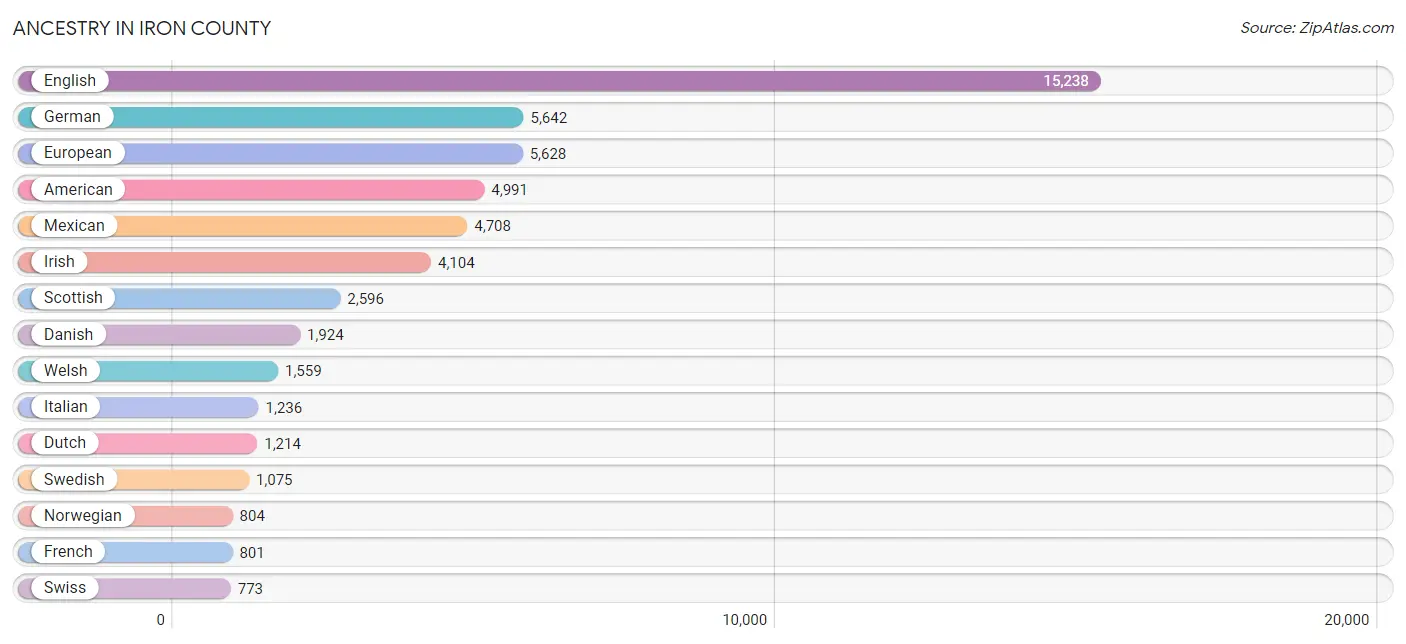
Ancestry in Iron County
The most populous ancestries reported in Iron County are English (15,238 | 26.2%), German (5,642 | 9.7%), European (5,628 | 9.7%), American (4,991 | 8.6%), and Mexican (4,708 | 8.1%), together accounting for 62.4% of all Iron County residents.
| Ancestry | # Population | % Population |
| African | 55 | 0.1% |
| Alaska Native | 43 | 0.1% |
| American | 4,991 | 8.6% |
| Arab | 144 | 0.3% |
| Argentinean | 142 | 0.2% |
| Armenian | 8 | 0.0% |
| Australian | 39 | 0.1% |
| Austrian | 24 | 0.0% |
| Barbadian | 17 | 0.0% |
| Belgian | 15 | 0.0% |
| Bhutanese | 220 | 0.4% |
| Blackfeet | 33 | 0.1% |
| Brazilian | 136 | 0.2% |
| British | 756 | 1.3% |
| Burmese | 75 | 0.1% |
| Cambodian | 2 | 0.0% |
| Canadian | 107 | 0.2% |
| Central American | 169 | 0.3% |
| Central American Indian | 43 | 0.1% |
| Cherokee | 310 | 0.5% |
| Chilean | 18 | 0.0% |
| Choctaw | 12 | 0.0% |
| Colombian | 125 | 0.2% |
| Costa Rican | 45 | 0.1% |
| Croatian | 45 | 0.1% |
| Cuban | 45 | 0.1% |
| Czech | 60 | 0.1% |
| Czechoslovakian | 31 | 0.1% |
| Danish | 1,924 | 3.3% |
| Dutch | 1,214 | 2.1% |
| English | 15,238 | 26.2% |
| European | 5,628 | 9.7% |
| Filipino | 12 | 0.0% |
| Finnish | 20 | 0.0% |
| French | 801 | 1.4% |
| French Canadian | 158 | 0.3% |
| German | 5,642 | 9.7% |
| Ghanaian | 19 | 0.0% |
| Greek | 122 | 0.2% |
| Guamanian / Chamorro | 6 | 0.0% |
| Guatemalan | 17 | 0.0% |
| Hopi | 13 | 0.0% |
| Hungarian | 190 | 0.3% |
| Icelander | 51 | 0.1% |
| Indian (Asian) | 295 | 0.5% |
| Iranian | 39 | 0.1% |
| Irish | 4,104 | 7.1% |
| Iroquois | 28 | 0.1% |
| Italian | 1,236 | 2.1% |
| Korean | 91 | 0.2% |
| Lebanese | 111 | 0.2% |
| Lithuanian | 67 | 0.1% |
| Mexican | 4,708 | 8.1% |
| Mexican American Indian | 242 | 0.4% |
| Native Hawaiian | 147 | 0.3% |
| Navajo | 404 | 0.7% |
| Nicaraguan | 8 | 0.0% |
| Northern European | 110 | 0.2% |
| Norwegian | 804 | 1.4% |
| Paiute | 167 | 0.3% |
| Pakistani | 14 | 0.0% |
| Peruvian | 10 | 0.0% |
| Polish | 425 | 0.7% |
| Portuguese | 199 | 0.3% |
| Puerto Rican | 23 | 0.0% |
| Romanian | 17 | 0.0% |
| Russian | 91 | 0.2% |
| Salvadoran | 99 | 0.2% |
| Samoan | 157 | 0.3% |
| Scandinavian | 688 | 1.2% |
| Scotch-Irish | 421 | 0.7% |
| Scottish | 2,596 | 4.5% |
| Shoshone | 25 | 0.0% |
| Sioux | 2 | 0.0% |
| Slovak | 36 | 0.1% |
| South American | 295 | 0.5% |
| Spaniard | 70 | 0.1% |
| Spanish | 136 | 0.2% |
| Sri Lankan | 31 | 0.1% |
| Subsaharan African | 74 | 0.1% |
| Swedish | 1,075 | 1.8% |
| Swiss | 773 | 1.3% |
| Thai | 274 | 0.5% |
| Tongan | 135 | 0.2% |
| Ukrainian | 22 | 0.0% |
| Ute | 1 | 0.0% |
| Welsh | 1,559 | 2.7% |
| Yugoslavian | 20 | 0.0% |
| Yuman | 8 | 0.0% |
| Yup'ik | 27 | 0.1% | View All 90 Rows |
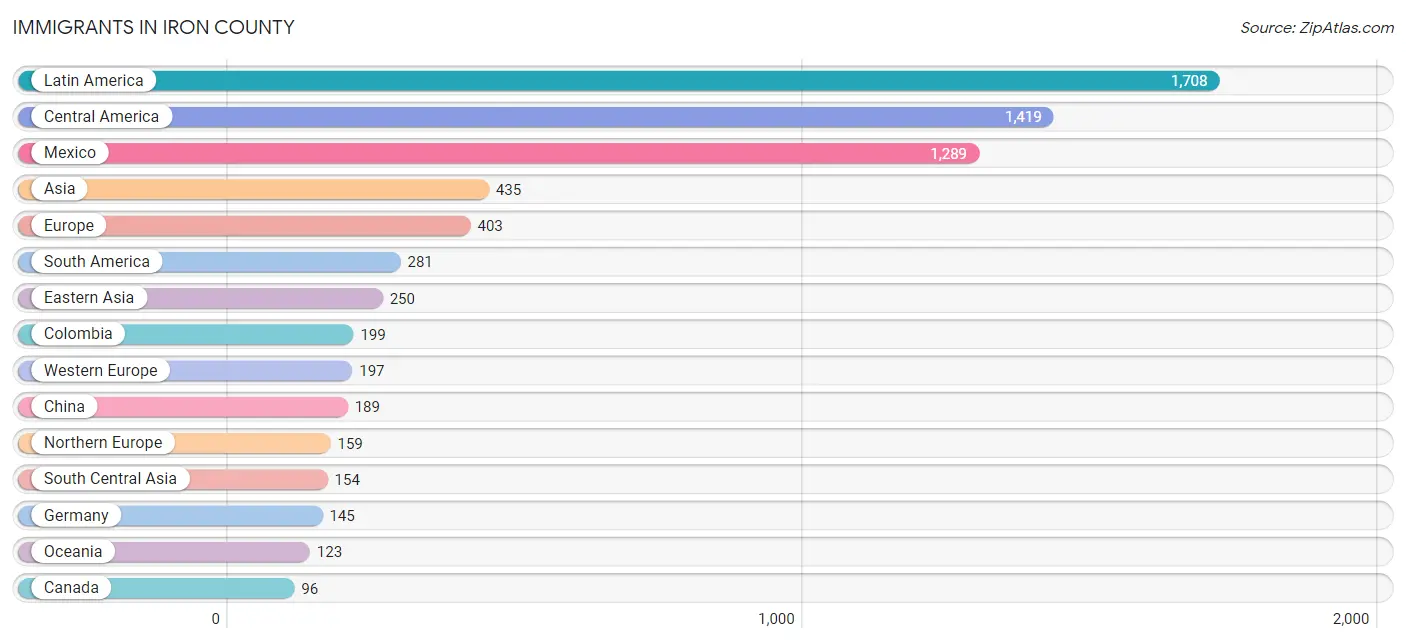
Immigrants in Iron County
The most numerous immigrant groups reported in Iron County came from Latin America (1,708 | 2.9%), Central America (1,419 | 2.4%), Mexico (1,289 | 2.2%), Asia (435 | 0.7%), and Europe (403 | 0.7%), together accounting for 9.0% of all Iron County residents.
| Immigration Origin | # Population | % Population |
| Africa | 85 | 0.2% |
| Argentina | 11 | 0.0% |
| Asia | 435 | 0.7% |
| Australia | 67 | 0.1% |
| Brazil | 42 | 0.1% |
| Canada | 96 | 0.2% |
| Caribbean | 8 | 0.0% |
| Central America | 1,419 | 2.4% |
| Chile | 18 | 0.0% |
| China | 189 | 0.3% |
| Colombia | 199 | 0.3% |
| Congo | 28 | 0.1% |
| Costa Rica | 45 | 0.1% |
| Denmark | 27 | 0.1% |
| Eastern Africa | 11 | 0.0% |
| Eastern Asia | 250 | 0.4% |
| Eastern Europe | 24 | 0.0% |
| England | 83 | 0.1% |
| Europe | 403 | 0.7% |
| France | 11 | 0.0% |
| Germany | 145 | 0.3% |
| Ghana | 19 | 0.0% |
| Guatemala | 85 | 0.2% |
| Hong Kong | 52 | 0.1% |
| India | 52 | 0.1% |
| Iran | 67 | 0.1% |
| Italy | 23 | 0.0% |
| Japan | 56 | 0.1% |
| Kazakhstan | 3 | 0.0% |
| Kenya | 9 | 0.0% |
| Korea | 1 | 0.0% |
| Latin America | 1,708 | 2.9% |
| Mexico | 1,289 | 2.2% |
| Middle Africa | 28 | 0.1% |
| Morocco | 27 | 0.1% |
| Nepal | 19 | 0.0% |
| Netherlands | 9 | 0.0% |
| Northern Africa | 27 | 0.1% |
| Northern Europe | 159 | 0.3% |
| Oceania | 123 | 0.2% |
| Peru | 11 | 0.0% |
| Philippines | 24 | 0.0% |
| Romania | 10 | 0.0% |
| South America | 281 | 0.5% |
| South Central Asia | 154 | 0.3% |
| South Eastern Asia | 31 | 0.1% |
| Southern Europe | 23 | 0.0% |
| Switzerland | 32 | 0.1% |
| Taiwan | 12 | 0.0% |
| Thailand | 7 | 0.0% |
| Trinidad and Tobago | 8 | 0.0% |
| Western Africa | 19 | 0.0% |
| Western Europe | 197 | 0.3% | View All 53 Rows |
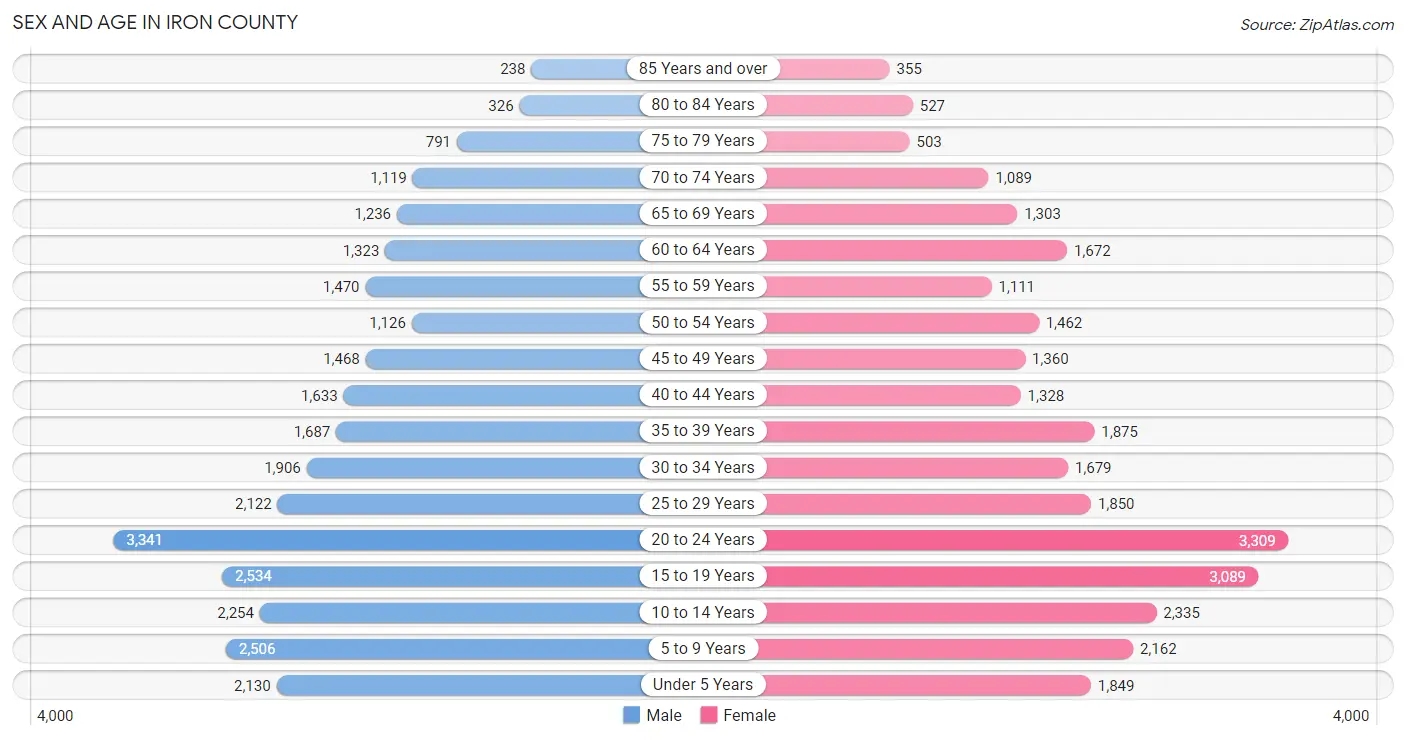
Sex and Age in Iron County
Sex and Age in Iron County
The most populous age groups in Iron County are 20 to 24 Years (3,341 | 11.4%) for men and 20 to 24 Years (3,309 | 11.5%) for women.
| Age Bracket | Male | Female |
| Under 5 Years | 2,130 (7.3%) | 1,849 (6.4%) |
| 5 to 9 Years | 2,506 (8.6%) | 2,162 (7.5%) |
| 10 to 14 Years | 2,254 (7.7%) | 2,335 (8.1%) |
| 15 to 19 Years | 2,534 (8.7%) | 3,089 (10.7%) |
| 20 to 24 Years | 3,341 (11.4%) | 3,309 (11.5%) |
| 25 to 29 Years | 2,122 (7.3%) | 1,850 (6.4%) |
| 30 to 34 Years | 1,906 (6.5%) | 1,679 (5.8%) |
| 35 to 39 Years | 1,687 (5.8%) | 1,875 (6.5%) |
| 40 to 44 Years | 1,633 (5.6%) | 1,328 (4.6%) |
| 45 to 49 Years | 1,468 (5.0%) | 1,360 (4.7%) |
| 50 to 54 Years | 1,126 (3.8%) | 1,462 (5.1%) |
| 55 to 59 Years | 1,470 (5.0%) | 1,111 (3.8%) |
| 60 to 64 Years | 1,323 (4.5%) | 1,672 (5.8%) |
| 65 to 69 Years | 1,236 (4.2%) | 1,303 (4.5%) |
| 70 to 74 Years | 1,119 (3.8%) | 1,089 (3.8%) |
| 75 to 79 Years | 791 (2.7%) | 503 (1.7%) |
| 80 to 84 Years | 326 (1.1%) | 527 (1.8%) |
| 85 Years and over | 238 (0.8%) | 355 (1.2%) |
| Total | 29,210 (100.0%) | 28,858 (100.0%) |
Families and Households in Iron County
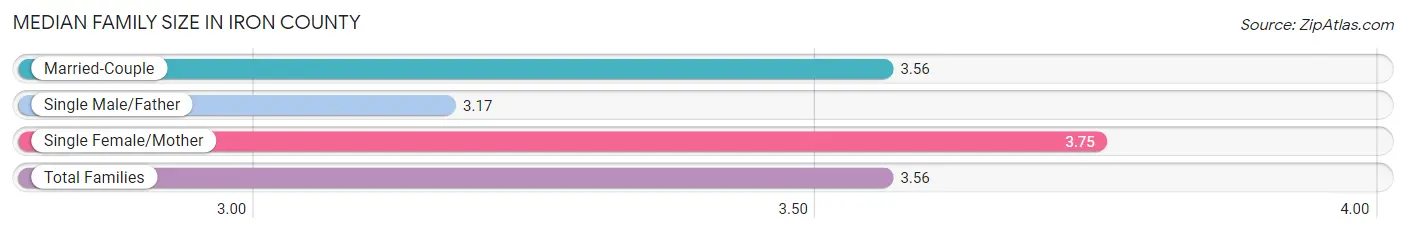
Median Family Size in Iron County
The median family size in Iron County is 3.56 persons per family, with single female/mother families (1,429 | 10.7%) accounting for the largest median family size of 3.75 persons per family. On the other hand, single male/father families (813 | 6.1%) represent the smallest median family size with 3.17 persons per family.
| Family Type | # Families | Family Size |
| Married-Couple | 11,148 (83.3%) | 3.56 |
| Single Male/Father | 813 (6.1%) | 3.17 |
| Single Female/Mother | 1,429 (10.7%) | 3.75 |
| Total Families | 13,390 (100.0%) | 3.56 |
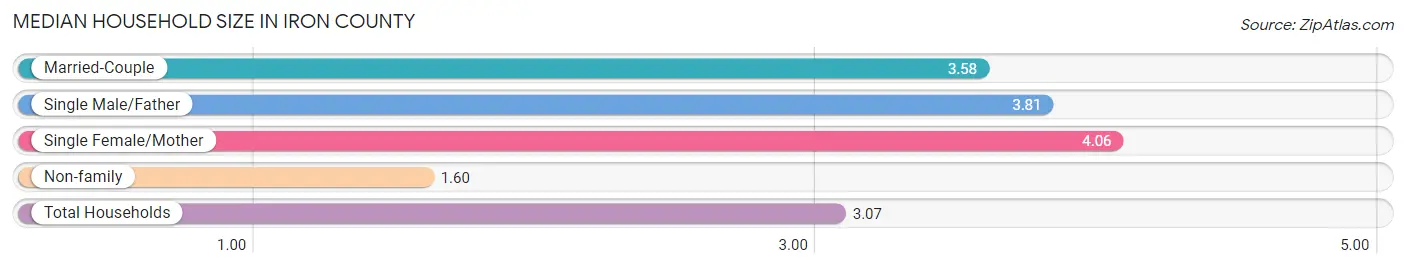
Median Household Size in Iron County
The median household size in Iron County is 3.07 persons per household, with single female/mother households (1,429 | 7.7%) accounting for the largest median household size of 4.06 persons per household. non-family households (5,206 | 28.0%) represent the smallest median household size with 1.60 persons per household.
| Household Type | # Households | Household Size |
| Married-Couple | 11,148 (60.0%) | 3.58 |
| Single Male/Father | 813 (4.4%) | 3.81 |
| Single Female/Mother | 1,429 (7.7%) | 4.06 |
| Non-family | 5,206 (28.0%) | 1.60 |
| Total Households | 18,596 (100.0%) | 3.07 |
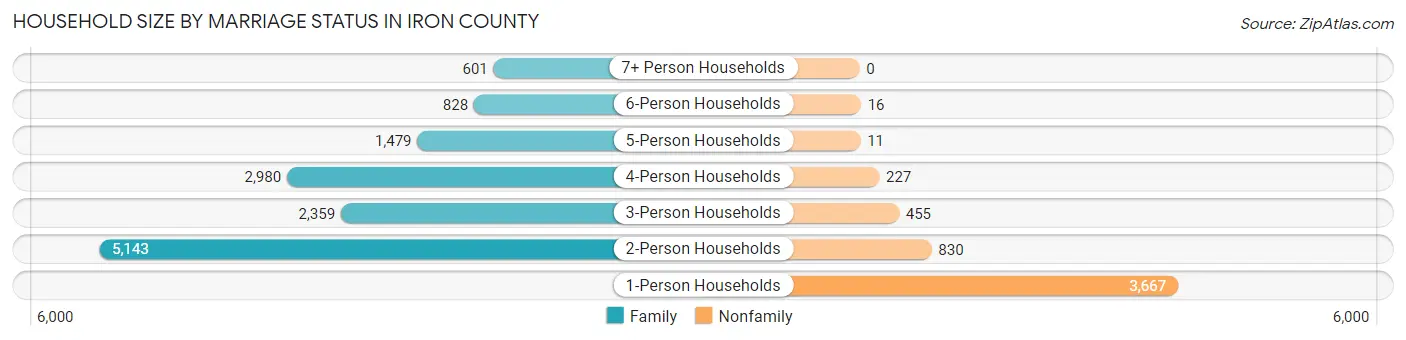
Household Size by Marriage Status in Iron County
Out of a total of 18,596 households in Iron County, 13,390 (72.0%) are family households, while 5,206 (28.0%) are nonfamily households. The most numerous type of family households are 2-person households, comprising 5,143, and the most common type of nonfamily households are 1-person households, comprising 3,667.
| Household Size | Family Households | Nonfamily Households |
| 1-Person Households | - | 3,667 (19.7%) |
| 2-Person Households | 5,143 (27.7%) | 830 (4.5%) |
| 3-Person Households | 2,359 (12.7%) | 455 (2.5%) |
| 4-Person Households | 2,980 (16.0%) | 227 (1.2%) |
| 5-Person Households | 1,479 (8.0%) | 11 (0.1%) |
| 6-Person Households | 828 (4.4%) | 16 (0.1%) |
| 7+ Person Households | 601 (3.2%) | 0 (0.0%) |
| Total | 13,390 (72.0%) | 5,206 (28.0%) |
Female Fertility in Iron County
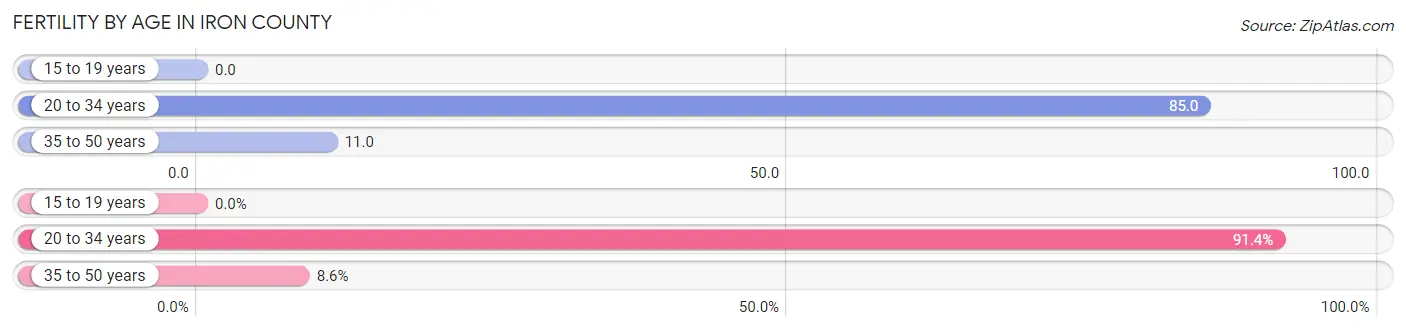
Fertility by Age in Iron County
Average fertility rate in Iron County is 43.0 births per 1,000 women. Women in the age bracket of 20 to 34 years have the highest fertility rate with 85.0 births per 1,000 women. Women in the age bracket of 20 to 34 years acount for 91.4% of all women with births.
| Age Bracket | Women with Births | Births / 1,000 Women |
| 15 to 19 years | 0 (0.0%) | 0.0 |
| 20 to 34 years | 582 (91.4%) | 85.0 |
| 35 to 50 years | 55 (8.6%) | 11.0 |
| Total | 637 (100.0%) | 43.0 |
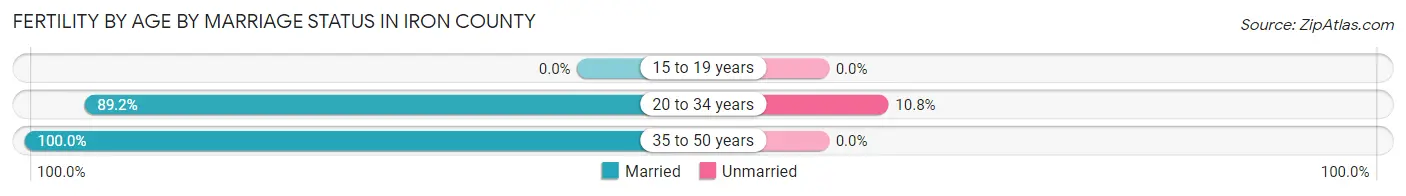
Fertility by Age by Marriage Status in Iron County
90.1% of women with births (637) in Iron County are married. The highest percentage of unmarried women with births falls into 20 to 34 years age bracket with 10.8% of them unmarried at the time of birth, while the lowest percentage of unmarried women with births belong to 35 to 50 years age bracket with 0.0% of them unmarried.
| Age Bracket | Married | Unmarried |
| 15 to 19 years | 0 (0.0%) | 0 (0.0%) |
| 20 to 34 years | 519 (89.2%) | 63 (10.8%) |
| 35 to 50 years | 55 (100.0%) | 0 (0.0%) |
| Total | 574 (90.1%) | 63 (9.9%) |
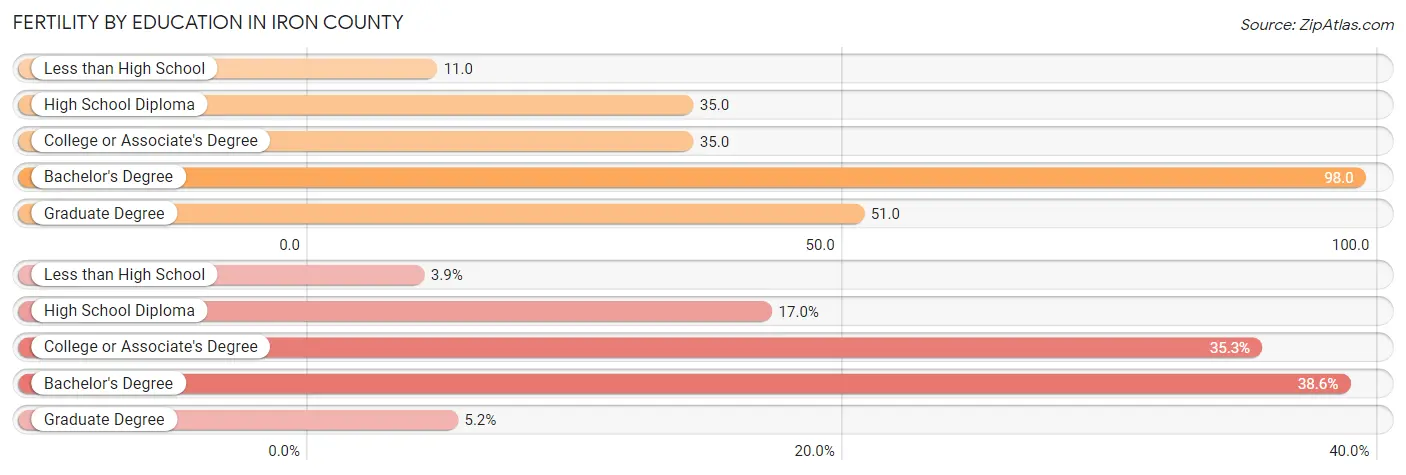
Fertility by Education in Iron County
Average fertility rate in Iron County is 43.0 births per 1,000 women. Women with the education attainment of bachelor's degree have the highest fertility rate of 98.0 births per 1,000 women, while women with the education attainment of less than high school have the lowest fertility at 11.0 births per 1,000 women. Women with the education attainment of bachelor's degree represent 38.6% of all women with births.
| Educational Attainment | Women with Births | Births / 1,000 Women |
| Less than High School | 25 (3.9%) | 11.0 |
| High School Diploma | 108 (17.0%) | 35.0 |
| College or Associate's Degree | 225 (35.3%) | 35.0 |
| Bachelor's Degree | 246 (38.6%) | 98.0 |
| Graduate Degree | 33 (5.2%) | 51.0 |
| Total | 637 (100.0%) | 43.0 |
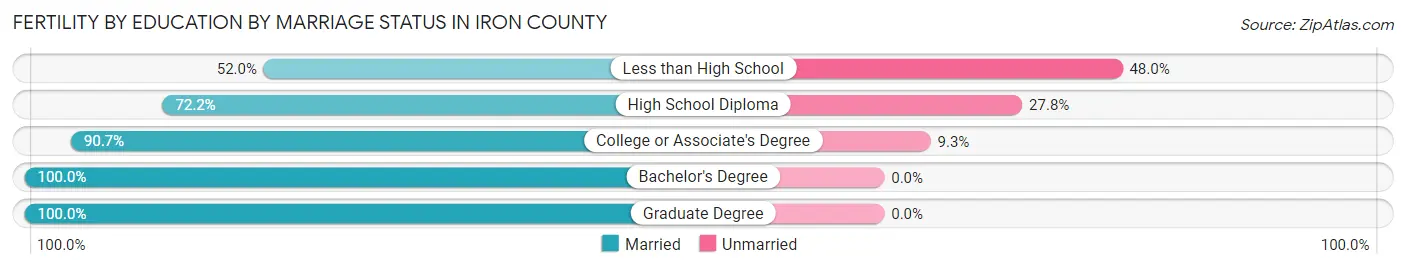
Fertility by Education by Marriage Status in Iron County
9.9% of women with births in Iron County are unmarried. Women with the educational attainment of bachelor's degree are most likely to be married with 100.0% of them married at childbirth, while women with the educational attainment of less than high school are least likely to be married with 48.0% of them unmarried at childbirth.
| Educational Attainment | Married | Unmarried |
| Less than High School | 13 (52.0%) | 12 (48.0%) |
| High School Diploma | 78 (72.2%) | 30 (27.8%) |
| College or Associate's Degree | 204 (90.7%) | 21 (9.3%) |
| Bachelor's Degree | 246 (100.0%) | 0 (0.0%) |
| Graduate Degree | 33 (100.0%) | 0 (0.0%) |
| Total | 574 (90.1%) | 63 (9.9%) |
Income in Iron County
Income Overview in Iron County
Per Capita Income in Iron County is $26,650, while median incomes of families and households are $78,002 and $63,005 respectively.
| Characteristic | Number | Measure |
| Per Capita Income | 58,068 | $26,650 |
| Median Family Income | 13,390 | $78,002 |
| Mean Family Income | 13,390 | $93,393 |
| Median Household Income | 18,596 | $63,005 |
| Mean Household Income | 18,596 | $80,860 |
| Income Deficit | 13,390 | $9,260 |
| Wage / Income Gap (%) | 58,068 | 54.73% |
| Wage / Income Gap ($) | 58,068 | 45.27¢ per $1 |
| Gini / Inequality Index | 58,068 | 0.42 |
Earnings by Sex in Iron County
Average Earnings in Iron County are $28,518, $38,064 for men and $17,233 for women, a difference of 54.7%.
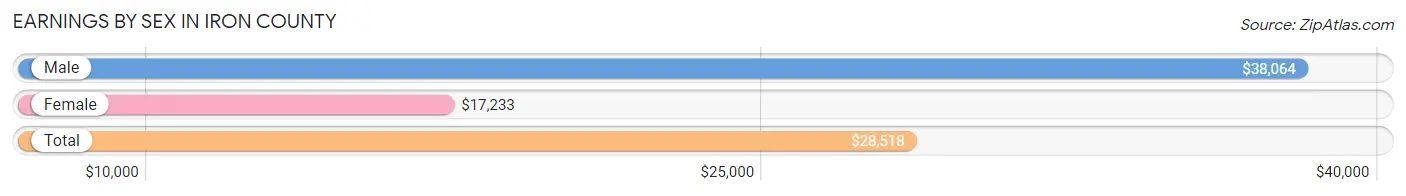
| Sex | Number | Average Earnings |
| Male | 16,244 (53.3%) | $38,064 |
| Female | 14,246 (46.7%) | $17,233 |
| Total | 30,490 (100.0%) | $28,518 |
Earnings by Sex by Income Bracket in Iron County
The most common earnings brackets in Iron County are $100,000+ for men (1,633 | 10.1%) and $2,499 or less for women (1,656 | 11.6%).
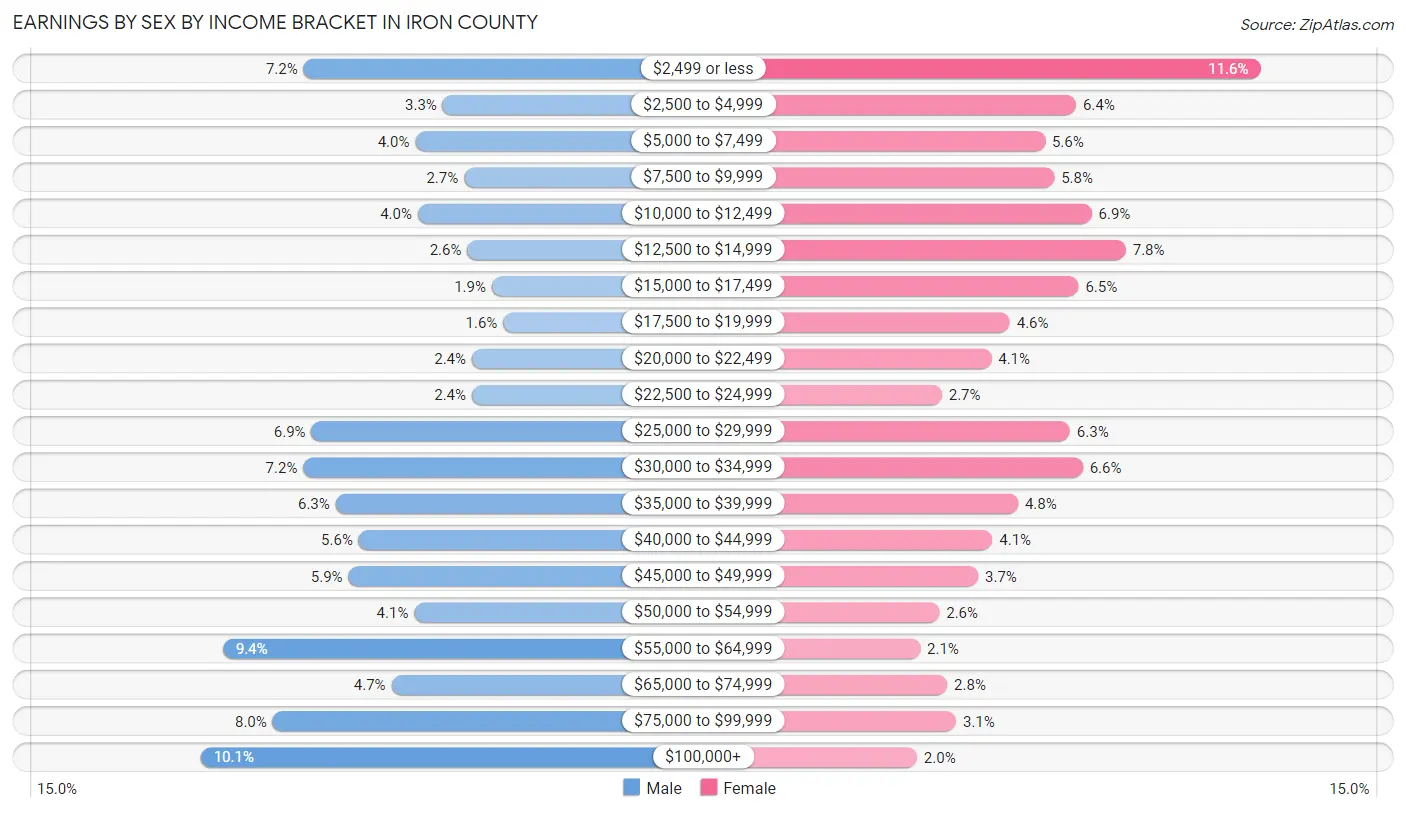
| Income | Male | Female |
| $2,499 or less | 1,163 (7.2%) | 1,656 (11.6%) |
| $2,500 to $4,999 | 528 (3.3%) | 918 (6.4%) |
| $5,000 to $7,499 | 653 (4.0%) | 793 (5.6%) |
| $7,500 to $9,999 | 431 (2.6%) | 831 (5.8%) |
| $10,000 to $12,499 | 641 (4.0%) | 980 (6.9%) |
| $12,500 to $14,999 | 416 (2.6%) | 1,117 (7.8%) |
| $15,000 to $17,499 | 303 (1.9%) | 927 (6.5%) |
| $17,500 to $19,999 | 251 (1.5%) | 652 (4.6%) |
| $20,000 to $22,499 | 395 (2.4%) | 579 (4.1%) |
| $22,500 to $24,999 | 395 (2.4%) | 381 (2.7%) |
| $25,000 to $29,999 | 1,128 (6.9%) | 893 (6.3%) |
| $30,000 to $34,999 | 1,165 (7.2%) | 944 (6.6%) |
| $35,000 to $39,999 | 1,017 (6.3%) | 685 (4.8%) |
| $40,000 to $44,999 | 912 (5.6%) | 582 (4.1%) |
| $45,000 to $49,999 | 958 (5.9%) | 525 (3.7%) |
| $50,000 to $54,999 | 658 (4.1%) | 371 (2.6%) |
| $55,000 to $64,999 | 1,531 (9.4%) | 293 (2.1%) |
| $65,000 to $74,999 | 762 (4.7%) | 402 (2.8%) |
| $75,000 to $99,999 | 1,304 (8.0%) | 437 (3.1%) |
| $100,000+ | 1,633 (10.1%) | 280 (2.0%) |
| Total | 16,244 (100.0%) | 14,246 (100.0%) |
Earnings by Sex by Educational Attainment in Iron County
Average earnings in Iron County are $48,180 for men and $23,157 for women, a difference of 51.9%. Men with an educational attainment of graduate degree enjoy the highest average annual earnings of $88,567, while those with college or associate's degree education earn the least with $43,743. Women with an educational attainment of graduate degree earn the most with the average annual earnings of $48,500, while those with less than high school education have the smallest earnings of $13,304.
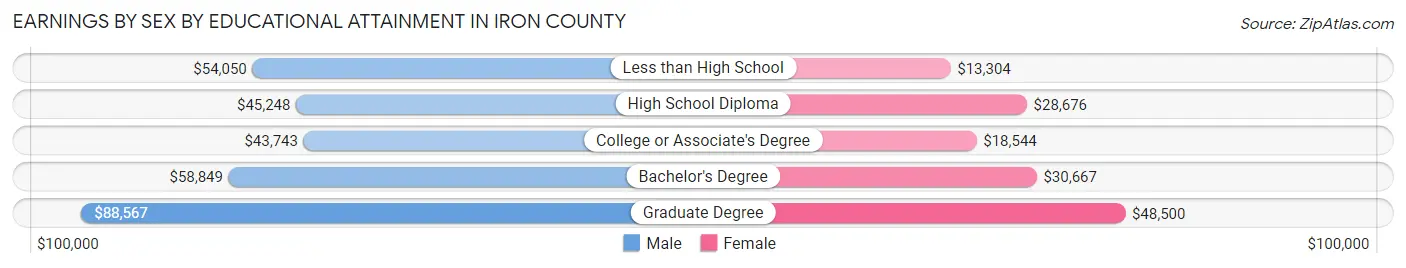
| Educational Attainment | Male Income | Female Income |
| Less than High School | $54,050 | $13,304 |
| High School Diploma | $45,248 | $28,676 |
| College or Associate's Degree | $43,743 | $18,544 |
| Bachelor's Degree | $58,849 | $30,667 |
| Graduate Degree | $88,567 | $48,500 |
| Total | $48,180 | $23,157 |
Family Income in Iron County
Family Income Brackets in Iron County
According to the Iron County family income data, there are 3,147 families falling into the $50,000 to $74,999 income range, which is the most common income bracket and makes up 23.5% of all families. Conversely, the $10,000 to $14,999 income bracket is the least frequent group with only 241 families (1.8%) belonging to this category.
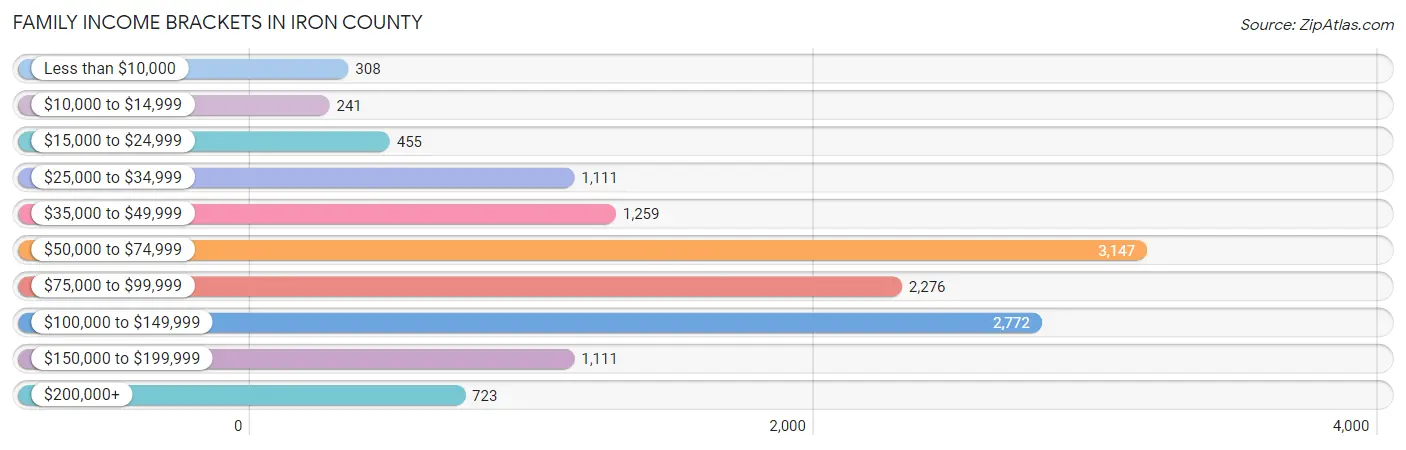
| Income Bracket | # Families | % Families |
| Less than $10,000 | 308 | 2.3% |
| $10,000 to $14,999 | 241 | 1.8% |
| $15,000 to $24,999 | 455 | 3.4% |
| $25,000 to $34,999 | 1,111 | 8.3% |
| $35,000 to $49,999 | 1,259 | 9.4% |
| $50,000 to $74,999 | 3,147 | 23.5% |
| $75,000 to $99,999 | 2,276 | 17.0% |
| $100,000 to $149,999 | 2,772 | 20.7% |
| $150,000 to $199,999 | 1,111 | 8.3% |
| $200,000+ | 723 | 5.4% |
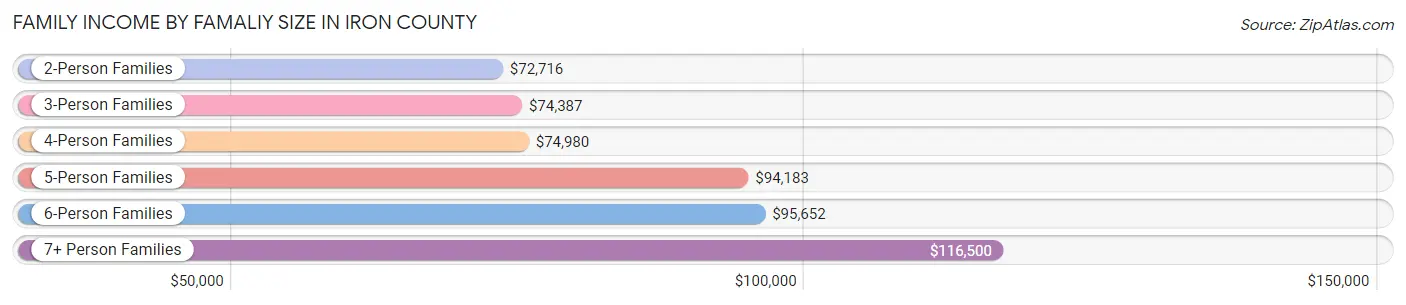
Family Income by Famaliy Size in Iron County
7+ person families (594 | 4.4%) account for the highest median family income in Iron County with $116,500 per family, while 2-person families (5,475 | 40.9%) have the highest median income of $36,358 per family member.
| Income Bracket | # Families | Median Income |
| 2-Person Families | 5,475 (40.9%) | $72,716 |
| 3-Person Families | 2,331 (17.4%) | $74,387 |
| 4-Person Families | 2,903 (21.7%) | $74,980 |
| 5-Person Families | 1,349 (10.1%) | $94,183 |
| 6-Person Families | 738 (5.5%) | $95,652 |
| 7+ Person Families | 594 (4.4%) | $116,500 |
| Total | 13,390 (100.0%) | $78,002 |
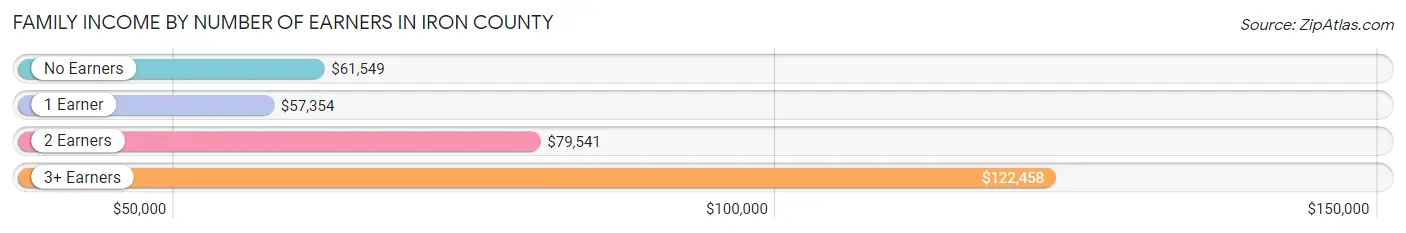
Family Income by Number of Earners in Iron County
The median family income in Iron County is $78,002, with families comprising 3+ earners (2,395) having the highest median family income of $122,458, while families with 1 earner (3,648) have the lowest median family income of $57,354, accounting for 17.9% and 27.2% of families, respectively.
| Number of Earners | # Families | Median Income |
| No Earners | 1,849 (13.8%) | $61,549 |
| 1 Earner | 3,648 (27.2%) | $57,354 |
| 2 Earners | 5,498 (41.1%) | $79,541 |
| 3+ Earners | 2,395 (17.9%) | $122,458 |
| Total | 13,390 (100.0%) | $78,002 |
Household Income in Iron County
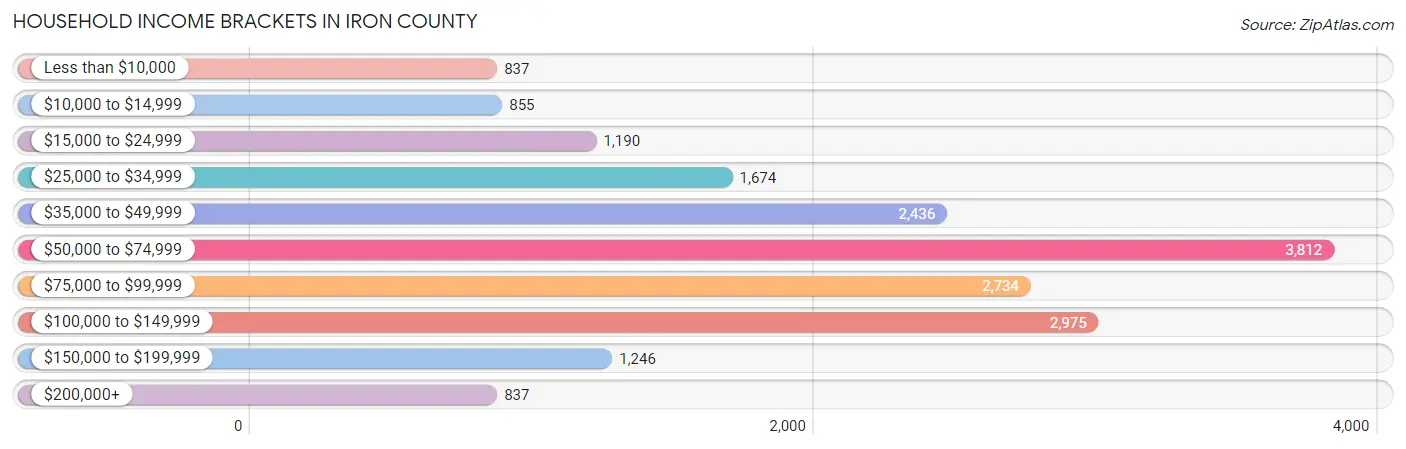
Household Income Brackets in Iron County
With 3,812 households falling in the category, the $50,000 to $74,999 income range is the most frequent in Iron County, accounting for 20.5% of all households. In contrast, only 837 households (4.5%) fall into the less than $10,000 income bracket, making it the least populous group.
| Income Bracket | # Households | % Households |
| Less than $10,000 | 837 | 4.5% |
| $10,000 to $14,999 | 855 | 4.6% |
| $15,000 to $24,999 | 1,190 | 6.4% |
| $25,000 to $34,999 | 1,674 | 9.0% |
| $35,000 to $49,999 | 2,436 | 13.1% |
| $50,000 to $74,999 | 3,812 | 20.5% |
| $75,000 to $99,999 | 2,734 | 14.7% |
| $100,000 to $149,999 | 2,975 | 16.0% |
| $150,000 to $199,999 | 1,246 | 6.7% |
| $200,000+ | 837 | 4.5% |
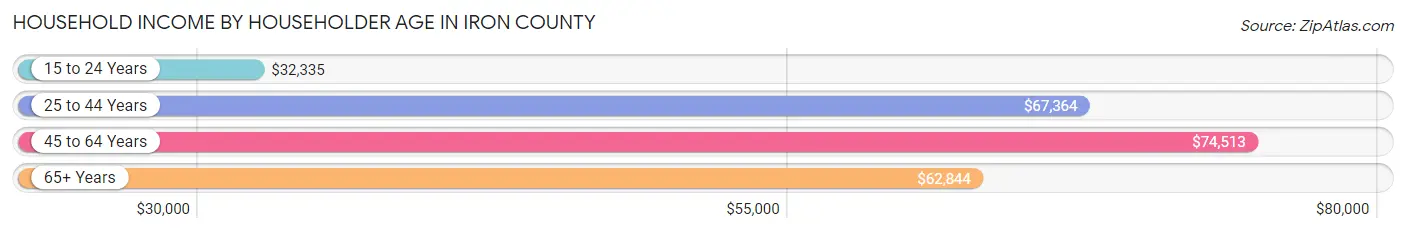
Household Income by Householder Age in Iron County
The median household income in Iron County is $63,005, with the highest median household income of $74,513 found in the 45 to 64 years age bracket for the primary householder. A total of 6,161 households (33.1%) fall into this category. Meanwhile, the 15 to 24 years age bracket for the primary householder has the lowest median household income of $32,335, with 2,235 households (12.0%) in this group.
| Income Bracket | # Households | Median Income |
| 15 to 24 Years | 2,235 (12.0%) | $32,335 |
| 25 to 44 Years | 5,833 (31.4%) | $67,364 |
| 45 to 64 Years | 6,161 (33.1%) | $74,513 |
| 65+ Years | 4,367 (23.5%) | $62,844 |
| Total | 18,596 (100.0%) | $63,005 |
Poverty in Iron County
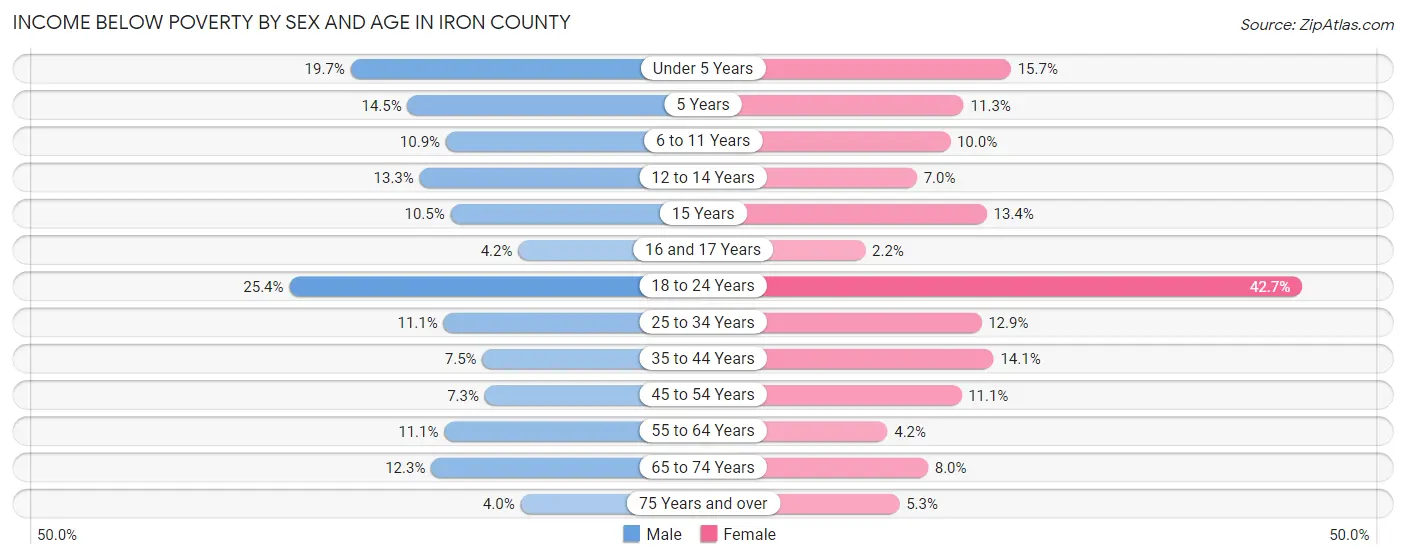
Income Below Poverty by Sex and Age in Iron County
With 12.8% poverty level for males and 15.5% for females among the residents of Iron County, 18 to 24 year old males and 18 to 24 year old females are the most vulnerable to poverty, with 1,087 males (25.4%) and 2,032 females (42.7%) in their respective age groups living below the poverty level.
| Age Bracket | Male | Female |
| Under 5 Years | 418 (19.7%) | 289 (15.7%) |
| 5 Years | 70 (14.5%) | 74 (11.3%) |
| 6 to 11 Years | 328 (10.9%) | 247 (10.0%) |
| 12 to 14 Years | 166 (13.3%) | 96 (7.0%) |
| 15 Years | 49 (10.5%) | 72 (13.4%) |
| 16 and 17 Years | 40 (4.2%) | 19 (2.2%) |
| 18 to 24 Years | 1,087 (25.4%) | 2,032 (42.7%) |
| 25 to 34 Years | 443 (11.1%) | 455 (12.9%) |
| 35 to 44 Years | 247 (7.5%) | 451 (14.1%) |
| 45 to 54 Years | 187 (7.3%) | 312 (11.1%) |
| 55 to 64 Years | 306 (11.1%) | 117 (4.2%) |
| 65 to 74 Years | 287 (12.3%) | 191 (8.0%) |
| 75 Years and over | 53 (4.0%) | 73 (5.3%) |
| Total | 3,681 (12.8%) | 4,428 (15.5%) |
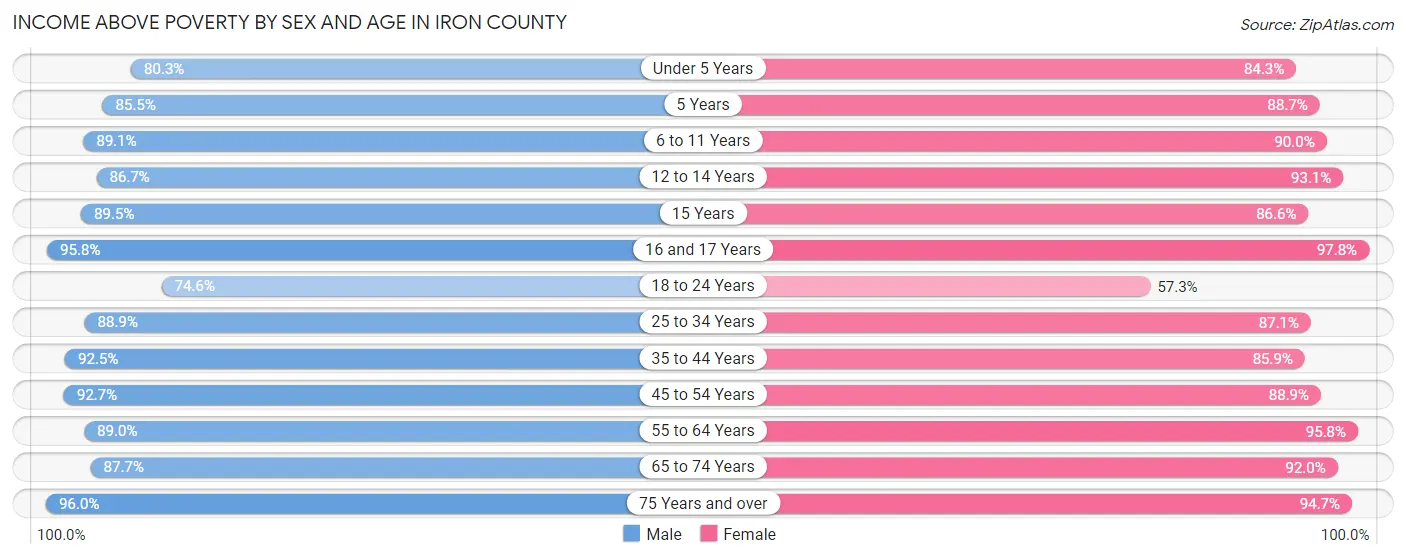
Income Above Poverty by Sex and Age in Iron County
According to the poverty statistics in Iron County, males aged 75 years and over and females aged 16 and 17 years are the age groups that are most secure financially, with 96.0% of males and 97.8% of females in these age groups living above the poverty line.
| Age Bracket | Male | Female |
| Under 5 Years | 1,699 (80.3%) | 1,554 (84.3%) |
| 5 Years | 414 (85.5%) | 580 (88.7%) |
| 6 to 11 Years | 2,680 (89.1%) | 2,214 (90.0%) |
| 12 to 14 Years | 1,078 (86.7%) | 1,286 (93.0%) |
| 15 Years | 419 (89.5%) | 464 (86.6%) |
| 16 and 17 Years | 916 (95.8%) | 862 (97.8%) |
| 18 to 24 Years | 3,188 (74.6%) | 2,726 (57.3%) |
| 25 to 34 Years | 3,540 (88.9%) | 3,062 (87.1%) |
| 35 to 44 Years | 3,042 (92.5%) | 2,752 (85.9%) |
| 45 to 54 Years | 2,379 (92.7%) | 2,505 (88.9%) |
| 55 to 64 Years | 2,463 (88.9%) | 2,656 (95.8%) |
| 65 to 74 Years | 2,054 (87.7%) | 2,201 (92.0%) |
| 75 Years and over | 1,278 (96.0%) | 1,296 (94.7%) |
| Total | 25,150 (87.2%) | 24,158 (84.5%) |
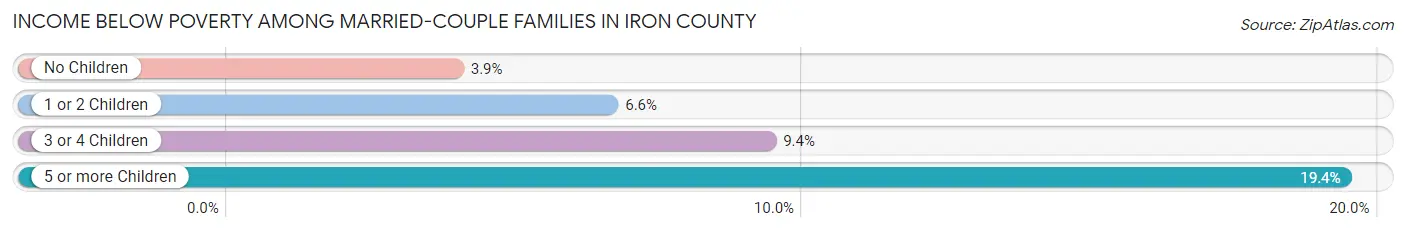
Income Below Poverty Among Married-Couple Families in Iron County
The poverty statistics for married-couple families in Iron County show that 6.0% or 667 of the total 11,148 families live below the poverty line. Families with 5 or more children have the highest poverty rate of 19.4%, comprising of 78 families. On the other hand, families with no children have the lowest poverty rate of 3.9%, which includes 232 families.
| Children | Above Poverty | Below Poverty |
| No Children | 5,669 (96.1%) | 232 (3.9%) |
| 1 or 2 Children | 3,288 (93.4%) | 233 (6.6%) |
| 3 or 4 Children | 1,200 (90.6%) | 124 (9.4%) |
| 5 or more Children | 324 (80.6%) | 78 (19.4%) |
| Total | 10,481 (94.0%) | 667 (6.0%) |
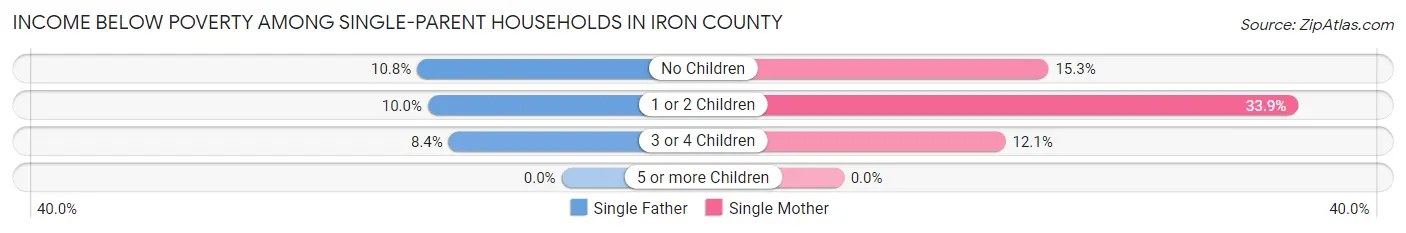
Income Below Poverty Among Single-Parent Households in Iron County
According to the poverty data in Iron County, 9.7% or 79 single-father households and 20.8% or 298 single-mother households are living below the poverty line. Among single-father households, those with no children have the highest poverty rate, with 34 households (10.8%) experiencing poverty. Likewise, among single-mother households, those with 1 or 2 children have the highest poverty rate, with 170 households (33.9%) falling below the poverty line.
| Children | Single Father | Single Mother |
| No Children | 34 (10.8%) | 94 (15.3%) |
| 1 or 2 Children | 27 (10.0%) | 170 (33.9%) |
| 3 or 4 Children | 18 (8.4%) | 34 (12.1%) |
| 5 or more Children | 0 (0.0%) | 0 (0.0%) |
| Total | 79 (9.7%) | 298 (20.8%) |
Income Below Poverty Among Married-Couple vs Single-Parent Households in Iron County
The poverty data for Iron County shows that 667 of the married-couple family households (6.0%) and 377 of the single-parent households (16.8%) are living below the poverty level. Within the married-couple family households, those with 5 or more children have the highest poverty rate, with 78 households (19.4%) falling below the poverty line. Among the single-parent households, those with 1 or 2 children have the highest poverty rate, with 197 household (25.5%) living below poverty.
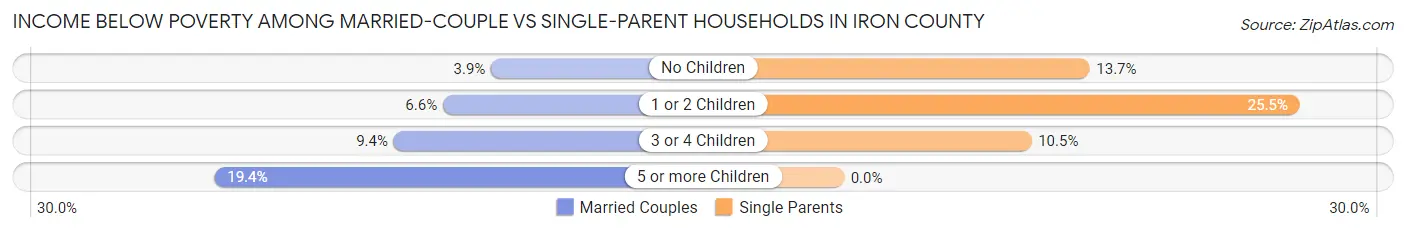
| Children | Married-Couple Families | Single-Parent Households |
| No Children | 232 (3.9%) | 128 (13.7%) |
| 1 or 2 Children | 233 (6.6%) | 197 (25.5%) |
| 3 or 4 Children | 124 (9.4%) | 52 (10.5%) |
| 5 or more Children | 78 (19.4%) | 0 (0.0%) |
| Total | 667 (6.0%) | 377 (16.8%) |
Employment Characteristics in Iron County
Employment by Class of Employer in Iron County
Among the 26,664 employed individuals in Iron County, private company employees (16,494 | 61.9%), local government employees (2,048 | 7.7%), and not-for-profit organizations (1,974 | 7.4%) make up the most common classes of employment.
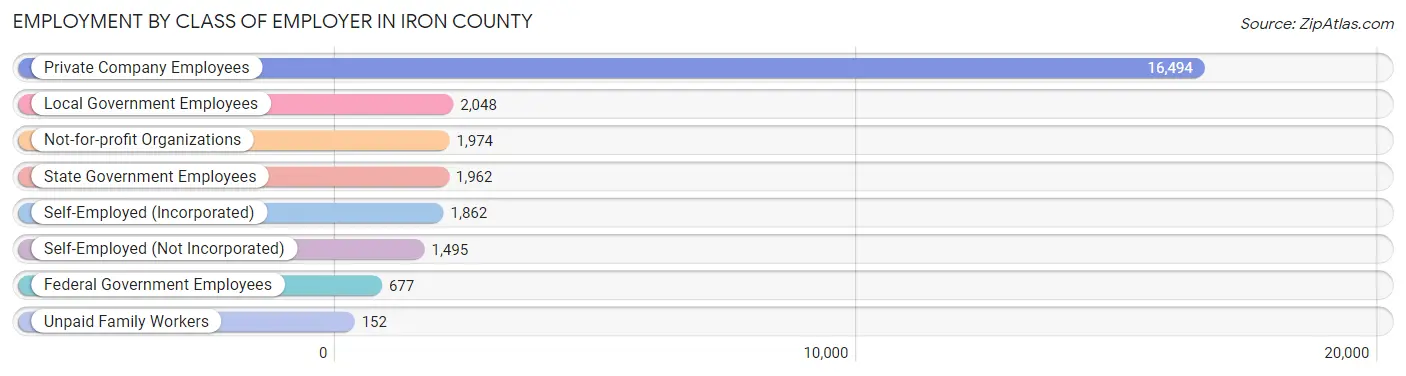
| Employer Class | # Employees | % Employees |
| Private Company Employees | 16,494 | 61.9% |
| Self-Employed (Incorporated) | 1,862 | 7.0% |
| Self-Employed (Not Incorporated) | 1,495 | 5.6% |
| Not-for-profit Organizations | 1,974 | 7.4% |
| Local Government Employees | 2,048 | 7.7% |
| State Government Employees | 1,962 | 7.4% |
| Federal Government Employees | 677 | 2.5% |
| Unpaid Family Workers | 152 | 0.6% |
| Total | 26,664 | 100.0% |
Employment Status by Age in Iron County
According to the labor force statistics for Iron County, out of the total population over 16 years of age (43,811), 64.4% or 28,214 individuals are in the labor force, with 3.3% or 931 of them unemployed. The age group with the highest labor force participation rate is 45 to 54 years, with 81.8% or 4,430 individuals in the labor force. Within the labor force, the 16 to 19 years age range has the highest percentage of unemployed individuals, with 9.2% or 227 of them being unemployed.
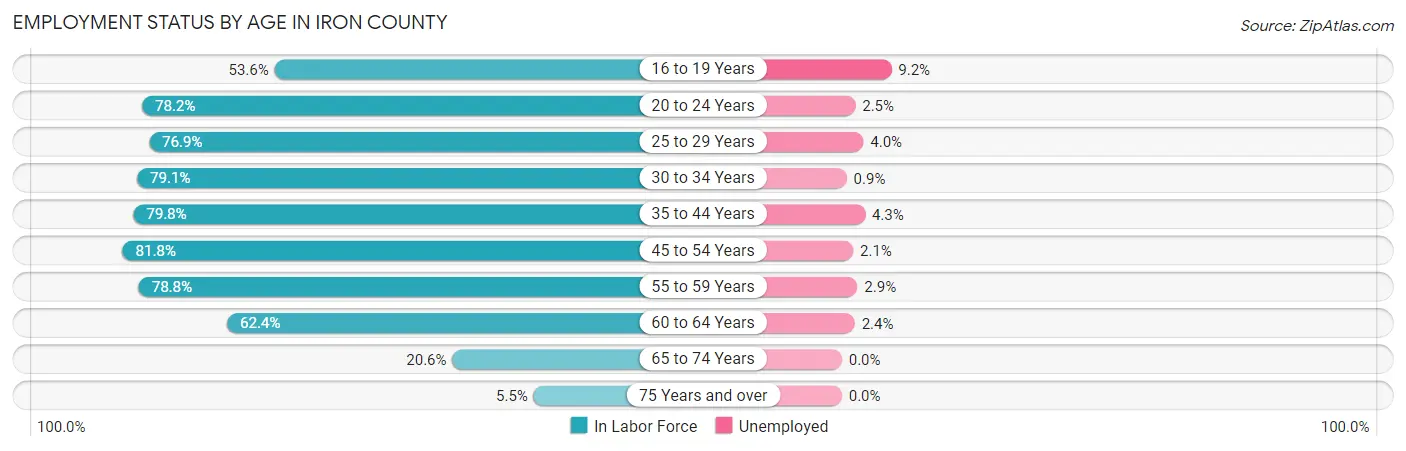
| Age Bracket | In Labor Force | Unemployed |
| 16 to 19 Years | 2,467 (53.6%) | 227 (9.2%) |
| 20 to 24 Years | 5,200 (78.2%) | 130 (2.5%) |
| 25 to 29 Years | 3,054 (76.9%) | 122 (4.0%) |
| 30 to 34 Years | 2,836 (79.1%) | 26 (0.9%) |
| 35 to 44 Years | 5,205 (79.8%) | 224 (4.3%) |
| 45 to 54 Years | 4,430 (81.8%) | 93 (2.1%) |
| 55 to 59 Years | 2,034 (78.8%) | 59 (2.9%) |
| 60 to 64 Years | 1,869 (62.4%) | 45 (2.4%) |
| 65 to 74 Years | 978 (20.6%) | 0 (0.0%) |
| 75 Years and over | 151 (5.5%) | 0 (0.0%) |
| Total | 28,214 (64.4%) | 931 (3.3%) |
Employment Status by Educational Attainment in Iron County
According to labor force statistics for Iron County, 77.5% of individuals (19,431) out of the total population between 25 and 64 years of age (25,072) are in the labor force, with 2.9% or 563 of them being unemployed. The group with the highest labor force participation rate are those with the educational attainment of bachelor's degree or higher, with 80.7% or 5,873 individuals in the labor force. Within the labor force, individuals with less than high school education have the highest percentage of unemployment, with 8.2% or 94 of them being unemployed.
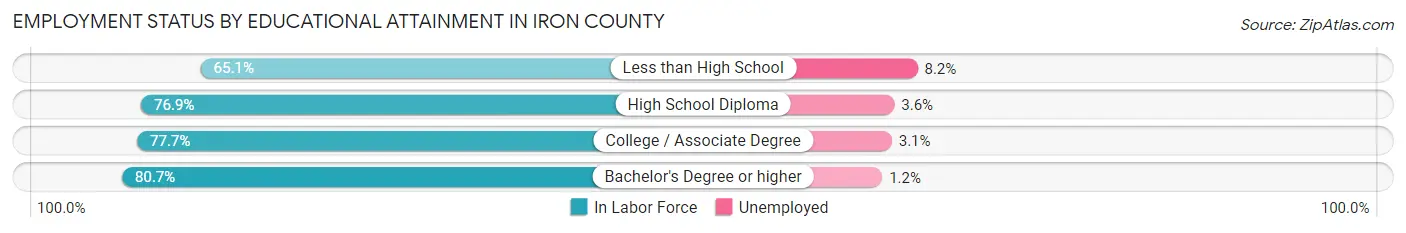
| Educational Attainment | In Labor Force | Unemployed |
| Less than High School | 1,152 (65.1%) | 145 (8.2%) |
| High School Diploma | 4,752 (76.9%) | 222 (3.6%) |
| College / Associate Degree | 7,651 (77.7%) | 305 (3.1%) |
| Bachelor's Degree or higher | 5,873 (80.7%) | 87 (1.2%) |
| Total | 19,431 (77.5%) | 727 (2.9%) |
Employment Occupations by Sex in Iron County
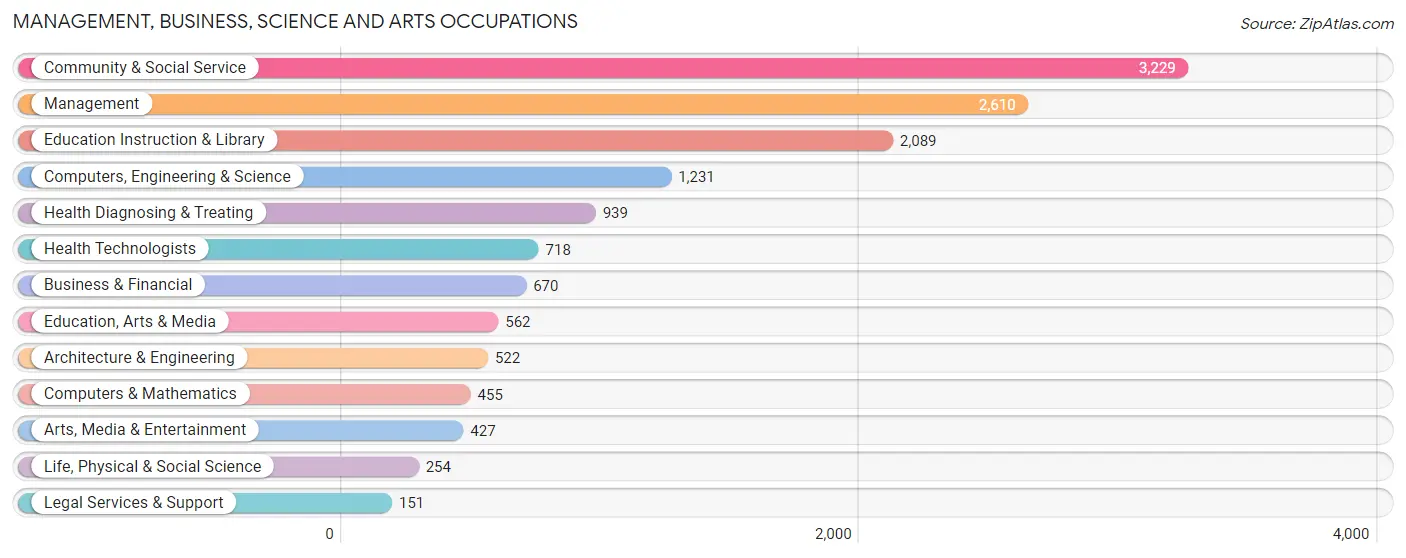
Management, Business, Science and Arts Occupations
The most common Management, Business, Science and Arts occupations in Iron County are Community & Social Service (3,229 | 11.8%), Management (2,610 | 9.6%), Education Instruction & Library (2,089 | 7.7%), Computers, Engineering & Science (1,231 | 4.5%), and Health Diagnosing & Treating (939 | 3.5%).
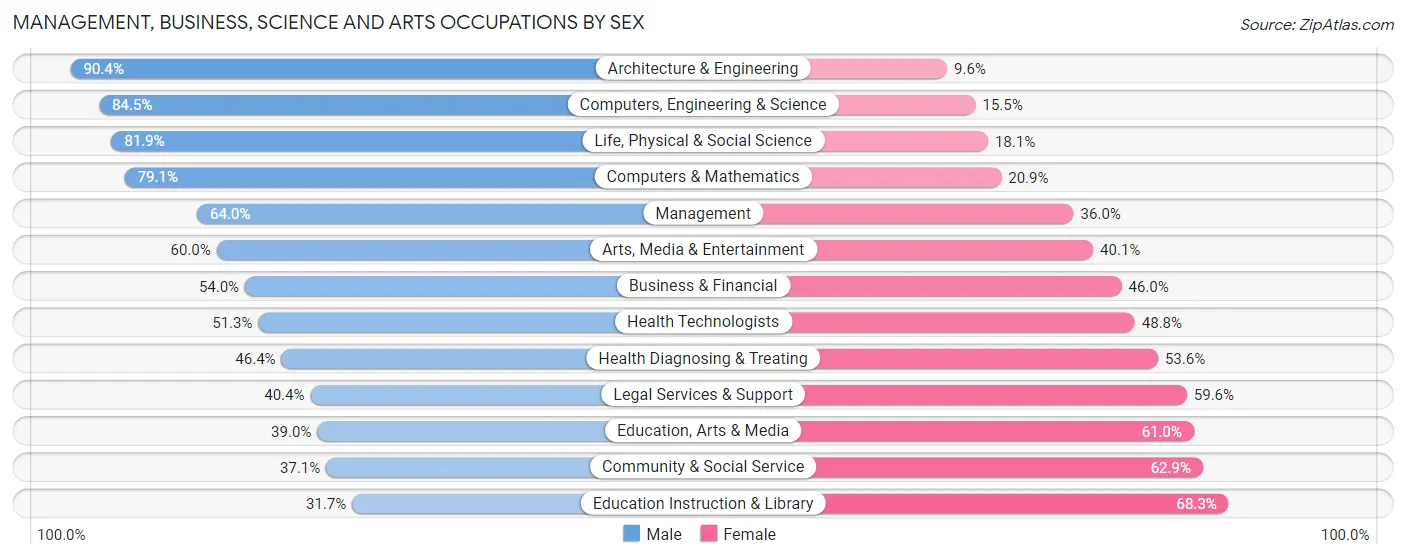
Management, Business, Science and Arts Occupations by Sex
Within the Management, Business, Science and Arts occupations in Iron County, the most male-oriented occupations are Architecture & Engineering (90.4%), Computers, Engineering & Science (84.5%), and Life, Physical & Social Science (81.9%), while the most female-oriented occupations are Education Instruction & Library (68.3%), Community & Social Service (62.9%), and Education, Arts & Media (61.0%).
| Occupation | Male | Female |
| Management | 1,671 (64.0%) | 939 (36.0%) |
| Business & Financial | 362 (54.0%) | 308 (46.0%) |
| Computers, Engineering & Science | 1,040 (84.5%) | 191 (15.5%) |
| Computers & Mathematics | 360 (79.1%) | 95 (20.9%) |
| Architecture & Engineering | 472 (90.4%) | 50 (9.6%) |
| Life, Physical & Social Science | 208 (81.9%) | 46 (18.1%) |
| Community & Social Service | 1,198 (37.1%) | 2,031 (62.9%) |
| Education, Arts & Media | 219 (39.0%) | 343 (61.0%) |
| Legal Services & Support | 61 (40.4%) | 90 (59.6%) |
| Education Instruction & Library | 662 (31.7%) | 1,427 (68.3%) |
| Arts, Media & Entertainment | 256 (60.0%) | 171 (40.1%) |
| Health Diagnosing & Treating | 436 (46.4%) | 503 (53.6%) |
| Health Technologists | 368 (51.2%) | 350 (48.7%) |
| Total (Category) | 4,707 (54.2%) | 3,972 (45.8%) |
| Total (Overall) | 14,555 (53.4%) | 12,694 (46.6%) |
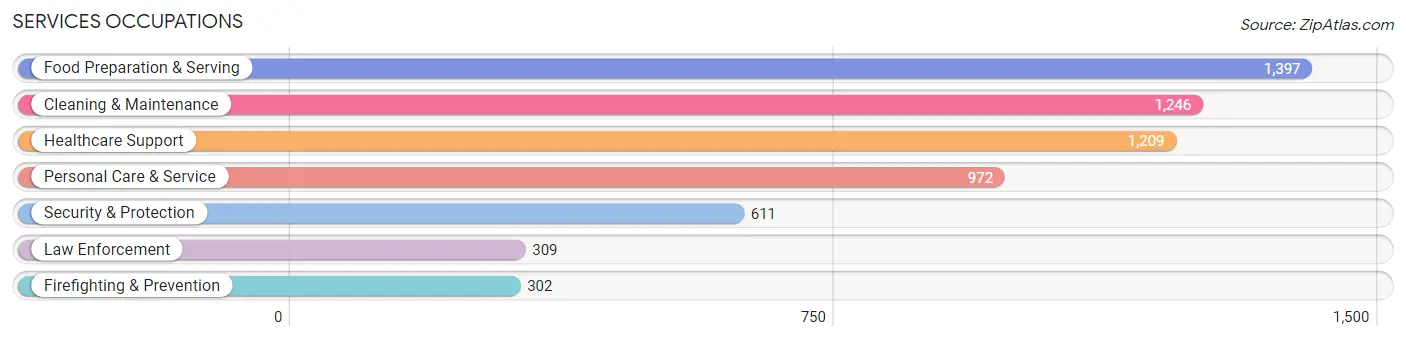
Services Occupations
The most common Services occupations in Iron County are Food Preparation & Serving (1,397 | 5.1%), Cleaning & Maintenance (1,246 | 4.6%), Healthcare Support (1,209 | 4.4%), Personal Care & Service (972 | 3.6%), and Security & Protection (611 | 2.2%).
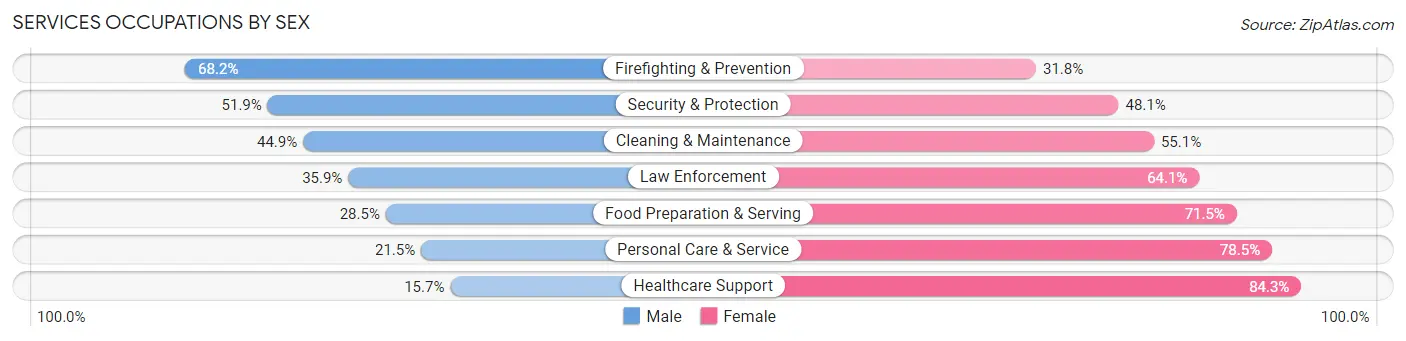
Services Occupations by Sex
Within the Services occupations in Iron County, the most male-oriented occupations are Firefighting & Prevention (68.2%), Security & Protection (51.9%), and Cleaning & Maintenance (44.9%), while the most female-oriented occupations are Healthcare Support (84.3%), Personal Care & Service (78.5%), and Food Preparation & Serving (71.5%).
| Occupation | Male | Female |
| Healthcare Support | 190 (15.7%) | 1,019 (84.3%) |
| Security & Protection | 317 (51.9%) | 294 (48.1%) |
| Firefighting & Prevention | 206 (68.2%) | 96 (31.8%) |
| Law Enforcement | 111 (35.9%) | 198 (64.1%) |
| Food Preparation & Serving | 398 (28.5%) | 999 (71.5%) |
| Cleaning & Maintenance | 559 (44.9%) | 687 (55.1%) |
| Personal Care & Service | 209 (21.5%) | 763 (78.5%) |
| Total (Category) | 1,673 (30.8%) | 3,762 (69.2%) |
| Total (Overall) | 14,555 (53.4%) | 12,694 (46.6%) |
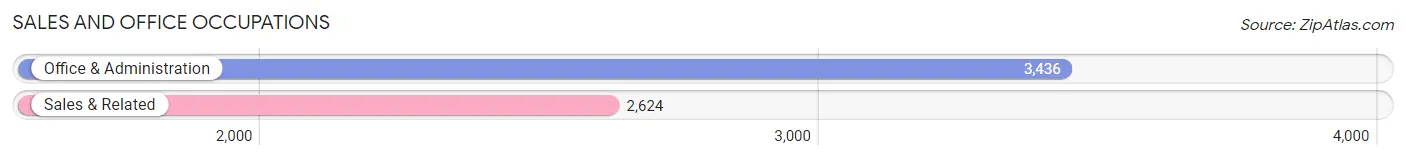
Sales and Office Occupations
The most common Sales and Office occupations in Iron County are Office & Administration (3,436 | 12.6%), and Sales & Related (2,624 | 9.6%).
Sales and Office Occupations by Sex
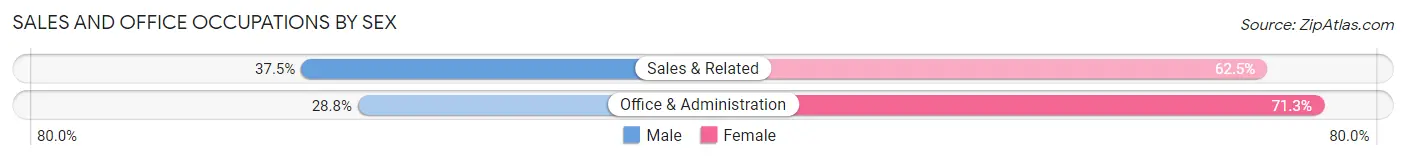
| Occupation | Male | Female |
| Sales & Related | 983 (37.5%) | 1,641 (62.5%) |
| Office & Administration | 988 (28.7%) | 2,448 (71.3%) |
| Total (Category) | 1,971 (32.5%) | 4,089 (67.5%) |
| Total (Overall) | 14,555 (53.4%) | 12,694 (46.6%) |
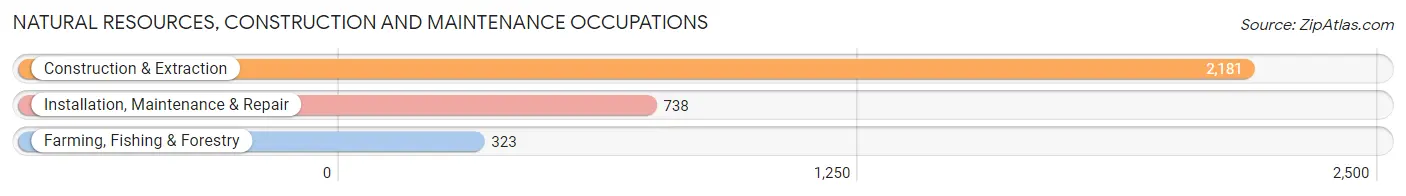
Natural Resources, Construction and Maintenance Occupations
The most common Natural Resources, Construction and Maintenance occupations in Iron County are Construction & Extraction (2,181 | 8.0%), Installation, Maintenance & Repair (738 | 2.7%), and Farming, Fishing & Forestry (323 | 1.2%).
Natural Resources, Construction and Maintenance Occupations by Sex
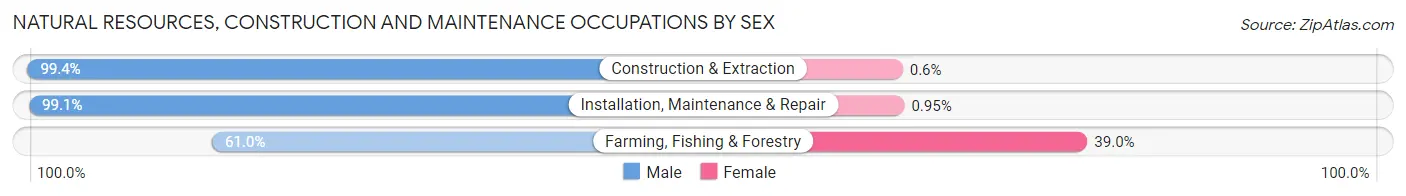
| Occupation | Male | Female |
| Farming, Fishing & Forestry | 197 (61.0%) | 126 (39.0%) |
| Construction & Extraction | 2,168 (99.4%) | 13 (0.6%) |
| Installation, Maintenance & Repair | 731 (99.1%) | 7 (0.9%) |
| Total (Category) | 3,096 (95.5%) | 146 (4.5%) |
| Total (Overall) | 14,555 (53.4%) | 12,694 (46.6%) |
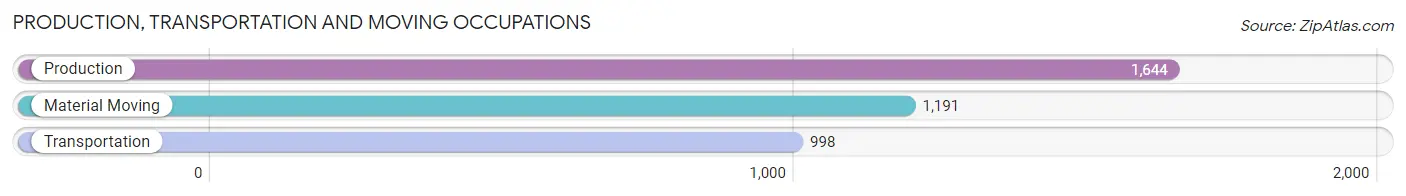
Production, Transportation and Moving Occupations
The most common Production, Transportation and Moving occupations in Iron County are Production (1,644 | 6.0%), Material Moving (1,191 | 4.4%), and Transportation (998 | 3.7%).
Production, Transportation and Moving Occupations by Sex
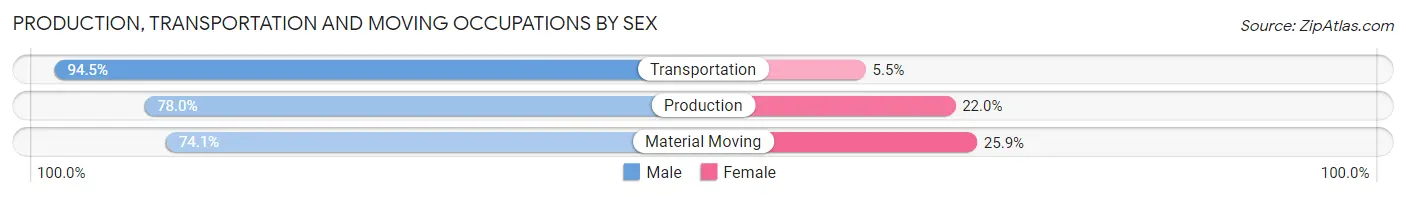
| Occupation | Male | Female |
| Production | 1,283 (78.0%) | 361 (22.0%) |
| Transportation | 943 (94.5%) | 55 (5.5%) |
| Material Moving | 882 (74.1%) | 309 (25.9%) |
| Total (Category) | 3,108 (81.1%) | 725 (18.9%) |
| Total (Overall) | 14,555 (53.4%) | 12,694 (46.6%) |
Employment Industries by Sex in Iron County
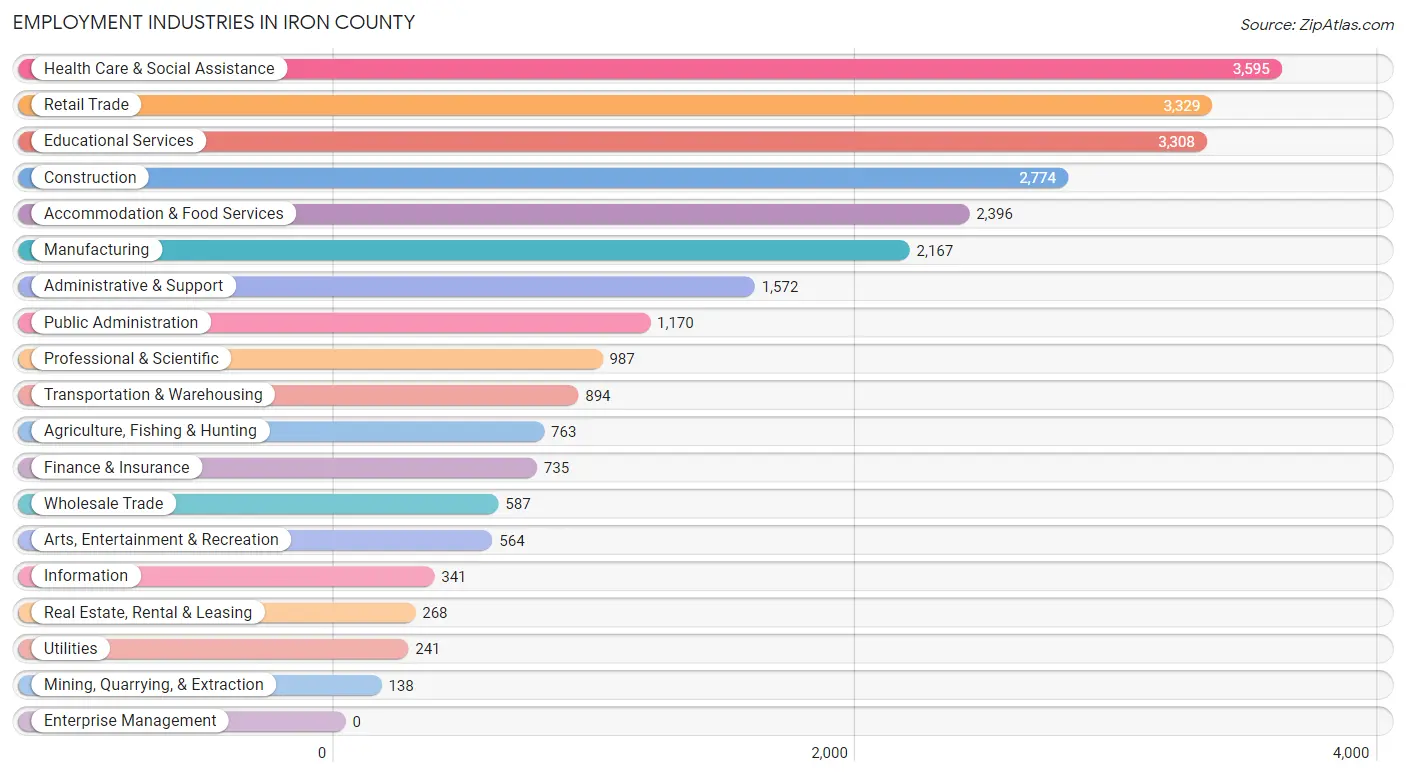
Employment Industries in Iron County
The major employment industries in Iron County include Health Care & Social Assistance (3,595 | 13.2%), Retail Trade (3,329 | 12.2%), Educational Services (3,308 | 12.1%), Construction (2,774 | 10.2%), and Accommodation & Food Services (2,396 | 8.8%).
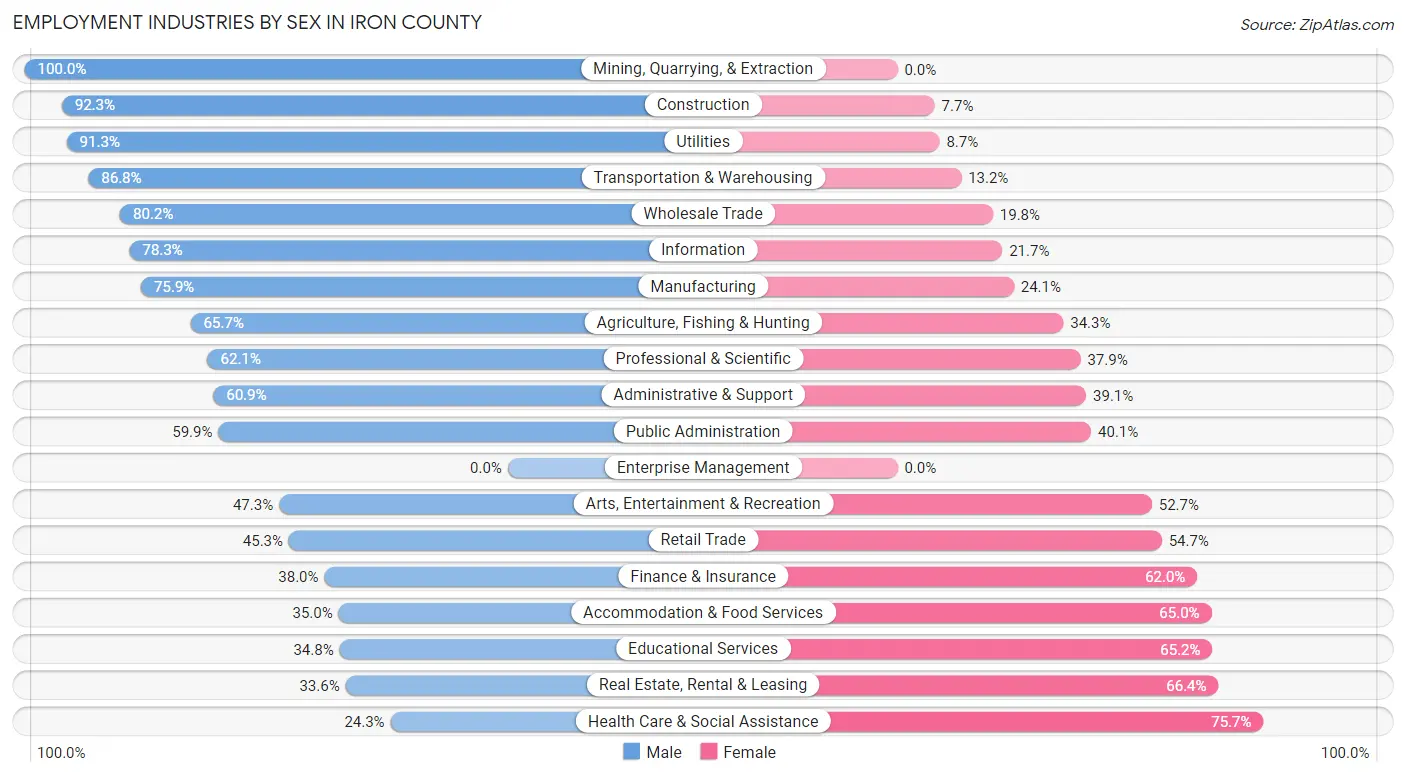
Employment Industries by Sex in Iron County
The Iron County industries that see more men than women are Mining, Quarrying, & Extraction (100.0%), Construction (92.3%), and Utilities (91.3%), whereas the industries that tend to have a higher number of women are Health Care & Social Assistance (75.7%), Real Estate, Rental & Leasing (66.4%), and Educational Services (65.2%).
| Industry | Male | Female |
| Agriculture, Fishing & Hunting | 501 (65.7%) | 262 (34.3%) |
| Mining, Quarrying, & Extraction | 138 (100.0%) | 0 (0.0%) |
| Construction | 2,560 (92.3%) | 214 (7.7%) |
| Manufacturing | 1,645 (75.9%) | 522 (24.1%) |
| Wholesale Trade | 471 (80.2%) | 116 (19.8%) |
| Retail Trade | 1,508 (45.3%) | 1,821 (54.7%) |
| Transportation & Warehousing | 776 (86.8%) | 118 (13.2%) |
| Utilities | 220 (91.3%) | 21 (8.7%) |
| Information | 267 (78.3%) | 74 (21.7%) |
| Finance & Insurance | 279 (38.0%) | 456 (62.0%) |
| Real Estate, Rental & Leasing | 90 (33.6%) | 178 (66.4%) |
| Professional & Scientific | 613 (62.1%) | 374 (37.9%) |
| Enterprise Management | 0 (0.0%) | 0 (0.0%) |
| Administrative & Support | 958 (60.9%) | 614 (39.1%) |
| Educational Services | 1,152 (34.8%) | 2,156 (65.2%) |
| Health Care & Social Assistance | 873 (24.3%) | 2,722 (75.7%) |
| Arts, Entertainment & Recreation | 267 (47.3%) | 297 (52.7%) |
| Accommodation & Food Services | 839 (35.0%) | 1,557 (65.0%) |
| Public Administration | 701 (59.9%) | 469 (40.1%) |
| Total | 14,555 (53.4%) | 12,694 (46.6%) |
Education in Iron County
School Enrollment in Iron County
The most common levels of schooling among the 19,975 students in Iron County are college / undergraduate (6,238 | 31.2%), high school (3,985 | 20.0%), and middle school (3,622 | 18.1%).
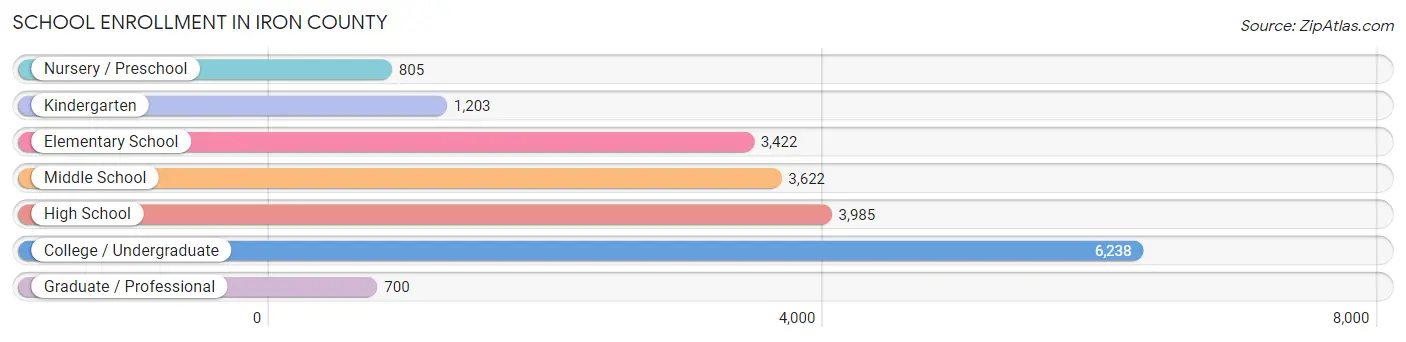
| School Level | # Students | % Students |
| Nursery / Preschool | 805 | 4.0% |
| Kindergarten | 1,203 | 6.0% |
| Elementary School | 3,422 | 17.1% |
| Middle School | 3,622 | 18.1% |
| High School | 3,985 | 20.0% |
| College / Undergraduate | 6,238 | 31.2% |
| Graduate / Professional | 700 | 3.5% |
| Total | 19,975 | 100.0% |
School Enrollment by Age by Funding Source in Iron County
Out of a total of 19,975 students who are enrolled in schools in Iron County, 1,458 (7.3%) attend a private institution, while the remaining 18,517 (92.7%) are enrolled in public schools. The age group of 3 to 4 year olds has the highest likelihood of being enrolled in private schools, with 299 (46.5% in the age bracket) enrolled. Conversely, the age group of 15 to 17 year olds has the lowest likelihood of being enrolled in a private school, with 2,714 (98.4% in the age bracket) attending a public institution.
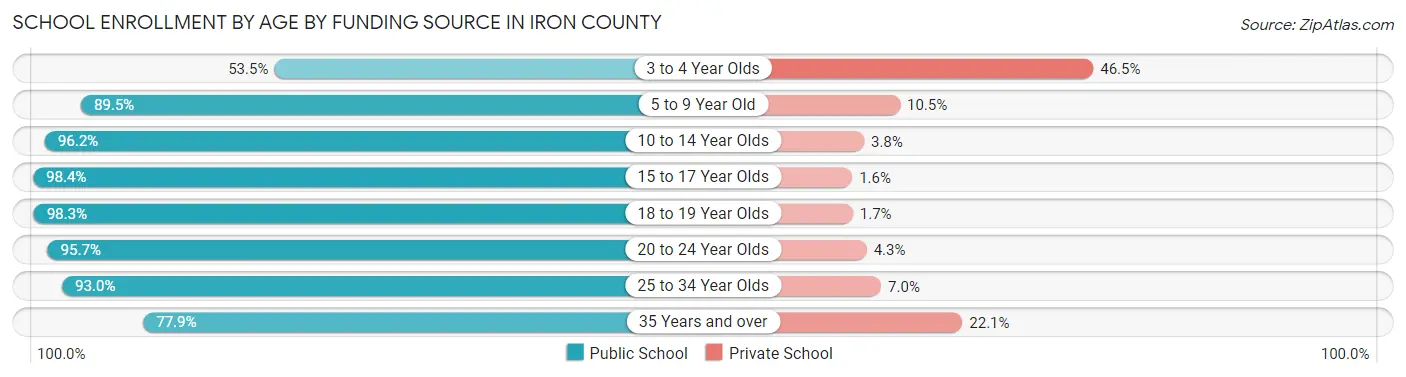
| Age Bracket | Public School | Private School |
| 3 to 4 Year Olds | 344 (53.5%) | 299 (46.5%) |
| 5 to 9 Year Old | 3,991 (89.5%) | 468 (10.5%) |
| 10 to 14 Year Olds | 4,342 (96.2%) | 171 (3.8%) |
| 15 to 17 Year Olds | 2,714 (98.4%) | 44 (1.6%) |
| 18 to 19 Year Olds | 1,721 (98.3%) | 30 (1.7%) |
| 20 to 24 Year Olds | 3,718 (95.7%) | 167 (4.3%) |
| 25 to 34 Year Olds | 920 (93.0%) | 69 (7.0%) |
| 35 Years and over | 761 (77.9%) | 216 (22.1%) |
| Total | 18,517 (92.7%) | 1,458 (7.3%) |
Educational Attainment by Field of Study in Iron County
Education (1,825 | 16.8%), business (1,819 | 16.8%), science & technology (1,049 | 9.7%), bio, nature & agricultural (875 | 8.1%), and social sciences (760 | 7.0%) are the most common fields of study among 10,849 individuals in Iron County who have obtained a bachelor's degree or higher.
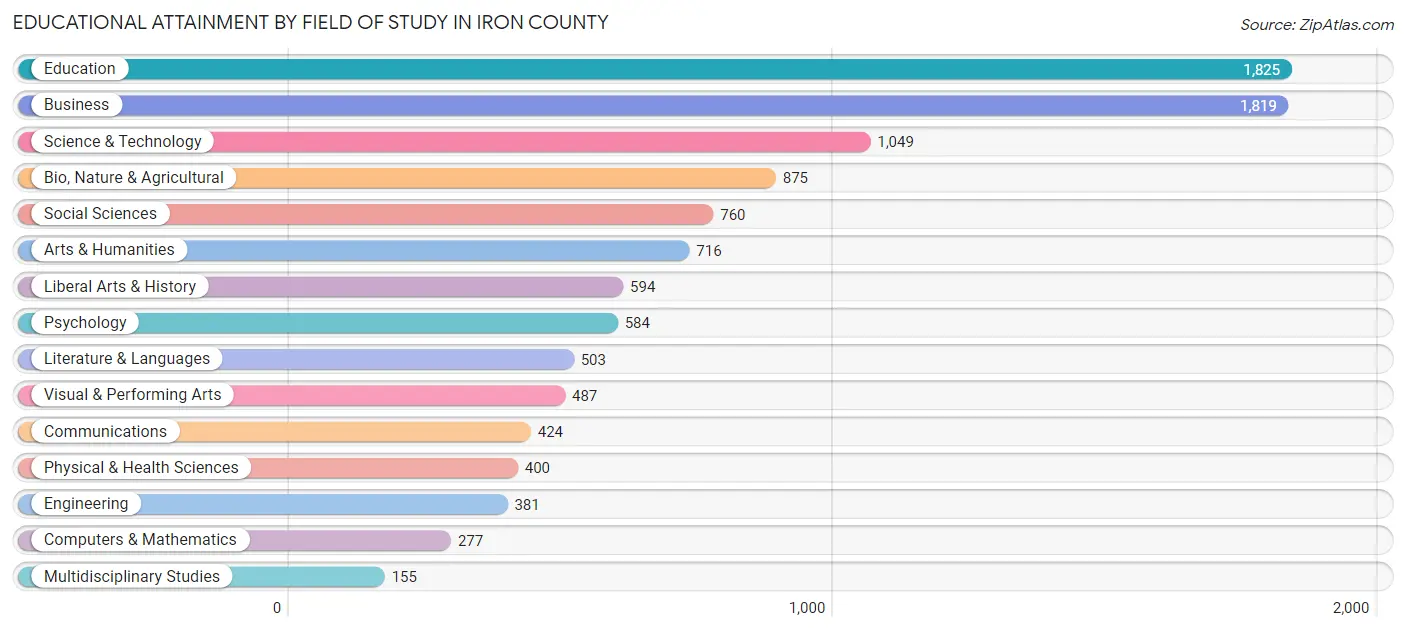
| Field of Study | # Graduates | % Graduates |
| Computers & Mathematics | 277 | 2.5% |
| Bio, Nature & Agricultural | 875 | 8.1% |
| Physical & Health Sciences | 400 | 3.7% |
| Psychology | 584 | 5.4% |
| Social Sciences | 760 | 7.0% |
| Engineering | 381 | 3.5% |
| Multidisciplinary Studies | 155 | 1.4% |
| Science & Technology | 1,049 | 9.7% |
| Business | 1,819 | 16.8% |
| Education | 1,825 | 16.8% |
| Literature & Languages | 503 | 4.6% |
| Liberal Arts & History | 594 | 5.5% |
| Visual & Performing Arts | 487 | 4.5% |
| Communications | 424 | 3.9% |
| Arts & Humanities | 716 | 6.6% |
| Total | 10,849 | 100.0% |
Transportation & Commute in Iron County
Vehicle Availability by Sex in Iron County
The most prevalent vehicle ownership categories in Iron County are males with 2 vehicles (5,201, accounting for 36.3%) and females with 2 vehicles (4,297, making up 43.2%).
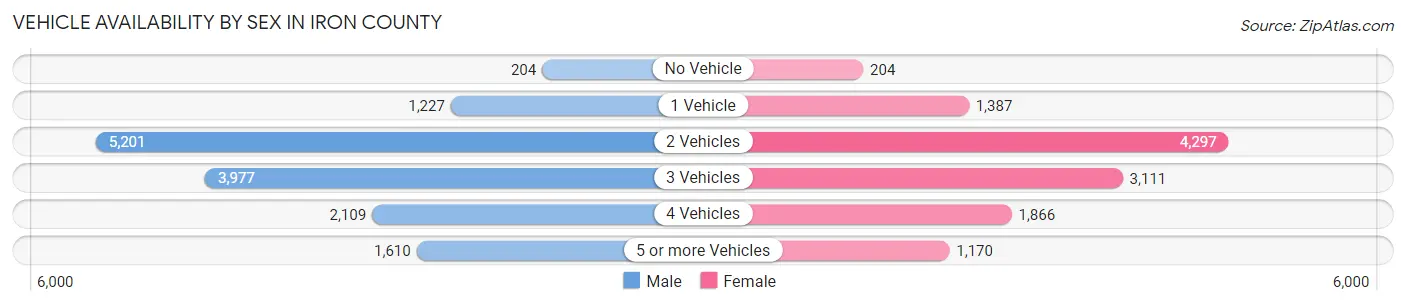
| Vehicles Available | Male | Female |
| No Vehicle | 204 (1.4%) | 204 (1.7%) |
| 1 Vehicle | 1,227 (8.6%) | 1,387 (11.5%) |
| 2 Vehicles | 5,201 (36.3%) | 4,297 (35.7%) |
| 3 Vehicles | 3,977 (27.8%) | 3,111 (25.9%) |
| 4 Vehicles | 2,109 (14.7%) | 1,866 (15.5%) |
| 5 or more Vehicles | 1,610 (11.2%) | 1,170 (9.7%) |
| Total | 14,328 (100.0%) | 12,035 (100.0%) |
Commute Time in Iron County
The most frequently occuring commute durations in Iron County are 10 to 14 minutes (7,218 commuters, 30.1%), 5 to 9 minutes (5,867 commuters, 24.4%), and 15 to 19 minutes (4,407 commuters, 18.3%).
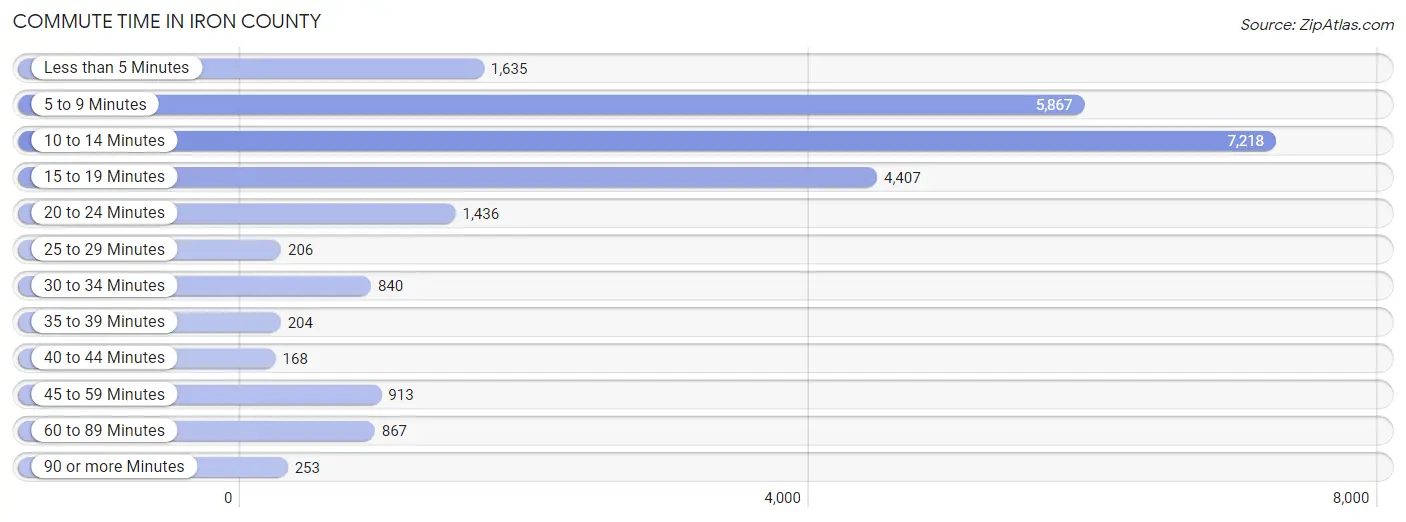
| Commute Time | # Commuters | % Commuters |
| Less than 5 Minutes | 1,635 | 6.8% |
| 5 to 9 Minutes | 5,867 | 24.4% |
| 10 to 14 Minutes | 7,218 | 30.1% |
| 15 to 19 Minutes | 4,407 | 18.3% |
| 20 to 24 Minutes | 1,436 | 6.0% |
| 25 to 29 Minutes | 206 | 0.9% |
| 30 to 34 Minutes | 840 | 3.5% |
| 35 to 39 Minutes | 204 | 0.9% |
| 40 to 44 Minutes | 168 | 0.7% |
| 45 to 59 Minutes | 913 | 3.8% |
| 60 to 89 Minutes | 867 | 3.6% |
| 90 or more Minutes | 253 | 1.1% |
Commute Time by Sex in Iron County
The most common commute times in Iron County are 10 to 14 minutes (3,946 commuters, 30.1%) for males and 10 to 14 minutes (3,272 commuters, 30.0%) for females.
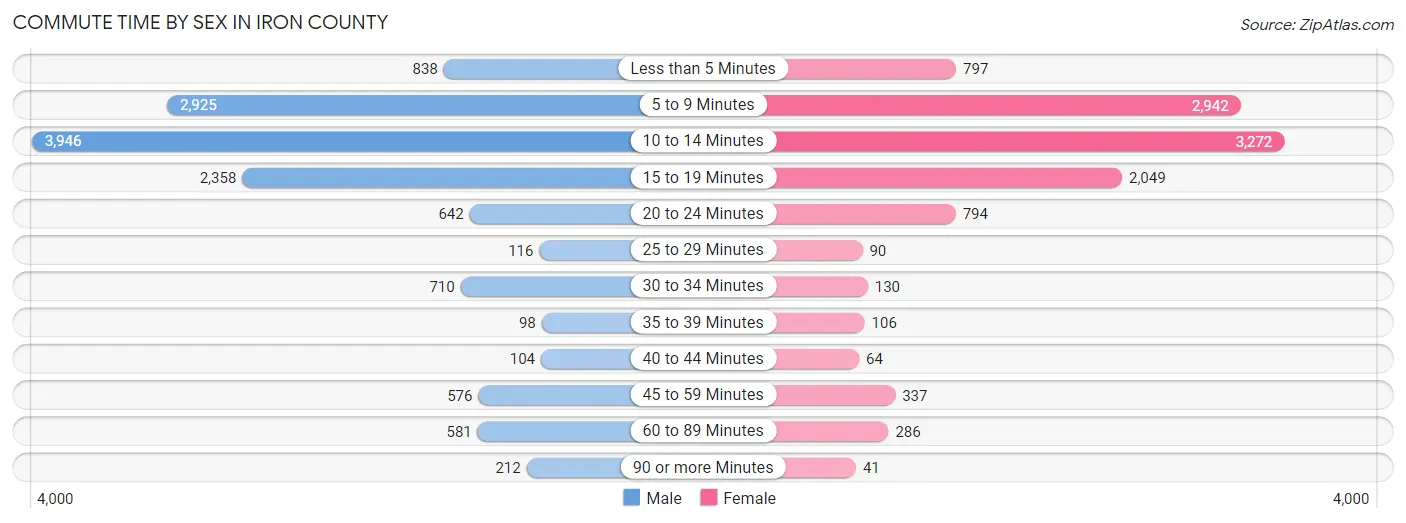
| Commute Time | Male | Female |
| Less than 5 Minutes | 838 (6.4%) | 797 (7.3%) |
| 5 to 9 Minutes | 2,925 (22.3%) | 2,942 (27.0%) |
| 10 to 14 Minutes | 3,946 (30.1%) | 3,272 (30.0%) |
| 15 to 19 Minutes | 2,358 (18.0%) | 2,049 (18.8%) |
| 20 to 24 Minutes | 642 (4.9%) | 794 (7.3%) |
| 25 to 29 Minutes | 116 (0.9%) | 90 (0.8%) |
| 30 to 34 Minutes | 710 (5.4%) | 130 (1.2%) |
| 35 to 39 Minutes | 98 (0.7%) | 106 (1.0%) |
| 40 to 44 Minutes | 104 (0.8%) | 64 (0.6%) |
| 45 to 59 Minutes | 576 (4.4%) | 337 (3.1%) |
| 60 to 89 Minutes | 581 (4.4%) | 286 (2.6%) |
| 90 or more Minutes | 212 (1.6%) | 41 (0.4%) |
Time of Departure to Work by Sex in Iron County
The most frequent times of departure to work in Iron County are 7:30 AM to 7:59 AM (1,865, 14.2%) for males and 7:30 AM to 7:59 AM (1,592, 14.6%) for females.
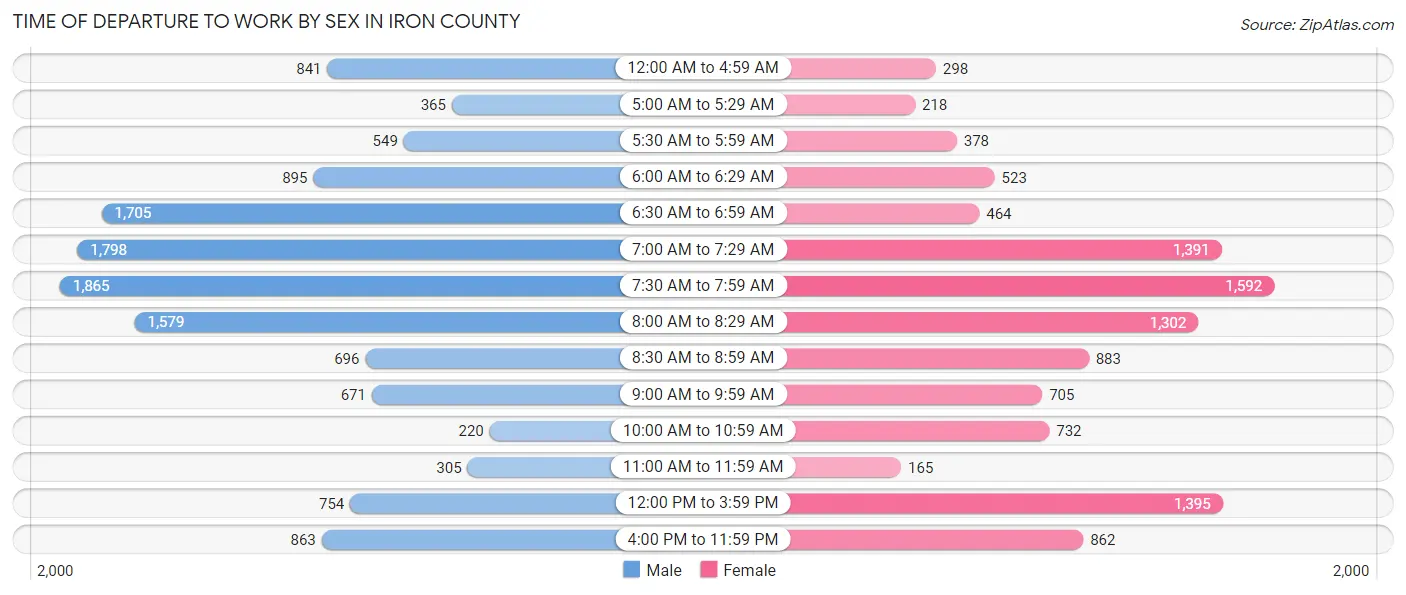
| Time of Departure | Male | Female |
| 12:00 AM to 4:59 AM | 841 (6.4%) | 298 (2.7%) |
| 5:00 AM to 5:29 AM | 365 (2.8%) | 218 (2.0%) |
| 5:30 AM to 5:59 AM | 549 (4.2%) | 378 (3.5%) |
| 6:00 AM to 6:29 AM | 895 (6.8%) | 523 (4.8%) |
| 6:30 AM to 6:59 AM | 1,705 (13.0%) | 464 (4.3%) |
| 7:00 AM to 7:29 AM | 1,798 (13.7%) | 1,391 (12.8%) |
| 7:30 AM to 7:59 AM | 1,865 (14.2%) | 1,592 (14.6%) |
| 8:00 AM to 8:29 AM | 1,579 (12.0%) | 1,302 (11.9%) |
| 8:30 AM to 8:59 AM | 696 (5.3%) | 883 (8.1%) |
| 9:00 AM to 9:59 AM | 671 (5.1%) | 705 (6.5%) |
| 10:00 AM to 10:59 AM | 220 (1.7%) | 732 (6.7%) |
| 11:00 AM to 11:59 AM | 305 (2.3%) | 165 (1.5%) |
| 12:00 PM to 3:59 PM | 754 (5.8%) | 1,395 (12.8%) |
| 4:00 PM to 11:59 PM | 863 (6.6%) | 862 (7.9%) |
| Total | 13,106 (100.0%) | 10,908 (100.0%) |
Housing Occupancy in Iron County
Occupancy by Ownership in Iron County
Of the total 18,596 dwellings in Iron County, owner-occupied units account for 12,644 (68.0%), while renter-occupied units make up 5,952 (32.0%).
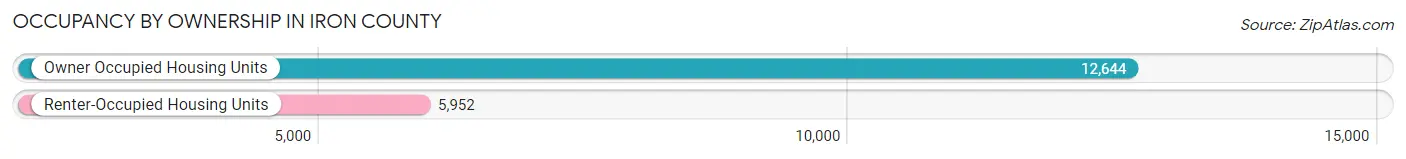
| Occupancy | # Housing Units | % Housing Units |
| Owner Occupied Housing Units | 12,644 | 68.0% |
| Renter-Occupied Housing Units | 5,952 | 32.0% |
| Total Occupied Housing Units | 18,596 | 100.0% |
Occupancy by Household Size in Iron County
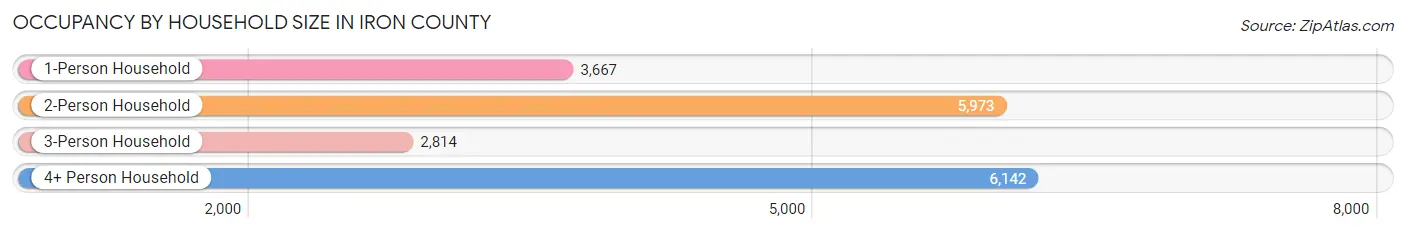
| Household Size | # Housing Units | % Housing Units |
| 1-Person Household | 3,667 | 19.7% |
| 2-Person Household | 5,973 | 32.1% |
| 3-Person Household | 2,814 | 15.1% |
| 4+ Person Household | 6,142 | 33.0% |
| Total Housing Units | 18,596 | 100.0% |
Occupancy by Ownership by Household Size in Iron County
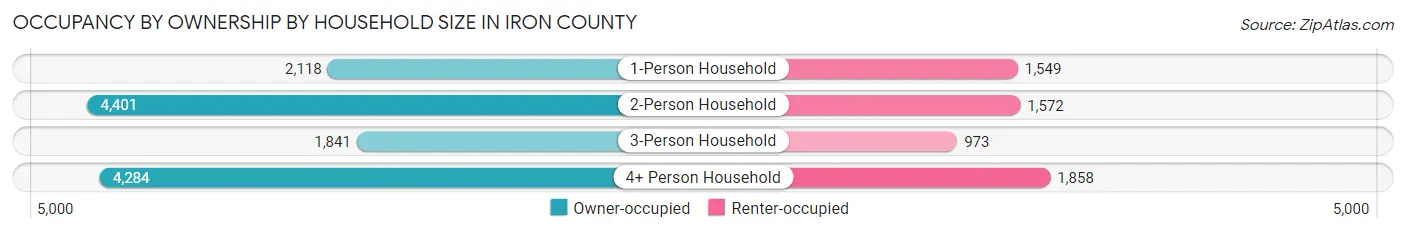
| Household Size | Owner-occupied | Renter-occupied |
| 1-Person Household | 2,118 (57.8%) | 1,549 (42.2%) |
| 2-Person Household | 4,401 (73.7%) | 1,572 (26.3%) |
| 3-Person Household | 1,841 (65.4%) | 973 (34.6%) |
| 4+ Person Household | 4,284 (69.8%) | 1,858 (30.2%) |
| Total Housing Units | 12,644 (68.0%) | 5,952 (32.0%) |
Occupancy by Educational Attainment in Iron County
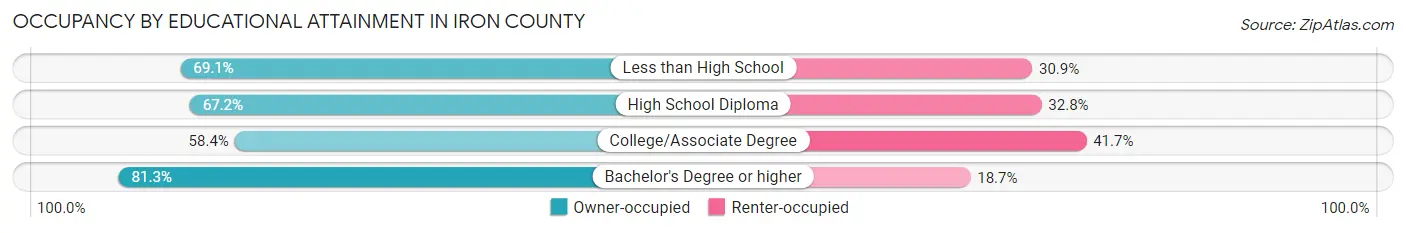
| Household Size | Owner-occupied | Renter-occupied |
| Less than High School | 785 (69.1%) | 351 (30.9%) |
| High School Diploma | 2,459 (67.2%) | 1,198 (32.8%) |
| College/Associate Degree | 4,637 (58.4%) | 3,310 (41.6%) |
| Bachelor's Degree or higher | 4,763 (81.3%) | 1,093 (18.7%) |
Occupancy by Age of Householder in Iron County
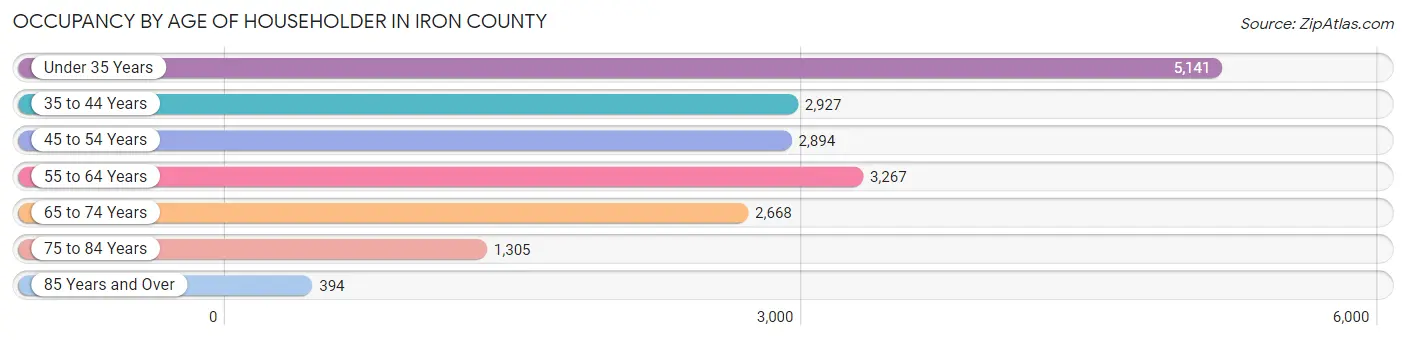
| Age Bracket | # Households | % Households |
| Under 35 Years | 5,141 | 27.7% |
| 35 to 44 Years | 2,927 | 15.7% |
| 45 to 54 Years | 2,894 | 15.6% |
| 55 to 64 Years | 3,267 | 17.6% |
| 65 to 74 Years | 2,668 | 14.3% |
| 75 to 84 Years | 1,305 | 7.0% |
| 85 Years and Over | 394 | 2.1% |
| Total | 18,596 | 100.0% |
Housing Finances in Iron County
Median Income by Occupancy in Iron County
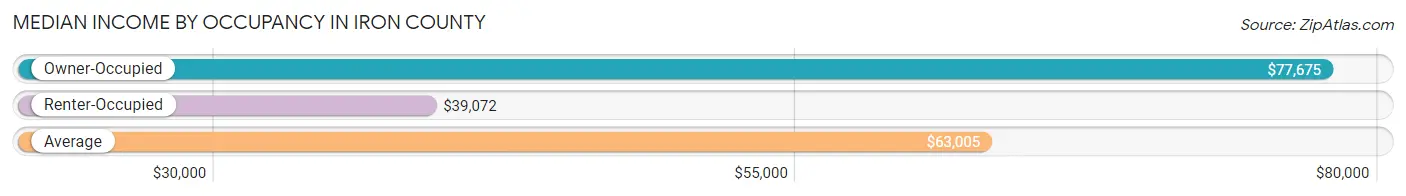
| Occupancy Type | # Households | Median Income |
| Owner-Occupied | 12,644 (68.0%) | $77,675 |
| Renter-Occupied | 5,952 (32.0%) | $39,072 |
| Average | 18,596 (100.0%) | $63,005 |
Occupancy by Householder Income Bracket in Iron County
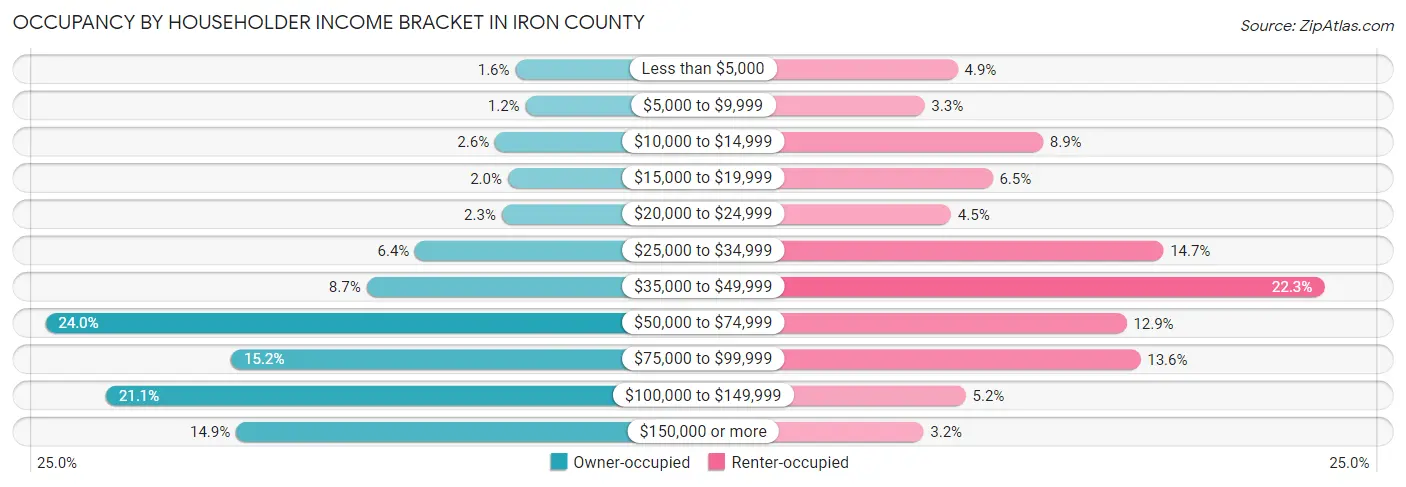
| Income Bracket | Owner-occupied | Renter-occupied |
| Less than $5,000 | 206 (1.6%) | 289 (4.9%) |
| $5,000 to $9,999 | 145 (1.1%) | 195 (3.3%) |
| $10,000 to $14,999 | 329 (2.6%) | 531 (8.9%) |
| $15,000 to $19,999 | 251 (2.0%) | 388 (6.5%) |
| $20,000 to $24,999 | 288 (2.3%) | 270 (4.5%) |
| $25,000 to $34,999 | 809 (6.4%) | 872 (14.6%) |
| $35,000 to $49,999 | 1,102 (8.7%) | 1,328 (22.3%) |
| $50,000 to $74,999 | 3,036 (24.0%) | 768 (12.9%) |
| $75,000 to $99,999 | 1,918 (15.2%) | 807 (13.6%) |
| $100,000 to $149,999 | 2,672 (21.1%) | 312 (5.2%) |
| $150,000 or more | 1,888 (14.9%) | 192 (3.2%) |
| Total | 12,644 (100.0%) | 5,952 (100.0%) |
Monthly Housing Cost Tiers in Iron County
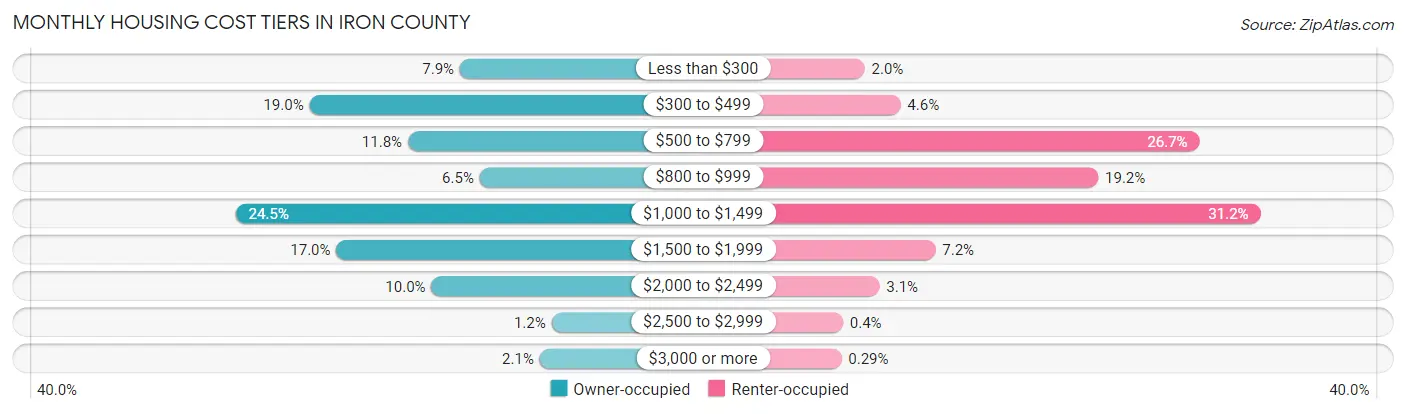
| Monthly Cost | Owner-occupied | Renter-occupied |
| Less than $300 | 1,004 (7.9%) | 119 (2.0%) |
| $300 to $499 | 2,405 (19.0%) | 276 (4.6%) |
| $500 to $799 | 1,488 (11.8%) | 1,587 (26.7%) |
| $800 to $999 | 819 (6.5%) | 1,143 (19.2%) |
| $1,000 to $1,499 | 3,093 (24.5%) | 1,854 (31.1%) |
| $1,500 to $1,999 | 2,154 (17.0%) | 429 (7.2%) |
| $2,000 to $2,499 | 1,269 (10.0%) | 184 (3.1%) |
| $2,500 to $2,999 | 151 (1.2%) | 24 (0.4%) |
| $3,000 or more | 261 (2.1%) | 17 (0.3%) |
| Total | 12,644 (100.0%) | 5,952 (100.0%) |
Physical Housing Characteristics in Iron County
Housing Structures in Iron County
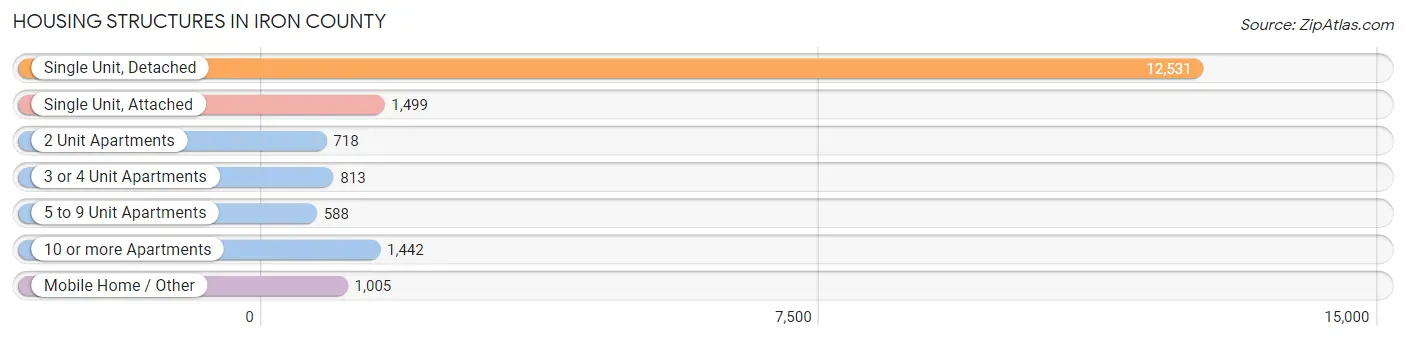
| Structure Type | # Housing Units | % Housing Units |
| Single Unit, Detached | 12,531 | 67.4% |
| Single Unit, Attached | 1,499 | 8.1% |
| 2 Unit Apartments | 718 | 3.9% |
| 3 or 4 Unit Apartments | 813 | 4.4% |
| 5 to 9 Unit Apartments | 588 | 3.2% |
| 10 or more Apartments | 1,442 | 7.7% |
| Mobile Home / Other | 1,005 | 5.4% |
| Total | 18,596 | 100.0% |
Housing Structures by Occupancy in Iron County
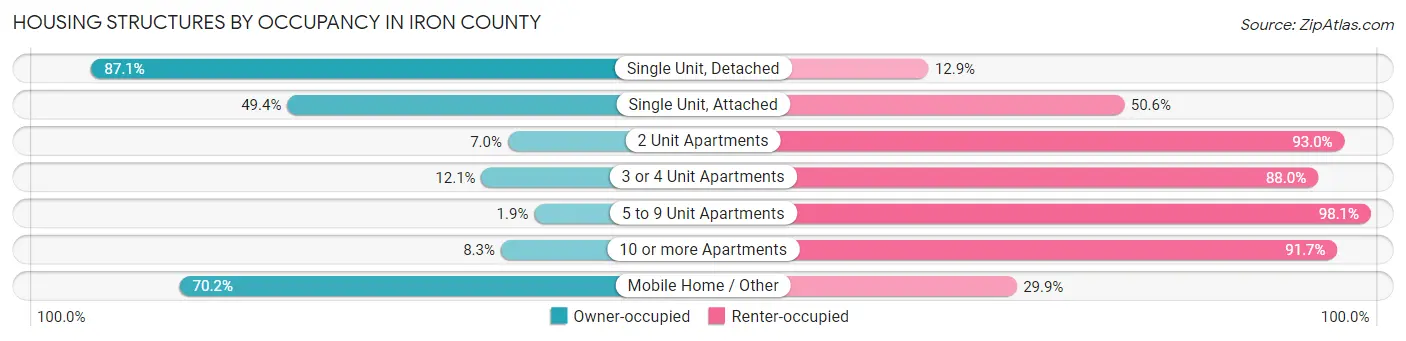
| Structure Type | Owner-occupied | Renter-occupied |
| Single Unit, Detached | 10,919 (87.1%) | 1,612 (12.9%) |
| Single Unit, Attached | 741 (49.4%) | 758 (50.6%) |
| 2 Unit Apartments | 50 (7.0%) | 668 (93.0%) |
| 3 or 4 Unit Apartments | 98 (12.0%) | 715 (87.9%) |
| 5 to 9 Unit Apartments | 11 (1.9%) | 577 (98.1%) |
| 10 or more Apartments | 120 (8.3%) | 1,322 (91.7%) |
| Mobile Home / Other | 705 (70.2%) | 300 (29.8%) |
| Total | 12,644 (68.0%) | 5,952 (32.0%) |
Housing Structures by Number of Rooms in Iron County
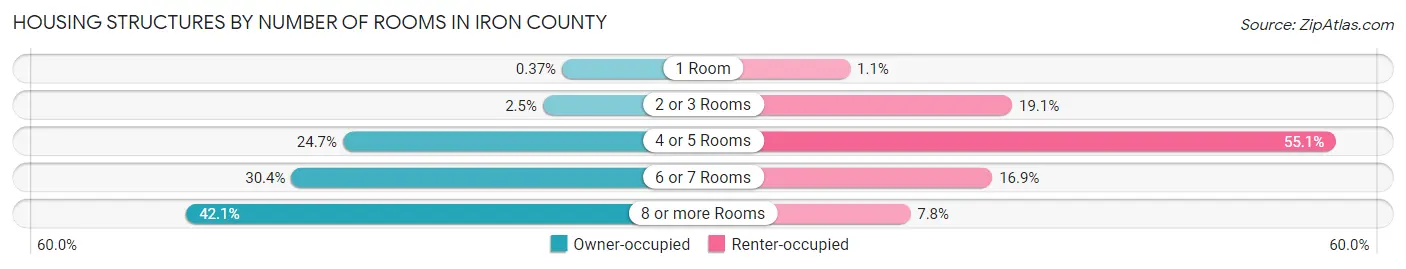
| Number of Rooms | Owner-occupied | Renter-occupied |
| 1 Room | 47 (0.4%) | 67 (1.1%) |
| 2 or 3 Rooms | 315 (2.5%) | 1,137 (19.1%) |
| 4 or 5 Rooms | 3,120 (24.7%) | 3,277 (55.1%) |
| 6 or 7 Rooms | 3,844 (30.4%) | 1,006 (16.9%) |
| 8 or more Rooms | 5,318 (42.1%) | 465 (7.8%) |
| Total | 12,644 (100.0%) | 5,952 (100.0%) |
Housing Structure by Heating Type in Iron County
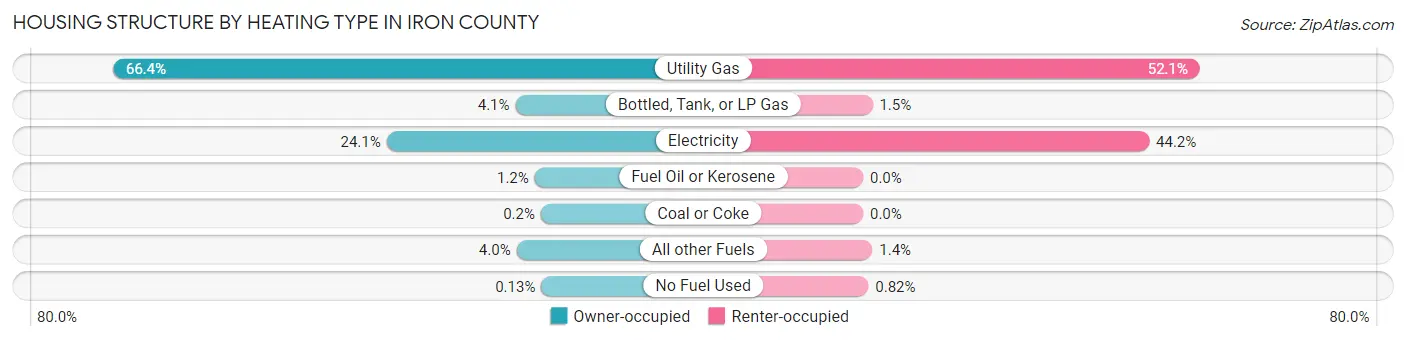
| Heating Type | Owner-occupied | Renter-occupied |
| Utility Gas | 8,391 (66.4%) | 3,098 (52.0%) |
| Bottled, Tank, or LP Gas | 522 (4.1%) | 87 (1.5%) |
| Electricity | 3,041 (24.0%) | 2,632 (44.2%) |
| Fuel Oil or Kerosene | 147 (1.2%) | 0 (0.0%) |
| Coal or Coke | 25 (0.2%) | 0 (0.0%) |
| All other Fuels | 501 (4.0%) | 86 (1.4%) |
| No Fuel Used | 17 (0.1%) | 49 (0.8%) |
| Total | 12,644 (100.0%) | 5,952 (100.0%) |
Household Vehicle Usage in Iron County
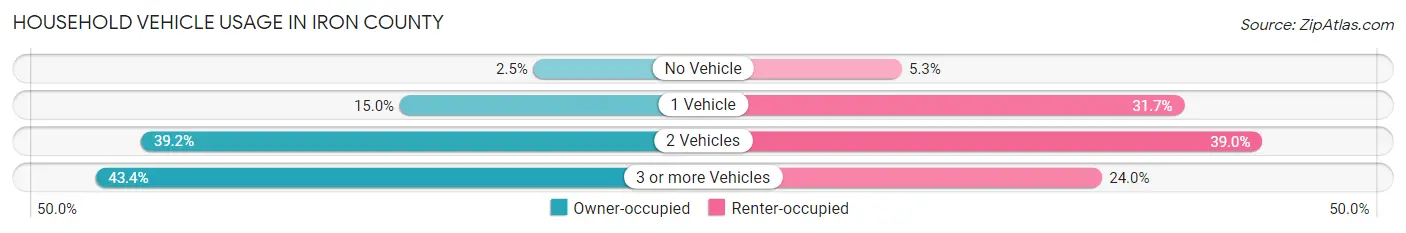
| Vehicles per Household | Owner-occupied | Renter-occupied |
| No Vehicle | 314 (2.5%) | 317 (5.3%) |
| 1 Vehicle | 1,892 (15.0%) | 1,886 (31.7%) |
| 2 Vehicles | 4,950 (39.2%) | 2,319 (39.0%) |
| 3 or more Vehicles | 5,488 (43.4%) | 1,430 (24.0%) |
| Total | 12,644 (100.0%) | 5,952 (100.0%) |
Real Estate & Mortgages in Iron County
Real Estate and Mortgage Overview in Iron County
| Characteristic | Without Mortgage | With Mortgage |
| Housing Units | 4,405 | 8,239 |
| Median Property Value | $283,400 | $313,000 |
| Median Household Income | $64,109 | $1,412 |
| Monthly Housing Costs | $385 | $259 |
| Real Estate Taxes | $1,410 | $241 |
Property Value by Mortgage Status in Iron County
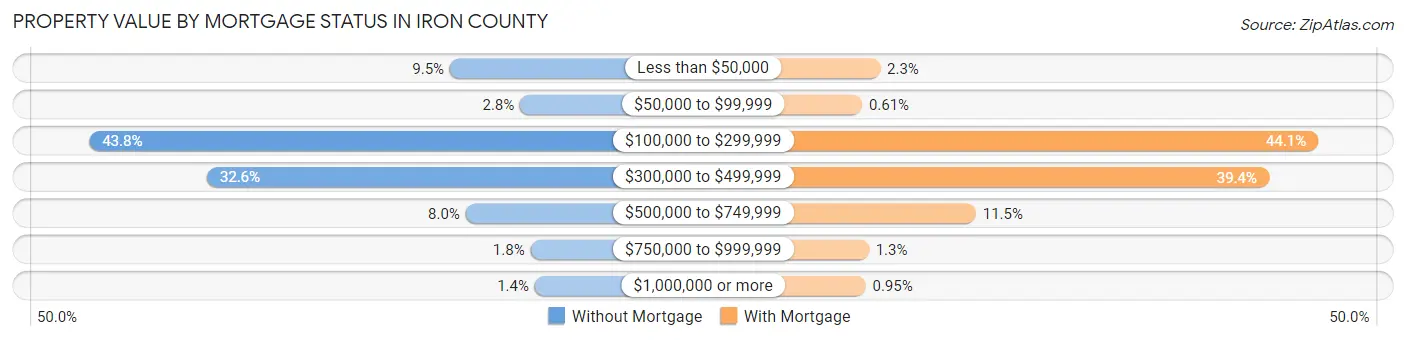
| Property Value | Without Mortgage | With Mortgage |
| Less than $50,000 | 418 (9.5%) | 193 (2.3%) |
| $50,000 to $99,999 | 124 (2.8%) | 50 (0.6%) |
| $100,000 to $299,999 | 1,931 (43.8%) | 3,629 (44.1%) |
| $300,000 to $499,999 | 1,438 (32.6%) | 3,243 (39.4%) |
| $500,000 to $749,999 | 352 (8.0%) | 943 (11.5%) |
| $750,000 to $999,999 | 80 (1.8%) | 103 (1.3%) |
| $1,000,000 or more | 62 (1.4%) | 78 (0.9%) |
| Total | 4,405 (100.0%) | 8,239 (100.0%) |
Household Income by Mortgage Status in Iron County
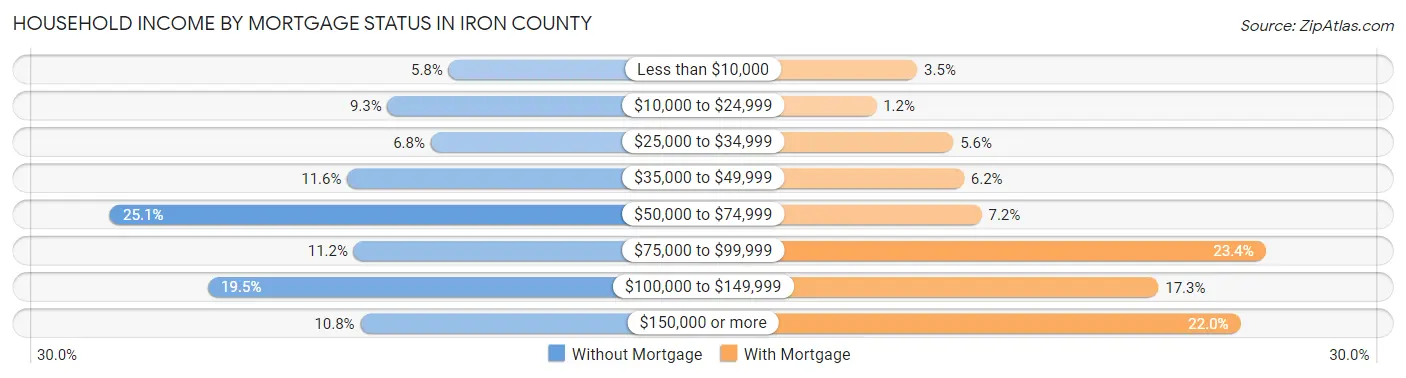
| Household Income | Without Mortgage | With Mortgage |
| Less than $10,000 | 254 (5.8%) | 290 (3.5%) |
| $10,000 to $24,999 | 408 (9.3%) | 97 (1.2%) |
| $25,000 to $34,999 | 299 (6.8%) | 460 (5.6%) |
| $35,000 to $49,999 | 509 (11.6%) | 510 (6.2%) |
| $50,000 to $74,999 | 1,106 (25.1%) | 593 (7.2%) |
| $75,000 to $99,999 | 493 (11.2%) | 1,930 (23.4%) |
| $100,000 to $149,999 | 860 (19.5%) | 1,425 (17.3%) |
| $150,000 or more | 476 (10.8%) | 1,812 (22.0%) |
| Total | 4,405 (100.0%) | 8,239 (100.0%) |
Property Value to Household Income Ratio in Iron County
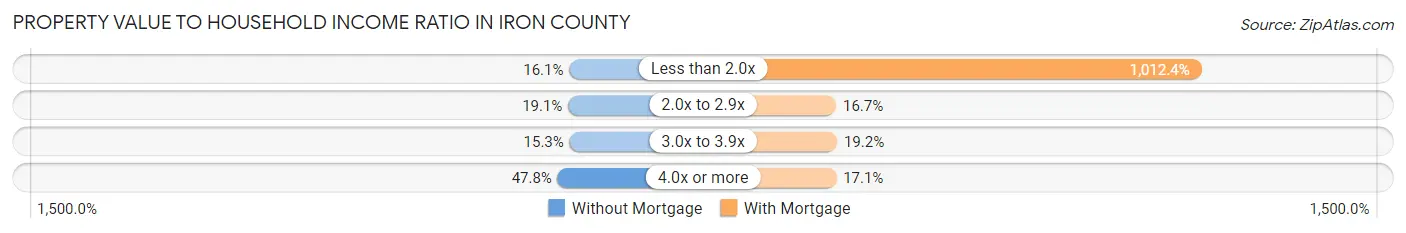
| Value-to-Income Ratio | Without Mortgage | With Mortgage |
| Less than 2.0x | 710 (16.1%) | 83,410 (1,012.4%) |
| 2.0x to 2.9x | 843 (19.1%) | 1,373 (16.7%) |
| 3.0x to 3.9x | 672 (15.3%) | 1,585 (19.2%) |
| 4.0x or more | 2,104 (47.8%) | 1,408 (17.1%) |
| Total | 4,405 (100.0%) | 8,239 (100.0%) |
Real Estate Taxes by Mortgage Status in Iron County
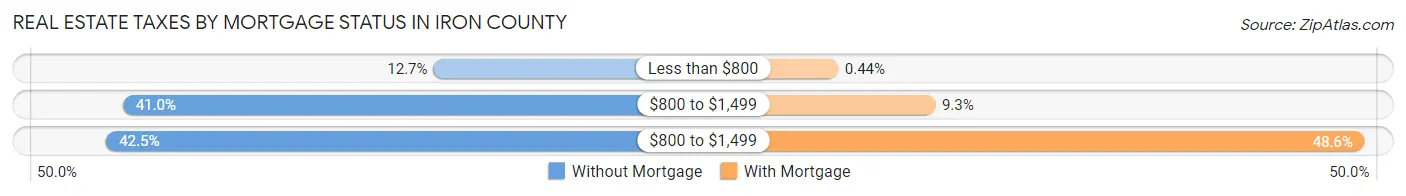
| Property Taxes | Without Mortgage | With Mortgage |
| Less than $800 | 558 (12.7%) | 36 (0.4%) |
| $800 to $1,499 | 1,808 (41.0%) | 767 (9.3%) |
| $800 to $1,499 | 1,874 (42.5%) | 4,001 (48.6%) |
| Total | 4,405 (100.0%) | 8,239 (100.0%) |
Health & Disability in Iron County
Health Insurance Coverage by Age in Iron County
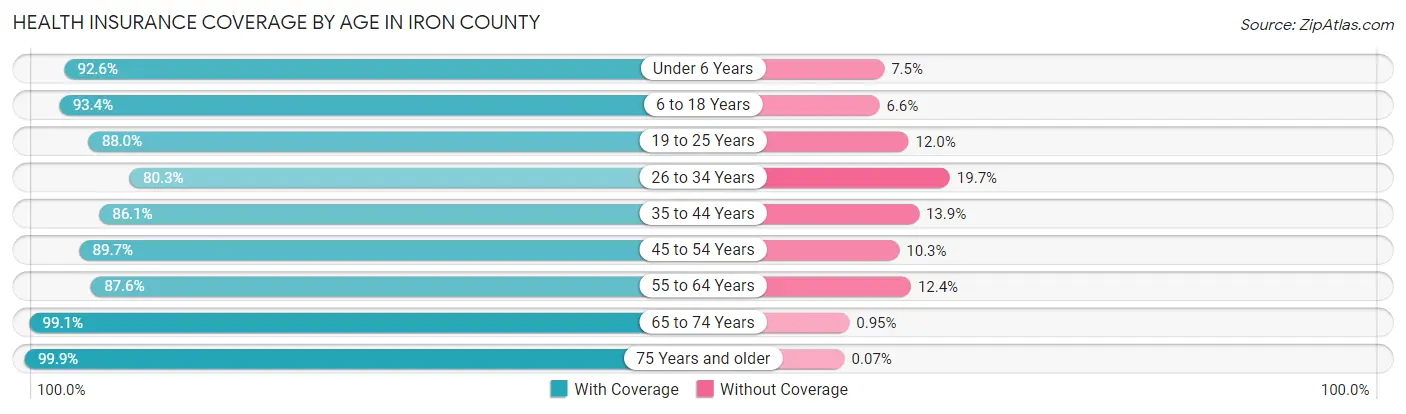
| Age Bracket | With Coverage | Without Coverage |
| Under 6 Years | 4,736 (92.5%) | 381 (7.4%) |
| 6 to 18 Years | 11,621 (93.4%) | 816 (6.6%) |
| 19 to 25 Years | 7,588 (88.0%) | 1,033 (12.0%) |
| 26 to 34 Years | 5,424 (80.3%) | 1,330 (19.7%) |
| 35 to 44 Years | 5,565 (86.1%) | 901 (13.9%) |
| 45 to 54 Years | 4,804 (89.7%) | 550 (10.3%) |
| 55 to 64 Years | 4,853 (87.6%) | 689 (12.4%) |
| 65 to 74 Years | 4,688 (99.1%) | 45 (0.9%) |
| 75 Years and older | 2,698 (99.9%) | 2 (0.1%) |
| Total | 51,977 (90.0%) | 5,747 (10.0%) |
Health Insurance Coverage by Citizenship Status in Iron County
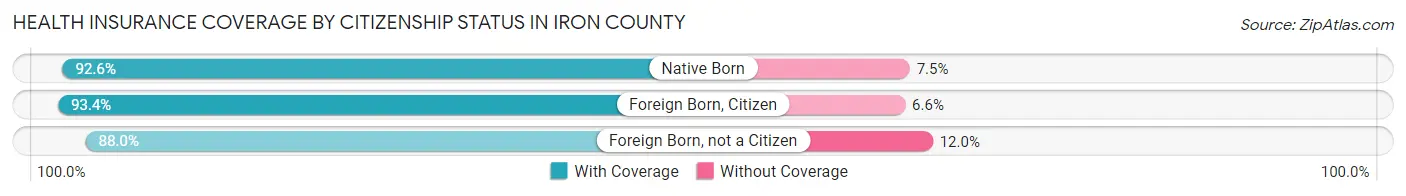
| Citizenship Status | With Coverage | Without Coverage |
| Native Born | 4,736 (92.5%) | 381 (7.4%) |
| Foreign Born, Citizen | 11,621 (93.4%) | 816 (6.6%) |
| Foreign Born, not a Citizen | 7,588 (88.0%) | 1,033 (12.0%) |
Health Insurance Coverage by Household Income in Iron County
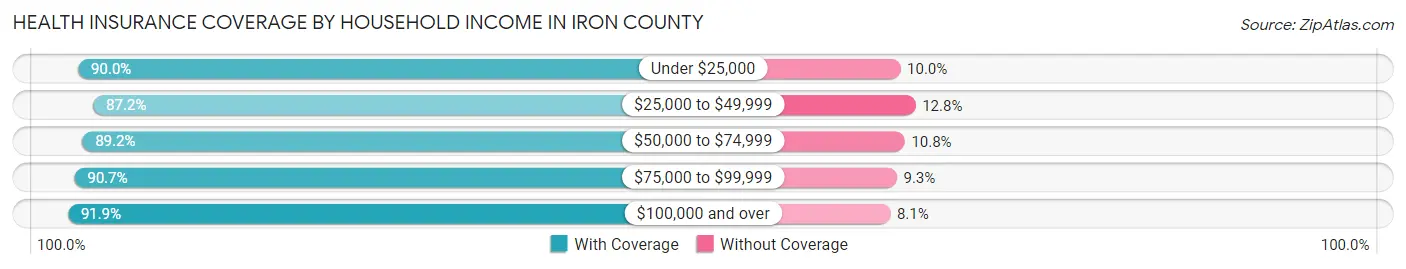
| Household Income | With Coverage | Without Coverage |
| Under $25,000 | 4,947 (90.0%) | 549 (10.0%) |
| $25,000 to $49,999 | 9,612 (87.2%) | 1,413 (12.8%) |
| $50,000 to $74,999 | 10,005 (89.2%) | 1,211 (10.8%) |
| $75,000 to $99,999 | 8,779 (90.7%) | 902 (9.3%) |
| $100,000 and over | 18,106 (91.9%) | 1,594 (8.1%) |
Public vs Private Health Insurance Coverage by Age in Iron County
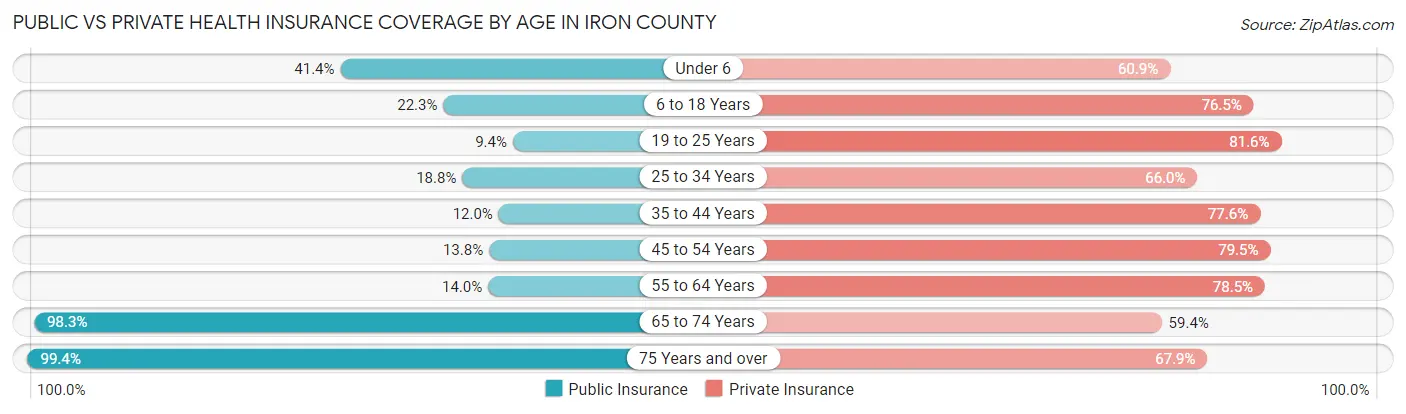
| Age Bracket | Public Insurance | Private Insurance |
| Under 6 | 2,118 (41.4%) | 3,118 (60.9%) |
| 6 to 18 Years | 2,771 (22.3%) | 9,508 (76.4%) |
| 19 to 25 Years | 809 (9.4%) | 7,033 (81.6%) |
| 25 to 34 Years | 1,268 (18.8%) | 4,457 (66.0%) |
| 35 to 44 Years | 776 (12.0%) | 5,019 (77.6%) |
| 45 to 54 Years | 739 (13.8%) | 4,258 (79.5%) |
| 55 to 64 Years | 775 (14.0%) | 4,352 (78.5%) |
| 65 to 74 Years | 4,650 (98.3%) | 2,810 (59.4%) |
| 75 Years and over | 2,685 (99.4%) | 1,832 (67.8%) |
| Total | 16,591 (28.7%) | 42,387 (73.4%) |
Disability Status by Sex by Age in Iron County
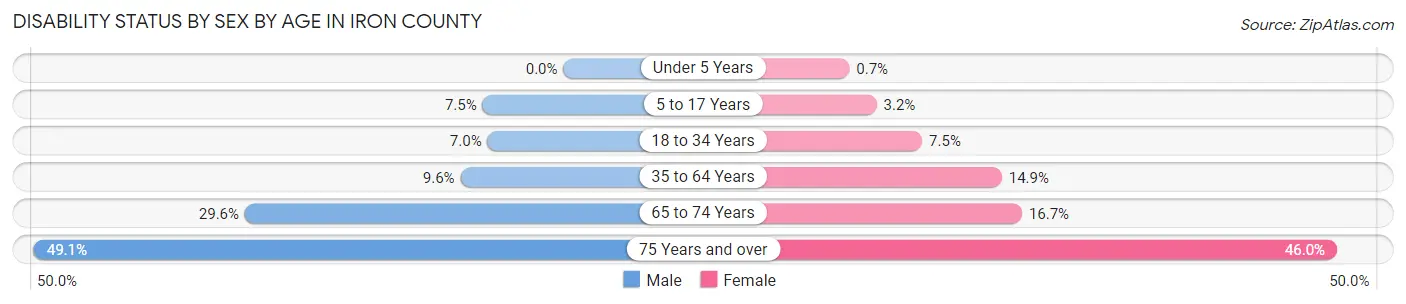
| Age Bracket | Male | Female |
| Under 5 Years | 0 (0.0%) | 13 (0.7%) |
| 5 to 17 Years | 463 (7.5%) | 191 (3.2%) |
| 18 to 34 Years | 590 (7.0%) | 633 (7.5%) |
| 35 to 64 Years | 819 (9.6%) | 1,304 (14.8%) |
| 65 to 74 Years | 692 (29.6%) | 400 (16.7%) |
| 75 Years and over | 654 (49.1%) | 629 (46.0%) |
Disability Class by Sex by Age in Iron County
Disability Class: Hearing Difficulty
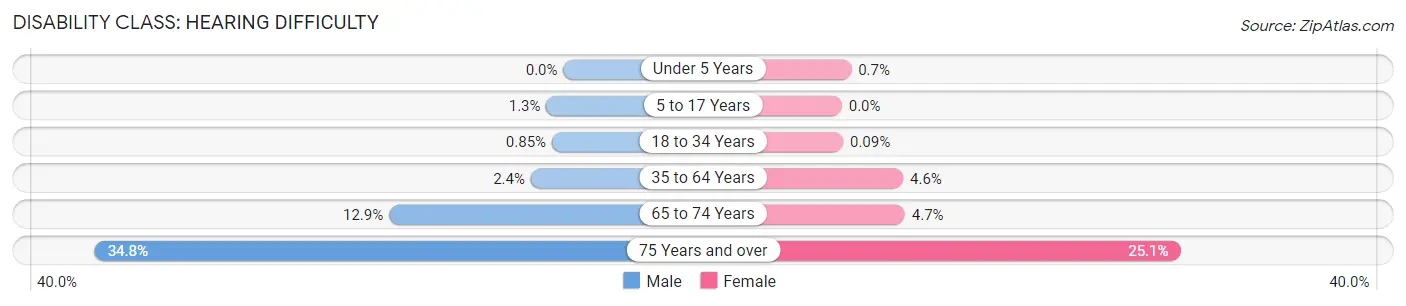
| Age Bracket | Male | Female |
| Under 5 Years | 0 (0.0%) | 13 (0.7%) |
| 5 to 17 Years | 78 (1.3%) | 0 (0.0%) |
| 18 to 34 Years | 71 (0.9%) | 8 (0.1%) |
| 35 to 64 Years | 208 (2.4%) | 400 (4.5%) |
| 65 to 74 Years | 303 (12.9%) | 112 (4.7%) |
| 75 Years and over | 463 (34.8%) | 344 (25.1%) |
Disability Class: Vision Difficulty
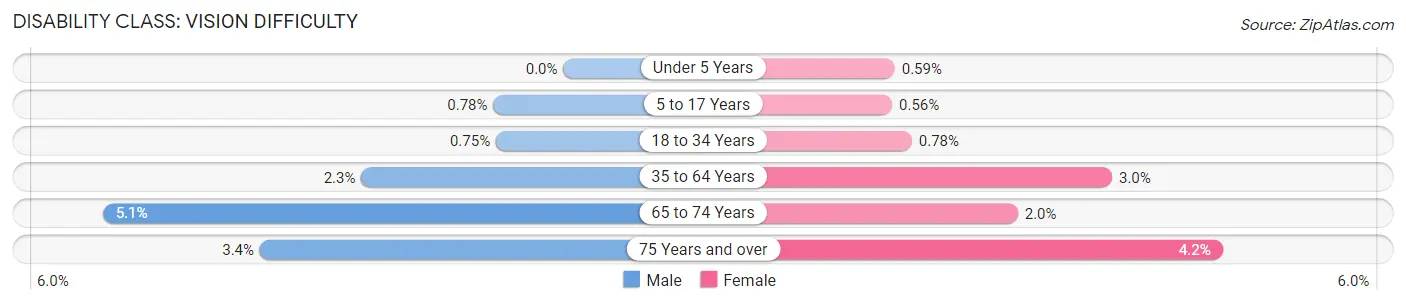
| Age Bracket | Male | Female |
| Under 5 Years | 0 (0.0%) | 11 (0.6%) |
| 5 to 17 Years | 48 (0.8%) | 33 (0.6%) |
| 18 to 34 Years | 63 (0.7%) | 66 (0.8%) |
| 35 to 64 Years | 193 (2.2%) | 264 (3.0%) |
| 65 to 74 Years | 120 (5.1%) | 47 (2.0%) |
| 75 Years and over | 45 (3.4%) | 58 (4.2%) |
Disability Class: Cognitive Difficulty
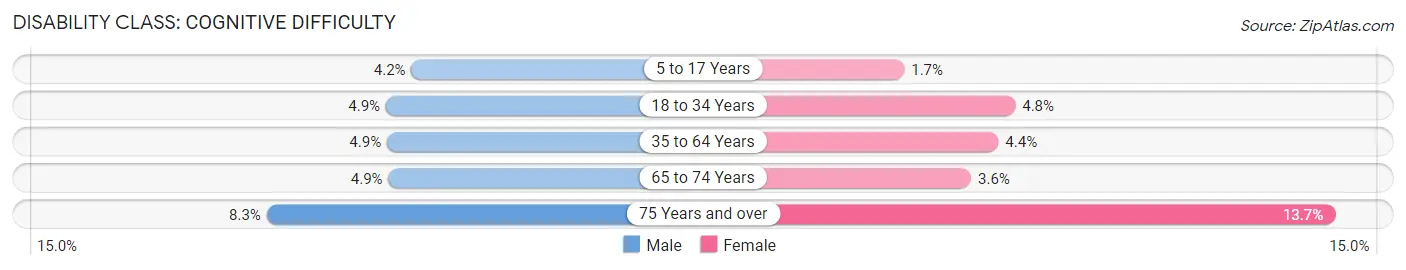
| Age Bracket | Male | Female |
| 5 to 17 Years | 261 (4.2%) | 103 (1.7%) |
| 18 to 34 Years | 414 (4.9%) | 410 (4.8%) |
| 35 to 64 Years | 421 (4.9%) | 383 (4.4%) |
| 65 to 74 Years | 114 (4.9%) | 86 (3.6%) |
| 75 Years and over | 110 (8.3%) | 188 (13.7%) |
Disability Class: Ambulatory Difficulty
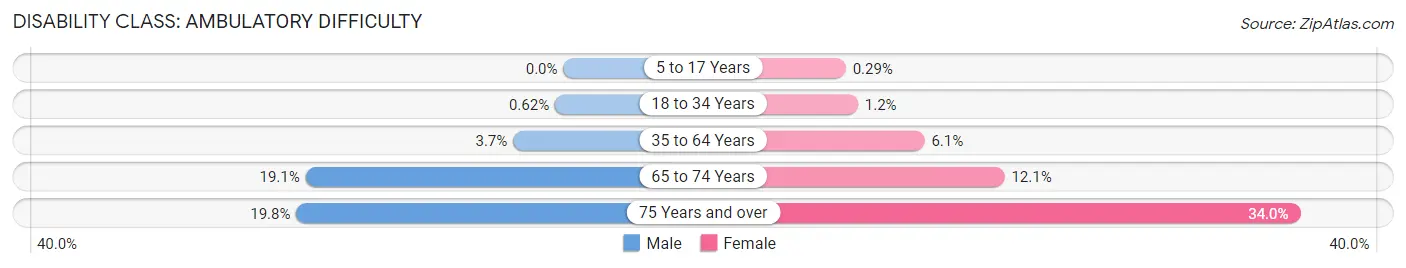
| Age Bracket | Male | Female |
| 5 to 17 Years | 0 (0.0%) | 17 (0.3%) |
| 18 to 34 Years | 52 (0.6%) | 101 (1.2%) |
| 35 to 64 Years | 320 (3.7%) | 539 (6.1%) |
| 65 to 74 Years | 448 (19.1%) | 289 (12.1%) |
| 75 Years and over | 264 (19.8%) | 466 (34.0%) |
Disability Class: Self-Care Difficulty
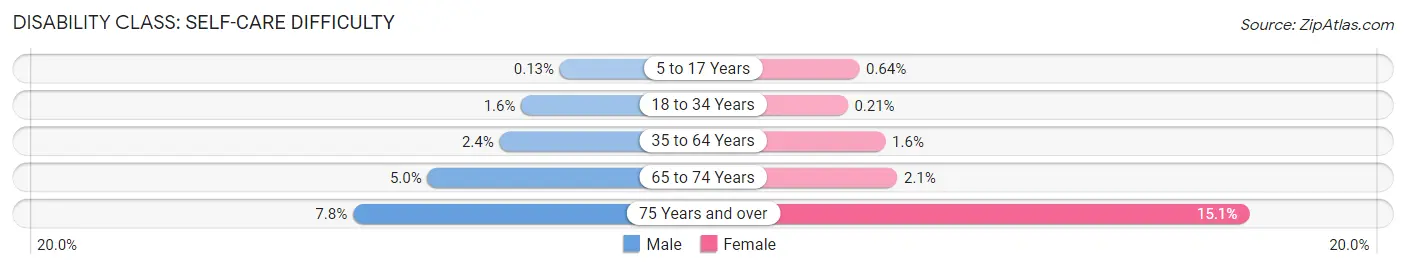
| Age Bracket | Male | Female |
| 5 to 17 Years | 8 (0.1%) | 38 (0.6%) |
| 18 to 34 Years | 131 (1.6%) | 18 (0.2%) |
| 35 to 64 Years | 203 (2.4%) | 141 (1.6%) |
| 65 to 74 Years | 118 (5.0%) | 49 (2.1%) |
| 75 Years and over | 104 (7.8%) | 207 (15.1%) |
Technology Access in Iron County
Computing Device Access in Iron County
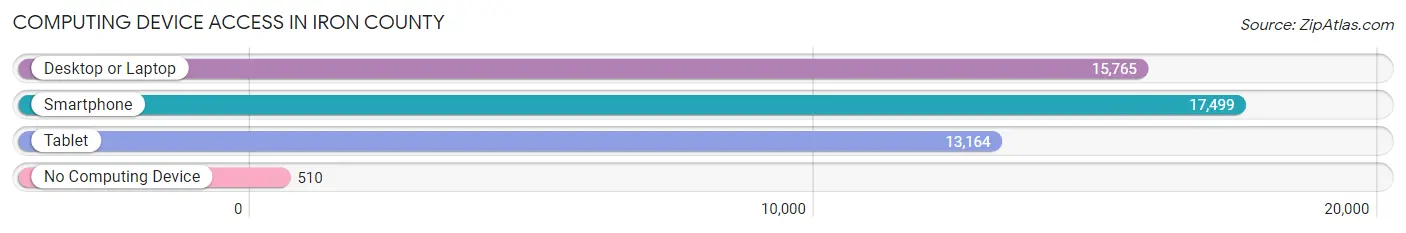
| Device Type | # Households | % Households |
| Desktop or Laptop | 15,765 | 84.8% |
| Smartphone | 17,499 | 94.1% |
| Tablet | 13,164 | 70.8% |
| No Computing Device | 510 | 2.7% |
| Total | 18,596 | 100.0% |
Internet Access in Iron County
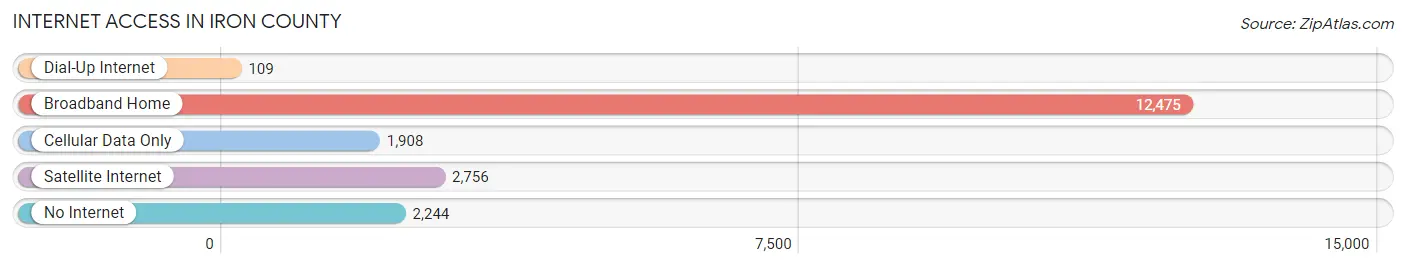
| Internet Type | # Households | % Households |
| Dial-Up Internet | 109 | 0.6% |
| Broadband Home | 12,475 | 67.1% |
| Cellular Data Only | 1,908 | 10.3% |
| Satellite Internet | 2,756 | 14.8% |
| No Internet | 2,244 | 12.1% |
| Total | 18,596 | 100.0% |
Iron County Summary
Iron County is located in the southwestern corner of Utah, and is bordered by Washington County to the north, Beaver County to the east, and Kane County to the south. The county seat is Parowan, and the largest city is Cedar City. Iron County is part of the Cedar City, UT Micropolitan Statistical Area.
History
Iron County was created in 1851, and was named after the iron ore deposits found in the area. The first settlers in the area were Mormon pioneers, who arrived in 1851. The first county seat was Parowan, which was established in 1851. The county was originally part of Washington County, but was split off in 1856.
In the late 19th century, Iron County was home to several mining towns, including Iron Springs, Iron City, and Iron Mountain. These towns were established to take advantage of the iron ore deposits in the area. The iron ore was used to make steel, which was used in the construction of the transcontinental railroad.
In the early 20th century, Iron County was home to several large cattle ranches. The area was also home to several logging operations, which harvested the area's abundant timber.
Geography
Iron County covers an area of 2,845 square miles, and is located in the southwestern corner of Utah. The county is bordered by Washington County to the north, Beaver County to the east, and Kane County to the south. The county is located in the Great Basin Desert, and is characterized by rugged mountains, deep canyons, and wide valleys.
The highest point in Iron County is the summit of Iron Mountain, which has an elevation of 9,890 feet. The lowest point in the county is the Beaver Dam Wash, which has an elevation of 4,400 feet.
The county is home to several rivers, including the Beaver River, the Parowan River, and the Sevier River. The county is also home to several lakes, including Cedar Breaks Lake, Iron Springs Lake, and Parowan Lake.
Economy
The economy of Iron County is largely based on agriculture, mining, and tourism. The county is home to several large cattle ranches, and is also home to several large mining operations. The county is also home to several tourist attractions, including Cedar Breaks National Monument, Zion National Park, and Bryce Canyon National Park.
The county is also home to several manufacturing companies, including Iron County Manufacturing, which produces steel products, and Iron County Plastics, which produces plastic products.
Demographics
As of the 2010 census, Iron County had a population of 46,163. The racial makeup of the county was 91.3% White, 0.7% Black or African American, 1.3% Native American, 0.7% Asian, 0.1% Pacific Islander, 4.2% from other races, and 1.9% from two or more races. Hispanic or Latino of any race were 10.3% of the population.
The median income for a household in Iron County was $41,945, and the median income for a family was $48,945. The per capita income for the county was $19,945. About 11.3% of families and 15.2% of the population were below the poverty line, including 19.2% of those under age 18 and 8.2% of those age 65 or over.
Common Questions
What is the Total Population of Iron County?
Total Population of Iron County is 58,068.
What is the Total Male Population of Iron County?
Total Male Population of Iron County is 29,210.
What is the Total Female Population of Iron County?
Total Female Population of Iron County is 28,858.
What is the Ratio of Males per 100 Females in Iron County?
There are 101.22 Males per 100 Females in Iron County.
What is the Ratio of Females per 100 Males in Iron County?
There are 98.79 Females per 100 Males in Iron County.
What is the Median Population Age in Iron County?
Median Population Age in Iron County is 29.5 Years.
What is the Average Family Size in Iron County
Average Family Size in Iron County is 3.6 People.
What is the Average Household Size in Iron County
Average Household Size in Iron County is 3.1 People.
What is Per Capita Income in Iron County?
Per Capita income in Iron County is $26,650.
What is the Median Family Income in Iron County?
Median Family Income in Iron County is $78,002.
What is the Median Household income in Iron County?
Median Household Income in Iron County is $63,005.
What is Income or Wage Gap in Iron County?
Income or Wage Gap in Iron County is 54.7%.
Women in Iron County earn 45.3 cents for every dollar earned by a man.
What is Family Income Deficit in Iron County?
Family Income Deficit in Iron County is $9,260.
Families that are below poverty line in Iron County earn $9,260 less on average than the poverty threshold level.
What is Inequality or Gini Index in Iron County?
Inequality or Gini Index in Iron County is 0.42.
How Large is the Labor Force in Iron County?
There are 28,214 People in the Labor Forcein in Iron County.
What is the Percentage of People in the Labor Force in Iron County?
64.4% of People are in the Labor Force in Iron County.
What is the Unemployment Rate in Iron County?
Unemployment Rate in Iron County is 3.3%.