Grand County, UT
Grand County Overview
9,680
TOTAL POPULATION
4,947
MALE POPULATION
4,733
FEMALE POPULATION
104.52
MALES / 100 FEMALES
95.67
FEMALES / 100 MALES
40.3
MEDIAN AGE
2.7
AVG FAMILY SIZE
2.2
AVG HOUSEHOLD SIZE
$37,510
PER CAPITA INCOME
$75,333
AVG FAMILY INCOME
$59,171
AVG HOUSEHOLD INCOME
31.7%
WAGE / INCOME GAP [ % ]
68.3¢/ $1
WAGE / INCOME GAP [ $ ]
0.46
INEQUALITY / GINI INDEX
5,760
LABOR FORCE [ PEOPLE ]
71.0%
PERCENT IN LABOR FORCE
1.2%
UNEMPLOYMENT RATE
Grand County Area Codes
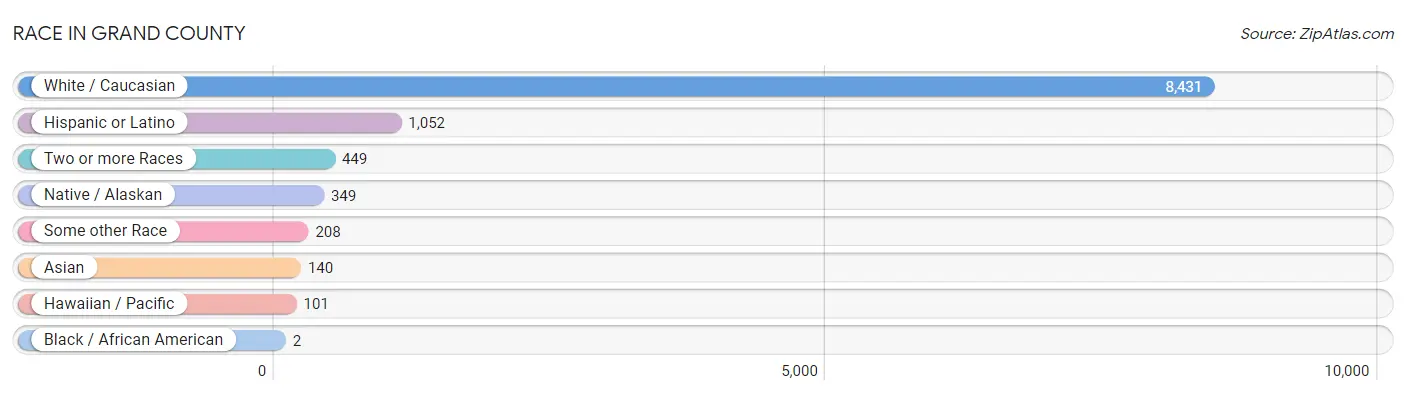
Race in Grand County
The most populous races in Grand County are White / Caucasian (8,431 | 87.1%), Hispanic or Latino (1,052 | 10.9%), and Two or more Races (449 | 4.6%).
| Race | # Population | % Population |
| Asian | 140 | 1.5% |
| Black / African American | 2 | 0.0% |
| Hawaiian / Pacific | 101 | 1.0% |
| Hispanic or Latino | 1,052 | 10.9% |
| Native / Alaskan | 349 | 3.6% |
| White / Caucasian | 8,431 | 87.1% |
| Two or more Races | 449 | 4.6% |
| Some other Race | 208 | 2.1% |
| Total | 9,680 | 100.0% |
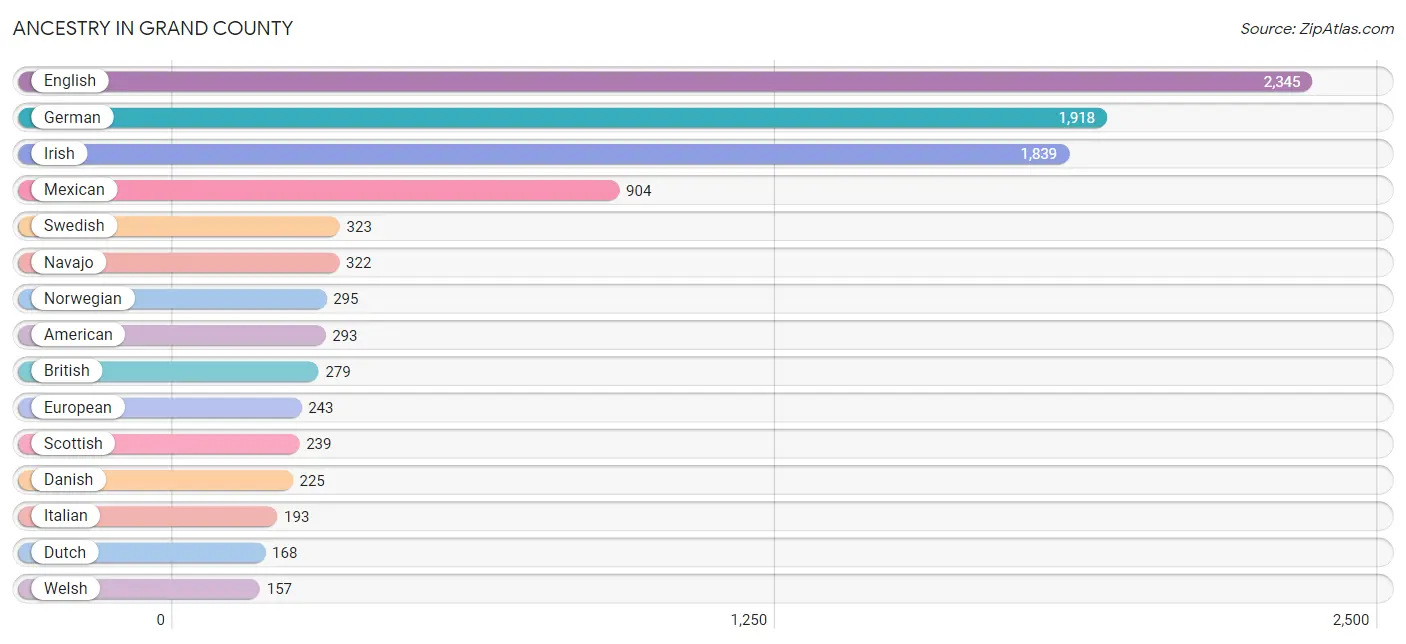
Ancestry in Grand County
The most populous ancestries reported in Grand County are English (2,345 | 24.2%), German (1,918 | 19.8%), Irish (1,839 | 19.0%), Mexican (904 | 9.3%), and Swedish (323 | 3.3%), together accounting for 75.7% of all Grand County residents.
| Ancestry | # Population | % Population |
| American | 293 | 3.0% |
| British | 279 | 2.9% |
| Canadian | 33 | 0.3% |
| Cherokee | 67 | 0.7% |
| Danish | 225 | 2.3% |
| Dutch | 168 | 1.7% |
| English | 2,345 | 24.2% |
| Estonian | 4 | 0.0% |
| European | 243 | 2.5% |
| Finnish | 72 | 0.7% |
| French | 145 | 1.5% |
| French Canadian | 54 | 0.6% |
| German | 1,918 | 19.8% |
| Hungarian | 35 | 0.4% |
| Indian (Asian) | 37 | 0.4% |
| Irish | 1,839 | 19.0% |
| Italian | 193 | 2.0% |
| Korean | 52 | 0.5% |
| Mexican | 904 | 9.3% |
| Native Hawaiian | 42 | 0.4% |
| Navajo | 322 | 3.3% |
| Northern European | 49 | 0.5% |
| Norwegian | 295 | 3.0% |
| Pakistani | 49 | 0.5% |
| Polish | 99 | 1.0% |
| Portuguese | 67 | 0.7% |
| Puerto Rican | 72 | 0.7% |
| Russian | 19 | 0.2% |
| Scandinavian | 40 | 0.4% |
| Scotch-Irish | 141 | 1.5% |
| Scottish | 239 | 2.5% |
| South American | 75 | 0.8% |
| Swedish | 323 | 3.3% |
| Swiss | 32 | 0.3% |
| Thai | 3 | 0.0% |
| Tongan | 71 | 0.7% |
| Ukrainian | 70 | 0.7% |
| Venezuelan | 75 | 0.8% |
| Welsh | 157 | 1.6% | View All 39 Rows |
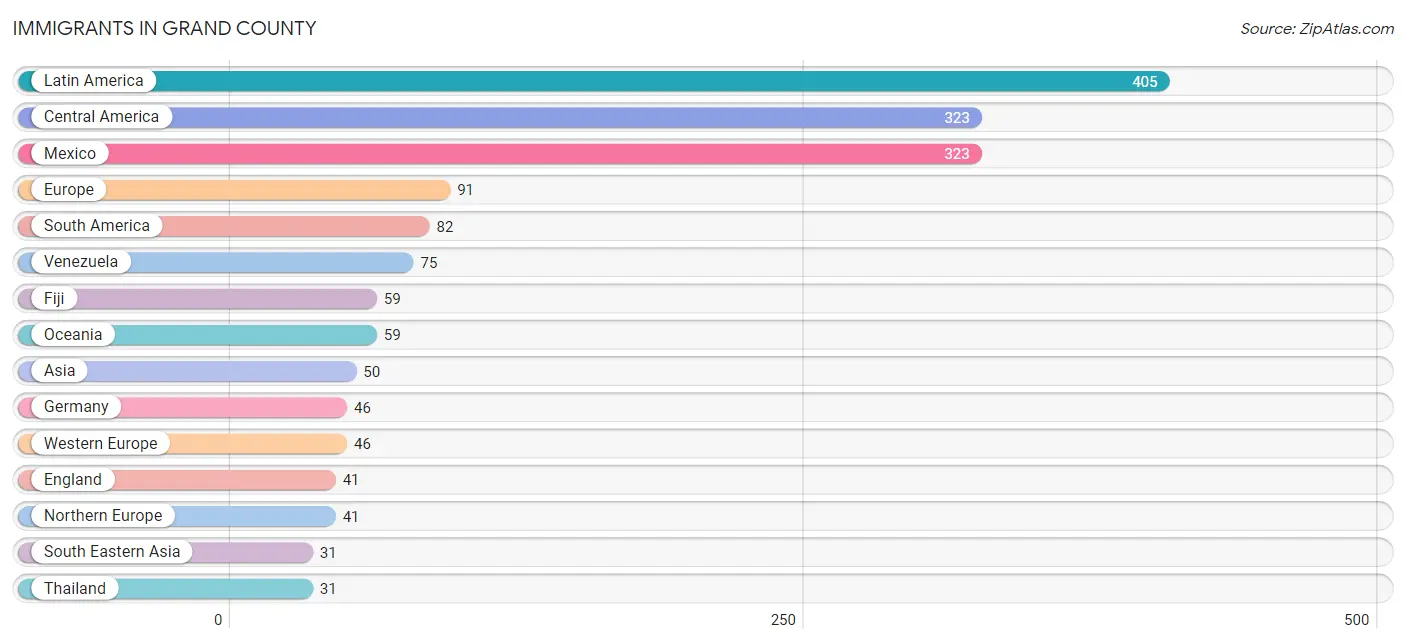
Immigrants in Grand County
The most numerous immigrant groups reported in Grand County came from Latin America (405 | 4.2%), Central America (323 | 3.3%), Mexico (323 | 3.3%), Europe (91 | 0.9%), and South America (82 | 0.9%), together accounting for 12.7% of all Grand County residents.
| Immigration Origin | # Population | % Population |
| Asia | 50 | 0.5% |
| Canada | 24 | 0.3% |
| Central America | 323 | 3.3% |
| China | 8 | 0.1% |
| Eastern Asia | 8 | 0.1% |
| Eastern Europe | 4 | 0.0% |
| England | 41 | 0.4% |
| Europe | 91 | 0.9% |
| Fiji | 59 | 0.6% |
| Germany | 46 | 0.5% |
| India | 3 | 0.0% |
| Latin America | 405 | 4.2% |
| Mexico | 323 | 3.3% |
| Northern Europe | 41 | 0.4% |
| Oceania | 59 | 0.6% |
| South America | 82 | 0.9% |
| South Central Asia | 3 | 0.0% |
| South Eastern Asia | 31 | 0.3% |
| Thailand | 31 | 0.3% |
| Turkey | 8 | 0.1% |
| Venezuela | 75 | 0.8% |
| Western Asia | 8 | 0.1% |
| Western Europe | 46 | 0.5% | View All 23 Rows |
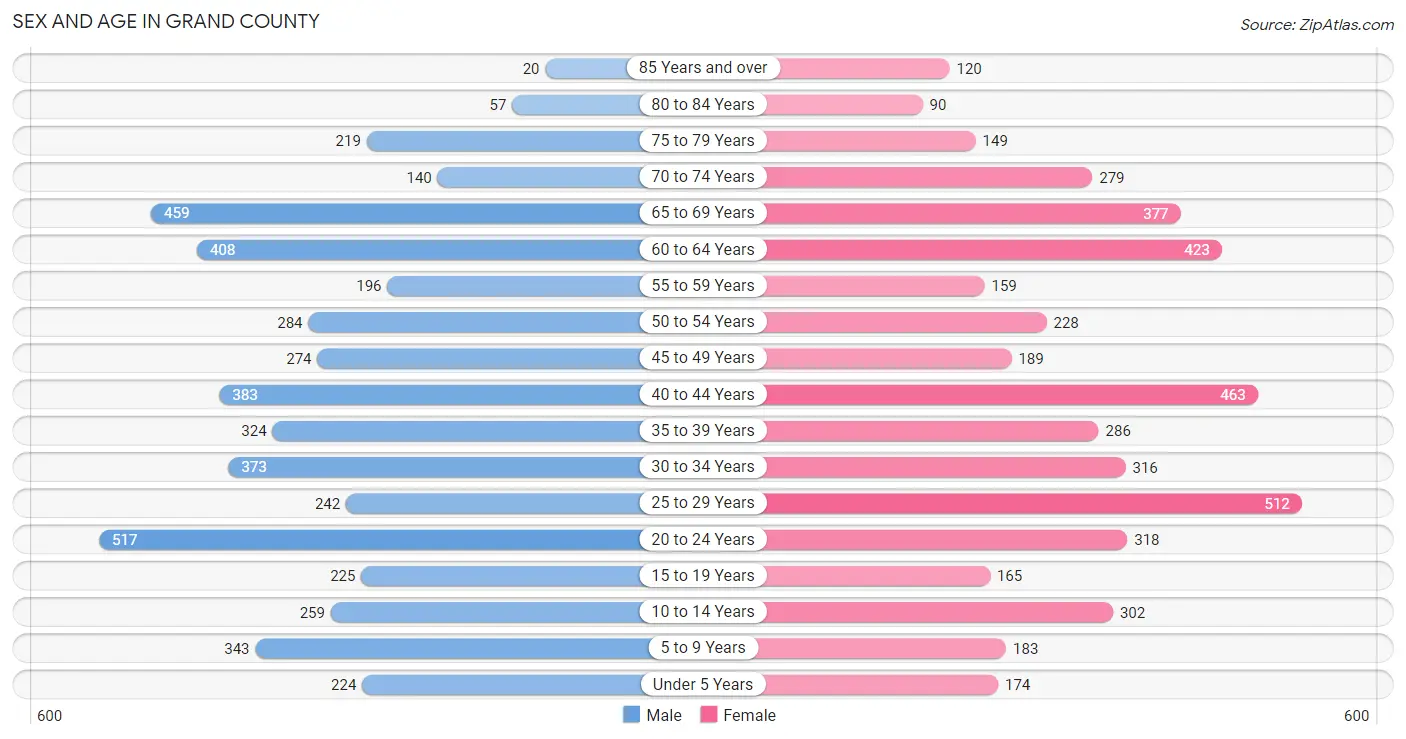
Sex and Age in Grand County
Sex and Age in Grand County
The most populous age groups in Grand County are 20 to 24 Years (517 | 10.4%) for men and 25 to 29 Years (512 | 10.8%) for women.
| Age Bracket | Male | Female |
| Under 5 Years | 224 (4.5%) | 174 (3.7%) |
| 5 to 9 Years | 343 (6.9%) | 183 (3.9%) |
| 10 to 14 Years | 259 (5.2%) | 302 (6.4%) |
| 15 to 19 Years | 225 (4.5%) | 165 (3.5%) |
| 20 to 24 Years | 517 (10.4%) | 318 (6.7%) |
| 25 to 29 Years | 242 (4.9%) | 512 (10.8%) |
| 30 to 34 Years | 373 (7.5%) | 316 (6.7%) |
| 35 to 39 Years | 324 (6.6%) | 286 (6.0%) |
| 40 to 44 Years | 383 (7.7%) | 463 (9.8%) |
| 45 to 49 Years | 274 (5.5%) | 189 (4.0%) |
| 50 to 54 Years | 284 (5.7%) | 228 (4.8%) |
| 55 to 59 Years | 196 (4.0%) | 159 (3.4%) |
| 60 to 64 Years | 408 (8.3%) | 423 (8.9%) |
| 65 to 69 Years | 459 (9.3%) | 377 (8.0%) |
| 70 to 74 Years | 140 (2.8%) | 279 (5.9%) |
| 75 to 79 Years | 219 (4.4%) | 149 (3.2%) |
| 80 to 84 Years | 57 (1.1%) | 90 (1.9%) |
| 85 Years and over | 20 (0.4%) | 120 (2.5%) |
| Total | 4,947 (100.0%) | 4,733 (100.0%) |
Families and Households in Grand County
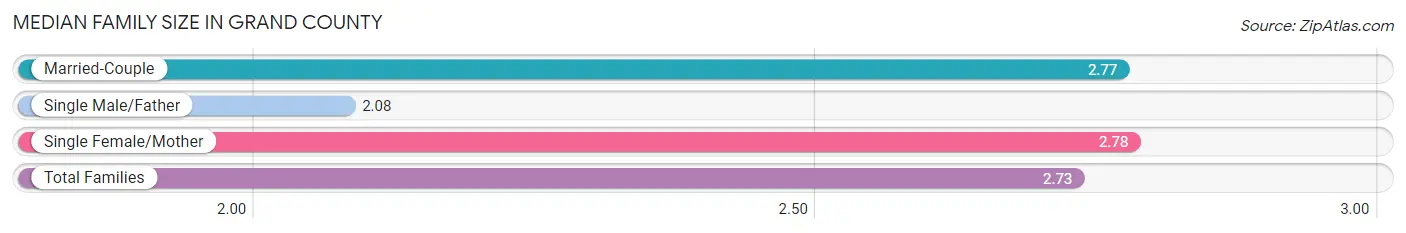
Median Family Size in Grand County
The median family size in Grand County is 2.73 persons per family, with single female/mother families (495 | 19.6%) accounting for the largest median family size of 2.78 persons per family. On the other hand, single male/father families (143 | 5.7%) represent the smallest median family size with 2.08 persons per family.
| Family Type | # Families | Family Size |
| Married-Couple | 1,883 (74.7%) | 2.77 |
| Single Male/Father | 143 (5.7%) | 2.08 |
| Single Female/Mother | 495 (19.6%) | 2.78 |
| Total Families | 2,521 (100.0%) | 2.73 |
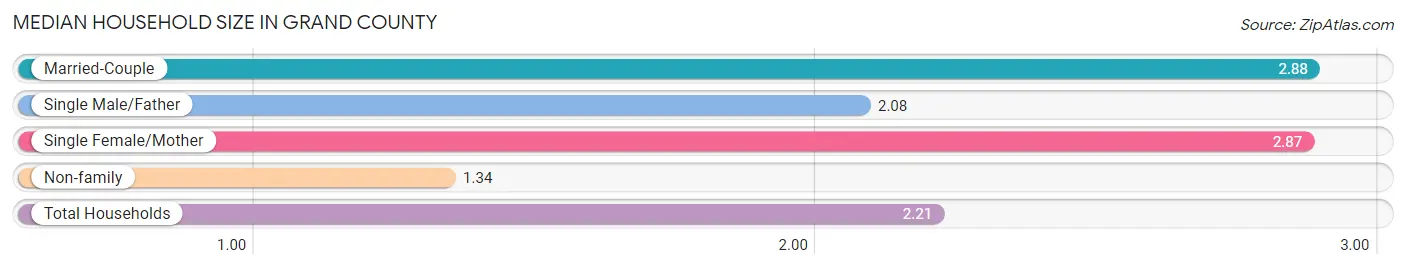
Median Household Size in Grand County
The median household size in Grand County is 2.21 persons per household, with married-couple households (1,883 | 43.4%) accounting for the largest median household size of 2.88 persons per household. non-family households (1,814 | 41.8%) represent the smallest median household size with 1.34 persons per household.
| Household Type | # Households | Household Size |
| Married-Couple | 1,883 (43.4%) | 2.88 |
| Single Male/Father | 143 (3.3%) | 2.08 |
| Single Female/Mother | 495 (11.4%) | 2.87 |
| Non-family | 1,814 (41.8%) | 1.34 |
| Total Households | 4,335 (100.0%) | 2.21 |
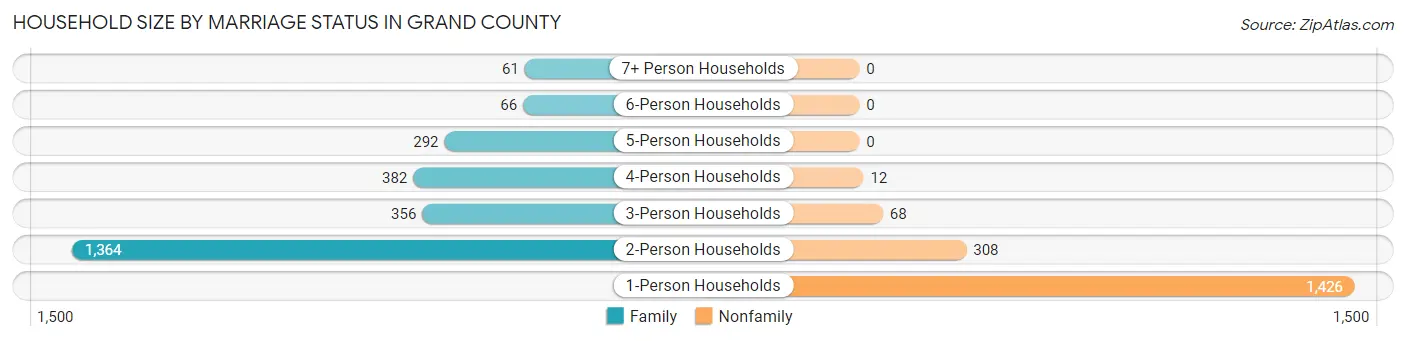
Household Size by Marriage Status in Grand County
Out of a total of 4,335 households in Grand County, 2,521 (58.2%) are family households, while 1,814 (41.8%) are nonfamily households. The most numerous type of family households are 2-person households, comprising 1,364, and the most common type of nonfamily households are 1-person households, comprising 1,426.
| Household Size | Family Households | Nonfamily Households |
| 1-Person Households | - | 1,426 (32.9%) |
| 2-Person Households | 1,364 (31.5%) | 308 (7.1%) |
| 3-Person Households | 356 (8.2%) | 68 (1.6%) |
| 4-Person Households | 382 (8.8%) | 12 (0.3%) |
| 5-Person Households | 292 (6.7%) | 0 (0.0%) |
| 6-Person Households | 66 (1.5%) | 0 (0.0%) |
| 7+ Person Households | 61 (1.4%) | 0 (0.0%) |
| Total | 2,521 (58.2%) | 1,814 (41.8%) |
Female Fertility in Grand County
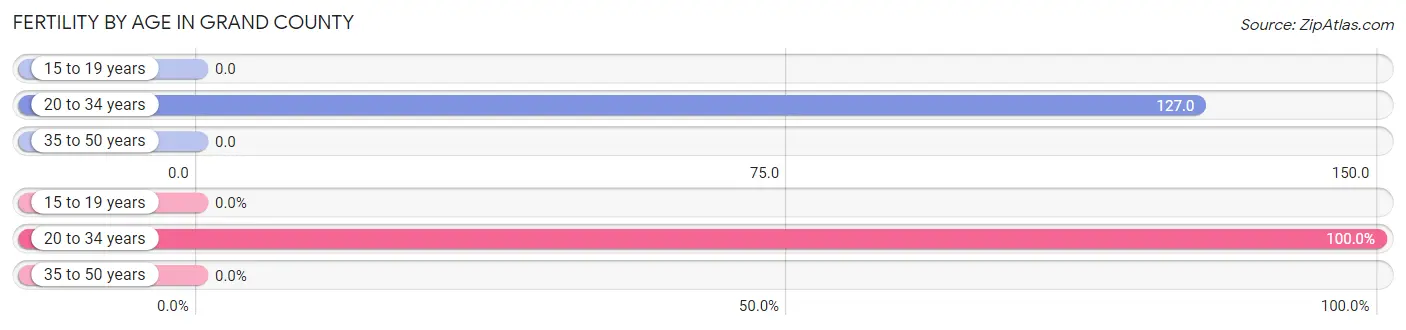
Fertility by Age in Grand County
Average fertility rate in Grand County is 64.0 births per 1,000 women. Women in the age bracket of 20 to 34 years have the highest fertility rate with 127.0 births per 1,000 women. Women in the age bracket of 20 to 34 years acount for 100.0% of all women with births.
| Age Bracket | Women with Births | Births / 1,000 Women |
| 15 to 19 years | 0 (0.0%) | 0.0 |
| 20 to 34 years | 146 (100.0%) | 127.0 |
| 35 to 50 years | 0 (0.0%) | 0.0 |
| Total | 146 (100.0%) | 64.0 |
Fertility by Age by Marriage Status in Grand County
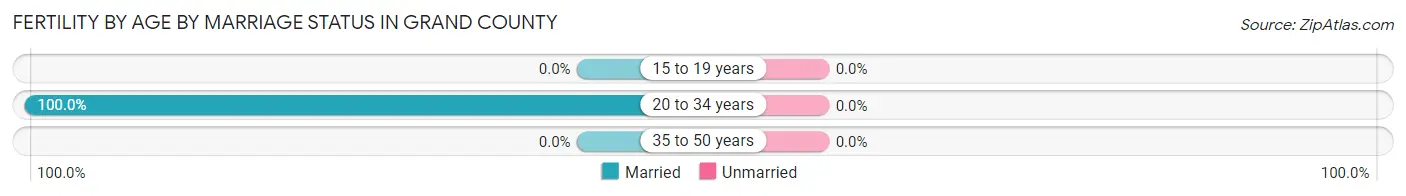
| Age Bracket | Married | Unmarried |
| 15 to 19 years | 0 (0.0%) | 0 (0.0%) |
| 20 to 34 years | 146 (100.0%) | 0 (0.0%) |
| 35 to 50 years | 0 (0.0%) | 0 (0.0%) |
| Total | 146 (100.0%) | 0 (0.0%) |
Fertility by Education in Grand County
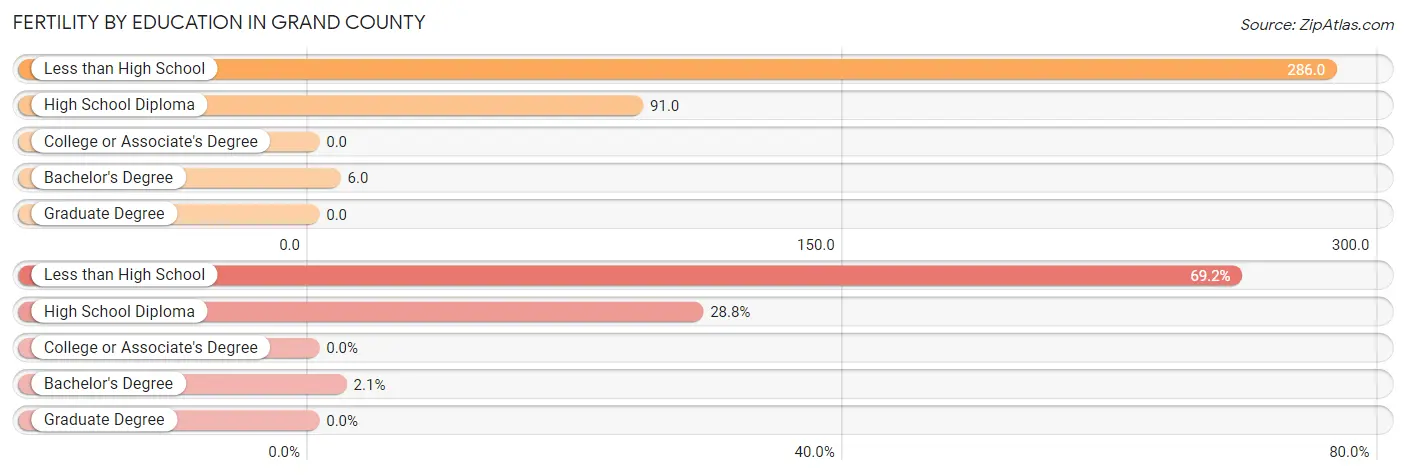
| Educational Attainment | Women with Births | Births / 1,000 Women |
| Less than High School | 101 (69.2%) | 286.0 |
| High School Diploma | 42 (28.8%) | 91.0 |
| College or Associate's Degree | 0 (0.0%) | 0.0 |
| Bachelor's Degree | 3 (2.1%) | 6.0 |
| Graduate Degree | 0 (0.0%) | 0.0 |
| Total | 146 (100.0%) | 64.0 |
Fertility by Education by Marriage Status in Grand County
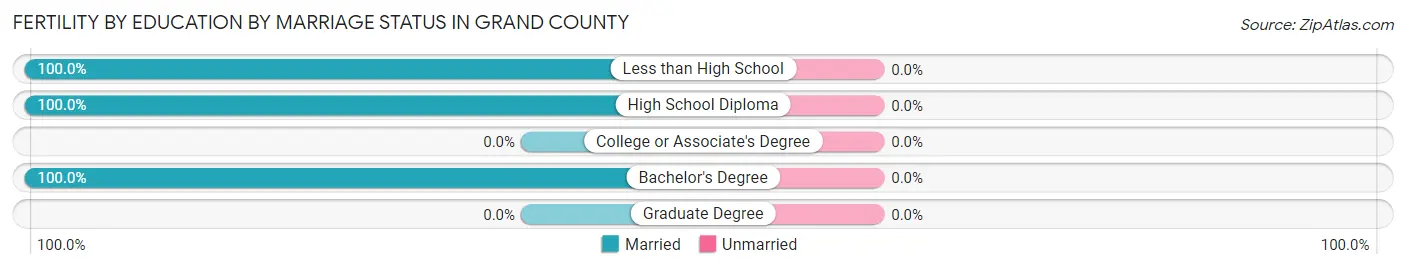
| Educational Attainment | Married | Unmarried |
| Less than High School | 101 (100.0%) | 0 (0.0%) |
| High School Diploma | 42 (100.0%) | 0 (0.0%) |
| College or Associate's Degree | 0 (0.0%) | 0 (0.0%) |
| Bachelor's Degree | 3 (100.0%) | 0 (0.0%) |
| Graduate Degree | 0 (0.0%) | 0 (0.0%) |
| Total | 146 (100.0%) | 0 (0.0%) |
Income in Grand County
Income Overview in Grand County
Per Capita Income in Grand County is $37,510, while median incomes of families and households are $75,333 and $59,171 respectively.
| Characteristic | Number | Measure |
| Per Capita Income | 9,680 | $37,510 |
| Median Family Income | 2,521 | $75,333 |
| Mean Family Income | 2,521 | $98,202 |
| Median Household Income | 4,335 | $59,171 |
| Mean Household Income | 4,335 | $80,818 |
| Income Deficit | 2,521 | $0 |
| Wage / Income Gap (%) | 9,680 | 31.69% |
| Wage / Income Gap ($) | 9,680 | 68.31¢ per $1 |
| Gini / Inequality Index | 9,680 | 0.46 |
Earnings by Sex in Grand County
Average Earnings in Grand County are $33,342, $40,981 for men and $27,995 for women, a difference of 31.7%.
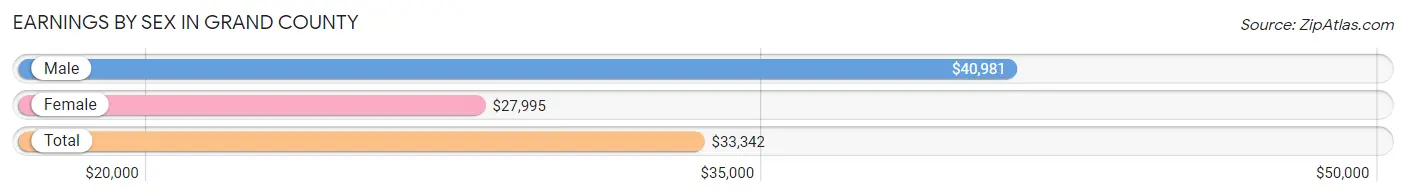
| Sex | Number | Average Earnings |
| Male | 3,296 (52.9%) | $40,981 |
| Female | 2,929 (47.0%) | $27,995 |
| Total | 6,225 (100.0%) | $33,342 |
Earnings by Sex by Income Bracket in Grand County
The most common earnings brackets in Grand County are $40,000 to $44,999 for men (554 | 16.8%) and $5,000 to $7,499 for women (336 | 11.5%).
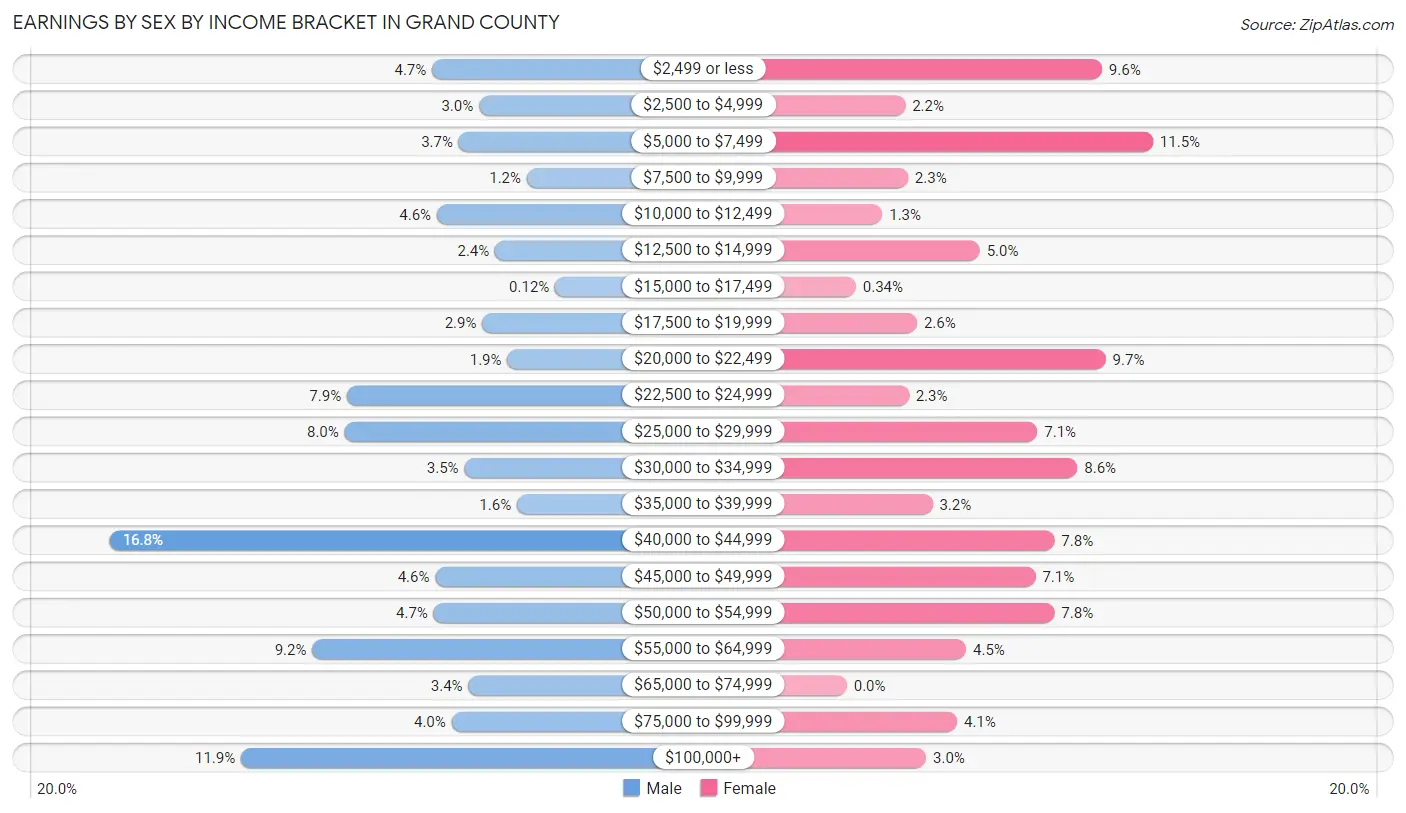
| Income | Male | Female |
| $2,499 or less | 156 (4.7%) | 280 (9.6%) |
| $2,500 to $4,999 | 98 (3.0%) | 64 (2.2%) |
| $5,000 to $7,499 | 123 (3.7%) | 336 (11.5%) |
| $7,500 to $9,999 | 39 (1.2%) | 67 (2.3%) |
| $10,000 to $12,499 | 150 (4.5%) | 39 (1.3%) |
| $12,500 to $14,999 | 78 (2.4%) | 146 (5.0%) |
| $15,000 to $17,499 | 4 (0.1%) | 10 (0.3%) |
| $17,500 to $19,999 | 94 (2.9%) | 77 (2.6%) |
| $20,000 to $22,499 | 63 (1.9%) | 284 (9.7%) |
| $22,500 to $24,999 | 261 (7.9%) | 68 (2.3%) |
| $25,000 to $29,999 | 264 (8.0%) | 209 (7.1%) |
| $30,000 to $34,999 | 116 (3.5%) | 253 (8.6%) |
| $35,000 to $39,999 | 51 (1.5%) | 94 (3.2%) |
| $40,000 to $44,999 | 554 (16.8%) | 228 (7.8%) |
| $45,000 to $49,999 | 152 (4.6%) | 207 (7.1%) |
| $50,000 to $54,999 | 154 (4.7%) | 228 (7.8%) |
| $55,000 to $64,999 | 304 (9.2%) | 131 (4.5%) |
| $65,000 to $74,999 | 111 (3.4%) | 0 (0.0%) |
| $75,000 to $99,999 | 132 (4.0%) | 121 (4.1%) |
| $100,000+ | 392 (11.9%) | 87 (3.0%) |
| Total | 3,296 (100.0%) | 2,929 (100.0%) |
Earnings by Sex by Educational Attainment in Grand County
Average earnings in Grand County are $42,596 for men and $31,184 for women, a difference of 26.8%. Men with an educational attainment of less than high school enjoy the highest average annual earnings of $60,890, while those with bachelor's degree education earn the least with $40,145. Women with an educational attainment of graduate degree earn the most with the average annual earnings of $45,270, while those with high school diploma education have the smallest earnings of $21,917.
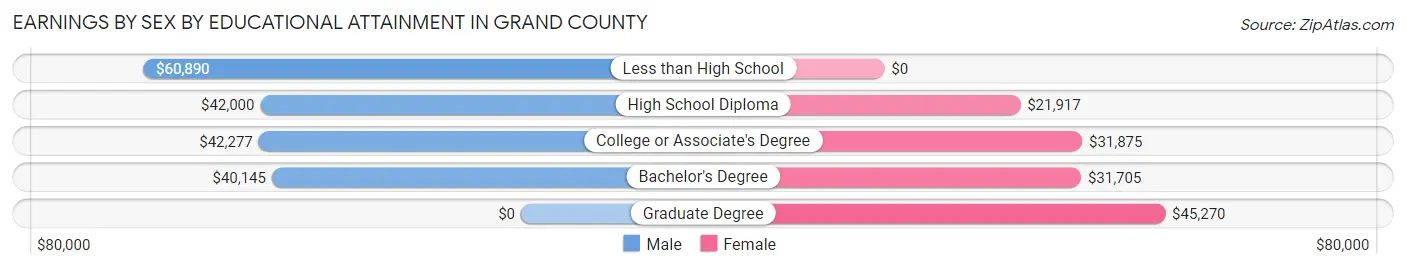
| Educational Attainment | Male Income | Female Income |
| Less than High School | $60,890 | $0 |
| High School Diploma | $42,000 | $21,917 |
| College or Associate's Degree | $42,277 | $31,875 |
| Bachelor's Degree | $40,145 | $31,705 |
| Graduate Degree | - | - |
| Total | $42,596 | $31,184 |
Family Income in Grand County
Family Income Brackets in Grand County
According to the Grand County family income data, there are 633 families falling into the $50,000 to $74,999 income range, which is the most common income bracket and makes up 25.1% of all families. Conversely, the $10,000 to $14,999 income bracket is the least frequent group with only 53 families (2.1%) belonging to this category.
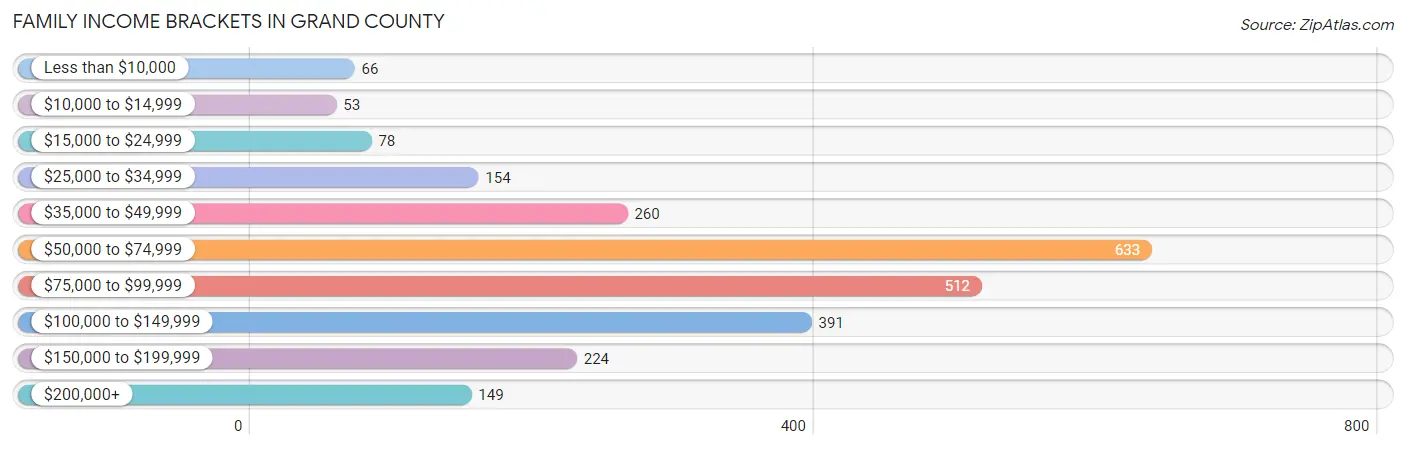
| Income Bracket | # Families | % Families |
| Less than $10,000 | 66 | 2.6% |
| $10,000 to $14,999 | 53 | 2.1% |
| $15,000 to $24,999 | 78 | 3.1% |
| $25,000 to $34,999 | 154 | 6.1% |
| $35,000 to $49,999 | 260 | 10.3% |
| $50,000 to $74,999 | 633 | 25.1% |
| $75,000 to $99,999 | 512 | 20.3% |
| $100,000 to $149,999 | 391 | 15.5% |
| $150,000 to $199,999 | 224 | 8.9% |
| $200,000+ | 149 | 5.9% |
Family Income by Famaliy Size in Grand County
3-person families (360 | 14.3%) account for the highest median family income in Grand County with $91,630 per family, while 2-person families (1,419 | 56.3%) have the highest median income of $37,336 per family member.
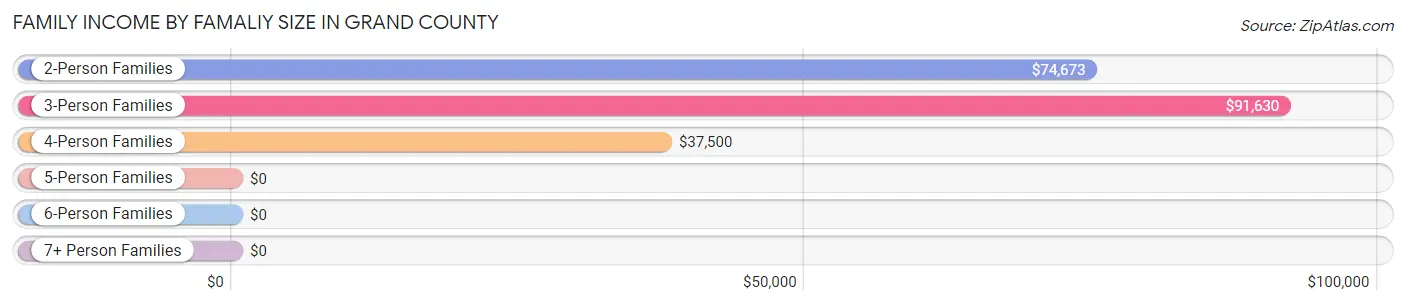
| Income Bracket | # Families | Median Income |
| 2-Person Families | 1,419 (56.3%) | $74,673 |
| 3-Person Families | 360 (14.3%) | $91,630 |
| 4-Person Families | 350 (13.9%) | $37,500 |
| 5-Person Families | 282 (11.2%) | $0 |
| 6-Person Families | 66 (2.6%) | $0 |
| 7+ Person Families | 44 (1.8%) | $0 |
| Total | 2,521 (100.0%) | $75,333 |
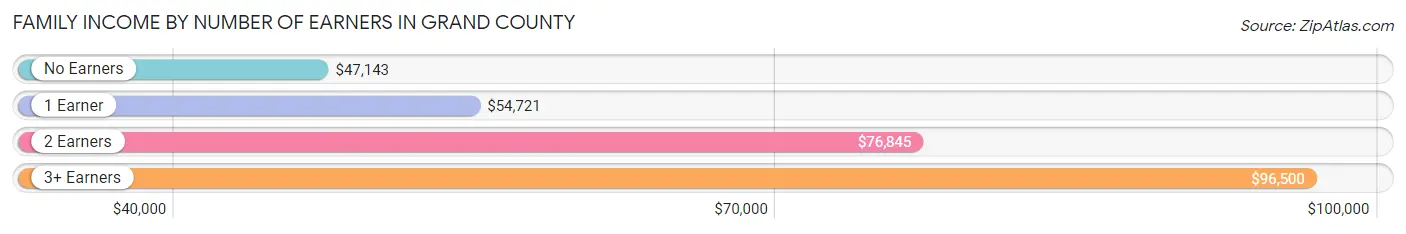
Family Income by Number of Earners in Grand County
The median family income in Grand County is $75,333, with families comprising 3+ earners (316) having the highest median family income of $96,500, while families with no earners (212) have the lowest median family income of $47,143, accounting for 12.5% and 8.4% of families, respectively.
| Number of Earners | # Families | Median Income |
| No Earners | 212 (8.4%) | $47,143 |
| 1 Earner | 685 (27.2%) | $54,721 |
| 2 Earners | 1,308 (51.9%) | $76,845 |
| 3+ Earners | 316 (12.5%) | $96,500 |
| Total | 2,521 (100.0%) | $75,333 |
Household Income in Grand County
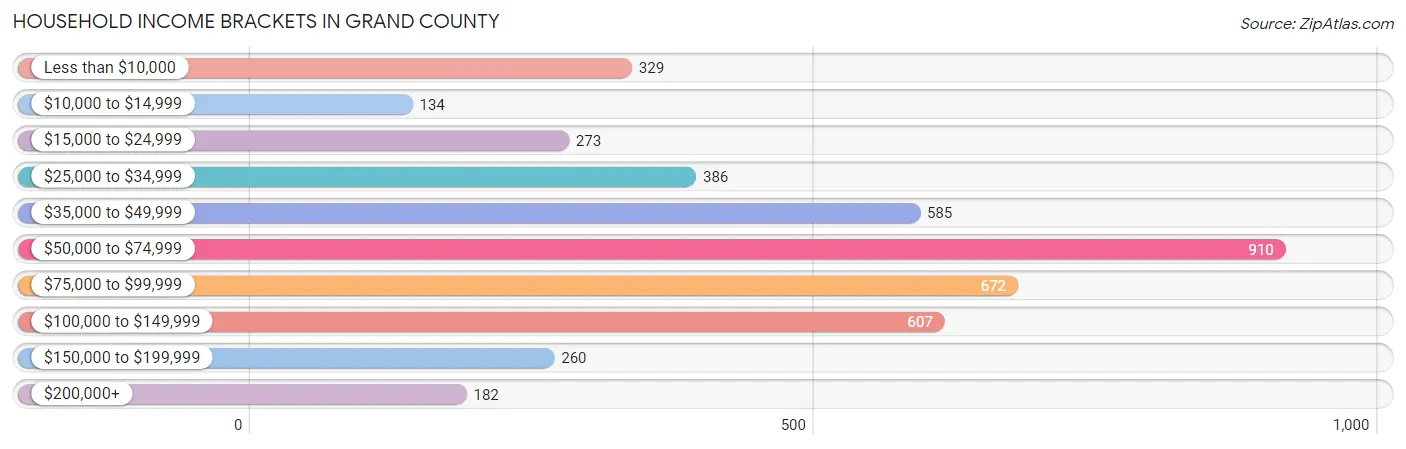
Household Income Brackets in Grand County
With 910 households falling in the category, the $50,000 to $74,999 income range is the most frequent in Grand County, accounting for 21.0% of all households. In contrast, only 134 households (3.1%) fall into the $10,000 to $14,999 income bracket, making it the least populous group.
| Income Bracket | # Households | % Households |
| Less than $10,000 | 329 | 7.6% |
| $10,000 to $14,999 | 134 | 3.1% |
| $15,000 to $24,999 | 273 | 6.3% |
| $25,000 to $34,999 | 386 | 8.9% |
| $35,000 to $49,999 | 585 | 13.5% |
| $50,000 to $74,999 | 910 | 21.0% |
| $75,000 to $99,999 | 672 | 15.5% |
| $100,000 to $149,999 | 607 | 14.0% |
| $150,000 to $199,999 | 260 | 6.0% |
| $200,000+ | 182 | 4.2% |
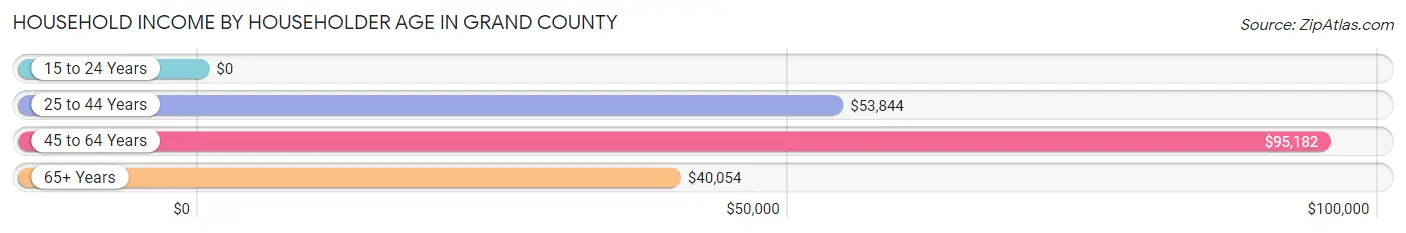
Household Income by Householder Age in Grand County
The median household income in Grand County is $59,171, with the highest median household income of $95,182 found in the 45 to 64 years age bracket for the primary householder. A total of 1,404 households (32.4%) fall into this category. Meanwhile, the 15 to 24 years age bracket for the primary householder has the lowest median household income of $0, with 175 households (4.0%) in this group.
| Income Bracket | # Households | Median Income |
| 15 to 24 Years | 175 (4.0%) | $0 |
| 25 to 44 Years | 1,539 (35.5%) | $53,844 |
| 45 to 64 Years | 1,404 (32.4%) | $95,182 |
| 65+ Years | 1,217 (28.1%) | $40,054 |
| Total | 4,335 (100.0%) | $59,171 |
Poverty in Grand County
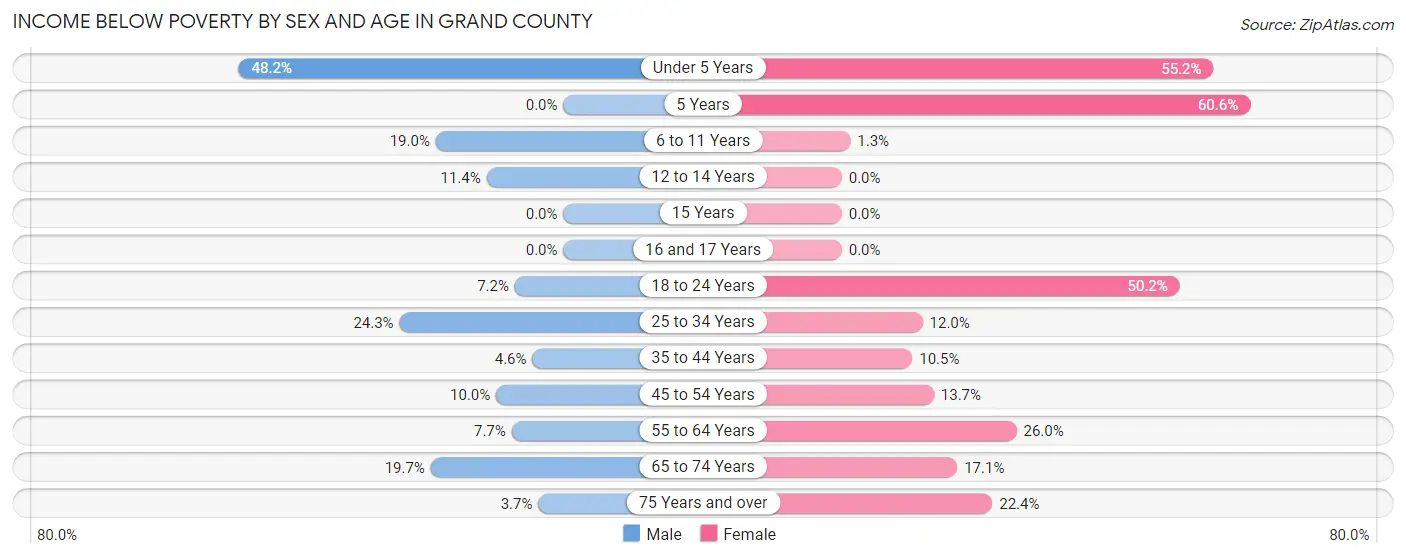
Income Below Poverty by Sex and Age in Grand County
With 13.4% poverty level for males and 18.1% for females among the residents of Grand County, under 5 year old males and 5 year old females are the most vulnerable to poverty, with 108 males (48.2%) and 20 females (60.6%) in their respective age groups living below the poverty level.
| Age Bracket | Male | Female |
| Under 5 Years | 108 (48.2%) | 96 (55.2%) |
| 5 Years | 0 (0.0%) | 20 (60.6%) |
| 6 to 11 Years | 83 (19.0%) | 3 (1.3%) |
| 12 to 14 Years | 13 (11.4%) | 0 (0.0%) |
| 15 Years | 0 (0.0%) | 0 (0.0%) |
| 16 and 17 Years | 0 (0.0%) | 0 (0.0%) |
| 18 to 24 Years | 44 (7.2%) | 157 (50.2%) |
| 25 to 34 Years | 148 (24.3%) | 99 (12.0%) |
| 35 to 44 Years | 32 (4.6%) | 78 (10.5%) |
| 45 to 54 Years | 55 (10.0%) | 57 (13.7%) |
| 55 to 64 Years | 46 (7.7%) | 151 (26.0%) |
| 65 to 74 Years | 118 (19.7%) | 108 (17.1%) |
| 75 Years and over | 11 (3.7%) | 78 (22.4%) |
| Total | 658 (13.4%) | 847 (18.1%) |
Income Above Poverty by Sex and Age in Grand County
According to the poverty statistics in Grand County, males aged 5 years and females aged 12 to 14 years are the age groups that are most secure financially, with 100.0% of males and 100.0% of females in these age groups living above the poverty line.
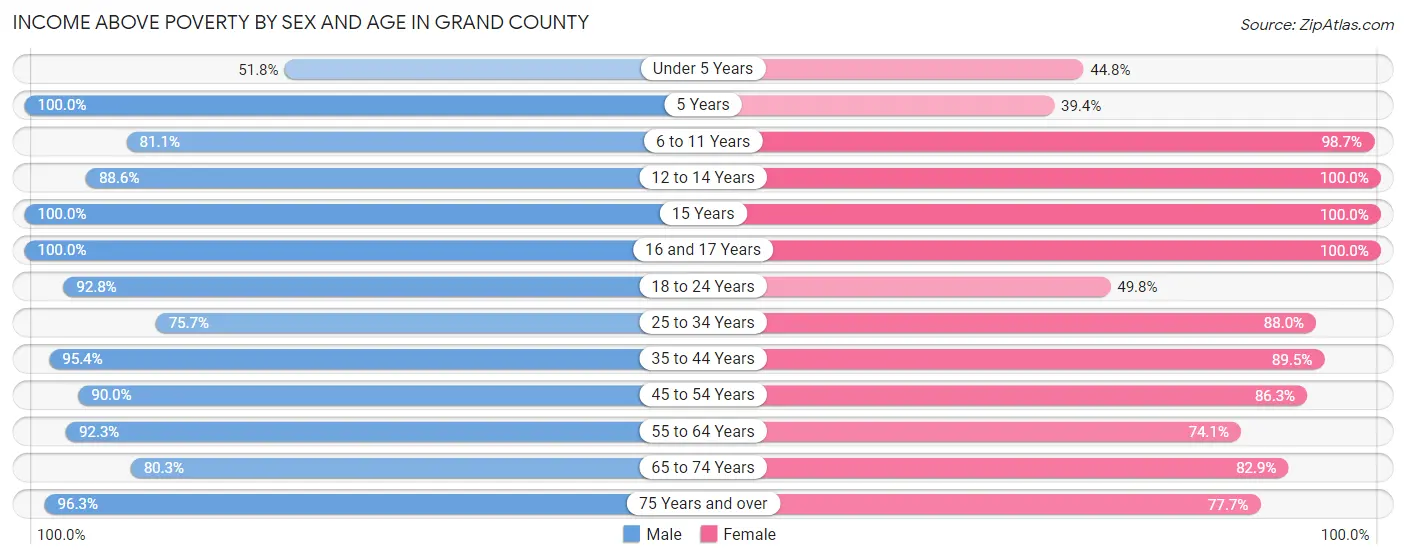
| Age Bracket | Male | Female |
| Under 5 Years | 116 (51.8%) | 78 (44.8%) |
| 5 Years | 50 (100.0%) | 13 (39.4%) |
| 6 to 11 Years | 355 (81.0%) | 233 (98.7%) |
| 12 to 14 Years | 101 (88.6%) | 216 (100.0%) |
| 15 Years | 23 (100.0%) | 59 (100.0%) |
| 16 and 17 Years | 109 (100.0%) | 103 (100.0%) |
| 18 to 24 Years | 566 (92.8%) | 156 (49.8%) |
| 25 to 34 Years | 460 (75.7%) | 726 (88.0%) |
| 35 to 44 Years | 664 (95.4%) | 667 (89.5%) |
| 45 to 54 Years | 496 (90.0%) | 360 (86.3%) |
| 55 to 64 Years | 553 (92.3%) | 431 (74.1%) |
| 65 to 74 Years | 481 (80.3%) | 522 (82.9%) |
| 75 Years and over | 285 (96.3%) | 271 (77.6%) |
| Total | 4,259 (86.6%) | 3,835 (81.9%) |
Income Below Poverty Among Married-Couple Families in Grand County
The poverty statistics for married-couple families in Grand County show that 7.7% or 146 of the total 1,883 families live below the poverty line. Families with 3 or 4 children have the highest poverty rate of 17.6%, comprising of 42 families. On the other hand, families with no children have the lowest poverty rate of 0.0%, which includes 0 families.
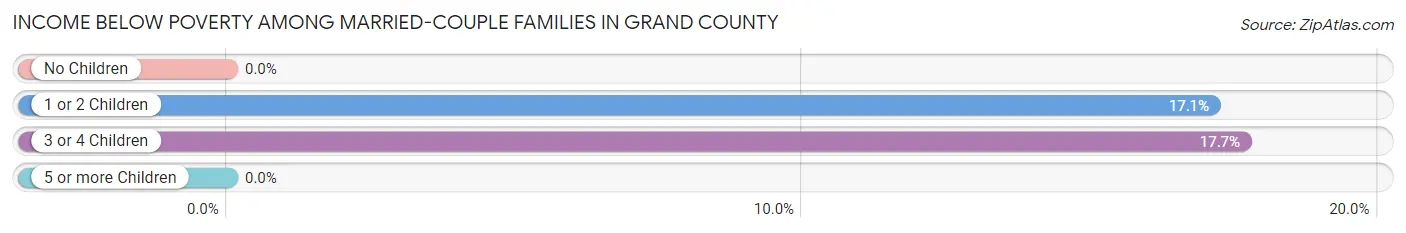
| Children | Above Poverty | Below Poverty |
| No Children | 1,016 (100.0%) | 0 (0.0%) |
| 1 or 2 Children | 504 (82.9%) | 104 (17.1%) |
| 3 or 4 Children | 196 (82.4%) | 42 (17.6%) |
| 5 or more Children | 21 (100.0%) | 0 (0.0%) |
| Total | 1,737 (92.2%) | 146 (7.7%) |
Income Below Poverty Among Single-Parent Households in Grand County
According to the poverty data in Grand County, 3.5% or 5 single-father households and 16.2% or 80 single-mother households are living below the poverty line. Among single-father households, those with 1 or 2 children have the highest poverty rate, with 5 households (19.2%) experiencing poverty. Likewise, among single-mother households, those with no children have the highest poverty rate, with 40 households (26.0%) falling below the poverty line.
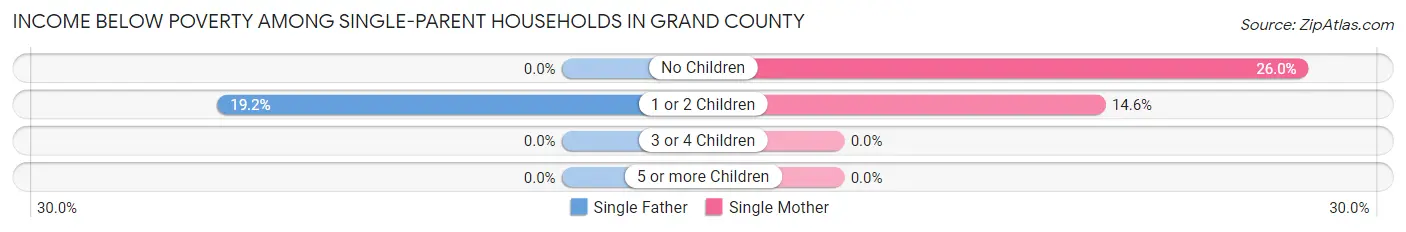
| Children | Single Father | Single Mother |
| No Children | 0 (0.0%) | 40 (26.0%) |
| 1 or 2 Children | 5 (19.2%) | 40 (14.6%) |
| 3 or 4 Children | 0 (0.0%) | 0 (0.0%) |
| 5 or more Children | 0 (0.0%) | 0 (0.0%) |
| Total | 5 (3.5%) | 80 (16.2%) |
Income Below Poverty Among Married-Couple vs Single-Parent Households in Grand County
The poverty data for Grand County shows that 146 of the married-couple family households (7.7%) and 85 of the single-parent households (13.3%) are living below the poverty level. Within the married-couple family households, those with 3 or 4 children have the highest poverty rate, with 42 households (17.6%) falling below the poverty line. Among the single-parent households, those with 1 or 2 children have the highest poverty rate, with 45 household (15.0%) living below poverty.
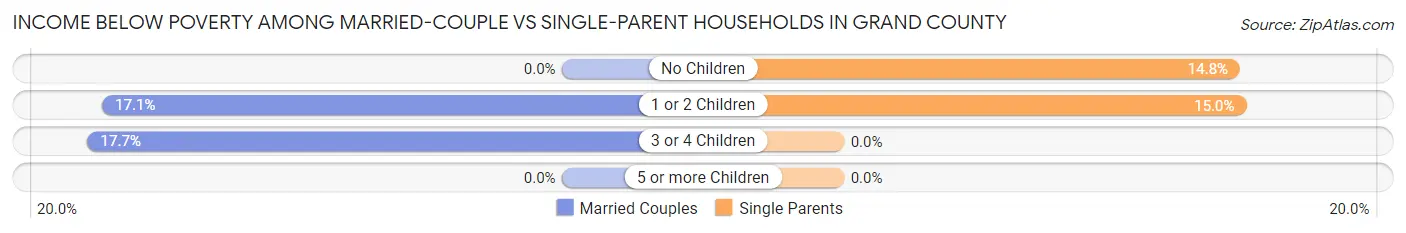
| Children | Married-Couple Families | Single-Parent Households |
| No Children | 0 (0.0%) | 40 (14.8%) |
| 1 or 2 Children | 104 (17.1%) | 45 (15.0%) |
| 3 or 4 Children | 42 (17.6%) | 0 (0.0%) |
| 5 or more Children | 0 (0.0%) | 0 (0.0%) |
| Total | 146 (7.7%) | 85 (13.3%) |
Employment Characteristics in Grand County
Employment by Class of Employer in Grand County
Among the 5,480 employed individuals in Grand County, private company employees (3,697 | 67.5%), self-employed (incorporated) (413 | 7.5%), and self-employed (not incorporated) (409 | 7.5%) make up the most common classes of employment.
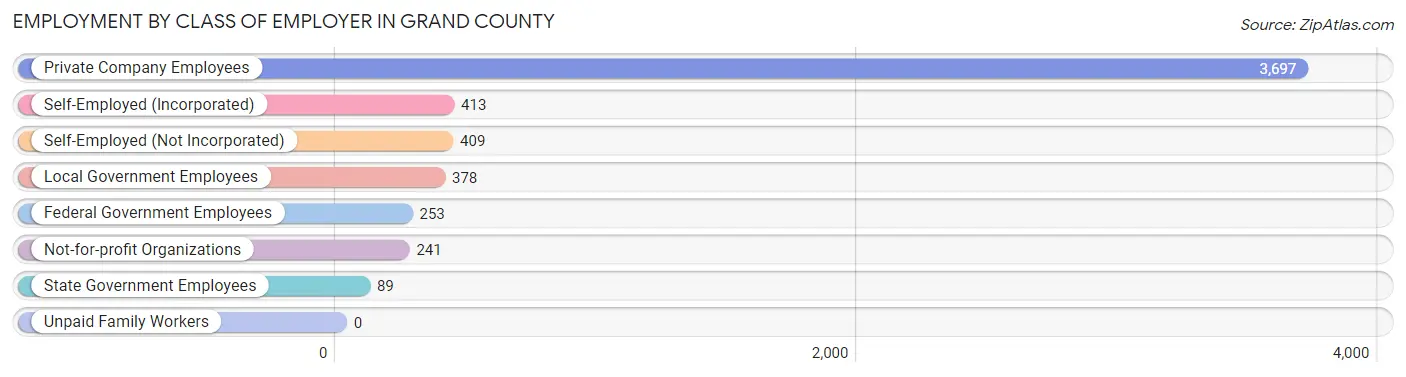
| Employer Class | # Employees | % Employees |
| Private Company Employees | 3,697 | 67.5% |
| Self-Employed (Incorporated) | 413 | 7.5% |
| Self-Employed (Not Incorporated) | 409 | 7.5% |
| Not-for-profit Organizations | 241 | 4.4% |
| Local Government Employees | 378 | 6.9% |
| State Government Employees | 89 | 1.6% |
| Federal Government Employees | 253 | 4.6% |
| Unpaid Family Workers | 0 | 0.0% |
| Total | 5,480 | 100.0% |
Employment Status by Age in Grand County
According to the labor force statistics for Grand County, out of the total population over 16 years of age (8,113), 71.0% or 5,760 individuals are in the labor force, with 1.2% or 69 of them unemployed. The age group with the highest labor force participation rate is 20 to 24 years, with 99.6% or 832 individuals in the labor force. Within the labor force, the 75 years and over age range has the highest percentage of unemployed individuals, with 46.8% or 58 of them being unemployed.
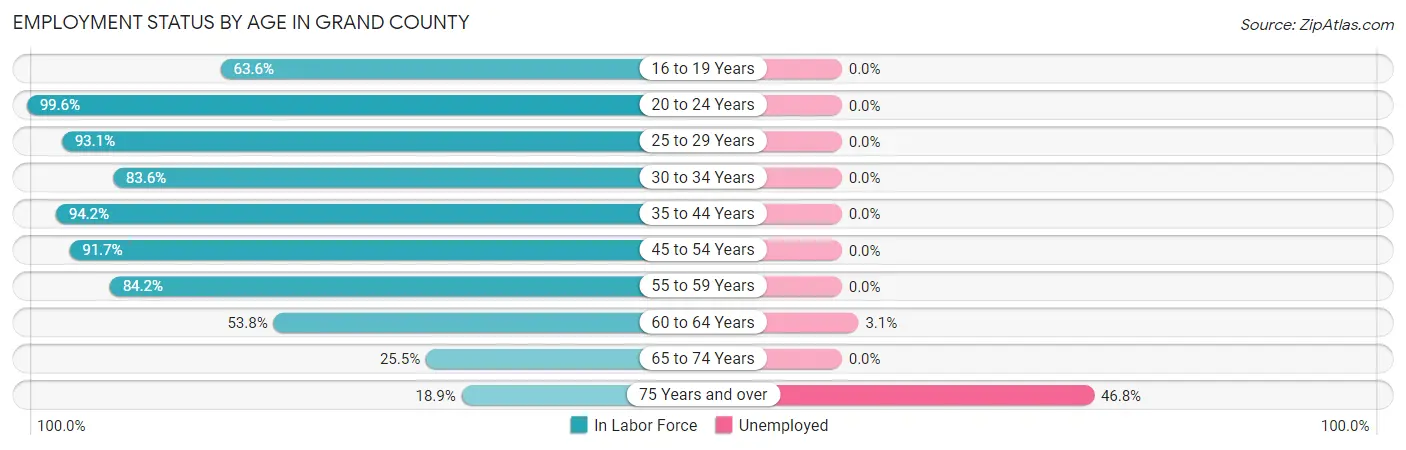
| Age Bracket | In Labor Force | Unemployed |
| 16 to 19 Years | 196 (63.6%) | 0 (0.0%) |
| 20 to 24 Years | 832 (99.6%) | 0 (0.0%) |
| 25 to 29 Years | 702 (93.1%) | 0 (0.0%) |
| 30 to 34 Years | 576 (83.6%) | 0 (0.0%) |
| 35 to 44 Years | 1,372 (94.2%) | 0 (0.0%) |
| 45 to 54 Years | 894 (91.7%) | 0 (0.0%) |
| 55 to 59 Years | 299 (84.2%) | 0 (0.0%) |
| 60 to 64 Years | 447 (53.8%) | 14 (3.1%) |
| 65 to 74 Years | 320 (25.5%) | 0 (0.0%) |
| 75 Years and over | 124 (18.9%) | 58 (46.8%) |
| Total | 5,760 (71.0%) | 69 (1.2%) |
Employment Status by Educational Attainment in Grand County
According to labor force statistics for Grand County, 84.8% of individuals (4,291) out of the total population between 25 and 64 years of age (5,060) are in the labor force, with 0.3% or 13 of them being unemployed. The group with the highest labor force participation rate are those with the educational attainment of high school diploma, with 92.1% or 998 individuals in the labor force. Within the labor force, individuals with bachelor's degree or higher education have the highest percentage of unemployment, with 1.0% or 14 of them being unemployed.
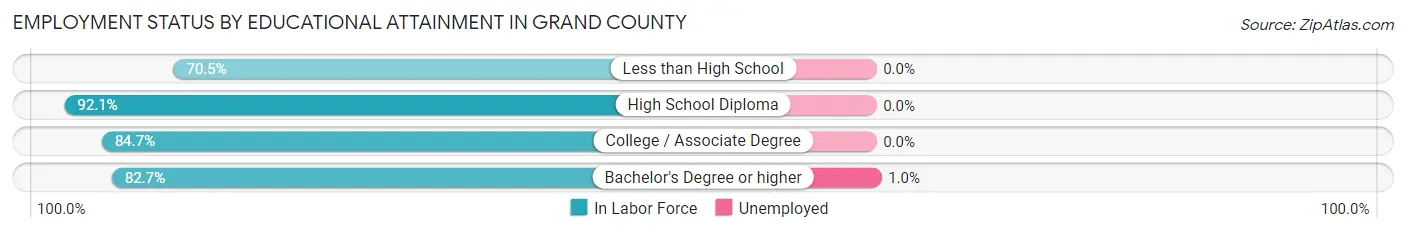
| Educational Attainment | In Labor Force | Unemployed |
| Less than High School | 208 (70.5%) | 0 (0.0%) |
| High School Diploma | 998 (92.1%) | 0 (0.0%) |
| College / Associate Degree | 1,694 (84.7%) | 0 (0.0%) |
| Bachelor's Degree or higher | 1,390 (82.7%) | 17 (1.0%) |
| Total | 4,291 (84.8%) | 15 (0.3%) |
Employment Occupations by Sex in Grand County
Management, Business, Science and Arts Occupations
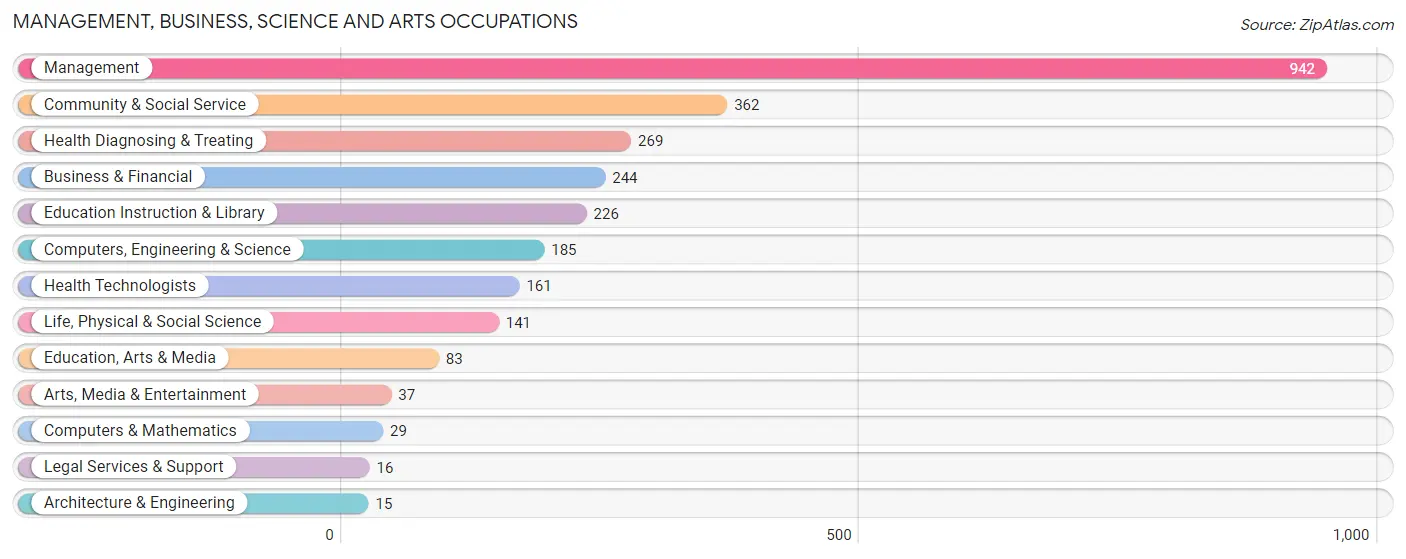
The most common Management, Business, Science and Arts occupations in Grand County are Management (942 | 16.6%), Community & Social Service (362 | 6.4%), Health Diagnosing & Treating (269 | 4.7%), Business & Financial (244 | 4.3%), and Education Instruction & Library (226 | 4.0%).
Management, Business, Science and Arts Occupations by Sex
Within the Management, Business, Science and Arts occupations in Grand County, the most male-oriented occupations are Architecture & Engineering (100.0%), Computers, Engineering & Science (64.3%), and Life, Physical & Social Science (61.7%), while the most female-oriented occupations are Legal Services & Support (100.0%), Education Instruction & Library (80.5%), and Community & Social Service (72.1%).
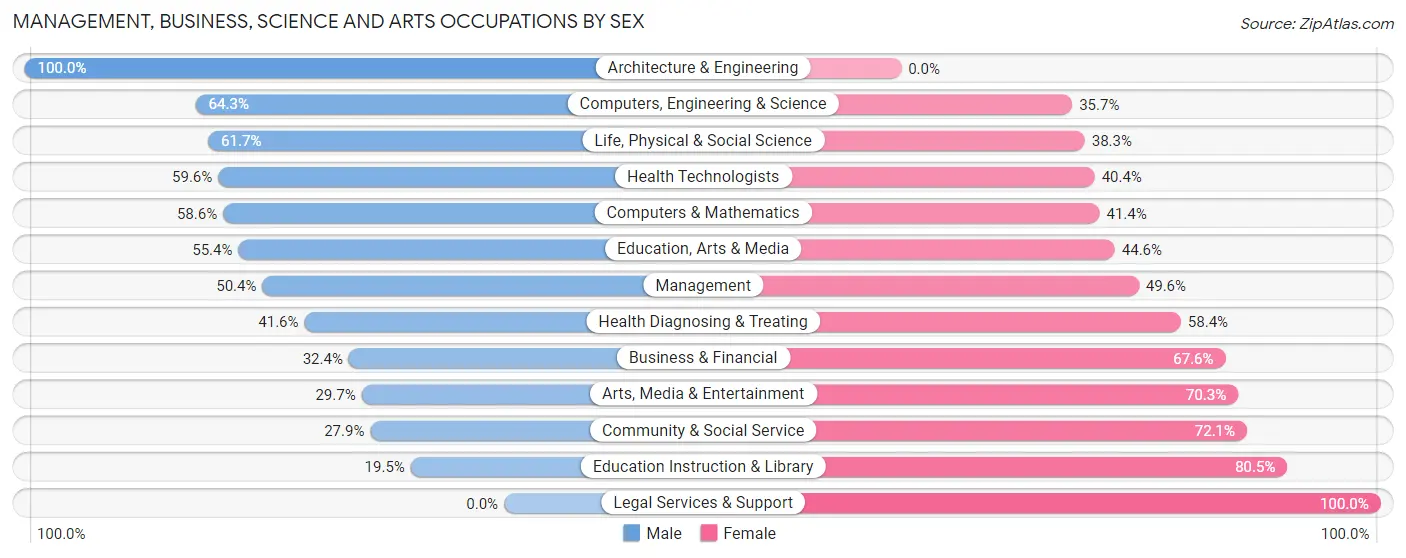
| Occupation | Male | Female |
| Management | 475 (50.4%) | 467 (49.6%) |
| Business & Financial | 79 (32.4%) | 165 (67.6%) |
| Computers, Engineering & Science | 119 (64.3%) | 66 (35.7%) |
| Computers & Mathematics | 17 (58.6%) | 12 (41.4%) |
| Architecture & Engineering | 15 (100.0%) | 0 (0.0%) |
| Life, Physical & Social Science | 87 (61.7%) | 54 (38.3%) |
| Community & Social Service | 101 (27.9%) | 261 (72.1%) |
| Education, Arts & Media | 46 (55.4%) | 37 (44.6%) |
| Legal Services & Support | 0 (0.0%) | 16 (100.0%) |
| Education Instruction & Library | 44 (19.5%) | 182 (80.5%) |
| Arts, Media & Entertainment | 11 (29.7%) | 26 (70.3%) |
| Health Diagnosing & Treating | 112 (41.6%) | 157 (58.4%) |
| Health Technologists | 96 (59.6%) | 65 (40.4%) |
| Total (Category) | 886 (44.3%) | 1,116 (55.7%) |
| Total (Overall) | 3,059 (53.8%) | 2,631 (46.2%) |
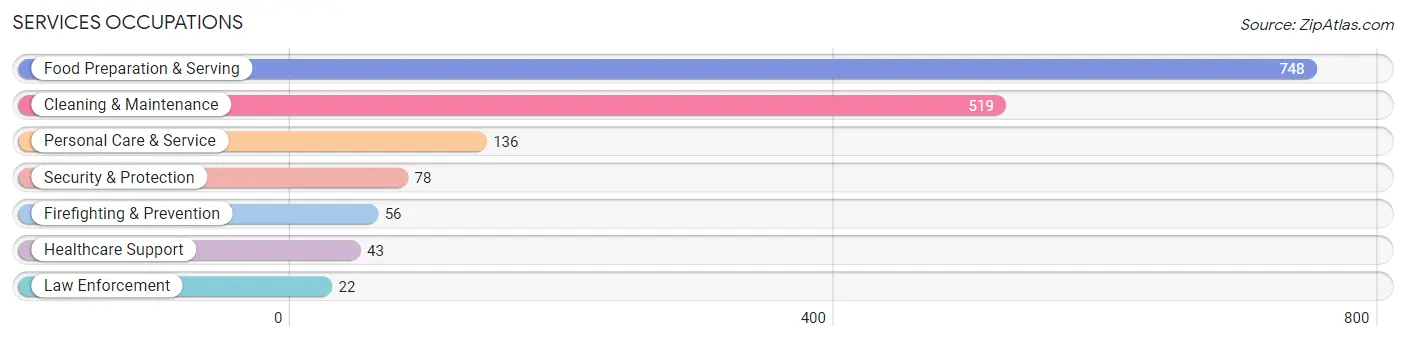
Services Occupations
The most common Services occupations in Grand County are Food Preparation & Serving (748 | 13.2%), Cleaning & Maintenance (519 | 9.1%), Personal Care & Service (136 | 2.4%), Security & Protection (78 | 1.4%), and Firefighting & Prevention (56 | 1.0%).
Services Occupations by Sex
Within the Services occupations in Grand County, the most male-oriented occupations are Food Preparation & Serving (69.0%), Personal Care & Service (59.6%), and Cleaning & Maintenance (57.2%), while the most female-oriented occupations are Healthcare Support (100.0%), Law Enforcement (100.0%), and Security & Protection (74.4%).
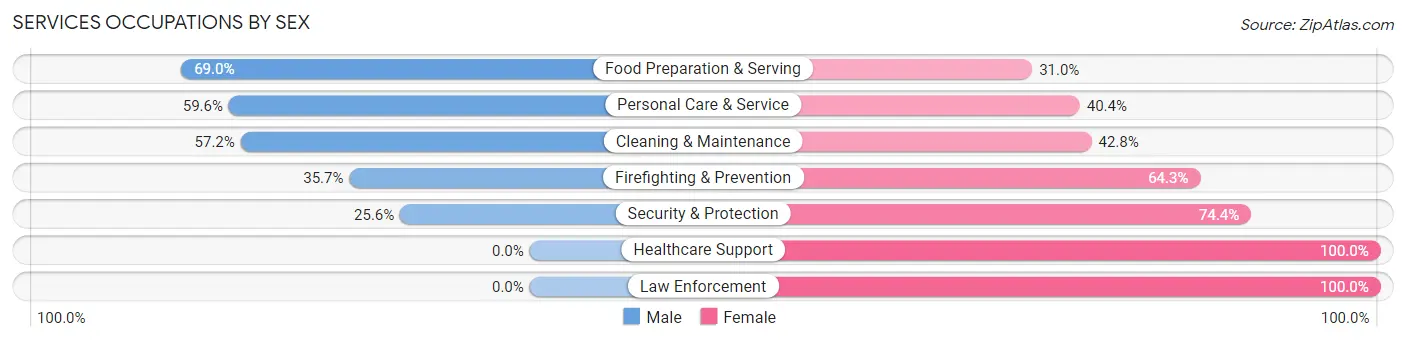
| Occupation | Male | Female |
| Healthcare Support | 0 (0.0%) | 43 (100.0%) |
| Security & Protection | 20 (25.6%) | 58 (74.4%) |
| Firefighting & Prevention | 20 (35.7%) | 36 (64.3%) |
| Law Enforcement | 0 (0.0%) | 22 (100.0%) |
| Food Preparation & Serving | 516 (69.0%) | 232 (31.0%) |
| Cleaning & Maintenance | 297 (57.2%) | 222 (42.8%) |
| Personal Care & Service | 81 (59.6%) | 55 (40.4%) |
| Total (Category) | 914 (60.0%) | 610 (40.0%) |
| Total (Overall) | 3,059 (53.8%) | 2,631 (46.2%) |
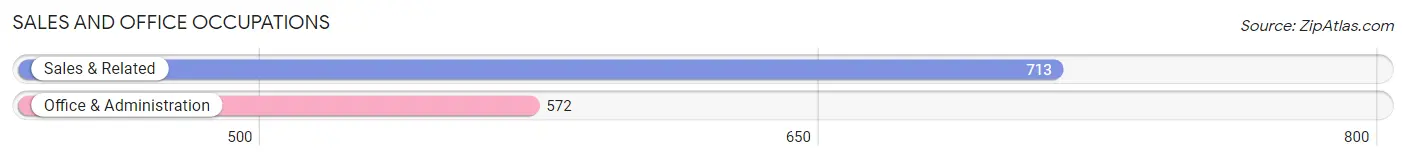
Sales and Office Occupations
The most common Sales and Office occupations in Grand County are Sales & Related (713 | 12.5%), and Office & Administration (572 | 10.1%).
Sales and Office Occupations by Sex

| Occupation | Male | Female |
| Sales & Related | 464 (65.1%) | 249 (34.9%) |
| Office & Administration | 54 (9.4%) | 518 (90.6%) |
| Total (Category) | 518 (40.3%) | 767 (59.7%) |
| Total (Overall) | 3,059 (53.8%) | 2,631 (46.2%) |
Natural Resources, Construction and Maintenance Occupations
The most common Natural Resources, Construction and Maintenance occupations in Grand County are Construction & Extraction (309 | 5.4%), Installation, Maintenance & Repair (107 | 1.9%), and Farming, Fishing & Forestry (57 | 1.0%).

Natural Resources, Construction and Maintenance Occupations by Sex
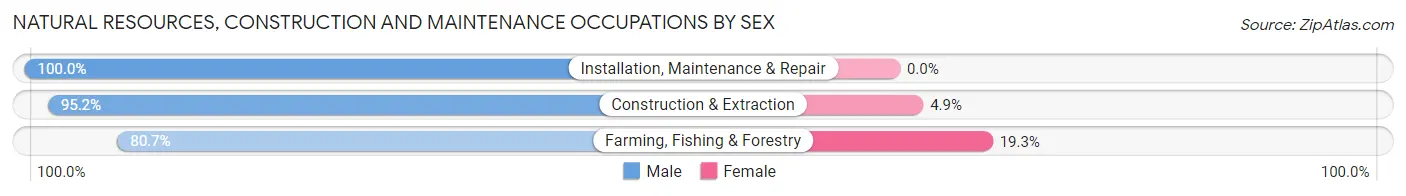
| Occupation | Male | Female |
| Farming, Fishing & Forestry | 46 (80.7%) | 11 (19.3%) |
| Construction & Extraction | 294 (95.2%) | 15 (4.9%) |
| Installation, Maintenance & Repair | 107 (100.0%) | 0 (0.0%) |
| Total (Category) | 447 (94.5%) | 26 (5.5%) |
| Total (Overall) | 3,059 (53.8%) | 2,631 (46.2%) |
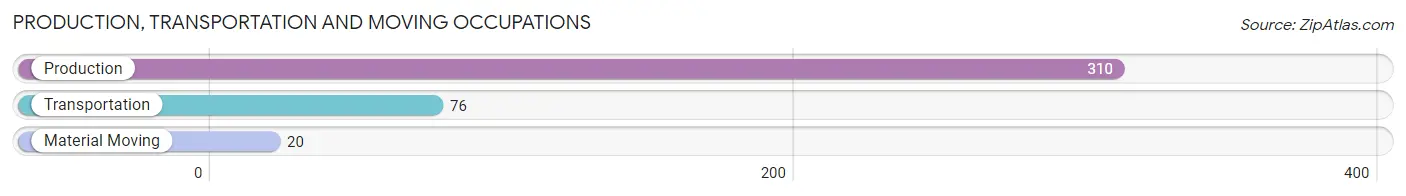
Production, Transportation and Moving Occupations
The most common Production, Transportation and Moving occupations in Grand County are Production (310 | 5.4%), Transportation (76 | 1.3%), and Material Moving (20 | 0.4%).
Production, Transportation and Moving Occupations by Sex
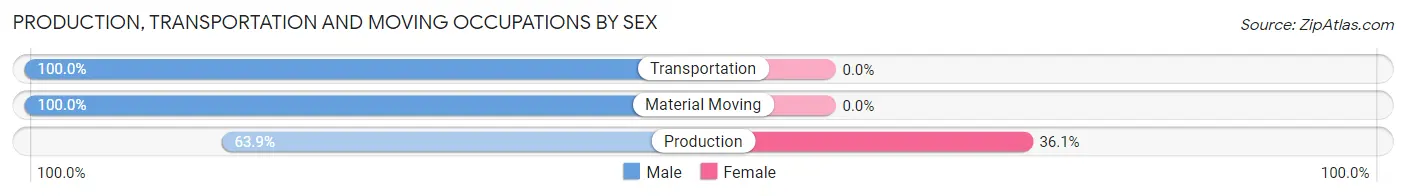
| Occupation | Male | Female |
| Production | 198 (63.9%) | 112 (36.1%) |
| Transportation | 76 (100.0%) | 0 (0.0%) |
| Material Moving | 20 (100.0%) | 0 (0.0%) |
| Total (Category) | 294 (72.4%) | 112 (27.6%) |
| Total (Overall) | 3,059 (53.8%) | 2,631 (46.2%) |
Employment Industries by Sex in Grand County
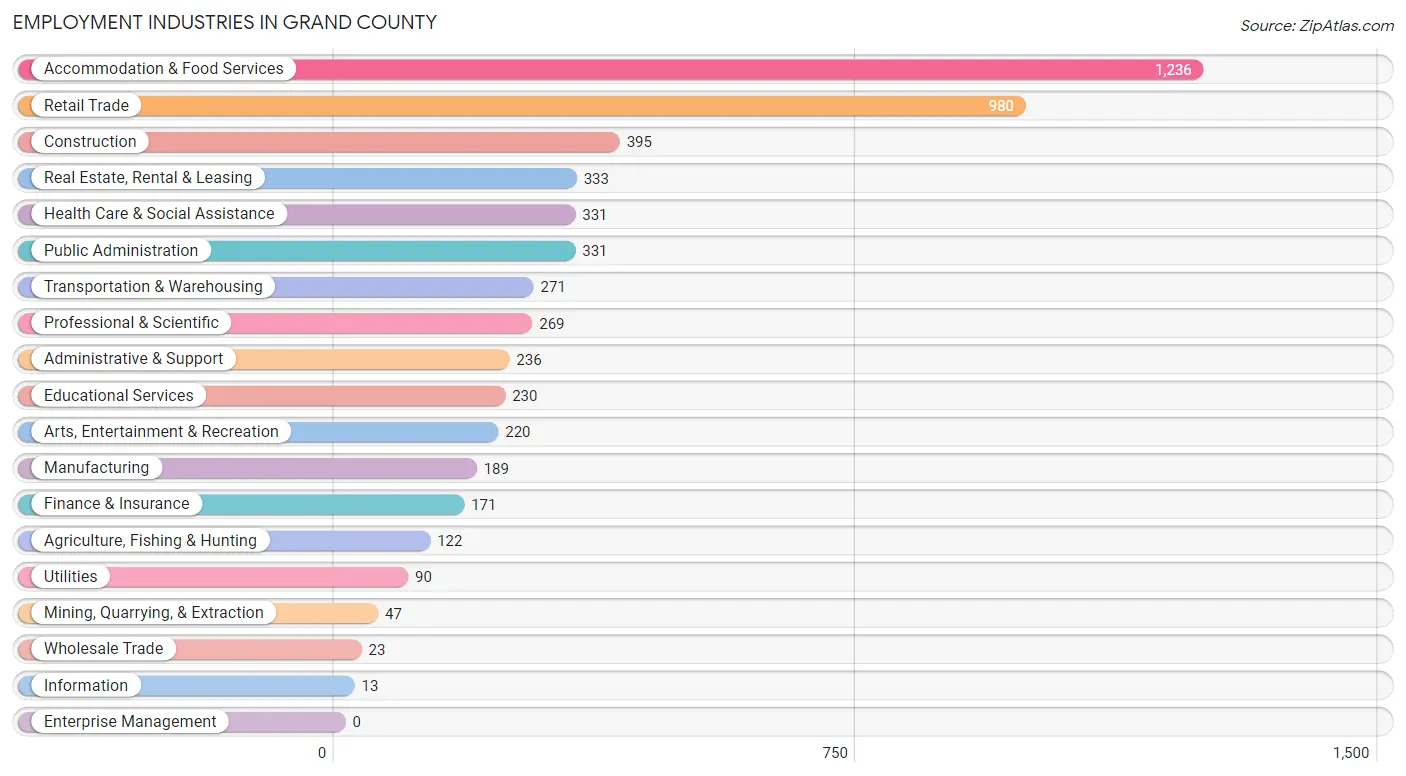
Employment Industries in Grand County
The major employment industries in Grand County include Accommodation & Food Services (1,236 | 21.7%), Retail Trade (980 | 17.2%), Construction (395 | 6.9%), Real Estate, Rental & Leasing (333 | 5.9%), and Health Care & Social Assistance (331 | 5.8%).
Employment Industries by Sex in Grand County
The Grand County industries that see more men than women are Mining, Quarrying, & Extraction (100.0%), Utilities (100.0%), and Agriculture, Fishing & Hunting (87.7%), whereas the industries that tend to have a higher number of women are Finance & Insurance (90.1%), Educational Services (82.2%), and Information (76.9%).
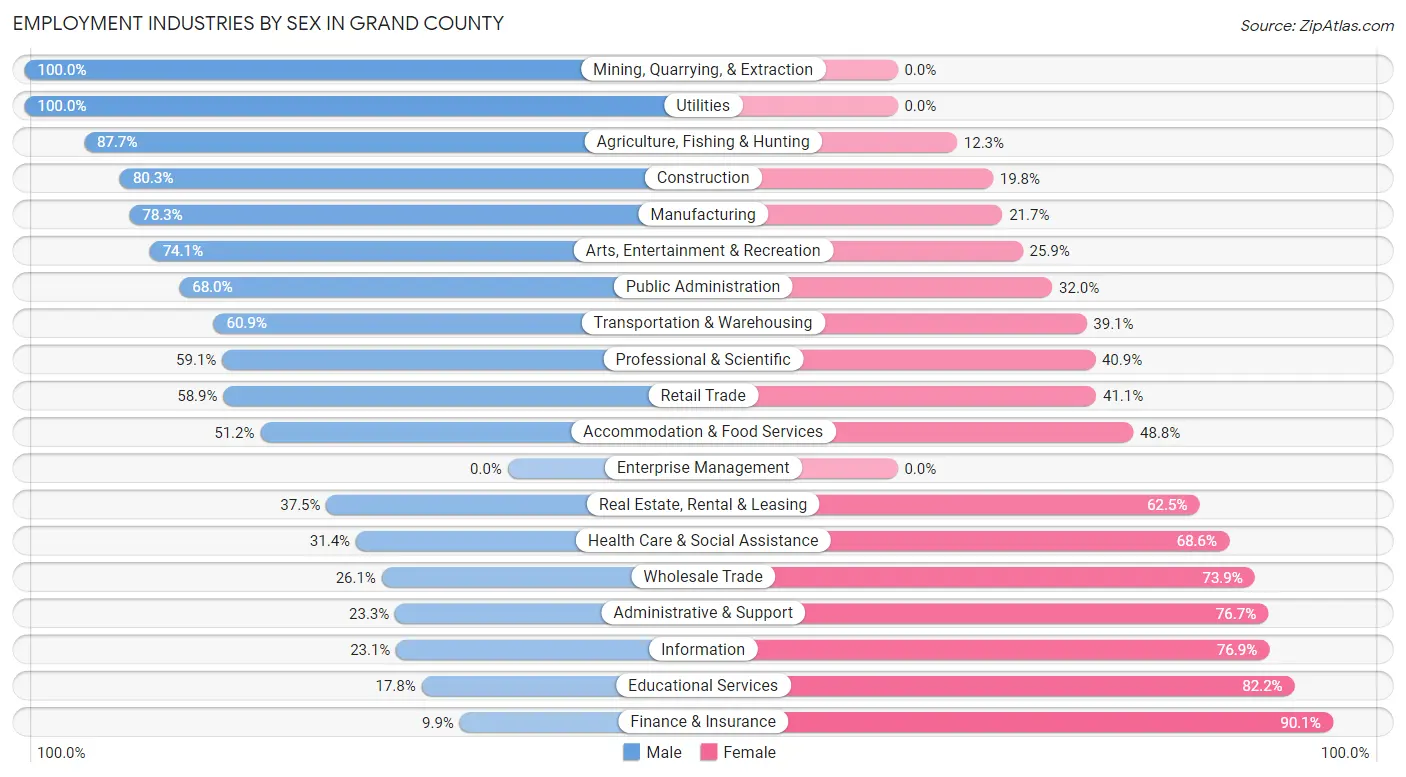
| Industry | Male | Female |
| Agriculture, Fishing & Hunting | 107 (87.7%) | 15 (12.3%) |
| Mining, Quarrying, & Extraction | 47 (100.0%) | 0 (0.0%) |
| Construction | 317 (80.2%) | 78 (19.8%) |
| Manufacturing | 148 (78.3%) | 41 (21.7%) |
| Wholesale Trade | 6 (26.1%) | 17 (73.9%) |
| Retail Trade | 577 (58.9%) | 403 (41.1%) |
| Transportation & Warehousing | 165 (60.9%) | 106 (39.1%) |
| Utilities | 90 (100.0%) | 0 (0.0%) |
| Information | 3 (23.1%) | 10 (76.9%) |
| Finance & Insurance | 17 (9.9%) | 154 (90.1%) |
| Real Estate, Rental & Leasing | 125 (37.5%) | 208 (62.5%) |
| Professional & Scientific | 159 (59.1%) | 110 (40.9%) |
| Enterprise Management | 0 (0.0%) | 0 (0.0%) |
| Administrative & Support | 55 (23.3%) | 181 (76.7%) |
| Educational Services | 41 (17.8%) | 189 (82.2%) |
| Health Care & Social Assistance | 104 (31.4%) | 227 (68.6%) |
| Arts, Entertainment & Recreation | 163 (74.1%) | 57 (25.9%) |
| Accommodation & Food Services | 633 (51.2%) | 603 (48.8%) |
| Public Administration | 225 (68.0%) | 106 (32.0%) |
| Total | 3,059 (53.8%) | 2,631 (46.2%) |
Education in Grand County
School Enrollment in Grand County
The most common levels of schooling among the 1,855 students in Grand County are elementary school (391 | 21.1%), high school (389 | 21.0%), and middle school (358 | 19.3%).
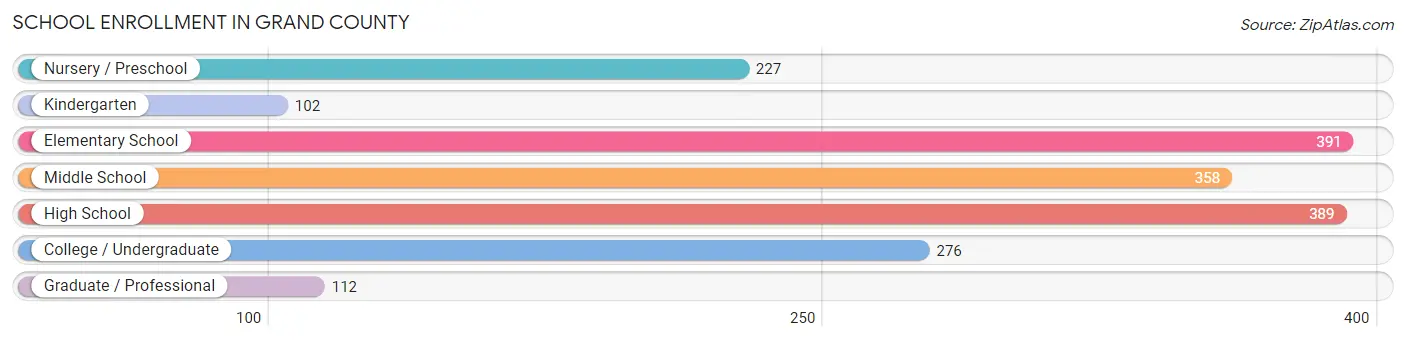
| School Level | # Students | % Students |
| Nursery / Preschool | 227 | 12.2% |
| Kindergarten | 102 | 5.5% |
| Elementary School | 391 | 21.1% |
| Middle School | 358 | 19.3% |
| High School | 389 | 21.0% |
| College / Undergraduate | 276 | 14.9% |
| Graduate / Professional | 112 | 6.0% |
| Total | 1,855 | 100.0% |
School Enrollment by Age by Funding Source in Grand County
Out of a total of 1,855 students who are enrolled in schools in Grand County, 414 (22.3%) attend a private institution, while the remaining 1,441 (77.7%) are enrolled in public schools. The age group of 3 to 4 year olds has the highest likelihood of being enrolled in private schools, with 164 (100.0% in the age bracket) enrolled. Conversely, the age group of 10 to 14 year olds has the lowest likelihood of being enrolled in a private school, with 503 (100.0% in the age bracket) attending a public institution.
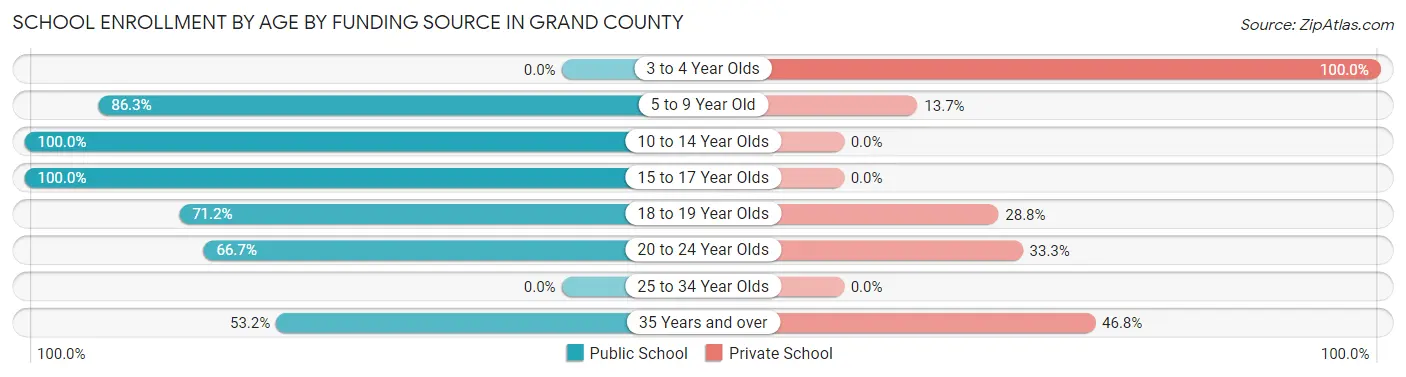
| Age Bracket | Public School | Private School |
| 3 to 4 Year Olds | 0 (0.0%) | 164 (100.0%) |
| 5 to 9 Year Old | 440 (86.3%) | 70 (13.7%) |
| 10 to 14 Year Olds | 503 (100.0%) | 0 (0.0%) |
| 15 to 17 Year Olds | 248 (100.0%) | 0 (0.0%) |
| 18 to 19 Year Olds | 42 (71.2%) | 17 (28.8%) |
| 20 to 24 Year Olds | 58 (66.7%) | 29 (33.3%) |
| 25 to 34 Year Olds | 0 (0.0%) | 0 (0.0%) |
| 35 Years and over | 151 (53.2%) | 133 (46.8%) |
| Total | 1,441 (77.7%) | 414 (22.3%) |
Educational Attainment by Field of Study in Grand County
Bio, nature & agricultural (368 | 15.6%), arts & humanities (366 | 15.5%), social sciences (238 | 10.1%), education (207 | 8.8%), and communications (196 | 8.3%) are the most common fields of study among 2,354 individuals in Grand County who have obtained a bachelor's degree or higher.
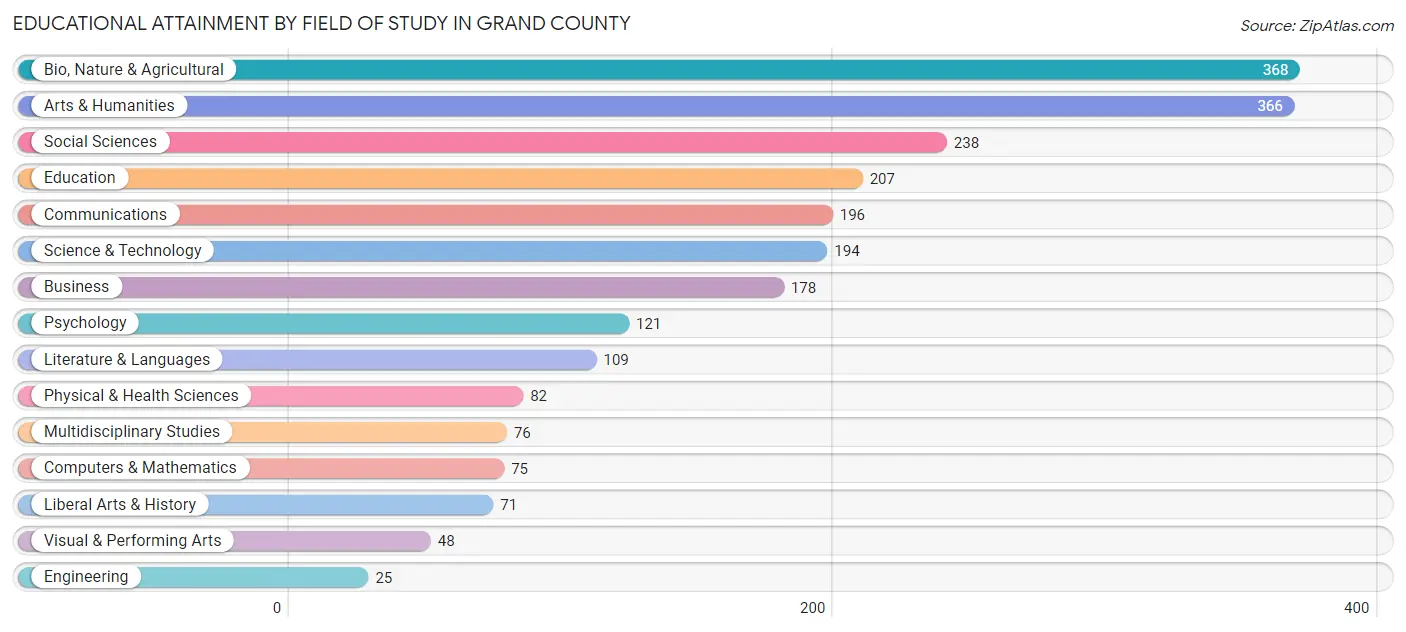
| Field of Study | # Graduates | % Graduates |
| Computers & Mathematics | 75 | 3.2% |
| Bio, Nature & Agricultural | 368 | 15.6% |
| Physical & Health Sciences | 82 | 3.5% |
| Psychology | 121 | 5.1% |
| Social Sciences | 238 | 10.1% |
| Engineering | 25 | 1.1% |
| Multidisciplinary Studies | 76 | 3.2% |
| Science & Technology | 194 | 8.2% |
| Business | 178 | 7.6% |
| Education | 207 | 8.8% |
| Literature & Languages | 109 | 4.6% |
| Liberal Arts & History | 71 | 3.0% |
| Visual & Performing Arts | 48 | 2.0% |
| Communications | 196 | 8.3% |
| Arts & Humanities | 366 | 15.5% |
| Total | 2,354 | 100.0% |
Transportation & Commute in Grand County
Vehicle Availability by Sex in Grand County
The most prevalent vehicle ownership categories in Grand County are males with 2 vehicles (1,089, accounting for 37.8%) and females with 2 vehicles (806, making up 42.5%).
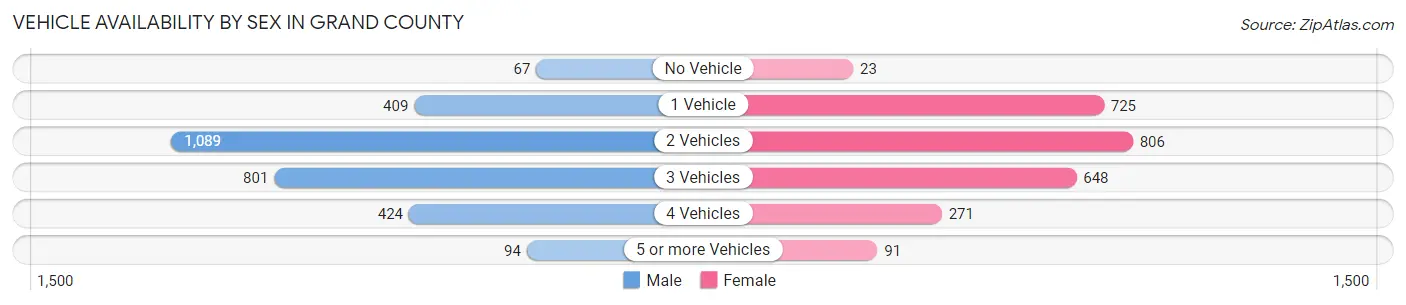
| Vehicles Available | Male | Female |
| No Vehicle | 67 (2.3%) | 23 (0.9%) |
| 1 Vehicle | 409 (14.2%) | 725 (28.3%) |
| 2 Vehicles | 1,089 (37.8%) | 806 (31.4%) |
| 3 Vehicles | 801 (27.8%) | 648 (25.3%) |
| 4 Vehicles | 424 (14.7%) | 271 (10.6%) |
| 5 or more Vehicles | 94 (3.3%) | 91 (3.5%) |
| Total | 2,884 (100.0%) | 2,564 (100.0%) |
Commute Time in Grand County
The most frequently occuring commute durations in Grand County are 5 to 9 minutes (2,172 commuters, 43.2%), 10 to 14 minutes (1,213 commuters, 24.1%), and 15 to 19 minutes (554 commuters, 11.0%).
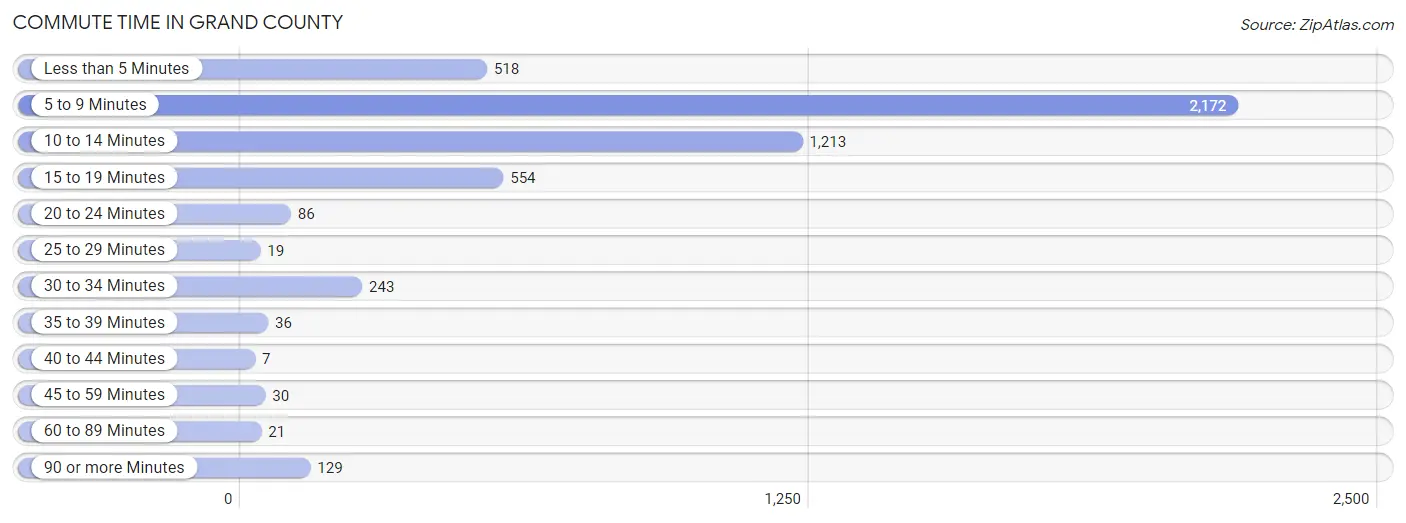
| Commute Time | # Commuters | % Commuters |
| Less than 5 Minutes | 518 | 10.3% |
| 5 to 9 Minutes | 2,172 | 43.2% |
| 10 to 14 Minutes | 1,213 | 24.1% |
| 15 to 19 Minutes | 554 | 11.0% |
| 20 to 24 Minutes | 86 | 1.7% |
| 25 to 29 Minutes | 19 | 0.4% |
| 30 to 34 Minutes | 243 | 4.8% |
| 35 to 39 Minutes | 36 | 0.7% |
| 40 to 44 Minutes | 7 | 0.1% |
| 45 to 59 Minutes | 30 | 0.6% |
| 60 to 89 Minutes | 21 | 0.4% |
| 90 or more Minutes | 129 | 2.6% |
Commute Time by Sex in Grand County
The most common commute times in Grand County are 5 to 9 minutes (1,001 commuters, 36.2%) for males and 5 to 9 minutes (1,171 commuters, 51.8%) for females.
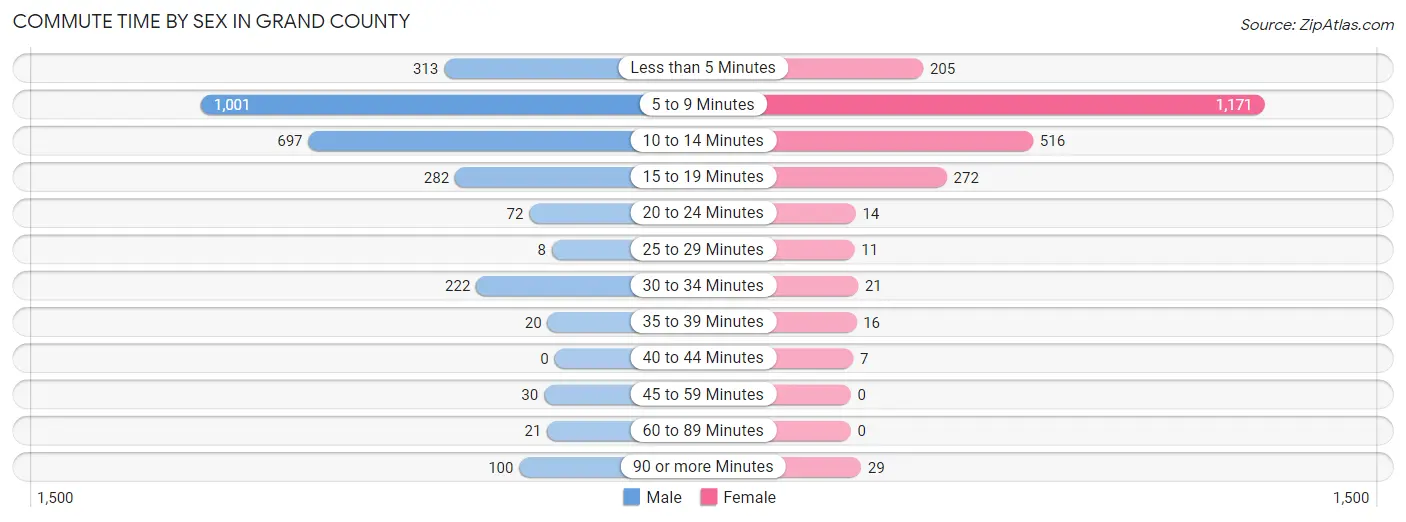
| Commute Time | Male | Female |
| Less than 5 Minutes | 313 (11.3%) | 205 (9.1%) |
| 5 to 9 Minutes | 1,001 (36.2%) | 1,171 (51.8%) |
| 10 to 14 Minutes | 697 (25.2%) | 516 (22.8%) |
| 15 to 19 Minutes | 282 (10.2%) | 272 (12.0%) |
| 20 to 24 Minutes | 72 (2.6%) | 14 (0.6%) |
| 25 to 29 Minutes | 8 (0.3%) | 11 (0.5%) |
| 30 to 34 Minutes | 222 (8.0%) | 21 (0.9%) |
| 35 to 39 Minutes | 20 (0.7%) | 16 (0.7%) |
| 40 to 44 Minutes | 0 (0.0%) | 7 (0.3%) |
| 45 to 59 Minutes | 30 (1.1%) | 0 (0.0%) |
| 60 to 89 Minutes | 21 (0.8%) | 0 (0.0%) |
| 90 or more Minutes | 100 (3.6%) | 29 (1.3%) |
Time of Departure to Work by Sex in Grand County
The most frequent times of departure to work in Grand County are 8:00 AM to 8:29 AM (566, 20.5%) for males and 7:30 AM to 7:59 AM (411, 18.2%) for females.
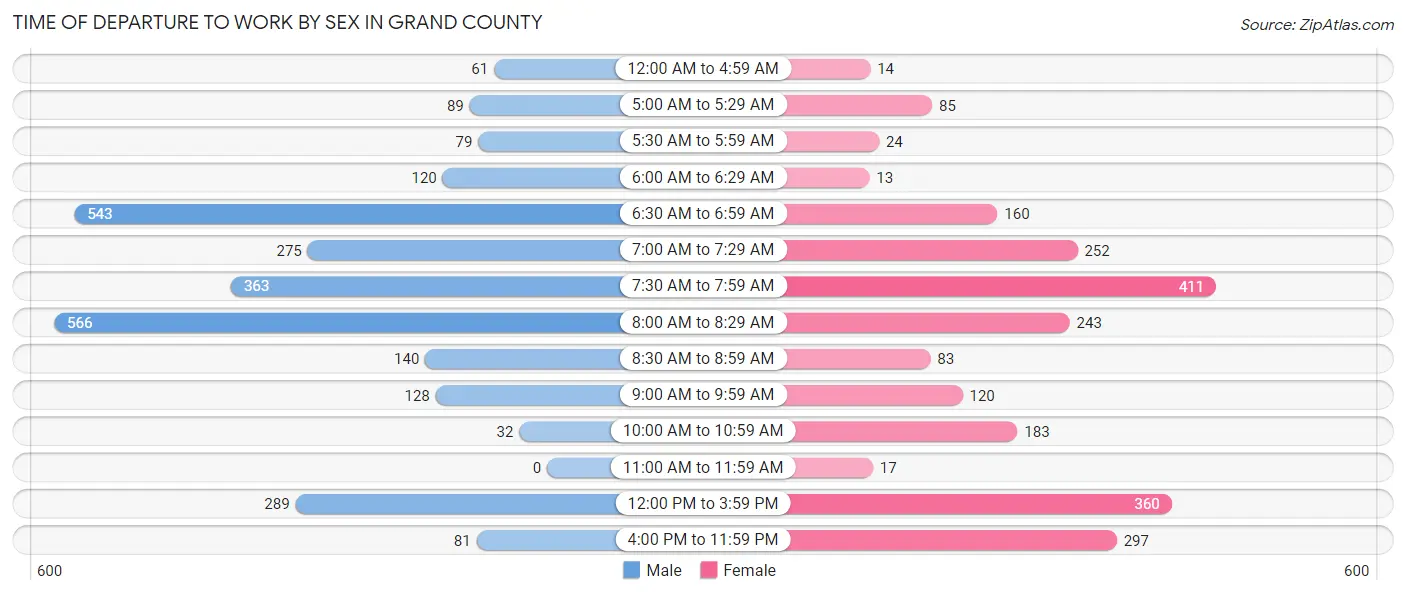
| Time of Departure | Male | Female |
| 12:00 AM to 4:59 AM | 61 (2.2%) | 14 (0.6%) |
| 5:00 AM to 5:29 AM | 89 (3.2%) | 85 (3.8%) |
| 5:30 AM to 5:59 AM | 79 (2.9%) | 24 (1.1%) |
| 6:00 AM to 6:29 AM | 120 (4.3%) | 13 (0.6%) |
| 6:30 AM to 6:59 AM | 543 (19.6%) | 160 (7.1%) |
| 7:00 AM to 7:29 AM | 275 (9.9%) | 252 (11.1%) |
| 7:30 AM to 7:59 AM | 363 (13.1%) | 411 (18.2%) |
| 8:00 AM to 8:29 AM | 566 (20.5%) | 243 (10.7%) |
| 8:30 AM to 8:59 AM | 140 (5.1%) | 83 (3.7%) |
| 9:00 AM to 9:59 AM | 128 (4.6%) | 120 (5.3%) |
| 10:00 AM to 10:59 AM | 32 (1.2%) | 183 (8.1%) |
| 11:00 AM to 11:59 AM | 0 (0.0%) | 17 (0.7%) |
| 12:00 PM to 3:59 PM | 289 (10.4%) | 360 (15.9%) |
| 4:00 PM to 11:59 PM | 81 (2.9%) | 297 (13.1%) |
| Total | 2,766 (100.0%) | 2,262 (100.0%) |
Housing Occupancy in Grand County
Occupancy by Ownership in Grand County
Of the total 4,335 dwellings in Grand County, owner-occupied units account for 2,906 (67.0%), while renter-occupied units make up 1,429 (33.0%).
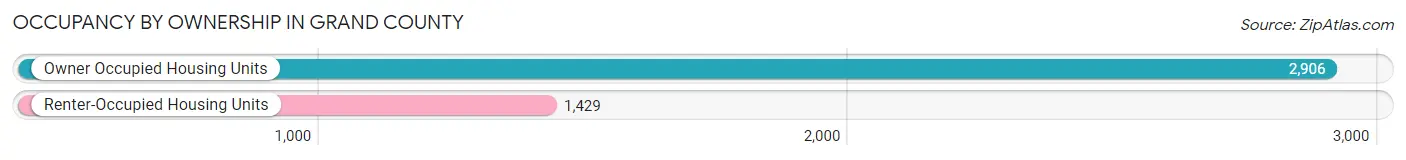
| Occupancy | # Housing Units | % Housing Units |
| Owner Occupied Housing Units | 2,906 | 67.0% |
| Renter-Occupied Housing Units | 1,429 | 33.0% |
| Total Occupied Housing Units | 4,335 | 100.0% |
Occupancy by Household Size in Grand County
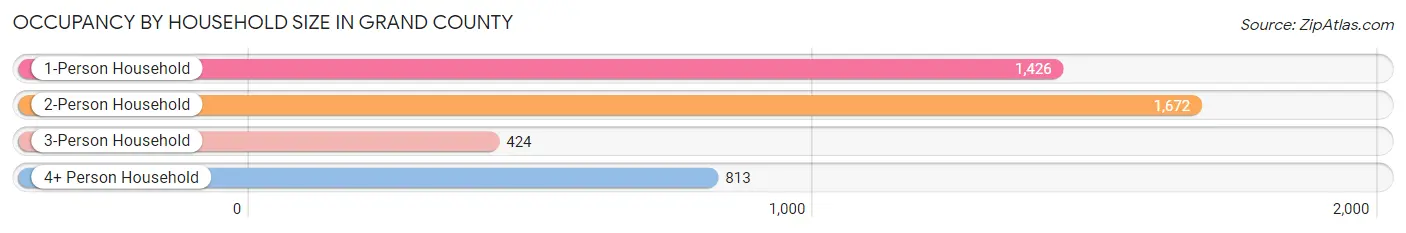
| Household Size | # Housing Units | % Housing Units |
| 1-Person Household | 1,426 | 32.9% |
| 2-Person Household | 1,672 | 38.6% |
| 3-Person Household | 424 | 9.8% |
| 4+ Person Household | 813 | 18.8% |
| Total Housing Units | 4,335 | 100.0% |
Occupancy by Ownership by Household Size in Grand County
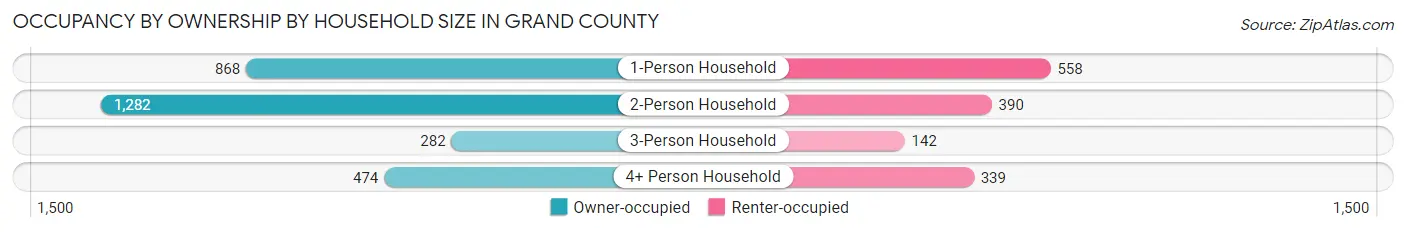
| Household Size | Owner-occupied | Renter-occupied |
| 1-Person Household | 868 (60.9%) | 558 (39.1%) |
| 2-Person Household | 1,282 (76.7%) | 390 (23.3%) |
| 3-Person Household | 282 (66.5%) | 142 (33.5%) |
| 4+ Person Household | 474 (58.3%) | 339 (41.7%) |
| Total Housing Units | 2,906 (67.0%) | 1,429 (33.0%) |
Occupancy by Educational Attainment in Grand County
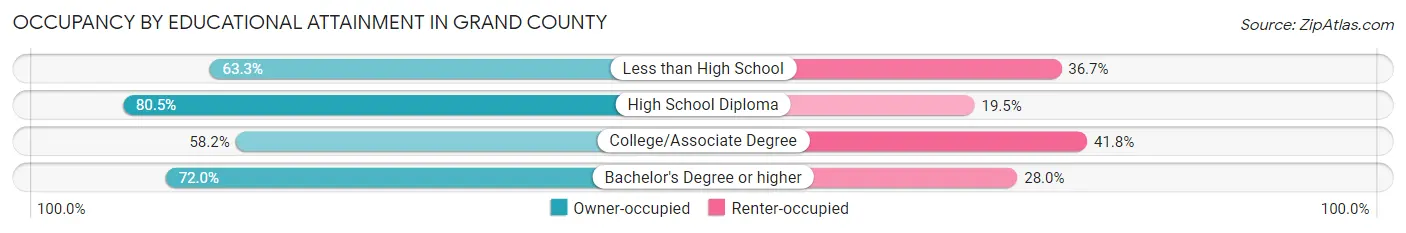
| Household Size | Owner-occupied | Renter-occupied |
| Less than High School | 138 (63.3%) | 80 (36.7%) |
| High School Diploma | 644 (80.5%) | 156 (19.5%) |
| College/Associate Degree | 1,115 (58.2%) | 801 (41.8%) |
| Bachelor's Degree or higher | 1,009 (72.0%) | 392 (28.0%) |
Occupancy by Age of Householder in Grand County
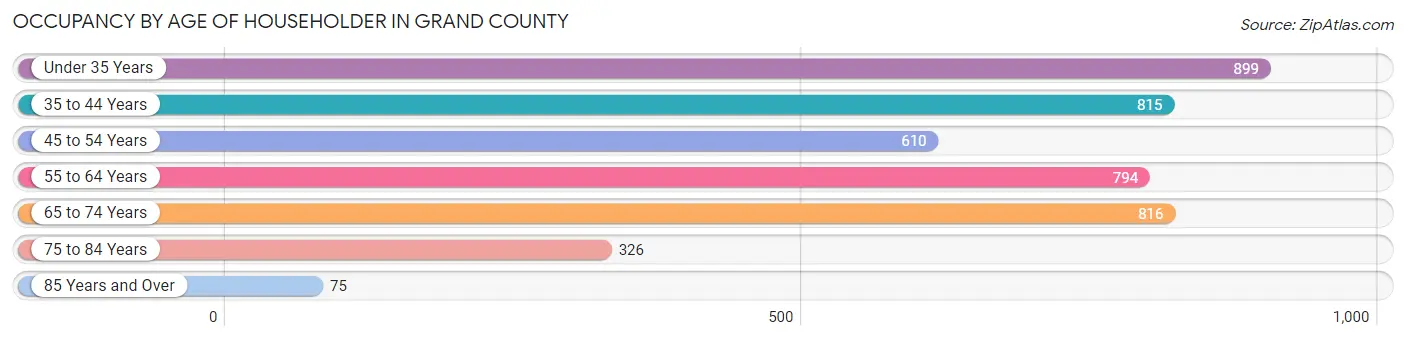
| Age Bracket | # Households | % Households |
| Under 35 Years | 899 | 20.7% |
| 35 to 44 Years | 815 | 18.8% |
| 45 to 54 Years | 610 | 14.1% |
| 55 to 64 Years | 794 | 18.3% |
| 65 to 74 Years | 816 | 18.8% |
| 75 to 84 Years | 326 | 7.5% |
| 85 Years and Over | 75 | 1.7% |
| Total | 4,335 | 100.0% |
Housing Finances in Grand County
Median Income by Occupancy in Grand County
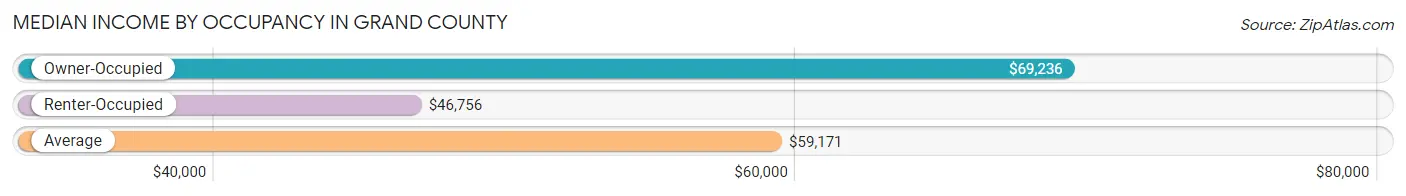
| Occupancy Type | # Households | Median Income |
| Owner-Occupied | 2,906 (67.0%) | $69,236 |
| Renter-Occupied | 1,429 (33.0%) | $46,756 |
| Average | 4,335 (100.0%) | $59,171 |
Occupancy by Householder Income Bracket in Grand County
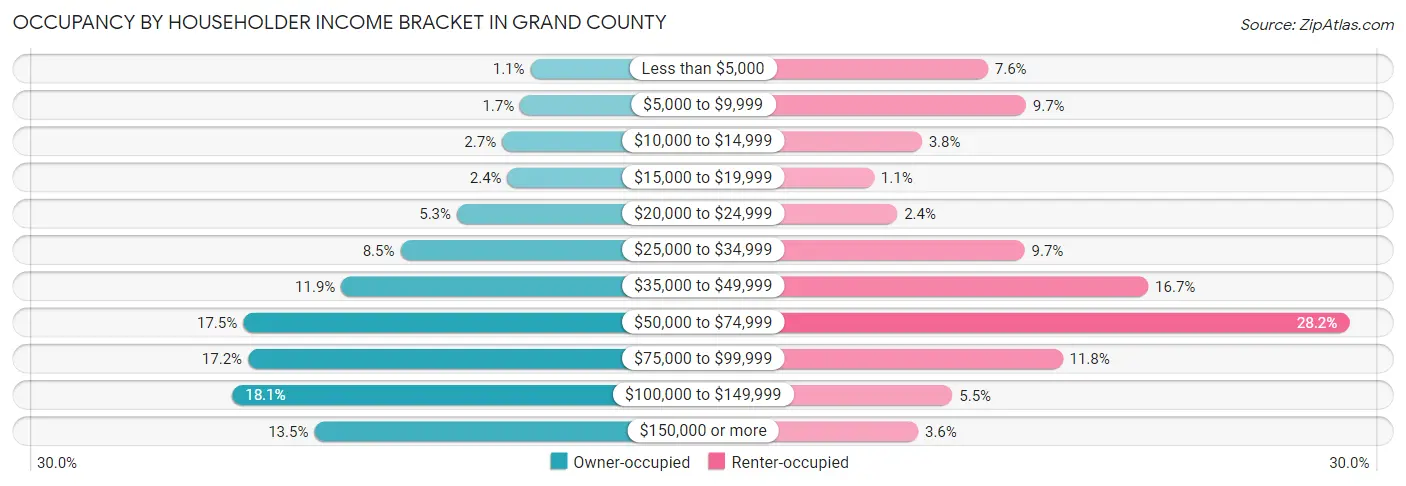
| Income Bracket | Owner-occupied | Renter-occupied |
| Less than $5,000 | 32 (1.1%) | 108 (7.6%) |
| $5,000 to $9,999 | 49 (1.7%) | 139 (9.7%) |
| $10,000 to $14,999 | 79 (2.7%) | 54 (3.8%) |
| $15,000 to $19,999 | 70 (2.4%) | 15 (1.1%) |
| $20,000 to $24,999 | 154 (5.3%) | 34 (2.4%) |
| $25,000 to $34,999 | 248 (8.5%) | 138 (9.7%) |
| $35,000 to $49,999 | 346 (11.9%) | 239 (16.7%) |
| $50,000 to $74,999 | 509 (17.5%) | 403 (28.2%) |
| $75,000 to $99,999 | 501 (17.2%) | 169 (11.8%) |
| $100,000 to $149,999 | 527 (18.1%) | 79 (5.5%) |
| $150,000 or more | 391 (13.5%) | 51 (3.6%) |
| Total | 2,906 (100.0%) | 1,429 (100.0%) |
Monthly Housing Cost Tiers in Grand County
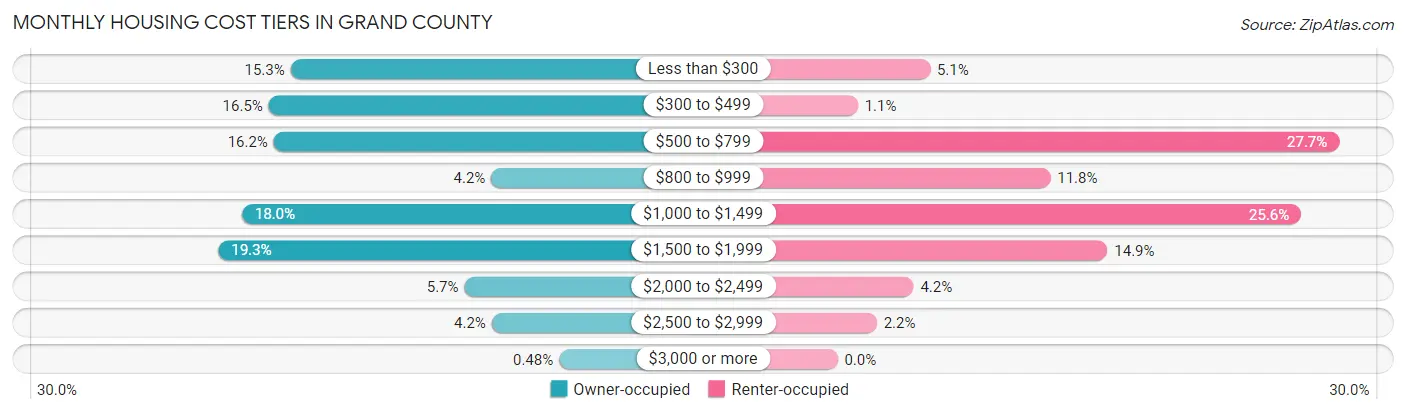
| Monthly Cost | Owner-occupied | Renter-occupied |
| Less than $300 | 445 (15.3%) | 73 (5.1%) |
| $300 to $499 | 480 (16.5%) | 16 (1.1%) |
| $500 to $799 | 472 (16.2%) | 396 (27.7%) |
| $800 to $999 | 123 (4.2%) | 168 (11.8%) |
| $1,000 to $1,499 | 523 (18.0%) | 366 (25.6%) |
| $1,500 to $1,999 | 561 (19.3%) | 213 (14.9%) |
| $2,000 to $2,499 | 166 (5.7%) | 60 (4.2%) |
| $2,500 to $2,999 | 122 (4.2%) | 31 (2.2%) |
| $3,000 or more | 14 (0.5%) | 0 (0.0%) |
| Total | 2,906 (100.0%) | 1,429 (100.0%) |
Physical Housing Characteristics in Grand County
Housing Structures in Grand County
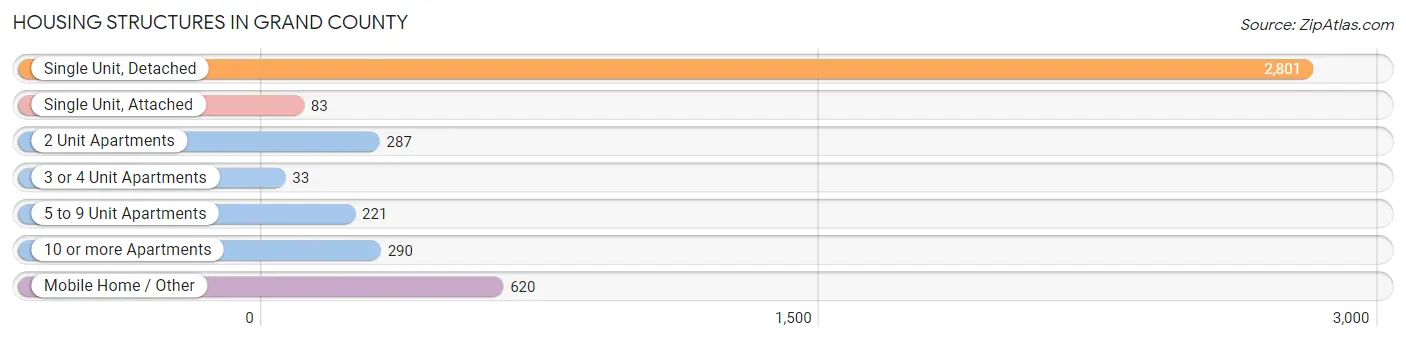
| Structure Type | # Housing Units | % Housing Units |
| Single Unit, Detached | 2,801 | 64.6% |
| Single Unit, Attached | 83 | 1.9% |
| 2 Unit Apartments | 287 | 6.6% |
| 3 or 4 Unit Apartments | 33 | 0.8% |
| 5 to 9 Unit Apartments | 221 | 5.1% |
| 10 or more Apartments | 290 | 6.7% |
| Mobile Home / Other | 620 | 14.3% |
| Total | 4,335 | 100.0% |
Housing Structures by Occupancy in Grand County
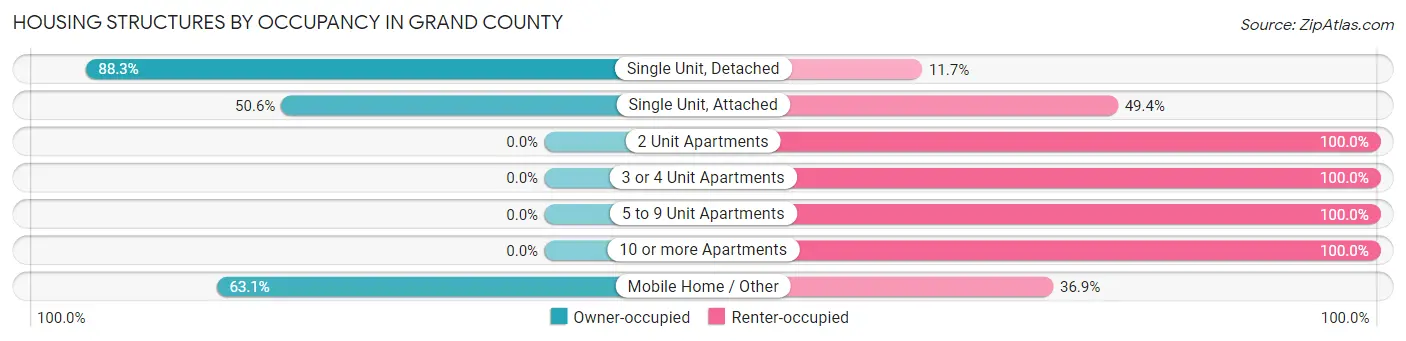
| Structure Type | Owner-occupied | Renter-occupied |
| Single Unit, Detached | 2,473 (88.3%) | 328 (11.7%) |
| Single Unit, Attached | 42 (50.6%) | 41 (49.4%) |
| 2 Unit Apartments | 0 (0.0%) | 287 (100.0%) |
| 3 or 4 Unit Apartments | 0 (0.0%) | 33 (100.0%) |
| 5 to 9 Unit Apartments | 0 (0.0%) | 221 (100.0%) |
| 10 or more Apartments | 0 (0.0%) | 290 (100.0%) |
| Mobile Home / Other | 391 (63.1%) | 229 (36.9%) |
| Total | 2,906 (67.0%) | 1,429 (33.0%) |
Housing Structures by Number of Rooms in Grand County
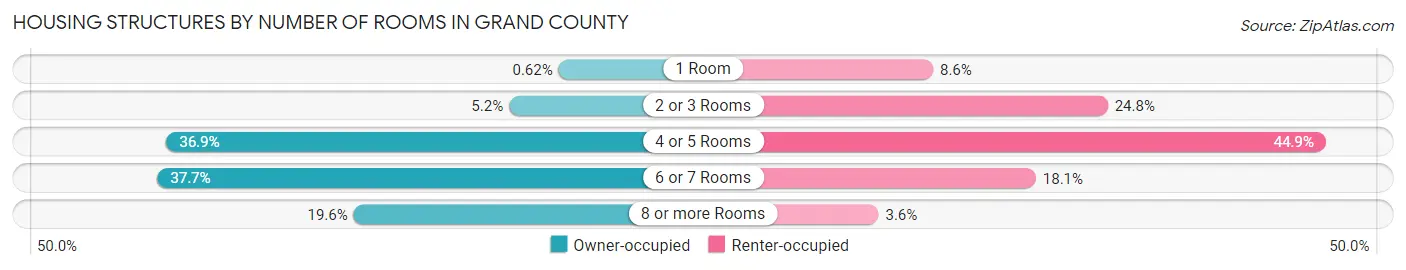
| Number of Rooms | Owner-occupied | Renter-occupied |
| 1 Room | 18 (0.6%) | 123 (8.6%) |
| 2 or 3 Rooms | 151 (5.2%) | 354 (24.8%) |
| 4 or 5 Rooms | 1,072 (36.9%) | 642 (44.9%) |
| 6 or 7 Rooms | 1,096 (37.7%) | 259 (18.1%) |
| 8 or more Rooms | 569 (19.6%) | 51 (3.6%) |
| Total | 2,906 (100.0%) | 1,429 (100.0%) |
Housing Structure by Heating Type in Grand County
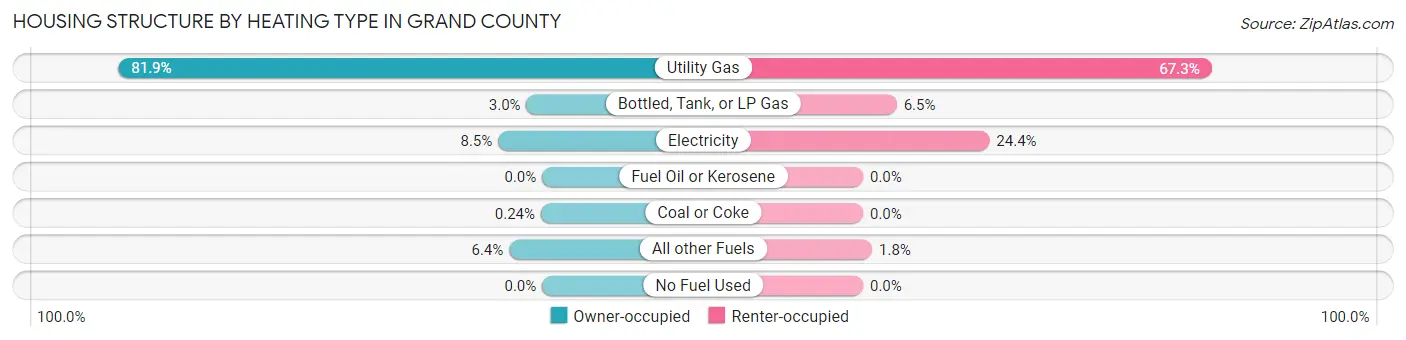
| Heating Type | Owner-occupied | Renter-occupied |
| Utility Gas | 2,379 (81.9%) | 962 (67.3%) |
| Bottled, Tank, or LP Gas | 88 (3.0%) | 93 (6.5%) |
| Electricity | 247 (8.5%) | 349 (24.4%) |
| Fuel Oil or Kerosene | 0 (0.0%) | 0 (0.0%) |
| Coal or Coke | 7 (0.2%) | 0 (0.0%) |
| All other Fuels | 185 (6.4%) | 25 (1.8%) |
| No Fuel Used | 0 (0.0%) | 0 (0.0%) |
| Total | 2,906 (100.0%) | 1,429 (100.0%) |
Household Vehicle Usage in Grand County
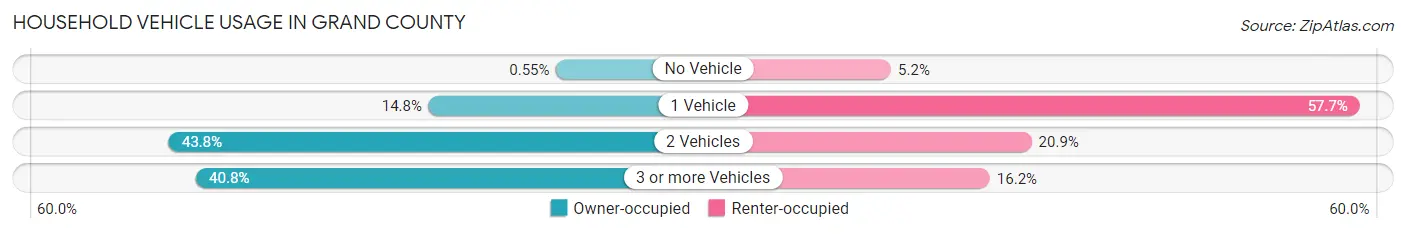
| Vehicles per Household | Owner-occupied | Renter-occupied |
| No Vehicle | 16 (0.5%) | 74 (5.2%) |
| 1 Vehicle | 431 (14.8%) | 824 (57.7%) |
| 2 Vehicles | 1,274 (43.8%) | 299 (20.9%) |
| 3 or more Vehicles | 1,185 (40.8%) | 232 (16.2%) |
| Total | 2,906 (100.0%) | 1,429 (100.0%) |
Real Estate & Mortgages in Grand County
Real Estate and Mortgage Overview in Grand County
| Characteristic | Without Mortgage | With Mortgage |
| Housing Units | 1,435 | 1,471 |
| Median Property Value | $423,800 | $429,700 |
| Median Household Income | $75,355 | $296 |
| Monthly Housing Costs | $389 | $14 |
| Real Estate Taxes | $1,665 | $22 |
Property Value by Mortgage Status in Grand County
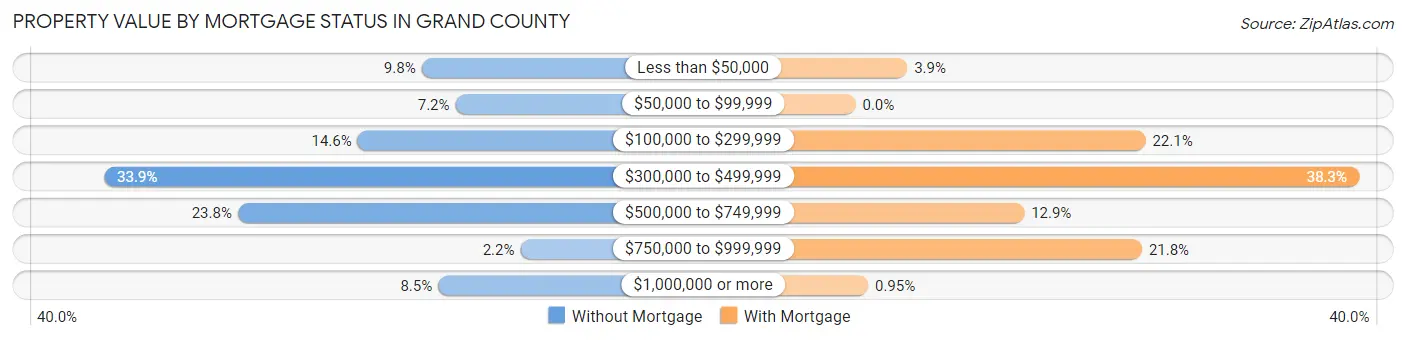
| Property Value | Without Mortgage | With Mortgage |
| Less than $50,000 | 140 (9.8%) | 58 (3.9%) |
| $50,000 to $99,999 | 103 (7.2%) | 0 (0.0%) |
| $100,000 to $299,999 | 210 (14.6%) | 325 (22.1%) |
| $300,000 to $499,999 | 487 (33.9%) | 564 (38.3%) |
| $500,000 to $749,999 | 341 (23.8%) | 189 (12.9%) |
| $750,000 to $999,999 | 32 (2.2%) | 321 (21.8%) |
| $1,000,000 or more | 122 (8.5%) | 14 (0.9%) |
| Total | 1,435 (100.0%) | 1,471 (100.0%) |
Household Income by Mortgage Status in Grand County
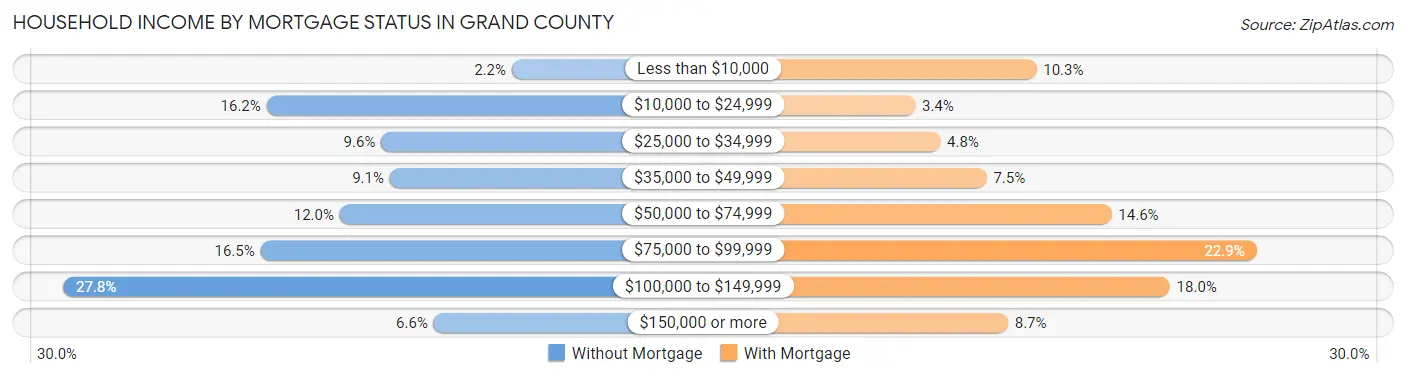
| Household Income | Without Mortgage | With Mortgage |
| Less than $10,000 | 31 (2.2%) | 152 (10.3%) |
| $10,000 to $24,999 | 232 (16.2%) | 50 (3.4%) |
| $25,000 to $34,999 | 138 (9.6%) | 71 (4.8%) |
| $35,000 to $49,999 | 131 (9.1%) | 110 (7.5%) |
| $50,000 to $74,999 | 172 (12.0%) | 215 (14.6%) |
| $75,000 to $99,999 | 237 (16.5%) | 337 (22.9%) |
| $100,000 to $149,999 | 399 (27.8%) | 264 (17.9%) |
| $150,000 or more | 95 (6.6%) | 128 (8.7%) |
| Total | 1,435 (100.0%) | 1,471 (100.0%) |
Property Value to Household Income Ratio in Grand County
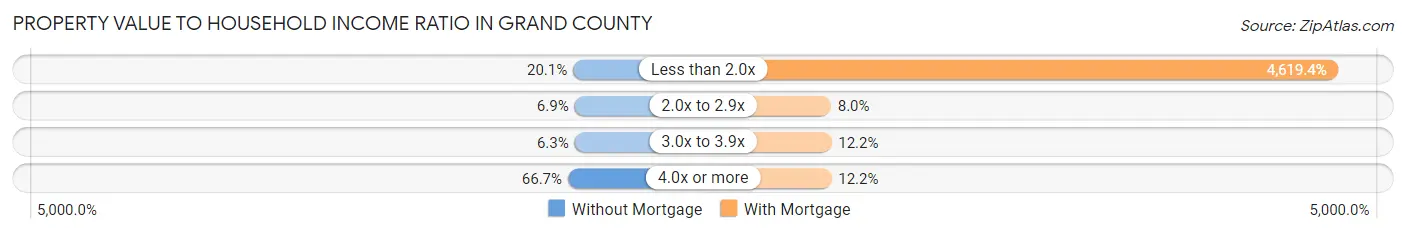
| Value-to-Income Ratio | Without Mortgage | With Mortgage |
| Less than 2.0x | 288 (20.1%) | 67,951 (4,619.4%) |
| 2.0x to 2.9x | 99 (6.9%) | 118 (8.0%) |
| 3.0x to 3.9x | 91 (6.3%) | 180 (12.2%) |
| 4.0x or more | 957 (66.7%) | 180 (12.2%) |
| Total | 1,435 (100.0%) | 1,471 (100.0%) |
Real Estate Taxes by Mortgage Status in Grand County
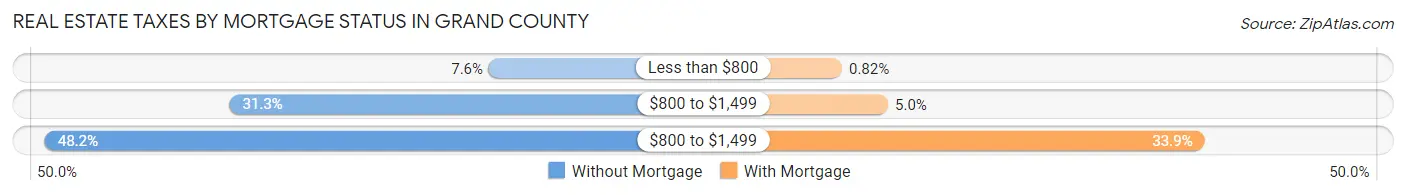
| Property Taxes | Without Mortgage | With Mortgage |
| Less than $800 | 109 (7.6%) | 12 (0.8%) |
| $800 to $1,499 | 449 (31.3%) | 74 (5.0%) |
| $800 to $1,499 | 691 (48.1%) | 499 (33.9%) |
| Total | 1,435 (100.0%) | 1,471 (100.0%) |
Health & Disability in Grand County
Health Insurance Coverage by Age in Grand County
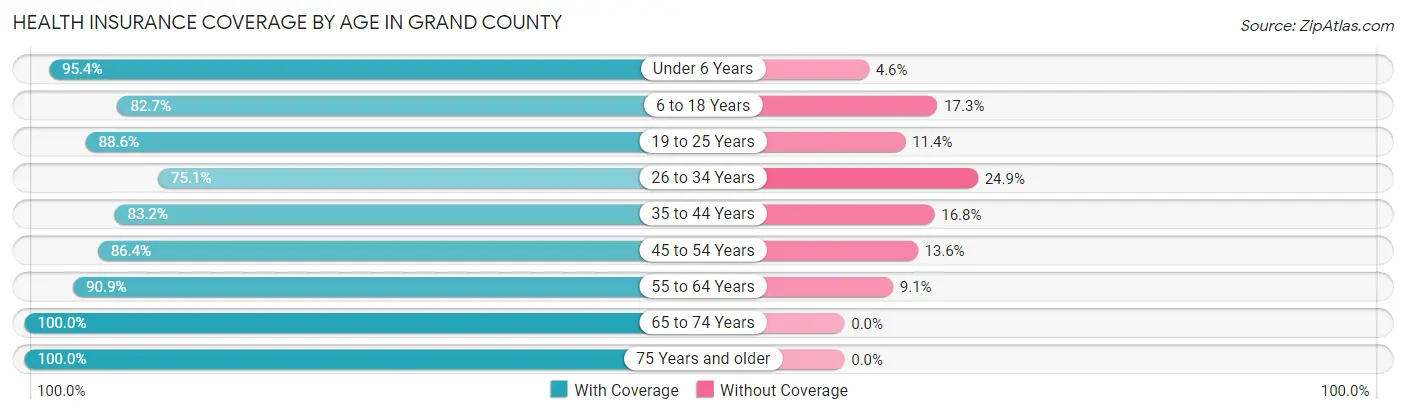
| Age Bracket | With Coverage | Without Coverage |
| Under 6 Years | 459 (95.4%) | 22 (4.6%) |
| 6 to 18 Years | 1,150 (82.7%) | 241 (17.3%) |
| 19 to 25 Years | 871 (88.6%) | 112 (11.4%) |
| 26 to 34 Years | 969 (75.1%) | 321 (24.9%) |
| 35 to 44 Years | 1,199 (83.2%) | 242 (16.8%) |
| 45 to 54 Years | 836 (86.4%) | 132 (13.6%) |
| 55 to 64 Years | 1,074 (90.9%) | 107 (9.1%) |
| 65 to 74 Years | 1,229 (100.0%) | 0 (0.0%) |
| 75 Years and older | 645 (100.0%) | 0 (0.0%) |
| Total | 8,432 (87.7%) | 1,177 (12.2%) |
Health Insurance Coverage by Citizenship Status in Grand County
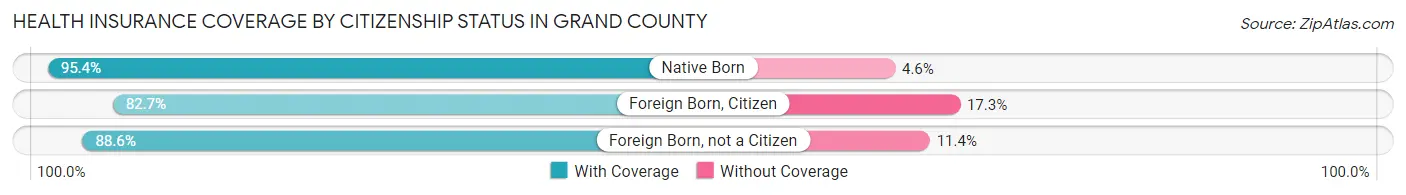
| Citizenship Status | With Coverage | Without Coverage |
| Native Born | 459 (95.4%) | 22 (4.6%) |
| Foreign Born, Citizen | 1,150 (82.7%) | 241 (17.3%) |
| Foreign Born, not a Citizen | 871 (88.6%) | 112 (11.4%) |
Health Insurance Coverage by Household Income in Grand County
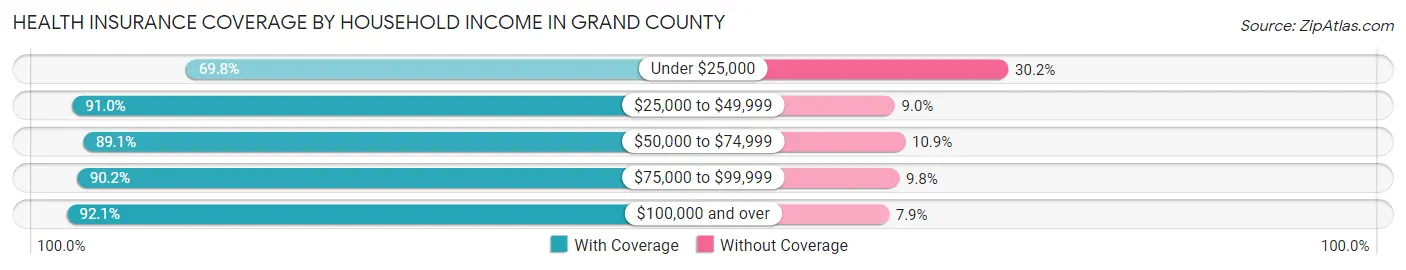
| Household Income | With Coverage | Without Coverage |
| Under $25,000 | 882 (69.8%) | 382 (30.2%) |
| $25,000 to $49,999 | 1,565 (91.0%) | 154 (9.0%) |
| $50,000 to $74,999 | 1,854 (89.1%) | 227 (10.9%) |
| $75,000 to $99,999 | 1,539 (90.2%) | 167 (9.8%) |
| $100,000 and over | 2,576 (92.1%) | 220 (7.9%) |
Public vs Private Health Insurance Coverage by Age in Grand County
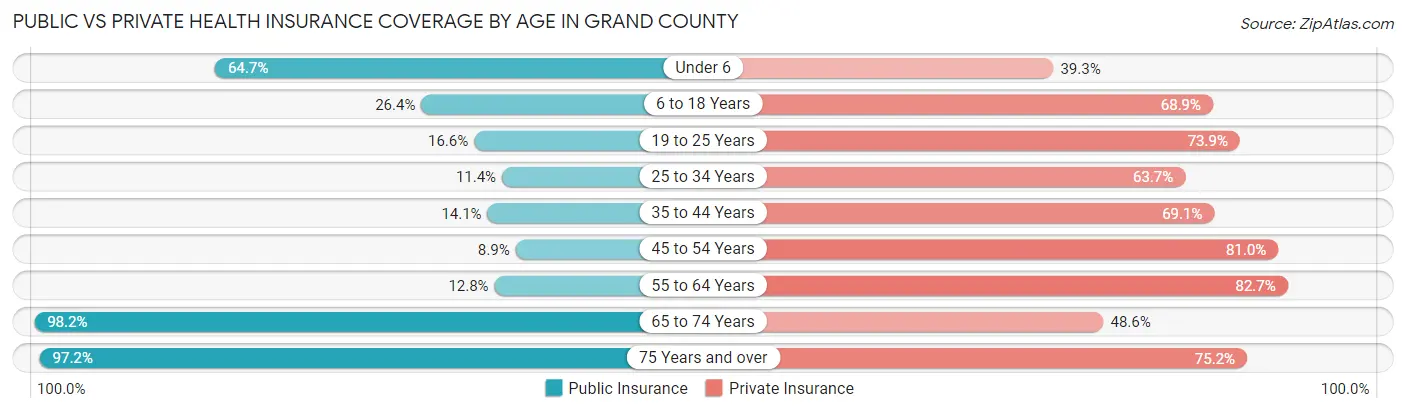
| Age Bracket | Public Insurance | Private Insurance |
| Under 6 | 311 (64.7%) | 189 (39.3%) |
| 6 to 18 Years | 367 (26.4%) | 958 (68.9%) |
| 19 to 25 Years | 163 (16.6%) | 726 (73.9%) |
| 25 to 34 Years | 147 (11.4%) | 822 (63.7%) |
| 35 to 44 Years | 203 (14.1%) | 996 (69.1%) |
| 45 to 54 Years | 86 (8.9%) | 784 (81.0%) |
| 55 to 64 Years | 151 (12.8%) | 977 (82.7%) |
| 65 to 74 Years | 1,207 (98.2%) | 597 (48.6%) |
| 75 Years and over | 627 (97.2%) | 485 (75.2%) |
| Total | 3,262 (34.0%) | 6,534 (68.0%) |
Disability Status by Sex by Age in Grand County
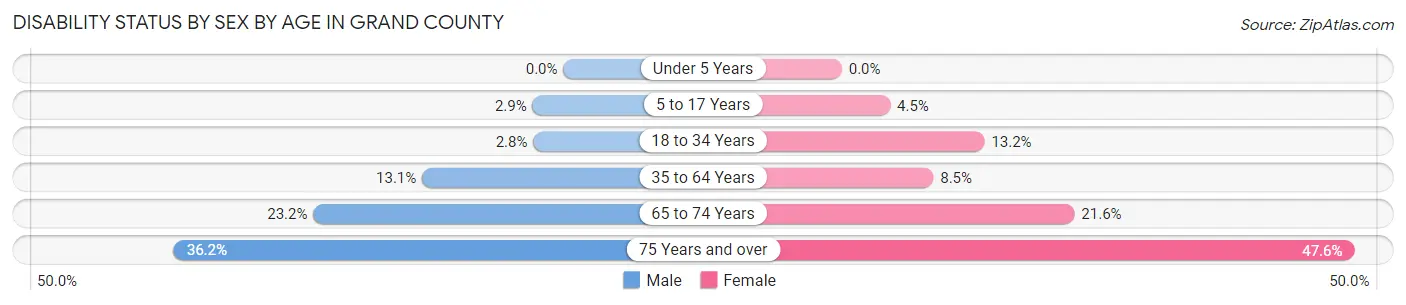
| Age Bracket | Male | Female |
| Under 5 Years | 0 (0.0%) | 0 (0.0%) |
| 5 to 17 Years | 21 (2.9%) | 29 (4.5%) |
| 18 to 34 Years | 34 (2.8%) | 152 (13.2%) |
| 35 to 64 Years | 242 (13.1%) | 148 (8.5%) |
| 65 to 74 Years | 139 (23.2%) | 136 (21.6%) |
| 75 Years and over | 107 (36.1%) | 166 (47.6%) |
Disability Class by Sex by Age in Grand County
Disability Class: Hearing Difficulty
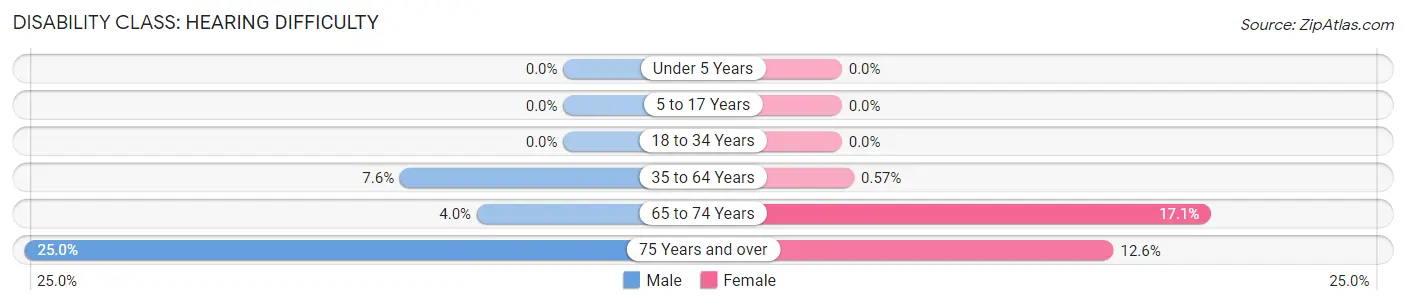
| Age Bracket | Male | Female |
| Under 5 Years | 0 (0.0%) | 0 (0.0%) |
| 5 to 17 Years | 0 (0.0%) | 0 (0.0%) |
| 18 to 34 Years | 0 (0.0%) | 0 (0.0%) |
| 35 to 64 Years | 140 (7.6%) | 10 (0.6%) |
| 65 to 74 Years | 24 (4.0%) | 108 (17.1%) |
| 75 Years and over | 74 (25.0%) | 44 (12.6%) |
Disability Class: Vision Difficulty
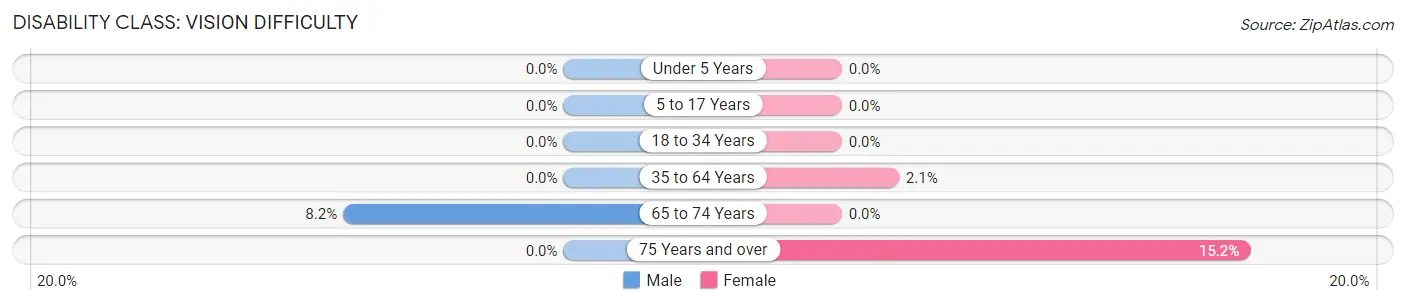
| Age Bracket | Male | Female |
| Under 5 Years | 0 (0.0%) | 0 (0.0%) |
| 5 to 17 Years | 0 (0.0%) | 0 (0.0%) |
| 18 to 34 Years | 0 (0.0%) | 0 (0.0%) |
| 35 to 64 Years | 0 (0.0%) | 37 (2.1%) |
| 65 to 74 Years | 49 (8.2%) | 0 (0.0%) |
| 75 Years and over | 0 (0.0%) | 53 (15.2%) |
Disability Class: Cognitive Difficulty
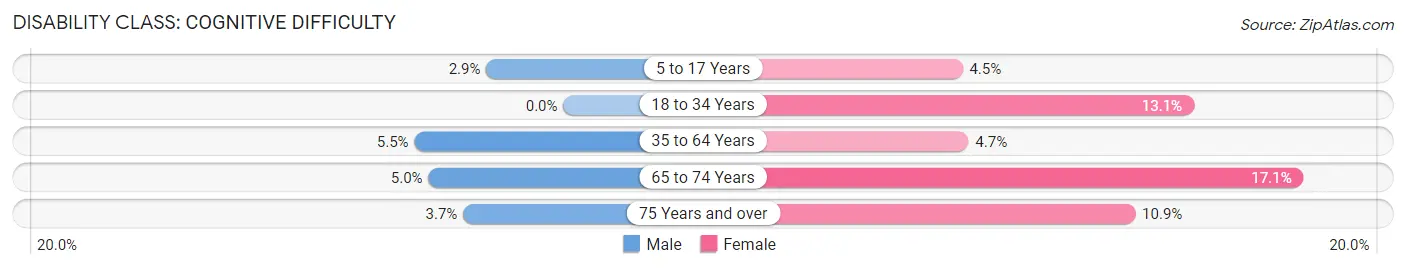
| Age Bracket | Male | Female |
| 5 to 17 Years | 21 (2.9%) | 29 (4.5%) |
| 18 to 34 Years | 0 (0.0%) | 150 (13.1%) |
| 35 to 64 Years | 102 (5.5%) | 82 (4.7%) |
| 65 to 74 Years | 30 (5.0%) | 108 (17.1%) |
| 75 Years and over | 11 (3.7%) | 38 (10.9%) |
Disability Class: Ambulatory Difficulty
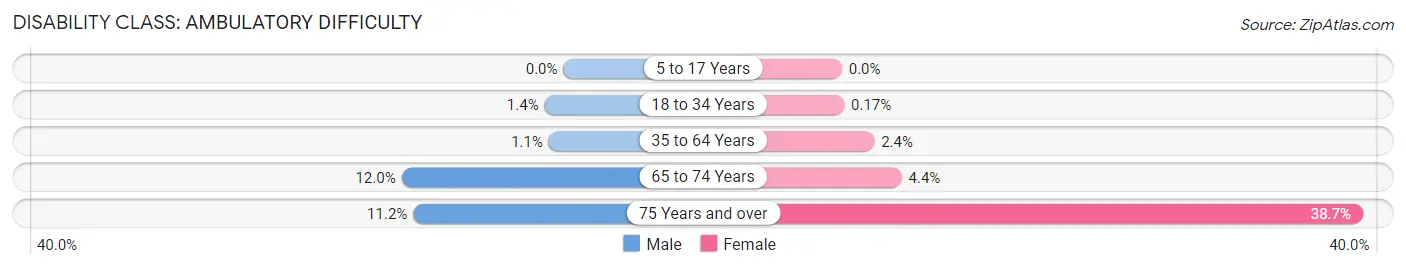
| Age Bracket | Male | Female |
| 5 to 17 Years | 0 (0.0%) | 0 (0.0%) |
| 18 to 34 Years | 17 (1.4%) | 2 (0.2%) |
| 35 to 64 Years | 20 (1.1%) | 42 (2.4%) |
| 65 to 74 Years | 72 (12.0%) | 28 (4.4%) |
| 75 Years and over | 33 (11.2%) | 135 (38.7%) |
Disability Class: Self-Care Difficulty
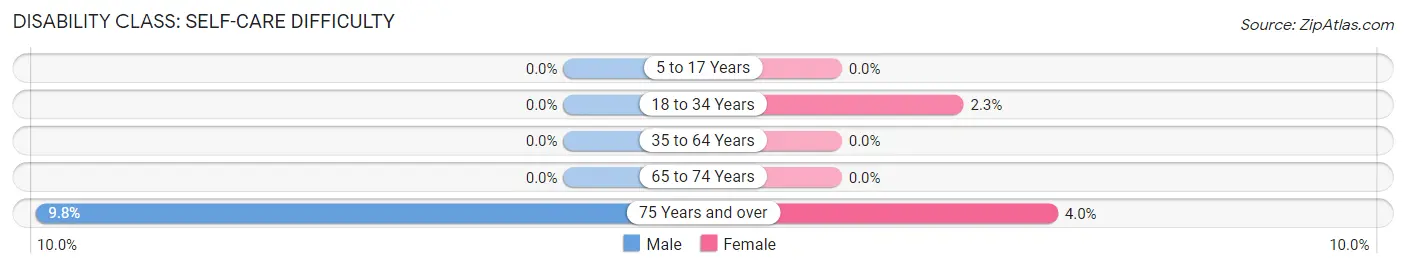
| Age Bracket | Male | Female |
| 5 to 17 Years | 0 (0.0%) | 0 (0.0%) |
| 18 to 34 Years | 0 (0.0%) | 26 (2.3%) |
| 35 to 64 Years | 0 (0.0%) | 0 (0.0%) |
| 65 to 74 Years | 0 (0.0%) | 0 (0.0%) |
| 75 Years and over | 29 (9.8%) | 14 (4.0%) |
Technology Access in Grand County
Computing Device Access in Grand County
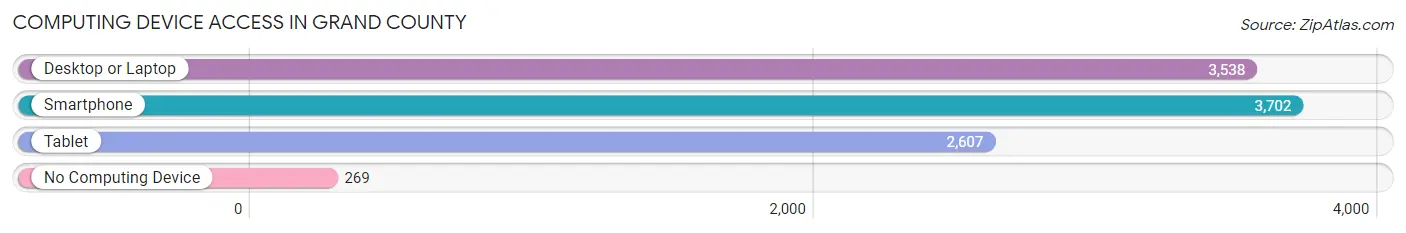
| Device Type | # Households | % Households |
| Desktop or Laptop | 3,538 | 81.6% |
| Smartphone | 3,702 | 85.4% |
| Tablet | 2,607 | 60.1% |
| No Computing Device | 269 | 6.2% |
| Total | 4,335 | 100.0% |
Internet Access in Grand County
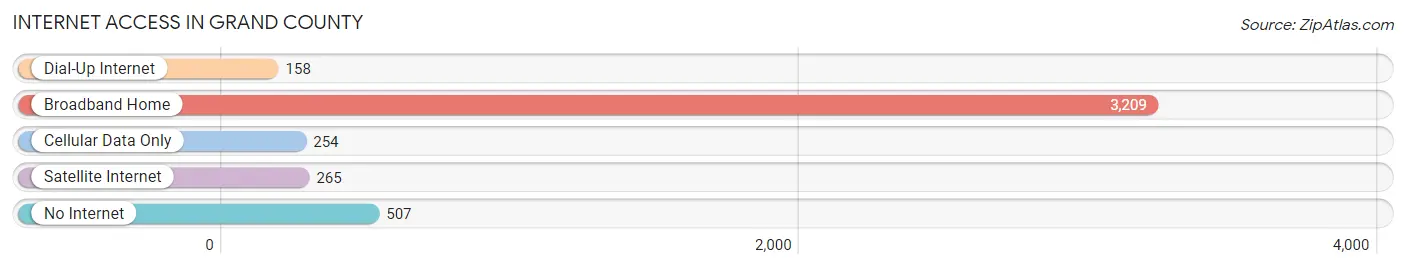
| Internet Type | # Households | % Households |
| Dial-Up Internet | 158 | 3.6% |
| Broadband Home | 3,209 | 74.0% |
| Cellular Data Only | 254 | 5.9% |
| Satellite Internet | 265 | 6.1% |
| No Internet | 507 | 11.7% |
| Total | 4,335 | 100.0% |
Grand County Summary
Geography
Grand County is located in the southeastern corner of Utah, and is bordered by San Juan County to the east, Emery County to the south, Carbon County to the west, and Uintah County to the north. The county covers an area of 4,890 square miles, making it the fourth largest county in the state. The county is home to the Colorado River, which forms its eastern border, and the Green River, which forms its western border. The county is also home to the Book Cliffs, a series of steep cliffs that run along the western edge of the county.
The county is divided into two distinct regions: the high desert plateau to the west and the rugged canyonlands to the east. The western region is characterized by flat, open terrain, while the eastern region is characterized by steep canyons and mesas. The highest point in the county is the La Sal Mountains, which rise to an elevation of 11,222 feet.
History
Grand County was established in 1892, and was named after the Grand River, which flows through the county. The county was originally inhabited by the Ute and Paiute tribes, who lived in the area for centuries before the arrival of European settlers.
The first European settlers arrived in the area in the late 1800s, and the county quickly became a popular destination for ranchers and miners. The county was also home to several small towns, including Moab, which was founded in 1883.
In the early 1900s, the county began to attract tourists, who were drawn to the area’s stunning scenery and outdoor recreation opportunities. The county was also home to several national parks, including Arches National Park, which was established in 1929.
Economy
Grand County’s economy is largely based on tourism, agriculture, and mining. The county is home to several national parks, including Arches National Park, Canyonlands National Park, and Dead Horse Point State Park, which attract millions of visitors each year.
Agriculture is also an important part of the county’s economy. The county is home to several large farms, which produce a variety of crops, including hay, alfalfa, and wheat.
Mining is also an important part of the county’s economy. The county is home to several large mines, which produce a variety of minerals, including uranium, copper, and gold.
Demographics
As of the 2010 census, Grand County had a population of 9,225. The county’s population is largely white (86.3%), with smaller percentages of Native American (3.2%), Hispanic (3.1%), and African American (1.2%) residents. The median household income in the county is $45,845, and the median home value is $179,400.
Common Questions
What is the Total Population of Grand County?
Total Population of Grand County is 9,680.
What is the Total Male Population of Grand County?
Total Male Population of Grand County is 4,947.
What is the Total Female Population of Grand County?
Total Female Population of Grand County is 4,733.
What is the Ratio of Males per 100 Females in Grand County?
There are 104.52 Males per 100 Females in Grand County.
What is the Ratio of Females per 100 Males in Grand County?
There are 95.67 Females per 100 Males in Grand County.
What is the Median Population Age in Grand County?
Median Population Age in Grand County is 40.3 Years.
What is the Average Family Size in Grand County
Average Family Size in Grand County is 2.7 People.
What is the Average Household Size in Grand County
Average Household Size in Grand County is 2.2 People.
What is Per Capita Income in Grand County?
Per Capita income in Grand County is $37,510.
What is the Median Family Income in Grand County?
Median Family Income in Grand County is $75,333.
What is the Median Household income in Grand County?
Median Household Income in Grand County is $59,171.
What is Income or Wage Gap in Grand County?
Income or Wage Gap in Grand County is 31.7%.
Women in Grand County earn 68.3 cents for every dollar earned by a man.
What is Inequality or Gini Index in Grand County?
Inequality or Gini Index in Grand County is 0.46.
How Large is the Labor Force in Grand County?
There are 5,760 People in the Labor Forcein in Grand County.
What is the Percentage of People in the Labor Force in Grand County?
71.0% of People are in the Labor Force in Grand County.
What is the Unemployment Rate in Grand County?
Unemployment Rate in Grand County is 1.2%.