Garfield County, UT
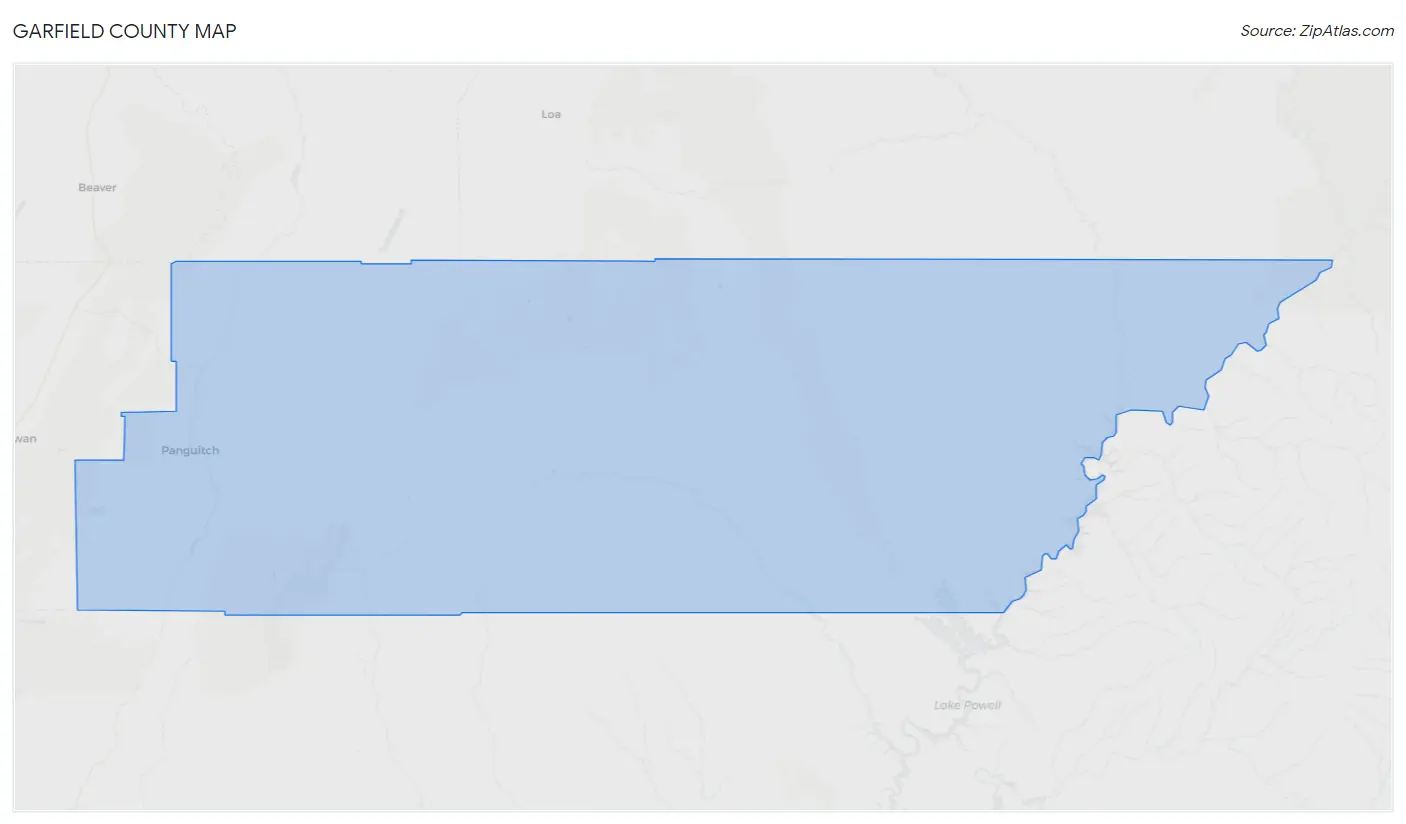
Garfield County Map
Garfield County Overview
5,121
TOTAL POPULATION
2,635
MALE POPULATION
2,486
FEMALE POPULATION
105.99
MALES / 100 FEMALES
94.35
FEMALES / 100 MALES
40.4
MEDIAN AGE
3.0
AVG FAMILY SIZE
2.5
AVG HOUSEHOLD SIZE
$29,240
PER CAPITA INCOME
$72,930
AVG FAMILY INCOME
$56,481
AVG HOUSEHOLD INCOME
22.9%
WAGE / INCOME GAP [ % ]
77.1¢/ $1
WAGE / INCOME GAP [ $ ]
0.43
INEQUALITY / GINI INDEX
2,443
LABOR FORCE [ PEOPLE ]
59.3%
PERCENT IN LABOR FORCE
4.4%
UNEMPLOYMENT RATE
Garfield County Area Codes
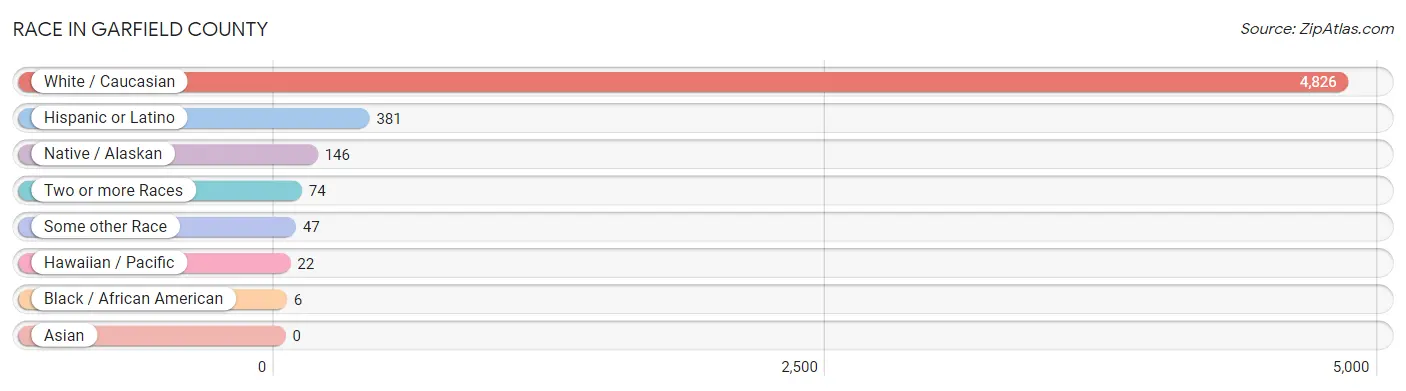
Race in Garfield County
The most populous races in Garfield County are White / Caucasian (4,826 | 94.2%), Hispanic or Latino (381 | 7.4%), and Native / Alaskan (146 | 2.9%).
| Race | # Population | % Population |
| Asian | 0 | 0.0% |
| Black / African American | 6 | 0.1% |
| Hawaiian / Pacific | 22 | 0.4% |
| Hispanic or Latino | 381 | 7.4% |
| Native / Alaskan | 146 | 2.9% |
| White / Caucasian | 4,826 | 94.2% |
| Two or more Races | 74 | 1.5% |
| Some other Race | 47 | 0.9% |
| Total | 5,121 | 100.0% |
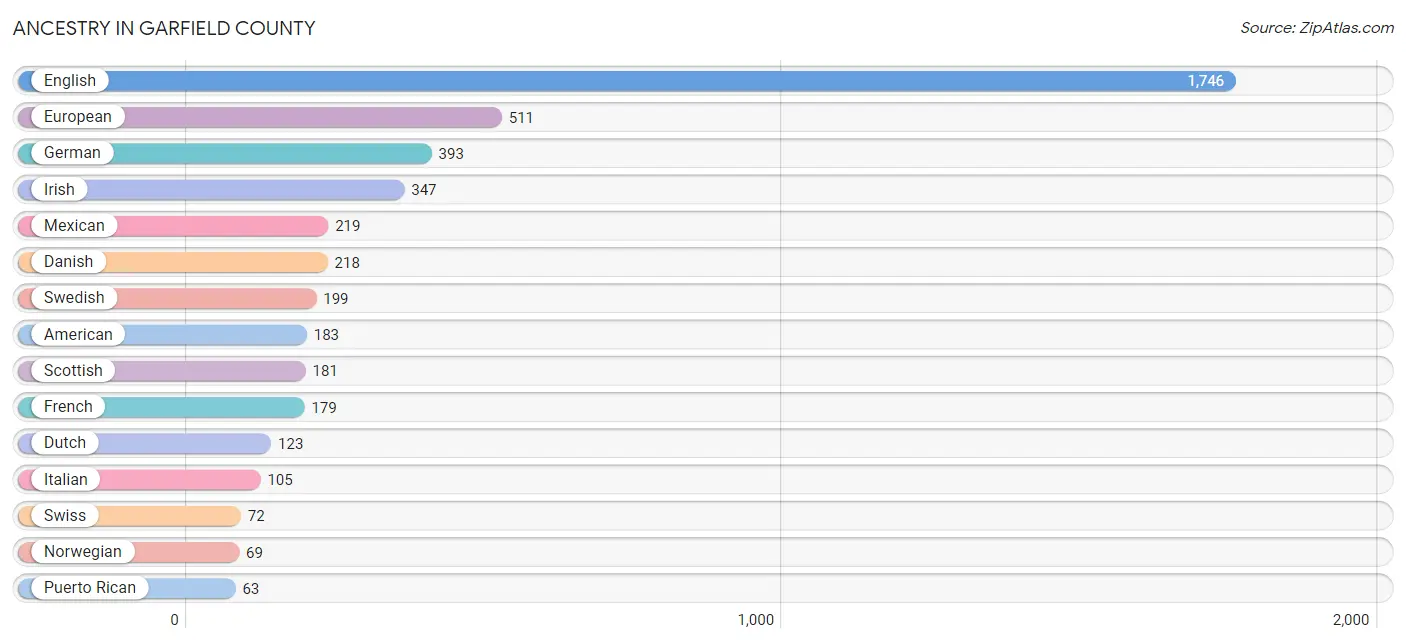
Ancestry in Garfield County
The most populous ancestries reported in Garfield County are English (1,746 | 34.1%), European (511 | 10.0%), German (393 | 7.7%), Irish (347 | 6.8%), and Mexican (219 | 4.3%), together accounting for 62.8% of all Garfield County residents.
| Ancestry | # Population | % Population |
| African | 1 | 0.0% |
| American | 183 | 3.6% |
| British | 22 | 0.4% |
| Bulgarian | 6 | 0.1% |
| Cajun | 7 | 0.1% |
| Central American | 4 | 0.1% |
| Cuban | 52 | 1.0% |
| Danish | 218 | 4.3% |
| Dutch | 123 | 2.4% |
| Eastern European | 3 | 0.1% |
| English | 1,746 | 34.1% |
| European | 511 | 10.0% |
| French | 179 | 3.5% |
| German | 393 | 7.7% |
| Guatemalan | 4 | 0.1% |
| Icelander | 49 | 1.0% |
| Indian (Asian) | 7 | 0.1% |
| Irish | 347 | 6.8% |
| Italian | 105 | 2.1% |
| Luxembourger | 4 | 0.1% |
| Mexican | 219 | 4.3% |
| Native Hawaiian | 7 | 0.1% |
| Navajo | 40 | 0.8% |
| Northern European | 21 | 0.4% |
| Norwegian | 69 | 1.3% |
| Peruvian | 2 | 0.0% |
| Polish | 4 | 0.1% |
| Portuguese | 14 | 0.3% |
| Puerto Rican | 63 | 1.2% |
| Russian | 9 | 0.2% |
| Samoan | 19 | 0.4% |
| Scandinavian | 26 | 0.5% |
| Scotch-Irish | 42 | 0.8% |
| Scottish | 181 | 3.5% |
| Slovene | 18 | 0.4% |
| South American | 2 | 0.0% |
| Spaniard | 8 | 0.2% |
| Subsaharan African | 1 | 0.0% |
| Swedish | 199 | 3.9% |
| Swiss | 72 | 1.4% |
| Tlingit-Haida | 8 | 0.2% |
| Tongan | 12 | 0.2% |
| Ukrainian | 6 | 0.1% |
| Welsh | 53 | 1.0% | View All 44 Rows |
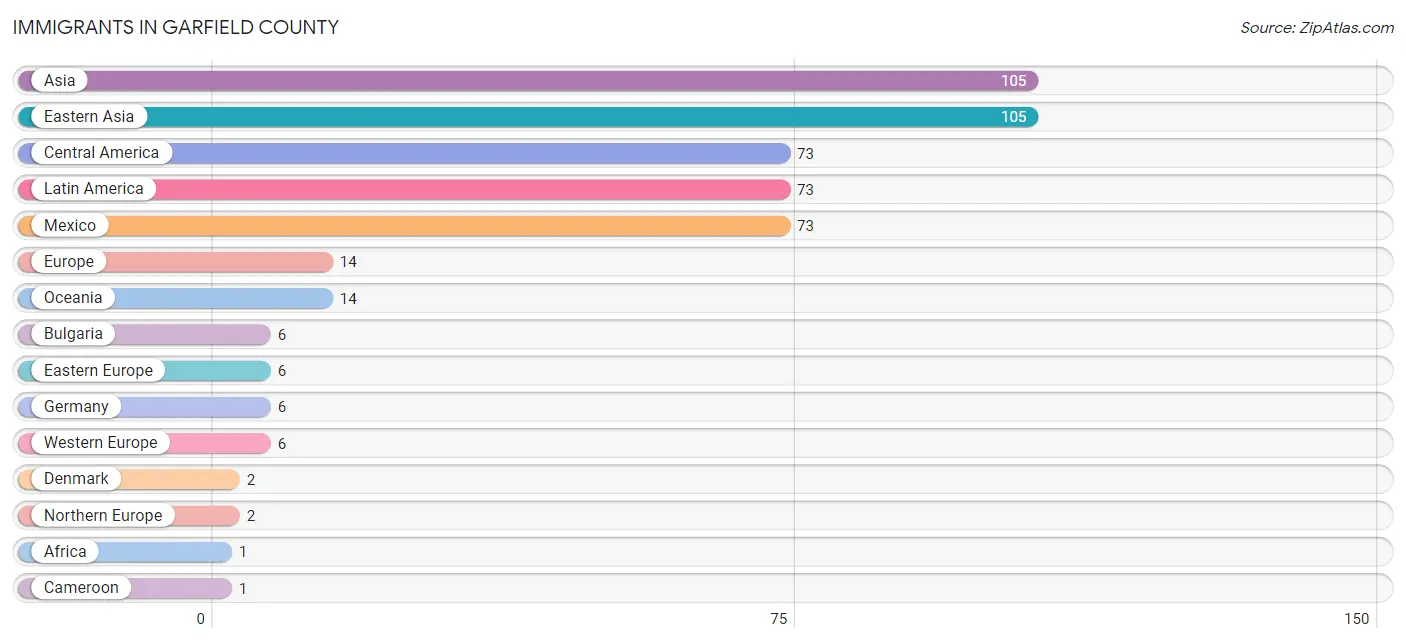
Immigrants in Garfield County
The most numerous immigrant groups reported in Garfield County came from Asia (105 | 2.1%), Eastern Asia (105 | 2.1%), Central America (73 | 1.4%), Latin America (73 | 1.4%), and Mexico (73 | 1.4%), together accounting for 8.4% of all Garfield County residents.
| Immigration Origin | # Population | % Population |
| Africa | 1 | 0.0% |
| Asia | 105 | 2.1% |
| Bulgaria | 6 | 0.1% |
| Cameroon | 1 | 0.0% |
| Canada | 1 | 0.0% |
| Central America | 73 | 1.4% |
| Denmark | 2 | 0.0% |
| Eastern Asia | 105 | 2.1% |
| Eastern Europe | 6 | 0.1% |
| Europe | 14 | 0.3% |
| Germany | 6 | 0.1% |
| Latin America | 73 | 1.4% |
| Mexico | 73 | 1.4% |
| Middle Africa | 1 | 0.0% |
| Northern Europe | 2 | 0.0% |
| Oceania | 14 | 0.3% |
| Western Europe | 6 | 0.1% | View All 17 Rows |
Sex and Age in Garfield County
Sex and Age in Garfield County
The most populous age groups in Garfield County are 30 to 34 Years (263 | 10.0%) for men and 65 to 69 Years (216 | 8.7%) for women.
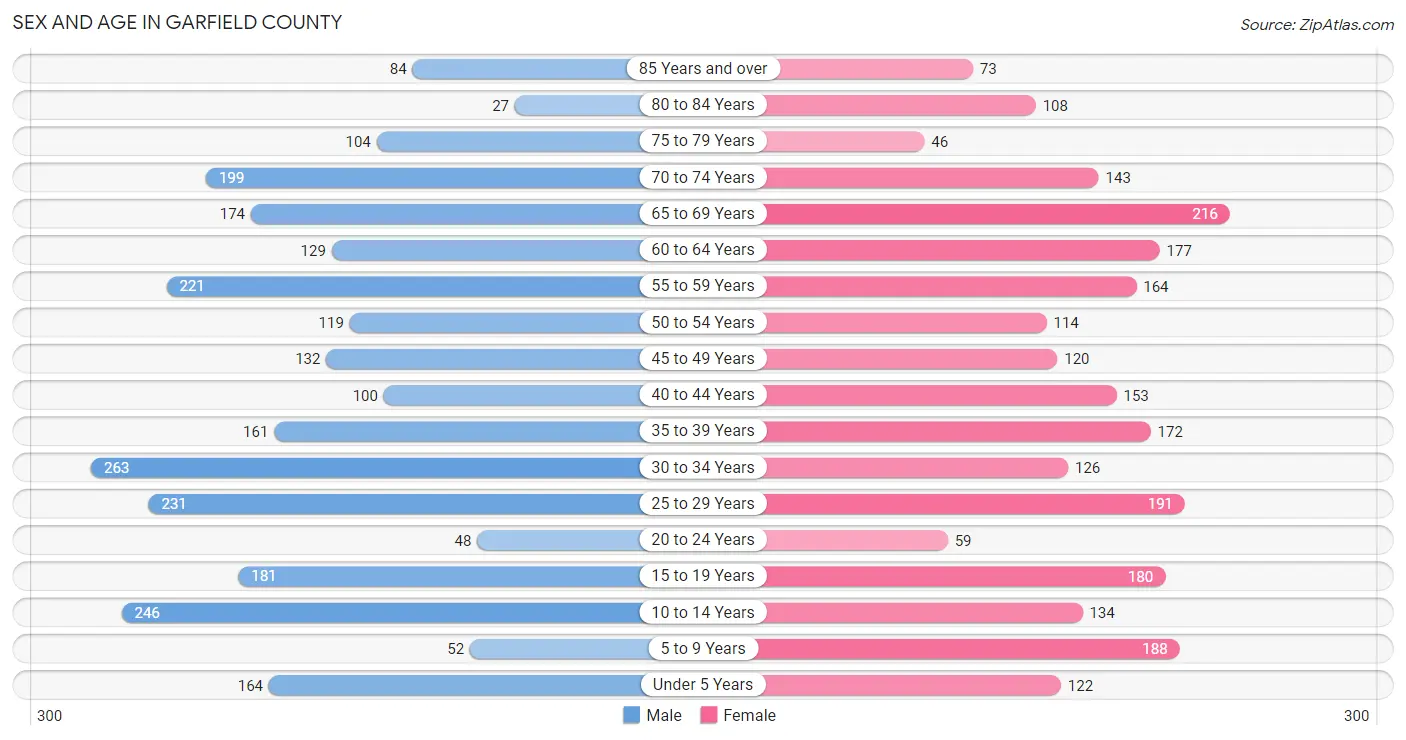
| Age Bracket | Male | Female |
| Under 5 Years | 164 (6.2%) | 122 (4.9%) |
| 5 to 9 Years | 52 (2.0%) | 188 (7.6%) |
| 10 to 14 Years | 246 (9.3%) | 134 (5.4%) |
| 15 to 19 Years | 181 (6.9%) | 180 (7.2%) |
| 20 to 24 Years | 48 (1.8%) | 59 (2.4%) |
| 25 to 29 Years | 231 (8.8%) | 191 (7.7%) |
| 30 to 34 Years | 263 (10.0%) | 126 (5.1%) |
| 35 to 39 Years | 161 (6.1%) | 172 (6.9%) |
| 40 to 44 Years | 100 (3.8%) | 153 (6.1%) |
| 45 to 49 Years | 132 (5.0%) | 120 (4.8%) |
| 50 to 54 Years | 119 (4.5%) | 114 (4.6%) |
| 55 to 59 Years | 221 (8.4%) | 164 (6.6%) |
| 60 to 64 Years | 129 (4.9%) | 177 (7.1%) |
| 65 to 69 Years | 174 (6.6%) | 216 (8.7%) |
| 70 to 74 Years | 199 (7.5%) | 143 (5.8%) |
| 75 to 79 Years | 104 (4.0%) | 46 (1.8%) |
| 80 to 84 Years | 27 (1.0%) | 108 (4.3%) |
| 85 Years and over | 84 (3.2%) | 73 (2.9%) |
| Total | 2,635 (100.0%) | 2,486 (100.0%) |
Families and Households in Garfield County
Median Family Size in Garfield County
The median family size in Garfield County is 2.98 persons per family, with single male/father families (69 | 5.0%) accounting for the largest median family size of 3.3 persons per family. On the other hand, married-couple families (1,166 | 85.2%) represent the smallest median family size with 2.92 persons per family.
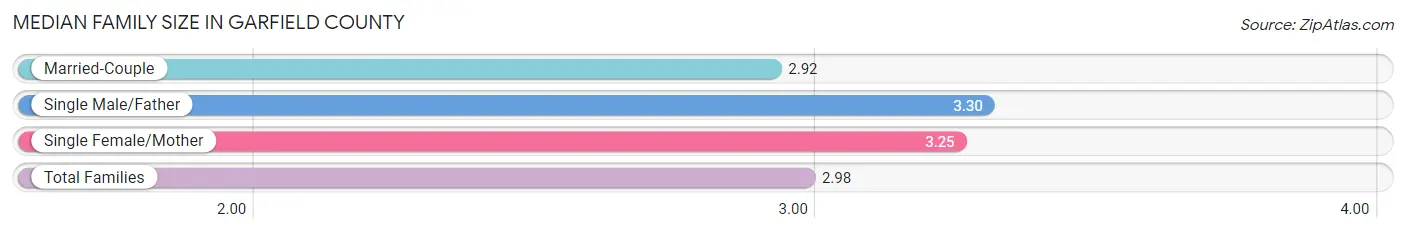
| Family Type | # Families | Family Size |
| Married-Couple | 1,166 (85.2%) | 2.92 |
| Single Male/Father | 69 (5.0%) | 3.30 |
| Single Female/Mother | 134 (9.8%) | 3.25 |
| Total Families | 1,369 (100.0%) | 2.98 |
Median Household Size in Garfield County
The median household size in Garfield County is 2.46 persons per household, with single female/mother households (134 | 6.9%) accounting for the largest median household size of 3.58 persons per household. non-family households (583 | 29.9%) represent the smallest median household size with 1.13 persons per household.
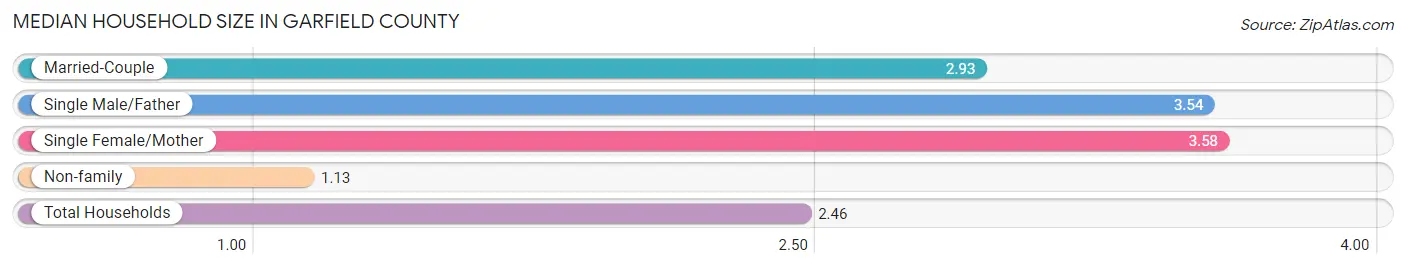
| Household Type | # Households | Household Size |
| Married-Couple | 1,166 (59.7%) | 2.93 |
| Single Male/Father | 69 (3.5%) | 3.54 |
| Single Female/Mother | 134 (6.9%) | 3.58 |
| Non-family | 583 (29.9%) | 1.13 |
| Total Households | 1,952 (100.0%) | 2.46 |
Household Size by Marriage Status in Garfield County
Out of a total of 1,952 households in Garfield County, 1,369 (70.1%) are family households, while 583 (29.9%) are nonfamily households. The most numerous type of family households are 2-person households, comprising 765, and the most common type of nonfamily households are 1-person households, comprising 482.
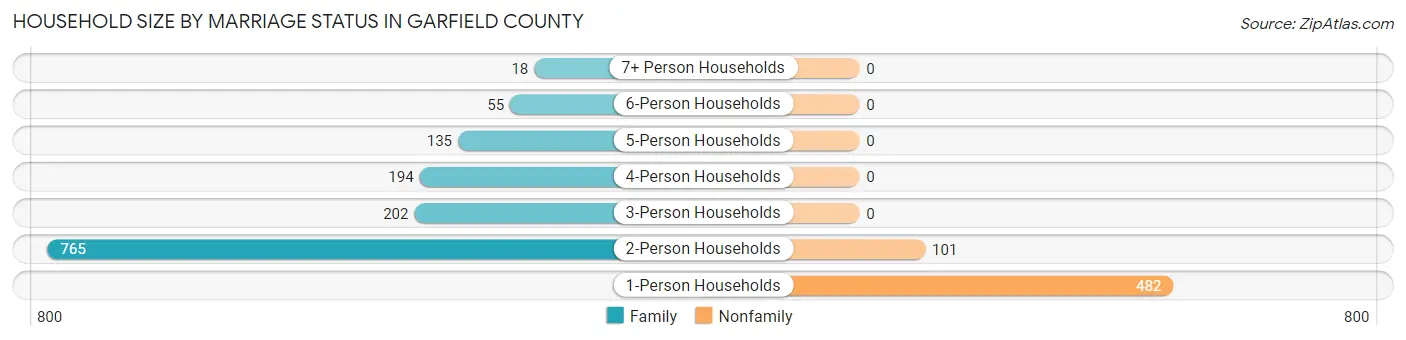
| Household Size | Family Households | Nonfamily Households |
| 1-Person Households | - | 482 (24.7%) |
| 2-Person Households | 765 (39.2%) | 101 (5.2%) |
| 3-Person Households | 202 (10.3%) | 0 (0.0%) |
| 4-Person Households | 194 (9.9%) | 0 (0.0%) |
| 5-Person Households | 135 (6.9%) | 0 (0.0%) |
| 6-Person Households | 55 (2.8%) | 0 (0.0%) |
| 7+ Person Households | 18 (0.9%) | 0 (0.0%) |
| Total | 1,369 (70.1%) | 583 (29.9%) |
Female Fertility in Garfield County
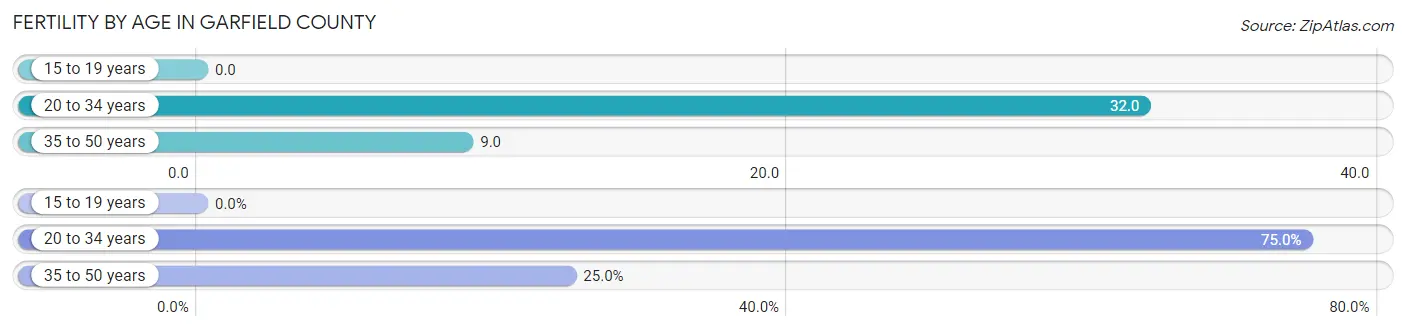
Fertility by Age in Garfield County
Average fertility rate in Garfield County is 16.0 births per 1,000 women. Women in the age bracket of 20 to 34 years have the highest fertility rate with 32.0 births per 1,000 women. Women in the age bracket of 20 to 34 years acount for 75.0% of all women with births.
| Age Bracket | Women with Births | Births / 1,000 Women |
| 15 to 19 years | 0 (0.0%) | 0.0 |
| 20 to 34 years | 12 (75.0%) | 32.0 |
| 35 to 50 years | 4 (25.0%) | 9.0 |
| Total | 16 (100.0%) | 16.0 |
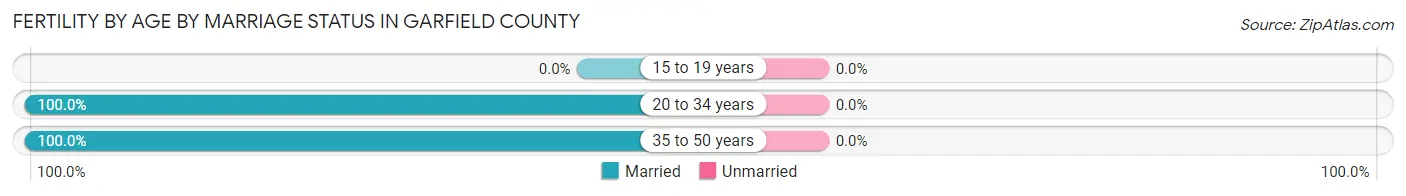
Fertility by Age by Marriage Status in Garfield County
| Age Bracket | Married | Unmarried |
| 15 to 19 years | 0 (0.0%) | 0 (0.0%) |
| 20 to 34 years | 12 (100.0%) | 0 (0.0%) |
| 35 to 50 years | 4 (100.0%) | 0 (0.0%) |
| Total | 16 (100.0%) | 0 (0.0%) |
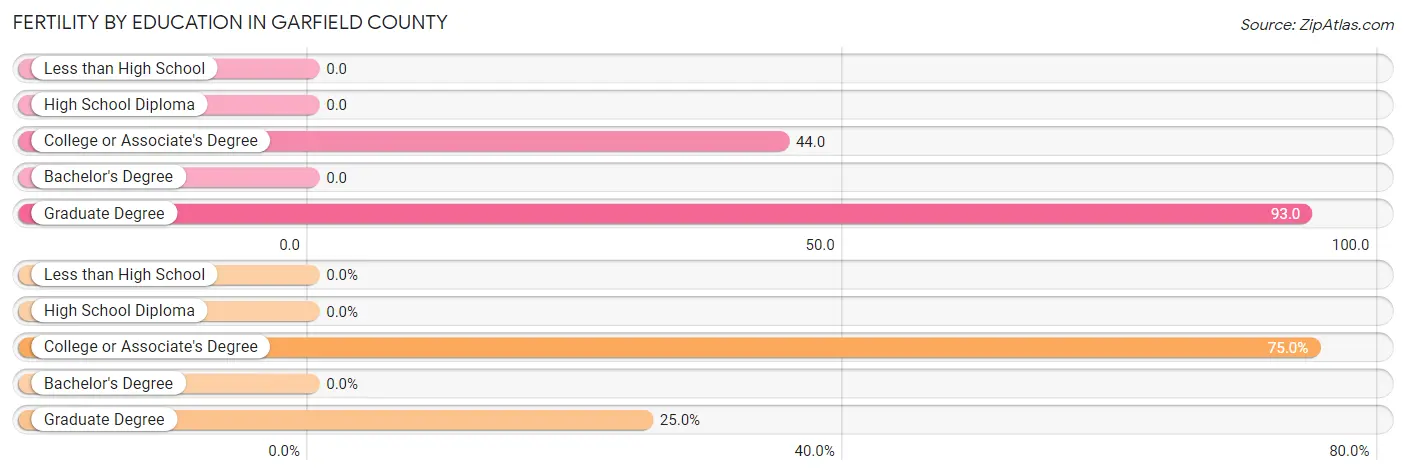
Fertility by Education in Garfield County
| Educational Attainment | Women with Births | Births / 1,000 Women |
| Less than High School | 0 (0.0%) | 0.0 |
| High School Diploma | 0 (0.0%) | 0.0 |
| College or Associate's Degree | 12 (75.0%) | 44.0 |
| Bachelor's Degree | 0 (0.0%) | 0.0 |
| Graduate Degree | 4 (25.0%) | 93.0 |
| Total | 16 (100.0%) | 16.0 |
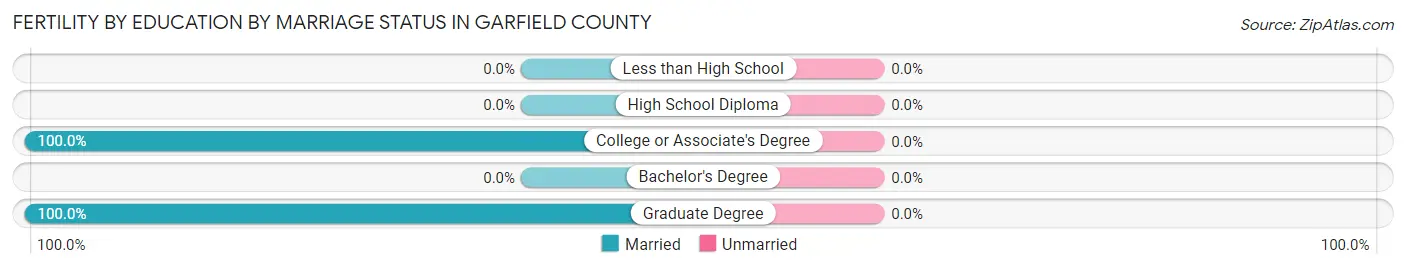
Fertility by Education by Marriage Status in Garfield County
| Educational Attainment | Married | Unmarried |
| Less than High School | 0 (0.0%) | 0 (0.0%) |
| High School Diploma | 0 (0.0%) | 0 (0.0%) |
| College or Associate's Degree | 12 (100.0%) | 0 (0.0%) |
| Bachelor's Degree | 0 (0.0%) | 0 (0.0%) |
| Graduate Degree | 4 (100.0%) | 0 (0.0%) |
| Total | 16 (100.0%) | 0 (0.0%) |
Income in Garfield County
Income Overview in Garfield County
Per Capita Income in Garfield County is $29,240, while median incomes of families and households are $72,930 and $56,481 respectively.
| Characteristic | Number | Measure |
| Per Capita Income | 5,121 | $29,240 |
| Median Family Income | 1,369 | $72,930 |
| Mean Family Income | 1,369 | $87,099 |
| Median Household Income | 1,952 | $56,481 |
| Mean Household Income | 1,952 | $72,278 |
| Income Deficit | 1,369 | $0 |
| Wage / Income Gap (%) | 5,121 | 22.90% |
| Wage / Income Gap ($) | 5,121 | 77.10¢ per $1 |
| Gini / Inequality Index | 5,121 | 0.43 |
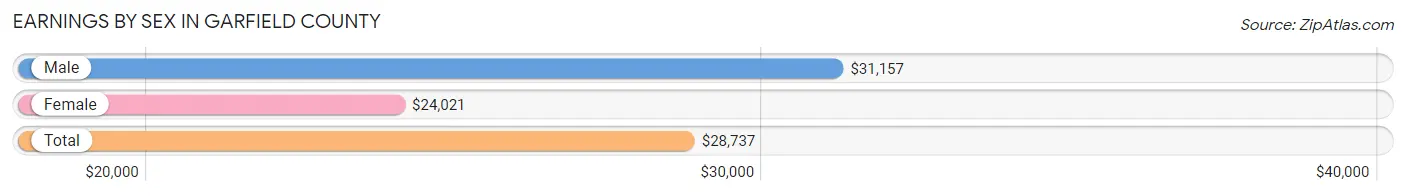
Earnings by Sex in Garfield County
Average Earnings in Garfield County are $28,737, $31,157 for men and $24,021 for women, a difference of 22.9%.
| Sex | Number | Average Earnings |
| Male | 1,481 (53.8%) | $31,157 |
| Female | 1,273 (46.2%) | $24,021 |
| Total | 2,754 (100.0%) | $28,737 |
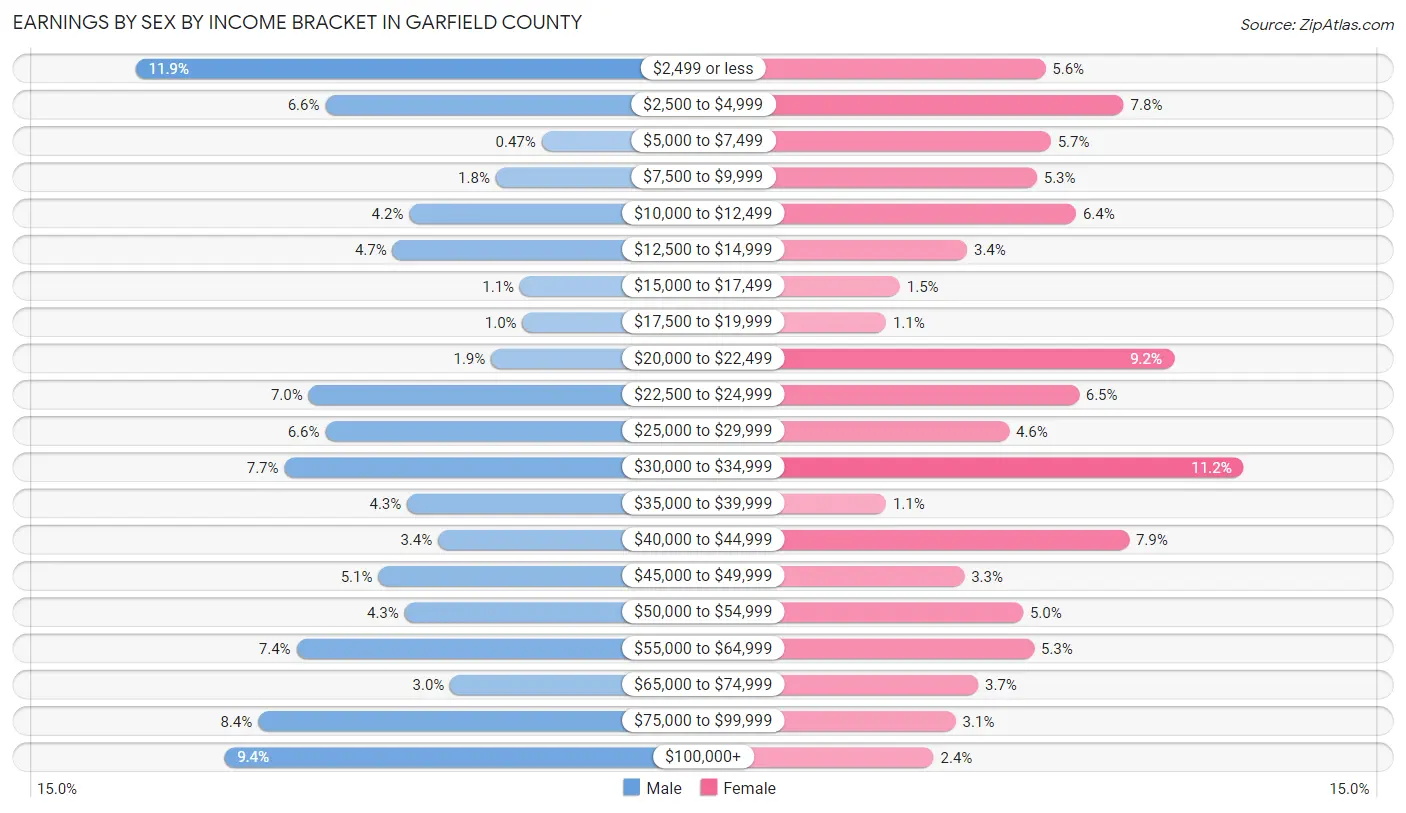
Earnings by Sex by Income Bracket in Garfield County
The most common earnings brackets in Garfield County are $2,499 or less for men (176 | 11.9%) and $30,000 to $34,999 for women (142 | 11.2%).
| Income | Male | Female |
| $2,499 or less | 176 (11.9%) | 71 (5.6%) |
| $2,500 to $4,999 | 97 (6.6%) | 99 (7.8%) |
| $5,000 to $7,499 | 7 (0.5%) | 73 (5.7%) |
| $7,500 to $9,999 | 26 (1.8%) | 68 (5.3%) |
| $10,000 to $12,499 | 62 (4.2%) | 82 (6.4%) |
| $12,500 to $14,999 | 69 (4.7%) | 43 (3.4%) |
| $15,000 to $17,499 | 16 (1.1%) | 19 (1.5%) |
| $17,500 to $19,999 | 15 (1.0%) | 14 (1.1%) |
| $20,000 to $22,499 | 28 (1.9%) | 117 (9.2%) |
| $22,500 to $24,999 | 104 (7.0%) | 83 (6.5%) |
| $25,000 to $29,999 | 97 (6.6%) | 58 (4.6%) |
| $30,000 to $34,999 | 114 (7.7%) | 142 (11.2%) |
| $35,000 to $39,999 | 63 (4.3%) | 14 (1.1%) |
| $40,000 to $44,999 | 50 (3.4%) | 101 (7.9%) |
| $45,000 to $49,999 | 75 (5.1%) | 42 (3.3%) |
| $50,000 to $54,999 | 64 (4.3%) | 63 (5.0%) |
| $55,000 to $64,999 | 109 (7.4%) | 67 (5.3%) |
| $65,000 to $74,999 | 45 (3.0%) | 47 (3.7%) |
| $75,000 to $99,999 | 125 (8.4%) | 39 (3.1%) |
| $100,000+ | 139 (9.4%) | 31 (2.4%) |
| Total | 1,481 (100.0%) | 1,273 (100.0%) |
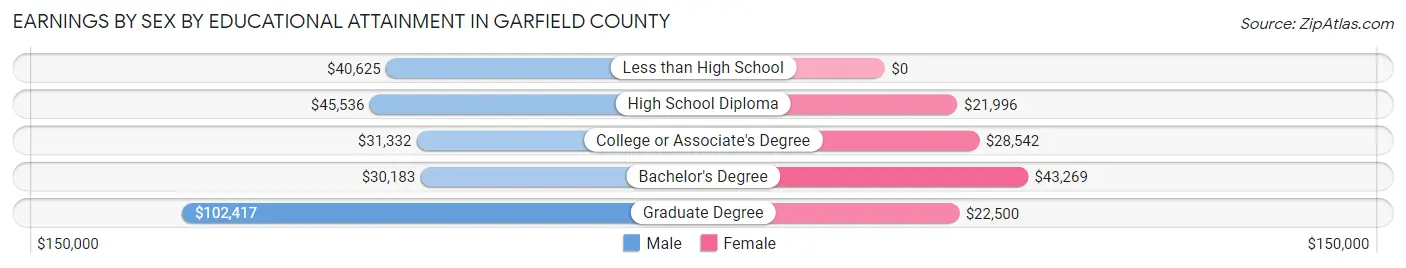
Earnings by Sex by Educational Attainment in Garfield County
Average earnings in Garfield County are $35,938 for men and $26,856 for women, a difference of 25.3%. Men with an educational attainment of graduate degree enjoy the highest average annual earnings of $102,417, while those with bachelor's degree education earn the least with $30,183. Women with an educational attainment of bachelor's degree earn the most with the average annual earnings of $43,269, while those with high school diploma education have the smallest earnings of $21,996.
| Educational Attainment | Male Income | Female Income |
| Less than High School | $40,625 | $0 |
| High School Diploma | $45,536 | $21,996 |
| College or Associate's Degree | $31,332 | $28,542 |
| Bachelor's Degree | $30,183 | $43,269 |
| Graduate Degree | $102,417 | $22,500 |
| Total | $35,938 | $26,856 |
Family Income in Garfield County
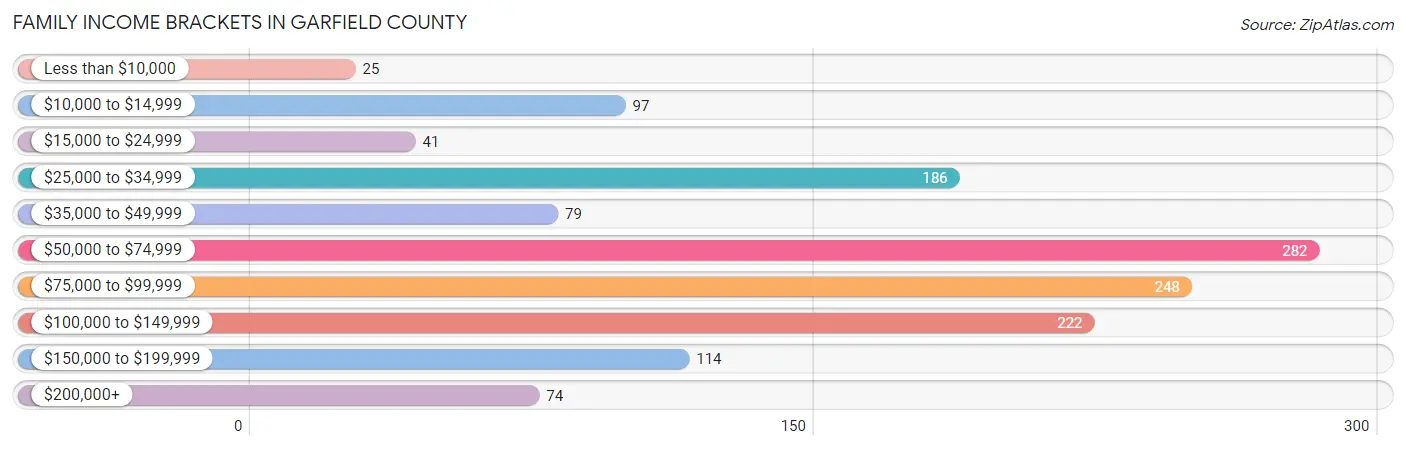
Family Income Brackets in Garfield County
According to the Garfield County family income data, there are 282 families falling into the $50,000 to $74,999 income range, which is the most common income bracket and makes up 20.6% of all families. Conversely, the less than $10,000 income bracket is the least frequent group with only 25 families (1.8%) belonging to this category.
| Income Bracket | # Families | % Families |
| Less than $10,000 | 25 | 1.8% |
| $10,000 to $14,999 | 97 | 7.1% |
| $15,000 to $24,999 | 41 | 3.0% |
| $25,000 to $34,999 | 186 | 13.6% |
| $35,000 to $49,999 | 79 | 5.8% |
| $50,000 to $74,999 | 282 | 20.6% |
| $75,000 to $99,999 | 248 | 18.1% |
| $100,000 to $149,999 | 222 | 16.2% |
| $150,000 to $199,999 | 114 | 8.3% |
| $200,000+ | 74 | 5.4% |
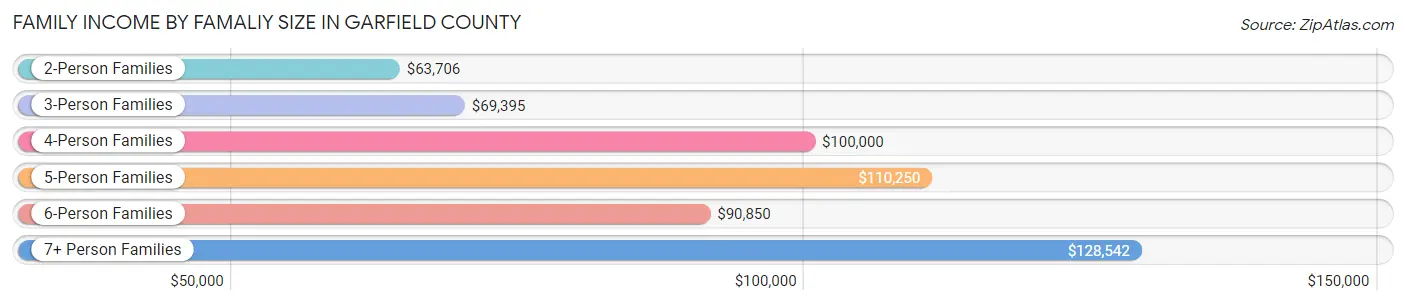
Family Income by Famaliy Size in Garfield County
7+ person families (18 | 1.3%) account for the highest median family income in Garfield County with $128,542 per family, while 2-person families (788 | 57.6%) have the highest median income of $31,853 per family member.
| Income Bracket | # Families | Median Income |
| 2-Person Families | 788 (57.6%) | $63,706 |
| 3-Person Families | 215 (15.7%) | $69,395 |
| 4-Person Families | 158 (11.5%) | $100,000 |
| 5-Person Families | 135 (9.9%) | $110,250 |
| 6-Person Families | 55 (4.0%) | $90,850 |
| 7+ Person Families | 18 (1.3%) | $128,542 |
| Total | 1,369 (100.0%) | $72,930 |
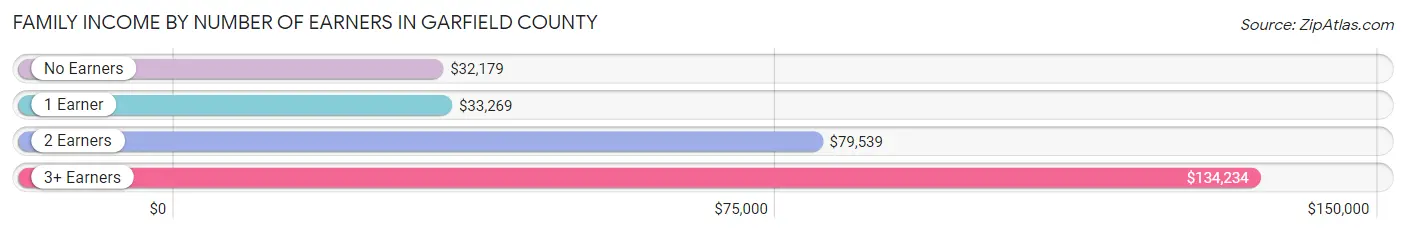
Family Income by Number of Earners in Garfield County
The median family income in Garfield County is $72,930, with families comprising 3+ earners (139) having the highest median family income of $134,234, while families with no earners (263) have the lowest median family income of $32,179, accounting for 10.2% and 19.2% of families, respectively.
| Number of Earners | # Families | Median Income |
| No Earners | 263 (19.2%) | $32,179 |
| 1 Earner | 280 (20.4%) | $33,269 |
| 2 Earners | 687 (50.2%) | $79,539 |
| 3+ Earners | 139 (10.2%) | $134,234 |
| Total | 1,369 (100.0%) | $72,930 |
Household Income in Garfield County
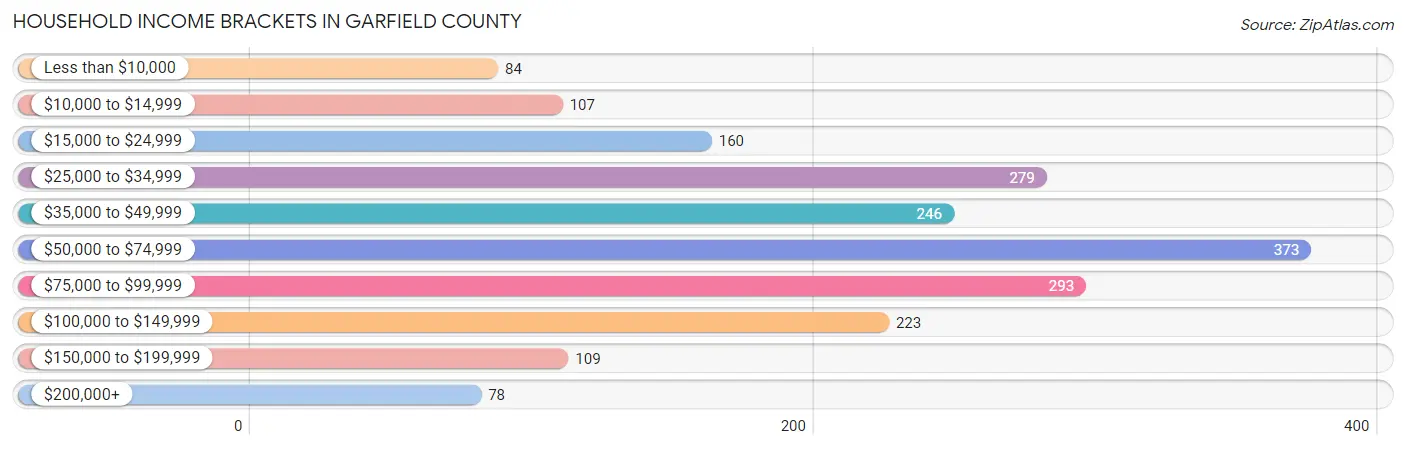
Household Income Brackets in Garfield County
With 373 households falling in the category, the $50,000 to $74,999 income range is the most frequent in Garfield County, accounting for 19.1% of all households. In contrast, only 78 households (4.0%) fall into the $200,000+ income bracket, making it the least populous group.
| Income Bracket | # Households | % Households |
| Less than $10,000 | 84 | 4.3% |
| $10,000 to $14,999 | 107 | 5.5% |
| $15,000 to $24,999 | 160 | 8.2% |
| $25,000 to $34,999 | 279 | 14.3% |
| $35,000 to $49,999 | 246 | 12.6% |
| $50,000 to $74,999 | 373 | 19.1% |
| $75,000 to $99,999 | 293 | 15.0% |
| $100,000 to $149,999 | 223 | 11.4% |
| $150,000 to $199,999 | 109 | 5.6% |
| $200,000+ | 78 | 4.0% |
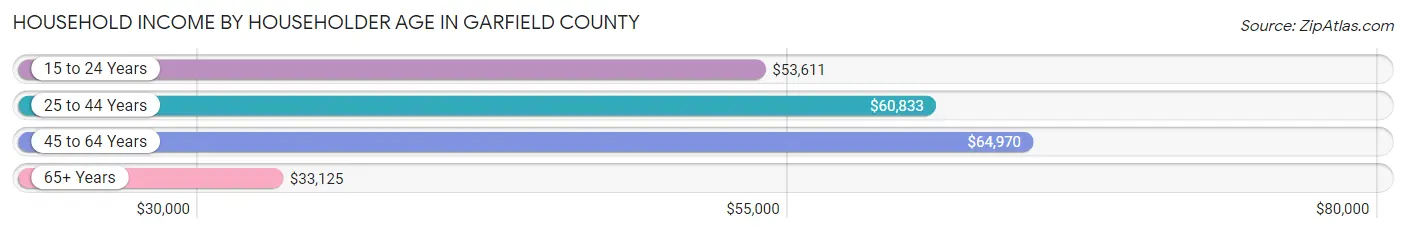
Household Income by Householder Age in Garfield County
The median household income in Garfield County is $56,481, with the highest median household income of $64,970 found in the 45 to 64 years age bracket for the primary householder. A total of 641 households (32.8%) fall into this category. Meanwhile, the 65+ years age bracket for the primary householder has the lowest median household income of $33,125, with 711 households (36.4%) in this group.
| Income Bracket | # Households | Median Income |
| 15 to 24 Years | 28 (1.4%) | $53,611 |
| 25 to 44 Years | 572 (29.3%) | $60,833 |
| 45 to 64 Years | 641 (32.8%) | $64,970 |
| 65+ Years | 711 (36.4%) | $33,125 |
| Total | 1,952 (100.0%) | $56,481 |
Poverty in Garfield County
Income Below Poverty by Sex and Age in Garfield County
With 20.1% poverty level for males and 11.6% for females among the residents of Garfield County, 25 to 34 year old males and under 5 year old females are the most vulnerable to poverty, with 192 males (44.1%) and 49 females (40.2%) in their respective age groups living below the poverty level.
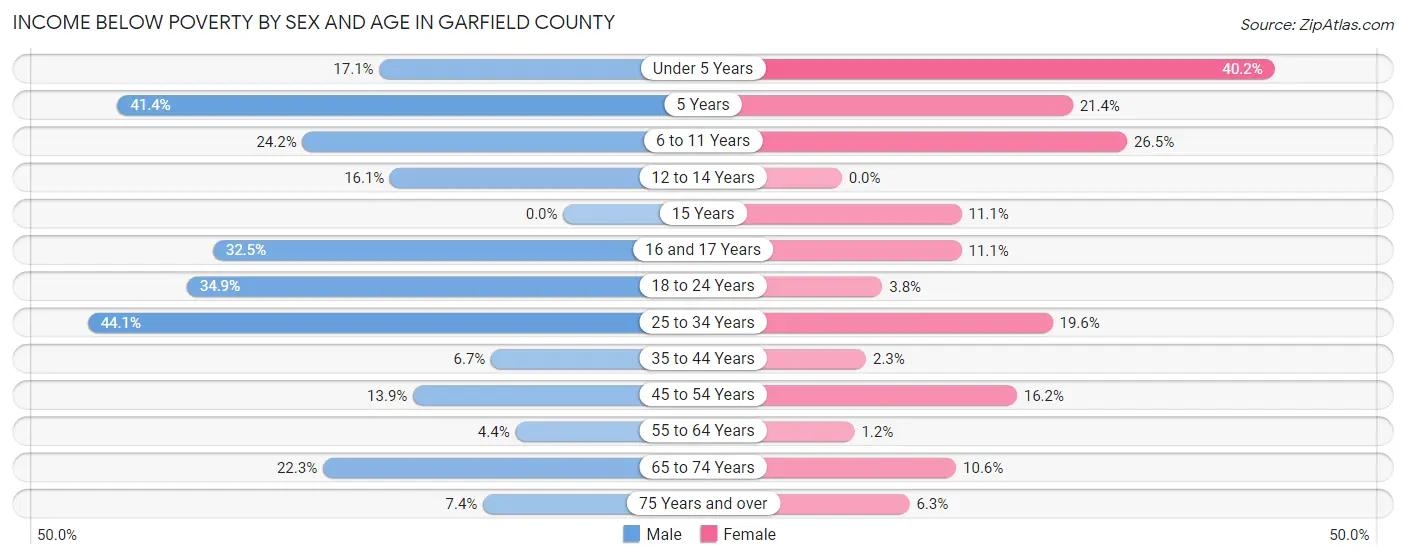
| Age Bracket | Male | Female |
| Under 5 Years | 28 (17.1%) | 49 (40.2%) |
| 5 Years | 12 (41.4%) | 12 (21.4%) |
| 6 to 11 Years | 23 (24.2%) | 45 (26.5%) |
| 12 to 14 Years | 27 (16.1%) | 0 (0.0%) |
| 15 Years | 0 (0.0%) | 6 (11.1%) |
| 16 and 17 Years | 27 (32.5%) | 5 (11.1%) |
| 18 to 24 Years | 29 (34.9%) | 5 (3.8%) |
| 25 to 34 Years | 192 (44.1%) | 62 (19.6%) |
| 35 to 44 Years | 15 (6.7%) | 7 (2.2%) |
| 45 to 54 Years | 35 (13.9%) | 38 (16.2%) |
| 55 to 64 Years | 15 (4.4%) | 4 (1.2%) |
| 65 to 74 Years | 83 (22.3%) | 38 (10.6%) |
| 75 Years and over | 16 (7.4%) | 14 (6.3%) |
| Total | 502 (20.1%) | 285 (11.6%) |
Income Above Poverty by Sex and Age in Garfield County
According to the poverty statistics in Garfield County, males aged 15 years and females aged 12 to 14 years are the age groups that are most secure financially, with 100.0% of males and 100.0% of females in these age groups living above the poverty line.
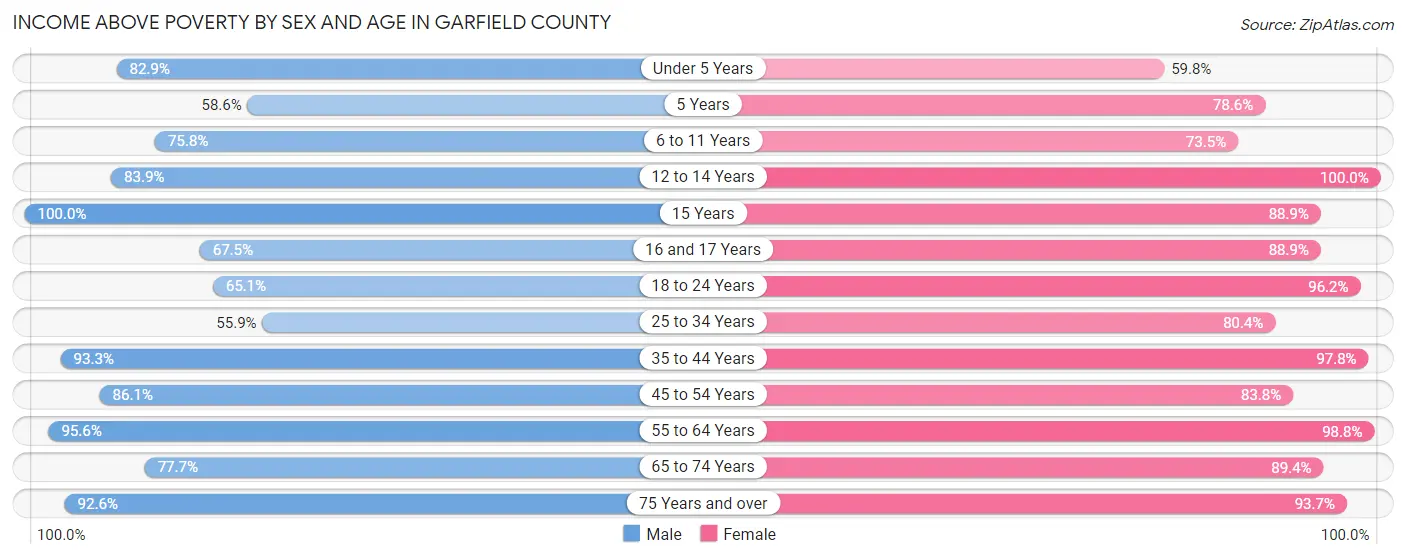
| Age Bracket | Male | Female |
| Under 5 Years | 136 (82.9%) | 73 (59.8%) |
| 5 Years | 17 (58.6%) | 44 (78.6%) |
| 6 to 11 Years | 72 (75.8%) | 125 (73.5%) |
| 12 to 14 Years | 141 (83.9%) | 91 (100.0%) |
| 15 Years | 36 (100.0%) | 48 (88.9%) |
| 16 and 17 Years | 56 (67.5%) | 40 (88.9%) |
| 18 to 24 Years | 54 (65.1%) | 128 (96.2%) |
| 25 to 34 Years | 243 (55.9%) | 255 (80.4%) |
| 35 to 44 Years | 209 (93.3%) | 304 (97.8%) |
| 45 to 54 Years | 216 (86.1%) | 196 (83.8%) |
| 55 to 64 Years | 323 (95.6%) | 336 (98.8%) |
| 65 to 74 Years | 289 (77.7%) | 320 (89.4%) |
| 75 Years and over | 199 (92.6%) | 209 (93.7%) |
| Total | 1,991 (79.9%) | 2,169 (88.4%) |
Income Below Poverty Among Married-Couple Families in Garfield County
The poverty statistics for married-couple families in Garfield County show that 5.2% or 61 of the total 1,166 families live below the poverty line. Families with 3 or 4 children have the highest poverty rate of 23.7%, comprising of 28 families. On the other hand, families with 1 or 2 children have the lowest poverty rate of 0.0%, which includes 0 families.
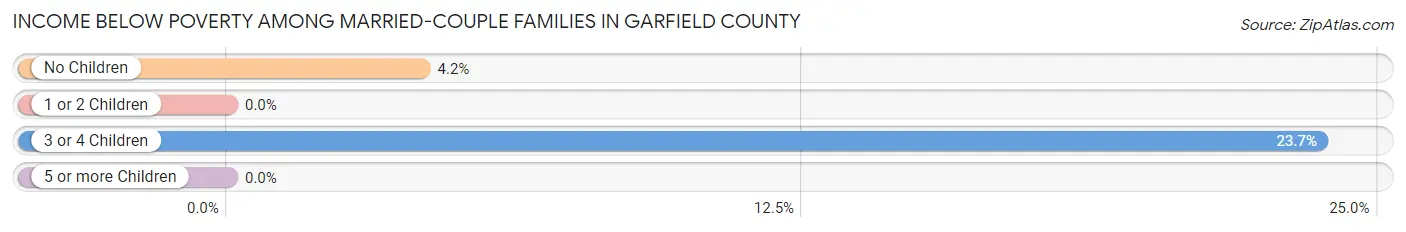
| Children | Above Poverty | Below Poverty |
| No Children | 754 (95.8%) | 33 (4.2%) |
| 1 or 2 Children | 252 (100.0%) | 0 (0.0%) |
| 3 or 4 Children | 90 (76.3%) | 28 (23.7%) |
| 5 or more Children | 9 (100.0%) | 0 (0.0%) |
| Total | 1,105 (94.8%) | 61 (5.2%) |
Income Below Poverty Among Single-Parent Households in Garfield County
According to the poverty data in Garfield County, 14.5% or 10 single-father households and 55.2% or 74 single-mother households are living below the poverty line. Among single-father households, those with no children have the highest poverty rate, with 10 households (34.5%) experiencing poverty. Likewise, among single-mother households, those with 3 or 4 children have the highest poverty rate, with 21 households (100.0%) falling below the poverty line.
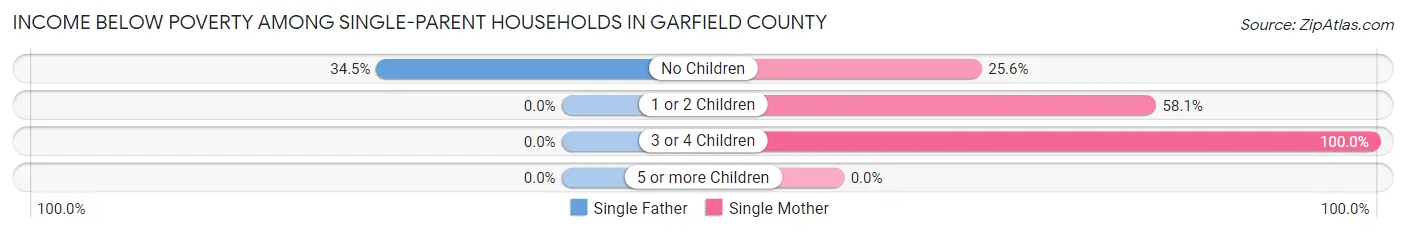
| Children | Single Father | Single Mother |
| No Children | 10 (34.5%) | 10 (25.6%) |
| 1 or 2 Children | 0 (0.0%) | 43 (58.1%) |
| 3 or 4 Children | 0 (0.0%) | 21 (100.0%) |
| 5 or more Children | 0 (0.0%) | 0 (0.0%) |
| Total | 10 (14.5%) | 74 (55.2%) |
Income Below Poverty Among Married-Couple vs Single-Parent Households in Garfield County
The poverty data for Garfield County shows that 61 of the married-couple family households (5.2%) and 84 of the single-parent households (41.4%) are living below the poverty level. Within the married-couple family households, those with 3 or 4 children have the highest poverty rate, with 28 households (23.7%) falling below the poverty line. Among the single-parent households, those with 3 or 4 children have the highest poverty rate, with 21 household (100.0%) living below poverty.
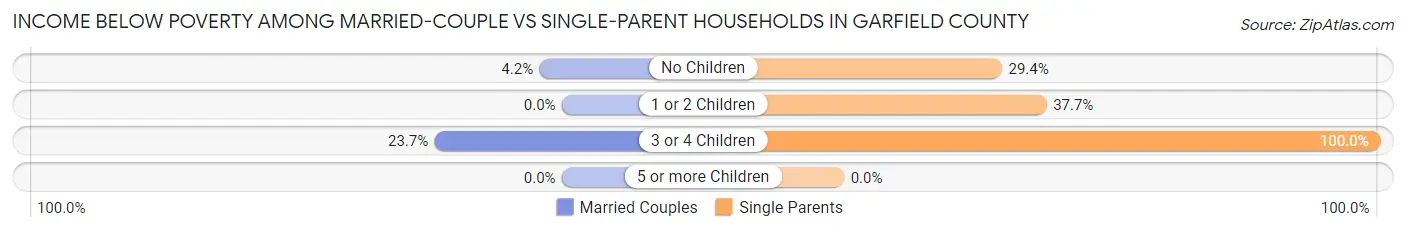
| Children | Married-Couple Families | Single-Parent Households |
| No Children | 33 (4.2%) | 20 (29.4%) |
| 1 or 2 Children | 0 (0.0%) | 43 (37.7%) |
| 3 or 4 Children | 28 (23.7%) | 21 (100.0%) |
| 5 or more Children | 0 (0.0%) | 0 (0.0%) |
| Total | 61 (5.2%) | 84 (41.4%) |
Employment Characteristics in Garfield County
Employment by Class of Employer in Garfield County
Among the 2,321 employed individuals in Garfield County, private company employees (1,368 | 58.9%), not-for-profit organizations (241 | 10.4%), and local government employees (155 | 6.7%) make up the most common classes of employment.
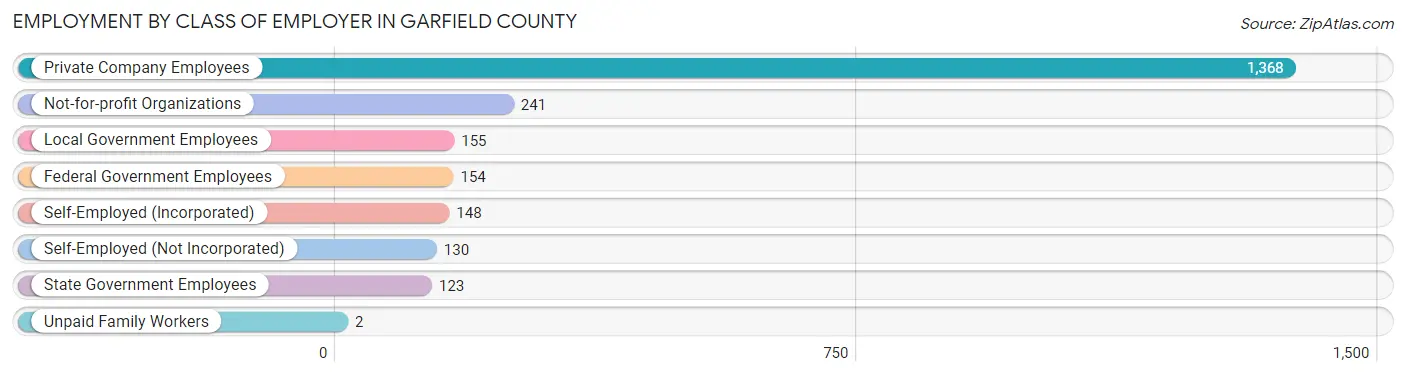
| Employer Class | # Employees | % Employees |
| Private Company Employees | 1,368 | 58.9% |
| Self-Employed (Incorporated) | 148 | 6.4% |
| Self-Employed (Not Incorporated) | 130 | 5.6% |
| Not-for-profit Organizations | 241 | 10.4% |
| Local Government Employees | 155 | 6.7% |
| State Government Employees | 123 | 5.3% |
| Federal Government Employees | 154 | 6.6% |
| Unpaid Family Workers | 2 | 0.1% |
| Total | 2,321 | 100.0% |
Employment Status by Age in Garfield County
According to the labor force statistics for Garfield County, out of the total population over 16 years of age (4,120), 59.3% or 2,443 individuals are in the labor force, with 4.4% or 107 of them unemployed. The age group with the highest labor force participation rate is 25 to 29 years, with 90.5% or 382 individuals in the labor force. Within the labor force, the 16 to 19 years age range has the highest percentage of unemployed individuals, with 21.6% or 46 of them being unemployed.
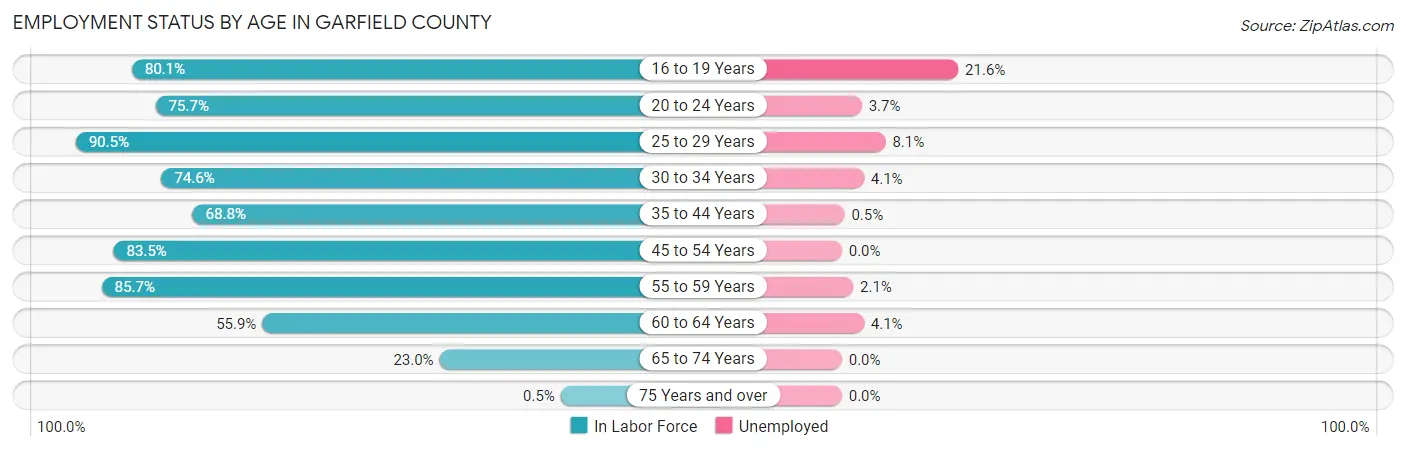
| Age Bracket | In Labor Force | Unemployed |
| 16 to 19 Years | 213 (80.1%) | 46 (21.6%) |
| 20 to 24 Years | 81 (75.7%) | 3 (3.7%) |
| 25 to 29 Years | 382 (90.5%) | 31 (8.1%) |
| 30 to 34 Years | 290 (74.6%) | 12 (4.1%) |
| 35 to 44 Years | 403 (68.8%) | 2 (0.5%) |
| 45 to 54 Years | 405 (83.5%) | 0 (0.0%) |
| 55 to 59 Years | 330 (85.7%) | 7 (2.1%) |
| 60 to 64 Years | 171 (55.9%) | 7 (4.1%) |
| 65 to 74 Years | 168 (23.0%) | 0 (0.0%) |
| 75 Years and over | 2 (0.5%) | 0 (0.0%) |
| Total | 2,443 (59.3%) | 107 (4.4%) |
Employment Status by Educational Attainment in Garfield County
According to labor force statistics for Garfield County, 77.0% of individuals (1,981) out of the total population between 25 and 64 years of age (2,573) are in the labor force, with 3.0% or 59 of them being unemployed. The group with the highest labor force participation rate are those with the educational attainment of college / associate degree, with 81.6% or 693 individuals in the labor force. Within the labor force, individuals with high school diploma education have the highest percentage of unemployment, with 7.4% or 43 of them being unemployed.
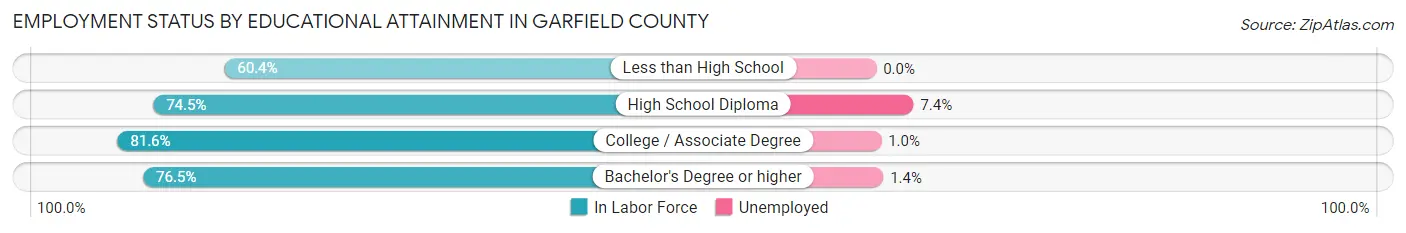
| Educational Attainment | In Labor Force | Unemployed |
| Less than High School | 58 (60.4%) | 0 (0.0%) |
| High School Diploma | 584 (74.5%) | 58 (7.4%) |
| College / Associate Degree | 693 (81.6%) | 8 (1.0%) |
| Bachelor's Degree or higher | 646 (76.5%) | 12 (1.4%) |
| Total | 1,981 (77.0%) | 77 (3.0%) |
Employment Occupations by Sex in Garfield County
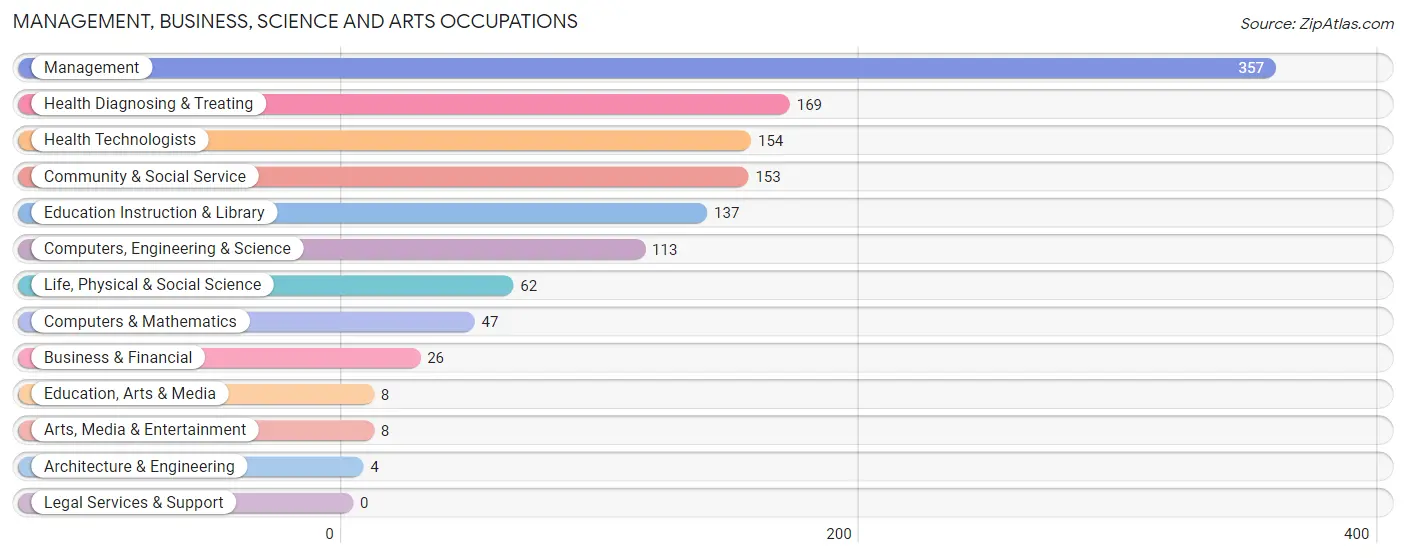
Management, Business, Science and Arts Occupations
The most common Management, Business, Science and Arts occupations in Garfield County are Management (357 | 15.3%), Health Diagnosing & Treating (169 | 7.2%), Health Technologists (154 | 6.6%), Community & Social Service (153 | 6.6%), and Education Instruction & Library (137 | 5.9%).
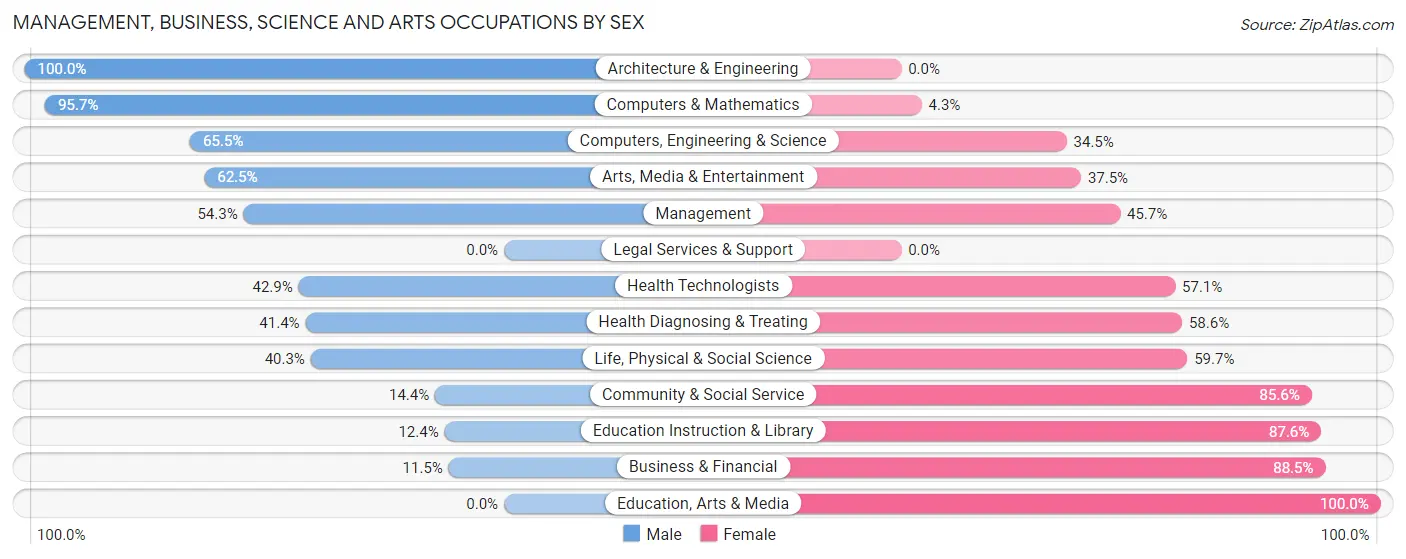
Management, Business, Science and Arts Occupations by Sex
Within the Management, Business, Science and Arts occupations in Garfield County, the most male-oriented occupations are Architecture & Engineering (100.0%), Computers & Mathematics (95.7%), and Computers, Engineering & Science (65.5%), while the most female-oriented occupations are Education, Arts & Media (100.0%), Business & Financial (88.5%), and Education Instruction & Library (87.6%).
| Occupation | Male | Female |
| Management | 194 (54.3%) | 163 (45.7%) |
| Business & Financial | 3 (11.5%) | 23 (88.5%) |
| Computers, Engineering & Science | 74 (65.5%) | 39 (34.5%) |
| Computers & Mathematics | 45 (95.7%) | 2 (4.3%) |
| Architecture & Engineering | 4 (100.0%) | 0 (0.0%) |
| Life, Physical & Social Science | 25 (40.3%) | 37 (59.7%) |
| Community & Social Service | 22 (14.4%) | 131 (85.6%) |
| Education, Arts & Media | 0 (0.0%) | 8 (100.0%) |
| Legal Services & Support | 0 (0.0%) | 0 (0.0%) |
| Education Instruction & Library | 17 (12.4%) | 120 (87.6%) |
| Arts, Media & Entertainment | 5 (62.5%) | 3 (37.5%) |
| Health Diagnosing & Treating | 70 (41.4%) | 99 (58.6%) |
| Health Technologists | 66 (42.9%) | 88 (57.1%) |
| Total (Category) | 363 (44.4%) | 455 (55.6%) |
| Total (Overall) | 1,273 (54.5%) | 1,064 (45.5%) |
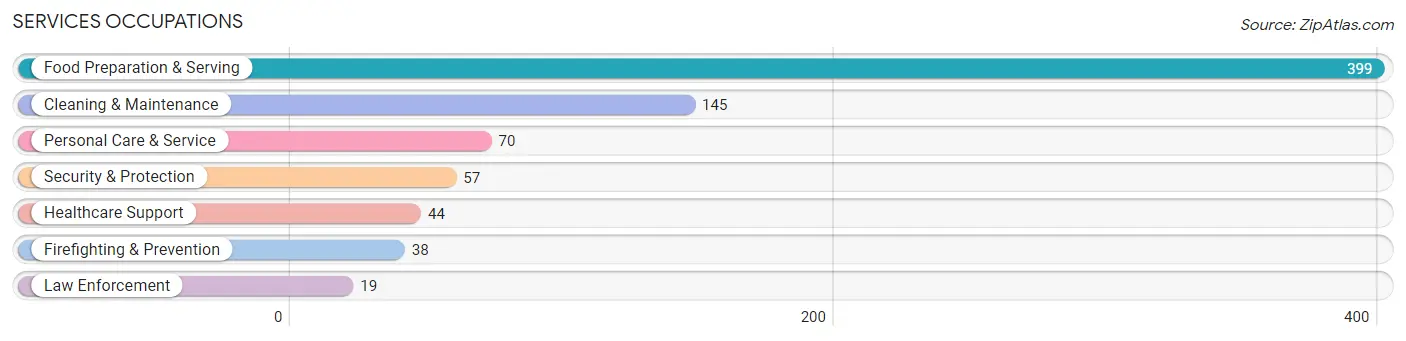
Services Occupations
The most common Services occupations in Garfield County are Food Preparation & Serving (399 | 17.1%), Cleaning & Maintenance (145 | 6.2%), Personal Care & Service (70 | 3.0%), Security & Protection (57 | 2.4%), and Healthcare Support (44 | 1.9%).
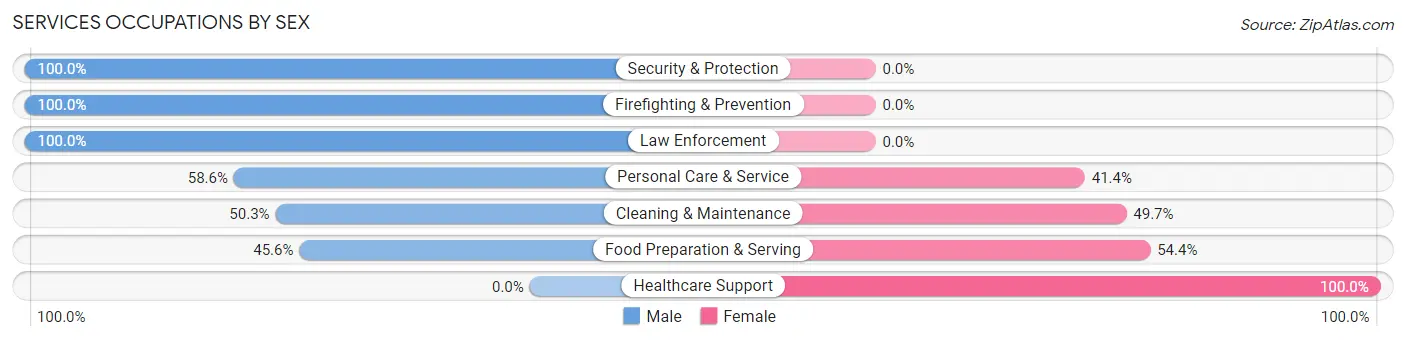
Services Occupations by Sex
Within the Services occupations in Garfield County, the most male-oriented occupations are Security & Protection (100.0%), Firefighting & Prevention (100.0%), and Law Enforcement (100.0%), while the most female-oriented occupations are Healthcare Support (100.0%), Food Preparation & Serving (54.4%), and Cleaning & Maintenance (49.7%).
| Occupation | Male | Female |
| Healthcare Support | 0 (0.0%) | 44 (100.0%) |
| Security & Protection | 57 (100.0%) | 0 (0.0%) |
| Firefighting & Prevention | 38 (100.0%) | 0 (0.0%) |
| Law Enforcement | 19 (100.0%) | 0 (0.0%) |
| Food Preparation & Serving | 182 (45.6%) | 217 (54.4%) |
| Cleaning & Maintenance | 73 (50.3%) | 72 (49.7%) |
| Personal Care & Service | 41 (58.6%) | 29 (41.4%) |
| Total (Category) | 353 (49.4%) | 362 (50.6%) |
| Total (Overall) | 1,273 (54.5%) | 1,064 (45.5%) |
Sales and Office Occupations
The most common Sales and Office occupations in Garfield County are Office & Administration (176 | 7.5%), and Sales & Related (115 | 4.9%).
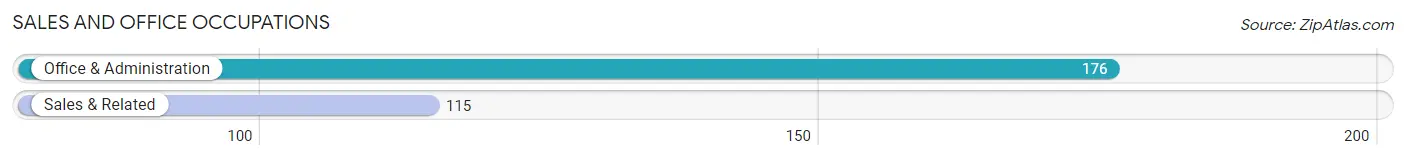
Sales and Office Occupations by Sex
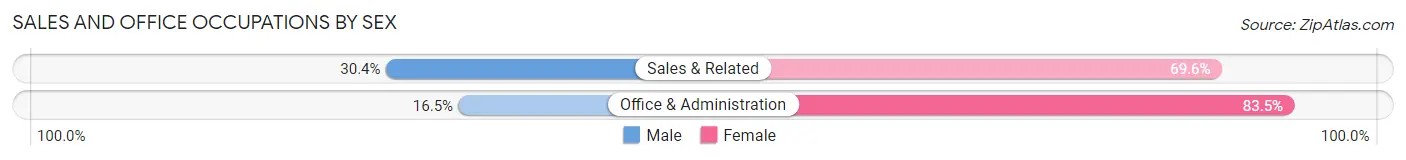
| Occupation | Male | Female |
| Sales & Related | 35 (30.4%) | 80 (69.6%) |
| Office & Administration | 29 (16.5%) | 147 (83.5%) |
| Total (Category) | 64 (22.0%) | 227 (78.0%) |
| Total (Overall) | 1,273 (54.5%) | 1,064 (45.5%) |
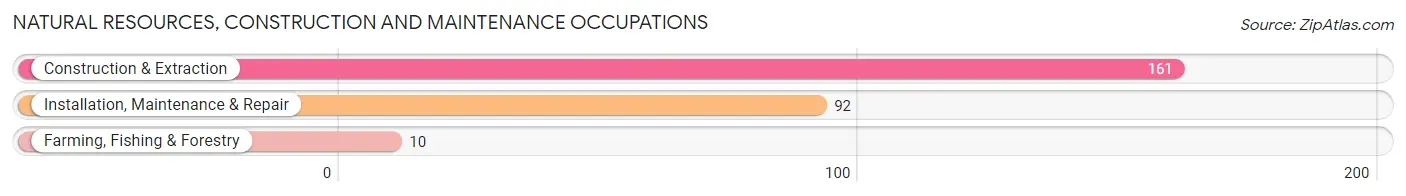
Natural Resources, Construction and Maintenance Occupations
The most common Natural Resources, Construction and Maintenance occupations in Garfield County are Construction & Extraction (161 | 6.9%), Installation, Maintenance & Repair (92 | 3.9%), and Farming, Fishing & Forestry (10 | 0.4%).
Natural Resources, Construction and Maintenance Occupations by Sex
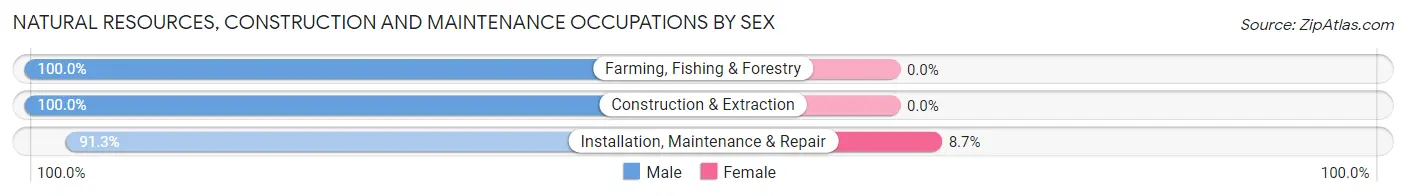
| Occupation | Male | Female |
| Farming, Fishing & Forestry | 10 (100.0%) | 0 (0.0%) |
| Construction & Extraction | 161 (100.0%) | 0 (0.0%) |
| Installation, Maintenance & Repair | 84 (91.3%) | 8 (8.7%) |
| Total (Category) | 255 (97.0%) | 8 (3.0%) |
| Total (Overall) | 1,273 (54.5%) | 1,064 (45.5%) |
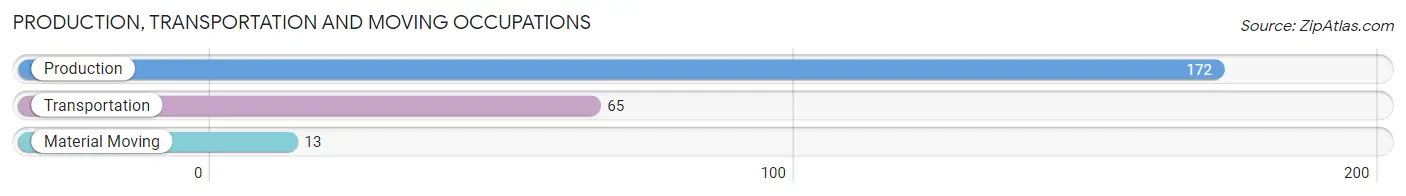
Production, Transportation and Moving Occupations
The most common Production, Transportation and Moving occupations in Garfield County are Production (172 | 7.4%), Transportation (65 | 2.8%), and Material Moving (13 | 0.6%).
Production, Transportation and Moving Occupations by Sex
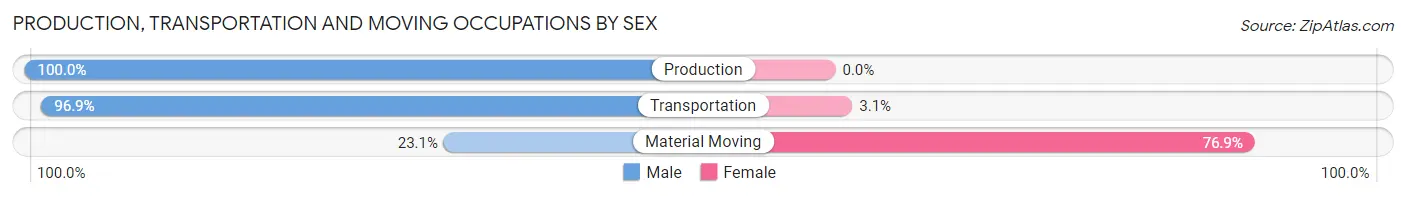
| Occupation | Male | Female |
| Production | 172 (100.0%) | 0 (0.0%) |
| Transportation | 63 (96.9%) | 2 (3.1%) |
| Material Moving | 3 (23.1%) | 10 (76.9%) |
| Total (Category) | 238 (95.2%) | 12 (4.8%) |
| Total (Overall) | 1,273 (54.5%) | 1,064 (45.5%) |
Employment Industries by Sex in Garfield County
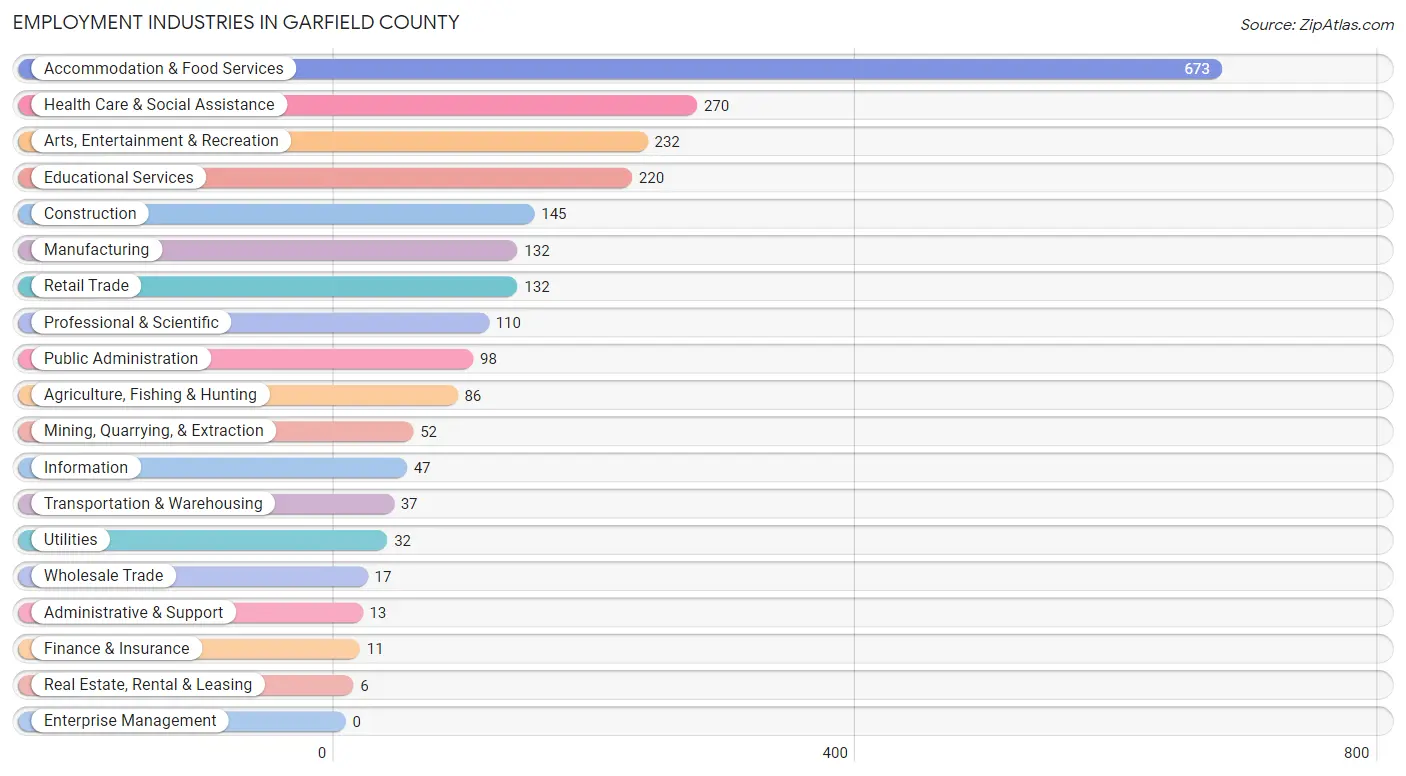
Employment Industries in Garfield County
The major employment industries in Garfield County include Accommodation & Food Services (673 | 28.8%), Health Care & Social Assistance (270 | 11.6%), Arts, Entertainment & Recreation (232 | 9.9%), Educational Services (220 | 9.4%), and Construction (145 | 6.2%).
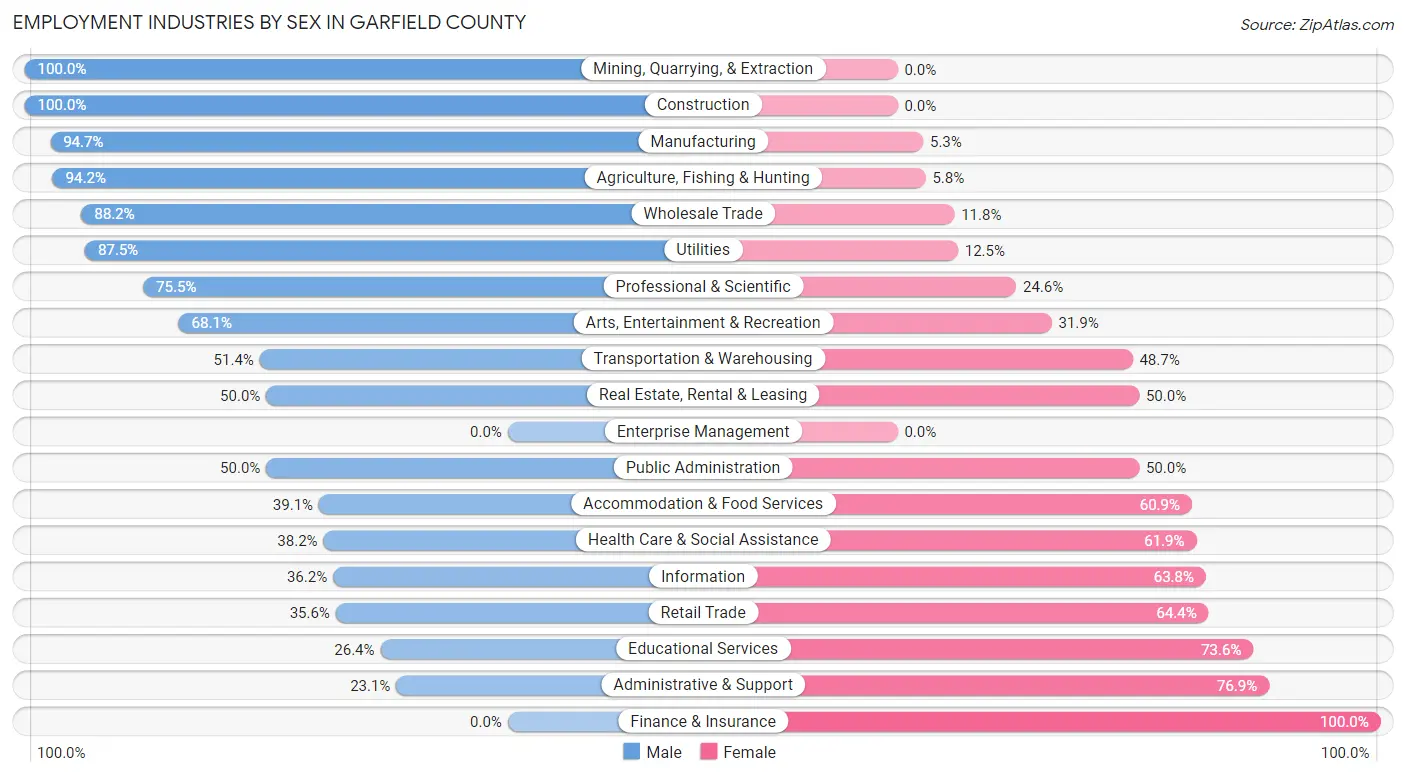
Employment Industries by Sex in Garfield County
The Garfield County industries that see more men than women are Mining, Quarrying, & Extraction (100.0%), Construction (100.0%), and Manufacturing (94.7%), whereas the industries that tend to have a higher number of women are Finance & Insurance (100.0%), Administrative & Support (76.9%), and Educational Services (73.6%).
| Industry | Male | Female |
| Agriculture, Fishing & Hunting | 81 (94.2%) | 5 (5.8%) |
| Mining, Quarrying, & Extraction | 52 (100.0%) | 0 (0.0%) |
| Construction | 145 (100.0%) | 0 (0.0%) |
| Manufacturing | 125 (94.7%) | 7 (5.3%) |
| Wholesale Trade | 15 (88.2%) | 2 (11.8%) |
| Retail Trade | 47 (35.6%) | 85 (64.4%) |
| Transportation & Warehousing | 19 (51.3%) | 18 (48.6%) |
| Utilities | 28 (87.5%) | 4 (12.5%) |
| Information | 17 (36.2%) | 30 (63.8%) |
| Finance & Insurance | 0 (0.0%) | 11 (100.0%) |
| Real Estate, Rental & Leasing | 3 (50.0%) | 3 (50.0%) |
| Professional & Scientific | 83 (75.4%) | 27 (24.5%) |
| Enterprise Management | 0 (0.0%) | 0 (0.0%) |
| Administrative & Support | 3 (23.1%) | 10 (76.9%) |
| Educational Services | 58 (26.4%) | 162 (73.6%) |
| Health Care & Social Assistance | 103 (38.2%) | 167 (61.9%) |
| Arts, Entertainment & Recreation | 158 (68.1%) | 74 (31.9%) |
| Accommodation & Food Services | 263 (39.1%) | 410 (60.9%) |
| Public Administration | 49 (50.0%) | 49 (50.0%) |
| Total | 1,273 (54.5%) | 1,064 (45.5%) |
Education in Garfield County
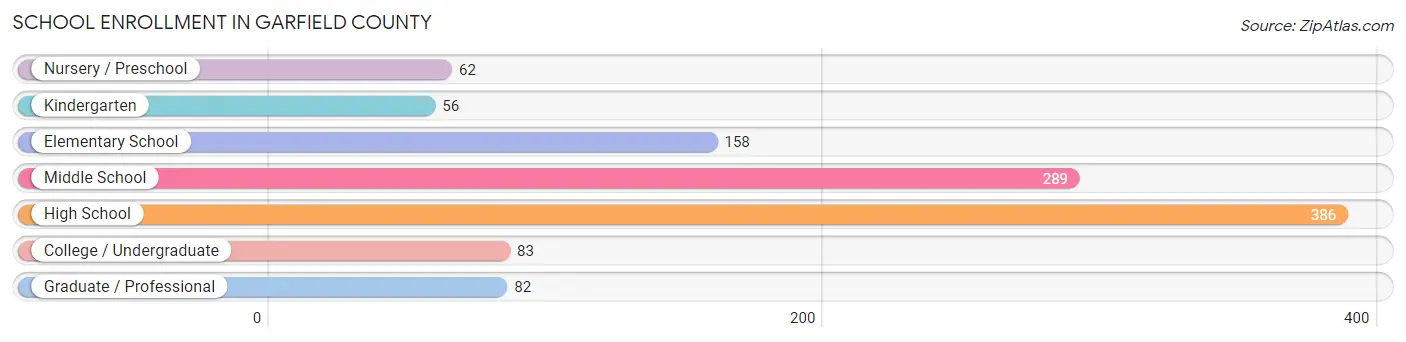
School Enrollment in Garfield County
The most common levels of schooling among the 1,116 students in Garfield County are high school (386 | 34.6%), middle school (289 | 25.9%), and elementary school (158 | 14.2%).
| School Level | # Students | % Students |
| Nursery / Preschool | 62 | 5.6% |
| Kindergarten | 56 | 5.0% |
| Elementary School | 158 | 14.2% |
| Middle School | 289 | 25.9% |
| High School | 386 | 34.6% |
| College / Undergraduate | 83 | 7.4% |
| Graduate / Professional | 82 | 7.3% |
| Total | 1,116 | 100.0% |
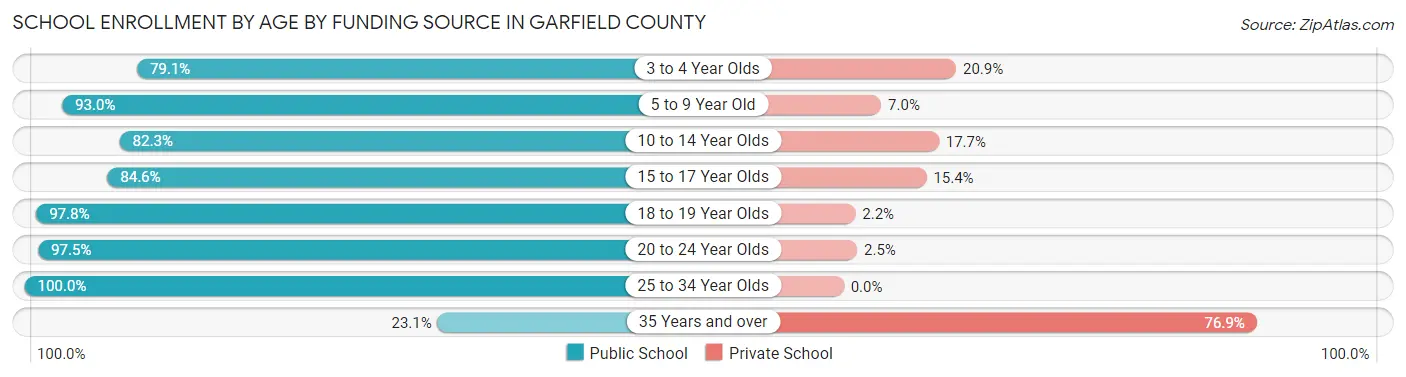
School Enrollment by Age by Funding Source in Garfield County
Out of a total of 1,116 students who are enrolled in schools in Garfield County, 167 (15.0%) attend a private institution, while the remaining 949 (85.0%) are enrolled in public schools. The age group of 35 years and over has the highest likelihood of being enrolled in private schools, with 40 (76.9% in the age bracket) enrolled. Conversely, the age group of 25 to 34 year olds has the lowest likelihood of being enrolled in a private school, with 80 (100.0% in the age bracket) attending a public institution.
| Age Bracket | Public School | Private School |
| 3 to 4 Year Olds | 34 (79.1%) | 9 (20.9%) |
| 5 to 9 Year Old | 200 (93.0%) | 15 (7.0%) |
| 10 to 14 Year Olds | 302 (82.3%) | 65 (17.7%) |
| 15 to 17 Year Olds | 192 (84.6%) | 35 (15.4%) |
| 18 to 19 Year Olds | 90 (97.8%) | 2 (2.2%) |
| 20 to 24 Year Olds | 39 (97.5%) | 1 (2.5%) |
| 25 to 34 Year Olds | 80 (100.0%) | 0 (0.0%) |
| 35 Years and over | 12 (23.1%) | 40 (76.9%) |
| Total | 949 (85.0%) | 167 (15.0%) |
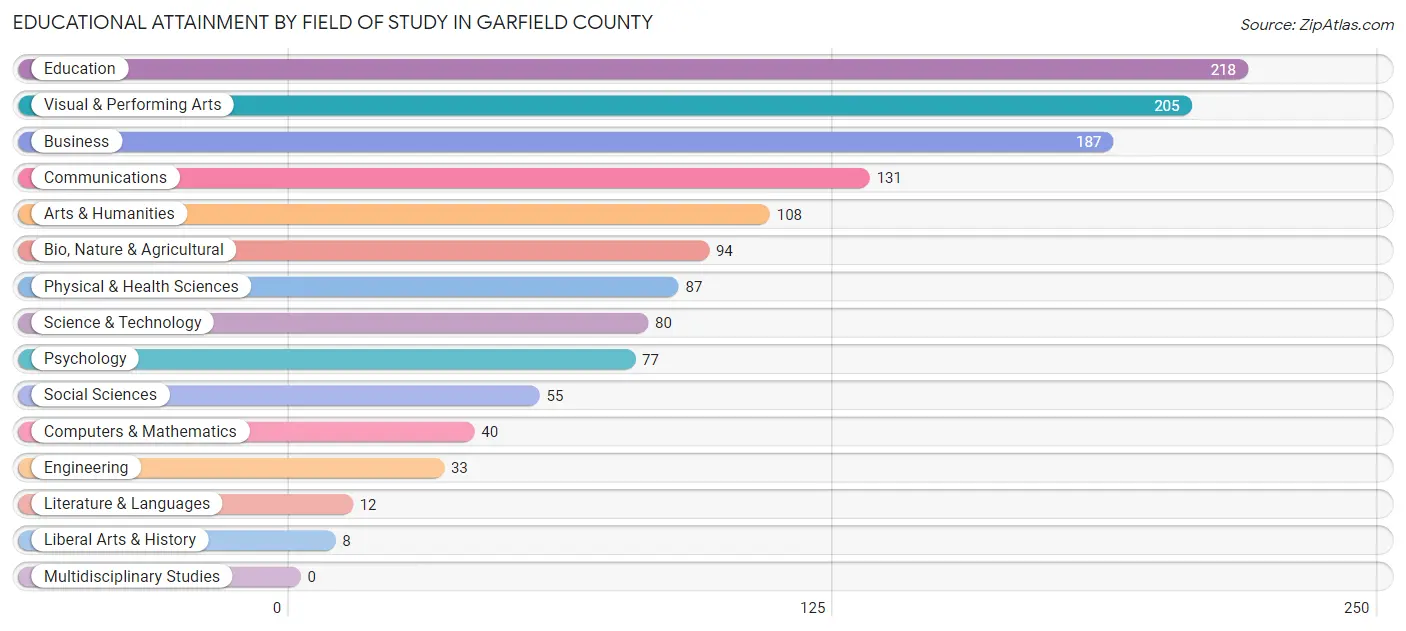
Educational Attainment by Field of Study in Garfield County
Education (218 | 16.3%), visual & performing arts (205 | 15.4%), business (187 | 14.0%), communications (131 | 9.8%), and arts & humanities (108 | 8.1%) are the most common fields of study among 1,335 individuals in Garfield County who have obtained a bachelor's degree or higher.
| Field of Study | # Graduates | % Graduates |
| Computers & Mathematics | 40 | 3.0% |
| Bio, Nature & Agricultural | 94 | 7.0% |
| Physical & Health Sciences | 87 | 6.5% |
| Psychology | 77 | 5.8% |
| Social Sciences | 55 | 4.1% |
| Engineering | 33 | 2.5% |
| Multidisciplinary Studies | 0 | 0.0% |
| Science & Technology | 80 | 6.0% |
| Business | 187 | 14.0% |
| Education | 218 | 16.3% |
| Literature & Languages | 12 | 0.9% |
| Liberal Arts & History | 8 | 0.6% |
| Visual & Performing Arts | 205 | 15.4% |
| Communications | 131 | 9.8% |
| Arts & Humanities | 108 | 8.1% |
| Total | 1,335 | 100.0% |
Transportation & Commute in Garfield County
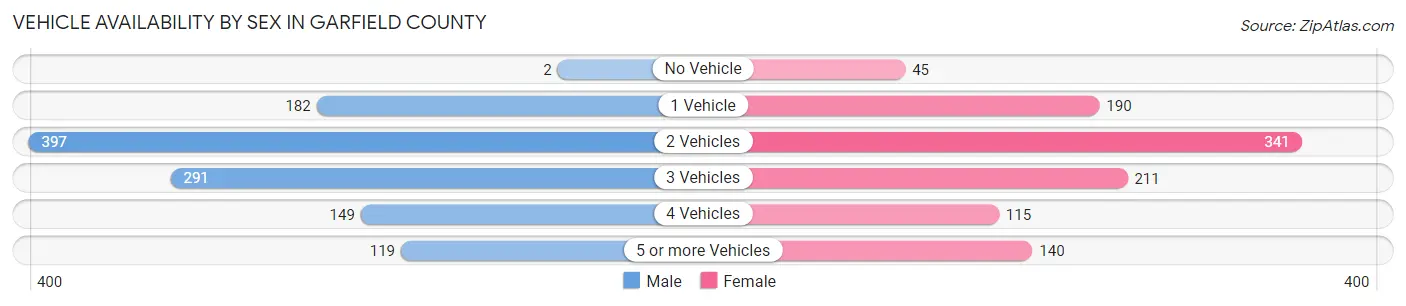
Vehicle Availability by Sex in Garfield County
The most prevalent vehicle ownership categories in Garfield County are males with 2 vehicles (397, accounting for 34.8%) and females with 2 vehicles (341, making up 38.1%).
| Vehicles Available | Male | Female |
| No Vehicle | 2 (0.2%) | 45 (4.3%) |
| 1 Vehicle | 182 (16.0%) | 190 (18.2%) |
| 2 Vehicles | 397 (34.8%) | 341 (32.7%) |
| 3 Vehicles | 291 (25.5%) | 211 (20.3%) |
| 4 Vehicles | 149 (13.1%) | 115 (11.0%) |
| 5 or more Vehicles | 119 (10.4%) | 140 (13.4%) |
| Total | 1,140 (100.0%) | 1,042 (100.0%) |
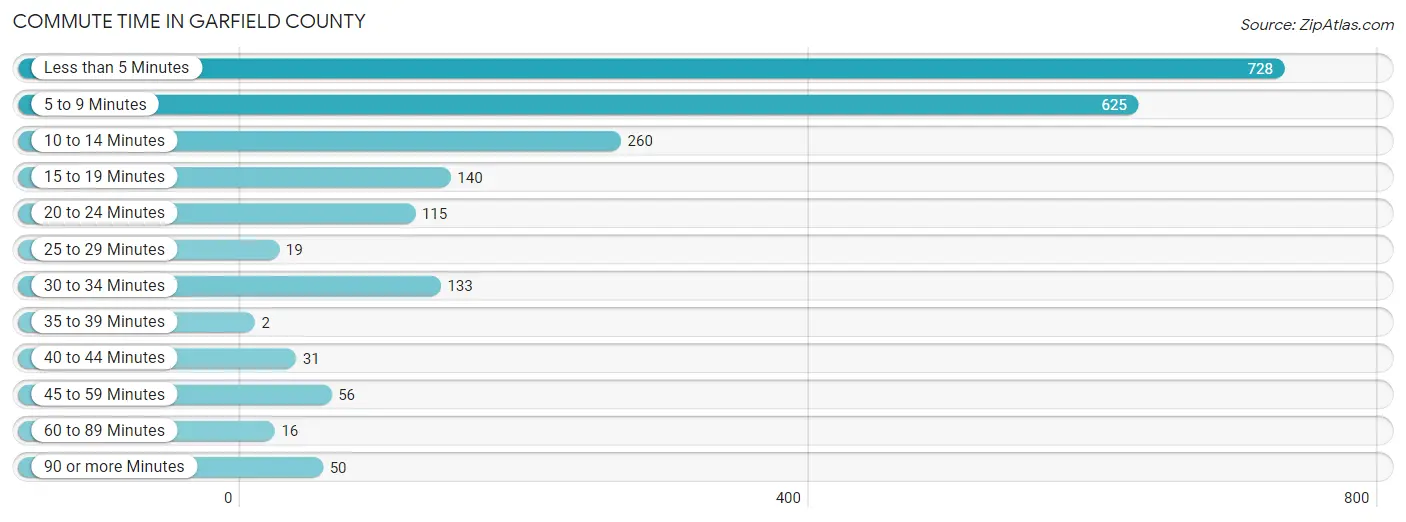
Commute Time in Garfield County
The most frequently occuring commute durations in Garfield County are less than 5 minutes (728 commuters, 33.5%), 5 to 9 minutes (625 commuters, 28.7%), and 10 to 14 minutes (260 commuters, 11.9%).
| Commute Time | # Commuters | % Commuters |
| Less than 5 Minutes | 728 | 33.5% |
| 5 to 9 Minutes | 625 | 28.7% |
| 10 to 14 Minutes | 260 | 11.9% |
| 15 to 19 Minutes | 140 | 6.4% |
| 20 to 24 Minutes | 115 | 5.3% |
| 25 to 29 Minutes | 19 | 0.9% |
| 30 to 34 Minutes | 133 | 6.1% |
| 35 to 39 Minutes | 2 | 0.1% |
| 40 to 44 Minutes | 31 | 1.4% |
| 45 to 59 Minutes | 56 | 2.6% |
| 60 to 89 Minutes | 16 | 0.7% |
| 90 or more Minutes | 50 | 2.3% |
Commute Time by Sex in Garfield County
The most common commute times in Garfield County are less than 5 minutes (366 commuters, 31.4%) for males and less than 5 minutes (362 commuters, 35.8%) for females.

| Commute Time | Male | Female |
| Less than 5 Minutes | 366 (31.4%) | 362 (35.8%) |
| 5 to 9 Minutes | 284 (24.4%) | 341 (33.7%) |
| 10 to 14 Minutes | 160 (13.8%) | 100 (9.9%) |
| 15 to 19 Minutes | 91 (7.8%) | 49 (4.9%) |
| 20 to 24 Minutes | 52 (4.5%) | 63 (6.2%) |
| 25 to 29 Minutes | 5 (0.4%) | 14 (1.4%) |
| 30 to 34 Minutes | 107 (9.2%) | 26 (2.6%) |
| 35 to 39 Minutes | 0 (0.0%) | 2 (0.2%) |
| 40 to 44 Minutes | 21 (1.8%) | 10 (1.0%) |
| 45 to 59 Minutes | 30 (2.6%) | 26 (2.6%) |
| 60 to 89 Minutes | 9 (0.8%) | 7 (0.7%) |
| 90 or more Minutes | 39 (3.4%) | 11 (1.1%) |
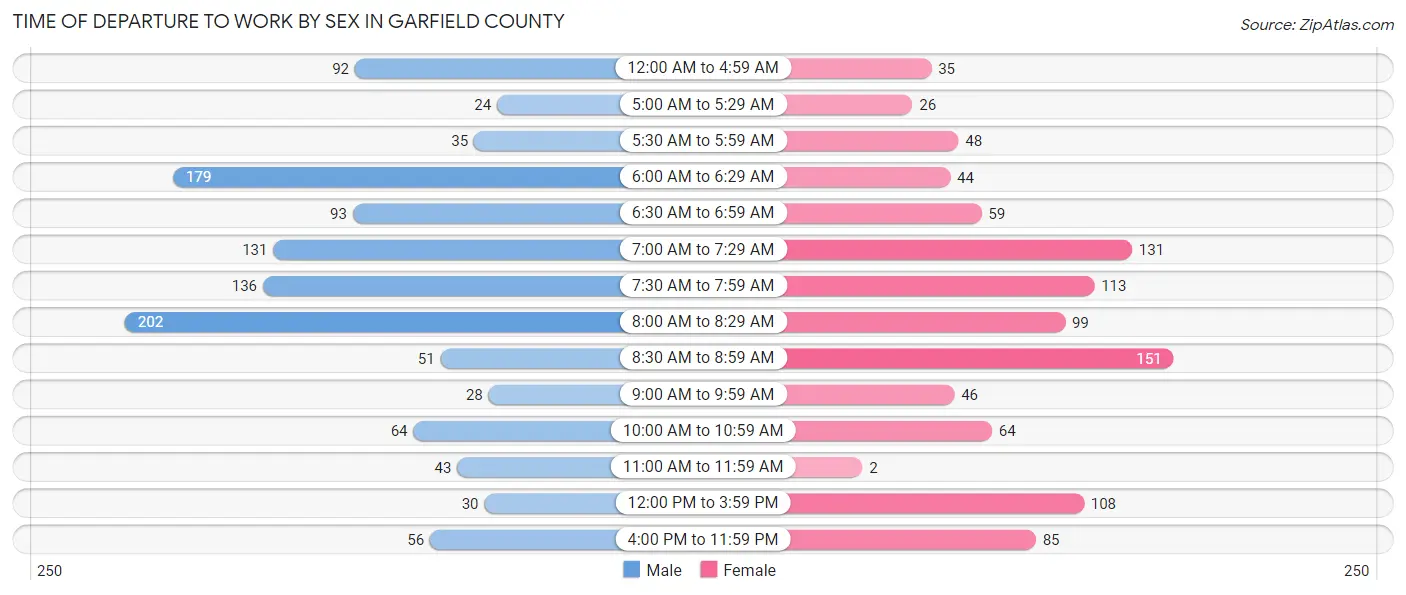
Time of Departure to Work by Sex in Garfield County
The most frequent times of departure to work in Garfield County are 8:00 AM to 8:29 AM (202, 17.3%) for males and 8:30 AM to 8:59 AM (151, 14.9%) for females.
| Time of Departure | Male | Female |
| 12:00 AM to 4:59 AM | 92 (7.9%) | 35 (3.5%) |
| 5:00 AM to 5:29 AM | 24 (2.1%) | 26 (2.6%) |
| 5:30 AM to 5:59 AM | 35 (3.0%) | 48 (4.8%) |
| 6:00 AM to 6:29 AM | 179 (15.4%) | 44 (4.3%) |
| 6:30 AM to 6:59 AM | 93 (8.0%) | 59 (5.8%) |
| 7:00 AM to 7:29 AM | 131 (11.3%) | 131 (13.0%) |
| 7:30 AM to 7:59 AM | 136 (11.7%) | 113 (11.2%) |
| 8:00 AM to 8:29 AM | 202 (17.3%) | 99 (9.8%) |
| 8:30 AM to 8:59 AM | 51 (4.4%) | 151 (14.9%) |
| 9:00 AM to 9:59 AM | 28 (2.4%) | 46 (4.5%) |
| 10:00 AM to 10:59 AM | 64 (5.5%) | 64 (6.3%) |
| 11:00 AM to 11:59 AM | 43 (3.7%) | 2 (0.2%) |
| 12:00 PM to 3:59 PM | 30 (2.6%) | 108 (10.7%) |
| 4:00 PM to 11:59 PM | 56 (4.8%) | 85 (8.4%) |
| Total | 1,164 (100.0%) | 1,011 (100.0%) |
Housing Occupancy in Garfield County
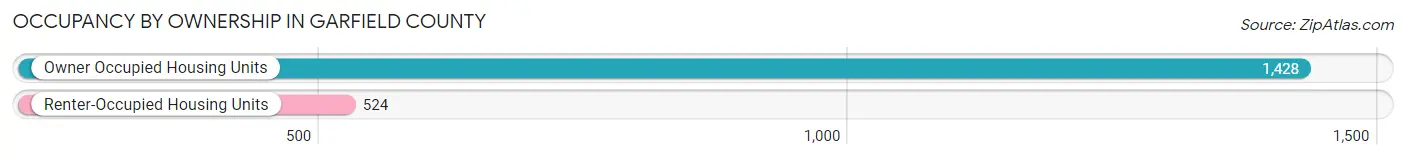
Occupancy by Ownership in Garfield County
Of the total 1,952 dwellings in Garfield County, owner-occupied units account for 1,428 (73.2%), while renter-occupied units make up 524 (26.8%).
| Occupancy | # Housing Units | % Housing Units |
| Owner Occupied Housing Units | 1,428 | 73.2% |
| Renter-Occupied Housing Units | 524 | 26.8% |
| Total Occupied Housing Units | 1,952 | 100.0% |
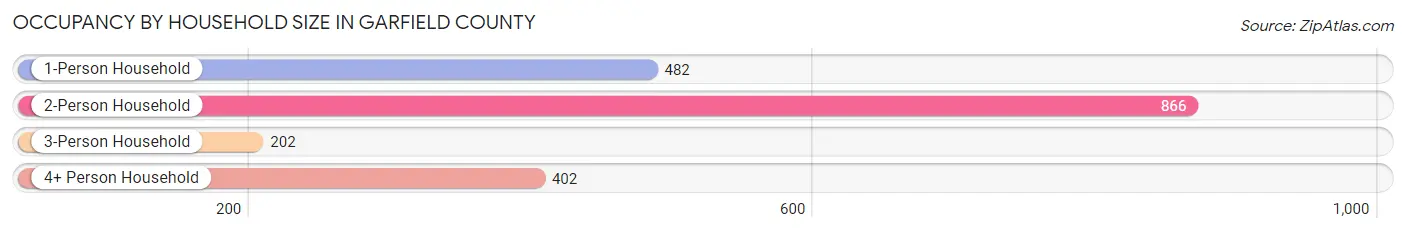
Occupancy by Household Size in Garfield County
| Household Size | # Housing Units | % Housing Units |
| 1-Person Household | 482 | 24.7% |
| 2-Person Household | 866 | 44.4% |
| 3-Person Household | 202 | 10.3% |
| 4+ Person Household | 402 | 20.6% |
| Total Housing Units | 1,952 | 100.0% |
Occupancy by Ownership by Household Size in Garfield County
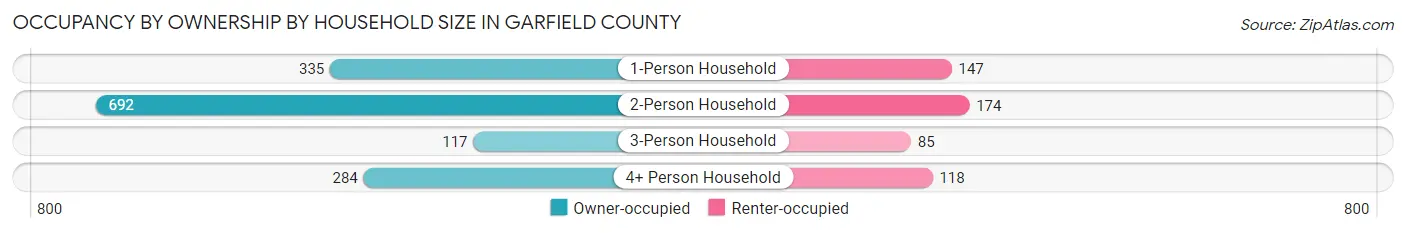
| Household Size | Owner-occupied | Renter-occupied |
| 1-Person Household | 335 (69.5%) | 147 (30.5%) |
| 2-Person Household | 692 (79.9%) | 174 (20.1%) |
| 3-Person Household | 117 (57.9%) | 85 (42.1%) |
| 4+ Person Household | 284 (70.7%) | 118 (29.3%) |
| Total Housing Units | 1,428 (73.2%) | 524 (26.8%) |
Occupancy by Educational Attainment in Garfield County
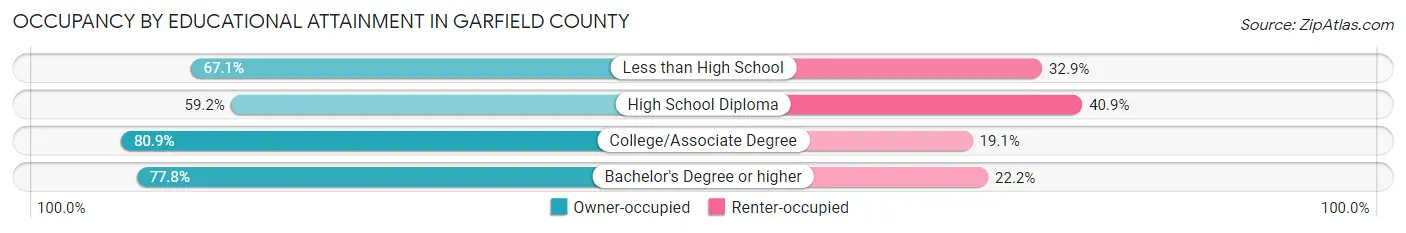
| Household Size | Owner-occupied | Renter-occupied |
| Less than High School | 53 (67.1%) | 26 (32.9%) |
| High School Diploma | 336 (59.2%) | 232 (40.8%) |
| College/Associate Degree | 622 (80.9%) | 147 (19.1%) |
| Bachelor's Degree or higher | 417 (77.8%) | 119 (22.2%) |
Occupancy by Age of Householder in Garfield County
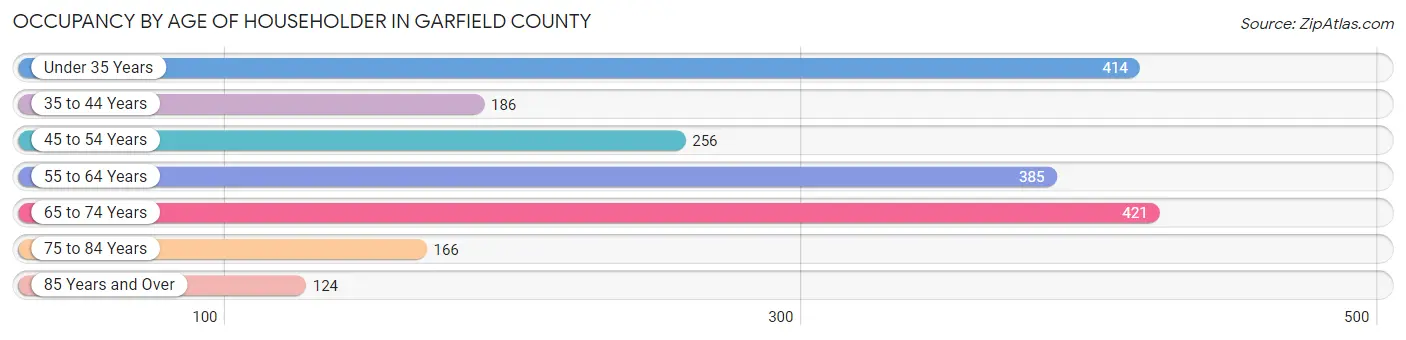
| Age Bracket | # Households | % Households |
| Under 35 Years | 414 | 21.2% |
| 35 to 44 Years | 186 | 9.5% |
| 45 to 54 Years | 256 | 13.1% |
| 55 to 64 Years | 385 | 19.7% |
| 65 to 74 Years | 421 | 21.6% |
| 75 to 84 Years | 166 | 8.5% |
| 85 Years and Over | 124 | 6.4% |
| Total | 1,952 | 100.0% |
Housing Finances in Garfield County
Median Income by Occupancy in Garfield County
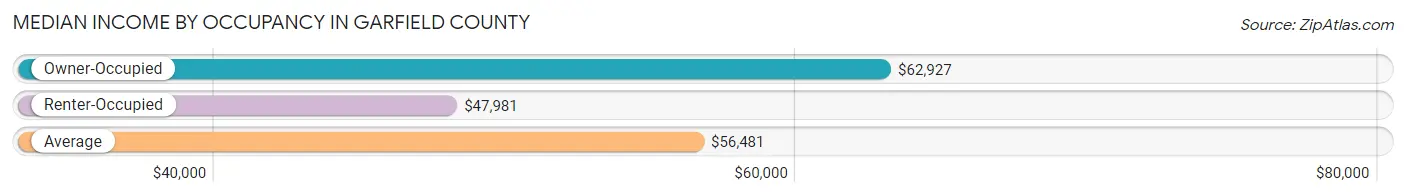
| Occupancy Type | # Households | Median Income |
| Owner-Occupied | 1,428 (73.2%) | $62,927 |
| Renter-Occupied | 524 (26.8%) | $47,981 |
| Average | 1,952 (100.0%) | $56,481 |
Occupancy by Householder Income Bracket in Garfield County
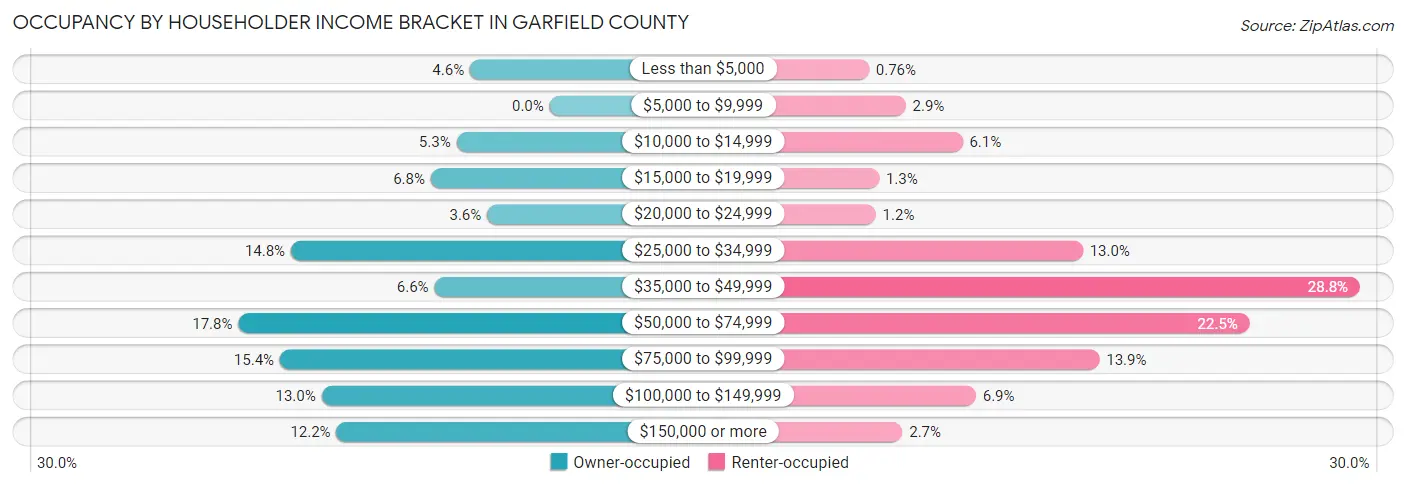
| Income Bracket | Owner-occupied | Renter-occupied |
| Less than $5,000 | 65 (4.5%) | 4 (0.8%) |
| $5,000 to $9,999 | 0 (0.0%) | 15 (2.9%) |
| $10,000 to $14,999 | 76 (5.3%) | 32 (6.1%) |
| $15,000 to $19,999 | 97 (6.8%) | 7 (1.3%) |
| $20,000 to $24,999 | 51 (3.6%) | 6 (1.1%) |
| $25,000 to $34,999 | 211 (14.8%) | 68 (13.0%) |
| $35,000 to $49,999 | 94 (6.6%) | 151 (28.8%) |
| $50,000 to $74,999 | 254 (17.8%) | 118 (22.5%) |
| $75,000 to $99,999 | 220 (15.4%) | 73 (13.9%) |
| $100,000 to $149,999 | 186 (13.0%) | 36 (6.9%) |
| $150,000 or more | 174 (12.2%) | 14 (2.7%) |
| Total | 1,428 (100.0%) | 524 (100.0%) |
Monthly Housing Cost Tiers in Garfield County
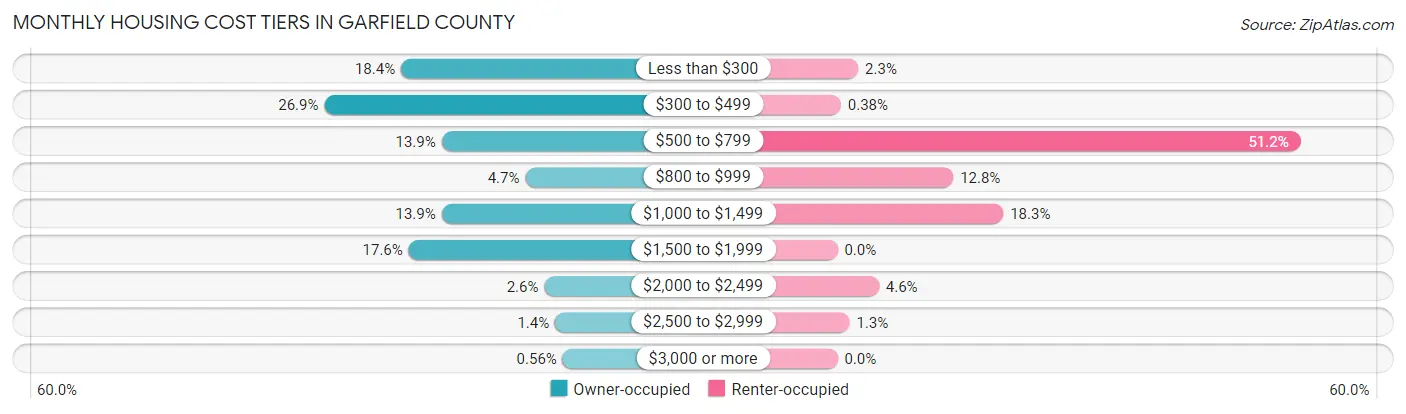
| Monthly Cost | Owner-occupied | Renter-occupied |
| Less than $300 | 263 (18.4%) | 12 (2.3%) |
| $300 to $499 | 384 (26.9%) | 2 (0.4%) |
| $500 to $799 | 199 (13.9%) | 268 (51.1%) |
| $800 to $999 | 67 (4.7%) | 67 (12.8%) |
| $1,000 to $1,499 | 199 (13.9%) | 96 (18.3%) |
| $1,500 to $1,999 | 251 (17.6%) | 0 (0.0%) |
| $2,000 to $2,499 | 37 (2.6%) | 24 (4.6%) |
| $2,500 to $2,999 | 20 (1.4%) | 7 (1.3%) |
| $3,000 or more | 8 (0.6%) | 0 (0.0%) |
| Total | 1,428 (100.0%) | 524 (100.0%) |
Physical Housing Characteristics in Garfield County
Housing Structures in Garfield County
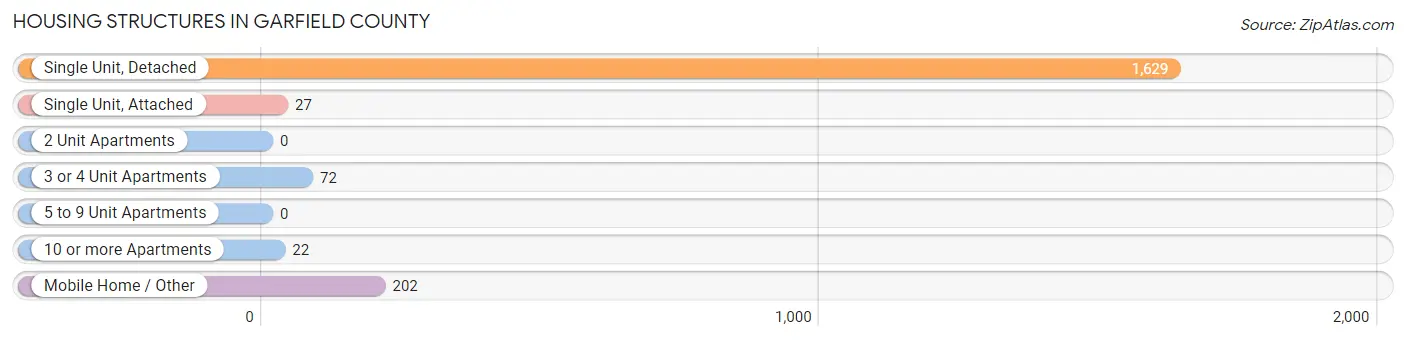
| Structure Type | # Housing Units | % Housing Units |
| Single Unit, Detached | 1,629 | 83.5% |
| Single Unit, Attached | 27 | 1.4% |
| 2 Unit Apartments | 0 | 0.0% |
| 3 or 4 Unit Apartments | 72 | 3.7% |
| 5 to 9 Unit Apartments | 0 | 0.0% |
| 10 or more Apartments | 22 | 1.1% |
| Mobile Home / Other | 202 | 10.3% |
| Total | 1,952 | 100.0% |
Housing Structures by Occupancy in Garfield County
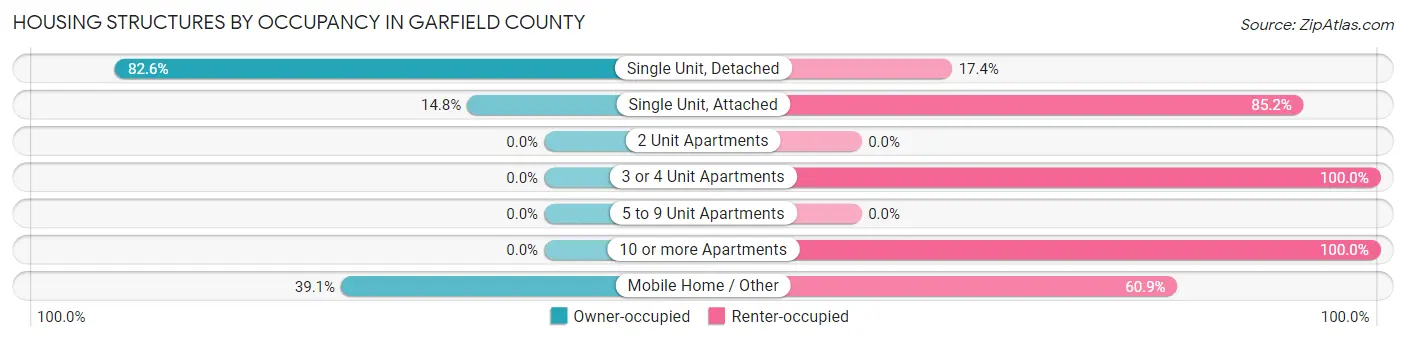
| Structure Type | Owner-occupied | Renter-occupied |
| Single Unit, Detached | 1,345 (82.6%) | 284 (17.4%) |
| Single Unit, Attached | 4 (14.8%) | 23 (85.2%) |
| 2 Unit Apartments | 0 (0.0%) | 0 (0.0%) |
| 3 or 4 Unit Apartments | 0 (0.0%) | 72 (100.0%) |
| 5 to 9 Unit Apartments | 0 (0.0%) | 0 (0.0%) |
| 10 or more Apartments | 0 (0.0%) | 22 (100.0%) |
| Mobile Home / Other | 79 (39.1%) | 123 (60.9%) |
| Total | 1,428 (73.2%) | 524 (26.8%) |
Housing Structures by Number of Rooms in Garfield County
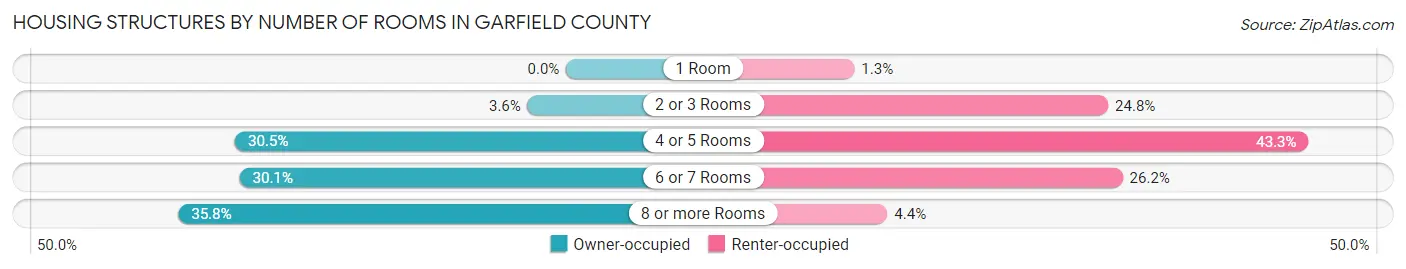
| Number of Rooms | Owner-occupied | Renter-occupied |
| 1 Room | 0 (0.0%) | 7 (1.3%) |
| 2 or 3 Rooms | 51 (3.6%) | 130 (24.8%) |
| 4 or 5 Rooms | 436 (30.5%) | 227 (43.3%) |
| 6 or 7 Rooms | 430 (30.1%) | 137 (26.2%) |
| 8 or more Rooms | 511 (35.8%) | 23 (4.4%) |
| Total | 1,428 (100.0%) | 524 (100.0%) |
Housing Structure by Heating Type in Garfield County
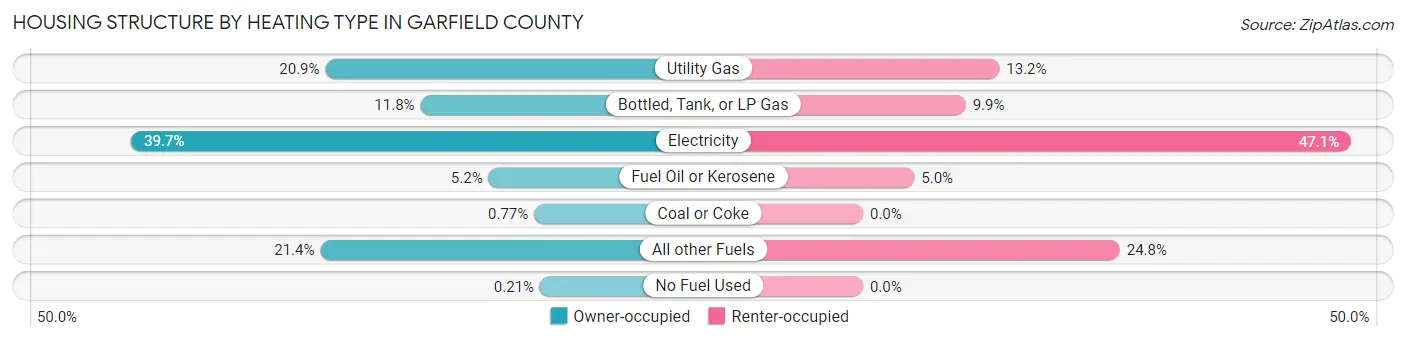
| Heating Type | Owner-occupied | Renter-occupied |
| Utility Gas | 299 (20.9%) | 69 (13.2%) |
| Bottled, Tank, or LP Gas | 168 (11.8%) | 52 (9.9%) |
| Electricity | 567 (39.7%) | 247 (47.1%) |
| Fuel Oil or Kerosene | 74 (5.2%) | 26 (5.0%) |
| Coal or Coke | 11 (0.8%) | 0 (0.0%) |
| All other Fuels | 306 (21.4%) | 130 (24.8%) |
| No Fuel Used | 3 (0.2%) | 0 (0.0%) |
| Total | 1,428 (100.0%) | 524 (100.0%) |
Household Vehicle Usage in Garfield County
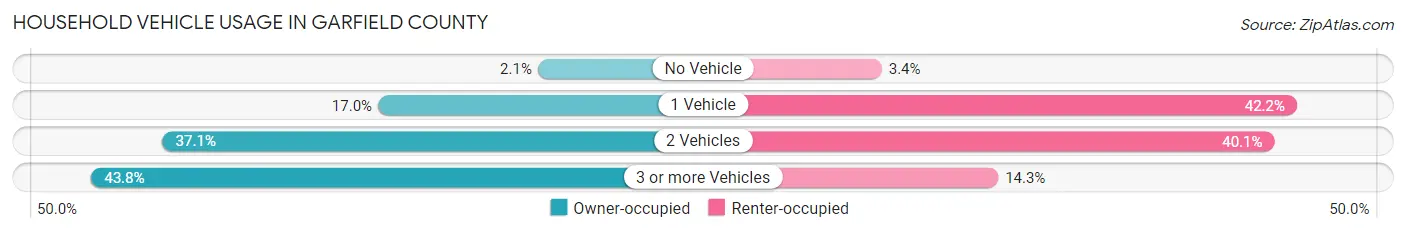
| Vehicles per Household | Owner-occupied | Renter-occupied |
| No Vehicle | 30 (2.1%) | 18 (3.4%) |
| 1 Vehicle | 243 (17.0%) | 221 (42.2%) |
| 2 Vehicles | 530 (37.1%) | 210 (40.1%) |
| 3 or more Vehicles | 625 (43.8%) | 75 (14.3%) |
| Total | 1,428 (100.0%) | 524 (100.0%) |
Real Estate & Mortgages in Garfield County
Real Estate and Mortgage Overview in Garfield County
| Characteristic | Without Mortgage | With Mortgage |
| Housing Units | 779 | 649 |
| Median Property Value | $208,700 | $302,700 |
| Median Household Income | $37,969 | $89 |
| Monthly Housing Costs | $334 | $8 |
| Real Estate Taxes | $867 | $7 |
Property Value by Mortgage Status in Garfield County
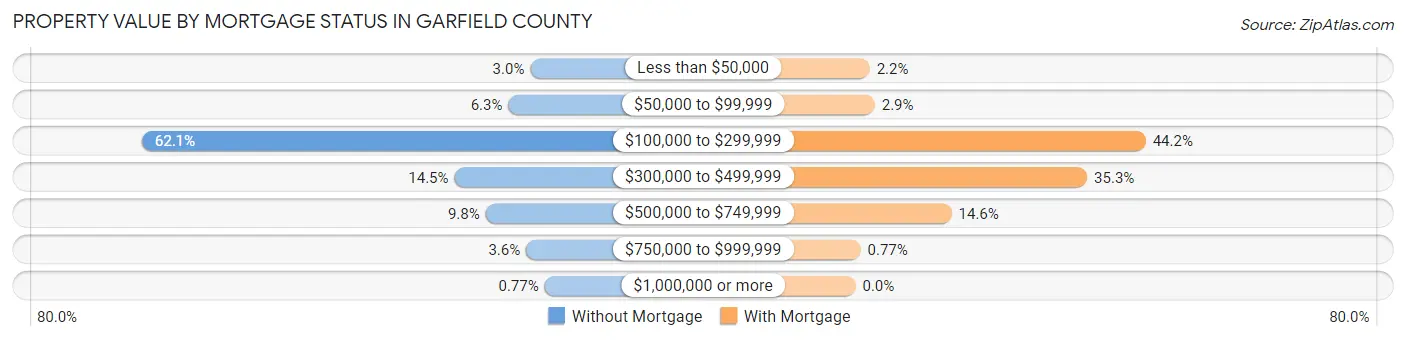
| Property Value | Without Mortgage | With Mortgage |
| Less than $50,000 | 23 (2.9%) | 14 (2.2%) |
| $50,000 to $99,999 | 49 (6.3%) | 19 (2.9%) |
| $100,000 to $299,999 | 484 (62.1%) | 287 (44.2%) |
| $300,000 to $499,999 | 113 (14.5%) | 229 (35.3%) |
| $500,000 to $749,999 | 76 (9.8%) | 95 (14.6%) |
| $750,000 to $999,999 | 28 (3.6%) | 5 (0.8%) |
| $1,000,000 or more | 6 (0.8%) | 0 (0.0%) |
| Total | 779 (100.0%) | 649 (100.0%) |
Household Income by Mortgage Status in Garfield County
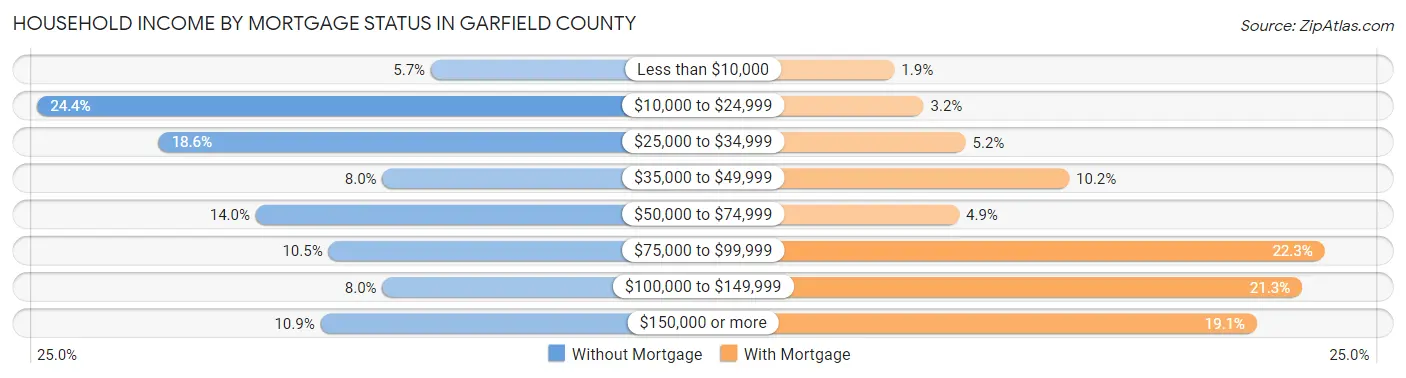
| Household Income | Without Mortgage | With Mortgage |
| Less than $10,000 | 44 (5.7%) | 12 (1.8%) |
| $10,000 to $24,999 | 190 (24.4%) | 21 (3.2%) |
| $25,000 to $34,999 | 145 (18.6%) | 34 (5.2%) |
| $35,000 to $49,999 | 62 (8.0%) | 66 (10.2%) |
| $50,000 to $74,999 | 109 (14.0%) | 32 (4.9%) |
| $75,000 to $99,999 | 82 (10.5%) | 145 (22.3%) |
| $100,000 to $149,999 | 62 (8.0%) | 138 (21.3%) |
| $150,000 or more | 85 (10.9%) | 124 (19.1%) |
| Total | 779 (100.0%) | 649 (100.0%) |
Property Value to Household Income Ratio in Garfield County
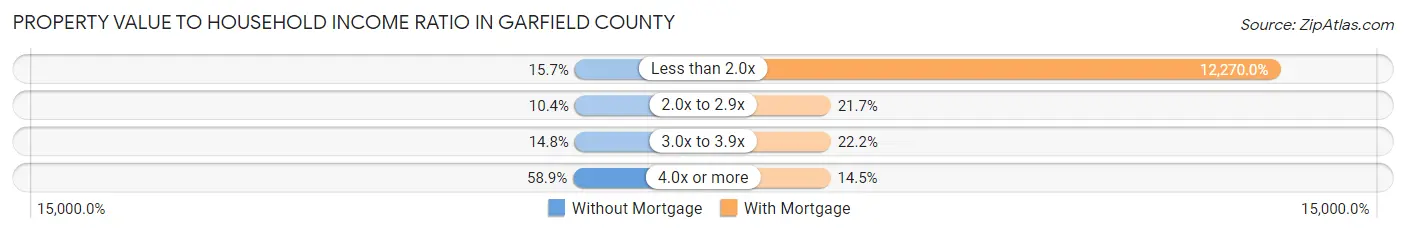
| Value-to-Income Ratio | Without Mortgage | With Mortgage |
| Less than 2.0x | 122 (15.7%) | 79,632 (12,270.0%) |
| 2.0x to 2.9x | 81 (10.4%) | 141 (21.7%) |
| 3.0x to 3.9x | 115 (14.8%) | 144 (22.2%) |
| 4.0x or more | 459 (58.9%) | 94 (14.5%) |
| Total | 779 (100.0%) | 649 (100.0%) |
Real Estate Taxes by Mortgage Status in Garfield County
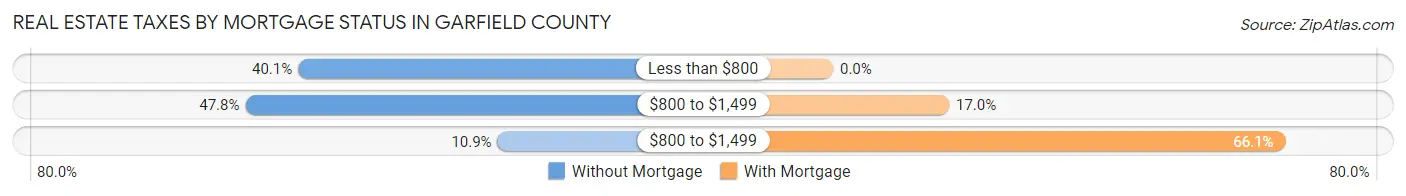
| Property Taxes | Without Mortgage | With Mortgage |
| Less than $800 | 312 (40.1%) | 0 (0.0%) |
| $800 to $1,499 | 372 (47.7%) | 110 (17.0%) |
| $800 to $1,499 | 85 (10.9%) | 429 (66.1%) |
| Total | 779 (100.0%) | 649 (100.0%) |
Health & Disability in Garfield County
Health Insurance Coverage by Age in Garfield County
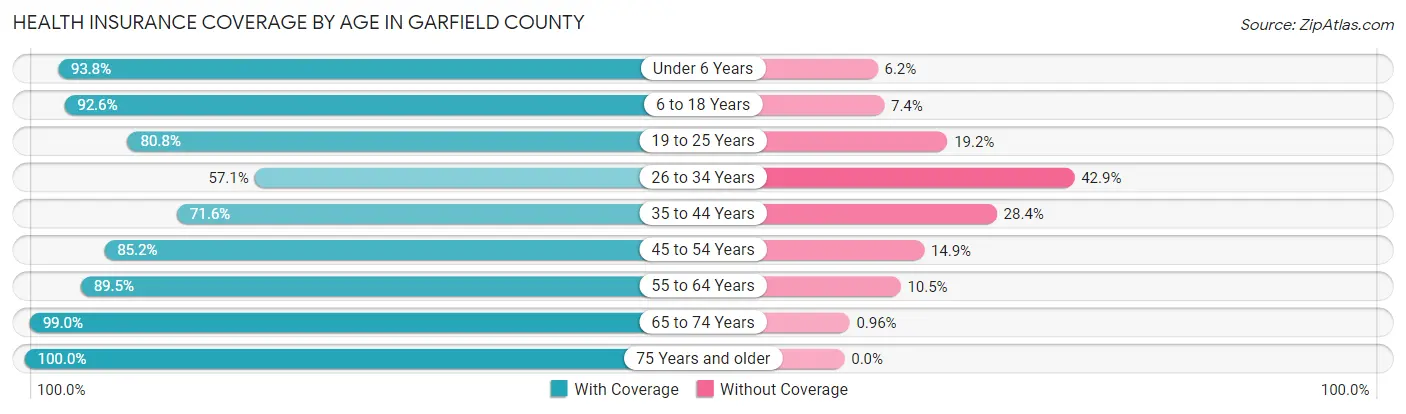
| Age Bracket | With Coverage | Without Coverage |
| Under 6 Years | 348 (93.8%) | 23 (6.2%) |
| 6 to 18 Years | 787 (92.6%) | 63 (7.4%) |
| 19 to 25 Years | 139 (80.8%) | 33 (19.2%) |
| 26 to 34 Years | 393 (57.1%) | 295 (42.9%) |
| 35 to 44 Years | 383 (71.6%) | 152 (28.4%) |
| 45 to 54 Years | 413 (85.2%) | 72 (14.8%) |
| 55 to 64 Years | 607 (89.5%) | 71 (10.5%) |
| 65 to 74 Years | 723 (99.0%) | 7 (1.0%) |
| 75 Years and older | 438 (100.0%) | 0 (0.0%) |
| Total | 4,231 (85.5%) | 716 (14.5%) |
Health Insurance Coverage by Citizenship Status in Garfield County
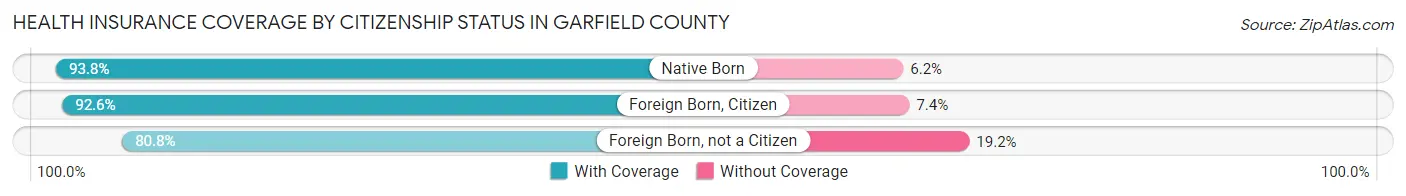
| Citizenship Status | With Coverage | Without Coverage |
| Native Born | 348 (93.8%) | 23 (6.2%) |
| Foreign Born, Citizen | 787 (92.6%) | 63 (7.4%) |
| Foreign Born, not a Citizen | 139 (80.8%) | 33 (19.2%) |
Health Insurance Coverage by Household Income in Garfield County
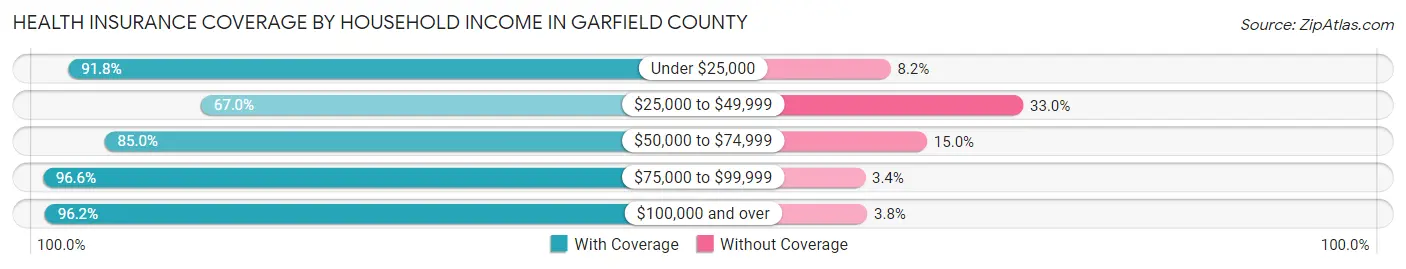
| Household Income | With Coverage | Without Coverage |
| Under $25,000 | 560 (91.8%) | 50 (8.2%) |
| $25,000 to $49,999 | 746 (67.0%) | 368 (33.0%) |
| $50,000 to $74,999 | 606 (85.0%) | 107 (15.0%) |
| $75,000 to $99,999 | 933 (96.6%) | 33 (3.4%) |
| $100,000 and over | 1,341 (96.2%) | 53 (3.8%) |
Public vs Private Health Insurance Coverage by Age in Garfield County
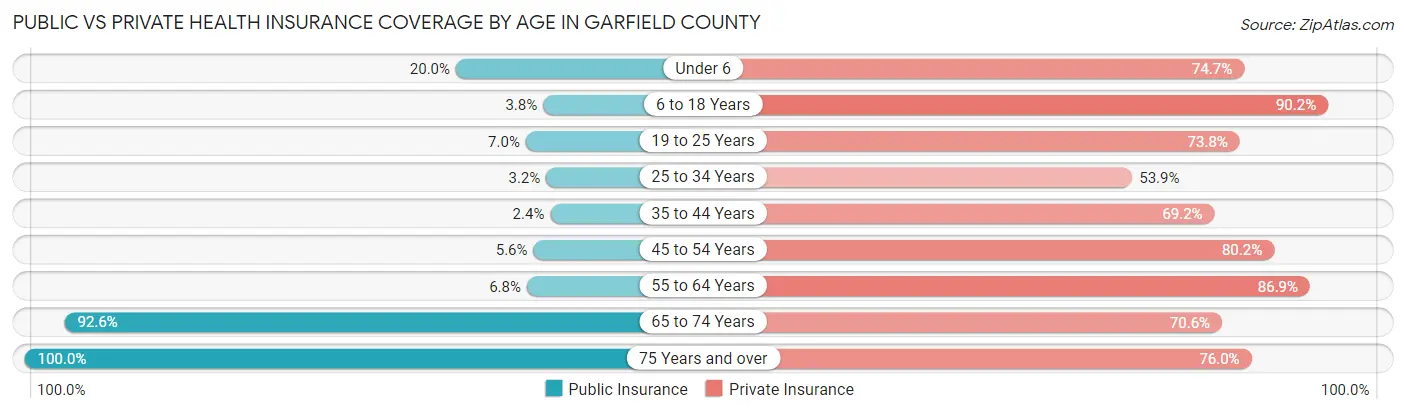
| Age Bracket | Public Insurance | Private Insurance |
| Under 6 | 74 (20.0%) | 277 (74.7%) |
| 6 to 18 Years | 32 (3.8%) | 767 (90.2%) |
| 19 to 25 Years | 12 (7.0%) | 127 (73.8%) |
| 25 to 34 Years | 22 (3.2%) | 371 (53.9%) |
| 35 to 44 Years | 13 (2.4%) | 370 (69.2%) |
| 45 to 54 Years | 27 (5.6%) | 389 (80.2%) |
| 55 to 64 Years | 46 (6.8%) | 589 (86.9%) |
| 65 to 74 Years | 676 (92.6%) | 515 (70.6%) |
| 75 Years and over | 438 (100.0%) | 333 (76.0%) |
| Total | 1,340 (27.1%) | 3,738 (75.6%) |
Disability Status by Sex by Age in Garfield County
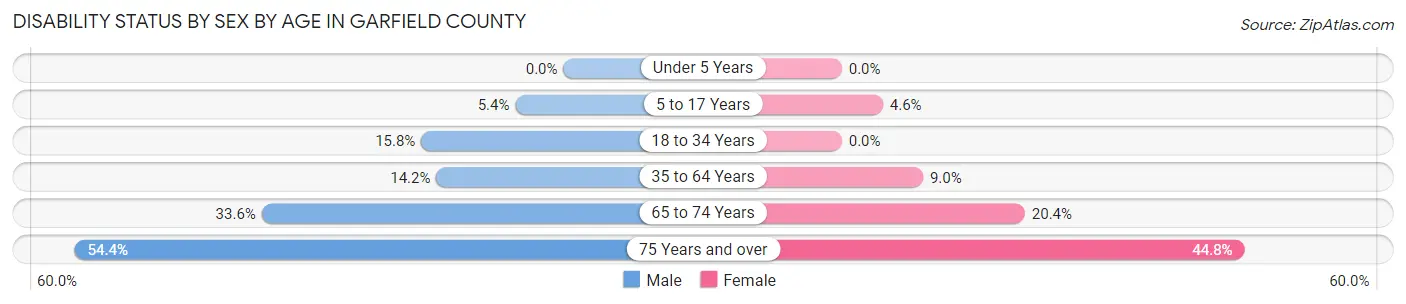
| Age Bracket | Male | Female |
| Under 5 Years | 0 (0.0%) | 0 (0.0%) |
| 5 to 17 Years | 22 (5.3%) | 19 (4.6%) |
| 18 to 34 Years | 82 (15.8%) | 0 (0.0%) |
| 35 to 64 Years | 115 (14.1%) | 80 (9.0%) |
| 65 to 74 Years | 125 (33.6%) | 73 (20.4%) |
| 75 Years and over | 117 (54.4%) | 100 (44.8%) |
Disability Class by Sex by Age in Garfield County
Disability Class: Hearing Difficulty
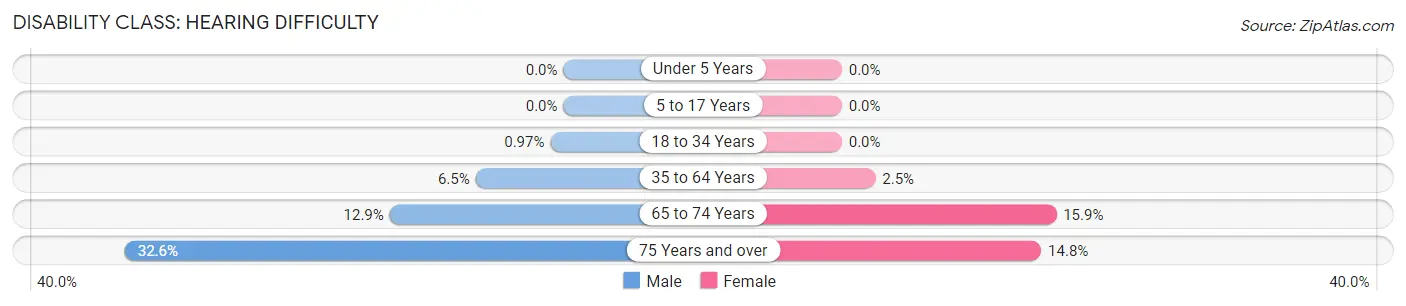
| Age Bracket | Male | Female |
| Under 5 Years | 0 (0.0%) | 0 (0.0%) |
| 5 to 17 Years | 0 (0.0%) | 0 (0.0%) |
| 18 to 34 Years | 5 (1.0%) | 0 (0.0%) |
| 35 to 64 Years | 53 (6.5%) | 22 (2.5%) |
| 65 to 74 Years | 48 (12.9%) | 57 (15.9%) |
| 75 Years and over | 70 (32.6%) | 33 (14.8%) |
Disability Class: Vision Difficulty
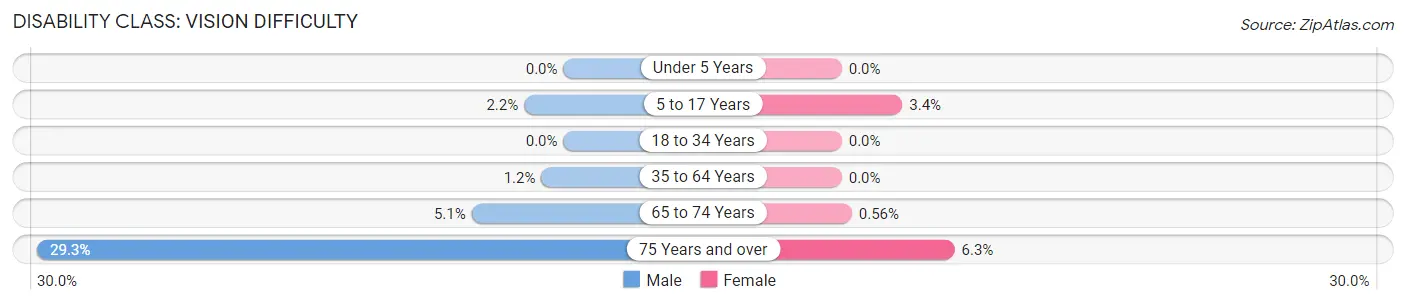
| Age Bracket | Male | Female |
| Under 5 Years | 0 (0.0%) | 0 (0.0%) |
| 5 to 17 Years | 9 (2.2%) | 14 (3.4%) |
| 18 to 34 Years | 0 (0.0%) | 0 (0.0%) |
| 35 to 64 Years | 10 (1.2%) | 0 (0.0%) |
| 65 to 74 Years | 19 (5.1%) | 2 (0.6%) |
| 75 Years and over | 63 (29.3%) | 14 (6.3%) |
Disability Class: Cognitive Difficulty
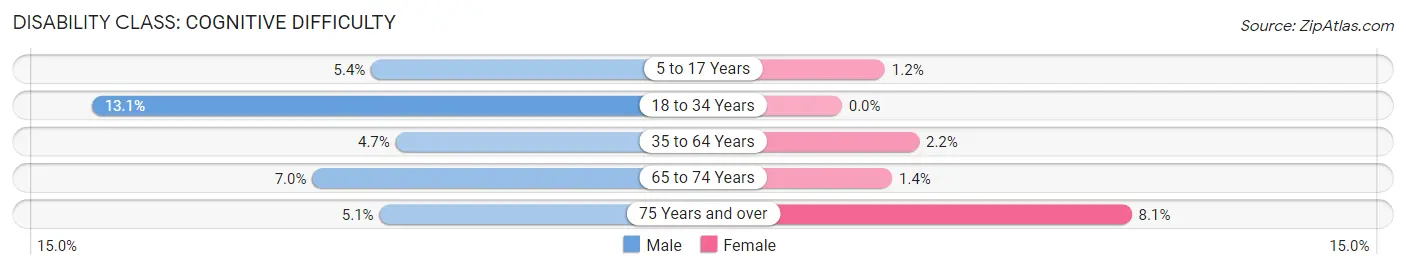
| Age Bracket | Male | Female |
| 5 to 17 Years | 22 (5.3%) | 5 (1.2%) |
| 18 to 34 Years | 68 (13.1%) | 0 (0.0%) |
| 35 to 64 Years | 38 (4.7%) | 19 (2.1%) |
| 65 to 74 Years | 26 (7.0%) | 5 (1.4%) |
| 75 Years and over | 11 (5.1%) | 18 (8.1%) |
Disability Class: Ambulatory Difficulty
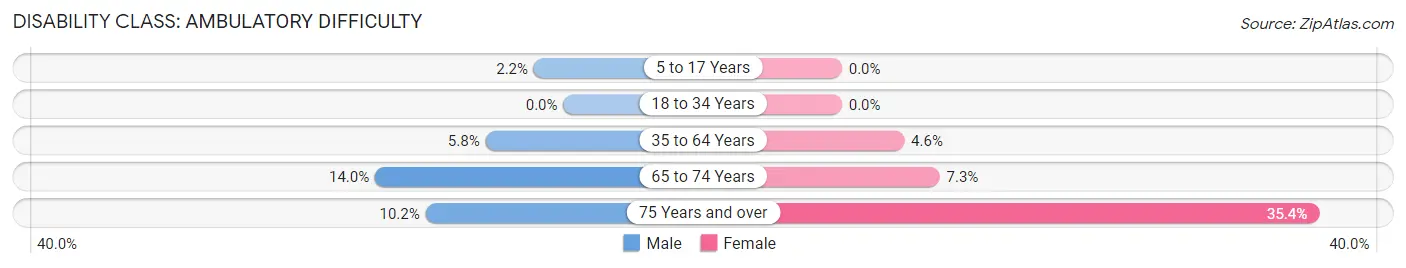
| Age Bracket | Male | Female |
| 5 to 17 Years | 9 (2.2%) | 0 (0.0%) |
| 18 to 34 Years | 0 (0.0%) | 0 (0.0%) |
| 35 to 64 Years | 47 (5.8%) | 41 (4.6%) |
| 65 to 74 Years | 52 (14.0%) | 26 (7.3%) |
| 75 Years and over | 22 (10.2%) | 79 (35.4%) |
Disability Class: Self-Care Difficulty
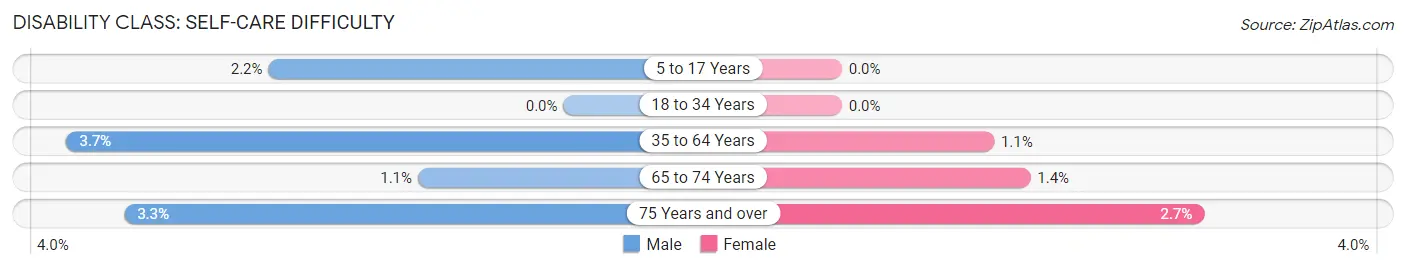
| Age Bracket | Male | Female |
| 5 to 17 Years | 9 (2.2%) | 0 (0.0%) |
| 18 to 34 Years | 0 (0.0%) | 0 (0.0%) |
| 35 to 64 Years | 30 (3.7%) | 10 (1.1%) |
| 65 to 74 Years | 4 (1.1%) | 5 (1.4%) |
| 75 Years and over | 7 (3.3%) | 6 (2.7%) |
Technology Access in Garfield County
Computing Device Access in Garfield County
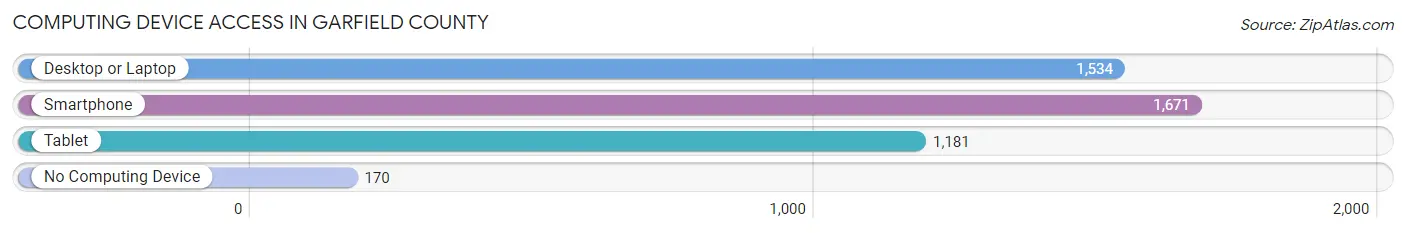
| Device Type | # Households | % Households |
| Desktop or Laptop | 1,534 | 78.6% |
| Smartphone | 1,671 | 85.6% |
| Tablet | 1,181 | 60.5% |
| No Computing Device | 170 | 8.7% |
| Total | 1,952 | 100.0% |
Internet Access in Garfield County
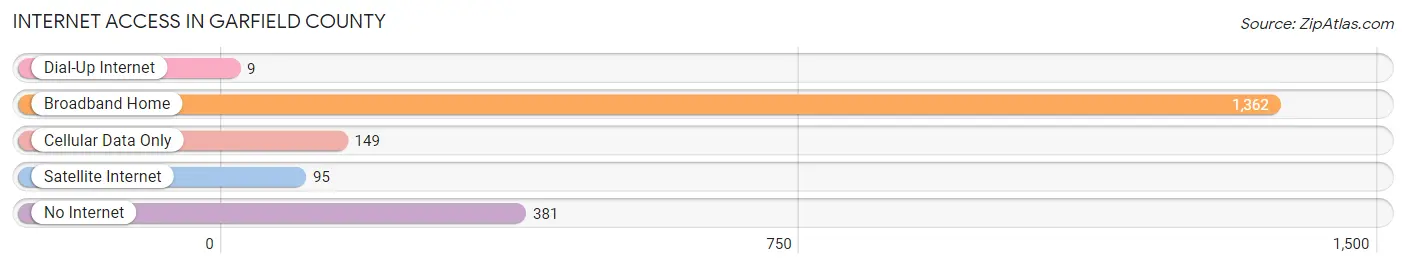
| Internet Type | # Households | % Households |
| Dial-Up Internet | 9 | 0.5% |
| Broadband Home | 1,362 | 69.8% |
| Cellular Data Only | 149 | 7.6% |
| Satellite Internet | 95 | 4.9% |
| No Internet | 381 | 19.5% |
| Total | 1,952 | 100.0% |
Garfield County Summary
Garfield County is located in the southeastern corner of Utah, and is bordered by Kane County to the north, San Juan County to the east, and Coconino County, Arizona to the south. The county seat is Panguitch, and the largest city is Escalante. The county was named after James A. Garfield, the 20th President of the United States.
Geography
Garfield County covers an area of 4,904 square miles, making it the fifth largest county in Utah. The county is located in the Colorado Plateau region of the state, and is characterized by its rugged terrain and high elevation. The county is home to several mountain ranges, including the Aquarius Plateau, the Kaiparowits Plateau, and the Paunsaugunt Plateau. The county is also home to several national parks and monuments, including Bryce Canyon National Park, Grand Staircase-Escalante National Monument, and Zion National Park.
The climate of Garfield County is semi-arid, with hot summers and cold winters. The average annual precipitation is 11.5 inches, and the average annual snowfall is 28.5 inches.
Demographics
As of the 2010 census, Garfield County had a population of 5,172. The population was spread out, with 25.2% under the age of 18, 8.2% from 18 to 24, 24.2% from 25 to 44, 28.2% from 45 to 64, and 14.2% who were 65 years of age or older. The median age was 39.4 years.
The racial makeup of the county was 94.2% White, 0.3% African American, 1.2% Native American, 0.3% Asian, 0.1% Pacific Islander, 2.2% from other races, and 1.7% from two or more races. Hispanic or Latino of any race were 4.3% of the population.
Economy
The economy of Garfield County is largely based on tourism, agriculture, and mining. The county is home to several national parks and monuments, which attract thousands of visitors each year. The county is also home to several farms and ranches, which produce hay, cattle, and other agricultural products. Mining is also an important part of the county's economy, with coal, copper, and uranium being the primary minerals mined.
The unemployment rate in Garfield County was 4.2% in 2019, which is lower than the national average of 3.7%. The median household income in the county was $45,845 in 2019, which is lower than the national average of $61,937.
Conclusion
Garfield County is located in the southeastern corner of Utah, and is bordered by Kane County to the north, San Juan County to the east, and Coconino County, Arizona to the south. The county is characterized by its rugged terrain and high elevation, and is home to several national parks and monuments. The economy of Garfield County is largely based on tourism, agriculture, and mining. The county has a population of 5,172, and the median household income is $45,845.
Common Questions
What is the Total Population of Garfield County?
Total Population of Garfield County is 5,121.
What is the Total Male Population of Garfield County?
Total Male Population of Garfield County is 2,635.
What is the Total Female Population of Garfield County?
Total Female Population of Garfield County is 2,486.
What is the Ratio of Males per 100 Females in Garfield County?
There are 105.99 Males per 100 Females in Garfield County.
What is the Ratio of Females per 100 Males in Garfield County?
There are 94.35 Females per 100 Males in Garfield County.
What is the Median Population Age in Garfield County?
Median Population Age in Garfield County is 40.4 Years.
What is the Average Family Size in Garfield County
Average Family Size in Garfield County is 3.0 People.
What is the Average Household Size in Garfield County
Average Household Size in Garfield County is 2.5 People.
What is Per Capita Income in Garfield County?
Per Capita income in Garfield County is $29,240.
What is the Median Family Income in Garfield County?
Median Family Income in Garfield County is $72,930.
What is the Median Household income in Garfield County?
Median Household Income in Garfield County is $56,481.
What is Income or Wage Gap in Garfield County?
Income or Wage Gap in Garfield County is 22.9%.
Women in Garfield County earn 77.1 cents for every dollar earned by a man.
What is Inequality or Gini Index in Garfield County?
Inequality or Gini Index in Garfield County is 0.43.
How Large is the Labor Force in Garfield County?
There are 2,443 People in the Labor Forcein in Garfield County.
What is the Percentage of People in the Labor Force in Garfield County?
59.3% of People are in the Labor Force in Garfield County.
What is the Unemployment Rate in Garfield County?
Unemployment Rate in Garfield County is 4.4%.