Emery County, UT
Emery County Map
Emery County Overview
9,898
TOTAL POPULATION
5,036
MALE POPULATION
4,862
FEMALE POPULATION
103.58
MALES / 100 FEMALES
96.54
FEMALES / 100 MALES
38.4
MEDIAN AGE
3.4
AVG FAMILY SIZE
2.8
AVG HOUSEHOLD SIZE
$27,771
PER CAPITA INCOME
$82,349
AVG FAMILY INCOME
$67,056
AVG HOUSEHOLD INCOME
67.9%
WAGE / INCOME GAP [ % ]
32.1¢/ $1
WAGE / INCOME GAP [ $ ]
$10,064
FAMILY INCOME DEFICIT
0.37
INEQUALITY / GINI INDEX
4,222
LABOR FORCE [ PEOPLE ]
56.6%
PERCENT IN LABOR FORCE
3.6%
UNEMPLOYMENT RATE
Emery County Area Codes
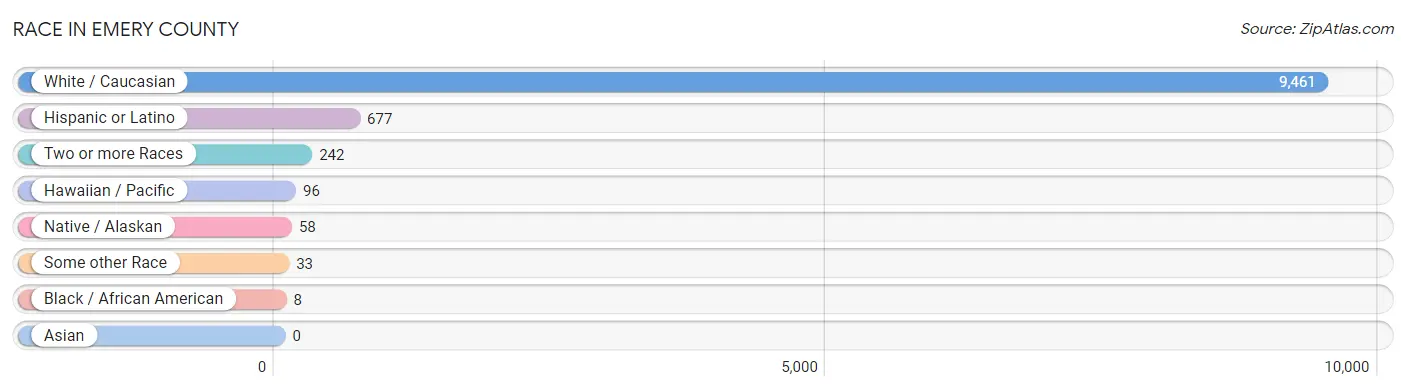
Race in Emery County
The most populous races in Emery County are White / Caucasian (9,461 | 95.6%), Hispanic or Latino (677 | 6.8%), and Two or more Races (242 | 2.4%).
| Race | # Population | % Population |
| Asian | 0 | 0.0% |
| Black / African American | 8 | 0.1% |
| Hawaiian / Pacific | 96 | 1.0% |
| Hispanic or Latino | 677 | 6.8% |
| Native / Alaskan | 58 | 0.6% |
| White / Caucasian | 9,461 | 95.6% |
| Two or more Races | 242 | 2.4% |
| Some other Race | 33 | 0.3% |
| Total | 9,898 | 100.0% |
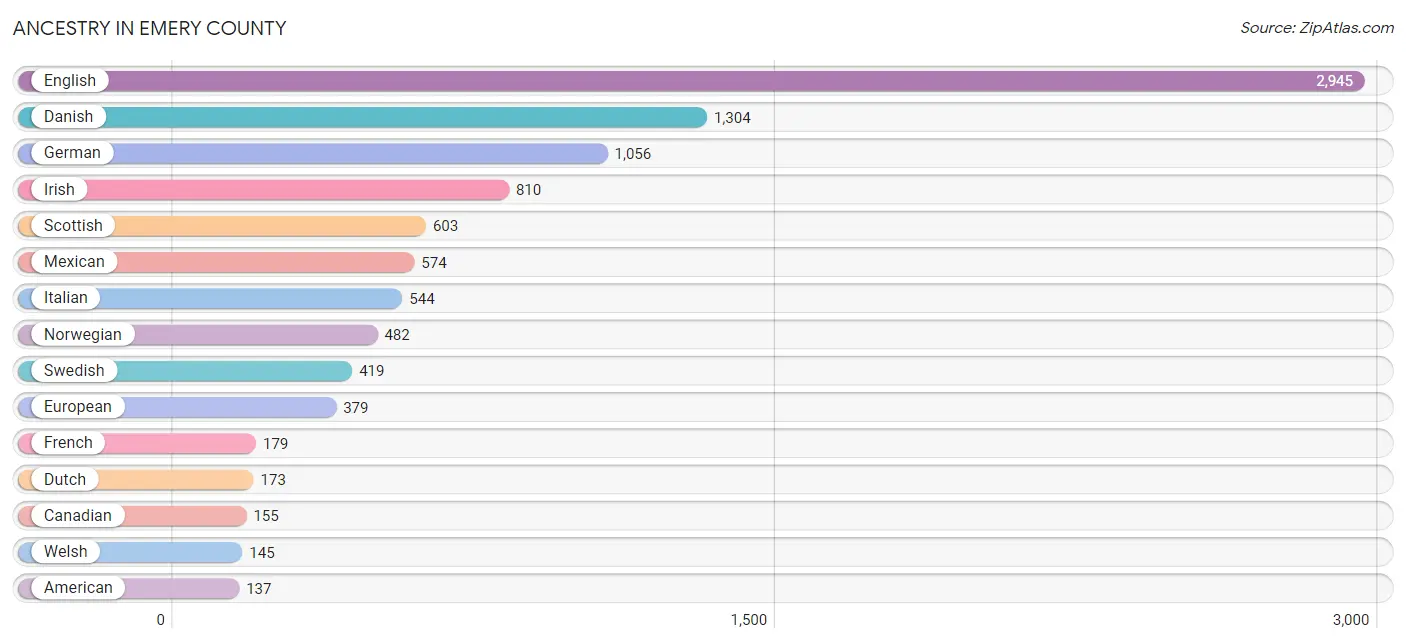
Ancestry in Emery County
The most populous ancestries reported in Emery County are English (2,945 | 29.7%), Danish (1,304 | 13.2%), German (1,056 | 10.7%), Irish (810 | 8.2%), and Scottish (603 | 6.1%), together accounting for 67.9% of all Emery County residents.
| Ancestry | # Population | % Population |
| Afghan | 61 | 0.6% |
| American | 137 | 1.4% |
| Austrian | 17 | 0.2% |
| Basque | 74 | 0.7% |
| British | 57 | 0.6% |
| Burmese | 57 | 0.6% |
| Canadian | 155 | 1.6% |
| Cherokee | 2 | 0.0% |
| Croatian | 1 | 0.0% |
| Danish | 1,304 | 13.2% |
| Dutch | 173 | 1.8% |
| English | 2,945 | 29.7% |
| European | 379 | 3.8% |
| Finnish | 24 | 0.2% |
| French | 179 | 1.8% |
| French Canadian | 15 | 0.2% |
| German | 1,056 | 10.7% |
| Greek | 29 | 0.3% |
| Irish | 810 | 8.2% |
| Italian | 544 | 5.5% |
| Mexican | 574 | 5.8% |
| Native Hawaiian | 96 | 1.0% |
| Navajo | 58 | 0.6% |
| Northern European | 9 | 0.1% |
| Norwegian | 482 | 4.9% |
| Polish | 47 | 0.5% |
| Portuguese | 4 | 0.0% |
| Romanian | 5 | 0.1% |
| Russian | 25 | 0.3% |
| Scandinavian | 36 | 0.4% |
| Scotch-Irish | 72 | 0.7% |
| Scottish | 603 | 6.1% |
| South American | 12 | 0.1% |
| Spaniard | 78 | 0.8% |
| Spanish | 12 | 0.1% |
| Swedish | 419 | 4.2% |
| Swiss | 35 | 0.4% |
| Ukrainian | 2 | 0.0% |
| Welsh | 145 | 1.5% |
| Yugoslavian | 38 | 0.4% | View All 40 Rows |
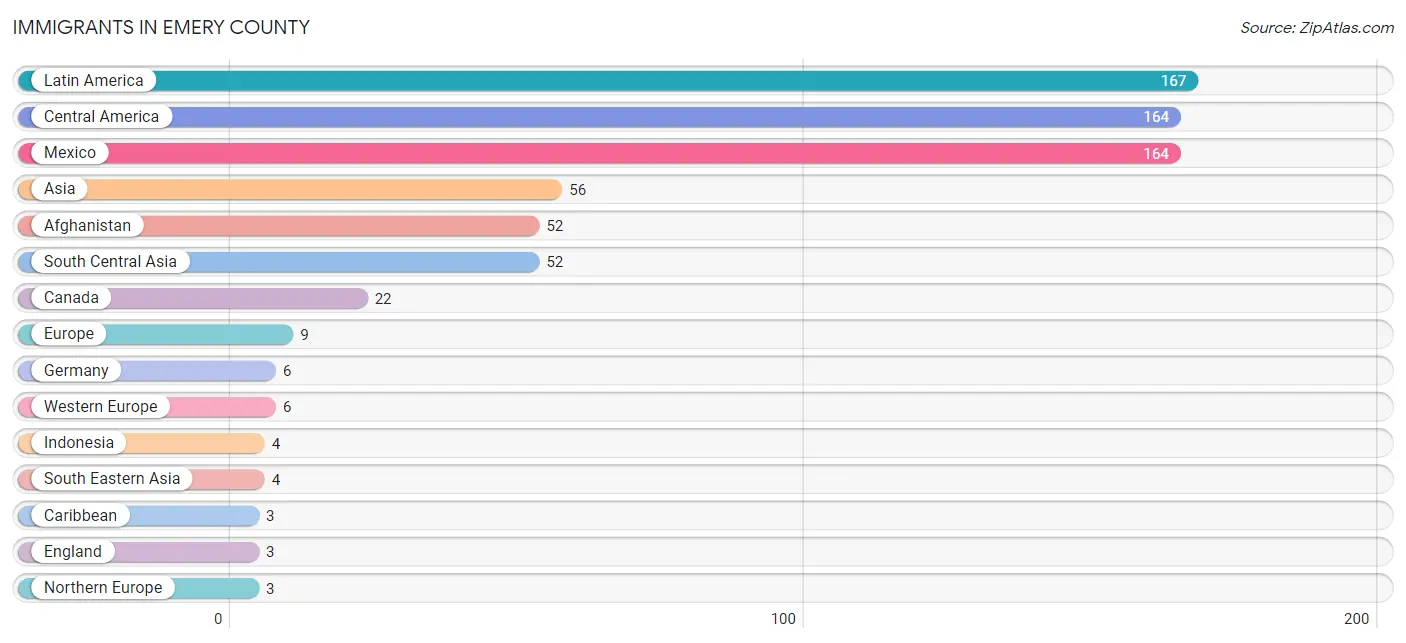
Immigrants in Emery County
The most numerous immigrant groups reported in Emery County came from Latin America (167 | 1.7%), Central America (164 | 1.7%), Mexico (164 | 1.7%), Asia (56 | 0.6%), and Afghanistan (52 | 0.5%), together accounting for 6.1% of all Emery County residents.
| Immigration Origin | # Population | % Population |
| Afghanistan | 52 | 0.5% |
| Asia | 56 | 0.6% |
| Canada | 22 | 0.2% |
| Caribbean | 3 | 0.0% |
| Central America | 164 | 1.7% |
| England | 3 | 0.0% |
| Europe | 9 | 0.1% |
| Germany | 6 | 0.1% |
| Indonesia | 4 | 0.0% |
| Latin America | 167 | 1.7% |
| Mexico | 164 | 1.7% |
| Northern Europe | 3 | 0.0% |
| South Central Asia | 52 | 0.5% |
| South Eastern Asia | 4 | 0.0% |
| Western Europe | 6 | 0.1% | View All 15 Rows |
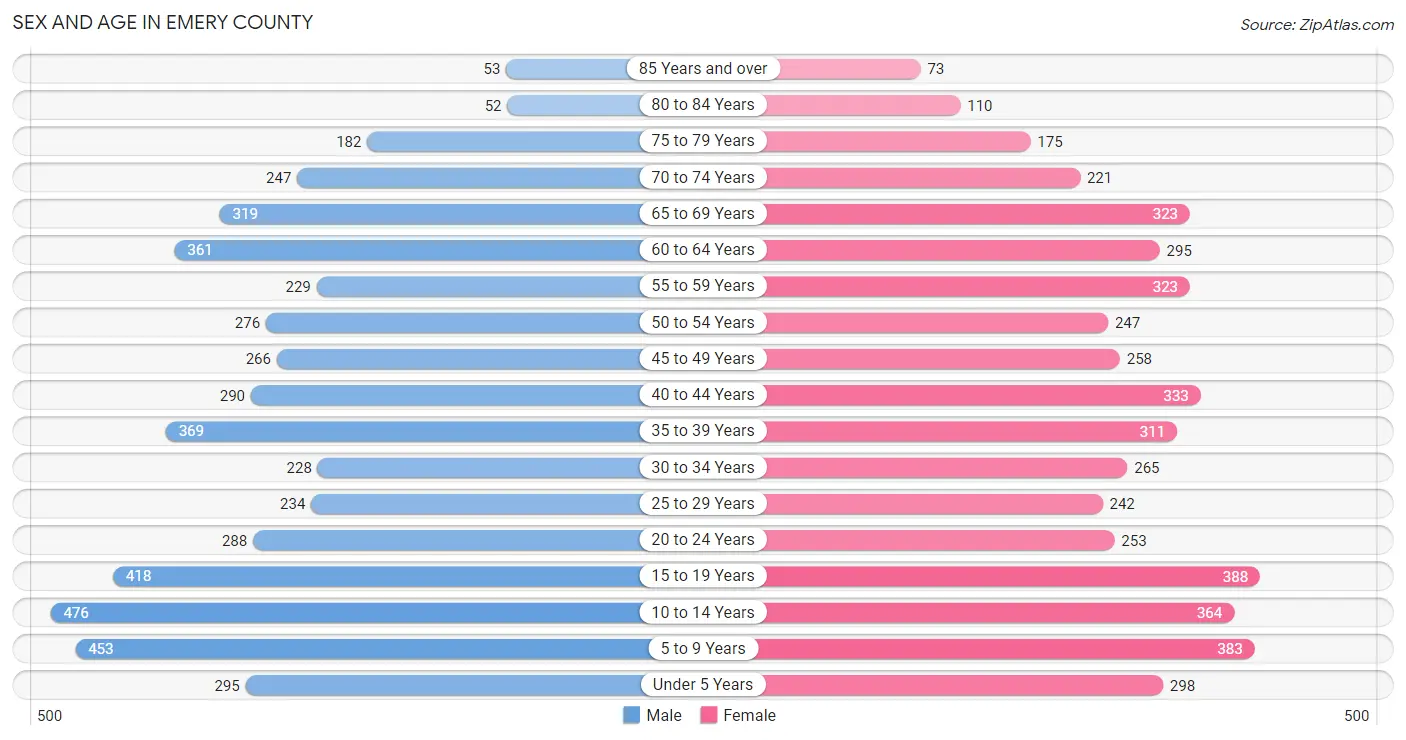
Sex and Age in Emery County
Sex and Age in Emery County
The most populous age groups in Emery County are 10 to 14 Years (476 | 9.5%) for men and 15 to 19 Years (388 | 8.0%) for women.
| Age Bracket | Male | Female |
| Under 5 Years | 295 (5.9%) | 298 (6.1%) |
| 5 to 9 Years | 453 (9.0%) | 383 (7.9%) |
| 10 to 14 Years | 476 (9.5%) | 364 (7.5%) |
| 15 to 19 Years | 418 (8.3%) | 388 (8.0%) |
| 20 to 24 Years | 288 (5.7%) | 253 (5.2%) |
| 25 to 29 Years | 234 (4.6%) | 242 (5.0%) |
| 30 to 34 Years | 228 (4.5%) | 265 (5.4%) |
| 35 to 39 Years | 369 (7.3%) | 311 (6.4%) |
| 40 to 44 Years | 290 (5.8%) | 333 (6.9%) |
| 45 to 49 Years | 266 (5.3%) | 258 (5.3%) |
| 50 to 54 Years | 276 (5.5%) | 247 (5.1%) |
| 55 to 59 Years | 229 (4.5%) | 323 (6.6%) |
| 60 to 64 Years | 361 (7.2%) | 295 (6.1%) |
| 65 to 69 Years | 319 (6.3%) | 323 (6.6%) |
| 70 to 74 Years | 247 (4.9%) | 221 (4.5%) |
| 75 to 79 Years | 182 (3.6%) | 175 (3.6%) |
| 80 to 84 Years | 52 (1.0%) | 110 (2.3%) |
| 85 Years and over | 53 (1.1%) | 73 (1.5%) |
| Total | 5,036 (100.0%) | 4,862 (100.0%) |
Families and Households in Emery County
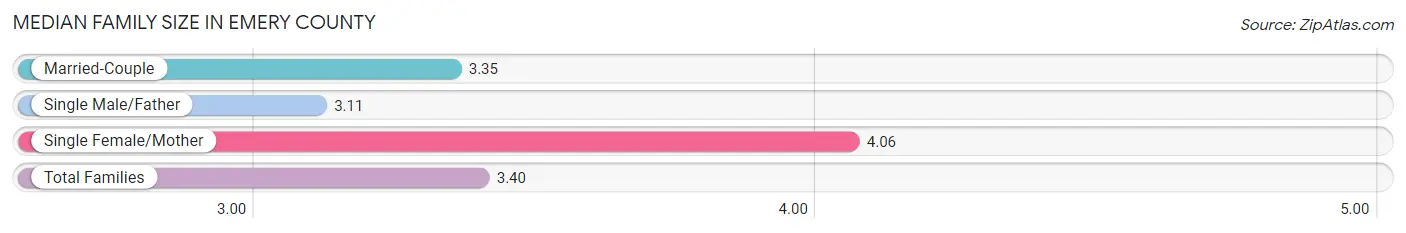
Median Family Size in Emery County
The median family size in Emery County is 3.40 persons per family, with single female/mother families (210 | 8.2%) accounting for the largest median family size of 4.06 persons per family. On the other hand, single male/father families (150 | 5.9%) represent the smallest median family size with 3.11 persons per family.
| Family Type | # Families | Family Size |
| Married-Couple | 2,193 (85.9%) | 3.35 |
| Single Male/Father | 150 (5.9%) | 3.11 |
| Single Female/Mother | 210 (8.2%) | 4.06 |
| Total Families | 2,553 (100.0%) | 3.40 |
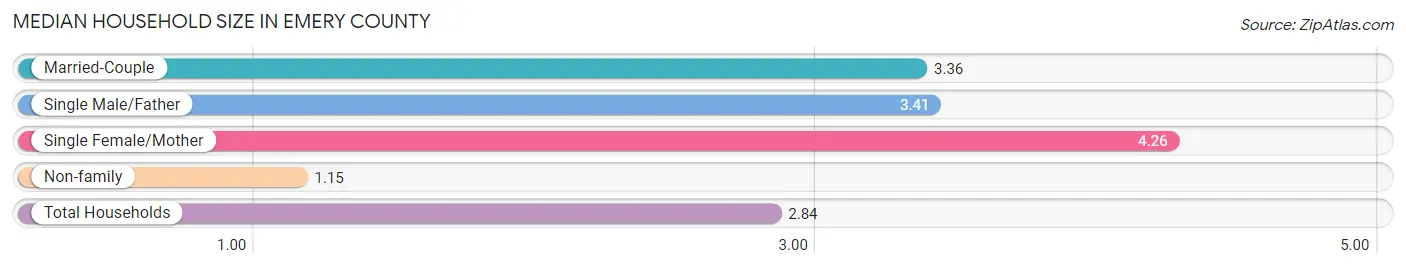
Median Household Size in Emery County
The median household size in Emery County is 2.84 persons per household, with single female/mother households (210 | 6.1%) accounting for the largest median household size of 4.26 persons per household. non-family households (894 | 25.9%) represent the smallest median household size with 1.15 persons per household.
| Household Type | # Households | Household Size |
| Married-Couple | 2,193 (63.6%) | 3.36 |
| Single Male/Father | 150 (4.3%) | 3.41 |
| Single Female/Mother | 210 (6.1%) | 4.26 |
| Non-family | 894 (25.9%) | 1.15 |
| Total Households | 3,447 (100.0%) | 2.84 |
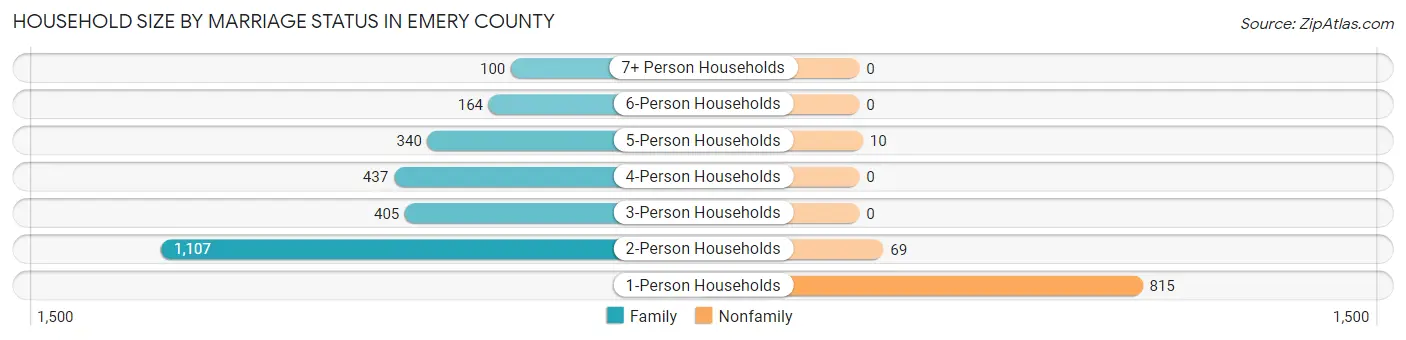
Household Size by Marriage Status in Emery County
Out of a total of 3,447 households in Emery County, 2,553 (74.1%) are family households, while 894 (25.9%) are nonfamily households. The most numerous type of family households are 2-person households, comprising 1,107, and the most common type of nonfamily households are 1-person households, comprising 815.
| Household Size | Family Households | Nonfamily Households |
| 1-Person Households | - | 815 (23.6%) |
| 2-Person Households | 1,107 (32.1%) | 69 (2.0%) |
| 3-Person Households | 405 (11.7%) | 0 (0.0%) |
| 4-Person Households | 437 (12.7%) | 0 (0.0%) |
| 5-Person Households | 340 (9.9%) | 10 (0.3%) |
| 6-Person Households | 164 (4.8%) | 0 (0.0%) |
| 7+ Person Households | 100 (2.9%) | 0 (0.0%) |
| Total | 2,553 (74.1%) | 894 (25.9%) |
Female Fertility in Emery County
Fertility by Age in Emery County
Average fertility rate in Emery County is 24.0 births per 1,000 women. Women in the age bracket of 20 to 34 years have the highest fertility rate with 59.0 births per 1,000 women. Women in the age bracket of 20 to 34 years acount for 84.9% of all women with births.
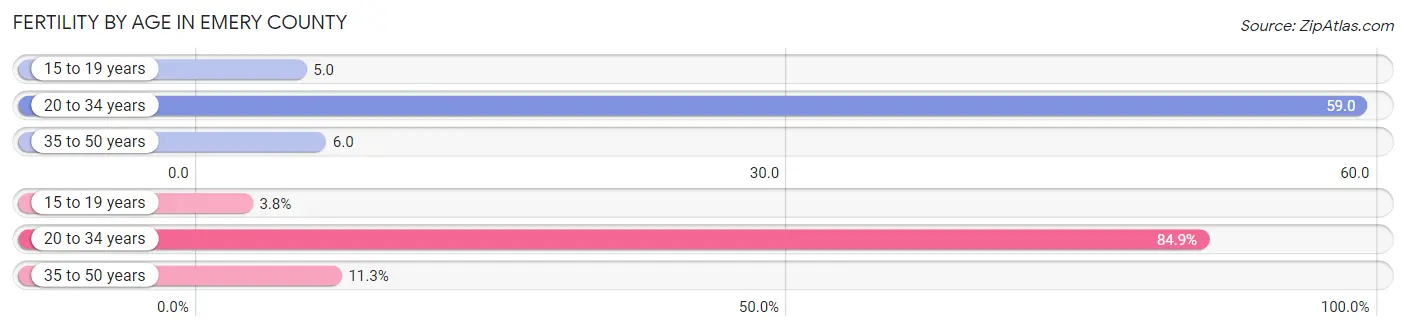
| Age Bracket | Women with Births | Births / 1,000 Women |
| 15 to 19 years | 2 (3.8%) | 5.0 |
| 20 to 34 years | 45 (84.9%) | 59.0 |
| 35 to 50 years | 6 (11.3%) | 6.0 |
| Total | 53 (100.0%) | 24.0 |
Fertility by Age by Marriage Status in Emery County
92.5% of women with births (53) in Emery County are married. The highest percentage of unmarried women with births falls into 20 to 34 years age bracket with 8.9% of them unmarried at the time of birth, while the lowest percentage of unmarried women with births belong to 15 to 19 years age bracket with 0.0% of them unmarried.
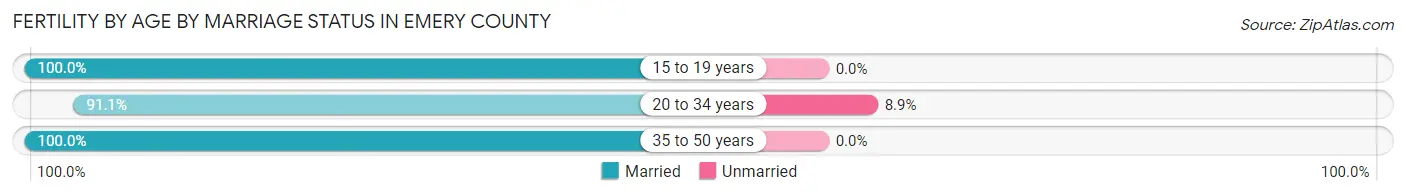
| Age Bracket | Married | Unmarried |
| 15 to 19 years | 2 (100.0%) | 0 (0.0%) |
| 20 to 34 years | 41 (91.1%) | 4 (8.9%) |
| 35 to 50 years | 6 (100.0%) | 0 (0.0%) |
| Total | 49 (92.4%) | 4 (7.5%) |
Fertility by Education in Emery County
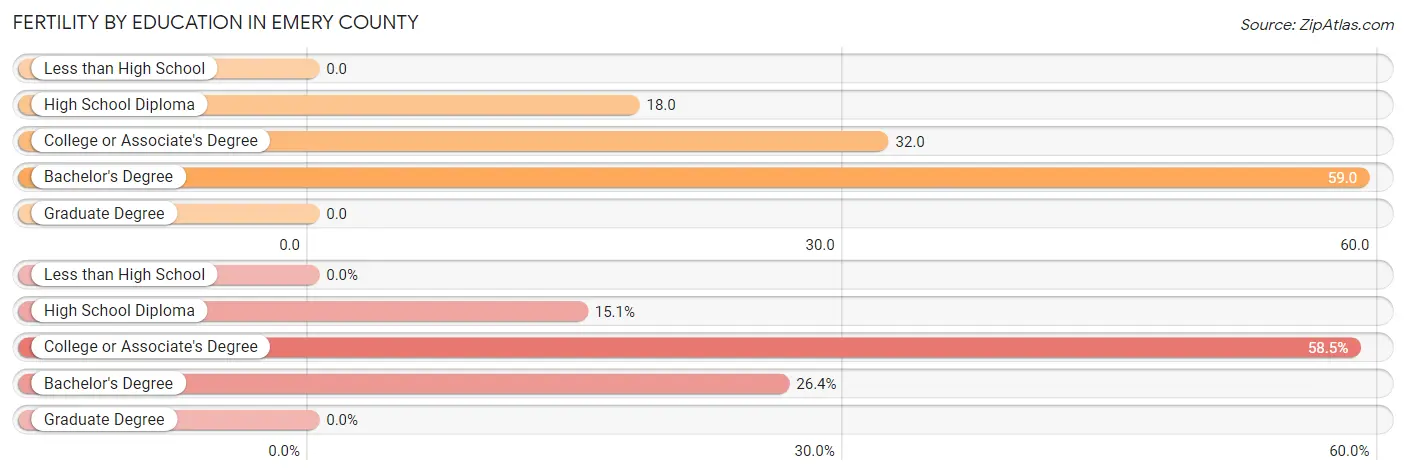
| Educational Attainment | Women with Births | Births / 1,000 Women |
| Less than High School | 0 (0.0%) | 0.0 |
| High School Diploma | 8 (15.1%) | 18.0 |
| College or Associate's Degree | 31 (58.5%) | 32.0 |
| Bachelor's Degree | 14 (26.4%) | 59.0 |
| Graduate Degree | 0 (0.0%) | 0.0 |
| Total | 53 (100.0%) | 24.0 |
Fertility by Education by Marriage Status in Emery County
7.5% of women with births in Emery County are unmarried. Women with the educational attainment of high school diploma are most likely to be married with 100.0% of them married at childbirth, while women with the educational attainment of bachelor's degree are least likely to be married with 28.6% of them unmarried at childbirth.
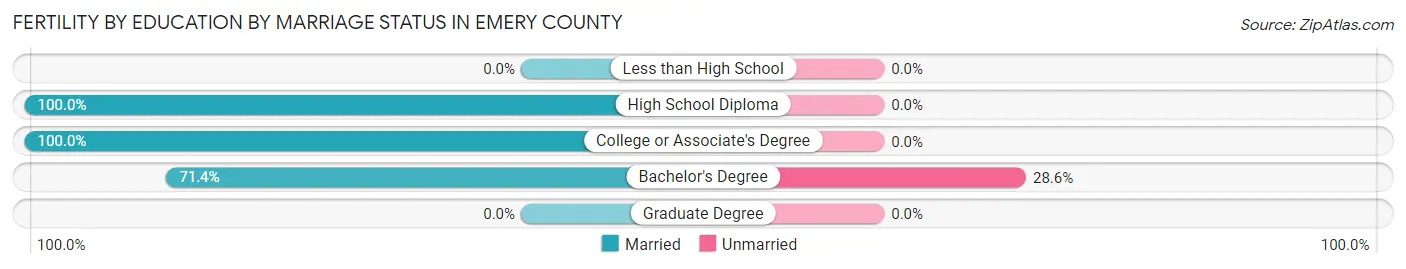
| Educational Attainment | Married | Unmarried |
| Less than High School | 0 (0.0%) | 0 (0.0%) |
| High School Diploma | 8 (100.0%) | 0 (0.0%) |
| College or Associate's Degree | 31 (100.0%) | 0 (0.0%) |
| Bachelor's Degree | 10 (71.4%) | 4 (28.6%) |
| Graduate Degree | 0 (0.0%) | 0 (0.0%) |
| Total | 49 (92.4%) | 4 (7.5%) |
Income in Emery County
Income Overview in Emery County
Per Capita Income in Emery County is $27,771, while median incomes of families and households are $82,349 and $67,056 respectively.
| Characteristic | Number | Measure |
| Per Capita Income | 9,898 | $27,771 |
| Median Family Income | 2,553 | $82,349 |
| Mean Family Income | 2,553 | $91,898 |
| Median Household Income | 3,447 | $67,056 |
| Mean Household Income | 3,447 | $78,765 |
| Income Deficit | 2,553 | $10,064 |
| Wage / Income Gap (%) | 9,898 | 67.91% |
| Wage / Income Gap ($) | 9,898 | 32.09¢ per $1 |
| Gini / Inequality Index | 9,898 | 0.37 |
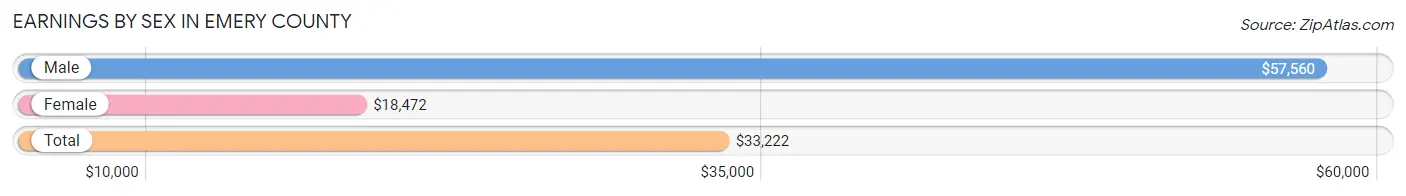
Earnings by Sex in Emery County
Average Earnings in Emery County are $33,222, $57,560 for men and $18,472 for women, a difference of 67.9%.
| Sex | Number | Average Earnings |
| Male | 2,522 (54.9%) | $57,560 |
| Female | 2,068 (45.1%) | $18,472 |
| Total | 4,590 (100.0%) | $33,222 |
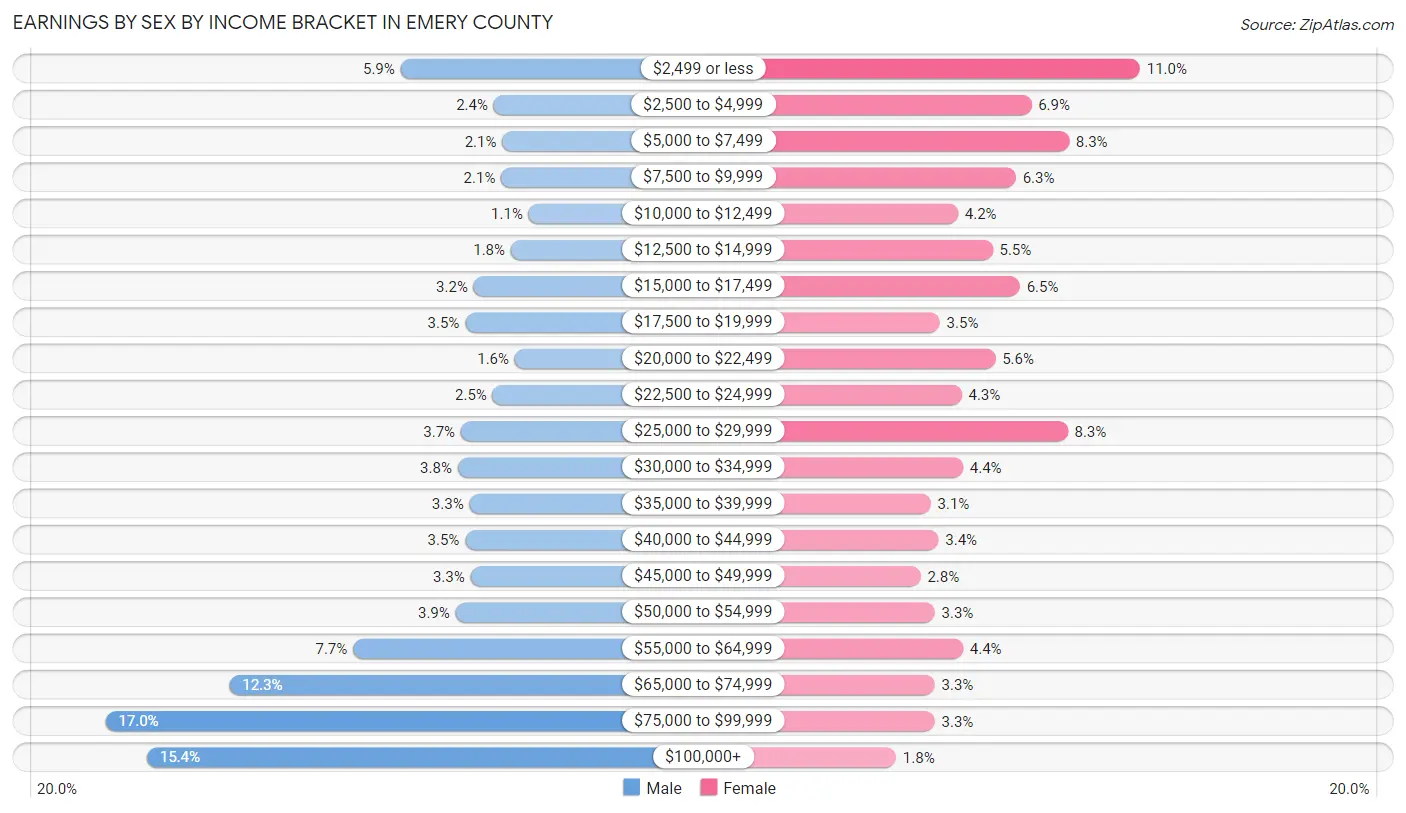
Earnings by Sex by Income Bracket in Emery County
The most common earnings brackets in Emery County are $75,000 to $99,999 for men (428 | 17.0%) and $2,499 or less for women (227 | 11.0%).
| Income | Male | Female |
| $2,499 or less | 149 (5.9%) | 227 (11.0%) |
| $2,500 to $4,999 | 61 (2.4%) | 143 (6.9%) |
| $5,000 to $7,499 | 53 (2.1%) | 172 (8.3%) |
| $7,500 to $9,999 | 54 (2.1%) | 131 (6.3%) |
| $10,000 to $12,499 | 28 (1.1%) | 86 (4.2%) |
| $12,500 to $14,999 | 45 (1.8%) | 113 (5.5%) |
| $15,000 to $17,499 | 80 (3.2%) | 134 (6.5%) |
| $17,500 to $19,999 | 88 (3.5%) | 72 (3.5%) |
| $20,000 to $22,499 | 41 (1.6%) | 115 (5.6%) |
| $22,500 to $24,999 | 62 (2.5%) | 89 (4.3%) |
| $25,000 to $29,999 | 92 (3.6%) | 171 (8.3%) |
| $30,000 to $34,999 | 95 (3.8%) | 90 (4.3%) |
| $35,000 to $39,999 | 84 (3.3%) | 65 (3.1%) |
| $40,000 to $44,999 | 88 (3.5%) | 71 (3.4%) |
| $45,000 to $49,999 | 83 (3.3%) | 57 (2.8%) |
| $50,000 to $54,999 | 97 (3.8%) | 68 (3.3%) |
| $55,000 to $64,999 | 194 (7.7%) | 90 (4.3%) |
| $65,000 to $74,999 | 311 (12.3%) | 68 (3.3%) |
| $75,000 to $99,999 | 428 (17.0%) | 68 (3.3%) |
| $100,000+ | 389 (15.4%) | 38 (1.8%) |
| Total | 2,522 (100.0%) | 2,068 (100.0%) |
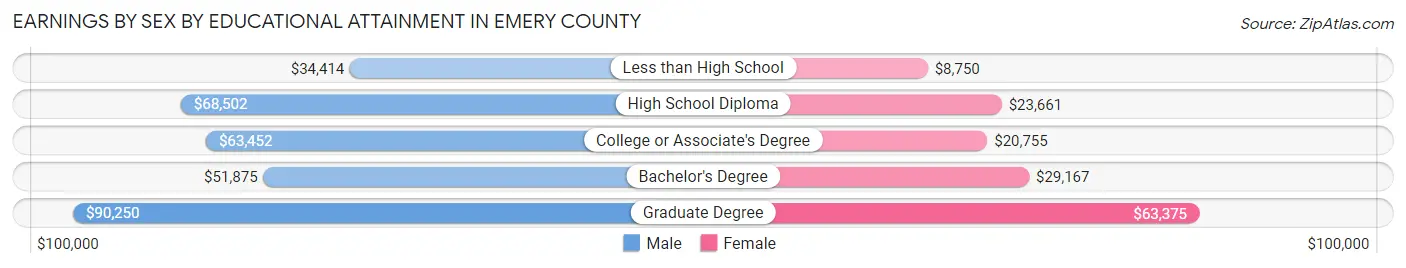
Earnings by Sex by Educational Attainment in Emery County
Average earnings in Emery County are $67,710 for men and $22,120 for women, a difference of 67.3%. Men with an educational attainment of graduate degree enjoy the highest average annual earnings of $90,250, while those with less than high school education earn the least with $34,414. Women with an educational attainment of graduate degree earn the most with the average annual earnings of $63,375, while those with less than high school education have the smallest earnings of $8,750.
| Educational Attainment | Male Income | Female Income |
| Less than High School | $34,414 | $8,750 |
| High School Diploma | $68,502 | $23,661 |
| College or Associate's Degree | $63,452 | $20,755 |
| Bachelor's Degree | $51,875 | $29,167 |
| Graduate Degree | $90,250 | $63,375 |
| Total | $67,710 | $22,120 |
Family Income in Emery County
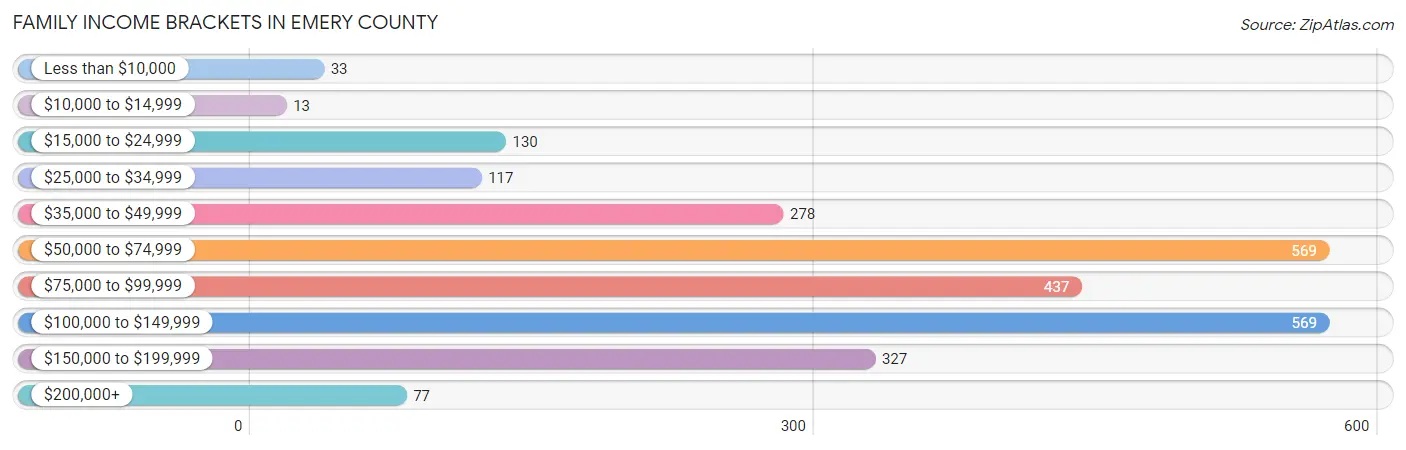
Family Income Brackets in Emery County
According to the Emery County family income data, there are 569 families falling into the $50,000 to $74,999 income range, which is the most common income bracket and makes up 22.3% of all families. Conversely, the $10,000 to $14,999 income bracket is the least frequent group with only 13 families (0.5%) belonging to this category.
| Income Bracket | # Families | % Families |
| Less than $10,000 | 33 | 1.3% |
| $10,000 to $14,999 | 13 | 0.5% |
| $15,000 to $24,999 | 130 | 5.1% |
| $25,000 to $34,999 | 117 | 4.6% |
| $35,000 to $49,999 | 278 | 10.9% |
| $50,000 to $74,999 | 569 | 22.3% |
| $75,000 to $99,999 | 437 | 17.1% |
| $100,000 to $149,999 | 569 | 22.3% |
| $150,000 to $199,999 | 327 | 12.8% |
| $200,000+ | 77 | 3.0% |
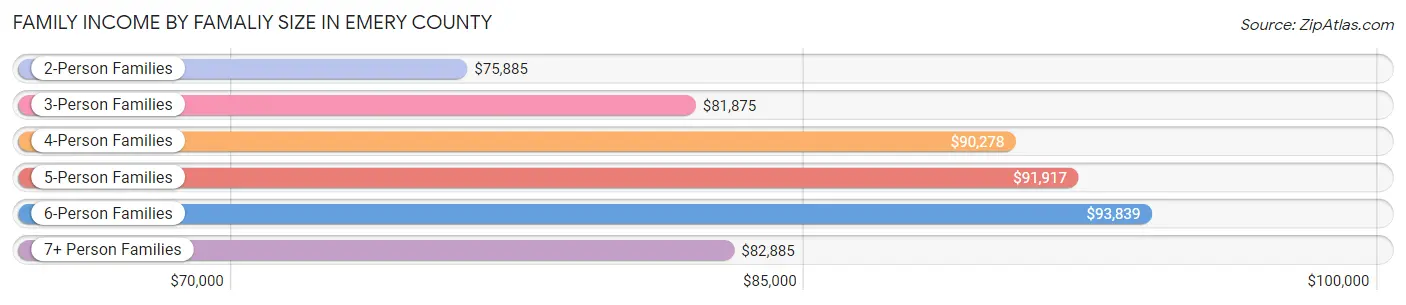
Family Income by Famaliy Size in Emery County
6-person families (143 | 5.6%) account for the highest median family income in Emery County with $93,839 per family, while 2-person families (1,123 | 44.0%) have the highest median income of $37,942 per family member.
| Income Bracket | # Families | Median Income |
| 2-Person Families | 1,123 (44.0%) | $75,885 |
| 3-Person Families | 431 (16.9%) | $81,875 |
| 4-Person Families | 402 (15.8%) | $90,278 |
| 5-Person Families | 354 (13.9%) | $91,917 |
| 6-Person Families | 143 (5.6%) | $93,839 |
| 7+ Person Families | 100 (3.9%) | $82,885 |
| Total | 2,553 (100.0%) | $82,349 |
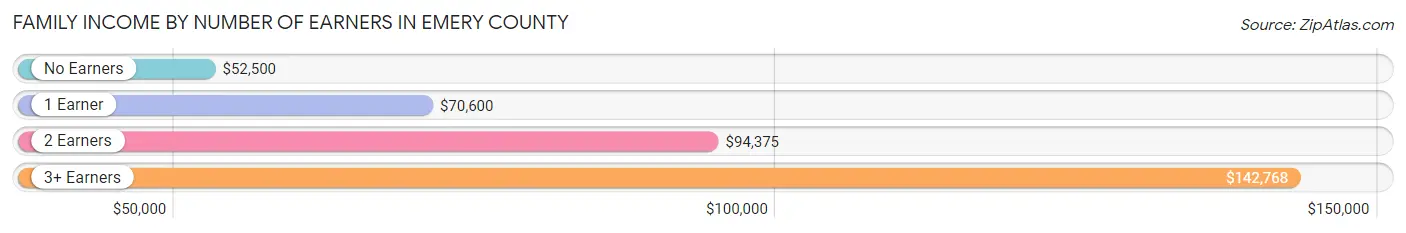
Family Income by Number of Earners in Emery County
The median family income in Emery County is $82,349, with families comprising 3+ earners (311) having the highest median family income of $142,768, while families with no earners (428) have the lowest median family income of $52,500, accounting for 12.2% and 16.8% of families, respectively.
| Number of Earners | # Families | Median Income |
| No Earners | 428 (16.8%) | $52,500 |
| 1 Earner | 874 (34.2%) | $70,600 |
| 2 Earners | 940 (36.8%) | $94,375 |
| 3+ Earners | 311 (12.2%) | $142,768 |
| Total | 2,553 (100.0%) | $82,349 |
Household Income in Emery County
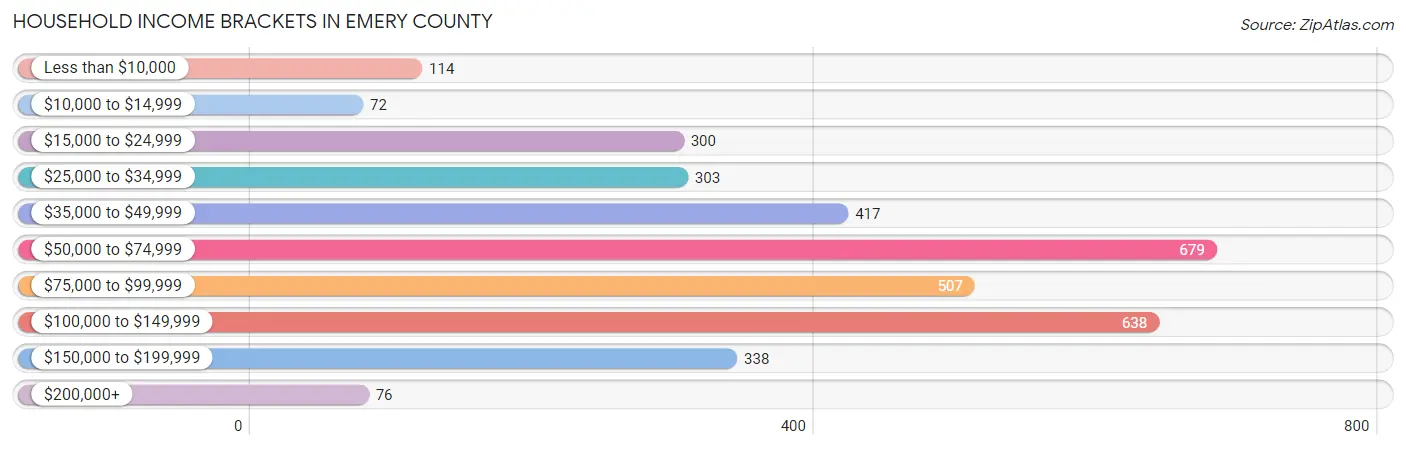
Household Income Brackets in Emery County
With 679 households falling in the category, the $50,000 to $74,999 income range is the most frequent in Emery County, accounting for 19.7% of all households. In contrast, only 72 households (2.1%) fall into the $10,000 to $14,999 income bracket, making it the least populous group.
| Income Bracket | # Households | % Households |
| Less than $10,000 | 114 | 3.3% |
| $10,000 to $14,999 | 72 | 2.1% |
| $15,000 to $24,999 | 300 | 8.7% |
| $25,000 to $34,999 | 303 | 8.8% |
| $35,000 to $49,999 | 417 | 12.1% |
| $50,000 to $74,999 | 679 | 19.7% |
| $75,000 to $99,999 | 507 | 14.7% |
| $100,000 to $149,999 | 638 | 18.5% |
| $150,000 to $199,999 | 338 | 9.8% |
| $200,000+ | 76 | 2.2% |
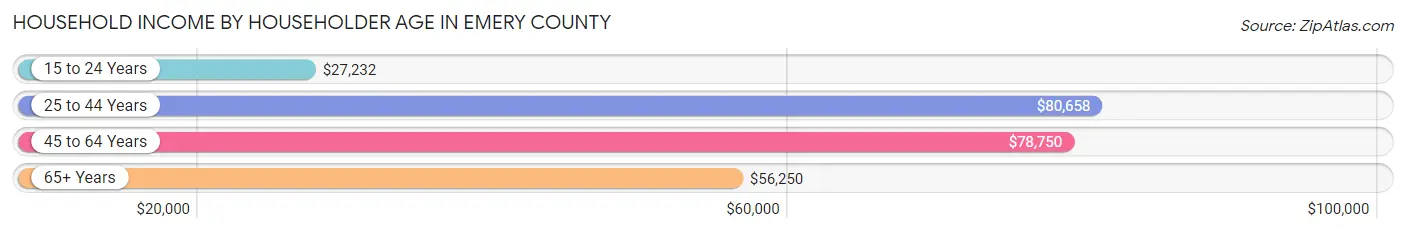
Household Income by Householder Age in Emery County
The median household income in Emery County is $67,056, with the highest median household income of $80,658 found in the 25 to 44 years age bracket for the primary householder. A total of 1,042 households (30.2%) fall into this category. Meanwhile, the 15 to 24 years age bracket for the primary householder has the lowest median household income of $27,232, with 150 households (4.3%) in this group.
| Income Bracket | # Households | Median Income |
| 15 to 24 Years | 150 (4.3%) | $27,232 |
| 25 to 44 Years | 1,042 (30.2%) | $80,658 |
| 45 to 64 Years | 1,212 (35.2%) | $78,750 |
| 65+ Years | 1,043 (30.3%) | $56,250 |
| Total | 3,447 (100.0%) | $67,056 |
Poverty in Emery County
Income Below Poverty by Sex and Age in Emery County
With 9.9% poverty level for males and 13.8% for females among the residents of Emery County, 6 to 11 year old males and 15 year old females are the most vulnerable to poverty, with 133 males (23.5%) and 29 females (32.6%) in their respective age groups living below the poverty level.
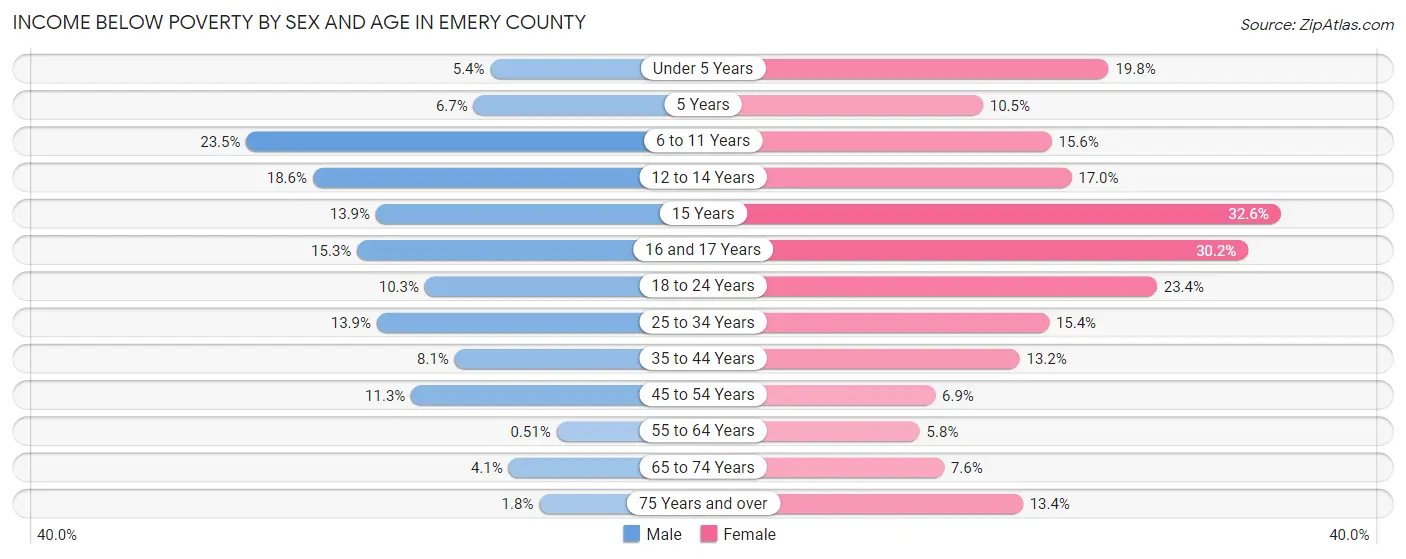
| Age Bracket | Male | Female |
| Under 5 Years | 16 (5.4%) | 59 (19.8%) |
| 5 Years | 5 (6.7%) | 9 (10.5%) |
| 6 to 11 Years | 133 (23.5%) | 67 (15.6%) |
| 12 to 14 Years | 45 (18.6%) | 38 (17.0%) |
| 15 Years | 11 (13.9%) | 29 (32.6%) |
| 16 and 17 Years | 32 (15.3%) | 54 (30.2%) |
| 18 to 24 Years | 43 (10.3%) | 87 (23.4%) |
| 25 to 34 Years | 64 (13.9%) | 78 (15.4%) |
| 35 to 44 Years | 53 (8.1%) | 85 (13.2%) |
| 45 to 54 Years | 61 (11.3%) | 35 (6.9%) |
| 55 to 64 Years | 3 (0.5%) | 35 (5.8%) |
| 65 to 74 Years | 23 (4.1%) | 41 (7.6%) |
| 75 Years and over | 5 (1.8%) | 45 (13.4%) |
| Total | 494 (9.9%) | 662 (13.8%) |
Income Above Poverty by Sex and Age in Emery County
According to the poverty statistics in Emery County, males aged 55 to 64 years and females aged 55 to 64 years are the age groups that are most secure financially, with 99.5% of males and 94.2% of females in these age groups living above the poverty line.
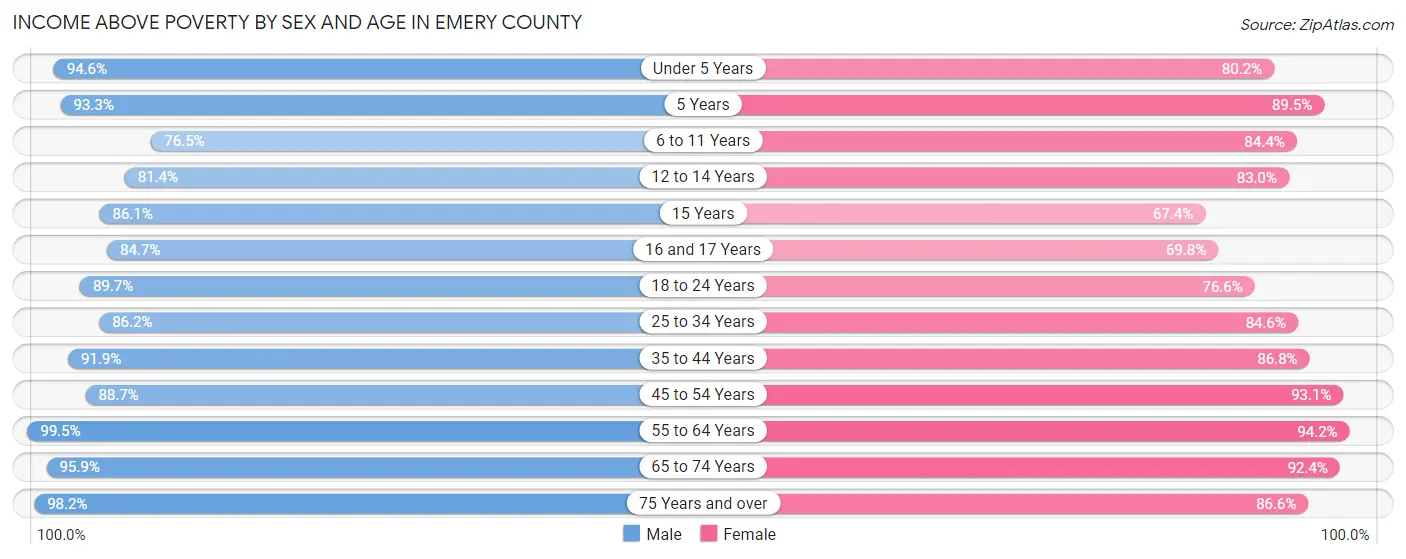
| Age Bracket | Male | Female |
| Under 5 Years | 279 (94.6%) | 239 (80.2%) |
| 5 Years | 70 (93.3%) | 77 (89.5%) |
| 6 to 11 Years | 432 (76.5%) | 363 (84.4%) |
| 12 to 14 Years | 197 (81.4%) | 185 (83.0%) |
| 15 Years | 68 (86.1%) | 60 (67.4%) |
| 16 and 17 Years | 177 (84.7%) | 125 (69.8%) |
| 18 to 24 Years | 375 (89.7%) | 285 (76.6%) |
| 25 to 34 Years | 398 (86.2%) | 429 (84.6%) |
| 35 to 44 Years | 604 (91.9%) | 559 (86.8%) |
| 45 to 54 Years | 479 (88.7%) | 470 (93.1%) |
| 55 to 64 Years | 587 (99.5%) | 571 (94.2%) |
| 65 to 74 Years | 542 (95.9%) | 500 (92.4%) |
| 75 Years and over | 274 (98.2%) | 290 (86.6%) |
| Total | 4,482 (90.1%) | 4,153 (86.3%) |
Income Below Poverty Among Married-Couple Families in Emery County
The poverty statistics for married-couple families in Emery County show that 3.4% or 74 of the total 2,193 families live below the poverty line. Families with 5 or more children have the highest poverty rate of 12.5%, comprising of 8 families. On the other hand, families with no children have the lowest poverty rate of 0.6%, which includes 7 families.
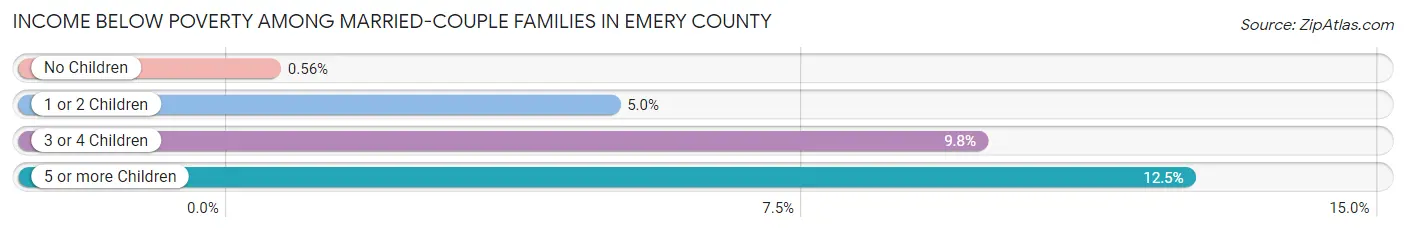
| Children | Above Poverty | Below Poverty |
| No Children | 1,254 (99.4%) | 7 (0.6%) |
| 1 or 2 Children | 514 (95.0%) | 27 (5.0%) |
| 3 or 4 Children | 295 (90.2%) | 32 (9.8%) |
| 5 or more Children | 56 (87.5%) | 8 (12.5%) |
| Total | 2,119 (96.6%) | 74 (3.4%) |
Income Below Poverty Among Single-Parent Households in Emery County
According to the poverty data in Emery County, 8.7% or 13 single-father households and 40.5% or 85 single-mother households are living below the poverty line. Among single-father households, those with 3 or 4 children have the highest poverty rate, with 3 households (17.6%) experiencing poverty. Likewise, among single-mother households, those with 5 or more children have the highest poverty rate, with 9 households (100.0%) falling below the poverty line.
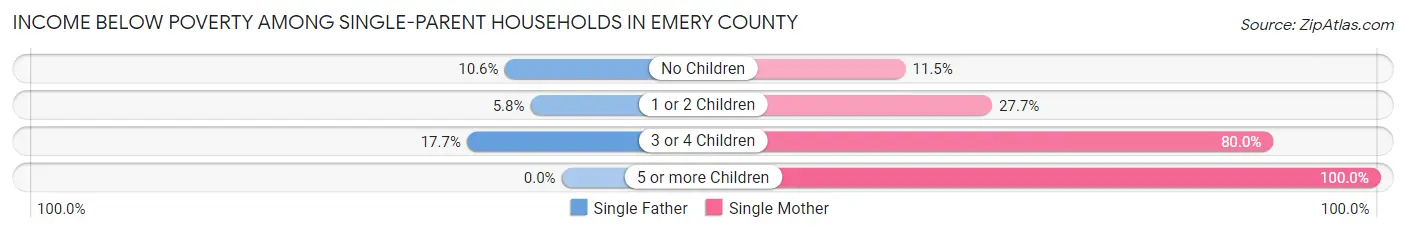
| Children | Single Father | Single Mother |
| No Children | 5 (10.6%) | 6 (11.5%) |
| 1 or 2 Children | 5 (5.8%) | 26 (27.7%) |
| 3 or 4 Children | 3 (17.6%) | 44 (80.0%) |
| 5 or more Children | 0 (0.0%) | 9 (100.0%) |
| Total | 13 (8.7%) | 85 (40.5%) |
Income Below Poverty Among Married-Couple vs Single-Parent Households in Emery County
The poverty data for Emery County shows that 74 of the married-couple family households (3.4%) and 98 of the single-parent households (27.2%) are living below the poverty level. Within the married-couple family households, those with 5 or more children have the highest poverty rate, with 8 households (12.5%) falling below the poverty line. Among the single-parent households, those with 5 or more children have the highest poverty rate, with 9 household (100.0%) living below poverty.
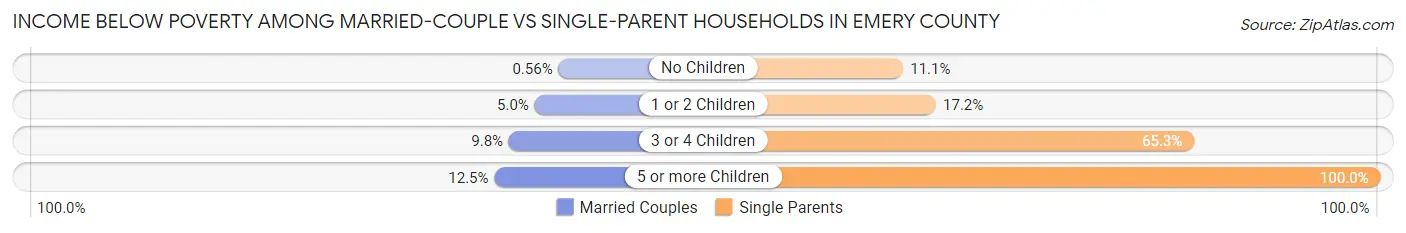
| Children | Married-Couple Families | Single-Parent Households |
| No Children | 7 (0.6%) | 11 (11.1%) |
| 1 or 2 Children | 27 (5.0%) | 31 (17.2%) |
| 3 or 4 Children | 32 (9.8%) | 47 (65.3%) |
| 5 or more Children | 8 (12.5%) | 9 (100.0%) |
| Total | 74 (3.4%) | 98 (27.2%) |
Employment Characteristics in Emery County
Employment by Class of Employer in Emery County
Among the 3,955 employed individuals in Emery County, private company employees (2,725 | 68.9%), local government employees (590 | 14.9%), and state government employees (240 | 6.1%) make up the most common classes of employment.
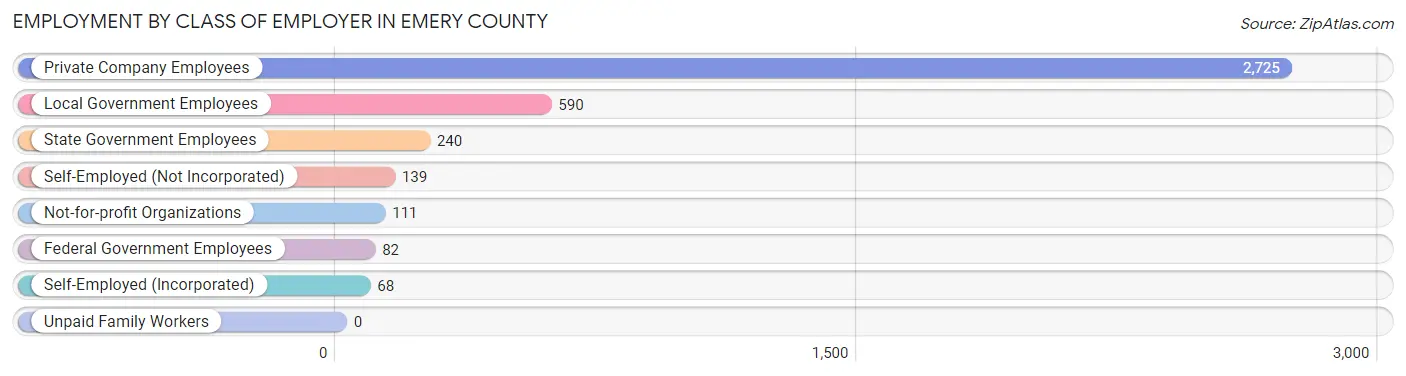
| Employer Class | # Employees | % Employees |
| Private Company Employees | 2,725 | 68.9% |
| Self-Employed (Incorporated) | 68 | 1.7% |
| Self-Employed (Not Incorporated) | 139 | 3.5% |
| Not-for-profit Organizations | 111 | 2.8% |
| Local Government Employees | 590 | 14.9% |
| State Government Employees | 240 | 6.1% |
| Federal Government Employees | 82 | 2.1% |
| Unpaid Family Workers | 0 | 0.0% |
| Total | 3,955 | 100.0% |
Employment Status by Age in Emery County
According to the labor force statistics for Emery County, out of the total population over 16 years of age (7,460), 56.6% or 4,222 individuals are in the labor force, with 3.6% or 152 of them unemployed. The age group with the highest labor force participation rate is 35 to 44 years, with 82.3% or 1,072 individuals in the labor force. Within the labor force, the 20 to 24 years age range has the highest percentage of unemployed individuals, with 12.3% or 50 of them being unemployed.
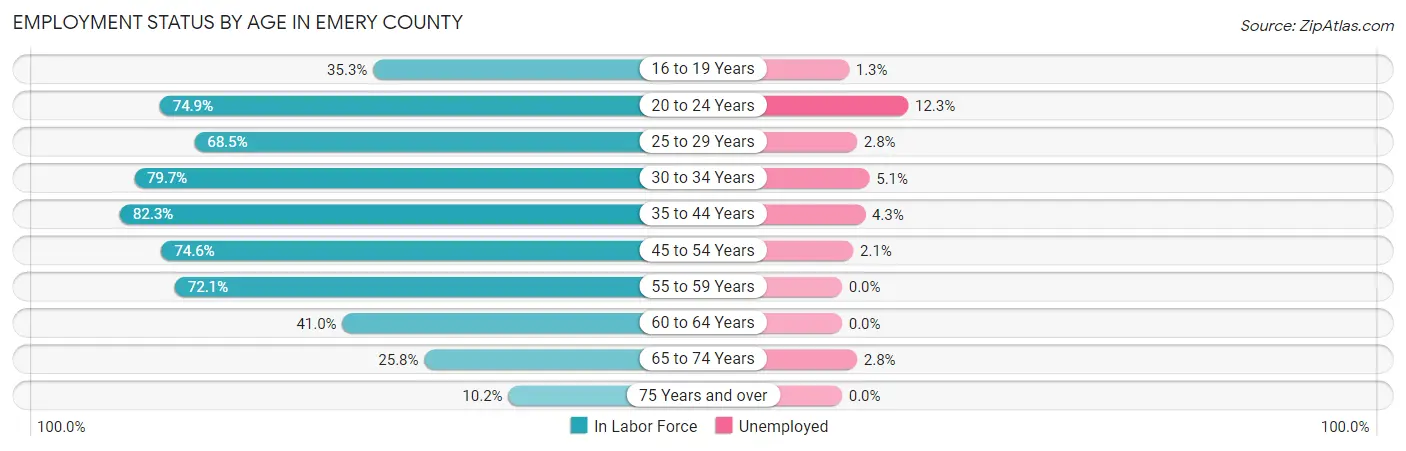
| Age Bracket | In Labor Force | Unemployed |
| 16 to 19 Years | 225 (35.3%) | 3 (1.3%) |
| 20 to 24 Years | 405 (74.9%) | 50 (12.3%) |
| 25 to 29 Years | 326 (68.5%) | 9 (2.8%) |
| 30 to 34 Years | 393 (79.7%) | 20 (5.1%) |
| 35 to 44 Years | 1,072 (82.3%) | 46 (4.3%) |
| 45 to 54 Years | 781 (74.6%) | 16 (2.1%) |
| 55 to 59 Years | 398 (72.1%) | 0 (0.0%) |
| 60 to 64 Years | 269 (41.0%) | 0 (0.0%) |
| 65 to 74 Years | 286 (25.8%) | 8 (2.8%) |
| 75 Years and over | 66 (10.2%) | 0 (0.0%) |
| Total | 4,222 (56.6%) | 152 (3.6%) |
Employment Status by Educational Attainment in Emery County
According to labor force statistics for Emery County, 71.6% of individuals (3,241) out of the total population between 25 and 64 years of age (4,527) are in the labor force, with 2.8% or 91 of them being unemployed. The group with the highest labor force participation rate are those with the educational attainment of bachelor's degree or higher, with 81.8% or 541 individuals in the labor force. Within the labor force, individuals with college / associate degree education have the highest percentage of unemployment, with 3.7% or 58 of them being unemployed.
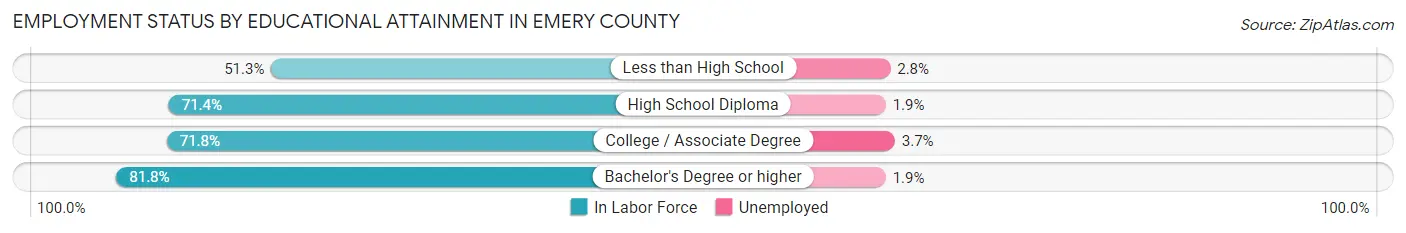
| Educational Attainment | In Labor Force | Unemployed |
| Less than High School | 176 (51.3%) | 10 (2.8%) |
| High School Diploma | 965 (71.4%) | 26 (1.9%) |
| College / Associate Degree | 1,559 (71.8%) | 80 (3.7%) |
| Bachelor's Degree or higher | 541 (81.8%) | 13 (1.9%) |
| Total | 3,241 (71.6%) | 127 (2.8%) |
Employment Occupations by Sex in Emery County
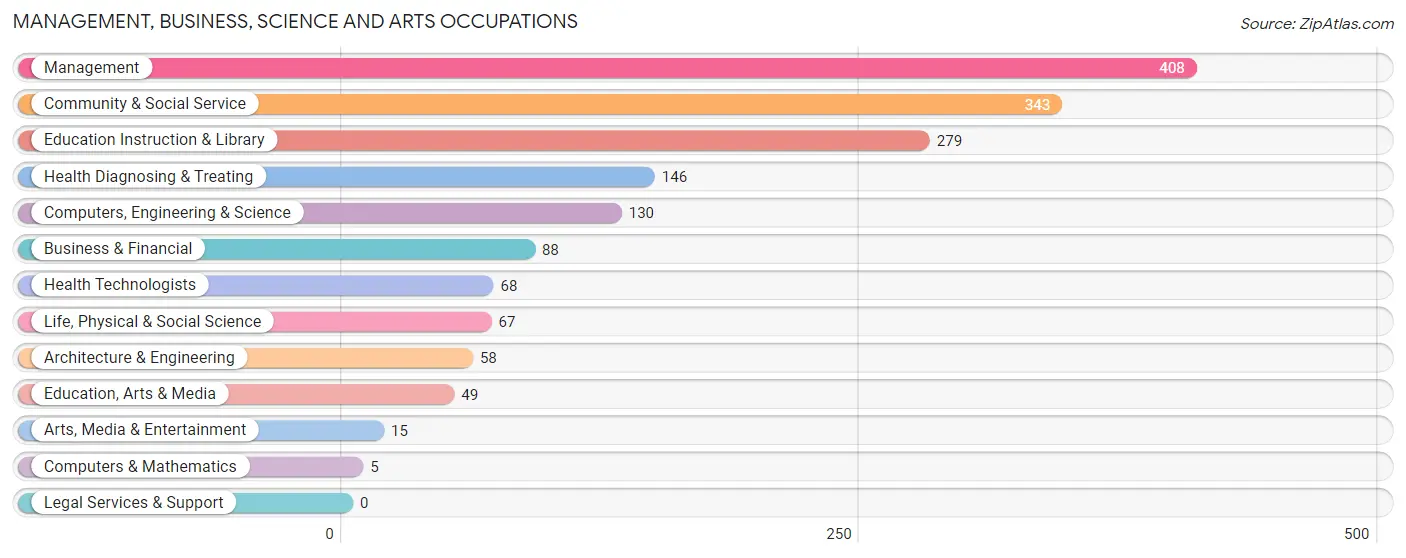
Management, Business, Science and Arts Occupations
The most common Management, Business, Science and Arts occupations in Emery County are Management (408 | 10.1%), Community & Social Service (343 | 8.5%), Education Instruction & Library (279 | 6.9%), Health Diagnosing & Treating (146 | 3.6%), and Computers, Engineering & Science (130 | 3.2%).
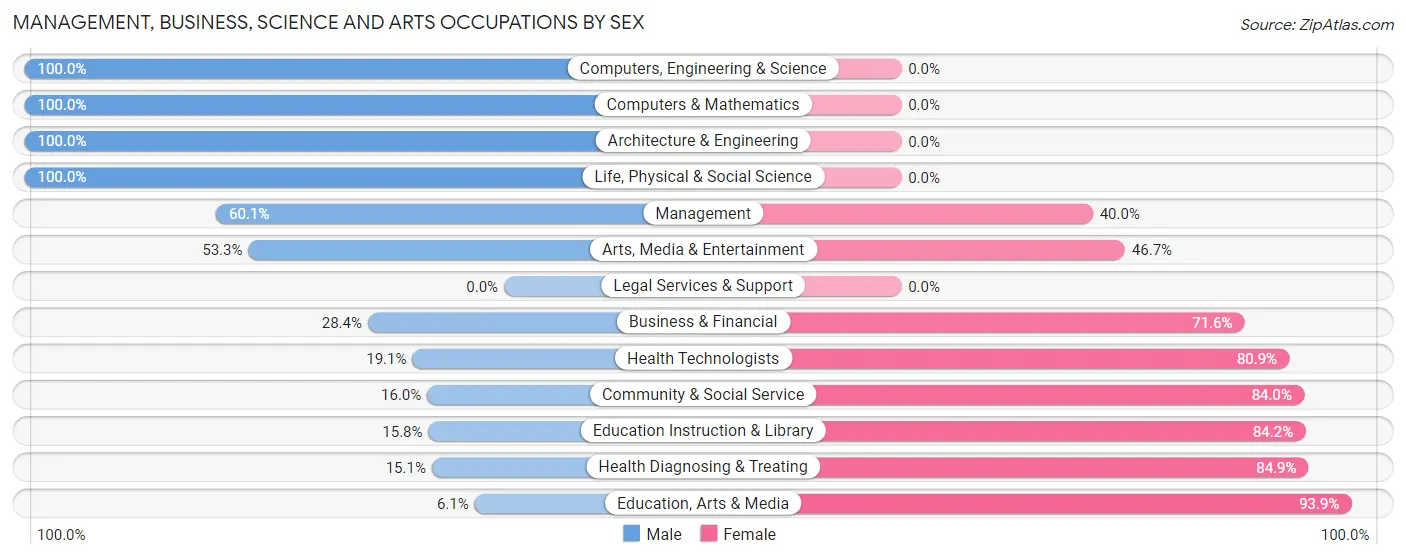
Management, Business, Science and Arts Occupations by Sex
Within the Management, Business, Science and Arts occupations in Emery County, the most male-oriented occupations are Computers, Engineering & Science (100.0%), Computers & Mathematics (100.0%), and Architecture & Engineering (100.0%), while the most female-oriented occupations are Education, Arts & Media (93.9%), Health Diagnosing & Treating (84.9%), and Education Instruction & Library (84.2%).
| Occupation | Male | Female |
| Management | 245 (60.1%) | 163 (40.0%) |
| Business & Financial | 25 (28.4%) | 63 (71.6%) |
| Computers, Engineering & Science | 130 (100.0%) | 0 (0.0%) |
| Computers & Mathematics | 5 (100.0%) | 0 (0.0%) |
| Architecture & Engineering | 58 (100.0%) | 0 (0.0%) |
| Life, Physical & Social Science | 67 (100.0%) | 0 (0.0%) |
| Community & Social Service | 55 (16.0%) | 288 (84.0%) |
| Education, Arts & Media | 3 (6.1%) | 46 (93.9%) |
| Legal Services & Support | 0 (0.0%) | 0 (0.0%) |
| Education Instruction & Library | 44 (15.8%) | 235 (84.2%) |
| Arts, Media & Entertainment | 8 (53.3%) | 7 (46.7%) |
| Health Diagnosing & Treating | 22 (15.1%) | 124 (84.9%) |
| Health Technologists | 13 (19.1%) | 55 (80.9%) |
| Total (Category) | 477 (42.8%) | 638 (57.2%) |
| Total (Overall) | 2,296 (56.8%) | 1,747 (43.2%) |
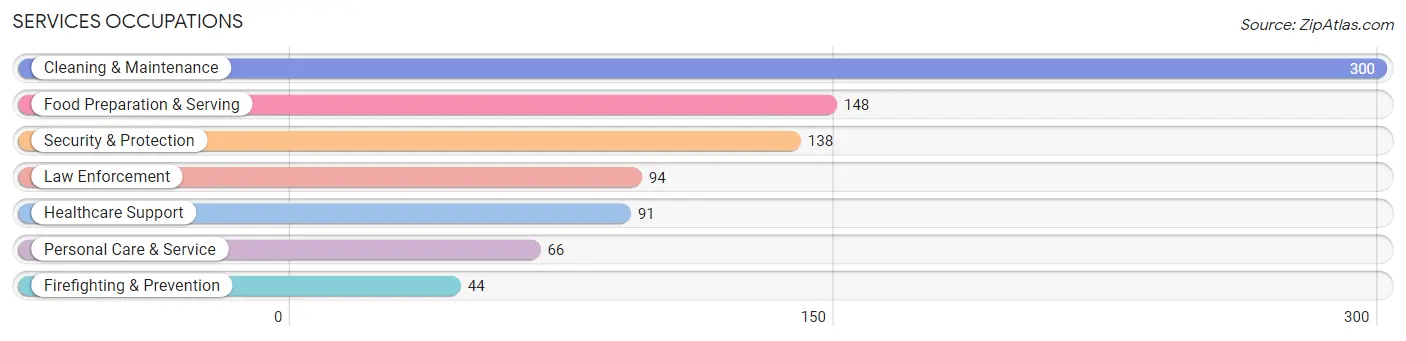
Services Occupations
The most common Services occupations in Emery County are Cleaning & Maintenance (300 | 7.4%), Food Preparation & Serving (148 | 3.7%), Security & Protection (138 | 3.4%), Law Enforcement (94 | 2.3%), and Healthcare Support (91 | 2.2%).
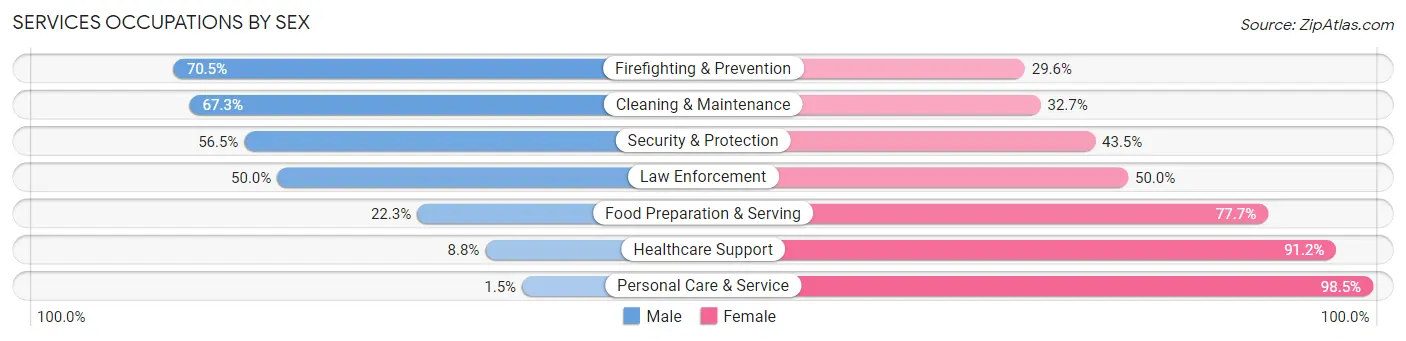
Services Occupations by Sex
Within the Services occupations in Emery County, the most male-oriented occupations are Firefighting & Prevention (70.5%), Cleaning & Maintenance (67.3%), and Security & Protection (56.5%), while the most female-oriented occupations are Personal Care & Service (98.5%), Healthcare Support (91.2%), and Food Preparation & Serving (77.7%).
| Occupation | Male | Female |
| Healthcare Support | 8 (8.8%) | 83 (91.2%) |
| Security & Protection | 78 (56.5%) | 60 (43.5%) |
| Firefighting & Prevention | 31 (70.5%) | 13 (29.5%) |
| Law Enforcement | 47 (50.0%) | 47 (50.0%) |
| Food Preparation & Serving | 33 (22.3%) | 115 (77.7%) |
| Cleaning & Maintenance | 202 (67.3%) | 98 (32.7%) |
| Personal Care & Service | 1 (1.5%) | 65 (98.5%) |
| Total (Category) | 322 (43.3%) | 421 (56.7%) |
| Total (Overall) | 2,296 (56.8%) | 1,747 (43.2%) |
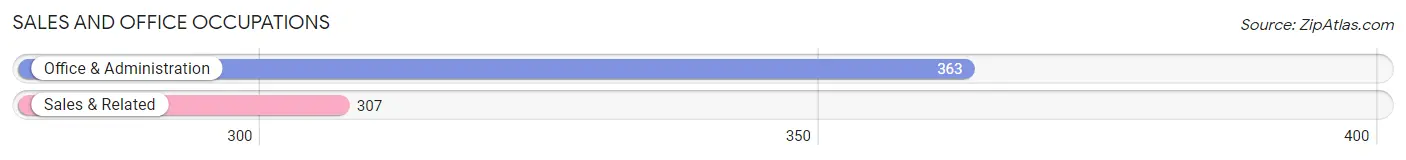
Sales and Office Occupations
The most common Sales and Office occupations in Emery County are Office & Administration (363 | 9.0%), and Sales & Related (307 | 7.6%).
Sales and Office Occupations by Sex
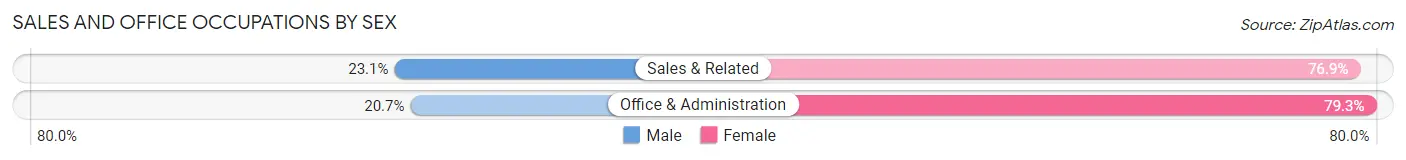
| Occupation | Male | Female |
| Sales & Related | 71 (23.1%) | 236 (76.9%) |
| Office & Administration | 75 (20.7%) | 288 (79.3%) |
| Total (Category) | 146 (21.8%) | 524 (78.2%) |
| Total (Overall) | 2,296 (56.8%) | 1,747 (43.2%) |
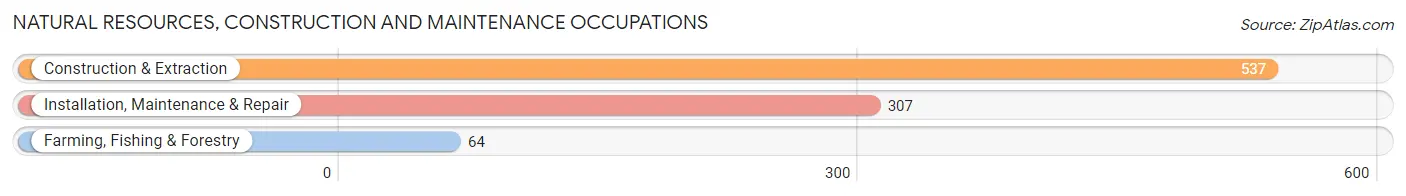
Natural Resources, Construction and Maintenance Occupations
The most common Natural Resources, Construction and Maintenance occupations in Emery County are Construction & Extraction (537 | 13.3%), Installation, Maintenance & Repair (307 | 7.6%), and Farming, Fishing & Forestry (64 | 1.6%).
Natural Resources, Construction and Maintenance Occupations by Sex
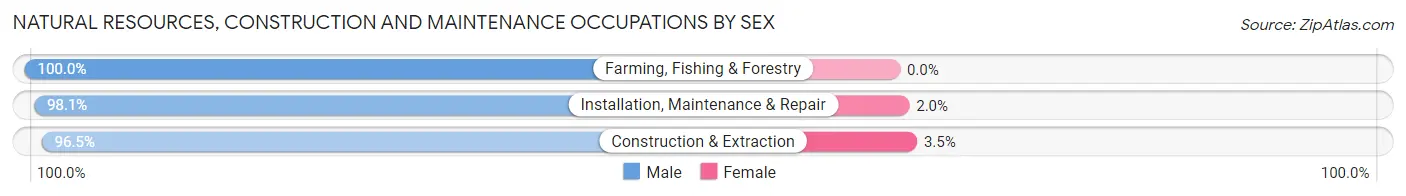
| Occupation | Male | Female |
| Farming, Fishing & Forestry | 64 (100.0%) | 0 (0.0%) |
| Construction & Extraction | 518 (96.5%) | 19 (3.5%) |
| Installation, Maintenance & Repair | 301 (98.1%) | 6 (1.9%) |
| Total (Category) | 883 (97.3%) | 25 (2.8%) |
| Total (Overall) | 2,296 (56.8%) | 1,747 (43.2%) |
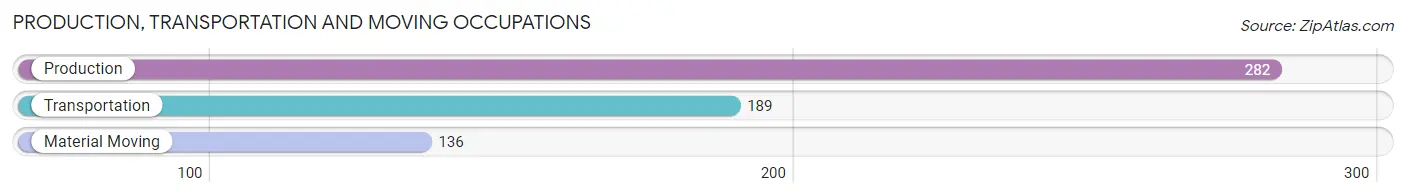
Production, Transportation and Moving Occupations
The most common Production, Transportation and Moving occupations in Emery County are Production (282 | 7.0%), Transportation (189 | 4.7%), and Material Moving (136 | 3.4%).
Production, Transportation and Moving Occupations by Sex
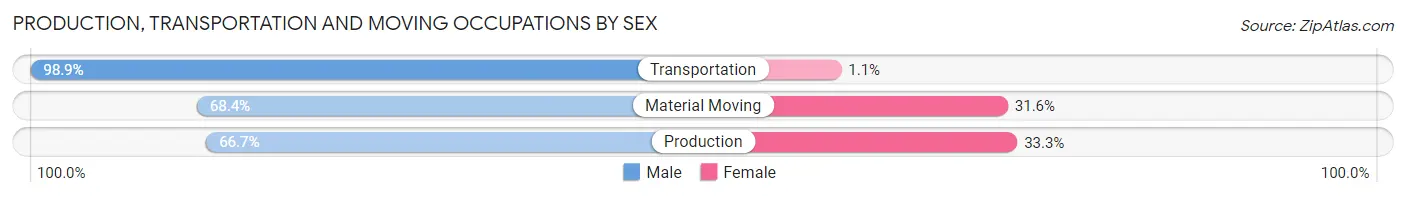
| Occupation | Male | Female |
| Production | 188 (66.7%) | 94 (33.3%) |
| Transportation | 187 (98.9%) | 2 (1.1%) |
| Material Moving | 93 (68.4%) | 43 (31.6%) |
| Total (Category) | 468 (77.1%) | 139 (22.9%) |
| Total (Overall) | 2,296 (56.8%) | 1,747 (43.2%) |
Employment Industries by Sex in Emery County
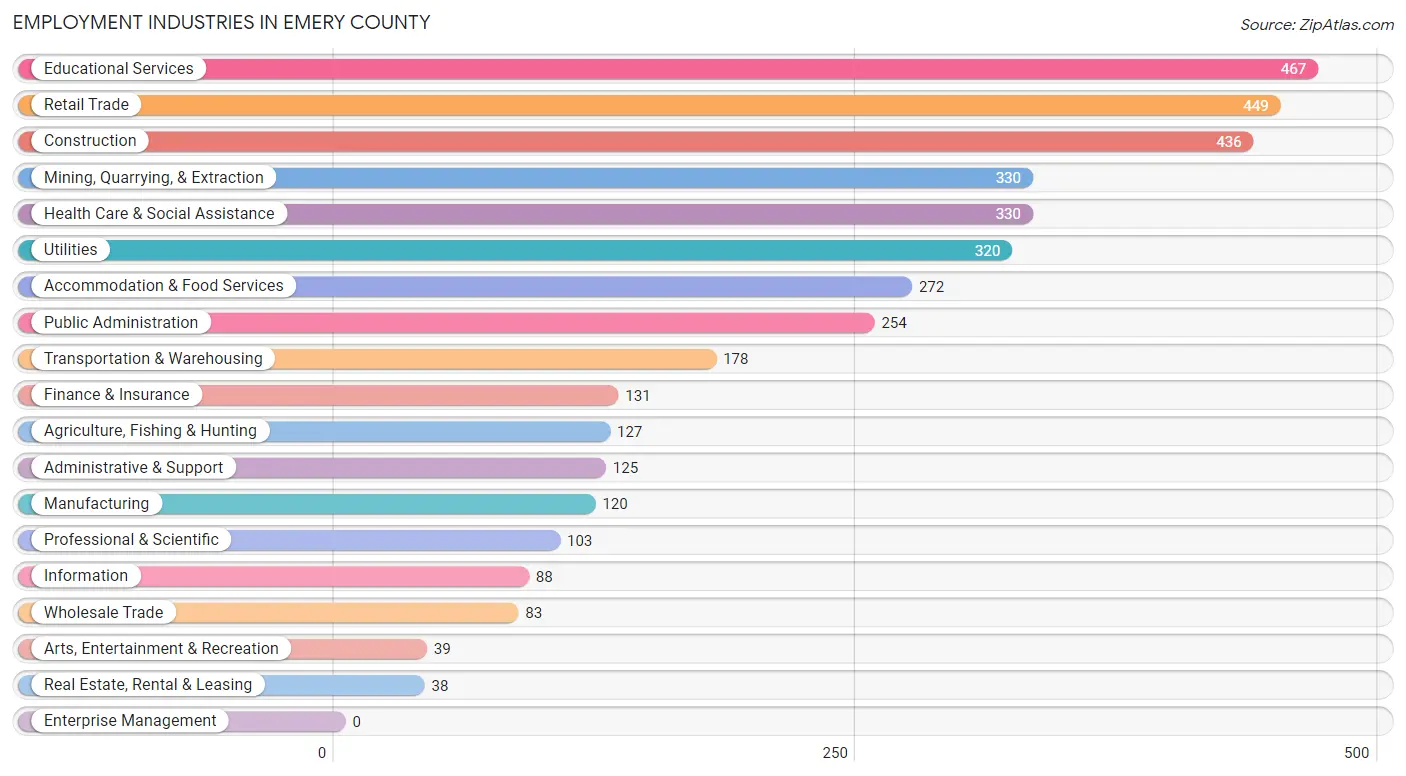
Employment Industries in Emery County
The major employment industries in Emery County include Educational Services (467 | 11.6%), Retail Trade (449 | 11.1%), Construction (436 | 10.8%), Mining, Quarrying, & Extraction (330 | 8.2%), and Health Care & Social Assistance (330 | 8.2%).
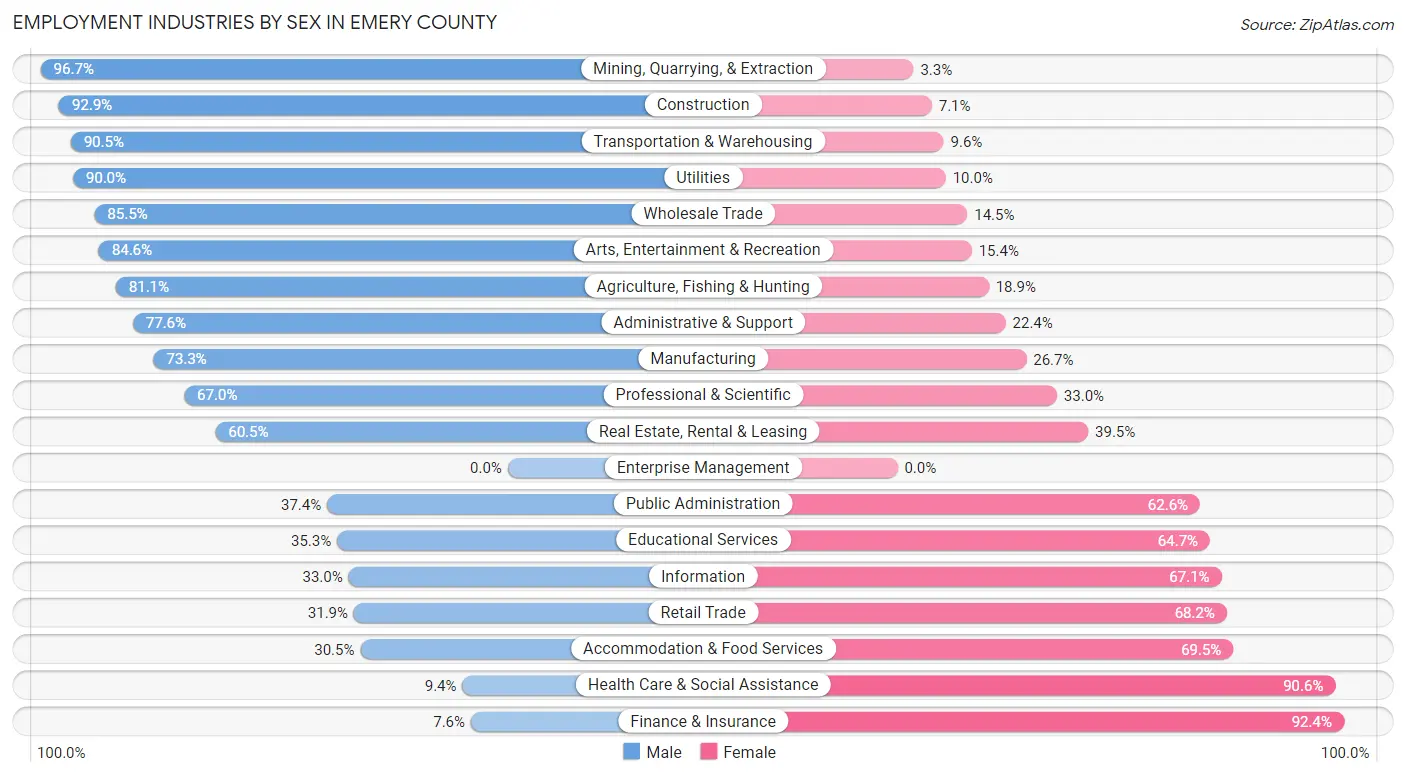
Employment Industries by Sex in Emery County
The Emery County industries that see more men than women are Mining, Quarrying, & Extraction (96.7%), Construction (92.9%), and Transportation & Warehousing (90.4%), whereas the industries that tend to have a higher number of women are Finance & Insurance (92.4%), Health Care & Social Assistance (90.6%), and Accommodation & Food Services (69.5%).
| Industry | Male | Female |
| Agriculture, Fishing & Hunting | 103 (81.1%) | 24 (18.9%) |
| Mining, Quarrying, & Extraction | 319 (96.7%) | 11 (3.3%) |
| Construction | 405 (92.9%) | 31 (7.1%) |
| Manufacturing | 88 (73.3%) | 32 (26.7%) |
| Wholesale Trade | 71 (85.5%) | 12 (14.5%) |
| Retail Trade | 143 (31.9%) | 306 (68.1%) |
| Transportation & Warehousing | 161 (90.4%) | 17 (9.6%) |
| Utilities | 288 (90.0%) | 32 (10.0%) |
| Information | 29 (33.0%) | 59 (67.0%) |
| Finance & Insurance | 10 (7.6%) | 121 (92.4%) |
| Real Estate, Rental & Leasing | 23 (60.5%) | 15 (39.5%) |
| Professional & Scientific | 69 (67.0%) | 34 (33.0%) |
| Enterprise Management | 0 (0.0%) | 0 (0.0%) |
| Administrative & Support | 97 (77.6%) | 28 (22.4%) |
| Educational Services | 165 (35.3%) | 302 (64.7%) |
| Health Care & Social Assistance | 31 (9.4%) | 299 (90.6%) |
| Arts, Entertainment & Recreation | 33 (84.6%) | 6 (15.4%) |
| Accommodation & Food Services | 83 (30.5%) | 189 (69.5%) |
| Public Administration | 95 (37.4%) | 159 (62.6%) |
| Total | 2,296 (56.8%) | 1,747 (43.2%) |
Education in Emery County
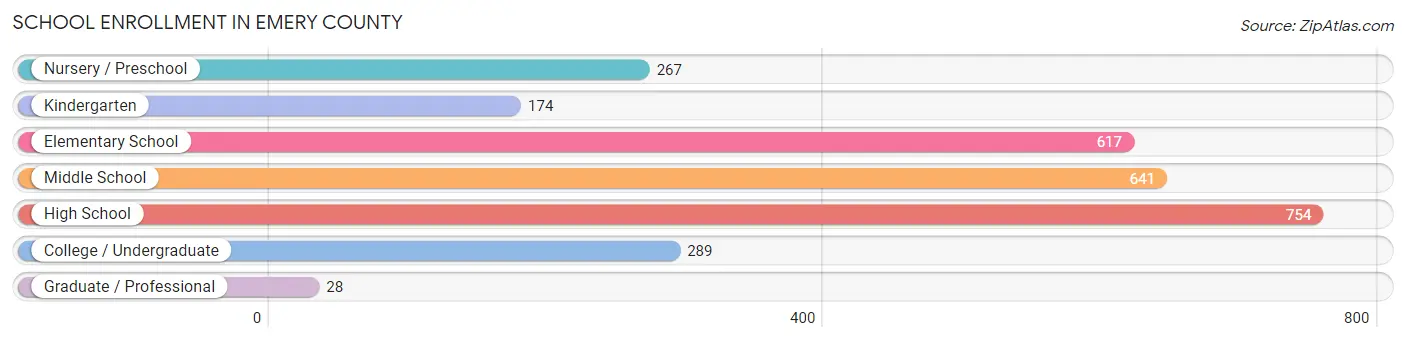
School Enrollment in Emery County
The most common levels of schooling among the 2,770 students in Emery County are high school (754 | 27.2%), middle school (641 | 23.1%), and elementary school (617 | 22.3%).
| School Level | # Students | % Students |
| Nursery / Preschool | 267 | 9.6% |
| Kindergarten | 174 | 6.3% |
| Elementary School | 617 | 22.3% |
| Middle School | 641 | 23.1% |
| High School | 754 | 27.2% |
| College / Undergraduate | 289 | 10.4% |
| Graduate / Professional | 28 | 1.0% |
| Total | 2,770 | 100.0% |
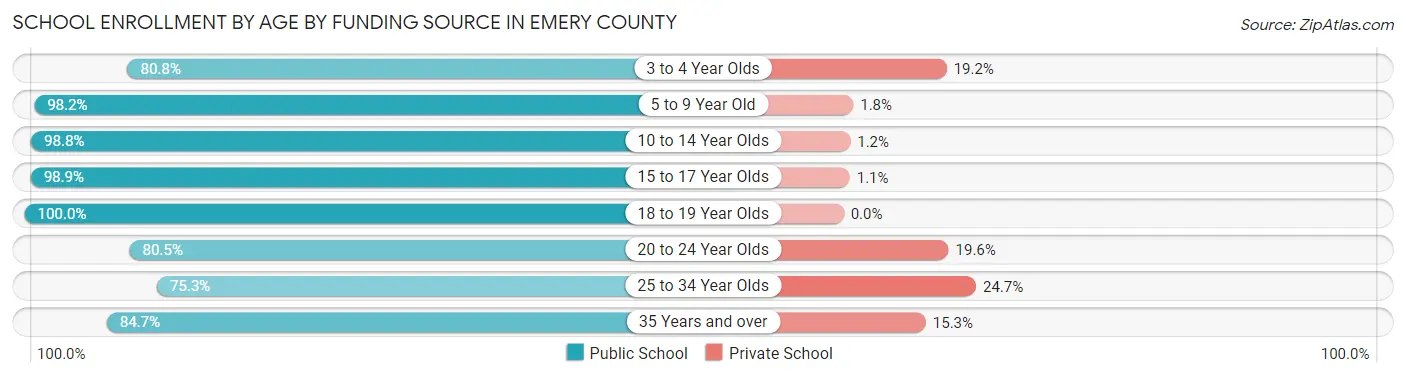
School Enrollment by Age by Funding Source in Emery County
Out of a total of 2,770 students who are enrolled in schools in Emery County, 127 (4.6%) attend a private institution, while the remaining 2,643 (95.4%) are enrolled in public schools. The age group of 25 to 34 year olds has the highest likelihood of being enrolled in private schools, with 18 (24.7% in the age bracket) enrolled. Conversely, the age group of 18 to 19 year olds has the lowest likelihood of being enrolled in a private school, with 146 (100.0% in the age bracket) attending a public institution.
| Age Bracket | Public School | Private School |
| 3 to 4 Year Olds | 160 (80.8%) | 38 (19.2%) |
| 5 to 9 Year Old | 768 (98.2%) | 14 (1.8%) |
| 10 to 14 Year Olds | 802 (98.8%) | 10 (1.2%) |
| 15 to 17 Year Olds | 522 (98.9%) | 6 (1.1%) |
| 18 to 19 Year Olds | 146 (100.0%) | 0 (0.0%) |
| 20 to 24 Year Olds | 107 (80.4%) | 26 (19.6%) |
| 25 to 34 Year Olds | 55 (75.3%) | 18 (24.7%) |
| 35 Years and over | 83 (84.7%) | 15 (15.3%) |
| Total | 2,643 (95.4%) | 127 (4.6%) |
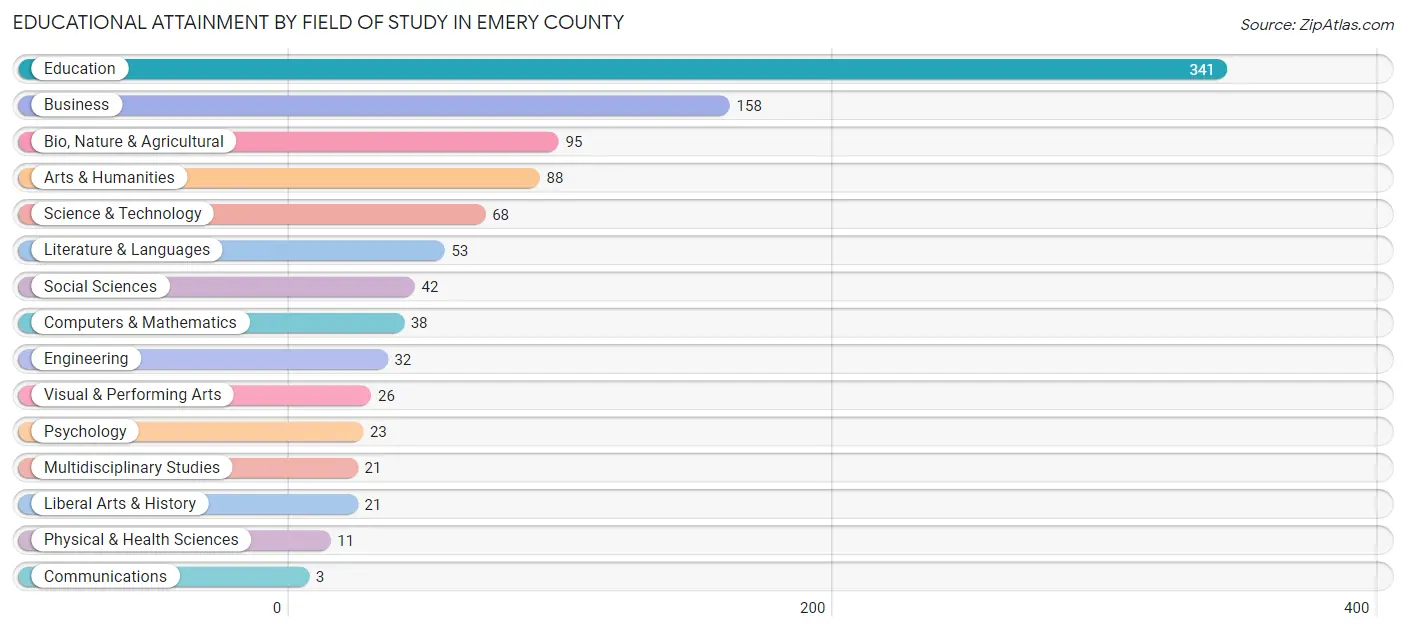
Educational Attainment by Field of Study in Emery County
Education (341 | 33.4%), business (158 | 15.5%), bio, nature & agricultural (95 | 9.3%), arts & humanities (88 | 8.6%), and science & technology (68 | 6.7%) are the most common fields of study among 1,020 individuals in Emery County who have obtained a bachelor's degree or higher.
| Field of Study | # Graduates | % Graduates |
| Computers & Mathematics | 38 | 3.7% |
| Bio, Nature & Agricultural | 95 | 9.3% |
| Physical & Health Sciences | 11 | 1.1% |
| Psychology | 23 | 2.2% |
| Social Sciences | 42 | 4.1% |
| Engineering | 32 | 3.1% |
| Multidisciplinary Studies | 21 | 2.1% |
| Science & Technology | 68 | 6.7% |
| Business | 158 | 15.5% |
| Education | 341 | 33.4% |
| Literature & Languages | 53 | 5.2% |
| Liberal Arts & History | 21 | 2.1% |
| Visual & Performing Arts | 26 | 2.5% |
| Communications | 3 | 0.3% |
| Arts & Humanities | 88 | 8.6% |
| Total | 1,020 | 100.0% |
Transportation & Commute in Emery County
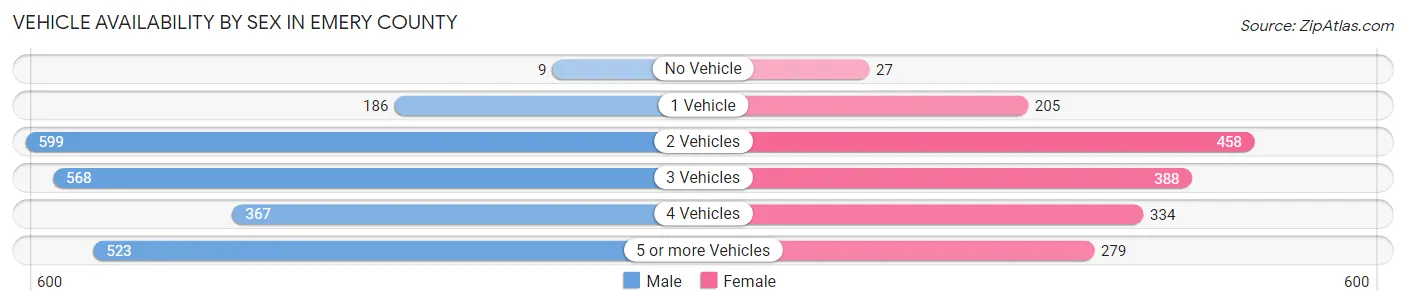
Vehicle Availability by Sex in Emery County
The most prevalent vehicle ownership categories in Emery County are males with 2 vehicles (599, accounting for 26.6%) and females with 2 vehicles (458, making up 35.4%).
| Vehicles Available | Male | Female |
| No Vehicle | 9 (0.4%) | 27 (1.6%) |
| 1 Vehicle | 186 (8.3%) | 205 (12.1%) |
| 2 Vehicles | 599 (26.6%) | 458 (27.1%) |
| 3 Vehicles | 568 (25.2%) | 388 (23.0%) |
| 4 Vehicles | 367 (16.3%) | 334 (19.8%) |
| 5 or more Vehicles | 523 (23.2%) | 279 (16.5%) |
| Total | 2,252 (100.0%) | 1,691 (100.0%) |
Commute Time in Emery County
The most frequently occuring commute durations in Emery County are 5 to 9 minutes (892 commuters, 24.0%), less than 5 minutes (552 commuters, 14.8%), and 20 to 24 minutes (422 commuters, 11.3%).
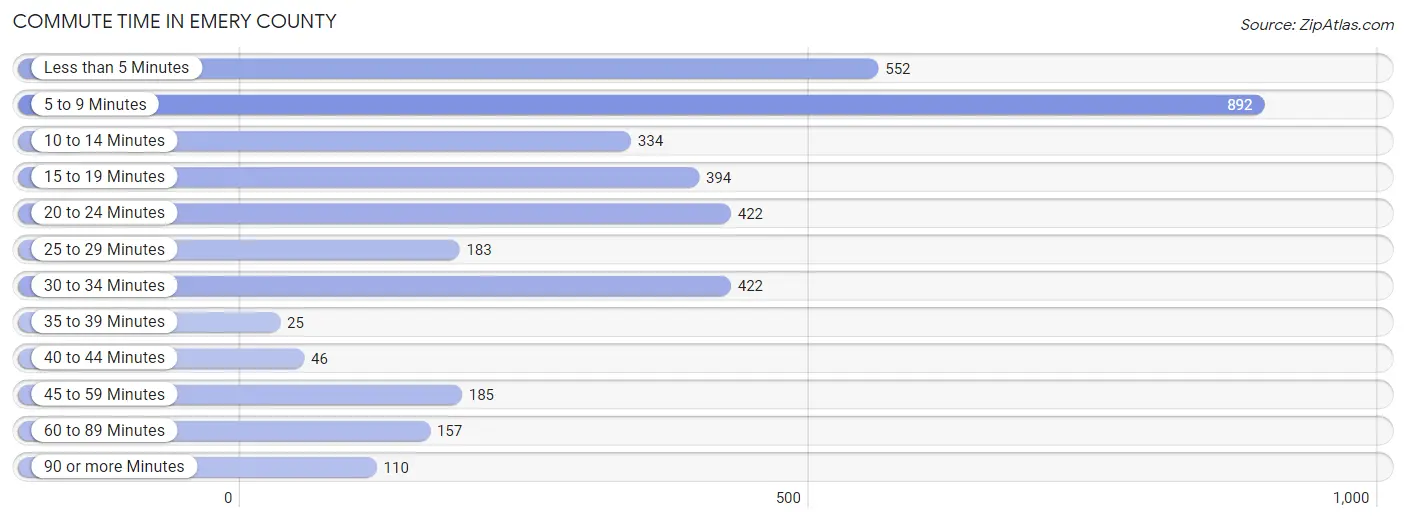
| Commute Time | # Commuters | % Commuters |
| Less than 5 Minutes | 552 | 14.8% |
| 5 to 9 Minutes | 892 | 24.0% |
| 10 to 14 Minutes | 334 | 9.0% |
| 15 to 19 Minutes | 394 | 10.6% |
| 20 to 24 Minutes | 422 | 11.3% |
| 25 to 29 Minutes | 183 | 4.9% |
| 30 to 34 Minutes | 422 | 11.3% |
| 35 to 39 Minutes | 25 | 0.7% |
| 40 to 44 Minutes | 46 | 1.2% |
| 45 to 59 Minutes | 185 | 5.0% |
| 60 to 89 Minutes | 157 | 4.2% |
| 90 or more Minutes | 110 | 3.0% |
Commute Time by Sex in Emery County
The most common commute times in Emery County are 5 to 9 minutes (412 commuters, 19.1%) for males and 5 to 9 minutes (480 commuters, 30.7%) for females.
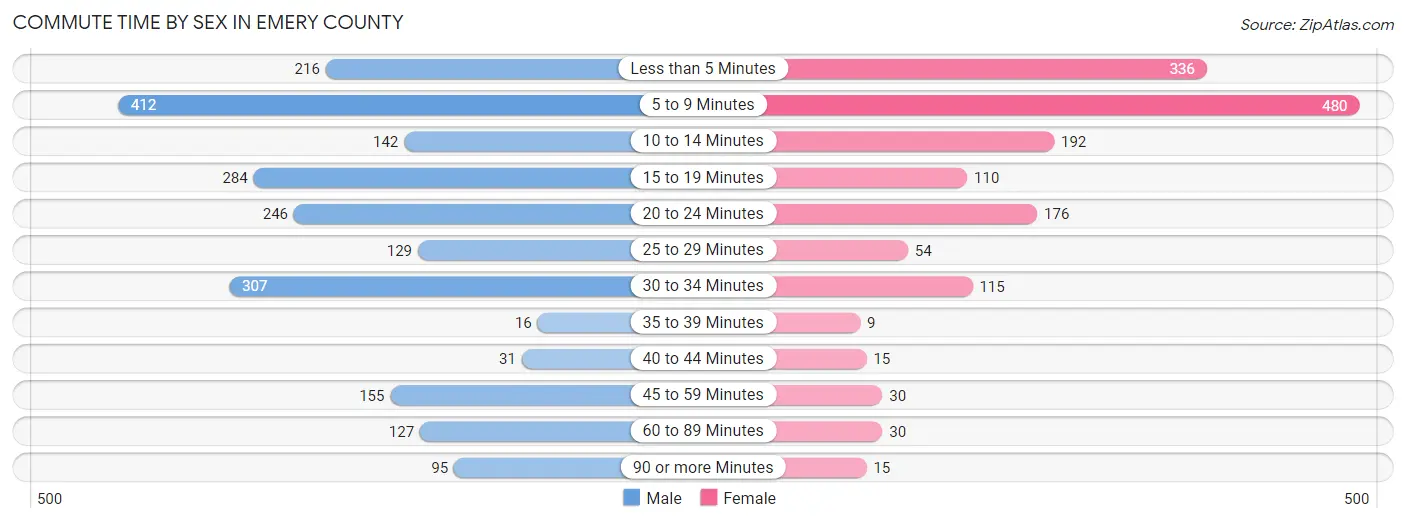
| Commute Time | Male | Female |
| Less than 5 Minutes | 216 (10.0%) | 336 (21.5%) |
| 5 to 9 Minutes | 412 (19.1%) | 480 (30.7%) |
| 10 to 14 Minutes | 142 (6.6%) | 192 (12.3%) |
| 15 to 19 Minutes | 284 (13.2%) | 110 (7.0%) |
| 20 to 24 Minutes | 246 (11.4%) | 176 (11.3%) |
| 25 to 29 Minutes | 129 (6.0%) | 54 (3.5%) |
| 30 to 34 Minutes | 307 (14.2%) | 115 (7.4%) |
| 35 to 39 Minutes | 16 (0.7%) | 9 (0.6%) |
| 40 to 44 Minutes | 31 (1.4%) | 15 (1.0%) |
| 45 to 59 Minutes | 155 (7.2%) | 30 (1.9%) |
| 60 to 89 Minutes | 127 (5.9%) | 30 (1.9%) |
| 90 or more Minutes | 95 (4.4%) | 15 (1.0%) |
Time of Departure to Work by Sex in Emery County
The most frequent times of departure to work in Emery County are 6:30 AM to 6:59 AM (327, 15.1%) for males and 8:00 AM to 8:29 AM (227, 14.5%) for females.
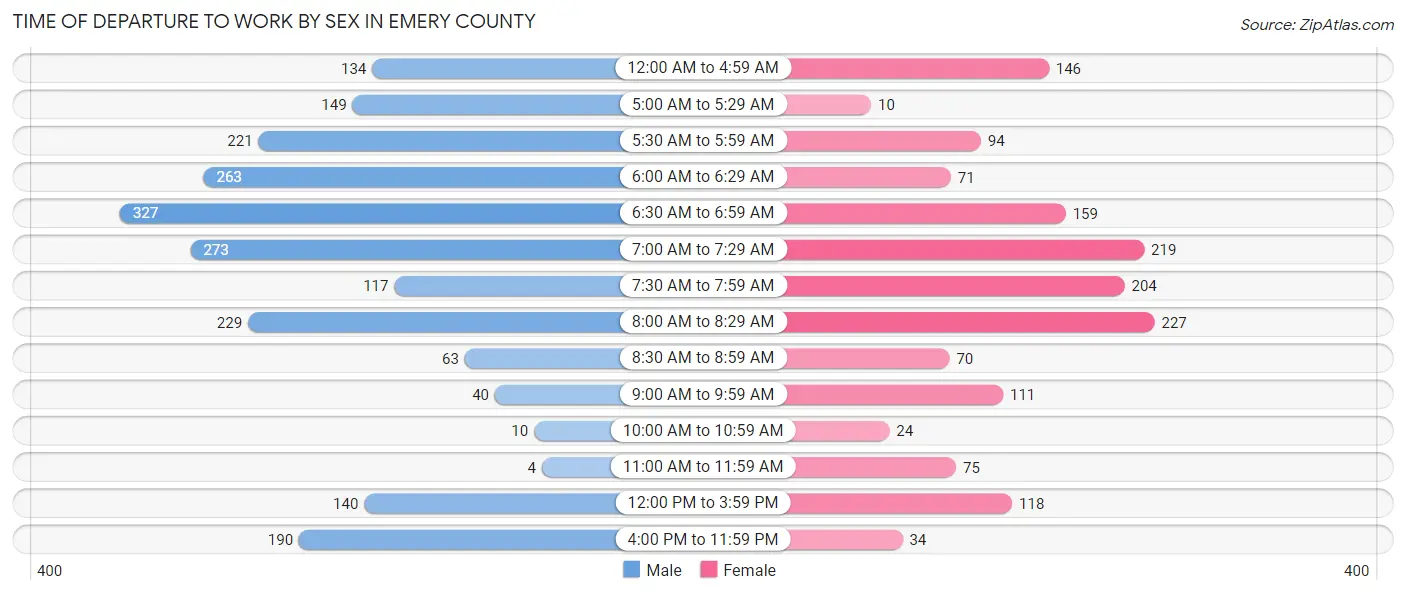
| Time of Departure | Male | Female |
| 12:00 AM to 4:59 AM | 134 (6.2%) | 146 (9.3%) |
| 5:00 AM to 5:29 AM | 149 (6.9%) | 10 (0.6%) |
| 5:30 AM to 5:59 AM | 221 (10.2%) | 94 (6.0%) |
| 6:00 AM to 6:29 AM | 263 (12.2%) | 71 (4.5%) |
| 6:30 AM to 6:59 AM | 327 (15.1%) | 159 (10.2%) |
| 7:00 AM to 7:29 AM | 273 (12.6%) | 219 (14.0%) |
| 7:30 AM to 7:59 AM | 117 (5.4%) | 204 (13.1%) |
| 8:00 AM to 8:29 AM | 229 (10.6%) | 227 (14.5%) |
| 8:30 AM to 8:59 AM | 63 (2.9%) | 70 (4.5%) |
| 9:00 AM to 9:59 AM | 40 (1.8%) | 111 (7.1%) |
| 10:00 AM to 10:59 AM | 10 (0.5%) | 24 (1.5%) |
| 11:00 AM to 11:59 AM | 4 (0.2%) | 75 (4.8%) |
| 12:00 PM to 3:59 PM | 140 (6.5%) | 118 (7.5%) |
| 4:00 PM to 11:59 PM | 190 (8.8%) | 34 (2.2%) |
| Total | 2,160 (100.0%) | 1,562 (100.0%) |
Housing Occupancy in Emery County
Occupancy by Ownership in Emery County
Of the total 3,447 dwellings in Emery County, owner-occupied units account for 2,698 (78.3%), while renter-occupied units make up 749 (21.7%).
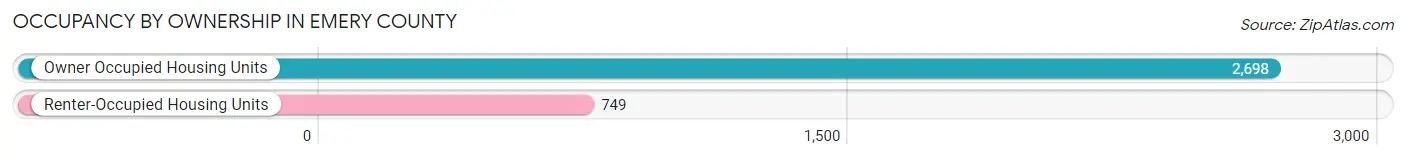
| Occupancy | # Housing Units | % Housing Units |
| Owner Occupied Housing Units | 2,698 | 78.3% |
| Renter-Occupied Housing Units | 749 | 21.7% |
| Total Occupied Housing Units | 3,447 | 100.0% |
Occupancy by Household Size in Emery County
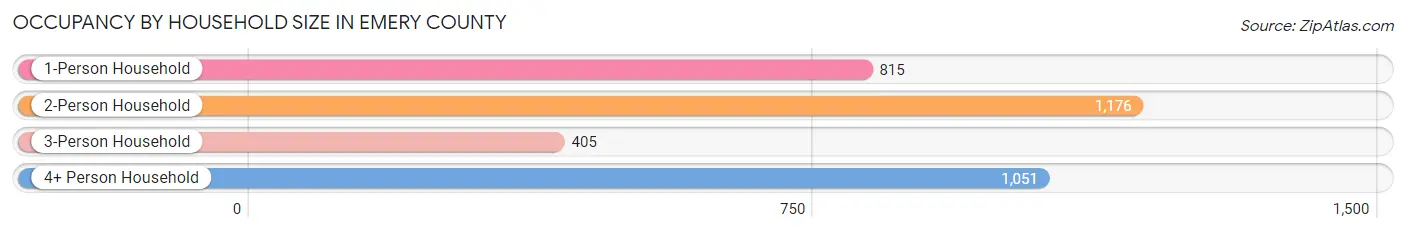
| Household Size | # Housing Units | % Housing Units |
| 1-Person Household | 815 | 23.6% |
| 2-Person Household | 1,176 | 34.1% |
| 3-Person Household | 405 | 11.7% |
| 4+ Person Household | 1,051 | 30.5% |
| Total Housing Units | 3,447 | 100.0% |
Occupancy by Ownership by Household Size in Emery County
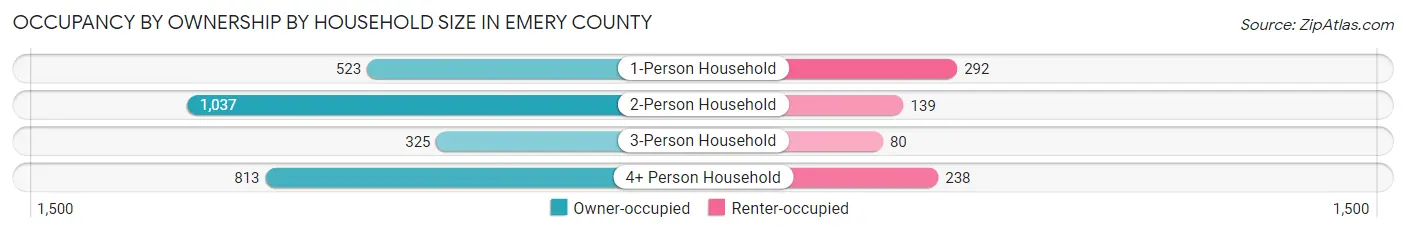
| Household Size | Owner-occupied | Renter-occupied |
| 1-Person Household | 523 (64.2%) | 292 (35.8%) |
| 2-Person Household | 1,037 (88.2%) | 139 (11.8%) |
| 3-Person Household | 325 (80.2%) | 80 (19.8%) |
| 4+ Person Household | 813 (77.3%) | 238 (22.7%) |
| Total Housing Units | 2,698 (78.3%) | 749 (21.7%) |
Occupancy by Educational Attainment in Emery County
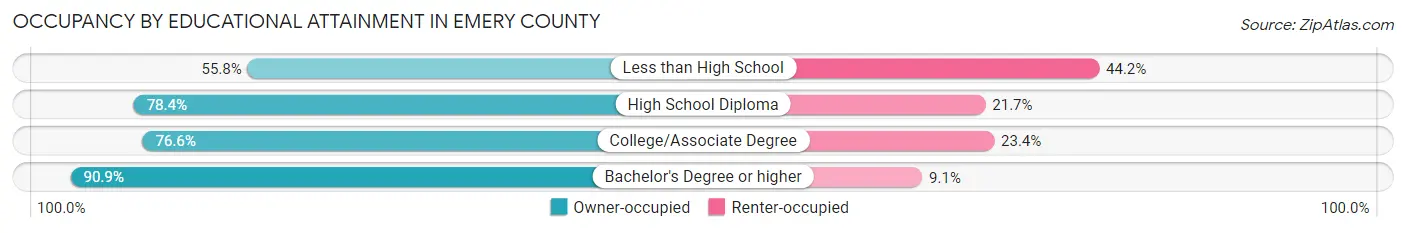
| Household Size | Owner-occupied | Renter-occupied |
| Less than High School | 101 (55.8%) | 80 (44.2%) |
| High School Diploma | 749 (78.3%) | 207 (21.6%) |
| College/Associate Degree | 1,350 (76.6%) | 412 (23.4%) |
| Bachelor's Degree or higher | 498 (90.9%) | 50 (9.1%) |
Occupancy by Age of Householder in Emery County
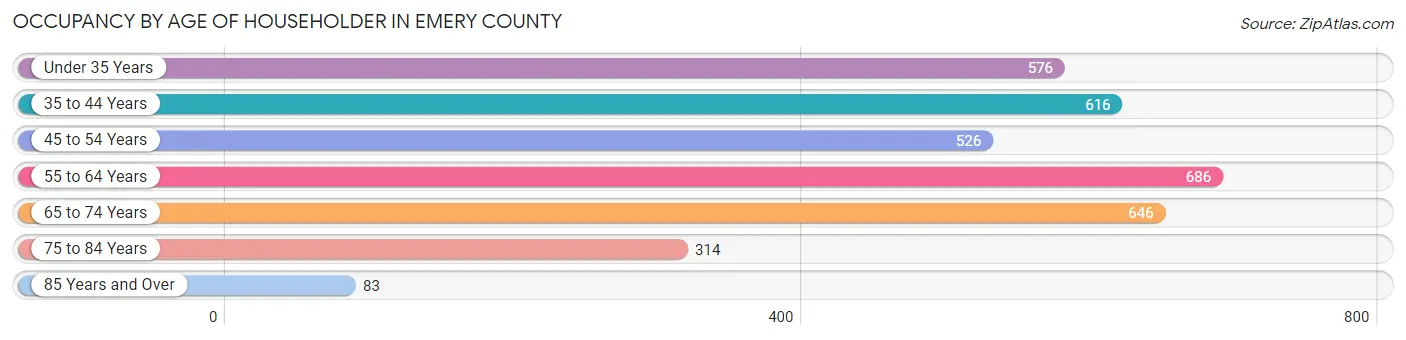
| Age Bracket | # Households | % Households |
| Under 35 Years | 576 | 16.7% |
| 35 to 44 Years | 616 | 17.9% |
| 45 to 54 Years | 526 | 15.3% |
| 55 to 64 Years | 686 | 19.9% |
| 65 to 74 Years | 646 | 18.7% |
| 75 to 84 Years | 314 | 9.1% |
| 85 Years and Over | 83 | 2.4% |
| Total | 3,447 | 100.0% |
Housing Finances in Emery County
Median Income by Occupancy in Emery County
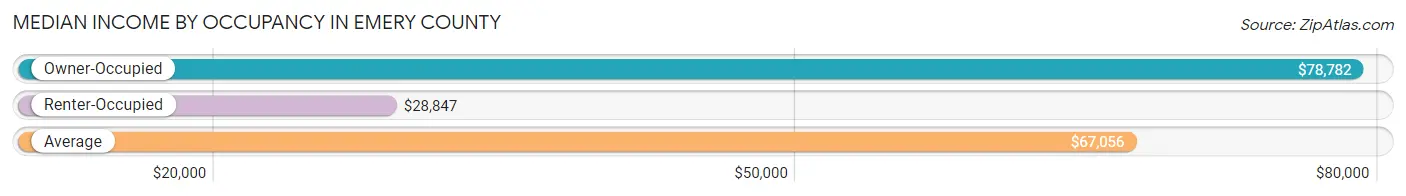
| Occupancy Type | # Households | Median Income |
| Owner-Occupied | 2,698 (78.3%) | $78,782 |
| Renter-Occupied | 749 (21.7%) | $28,847 |
| Average | 3,447 (100.0%) | $67,056 |
Occupancy by Householder Income Bracket in Emery County
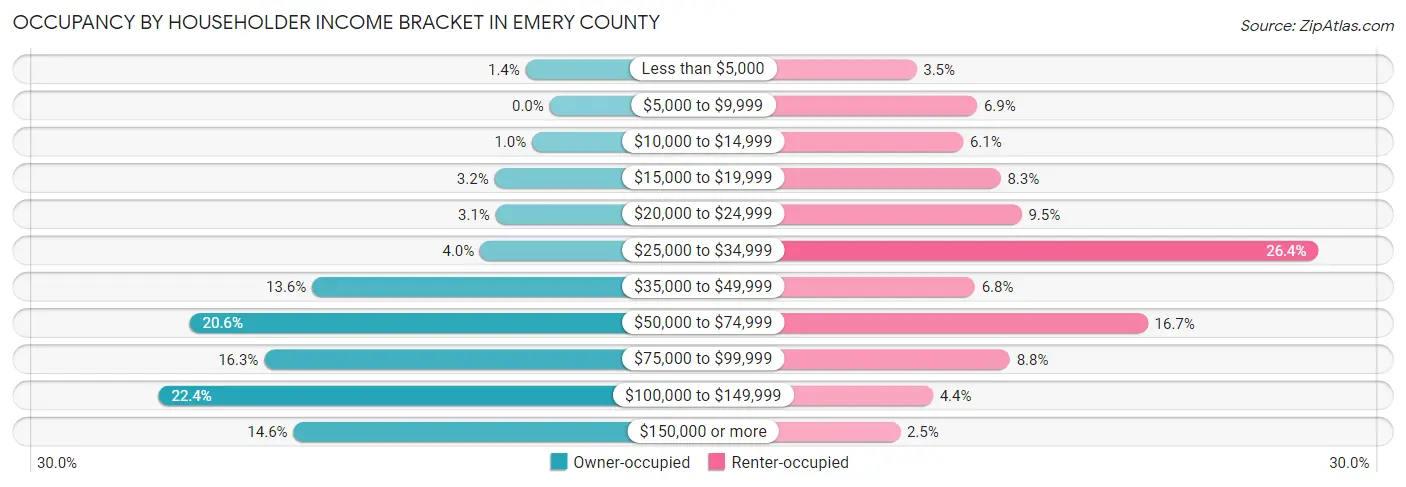
| Income Bracket | Owner-occupied | Renter-occupied |
| Less than $5,000 | 37 (1.4%) | 26 (3.5%) |
| $5,000 to $9,999 | 0 (0.0%) | 52 (6.9%) |
| $10,000 to $14,999 | 27 (1.0%) | 46 (6.1%) |
| $15,000 to $19,999 | 85 (3.2%) | 62 (8.3%) |
| $20,000 to $24,999 | 83 (3.1%) | 71 (9.5%) |
| $25,000 to $34,999 | 107 (4.0%) | 198 (26.4%) |
| $35,000 to $49,999 | 366 (13.6%) | 51 (6.8%) |
| $50,000 to $74,999 | 555 (20.6%) | 125 (16.7%) |
| $75,000 to $99,999 | 440 (16.3%) | 66 (8.8%) |
| $100,000 to $149,999 | 603 (22.4%) | 33 (4.4%) |
| $150,000 or more | 395 (14.6%) | 19 (2.5%) |
| Total | 2,698 (100.0%) | 749 (100.0%) |
Monthly Housing Cost Tiers in Emery County
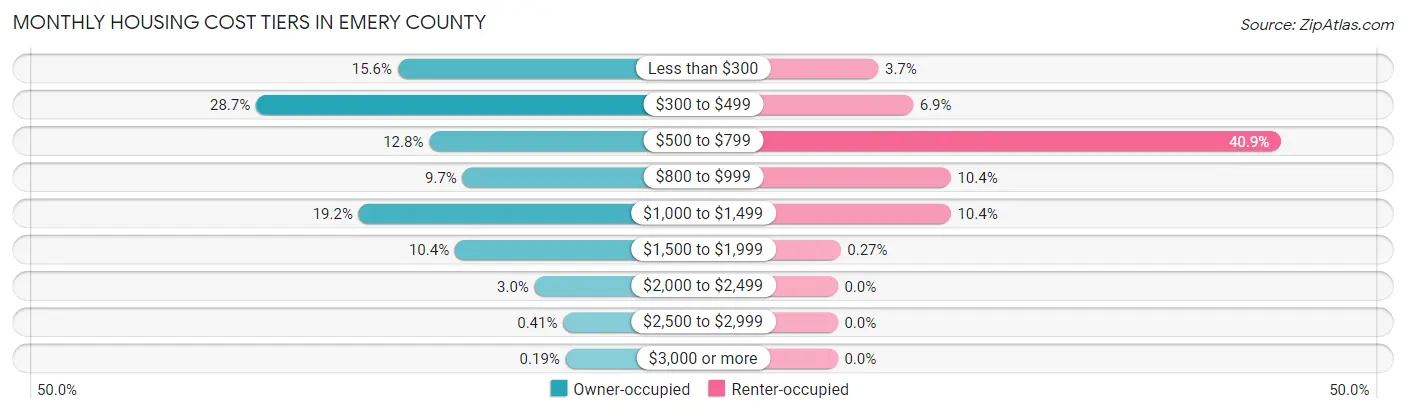
| Monthly Cost | Owner-occupied | Renter-occupied |
| Less than $300 | 422 (15.6%) | 28 (3.7%) |
| $300 to $499 | 774 (28.7%) | 52 (6.9%) |
| $500 to $799 | 344 (12.8%) | 306 (40.8%) |
| $800 to $999 | 261 (9.7%) | 78 (10.4%) |
| $1,000 to $1,499 | 519 (19.2%) | 78 (10.4%) |
| $1,500 to $1,999 | 280 (10.4%) | 2 (0.3%) |
| $2,000 to $2,499 | 82 (3.0%) | 0 (0.0%) |
| $2,500 to $2,999 | 11 (0.4%) | 0 (0.0%) |
| $3,000 or more | 5 (0.2%) | 0 (0.0%) |
| Total | 2,698 (100.0%) | 749 (100.0%) |
Physical Housing Characteristics in Emery County
Housing Structures in Emery County
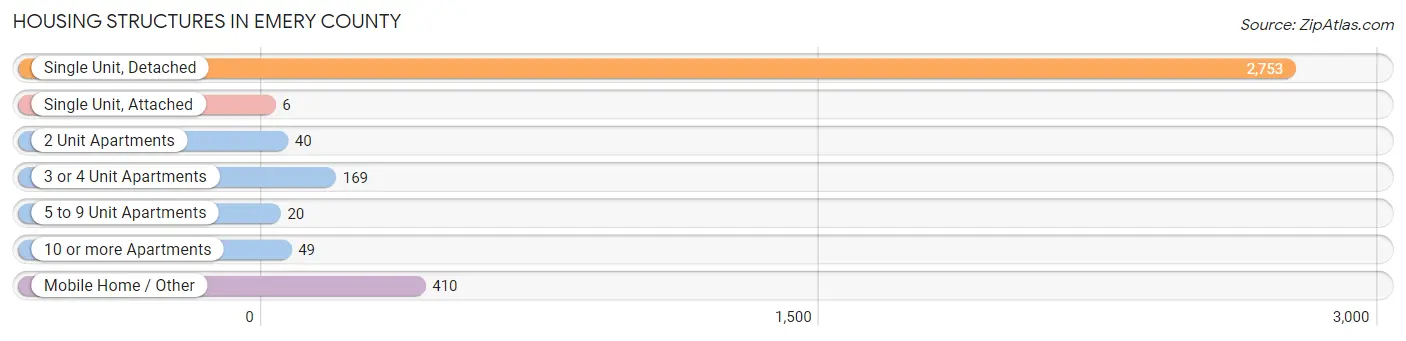
| Structure Type | # Housing Units | % Housing Units |
| Single Unit, Detached | 2,753 | 79.9% |
| Single Unit, Attached | 6 | 0.2% |
| 2 Unit Apartments | 40 | 1.2% |
| 3 or 4 Unit Apartments | 169 | 4.9% |
| 5 to 9 Unit Apartments | 20 | 0.6% |
| 10 or more Apartments | 49 | 1.4% |
| Mobile Home / Other | 410 | 11.9% |
| Total | 3,447 | 100.0% |
Housing Structures by Occupancy in Emery County
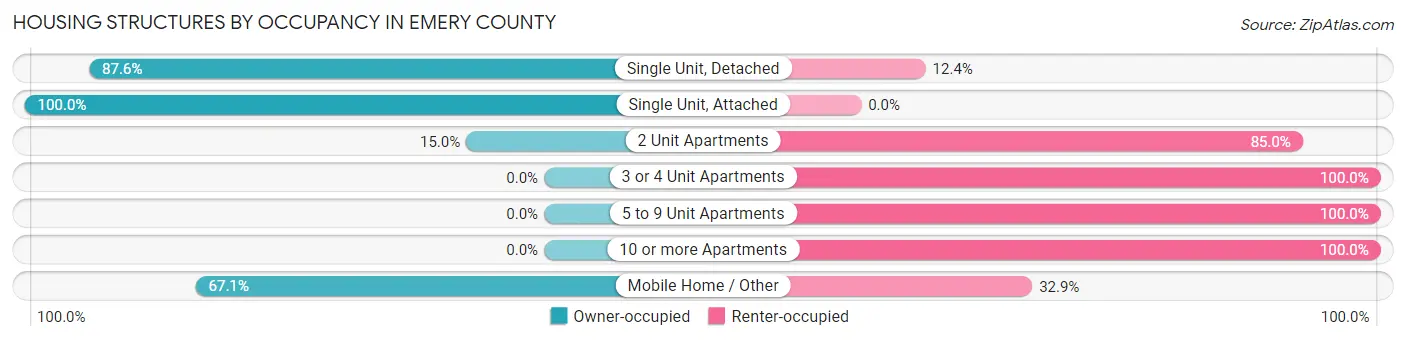
| Structure Type | Owner-occupied | Renter-occupied |
| Single Unit, Detached | 2,411 (87.6%) | 342 (12.4%) |
| Single Unit, Attached | 6 (100.0%) | 0 (0.0%) |
| 2 Unit Apartments | 6 (15.0%) | 34 (85.0%) |
| 3 or 4 Unit Apartments | 0 (0.0%) | 169 (100.0%) |
| 5 to 9 Unit Apartments | 0 (0.0%) | 20 (100.0%) |
| 10 or more Apartments | 0 (0.0%) | 49 (100.0%) |
| Mobile Home / Other | 275 (67.1%) | 135 (32.9%) |
| Total | 2,698 (78.3%) | 749 (21.7%) |
Housing Structures by Number of Rooms in Emery County
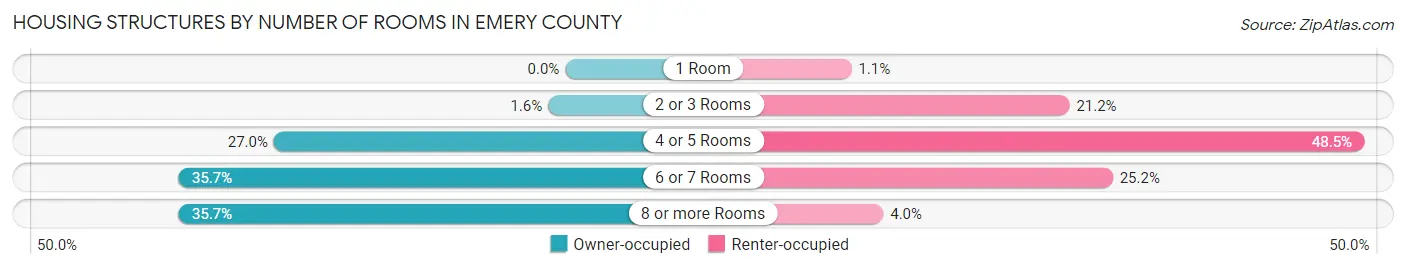
| Number of Rooms | Owner-occupied | Renter-occupied |
| 1 Room | 0 (0.0%) | 8 (1.1%) |
| 2 or 3 Rooms | 43 (1.6%) | 159 (21.2%) |
| 4 or 5 Rooms | 727 (27.0%) | 363 (48.5%) |
| 6 or 7 Rooms | 964 (35.7%) | 189 (25.2%) |
| 8 or more Rooms | 964 (35.7%) | 30 (4.0%) |
| Total | 2,698 (100.0%) | 749 (100.0%) |
Housing Structure by Heating Type in Emery County
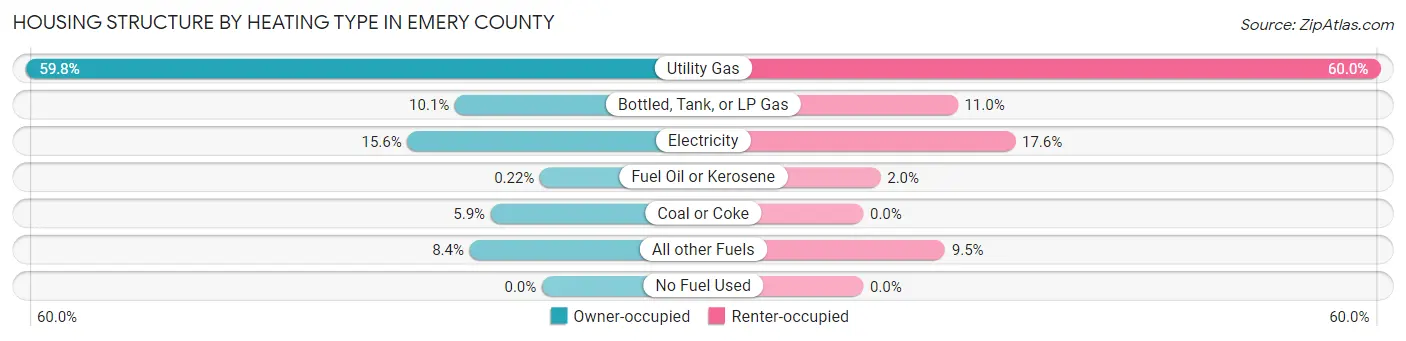
| Heating Type | Owner-occupied | Renter-occupied |
| Utility Gas | 1,613 (59.8%) | 449 (60.0%) |
| Bottled, Tank, or LP Gas | 272 (10.1%) | 82 (11.0%) |
| Electricity | 421 (15.6%) | 132 (17.6%) |
| Fuel Oil or Kerosene | 6 (0.2%) | 15 (2.0%) |
| Coal or Coke | 160 (5.9%) | 0 (0.0%) |
| All other Fuels | 226 (8.4%) | 71 (9.5%) |
| No Fuel Used | 0 (0.0%) | 0 (0.0%) |
| Total | 2,698 (100.0%) | 749 (100.0%) |
Household Vehicle Usage in Emery County
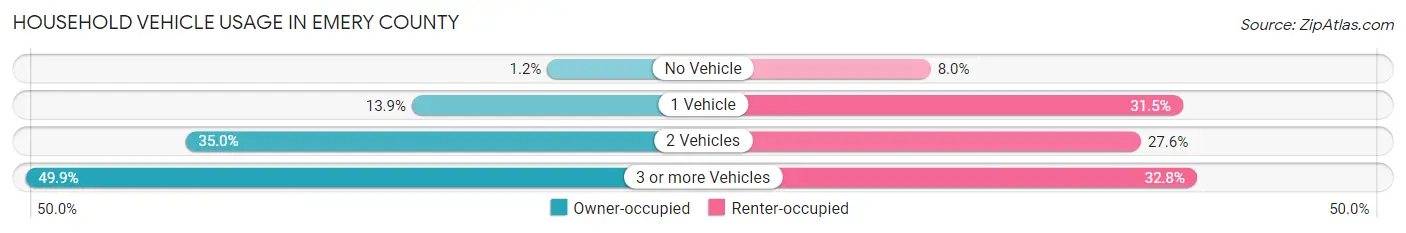
| Vehicles per Household | Owner-occupied | Renter-occupied |
| No Vehicle | 33 (1.2%) | 60 (8.0%) |
| 1 Vehicle | 374 (13.9%) | 236 (31.5%) |
| 2 Vehicles | 944 (35.0%) | 207 (27.6%) |
| 3 or more Vehicles | 1,347 (49.9%) | 246 (32.8%) |
| Total | 2,698 (100.0%) | 749 (100.0%) |
Real Estate & Mortgages in Emery County
Real Estate and Mortgage Overview in Emery County
| Characteristic | Without Mortgage | With Mortgage |
| Housing Units | 1,414 | 1,284 |
| Median Property Value | $151,600 | $196,700 |
| Median Household Income | $63,900 | $185 |
| Monthly Housing Costs | $359 | $5 |
| Real Estate Taxes | $924 | $5 |
Property Value by Mortgage Status in Emery County
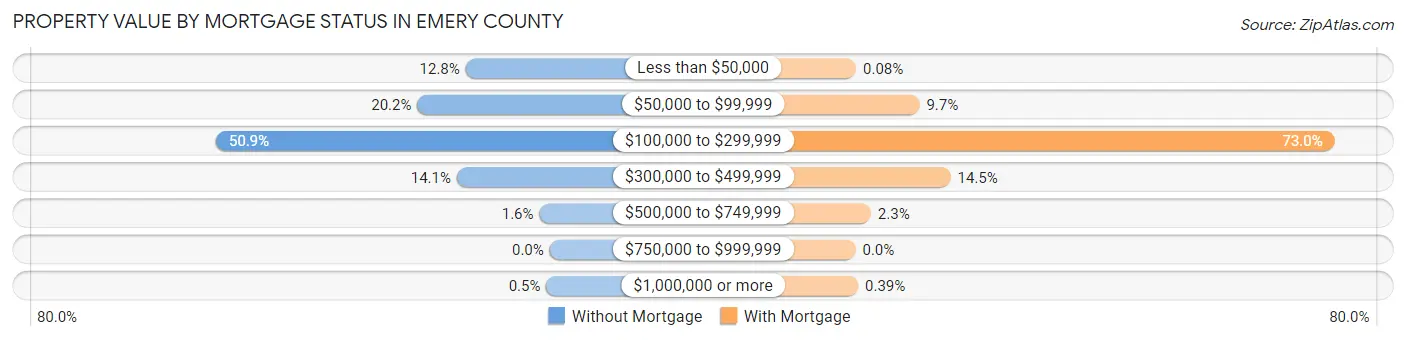
| Property Value | Without Mortgage | With Mortgage |
| Less than $50,000 | 181 (12.8%) | 1 (0.1%) |
| $50,000 to $99,999 | 285 (20.2%) | 125 (9.7%) |
| $100,000 to $299,999 | 719 (50.8%) | 937 (73.0%) |
| $300,000 to $499,999 | 200 (14.1%) | 186 (14.5%) |
| $500,000 to $749,999 | 22 (1.6%) | 30 (2.3%) |
| $750,000 to $999,999 | 0 (0.0%) | 0 (0.0%) |
| $1,000,000 or more | 7 (0.5%) | 5 (0.4%) |
| Total | 1,414 (100.0%) | 1,284 (100.0%) |
Household Income by Mortgage Status in Emery County
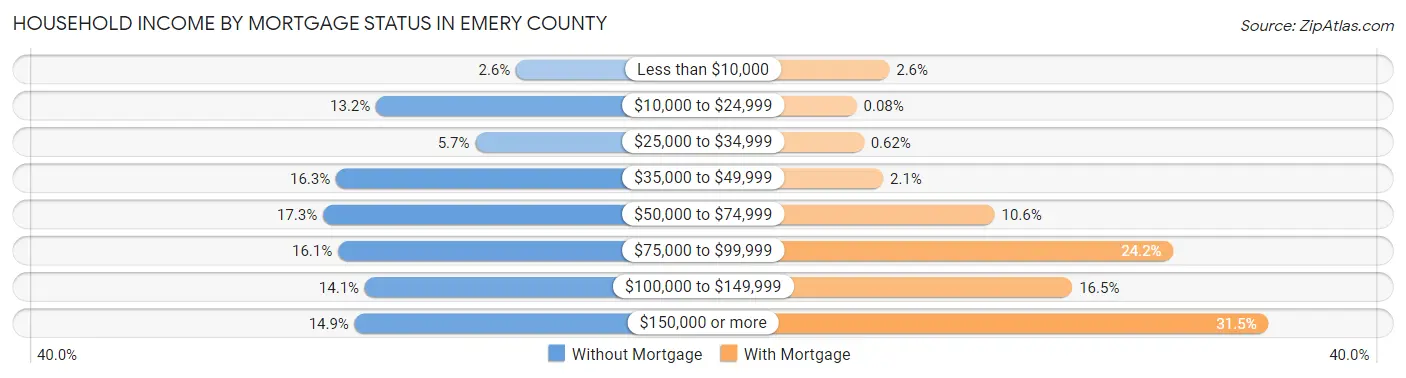
| Household Income | Without Mortgage | With Mortgage |
| Less than $10,000 | 36 (2.5%) | 33 (2.6%) |
| $10,000 to $24,999 | 187 (13.2%) | 1 (0.1%) |
| $25,000 to $34,999 | 80 (5.7%) | 8 (0.6%) |
| $35,000 to $49,999 | 230 (16.3%) | 27 (2.1%) |
| $50,000 to $74,999 | 244 (17.3%) | 136 (10.6%) |
| $75,000 to $99,999 | 228 (16.1%) | 311 (24.2%) |
| $100,000 to $149,999 | 199 (14.1%) | 212 (16.5%) |
| $150,000 or more | 210 (14.8%) | 404 (31.5%) |
| Total | 1,414 (100.0%) | 1,284 (100.0%) |
Property Value to Household Income Ratio in Emery County
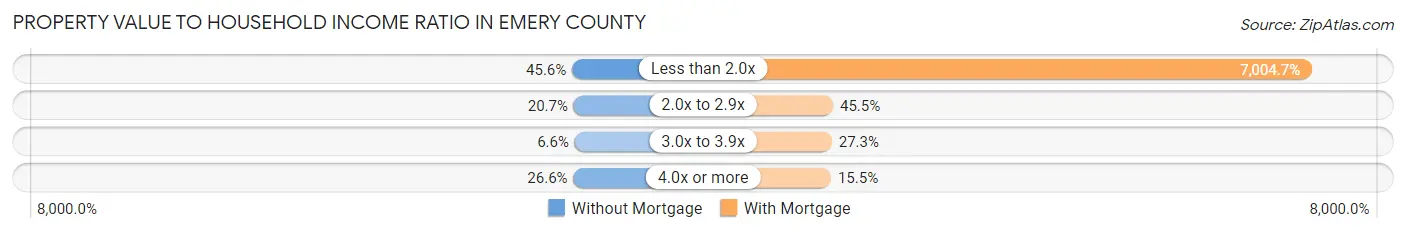
| Value-to-Income Ratio | Without Mortgage | With Mortgage |
| Less than 2.0x | 645 (45.6%) | 89,940 (7,004.7%) |
| 2.0x to 2.9x | 293 (20.7%) | 584 (45.5%) |
| 3.0x to 3.9x | 93 (6.6%) | 350 (27.3%) |
| 4.0x or more | 376 (26.6%) | 199 (15.5%) |
| Total | 1,414 (100.0%) | 1,284 (100.0%) |
Real Estate Taxes by Mortgage Status in Emery County
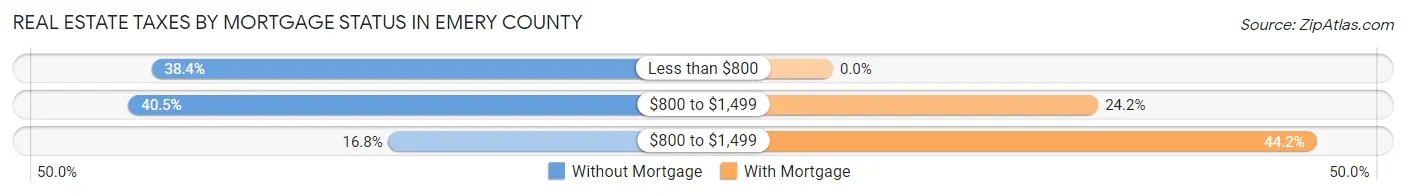
| Property Taxes | Without Mortgage | With Mortgage |
| Less than $800 | 543 (38.4%) | 0 (0.0%) |
| $800 to $1,499 | 573 (40.5%) | 311 (24.2%) |
| $800 to $1,499 | 237 (16.8%) | 567 (44.2%) |
| Total | 1,414 (100.0%) | 1,284 (100.0%) |
Health & Disability in Emery County
Health Insurance Coverage by Age in Emery County
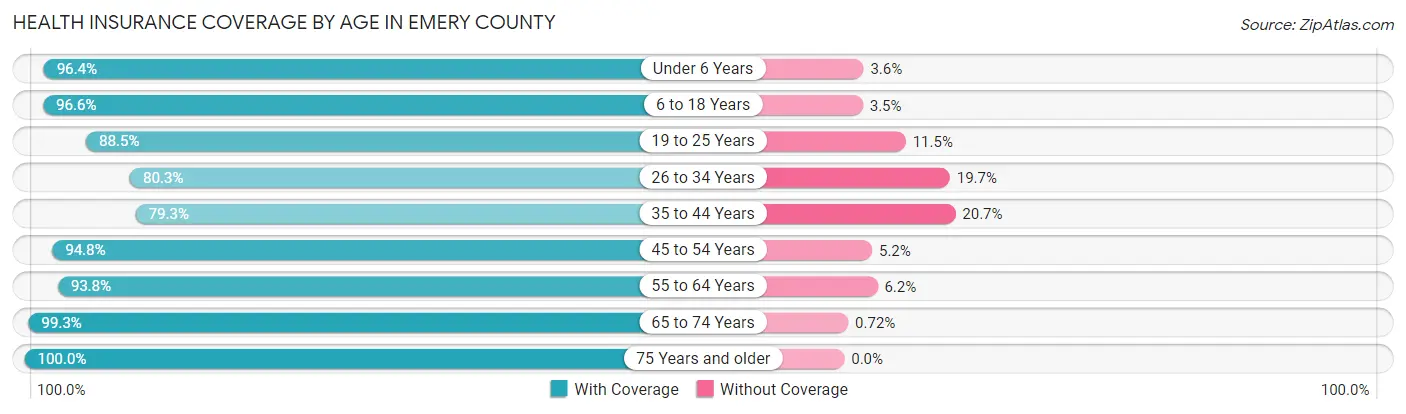
| Age Bracket | With Coverage | Without Coverage |
| Under 6 Years | 727 (96.4%) | 27 (3.6%) |
| 6 to 18 Years | 2,126 (96.6%) | 76 (3.5%) |
| 19 to 25 Years | 672 (88.5%) | 87 (11.5%) |
| 26 to 34 Years | 698 (80.3%) | 171 (19.7%) |
| 35 to 44 Years | 1,026 (79.3%) | 268 (20.7%) |
| 45 to 54 Years | 972 (94.8%) | 53 (5.2%) |
| 55 to 64 Years | 1,122 (93.8%) | 74 (6.2%) |
| 65 to 74 Years | 1,098 (99.3%) | 8 (0.7%) |
| 75 Years and older | 614 (100.0%) | 0 (0.0%) |
| Total | 9,055 (92.2%) | 764 (7.8%) |
Health Insurance Coverage by Citizenship Status in Emery County
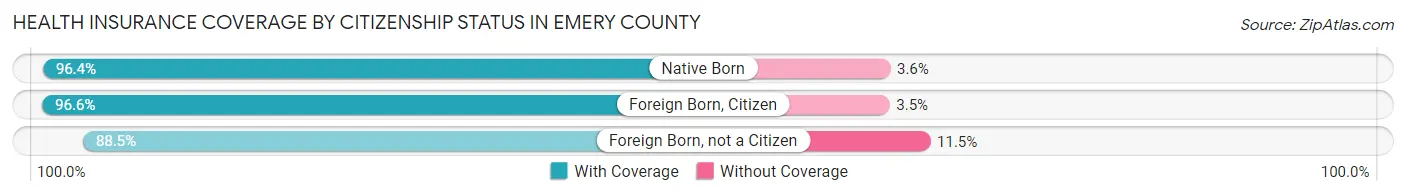
| Citizenship Status | With Coverage | Without Coverage |
| Native Born | 727 (96.4%) | 27 (3.6%) |
| Foreign Born, Citizen | 2,126 (96.6%) | 76 (3.5%) |
| Foreign Born, not a Citizen | 672 (88.5%) | 87 (11.5%) |
Health Insurance Coverage by Household Income in Emery County
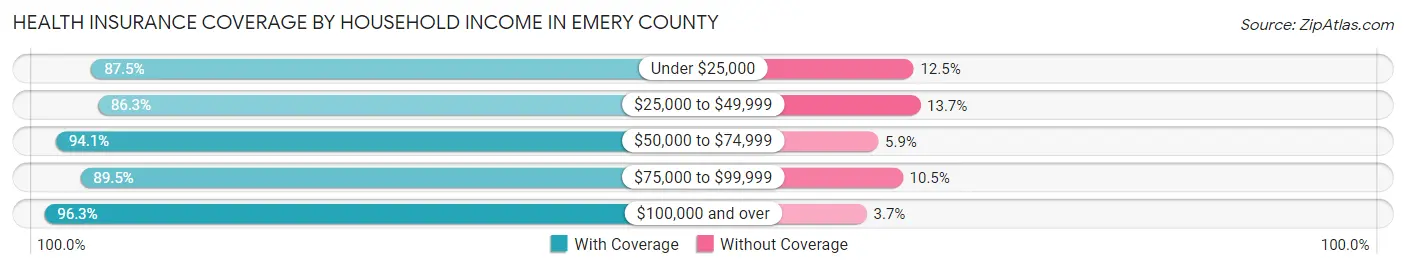
| Household Income | With Coverage | Without Coverage |
| Under $25,000 | 813 (87.5%) | 116 (12.5%) |
| $25,000 to $49,999 | 1,520 (86.3%) | 242 (13.7%) |
| $50,000 to $74,999 | 1,844 (94.1%) | 115 (5.9%) |
| $75,000 to $99,999 | 1,336 (89.5%) | 156 (10.5%) |
| $100,000 and over | 3,499 (96.3%) | 135 (3.7%) |
Public vs Private Health Insurance Coverage by Age in Emery County
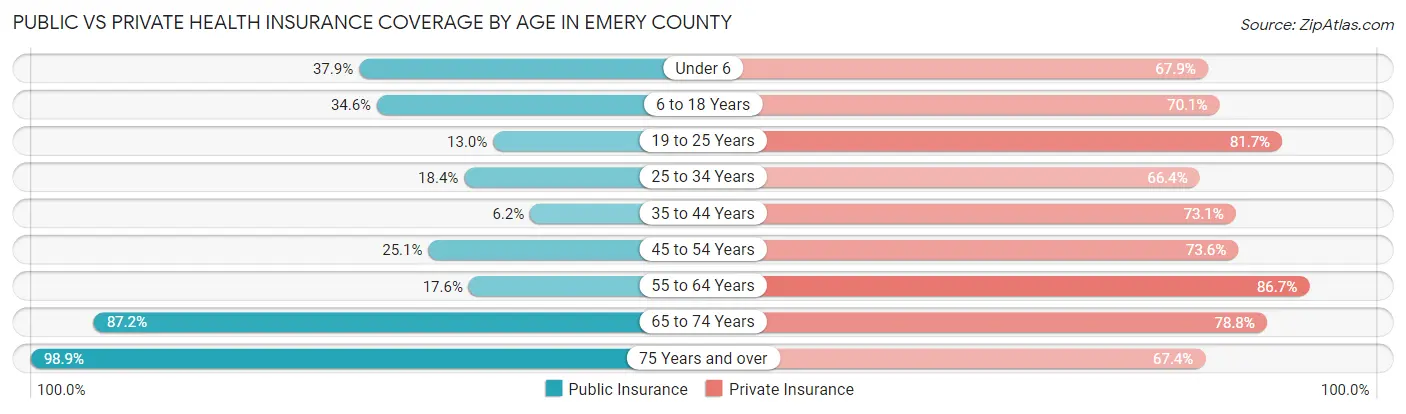
| Age Bracket | Public Insurance | Private Insurance |
| Under 6 | 286 (37.9%) | 512 (67.9%) |
| 6 to 18 Years | 762 (34.6%) | 1,543 (70.1%) |
| 19 to 25 Years | 99 (13.0%) | 620 (81.7%) |
| 25 to 34 Years | 160 (18.4%) | 577 (66.4%) |
| 35 to 44 Years | 80 (6.2%) | 946 (73.1%) |
| 45 to 54 Years | 257 (25.1%) | 754 (73.6%) |
| 55 to 64 Years | 210 (17.6%) | 1,037 (86.7%) |
| 65 to 74 Years | 964 (87.2%) | 872 (78.8%) |
| 75 Years and over | 607 (98.9%) | 414 (67.4%) |
| Total | 3,425 (34.9%) | 7,275 (74.1%) |
Disability Status by Sex by Age in Emery County
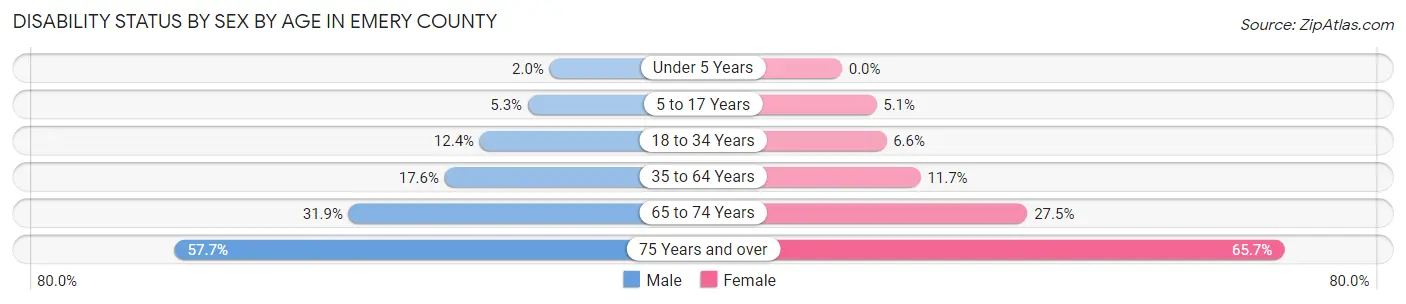
| Age Bracket | Male | Female |
| Under 5 Years | 6 (2.0%) | 0 (0.0%) |
| 5 to 17 Years | 64 (5.3%) | 52 (5.1%) |
| 18 to 34 Years | 109 (12.4%) | 58 (6.6%) |
| 35 to 64 Years | 310 (17.6%) | 205 (11.7%) |
| 65 to 74 Years | 180 (31.9%) | 149 (27.5%) |
| 75 Years and over | 161 (57.7%) | 220 (65.7%) |
Disability Class by Sex by Age in Emery County
Disability Class: Hearing Difficulty
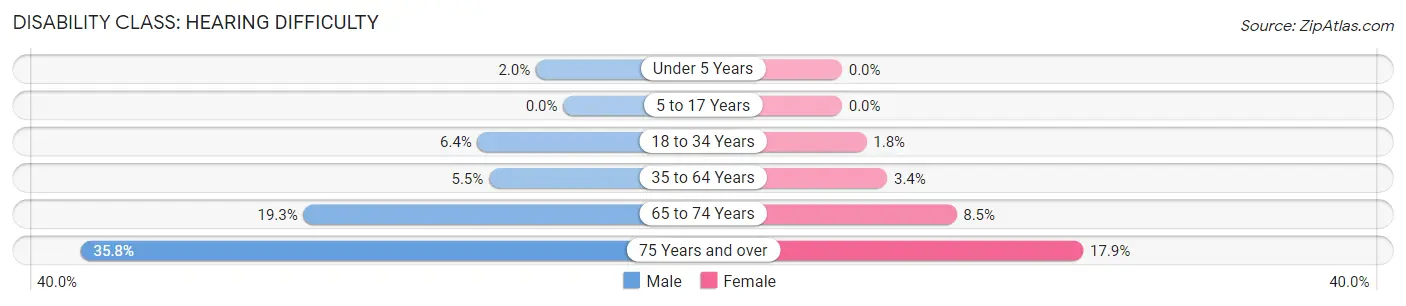
| Age Bracket | Male | Female |
| Under 5 Years | 6 (2.0%) | 0 (0.0%) |
| 5 to 17 Years | 0 (0.0%) | 0 (0.0%) |
| 18 to 34 Years | 56 (6.4%) | 16 (1.8%) |
| 35 to 64 Years | 97 (5.5%) | 59 (3.4%) |
| 65 to 74 Years | 109 (19.3%) | 46 (8.5%) |
| 75 Years and over | 100 (35.8%) | 60 (17.9%) |
Disability Class: Vision Difficulty
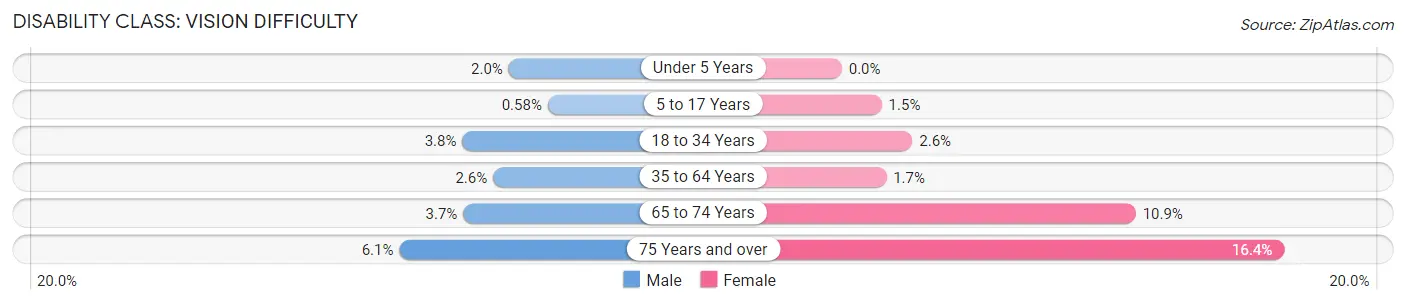
| Age Bracket | Male | Female |
| Under 5 Years | 6 (2.0%) | 0 (0.0%) |
| 5 to 17 Years | 7 (0.6%) | 15 (1.5%) |
| 18 to 34 Years | 33 (3.7%) | 23 (2.6%) |
| 35 to 64 Years | 46 (2.6%) | 29 (1.7%) |
| 65 to 74 Years | 21 (3.7%) | 59 (10.9%) |
| 75 Years and over | 17 (6.1%) | 55 (16.4%) |
Disability Class: Cognitive Difficulty
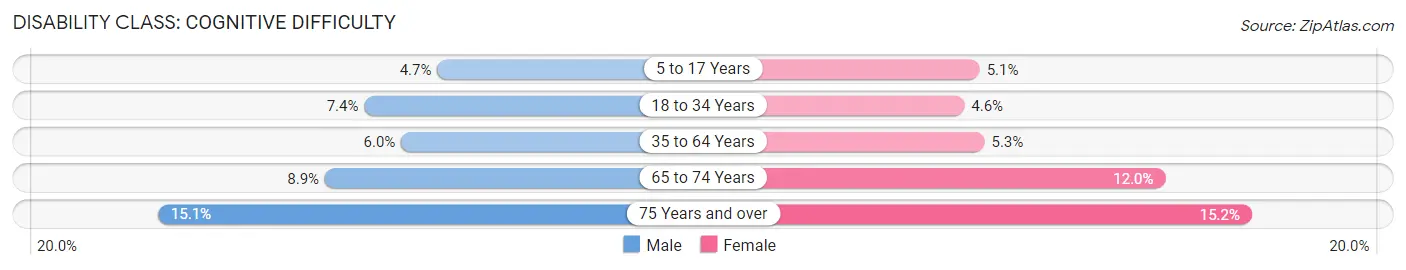
| Age Bracket | Male | Female |
| 5 to 17 Years | 57 (4.7%) | 52 (5.1%) |
| 18 to 34 Years | 65 (7.4%) | 40 (4.5%) |
| 35 to 64 Years | 106 (6.0%) | 93 (5.3%) |
| 65 to 74 Years | 50 (8.8%) | 65 (12.0%) |
| 75 Years and over | 42 (15.0%) | 51 (15.2%) |
Disability Class: Ambulatory Difficulty
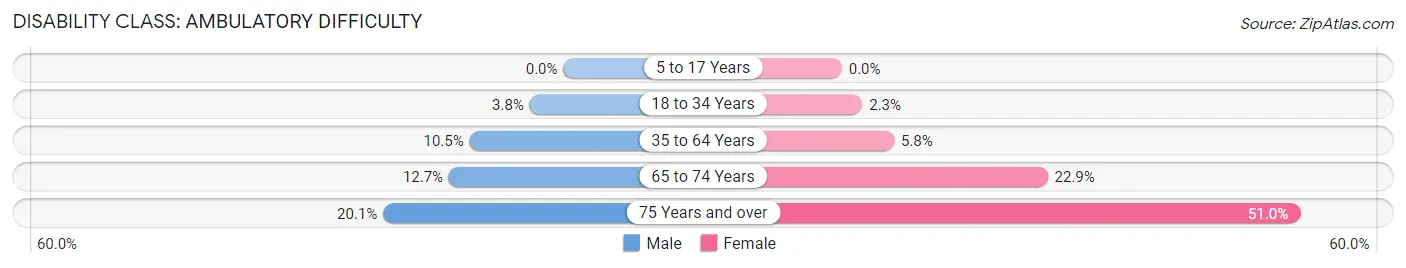
| Age Bracket | Male | Female |
| 5 to 17 Years | 0 (0.0%) | 0 (0.0%) |
| 18 to 34 Years | 33 (3.7%) | 20 (2.3%) |
| 35 to 64 Years | 184 (10.4%) | 102 (5.8%) |
| 65 to 74 Years | 72 (12.7%) | 124 (22.9%) |
| 75 Years and over | 56 (20.1%) | 171 (51.0%) |
Disability Class: Self-Care Difficulty
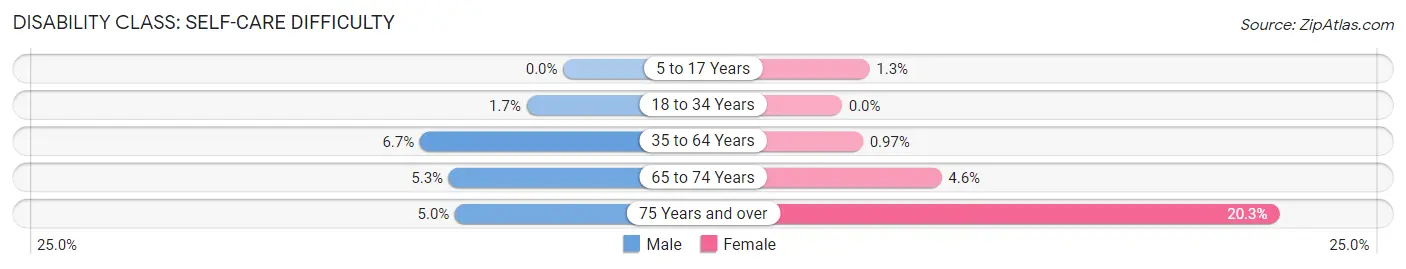
| Age Bracket | Male | Female |
| 5 to 17 Years | 0 (0.0%) | 13 (1.3%) |
| 18 to 34 Years | 15 (1.7%) | 0 (0.0%) |
| 35 to 64 Years | 117 (6.7%) | 17 (1.0%) |
| 65 to 74 Years | 30 (5.3%) | 25 (4.6%) |
| 75 Years and over | 14 (5.0%) | 68 (20.3%) |
Technology Access in Emery County
Computing Device Access in Emery County
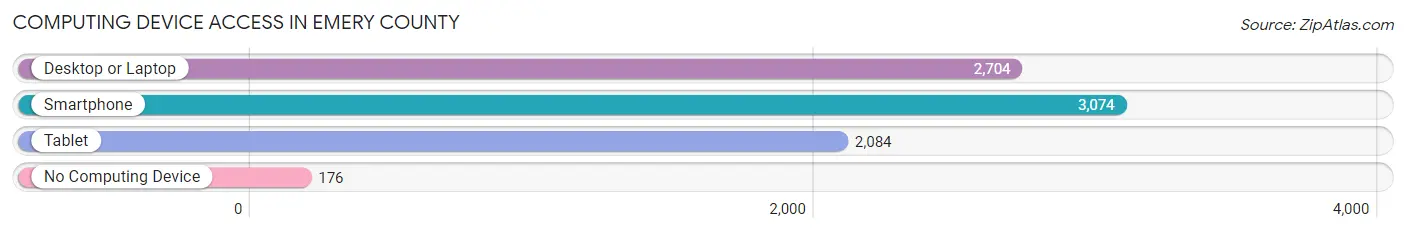
| Device Type | # Households | % Households |
| Desktop or Laptop | 2,704 | 78.4% |
| Smartphone | 3,074 | 89.2% |
| Tablet | 2,084 | 60.5% |
| No Computing Device | 176 | 5.1% |
| Total | 3,447 | 100.0% |
Internet Access in Emery County
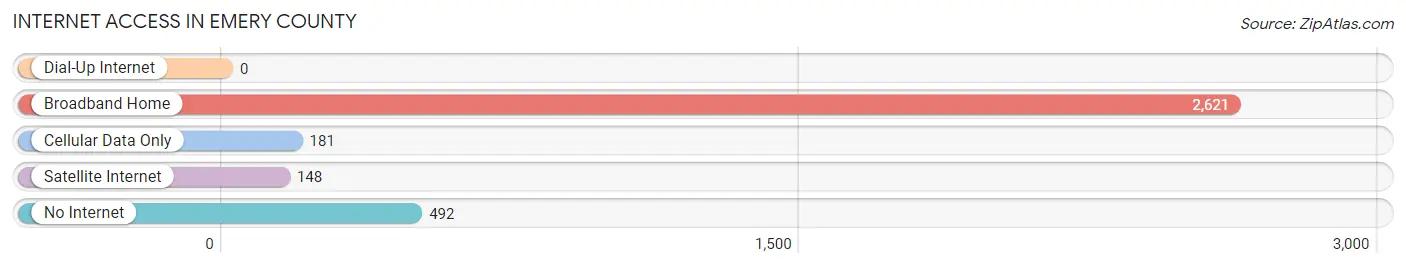
| Internet Type | # Households | % Households |
| Dial-Up Internet | 0 | 0.0% |
| Broadband Home | 2,621 | 76.0% |
| Cellular Data Only | 181 | 5.2% |
| Satellite Internet | 148 | 4.3% |
| No Internet | 492 | 14.3% |
| Total | 3,447 | 100.0% |
Emery County Summary
Emery County is located in the central part of Utah, and is bordered by Carbon, Grand, San Juan, and Sevier counties. It is the second largest county in the state, with an area of 7,086 square miles. The county seat is Castle Dale, and the largest city is Huntington.
History
The area that is now Emery County was first inhabited by the Fremont people, who lived in the area from about 500 to 1300 AD. The first Europeans to explore the area were members of the Dominguez-Escalante expedition in 1776. The first permanent settlers arrived in the area in 1877, and the county was officially established in 1880.
Geography
Emery County is located in the central part of Utah, and is bordered by Carbon, Grand, San Juan, and Sevier counties. It is the second largest county in the state, with an area of 7,086 square miles. The county is mostly mountainous, with the San Rafael Swell in the north, the Wasatch Plateau in the east, and the Manti-La Sal National Forest in the south. The Green River runs through the county, and there are several reservoirs, including Huntington Reservoir, Millsite Reservoir, and Scofield Reservoir.
Economy
The economy of Emery County is largely based on agriculture and mining. The county is home to several large coal mines, and the coal industry is the largest employer in the county. Other industries include tourism, ranching, and oil and gas production.
Demographics
As of the 2010 census, the population of Emery County was 10,976. The population is mostly white (93.3%), with small percentages of Native American (1.2%), Hispanic (2.2%), and African American (0.7%) residents. The median household income is $45,845, and the median age is 38.7 years.
Conclusion
Emery County is a large county in central Utah, with a population of nearly 11,000. The economy is largely based on agriculture and mining, and the county is home to several large coal mines. The population is mostly white, with small percentages of Native American, Hispanic, and African American residents.
Common Questions
What is the Total Population of Emery County?
Total Population of Emery County is 9,898.
What is the Total Male Population of Emery County?
Total Male Population of Emery County is 5,036.
What is the Total Female Population of Emery County?
Total Female Population of Emery County is 4,862.
What is the Ratio of Males per 100 Females in Emery County?
There are 103.58 Males per 100 Females in Emery County.
What is the Ratio of Females per 100 Males in Emery County?
There are 96.54 Females per 100 Males in Emery County.
What is the Median Population Age in Emery County?
Median Population Age in Emery County is 38.4 Years.
What is the Average Family Size in Emery County
Average Family Size in Emery County is 3.4 People.
What is the Average Household Size in Emery County
Average Household Size in Emery County is 2.8 People.
What is Per Capita Income in Emery County?
Per Capita income in Emery County is $27,771.
What is the Median Family Income in Emery County?
Median Family Income in Emery County is $82,349.
What is the Median Household income in Emery County?
Median Household Income in Emery County is $67,056.
What is Income or Wage Gap in Emery County?
Income or Wage Gap in Emery County is 67.9%.
Women in Emery County earn 32.1 cents for every dollar earned by a man.
What is Family Income Deficit in Emery County?
Family Income Deficit in Emery County is $10,064.
Families that are below poverty line in Emery County earn $10,064 less on average than the poverty threshold level.
What is Inequality or Gini Index in Emery County?
Inequality or Gini Index in Emery County is 0.37.
How Large is the Labor Force in Emery County?
There are 4,222 People in the Labor Forcein in Emery County.
What is the Percentage of People in the Labor Force in Emery County?
56.6% of People are in the Labor Force in Emery County.
What is the Unemployment Rate in Emery County?
Unemployment Rate in Emery County is 3.6%.