Davis County, UT
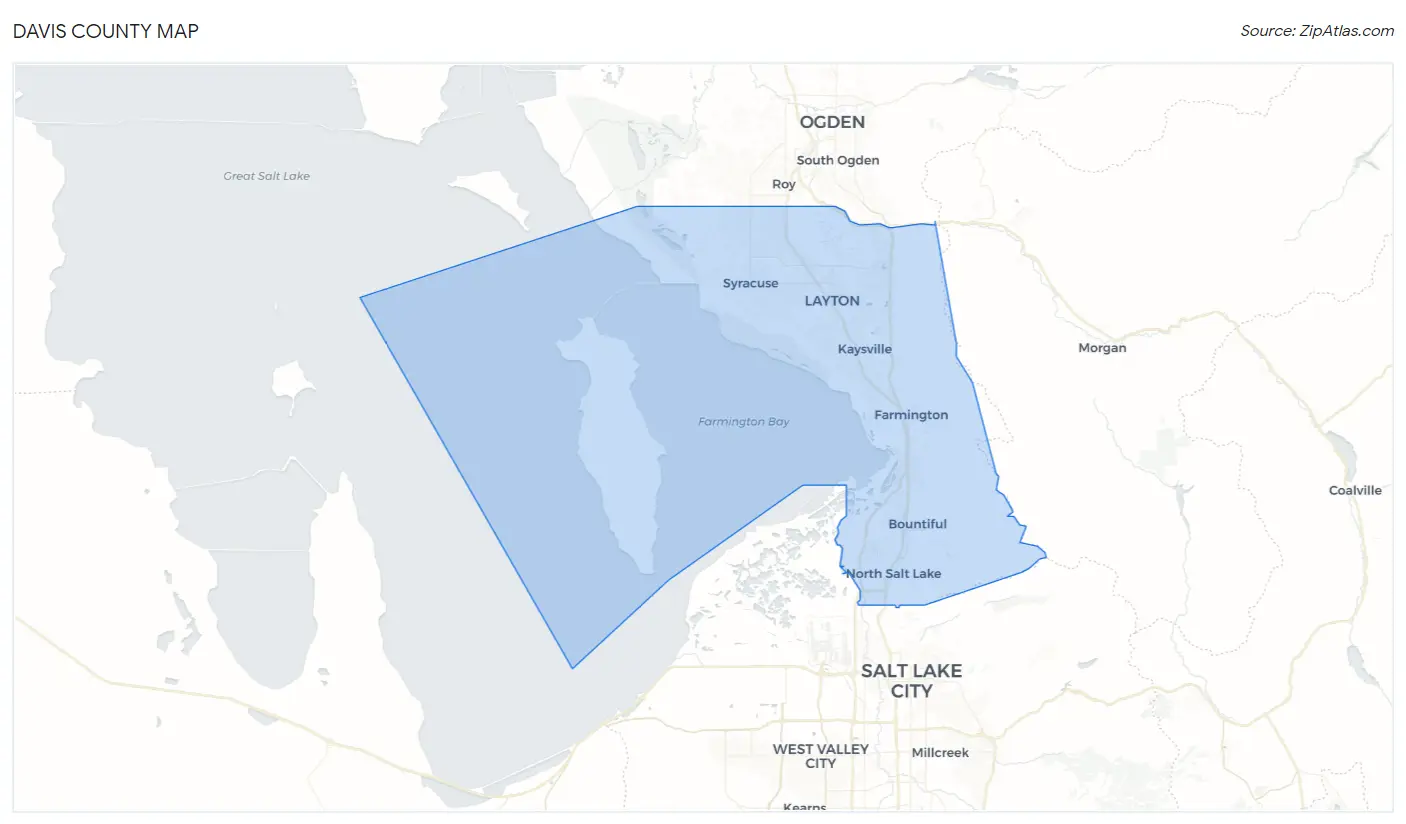
Davis County Map
Davis County Overview
363,032
TOTAL POPULATION
184,446
MALE POPULATION
178,586
FEMALE POPULATION
103.28
MALES / 100 FEMALES
96.82
FEMALES / 100 MALES
32.0
MEDIAN AGE
3.6
AVG FAMILY SIZE
3.2
AVG HOUSEHOLD SIZE
$39,218
PER CAPITA INCOME
$113,192
AVG FAMILY INCOME
$101,285
AVG HOUSEHOLD INCOME
47.0%
WAGE / INCOME GAP [ % ]
53.0¢/ $1
WAGE / INCOME GAP [ $ ]
$10,707
FAMILY INCOME DEFICIT
0.40
INEQUALITY / GINI INDEX
185,713
LABOR FORCE [ PEOPLE ]
70.6%
PERCENT IN LABOR FORCE
2.5%
UNEMPLOYMENT RATE
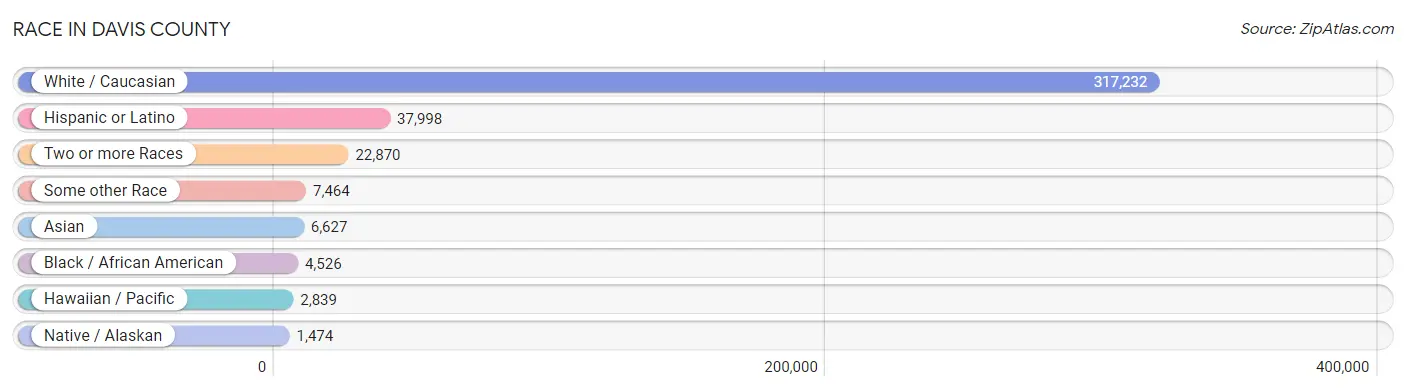
Race in Davis County
The most populous races in Davis County are White / Caucasian (317,232 | 87.4%), Hispanic or Latino (37,998 | 10.5%), and Two or more Races (22,870 | 6.3%).
| Race | # Population | % Population |
| Asian | 6,627 | 1.8% |
| Black / African American | 4,526 | 1.3% |
| Hawaiian / Pacific | 2,839 | 0.8% |
| Hispanic or Latino | 37,998 | 10.5% |
| Native / Alaskan | 1,474 | 0.4% |
| White / Caucasian | 317,232 | 87.4% |
| Two or more Races | 22,870 | 6.3% |
| Some other Race | 7,464 | 2.1% |
| Total | 363,032 | 100.0% |
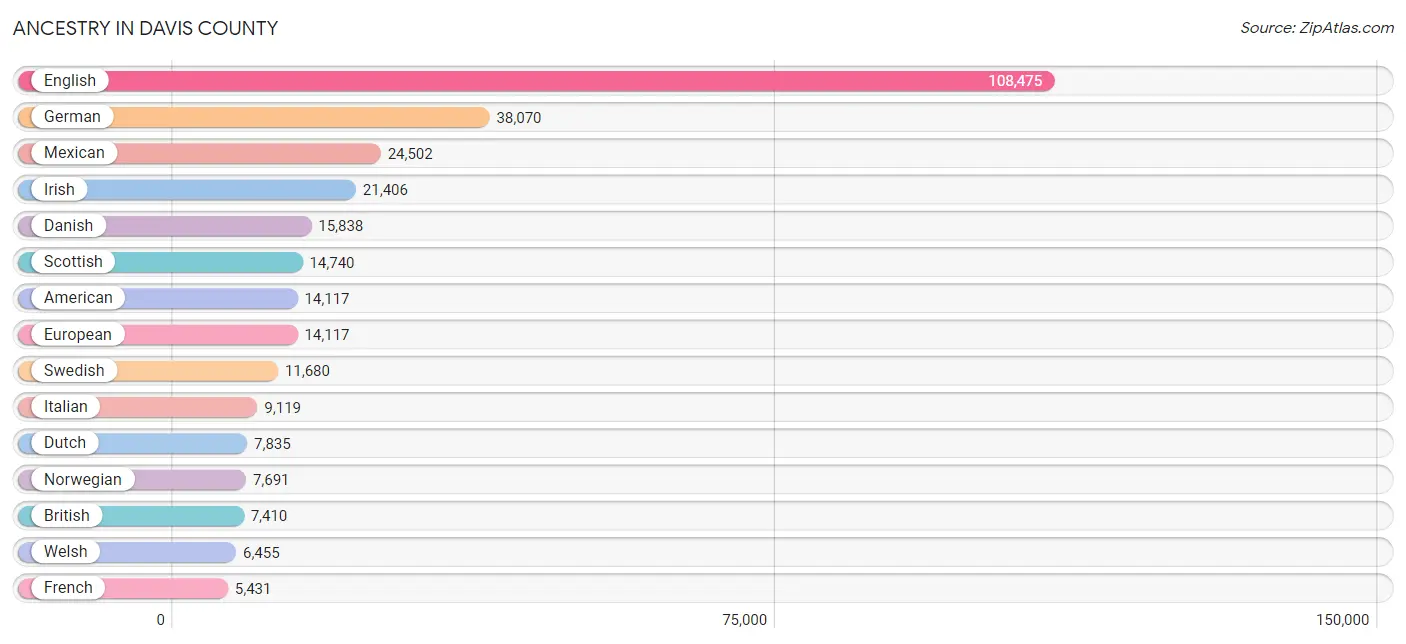
Ancestry in Davis County
The most populous ancestries reported in Davis County are English (108,475 | 29.9%), German (38,070 | 10.5%), Mexican (24,502 | 6.8%), Irish (21,406 | 5.9%), and Danish (15,838 | 4.4%), together accounting for 57.4% of all Davis County residents.
| Ancestry | # Population | % Population |
| African | 700 | 0.2% |
| Alaskan Athabascan | 36 | 0.0% |
| Albanian | 71 | 0.0% |
| American | 14,117 | 3.9% |
| Apache | 116 | 0.0% |
| Arab | 492 | 0.1% |
| Arapaho | 10 | 0.0% |
| Argentinean | 336 | 0.1% |
| Armenian | 330 | 0.1% |
| Australian | 213 | 0.1% |
| Austrian | 261 | 0.1% |
| Bangladeshi | 75 | 0.0% |
| Basque | 51 | 0.0% |
| Belgian | 172 | 0.1% |
| Bermudan | 12 | 0.0% |
| Bhutanese | 2,632 | 0.7% |
| Blackfeet | 42 | 0.0% |
| Bolivian | 70 | 0.0% |
| Brazilian | 533 | 0.2% |
| British | 7,410 | 2.0% |
| Bulgarian | 12 | 0.0% |
| Burmese | 1,290 | 0.4% |
| Cajun | 11 | 0.0% |
| Cambodian | 8 | 0.0% |
| Canadian | 1,164 | 0.3% |
| Celtic | 51 | 0.0% |
| Central American | 3,158 | 0.9% |
| Central American Indian | 177 | 0.1% |
| Cherokee | 690 | 0.2% |
| Chickasaw | 13 | 0.0% |
| Chilean | 819 | 0.2% |
| Chinese | 300 | 0.1% |
| Chippewa | 9 | 0.0% |
| Choctaw | 84 | 0.0% |
| Colombian | 664 | 0.2% |
| Comanche | 101 | 0.0% |
| Costa Rican | 30 | 0.0% |
| Creek | 27 | 0.0% |
| Croatian | 816 | 0.2% |
| Cuban | 162 | 0.0% |
| Czech | 420 | 0.1% |
| Czechoslovakian | 61 | 0.0% |
| Danish | 15,838 | 4.4% |
| Delaware | 39 | 0.0% |
| Dominican | 461 | 0.1% |
| Dutch | 7,835 | 2.2% |
| Dutch West Indian | 18 | 0.0% |
| Eastern European | 327 | 0.1% |
| Ecuadorian | 377 | 0.1% |
| Egyptian | 10 | 0.0% |
| English | 108,475 | 29.9% |
| Ethiopian | 98 | 0.0% |
| European | 14,117 | 3.9% |
| Fijian | 126 | 0.0% |
| Filipino | 56 | 0.0% |
| Finnish | 563 | 0.2% |
| French | 5,431 | 1.5% |
| French American Indian | 35 | 0.0% |
| French Canadian | 574 | 0.2% |
| German | 38,070 | 10.5% |
| Ghanaian | 117 | 0.0% |
| Greek | 1,367 | 0.4% |
| Guamanian / Chamorro | 170 | 0.1% |
| Guatemalan | 900 | 0.3% |
| Guyanese | 25 | 0.0% |
| Haitian | 74 | 0.0% |
| Honduran | 227 | 0.1% |
| Hopi | 35 | 0.0% |
| Hungarian | 486 | 0.1% |
| Icelander | 493 | 0.1% |
| Indian (Asian) | 2,198 | 0.6% |
| Inupiat | 94 | 0.0% |
| Iranian | 197 | 0.1% |
| Irish | 21,406 | 5.9% |
| Iroquois | 46 | 0.0% |
| Israeli | 17 | 0.0% |
| Italian | 9,119 | 2.5% |
| Jamaican | 59 | 0.0% |
| Japanese | 326 | 0.1% |
| Jordanian | 41 | 0.0% |
| Korean | 3,077 | 0.9% |
| Laotian | 67 | 0.0% |
| Latvian | 106 | 0.0% |
| Lebanese | 326 | 0.1% |
| Lithuanian | 157 | 0.0% |
| Lumbee | 6 | 0.0% |
| Malaysian | 151 | 0.0% |
| Mexican | 24,502 | 6.8% |
| Mexican American Indian | 150 | 0.0% |
| Mongolian | 13 | 0.0% |
| Native Hawaiian | 1,340 | 0.4% |
| Navajo | 804 | 0.2% |
| Nicaraguan | 380 | 0.1% |
| Nigerian | 23 | 0.0% |
| Northern European | 1,217 | 0.3% |
| Norwegian | 7,691 | 2.1% |
| Ottawa | 18 | 0.0% |
| Paiute | 26 | 0.0% |
| Pakistani | 744 | 0.2% |
| Panamanian | 59 | 0.0% |
| Pennsylvania German | 29 | 0.0% |
| Peruvian | 1,181 | 0.3% |
| Pima | 18 | 0.0% |
| Polish | 2,576 | 0.7% |
| Portuguese | 579 | 0.2% |
| Pueblo | 20 | 0.0% |
| Puerto Rican | 1,011 | 0.3% |
| Puget Sound Salish | 8 | 0.0% |
| Romanian | 35 | 0.0% |
| Russian | 728 | 0.2% |
| Salvadoran | 1,551 | 0.4% |
| Samoan | 1,252 | 0.3% |
| Scandinavian | 5,116 | 1.4% |
| Scotch-Irish | 2,598 | 0.7% |
| Scottish | 14,740 | 4.1% |
| Serbian | 168 | 0.1% |
| Shoshone | 105 | 0.0% |
| Sioux | 125 | 0.0% |
| Slavic | 25 | 0.0% |
| Slovak | 43 | 0.0% |
| Slovene | 137 | 0.0% |
| South African | 248 | 0.1% |
| South American | 3,867 | 1.1% |
| South American Indian | 51 | 0.0% |
| Spaniard | 1,760 | 0.5% |
| Spanish | 1,485 | 0.4% |
| Spanish American | 10 | 0.0% |
| Spanish American Indian | 17 | 0.0% |
| Sri Lankan | 955 | 0.3% |
| Subsaharan African | 1,249 | 0.3% |
| Swedish | 11,680 | 3.2% |
| Swiss | 4,488 | 1.2% |
| Syrian | 67 | 0.0% |
| Taiwanese | 18 | 0.0% |
| Thai | 505 | 0.1% |
| Tlingit-Haida | 9 | 0.0% |
| Tongan | 1,486 | 0.4% |
| Trinidadian and Tobagonian | 43 | 0.0% |
| Turkish | 16 | 0.0% |
| Ukrainian | 401 | 0.1% |
| Uruguayan | 58 | 0.0% |
| Ute | 13 | 0.0% |
| Venezuelan | 362 | 0.1% |
| Welsh | 6,455 | 1.8% |
| Yaqui | 11 | 0.0% |
| Yugoslavian | 139 | 0.0% | View All 146 Rows |
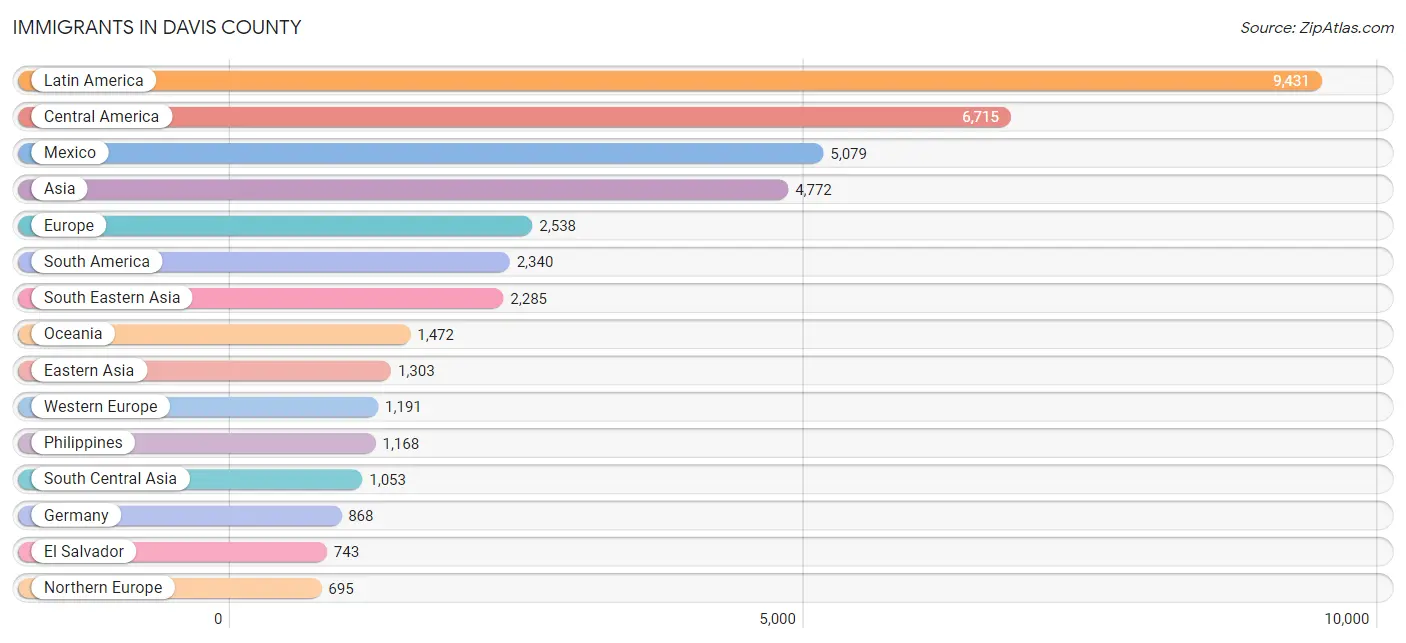
Immigrants in Davis County
The most numerous immigrant groups reported in Davis County came from Latin America (9,431 | 2.6%), Central America (6,715 | 1.8%), Mexico (5,079 | 1.4%), Asia (4,772 | 1.3%), and Europe (2,538 | 0.7%), together accounting for 7.9% of all Davis County residents.
| Immigration Origin | # Population | % Population |
| Africa | 349 | 0.1% |
| Argentina | 234 | 0.1% |
| Asia | 4,772 | 1.3% |
| Australia | 112 | 0.0% |
| Austria | 41 | 0.0% |
| Azores | 12 | 0.0% |
| Belarus | 6 | 0.0% |
| Bolivia | 85 | 0.0% |
| Bosnia and Herzegovina | 92 | 0.0% |
| Brazil | 508 | 0.1% |
| Bulgaria | 6 | 0.0% |
| Cambodia | 175 | 0.1% |
| Canada | 601 | 0.2% |
| Caribbean | 376 | 0.1% |
| Central America | 6,715 | 1.8% |
| Chile | 184 | 0.1% |
| China | 467 | 0.1% |
| Colombia | 368 | 0.1% |
| Croatia | 2 | 0.0% |
| Cuba | 118 | 0.0% |
| Denmark | 43 | 0.0% |
| Dominican Republic | 184 | 0.1% |
| Eastern Africa | 137 | 0.0% |
| Eastern Asia | 1,303 | 0.4% |
| Eastern Europe | 376 | 0.1% |
| Ecuador | 80 | 0.0% |
| Egypt | 13 | 0.0% |
| El Salvador | 743 | 0.2% |
| England | 267 | 0.1% |
| Ethiopia | 89 | 0.0% |
| Europe | 2,538 | 0.7% |
| France | 103 | 0.0% |
| Germany | 868 | 0.2% |
| Ghana | 42 | 0.0% |
| Greece | 8 | 0.0% |
| Guatemala | 493 | 0.1% |
| Haiti | 49 | 0.0% |
| Honduras | 199 | 0.1% |
| Hong Kong | 45 | 0.0% |
| India | 331 | 0.1% |
| Indonesia | 4 | 0.0% |
| Iran | 30 | 0.0% |
| Italy | 80 | 0.0% |
| Jamaica | 6 | 0.0% |
| Japan | 288 | 0.1% |
| Jordan | 34 | 0.0% |
| Kazakhstan | 3 | 0.0% |
| Kenya | 9 | 0.0% |
| Korea | 547 | 0.2% |
| Laos | 57 | 0.0% |
| Latin America | 9,431 | 2.6% |
| Lebanon | 62 | 0.0% |
| Malaysia | 47 | 0.0% |
| Mexico | 5,079 | 1.4% |
| Micronesia | 441 | 0.1% |
| Middle Africa | 3 | 0.0% |
| Nepal | 16 | 0.0% |
| Netherlands | 124 | 0.0% |
| Nicaragua | 136 | 0.0% |
| Northern Africa | 13 | 0.0% |
| Northern Europe | 695 | 0.2% |
| Norway | 32 | 0.0% |
| Oceania | 1,472 | 0.4% |
| Pakistan | 621 | 0.2% |
| Panama | 65 | 0.0% |
| Peru | 585 | 0.2% |
| Philippines | 1,168 | 0.3% |
| Poland | 30 | 0.0% |
| Portugal | 12 | 0.0% |
| Romania | 7 | 0.0% |
| Russia | 38 | 0.0% |
| Saudi Arabia | 19 | 0.0% |
| Scotland | 54 | 0.0% |
| South Africa | 154 | 0.0% |
| South America | 2,340 | 0.6% |
| South Central Asia | 1,053 | 0.3% |
| South Eastern Asia | 2,285 | 0.6% |
| Southern Europe | 276 | 0.1% |
| Spain | 176 | 0.1% |
| Sri Lanka | 23 | 0.0% |
| Sweden | 22 | 0.0% |
| Switzerland | 55 | 0.0% |
| Taiwan | 56 | 0.0% |
| Thailand | 266 | 0.1% |
| Turkey | 16 | 0.0% |
| Ukraine | 74 | 0.0% |
| Uruguay | 30 | 0.0% |
| Uzbekistan | 29 | 0.0% |
| Venezuela | 266 | 0.1% |
| Vietnam | 568 | 0.2% |
| Western Africa | 42 | 0.0% |
| Western Asia | 131 | 0.0% |
| Western Europe | 1,191 | 0.3% |
| Zaire | 3 | 0.0% |
| Zimbabwe | 34 | 0.0% | View All 95 Rows |
Sex and Age in Davis County
Sex and Age in Davis County
The most populous age groups in Davis County are 5 to 9 Years (17,089 | 9.3%) for men and 10 to 14 Years (16,831 | 9.4%) for women.
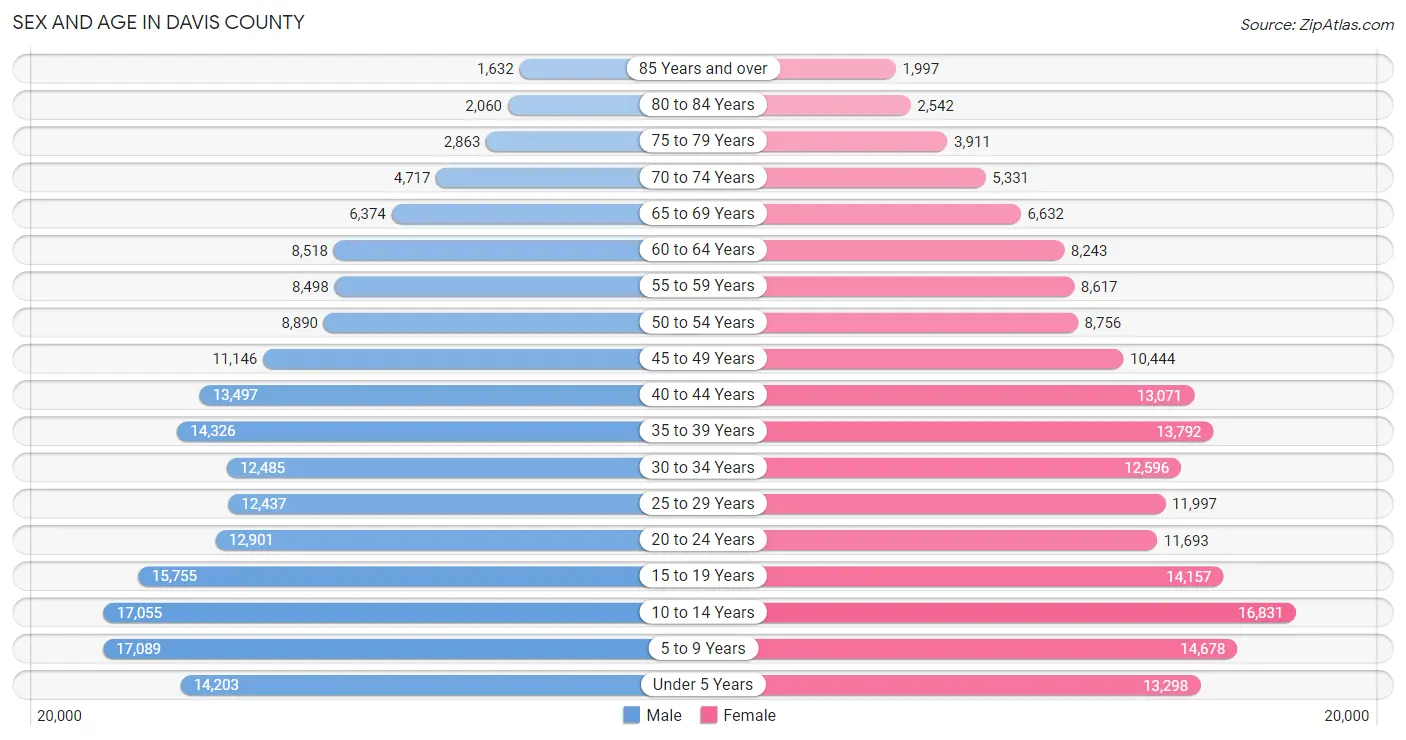
| Age Bracket | Male | Female |
| Under 5 Years | 14,203 (7.7%) | 13,298 (7.4%) |
| 5 to 9 Years | 17,089 (9.3%) | 14,678 (8.2%) |
| 10 to 14 Years | 17,055 (9.2%) | 16,831 (9.4%) |
| 15 to 19 Years | 15,755 (8.5%) | 14,157 (7.9%) |
| 20 to 24 Years | 12,901 (7.0%) | 11,693 (6.6%) |
| 25 to 29 Years | 12,437 (6.7%) | 11,997 (6.7%) |
| 30 to 34 Years | 12,485 (6.8%) | 12,596 (7.0%) |
| 35 to 39 Years | 14,326 (7.8%) | 13,792 (7.7%) |
| 40 to 44 Years | 13,497 (7.3%) | 13,071 (7.3%) |
| 45 to 49 Years | 11,146 (6.0%) | 10,444 (5.9%) |
| 50 to 54 Years | 8,890 (4.8%) | 8,756 (4.9%) |
| 55 to 59 Years | 8,498 (4.6%) | 8,617 (4.8%) |
| 60 to 64 Years | 8,518 (4.6%) | 8,243 (4.6%) |
| 65 to 69 Years | 6,374 (3.5%) | 6,632 (3.7%) |
| 70 to 74 Years | 4,717 (2.6%) | 5,331 (3.0%) |
| 75 to 79 Years | 2,863 (1.5%) | 3,911 (2.2%) |
| 80 to 84 Years | 2,060 (1.1%) | 2,542 (1.4%) |
| 85 Years and over | 1,632 (0.9%) | 1,997 (1.1%) |
| Total | 184,446 (100.0%) | 178,586 (100.0%) |
Families and Households in Davis County
Median Family Size in Davis County
The median family size in Davis County is 3.64 persons per family, with married-couple families (73,841 | 83.1%) accounting for the largest median family size of 3.73 persons per family. On the other hand, single male/father families (5,039 | 5.7%) represent the smallest median family size with 3.12 persons per family.
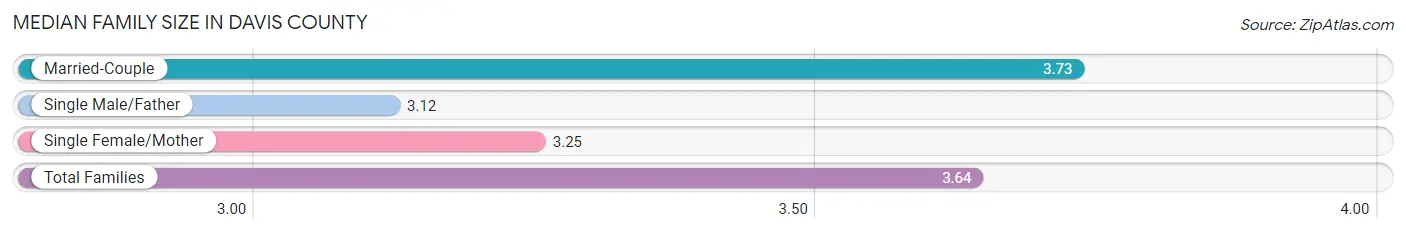
| Family Type | # Families | Family Size |
| Married-Couple | 73,841 (83.1%) | 3.73 |
| Single Male/Father | 5,039 (5.7%) | 3.12 |
| Single Female/Mother | 9,969 (11.2%) | 3.25 |
| Total Families | 88,849 (100.0%) | 3.64 |
Median Household Size in Davis County
The median household size in Davis County is 3.21 persons per household, with married-couple households (73,841 | 65.8%) accounting for the largest median household size of 3.77 persons per household. non-family households (23,306 | 20.8%) represent the smallest median household size with 1.31 persons per household.
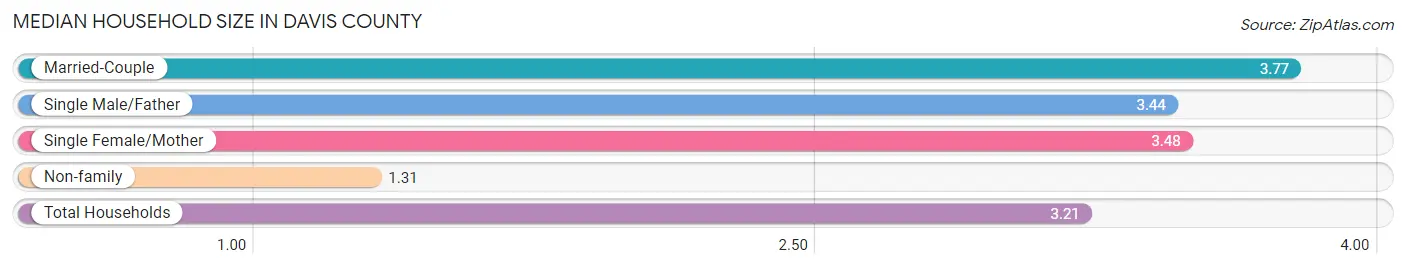
| Household Type | # Households | Household Size |
| Married-Couple | 73,841 (65.8%) | 3.77 |
| Single Male/Father | 5,039 (4.5%) | 3.44 |
| Single Female/Mother | 9,969 (8.9%) | 3.48 |
| Non-family | 23,306 (20.8%) | 1.31 |
| Total Households | 112,155 (100.0%) | 3.21 |
Household Size by Marriage Status in Davis County
Out of a total of 112,155 households in Davis County, 88,849 (79.2%) are family households, while 23,306 (20.8%) are nonfamily households. The most numerous type of family households are 2-person households, comprising 29,372, and the most common type of nonfamily households are 1-person households, comprising 18,600.
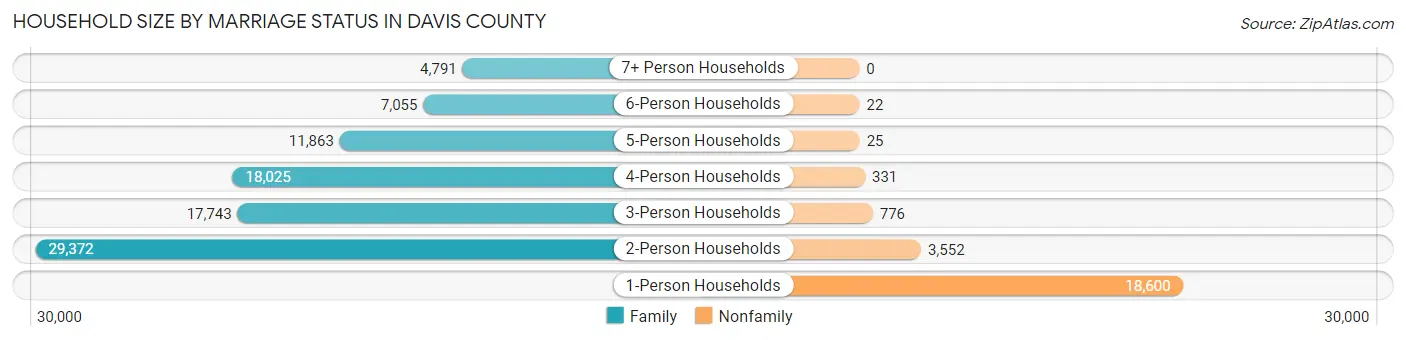
| Household Size | Family Households | Nonfamily Households |
| 1-Person Households | - | 18,600 (16.6%) |
| 2-Person Households | 29,372 (26.2%) | 3,552 (3.2%) |
| 3-Person Households | 17,743 (15.8%) | 776 (0.7%) |
| 4-Person Households | 18,025 (16.1%) | 331 (0.3%) |
| 5-Person Households | 11,863 (10.6%) | 25 (0.0%) |
| 6-Person Households | 7,055 (6.3%) | 22 (0.0%) |
| 7+ Person Households | 4,791 (4.3%) | 0 (0.0%) |
| Total | 88,849 (79.2%) | 23,306 (20.8%) |
Female Fertility in Davis County
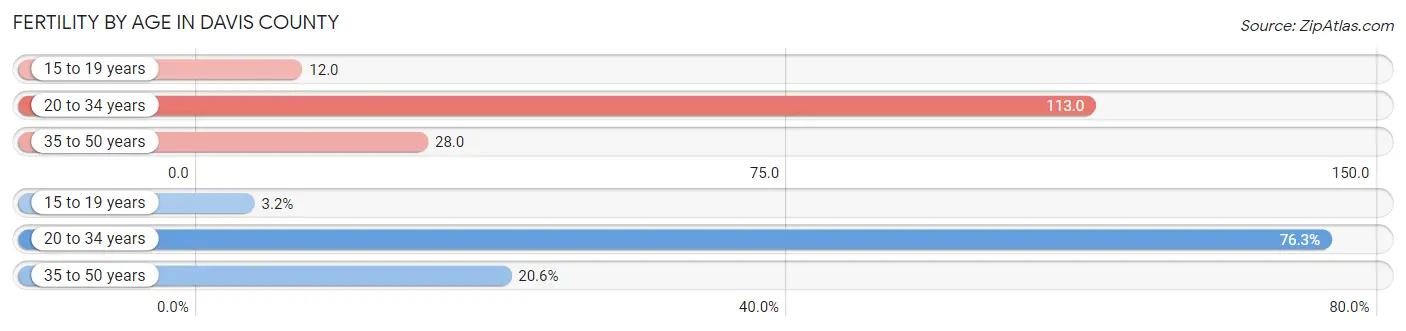
Fertility by Age in Davis County
Average fertility rate in Davis County is 60.0 births per 1,000 women. Women in the age bracket of 20 to 34 years have the highest fertility rate with 113.0 births per 1,000 women. Women in the age bracket of 20 to 34 years acount for 76.3% of all women with births.
| Age Bracket | Women with Births | Births / 1,000 Women |
| 15 to 19 years | 170 (3.2%) | 12.0 |
| 20 to 34 years | 4,102 (76.3%) | 113.0 |
| 35 to 50 years | 1,107 (20.6%) | 28.0 |
| Total | 5,379 (100.0%) | 60.0 |
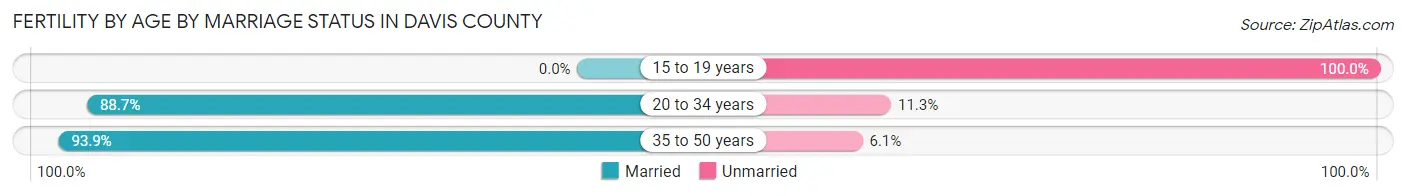
Fertility by Age by Marriage Status in Davis County
87.0% of women with births (5,379) in Davis County are married. The highest percentage of unmarried women with births falls into 15 to 19 years age bracket with 100.0% of them unmarried at the time of birth, while the lowest percentage of unmarried women with births belong to 35 to 50 years age bracket with 6.1% of them unmarried.
| Age Bracket | Married | Unmarried |
| 15 to 19 years | 0 (0.0%) | 170 (100.0%) |
| 20 to 34 years | 3,638 (88.7%) | 464 (11.3%) |
| 35 to 50 years | 1,039 (93.9%) | 68 (6.1%) |
| Total | 4,680 (87.0%) | 699 (13.0%) |
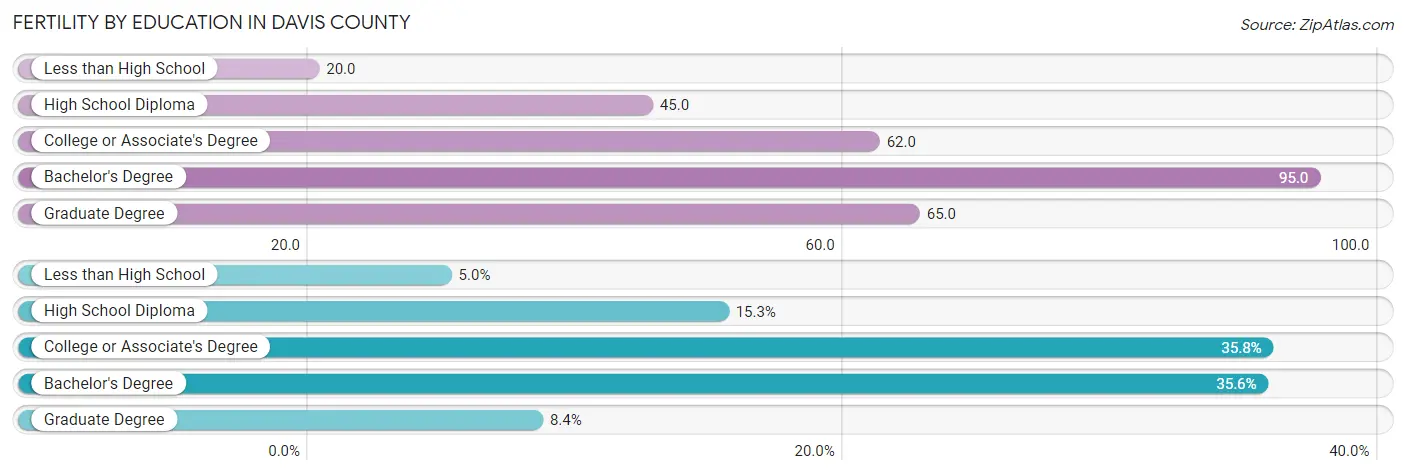
Fertility by Education in Davis County
Average fertility rate in Davis County is 60.0 births per 1,000 women. Women with the education attainment of bachelor's degree have the highest fertility rate of 95.0 births per 1,000 women, while women with the education attainment of less than high school have the lowest fertility at 20.0 births per 1,000 women. Women with the education attainment of college or associate's degree represent 35.7% of all women with births.
| Educational Attainment | Women with Births | Births / 1,000 Women |
| Less than High School | 267 (5.0%) | 20.0 |
| High School Diploma | 825 (15.3%) | 45.0 |
| College or Associate's Degree | 1,923 (35.7%) | 62.0 |
| Bachelor's Degree | 1,913 (35.6%) | 95.0 |
| Graduate Degree | 451 (8.4%) | 65.0 |
| Total | 5,379 (100.0%) | 60.0 |
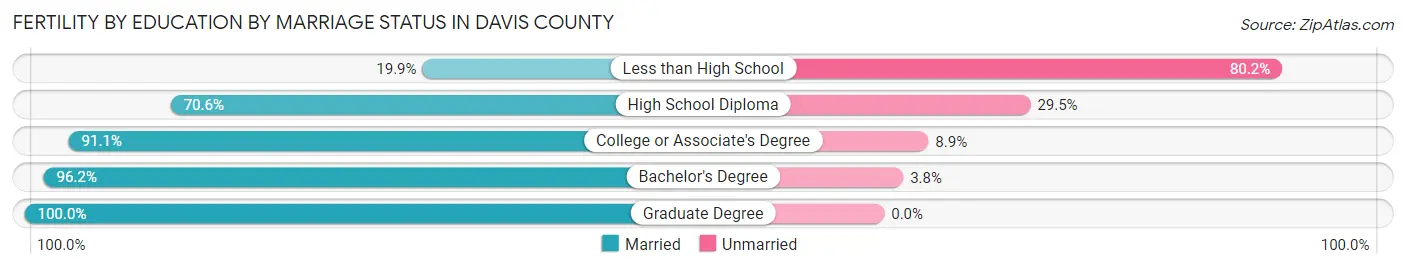
Fertility by Education by Marriage Status in Davis County
13.0% of women with births in Davis County are unmarried. Women with the educational attainment of graduate degree are most likely to be married with 100.0% of them married at childbirth, while women with the educational attainment of less than high school are least likely to be married with 80.1% of them unmarried at childbirth.
| Educational Attainment | Married | Unmarried |
| Less than High School | 53 (19.9%) | 214 (80.1%) |
| High School Diploma | 582 (70.6%) | 243 (29.4%) |
| College or Associate's Degree | 1,752 (91.1%) | 171 (8.9%) |
| Bachelor's Degree | 1,840 (96.2%) | 73 (3.8%) |
| Graduate Degree | 451 (100.0%) | 0 (0.0%) |
| Total | 4,680 (87.0%) | 699 (13.0%) |
Income in Davis County
Income Overview in Davis County
Per Capita Income in Davis County is $39,218, while median incomes of families and households are $113,192 and $101,285 respectively.
| Characteristic | Number | Measure |
| Per Capita Income | 363,032 | $39,218 |
| Median Family Income | 88,849 | $113,192 |
| Mean Family Income | 88,849 | $135,226 |
| Median Household Income | 112,155 | $101,285 |
| Mean Household Income | 112,155 | $123,102 |
| Income Deficit | 88,849 | $10,707 |
| Wage / Income Gap (%) | 363,032 | 47.01% |
| Wage / Income Gap ($) | 363,032 | 52.99¢ per $1 |
| Gini / Inequality Index | 363,032 | 0.40 |
Earnings by Sex in Davis County
Average Earnings in Davis County are $44,083, $58,849 for men and $31,187 for women, a difference of 47.0%.
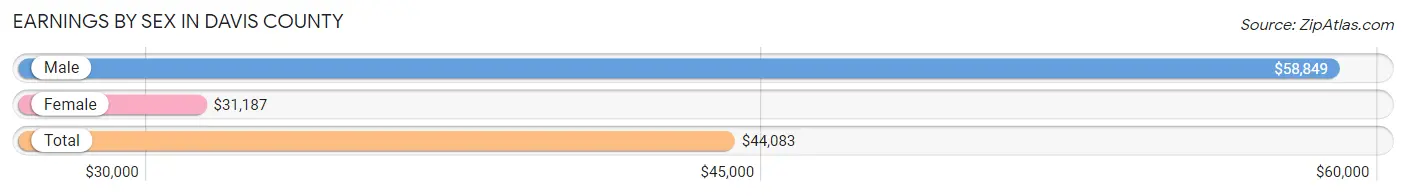
| Sex | Number | Average Earnings |
| Male | 108,266 (55.5%) | $58,849 |
| Female | 86,718 (44.5%) | $31,187 |
| Total | 194,984 (100.0%) | $44,083 |
Earnings by Sex by Income Bracket in Davis County
The most common earnings brackets in Davis County are $100,000+ for men (26,838 | 24.8%) and $2,499 or less for women (6,693 | 7.7%).
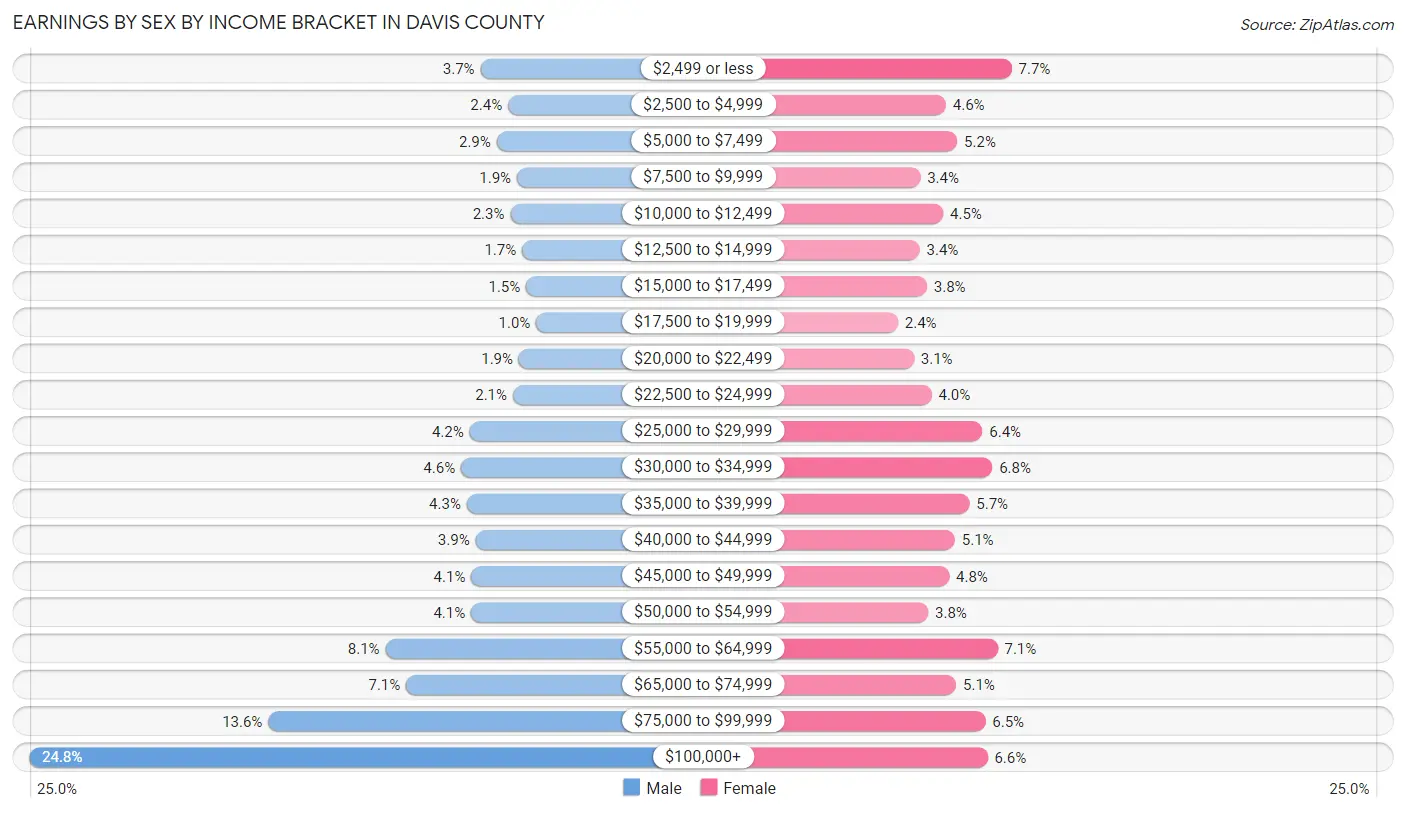
| Income | Male | Female |
| $2,499 or less | 3,955 (3.6%) | 6,693 (7.7%) |
| $2,500 to $4,999 | 2,555 (2.4%) | 4,026 (4.6%) |
| $5,000 to $7,499 | 3,126 (2.9%) | 4,486 (5.2%) |
| $7,500 to $9,999 | 2,096 (1.9%) | 2,981 (3.4%) |
| $10,000 to $12,499 | 2,441 (2.2%) | 3,912 (4.5%) |
| $12,500 to $14,999 | 1,836 (1.7%) | 2,960 (3.4%) |
| $15,000 to $17,499 | 1,632 (1.5%) | 3,253 (3.7%) |
| $17,500 to $19,999 | 1,129 (1.0%) | 2,070 (2.4%) |
| $20,000 to $22,499 | 2,001 (1.8%) | 2,724 (3.1%) |
| $22,500 to $24,999 | 2,304 (2.1%) | 3,445 (4.0%) |
| $25,000 to $29,999 | 4,508 (4.2%) | 5,509 (6.4%) |
| $30,000 to $34,999 | 4,939 (4.6%) | 5,905 (6.8%) |
| $35,000 to $39,999 | 4,645 (4.3%) | 4,981 (5.7%) |
| $40,000 to $44,999 | 4,206 (3.9%) | 4,392 (5.1%) |
| $45,000 to $49,999 | 4,422 (4.1%) | 4,157 (4.8%) |
| $50,000 to $54,999 | 4,429 (4.1%) | 3,305 (3.8%) |
| $55,000 to $64,999 | 8,770 (8.1%) | 6,126 (7.1%) |
| $65,000 to $74,999 | 7,716 (7.1%) | 4,444 (5.1%) |
| $75,000 to $99,999 | 14,718 (13.6%) | 5,631 (6.5%) |
| $100,000+ | 26,838 (24.8%) | 5,718 (6.6%) |
| Total | 108,266 (100.0%) | 86,718 (100.0%) |
Earnings by Sex by Educational Attainment in Davis County
Average earnings in Davis County are $71,169 for men and $37,334 for women, a difference of 47.5%. Men with an educational attainment of graduate degree enjoy the highest average annual earnings of $115,503, while those with less than high school education earn the least with $45,756. Women with an educational attainment of graduate degree earn the most with the average annual earnings of $71,396, while those with less than high school education have the smallest earnings of $26,318.
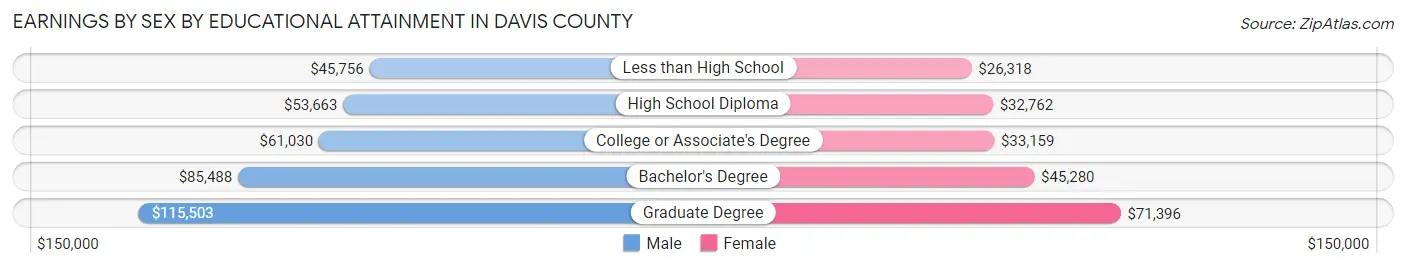
| Educational Attainment | Male Income | Female Income |
| Less than High School | $45,756 | $26,318 |
| High School Diploma | $53,663 | $32,762 |
| College or Associate's Degree | $61,030 | $33,159 |
| Bachelor's Degree | $85,488 | $45,280 |
| Graduate Degree | $115,503 | $71,396 |
| Total | $71,169 | $37,334 |
Family Income in Davis County
Family Income Brackets in Davis County
According to the Davis County family income data, there are 24,167 families falling into the $100,000 to $149,999 income range, which is the most common income bracket and makes up 27.2% of all families. Conversely, the $10,000 to $14,999 income bracket is the least frequent group with only 800 families (0.9%) belonging to this category.
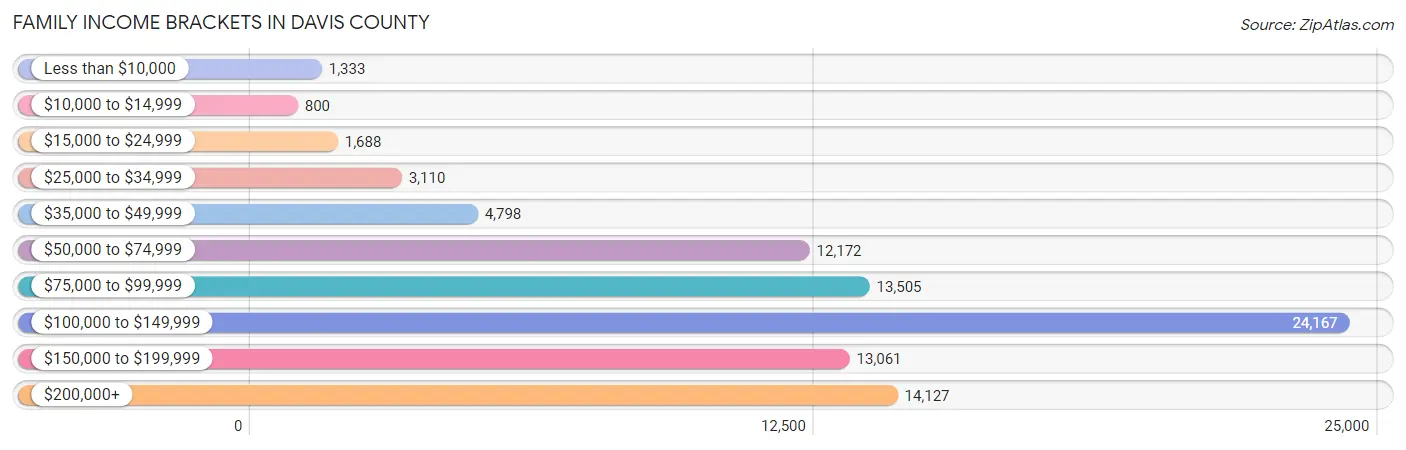
| Income Bracket | # Families | % Families |
| Less than $10,000 | 1,333 | 1.5% |
| $10,000 to $14,999 | 800 | 0.9% |
| $15,000 to $24,999 | 1,688 | 1.9% |
| $25,000 to $34,999 | 3,110 | 3.5% |
| $35,000 to $49,999 | 4,798 | 5.4% |
| $50,000 to $74,999 | 12,172 | 13.7% |
| $75,000 to $99,999 | 13,505 | 15.2% |
| $100,000 to $149,999 | 24,167 | 27.2% |
| $150,000 to $199,999 | 13,061 | 14.7% |
| $200,000+ | 14,127 | 15.9% |
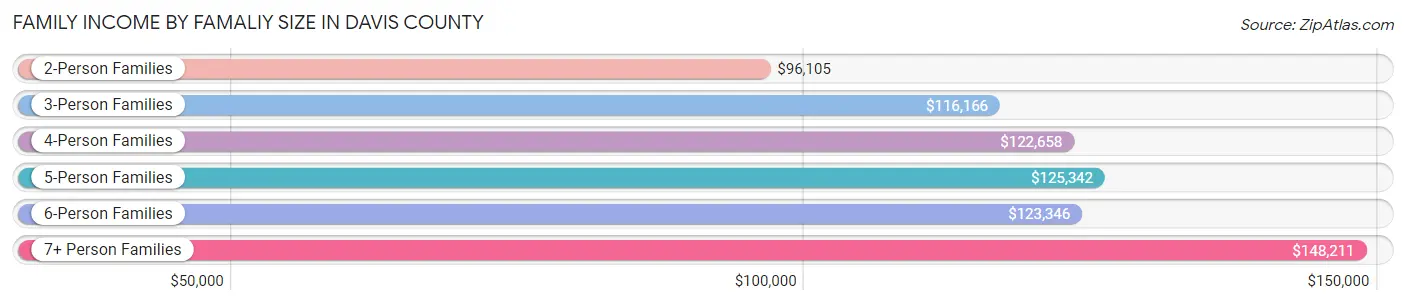
Family Income by Famaliy Size in Davis County
7+ person families (4,348 | 4.9%) account for the highest median family income in Davis County with $148,211 per family, while 2-person families (31,222 | 35.1%) have the highest median income of $48,052 per family member.
| Income Bracket | # Families | Median Income |
| 2-Person Families | 31,222 (35.1%) | $96,105 |
| 3-Person Families | 17,172 (19.3%) | $116,166 |
| 4-Person Families | 17,642 (19.9%) | $122,658 |
| 5-Person Families | 11,694 (13.2%) | $125,342 |
| 6-Person Families | 6,771 (7.6%) | $123,346 |
| 7+ Person Families | 4,348 (4.9%) | $148,211 |
| Total | 88,849 (100.0%) | $113,192 |
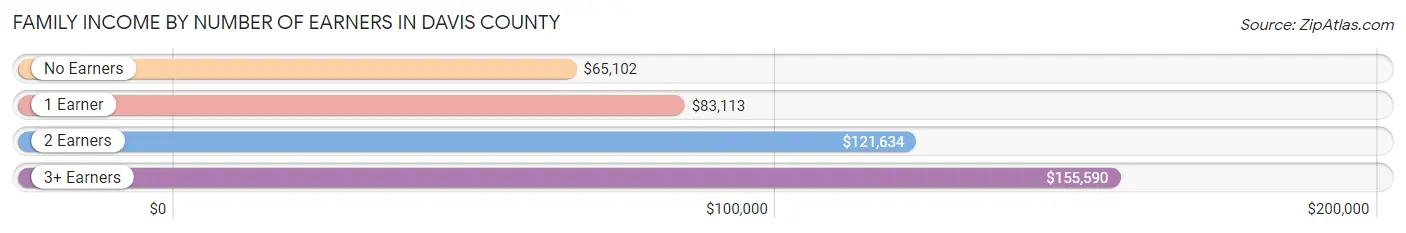
Family Income by Number of Earners in Davis County
The median family income in Davis County is $113,192, with families comprising 3+ earners (17,119) having the highest median family income of $155,590, while families with no earners (8,142) have the lowest median family income of $65,102, accounting for 19.3% and 9.2% of families, respectively.
| Number of Earners | # Families | Median Income |
| No Earners | 8,142 (9.2%) | $65,102 |
| 1 Earner | 24,519 (27.6%) | $83,113 |
| 2 Earners | 39,069 (44.0%) | $121,634 |
| 3+ Earners | 17,119 (19.3%) | $155,590 |
| Total | 88,849 (100.0%) | $113,192 |
Household Income in Davis County
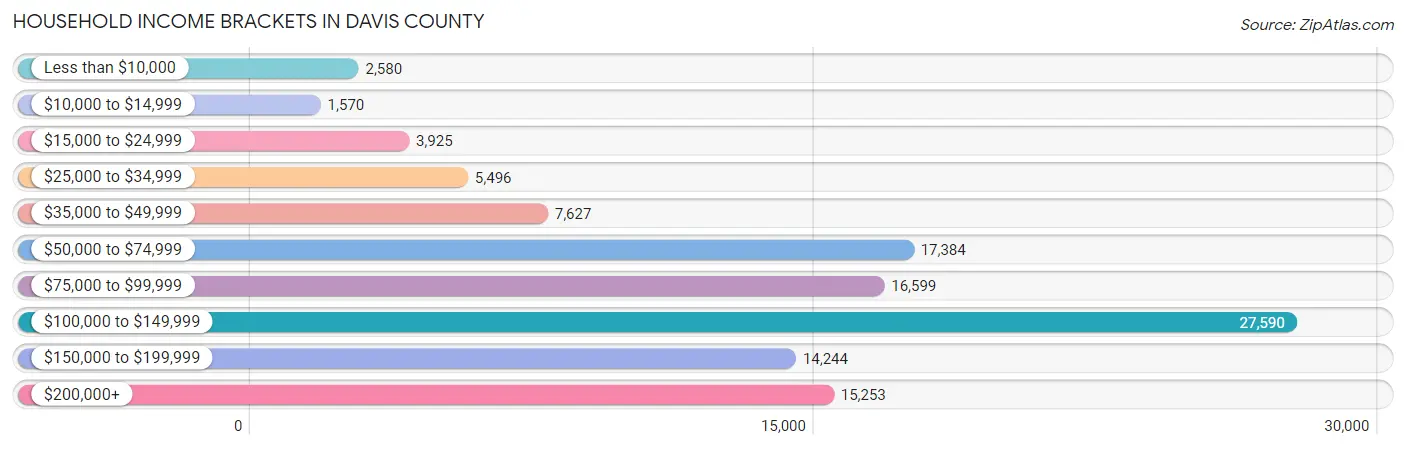
Household Income Brackets in Davis County
With 27,590 households falling in the category, the $100,000 to $149,999 income range is the most frequent in Davis County, accounting for 24.6% of all households. In contrast, only 1,570 households (1.4%) fall into the $10,000 to $14,999 income bracket, making it the least populous group.
| Income Bracket | # Households | % Households |
| Less than $10,000 | 2,580 | 2.3% |
| $10,000 to $14,999 | 1,570 | 1.4% |
| $15,000 to $24,999 | 3,925 | 3.5% |
| $25,000 to $34,999 | 5,496 | 4.9% |
| $35,000 to $49,999 | 7,627 | 6.8% |
| $50,000 to $74,999 | 17,384 | 15.5% |
| $75,000 to $99,999 | 16,599 | 14.8% |
| $100,000 to $149,999 | 27,590 | 24.6% |
| $150,000 to $199,999 | 14,244 | 12.7% |
| $200,000+ | 15,253 | 13.6% |
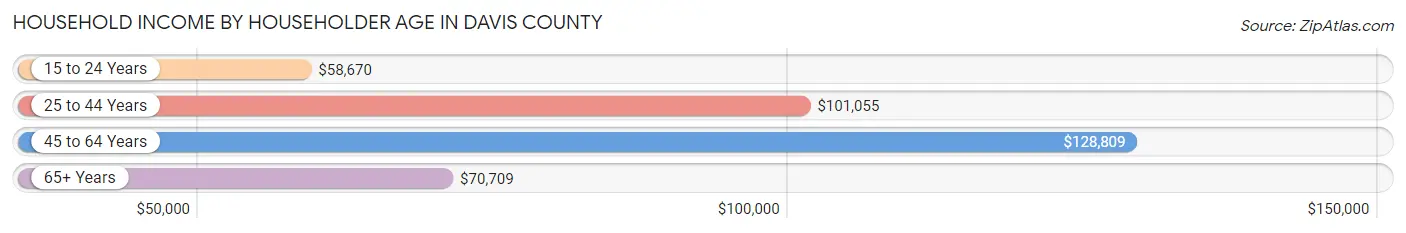
Household Income by Householder Age in Davis County
The median household income in Davis County is $101,285, with the highest median household income of $128,809 found in the 45 to 64 years age bracket for the primary householder. A total of 38,317 households (34.2%) fall into this category. Meanwhile, the 15 to 24 years age bracket for the primary householder has the lowest median household income of $58,670, with 4,463 households (4.0%) in this group.
| Income Bracket | # Households | Median Income |
| 15 to 24 Years | 4,463 (4.0%) | $58,670 |
| 25 to 44 Years | 46,967 (41.9%) | $101,055 |
| 45 to 64 Years | 38,317 (34.2%) | $128,809 |
| 65+ Years | 22,408 (20.0%) | $70,709 |
| Total | 112,155 (100.0%) | $101,285 |
Poverty in Davis County
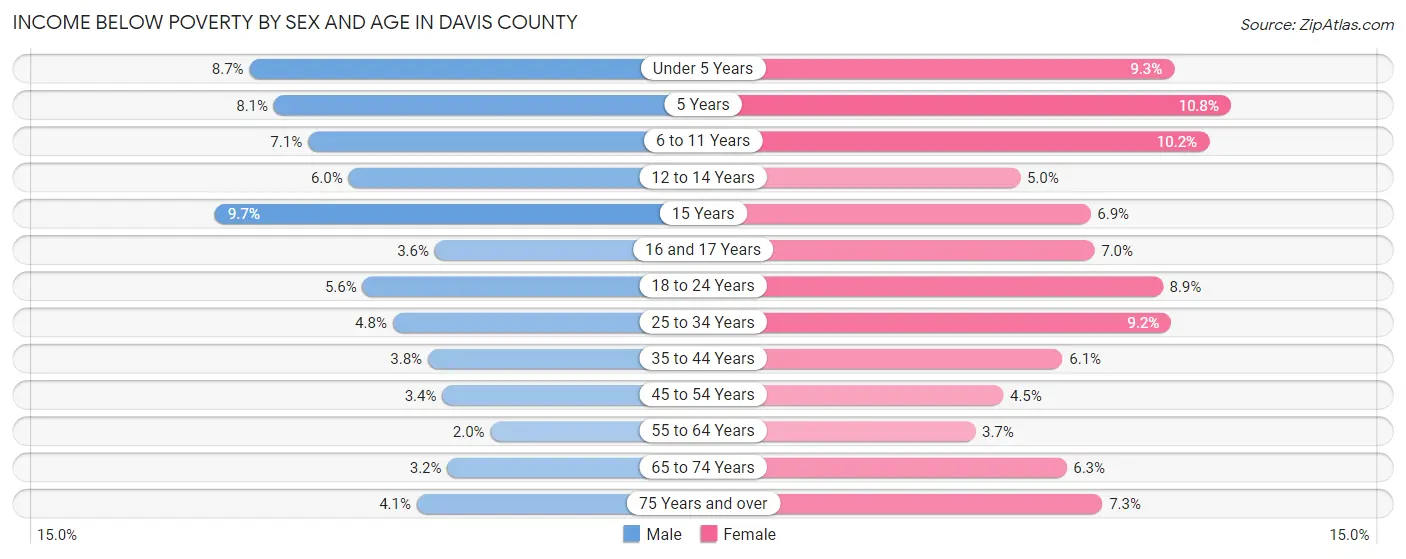
Income Below Poverty by Sex and Age in Davis County
With 4.9% poverty level for males and 7.2% for females among the residents of Davis County, 15 year old males and 5 year old females are the most vulnerable to poverty, with 345 males (9.7%) and 303 females (10.8%) in their respective age groups living below the poverty level.
| Age Bracket | Male | Female |
| Under 5 Years | 1,230 (8.7%) | 1,221 (9.2%) |
| 5 Years | 302 (8.1%) | 303 (10.8%) |
| 6 to 11 Years | 1,436 (7.1%) | 1,975 (10.2%) |
| 12 to 14 Years | 589 (6.0%) | 458 (5.0%) |
| 15 Years | 345 (9.7%) | 223 (6.9%) |
| 16 and 17 Years | 237 (3.6%) | 440 (7.0%) |
| 18 to 24 Years | 1,009 (5.6%) | 1,450 (8.9%) |
| 25 to 34 Years | 1,174 (4.8%) | 2,253 (9.2%) |
| 35 to 44 Years | 1,044 (3.8%) | 1,647 (6.1%) |
| 45 to 54 Years | 670 (3.4%) | 859 (4.5%) |
| 55 to 64 Years | 344 (2.0%) | 623 (3.7%) |
| 65 to 74 Years | 355 (3.2%) | 741 (6.2%) |
| 75 Years and over | 262 (4.1%) | 596 (7.2%) |
| Total | 8,997 (4.9%) | 12,789 (7.2%) |
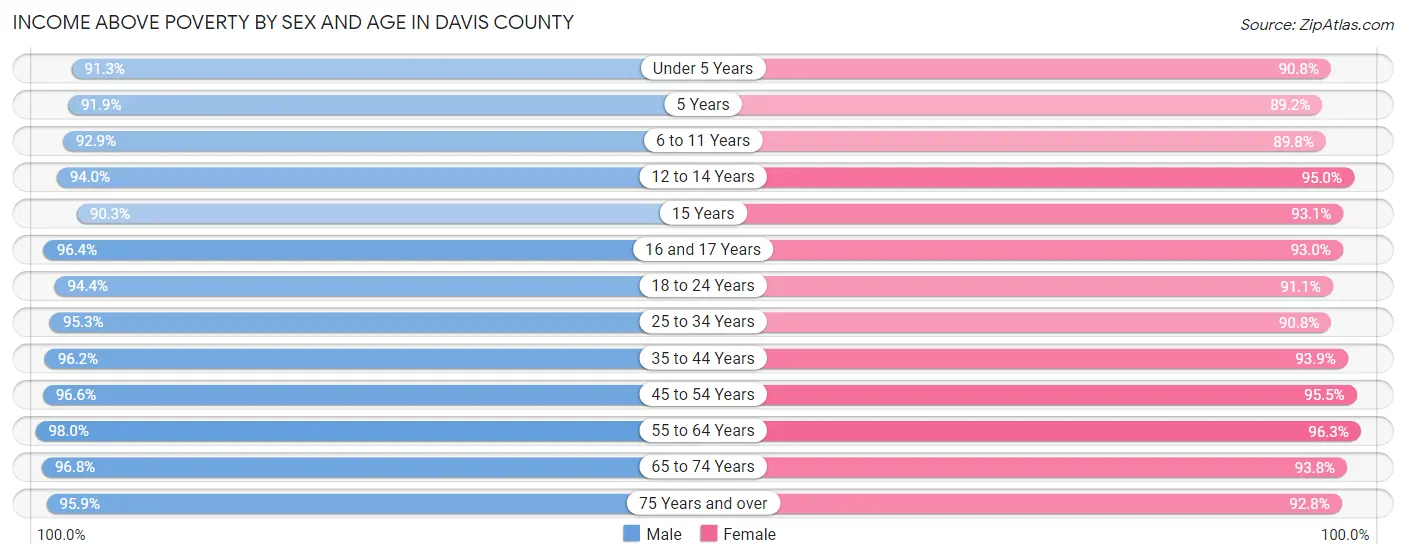
Income Above Poverty by Sex and Age in Davis County
According to the poverty statistics in Davis County, males aged 55 to 64 years and females aged 55 to 64 years are the age groups that are most secure financially, with 98.0% of males and 96.3% of females in these age groups living above the poverty line.
| Age Bracket | Male | Female |
| Under 5 Years | 12,843 (91.3%) | 11,975 (90.7%) |
| 5 Years | 3,443 (91.9%) | 2,496 (89.2%) |
| 6 to 11 Years | 18,774 (92.9%) | 17,346 (89.8%) |
| 12 to 14 Years | 9,268 (94.0%) | 8,784 (95.0%) |
| 15 Years | 3,210 (90.3%) | 2,999 (93.1%) |
| 16 and 17 Years | 6,383 (96.4%) | 5,818 (93.0%) |
| 18 to 24 Years | 17,035 (94.4%) | 14,793 (91.1%) |
| 25 to 34 Years | 23,534 (95.3%) | 22,314 (90.8%) |
| 35 to 44 Years | 26,612 (96.2%) | 25,170 (93.9%) |
| 45 to 54 Years | 19,198 (96.6%) | 18,289 (95.5%) |
| 55 to 64 Years | 16,592 (98.0%) | 16,147 (96.3%) |
| 65 to 74 Years | 10,630 (96.8%) | 11,119 (93.8%) |
| 75 Years and over | 6,165 (95.9%) | 7,630 (92.7%) |
| Total | 173,687 (95.1%) | 164,880 (92.8%) |
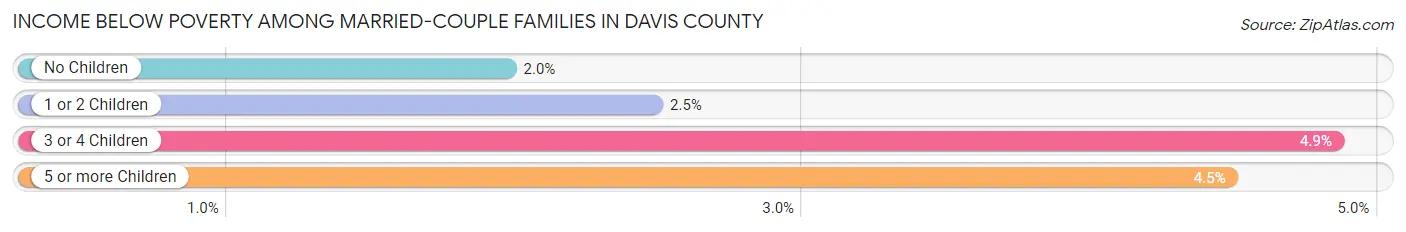
Income Below Poverty Among Married-Couple Families in Davis County
The poverty statistics for married-couple families in Davis County show that 2.7% or 2,021 of the total 73,841 families live below the poverty line. Families with 3 or 4 children have the highest poverty rate of 4.9%, comprising of 643 families. On the other hand, families with no children have the lowest poverty rate of 2.0%, which includes 669 families.
| Children | Above Poverty | Below Poverty |
| No Children | 33,208 (98.0%) | 669 (2.0%) |
| 1 or 2 Children | 23,721 (97.5%) | 602 (2.5%) |
| 3 or 4 Children | 12,610 (95.2%) | 643 (4.9%) |
| 5 or more Children | 2,281 (95.5%) | 107 (4.5%) |
| Total | 71,820 (97.3%) | 2,021 (2.7%) |
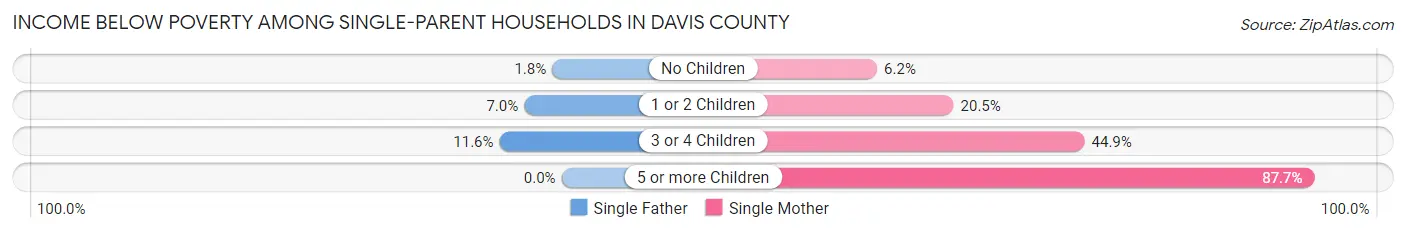
Income Below Poverty Among Single-Parent Households in Davis County
According to the poverty data in Davis County, 4.8% or 244 single-father households and 21.1% or 2,103 single-mother households are living below the poverty line. Among single-father households, those with 3 or 4 children have the highest poverty rate, with 48 households (11.6%) experiencing poverty. Likewise, among single-mother households, those with 5 or more children have the highest poverty rate, with 270 households (87.7%) falling below the poverty line.
| Children | Single Father | Single Mother |
| No Children | 42 (1.8%) | 207 (6.2%) |
| 1 or 2 Children | 154 (7.0%) | 1,025 (20.5%) |
| 3 or 4 Children | 48 (11.6%) | 601 (44.9%) |
| 5 or more Children | 0 (0.0%) | 270 (87.7%) |
| Total | 244 (4.8%) | 2,103 (21.1%) |
Income Below Poverty Among Married-Couple vs Single-Parent Households in Davis County
The poverty data for Davis County shows that 2,021 of the married-couple family households (2.7%) and 2,347 of the single-parent households (15.6%) are living below the poverty level. Within the married-couple family households, those with 3 or 4 children have the highest poverty rate, with 643 households (4.9%) falling below the poverty line. Among the single-parent households, those with 5 or more children have the highest poverty rate, with 270 household (79.9%) living below poverty.
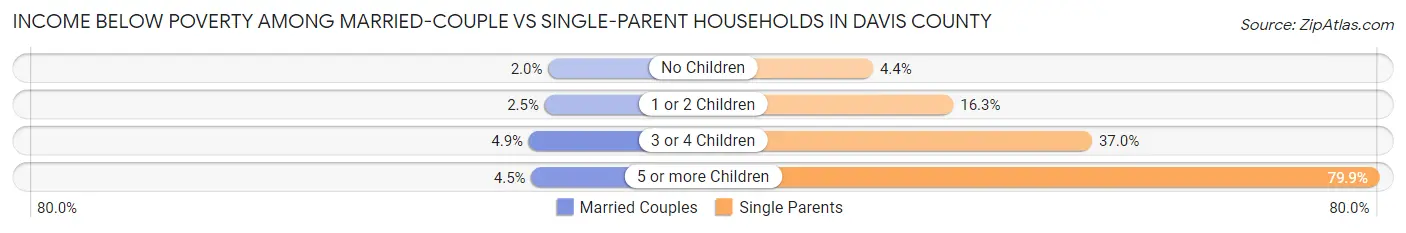
| Children | Married-Couple Families | Single-Parent Households |
| No Children | 669 (2.0%) | 249 (4.4%) |
| 1 or 2 Children | 602 (2.5%) | 1,179 (16.3%) |
| 3 or 4 Children | 643 (4.9%) | 649 (37.0%) |
| 5 or more Children | 107 (4.5%) | 270 (79.9%) |
| Total | 2,021 (2.7%) | 2,347 (15.6%) |
Employment Characteristics in Davis County
Employment by Class of Employer in Davis County
Among the 178,241 employed individuals in Davis County, private company employees (118,326 | 66.4%), federal government employees (13,183 | 7.4%), and local government employees (12,496 | 7.0%) make up the most common classes of employment.
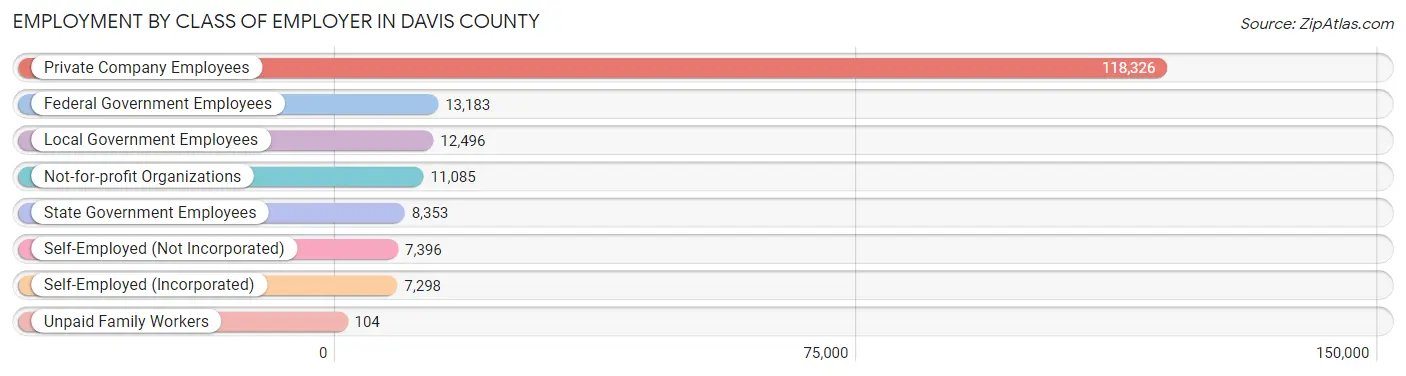
| Employer Class | # Employees | % Employees |
| Private Company Employees | 118,326 | 66.4% |
| Self-Employed (Incorporated) | 7,298 | 4.1% |
| Self-Employed (Not Incorporated) | 7,396 | 4.2% |
| Not-for-profit Organizations | 11,085 | 6.2% |
| Local Government Employees | 12,496 | 7.0% |
| State Government Employees | 8,353 | 4.7% |
| Federal Government Employees | 13,183 | 7.4% |
| Unpaid Family Workers | 104 | 0.1% |
| Total | 178,241 | 100.0% |
Employment Status by Age in Davis County
According to the labor force statistics for Davis County, out of the total population over 16 years of age (263,049), 70.6% or 185,713 individuals are in the labor force, with 2.5% or 4,643 of them unemployed. The age group with the highest labor force participation rate is 45 to 54 years, with 84.5% or 33,154 individuals in the labor force. Within the labor force, the 16 to 19 years age range has the highest percentage of unemployed individuals, with 6.1% or 836 of them being unemployed.
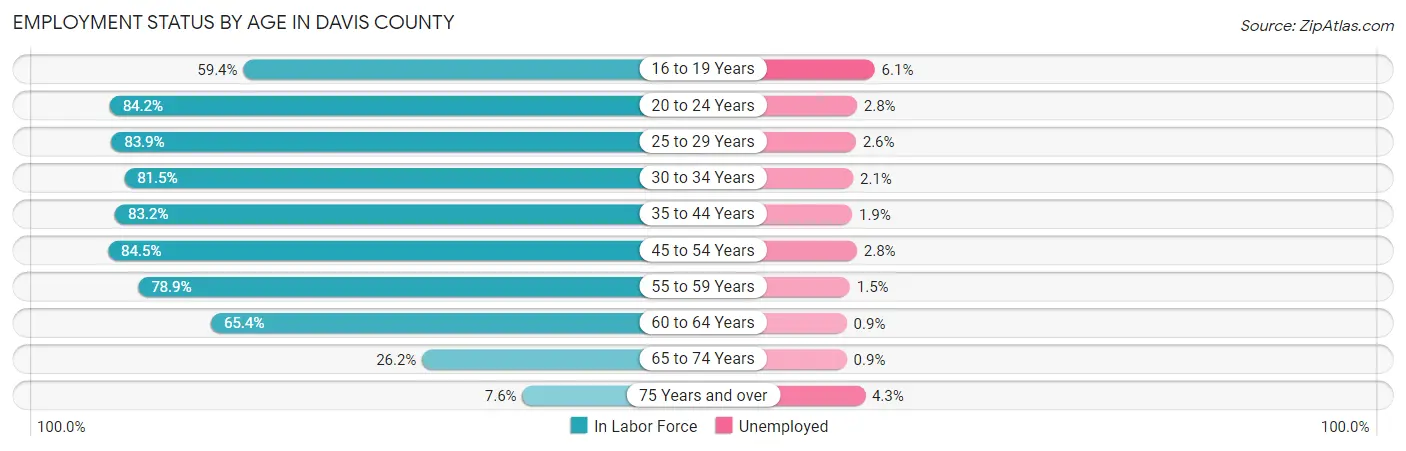
| Age Bracket | In Labor Force | Unemployed |
| 16 to 19 Years | 13,711 (59.4%) | 836 (6.1%) |
| 20 to 24 Years | 20,708 (84.2%) | 580 (2.8%) |
| 25 to 29 Years | 20,500 (83.9%) | 533 (2.6%) |
| 30 to 34 Years | 20,441 (81.5%) | 429 (2.1%) |
| 35 to 44 Years | 45,499 (83.2%) | 864 (1.9%) |
| 45 to 54 Years | 33,154 (84.5%) | 928 (2.8%) |
| 55 to 59 Years | 13,504 (78.9%) | 203 (1.5%) |
| 60 to 64 Years | 10,962 (65.4%) | 99 (0.9%) |
| 65 to 74 Years | 6,040 (26.2%) | 54 (0.9%) |
| 75 Years and over | 1,140 (7.6%) | 49 (4.3%) |
| Total | 185,713 (70.6%) | 4,643 (2.5%) |
Employment Status by Educational Attainment in Davis County
According to labor force statistics for Davis County, 81.3% of individuals (144,155) out of the total population between 25 and 64 years of age (177,313) are in the labor force, with 2.1% or 3,027 of them being unemployed. The group with the highest labor force participation rate are those with the educational attainment of bachelor's degree or higher, with 86.9% or 60,377 individuals in the labor force. Within the labor force, individuals with less than high school education have the highest percentage of unemployment, with 4.7% or 246 of them being unemployed.
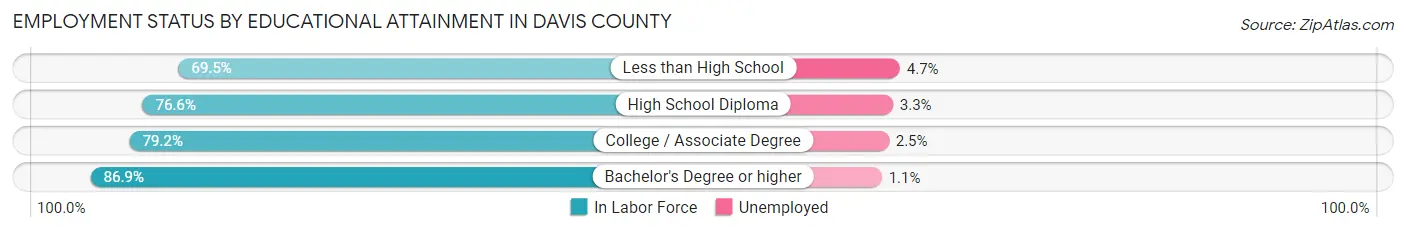
| Educational Attainment | In Labor Force | Unemployed |
| Less than High School | 5,235 (69.5%) | 354 (4.7%) |
| High School Diploma | 28,161 (76.6%) | 1,213 (3.3%) |
| College / Associate Degree | 50,322 (79.2%) | 1,588 (2.5%) |
| Bachelor's Degree or higher | 60,377 (86.9%) | 764 (1.1%) |
| Total | 144,155 (81.3%) | 3,724 (2.1%) |
Employment Occupations by Sex in Davis County
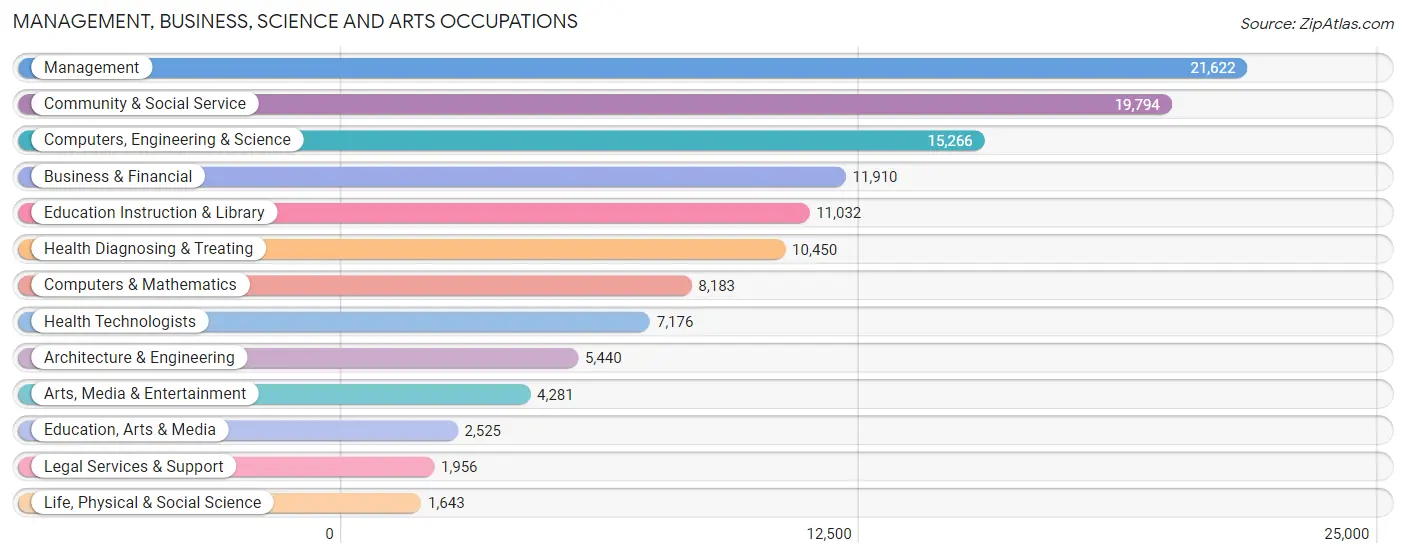
Management, Business, Science and Arts Occupations
The most common Management, Business, Science and Arts occupations in Davis County are Management (21,622 | 12.1%), Community & Social Service (19,794 | 11.1%), Computers, Engineering & Science (15,266 | 8.6%), Business & Financial (11,910 | 6.7%), and Education Instruction & Library (11,032 | 6.2%).
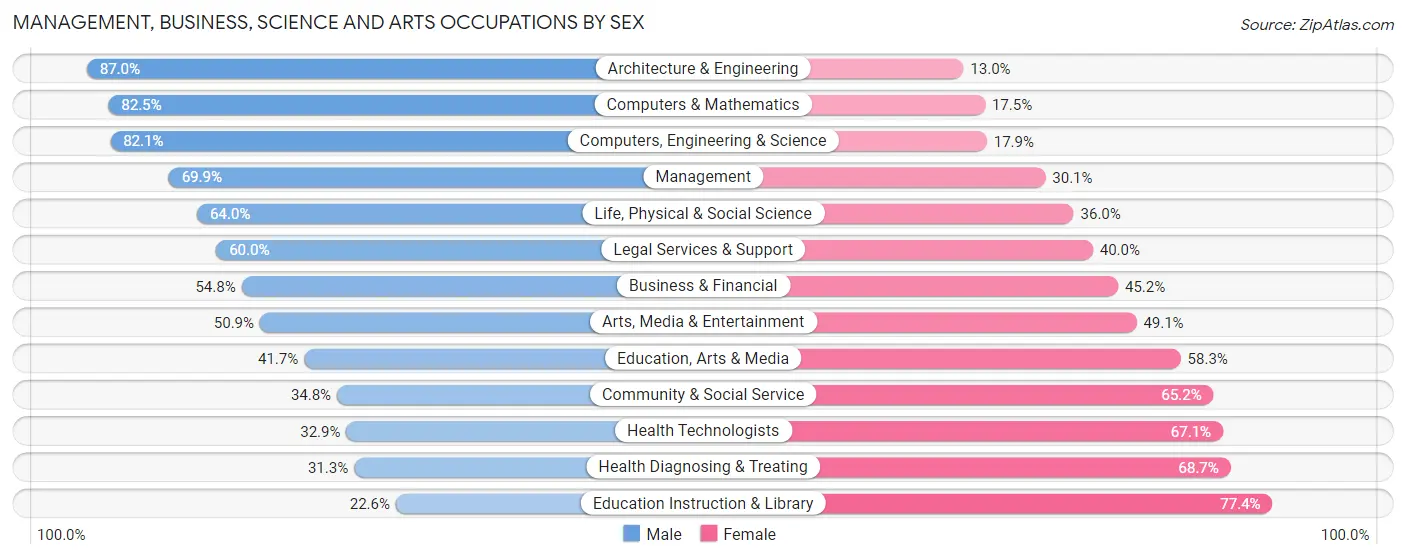
Management, Business, Science and Arts Occupations by Sex
Within the Management, Business, Science and Arts occupations in Davis County, the most male-oriented occupations are Architecture & Engineering (87.0%), Computers & Mathematics (82.5%), and Computers, Engineering & Science (82.1%), while the most female-oriented occupations are Education Instruction & Library (77.4%), Health Diagnosing & Treating (68.7%), and Health Technologists (67.1%).
| Occupation | Male | Female |
| Management | 15,118 (69.9%) | 6,504 (30.1%) |
| Business & Financial | 6,522 (54.8%) | 5,388 (45.2%) |
| Computers, Engineering & Science | 12,539 (82.1%) | 2,727 (17.9%) |
| Computers & Mathematics | 6,753 (82.5%) | 1,430 (17.5%) |
| Architecture & Engineering | 4,734 (87.0%) | 706 (13.0%) |
| Life, Physical & Social Science | 1,052 (64.0%) | 591 (36.0%) |
| Community & Social Service | 6,897 (34.8%) | 12,897 (65.2%) |
| Education, Arts & Media | 1,053 (41.7%) | 1,472 (58.3%) |
| Legal Services & Support | 1,174 (60.0%) | 782 (40.0%) |
| Education Instruction & Library | 2,490 (22.6%) | 8,542 (77.4%) |
| Arts, Media & Entertainment | 2,180 (50.9%) | 2,101 (49.1%) |
| Health Diagnosing & Treating | 3,270 (31.3%) | 7,180 (68.7%) |
| Health Technologists | 2,360 (32.9%) | 4,816 (67.1%) |
| Total (Category) | 44,346 (56.1%) | 34,696 (43.9%) |
| Total (Overall) | 99,683 (55.9%) | 78,705 (44.1%) |
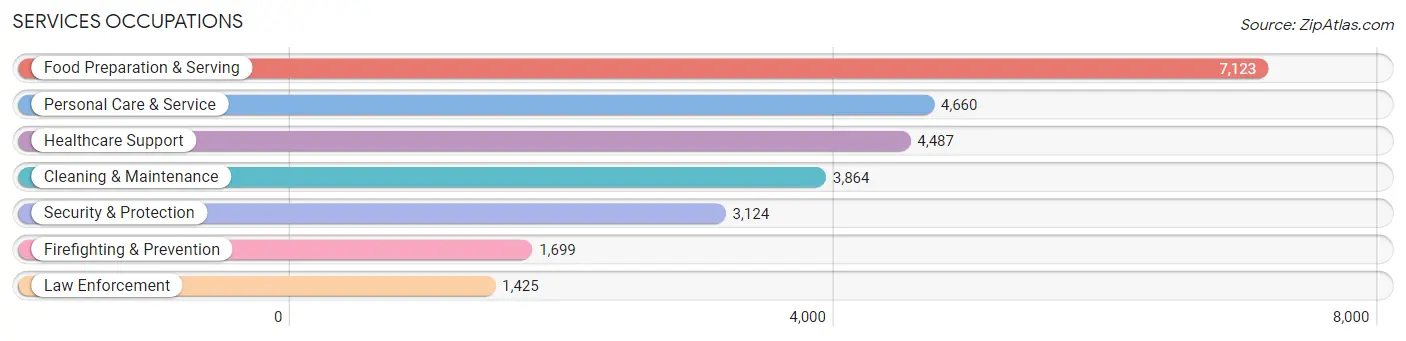
Services Occupations
The most common Services occupations in Davis County are Food Preparation & Serving (7,123 | 4.0%), Personal Care & Service (4,660 | 2.6%), Healthcare Support (4,487 | 2.5%), Cleaning & Maintenance (3,864 | 2.2%), and Security & Protection (3,124 | 1.8%).
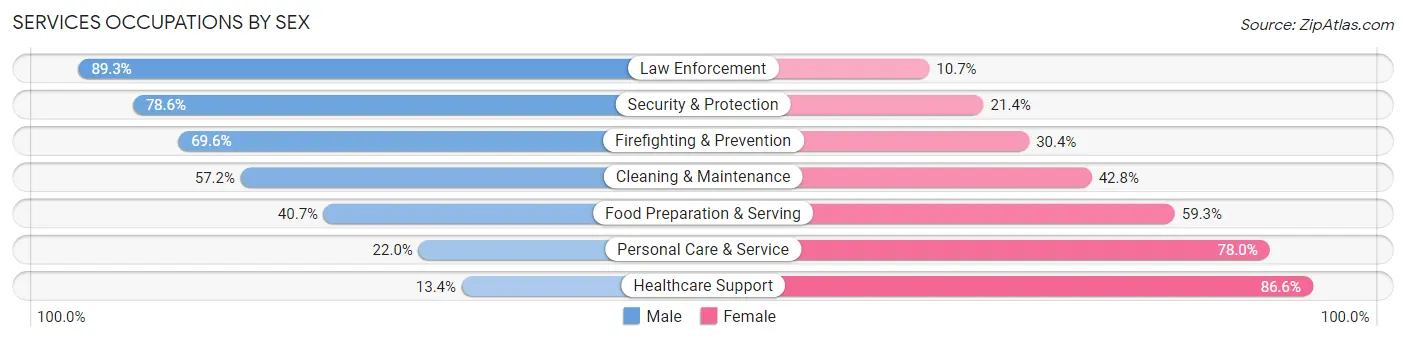
Services Occupations by Sex
Within the Services occupations in Davis County, the most male-oriented occupations are Law Enforcement (89.3%), Security & Protection (78.6%), and Firefighting & Prevention (69.6%), while the most female-oriented occupations are Healthcare Support (86.6%), Personal Care & Service (78.0%), and Food Preparation & Serving (59.3%).
| Occupation | Male | Female |
| Healthcare Support | 602 (13.4%) | 3,885 (86.6%) |
| Security & Protection | 2,455 (78.6%) | 669 (21.4%) |
| Firefighting & Prevention | 1,182 (69.6%) | 517 (30.4%) |
| Law Enforcement | 1,273 (89.3%) | 152 (10.7%) |
| Food Preparation & Serving | 2,901 (40.7%) | 4,222 (59.3%) |
| Cleaning & Maintenance | 2,210 (57.2%) | 1,654 (42.8%) |
| Personal Care & Service | 1,024 (22.0%) | 3,636 (78.0%) |
| Total (Category) | 9,192 (39.5%) | 14,066 (60.5%) |
| Total (Overall) | 99,683 (55.9%) | 78,705 (44.1%) |
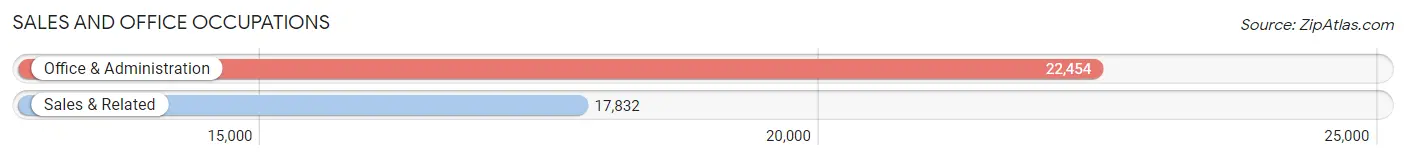
Sales and Office Occupations
The most common Sales and Office occupations in Davis County are Office & Administration (22,454 | 12.6%), and Sales & Related (17,832 | 10.0%).
Sales and Office Occupations by Sex
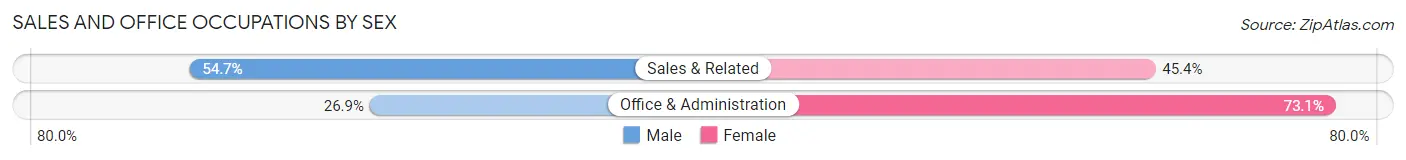
| Occupation | Male | Female |
| Sales & Related | 9,745 (54.6%) | 8,087 (45.4%) |
| Office & Administration | 6,039 (26.9%) | 16,415 (73.1%) |
| Total (Category) | 15,784 (39.2%) | 24,502 (60.8%) |
| Total (Overall) | 99,683 (55.9%) | 78,705 (44.1%) |
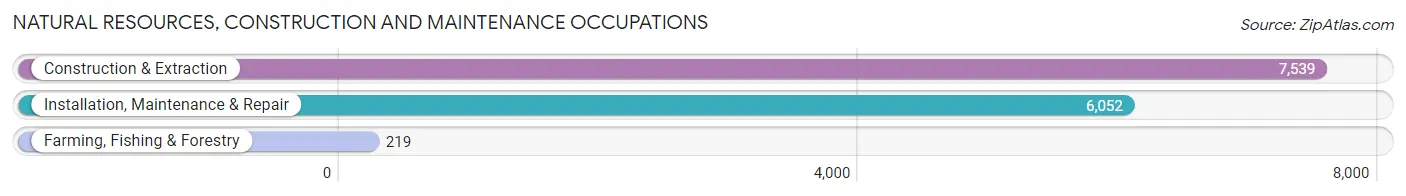
Natural Resources, Construction and Maintenance Occupations
The most common Natural Resources, Construction and Maintenance occupations in Davis County are Construction & Extraction (7,539 | 4.2%), Installation, Maintenance & Repair (6,052 | 3.4%), and Farming, Fishing & Forestry (219 | 0.1%).
Natural Resources, Construction and Maintenance Occupations by Sex
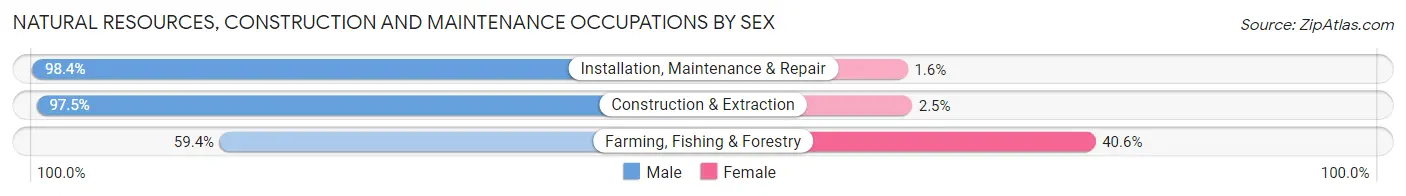
| Occupation | Male | Female |
| Farming, Fishing & Forestry | 130 (59.4%) | 89 (40.6%) |
| Construction & Extraction | 7,353 (97.5%) | 186 (2.5%) |
| Installation, Maintenance & Repair | 5,957 (98.4%) | 95 (1.6%) |
| Total (Category) | 13,440 (97.3%) | 370 (2.7%) |
| Total (Overall) | 99,683 (55.9%) | 78,705 (44.1%) |
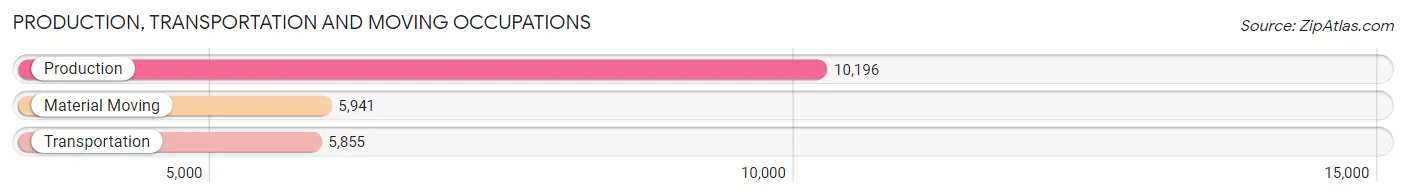
Production, Transportation and Moving Occupations
The most common Production, Transportation and Moving occupations in Davis County are Production (10,196 | 5.7%), Material Moving (5,941 | 3.3%), and Transportation (5,855 | 3.3%).
Production, Transportation and Moving Occupations by Sex
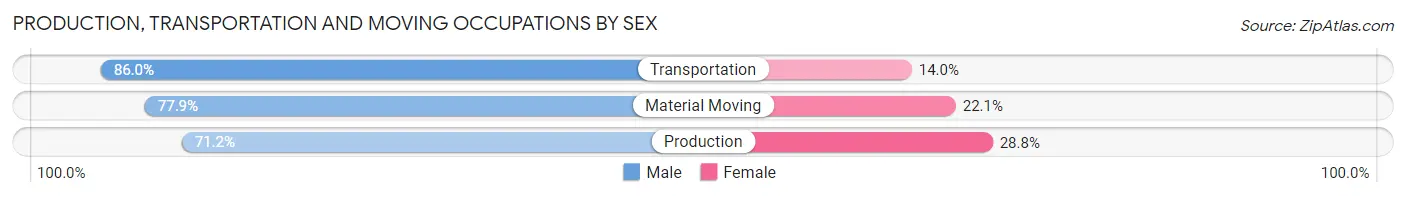
| Occupation | Male | Female |
| Production | 7,255 (71.2%) | 2,941 (28.8%) |
| Transportation | 5,036 (86.0%) | 819 (14.0%) |
| Material Moving | 4,630 (77.9%) | 1,311 (22.1%) |
| Total (Category) | 16,921 (76.9%) | 5,071 (23.1%) |
| Total (Overall) | 99,683 (55.9%) | 78,705 (44.1%) |
Employment Industries by Sex in Davis County
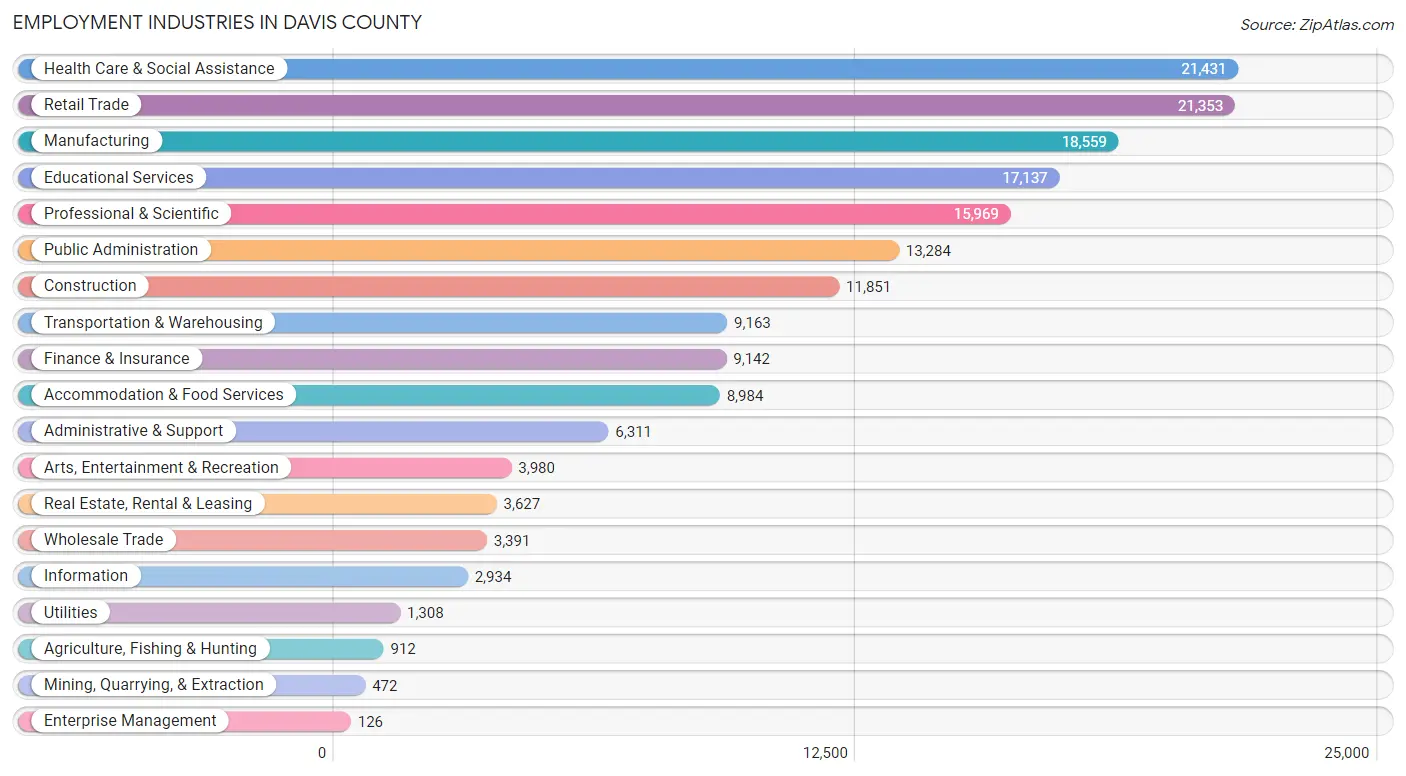
Employment Industries in Davis County
The major employment industries in Davis County include Health Care & Social Assistance (21,431 | 12.0%), Retail Trade (21,353 | 12.0%), Manufacturing (18,559 | 10.4%), Educational Services (17,137 | 9.6%), and Professional & Scientific (15,969 | 8.9%).
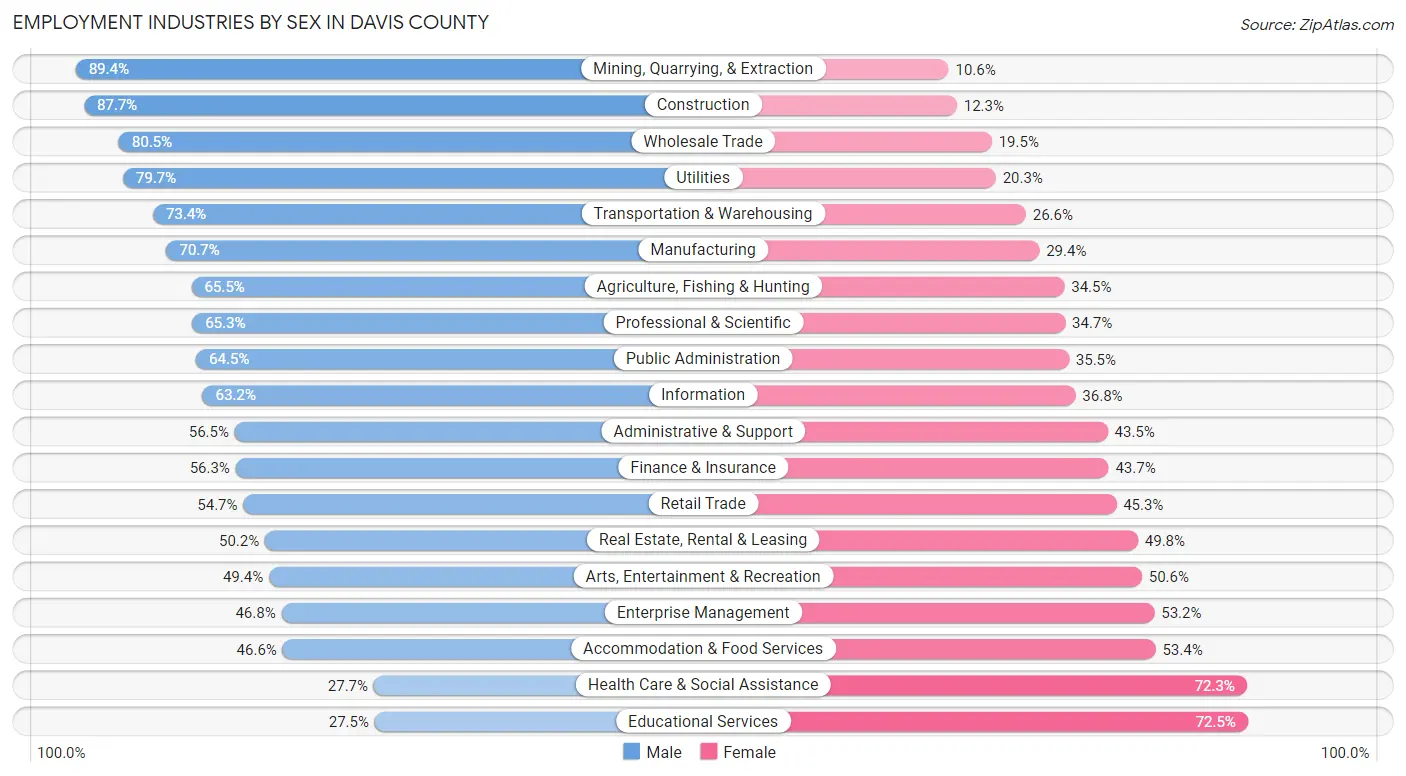
Employment Industries by Sex in Davis County
The Davis County industries that see more men than women are Mining, Quarrying, & Extraction (89.4%), Construction (87.7%), and Wholesale Trade (80.5%), whereas the industries that tend to have a higher number of women are Educational Services (72.5%), Health Care & Social Assistance (72.3%), and Accommodation & Food Services (53.4%).
| Industry | Male | Female |
| Agriculture, Fishing & Hunting | 597 (65.5%) | 315 (34.5%) |
| Mining, Quarrying, & Extraction | 422 (89.4%) | 50 (10.6%) |
| Construction | 10,395 (87.7%) | 1,456 (12.3%) |
| Manufacturing | 13,112 (70.7%) | 5,447 (29.3%) |
| Wholesale Trade | 2,729 (80.5%) | 662 (19.5%) |
| Retail Trade | 11,684 (54.7%) | 9,669 (45.3%) |
| Transportation & Warehousing | 6,728 (73.4%) | 2,435 (26.6%) |
| Utilities | 1,042 (79.7%) | 266 (20.3%) |
| Information | 1,853 (63.2%) | 1,081 (36.8%) |
| Finance & Insurance | 5,148 (56.3%) | 3,994 (43.7%) |
| Real Estate, Rental & Leasing | 1,822 (50.2%) | 1,805 (49.8%) |
| Professional & Scientific | 10,426 (65.3%) | 5,543 (34.7%) |
| Enterprise Management | 59 (46.8%) | 67 (53.2%) |
| Administrative & Support | 3,566 (56.5%) | 2,745 (43.5%) |
| Educational Services | 4,714 (27.5%) | 12,423 (72.5%) |
| Health Care & Social Assistance | 5,938 (27.7%) | 15,493 (72.3%) |
| Arts, Entertainment & Recreation | 1,967 (49.4%) | 2,013 (50.6%) |
| Accommodation & Food Services | 4,185 (46.6%) | 4,799 (53.4%) |
| Public Administration | 8,569 (64.5%) | 4,715 (35.5%) |
| Total | 99,683 (55.9%) | 78,705 (44.1%) |
Education in Davis County
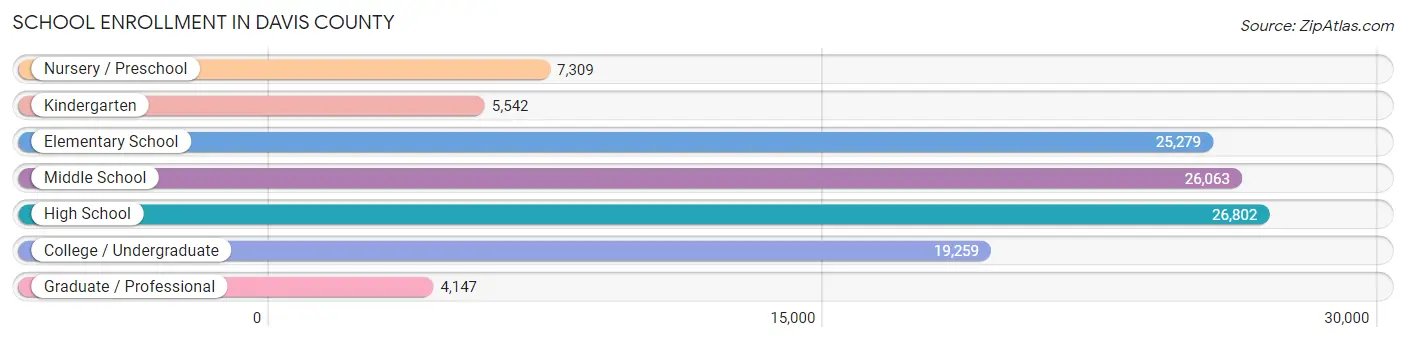
School Enrollment in Davis County
The most common levels of schooling among the 114,401 students in Davis County are high school (26,802 | 23.4%), middle school (26,063 | 22.8%), and elementary school (25,279 | 22.1%).
| School Level | # Students | % Students |
| Nursery / Preschool | 7,309 | 6.4% |
| Kindergarten | 5,542 | 4.8% |
| Elementary School | 25,279 | 22.1% |
| Middle School | 26,063 | 22.8% |
| High School | 26,802 | 23.4% |
| College / Undergraduate | 19,259 | 16.8% |
| Graduate / Professional | 4,147 | 3.6% |
| Total | 114,401 | 100.0% |
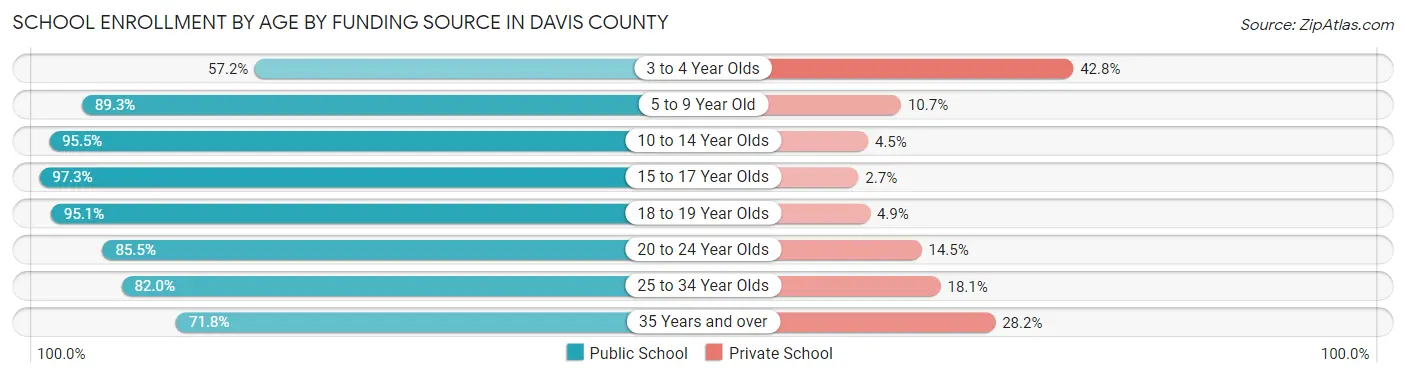
School Enrollment by Age by Funding Source in Davis County
Out of a total of 114,401 students who are enrolled in schools in Davis County, 11,783 (10.3%) attend a private institution, while the remaining 102,618 (89.7%) are enrolled in public schools. The age group of 3 to 4 year olds has the highest likelihood of being enrolled in private schools, with 2,142 (42.8% in the age bracket) enrolled. Conversely, the age group of 15 to 17 year olds has the lowest likelihood of being enrolled in a private school, with 18,836 (97.3% in the age bracket) attending a public institution.
| Age Bracket | Public School | Private School |
| 3 to 4 Year Olds | 2,867 (57.2%) | 2,142 (42.8%) |
| 5 to 9 Year Old | 26,264 (89.3%) | 3,141 (10.7%) |
| 10 to 14 Year Olds | 31,337 (95.5%) | 1,492 (4.5%) |
| 15 to 17 Year Olds | 18,836 (97.3%) | 531 (2.7%) |
| 18 to 19 Year Olds | 6,135 (95.1%) | 316 (4.9%) |
| 20 to 24 Year Olds | 7,130 (85.5%) | 1,210 (14.5%) |
| 25 to 34 Year Olds | 5,718 (82.0%) | 1,259 (18.0%) |
| 35 Years and over | 4,323 (71.8%) | 1,700 (28.2%) |
| Total | 102,618 (89.7%) | 11,783 (10.3%) |
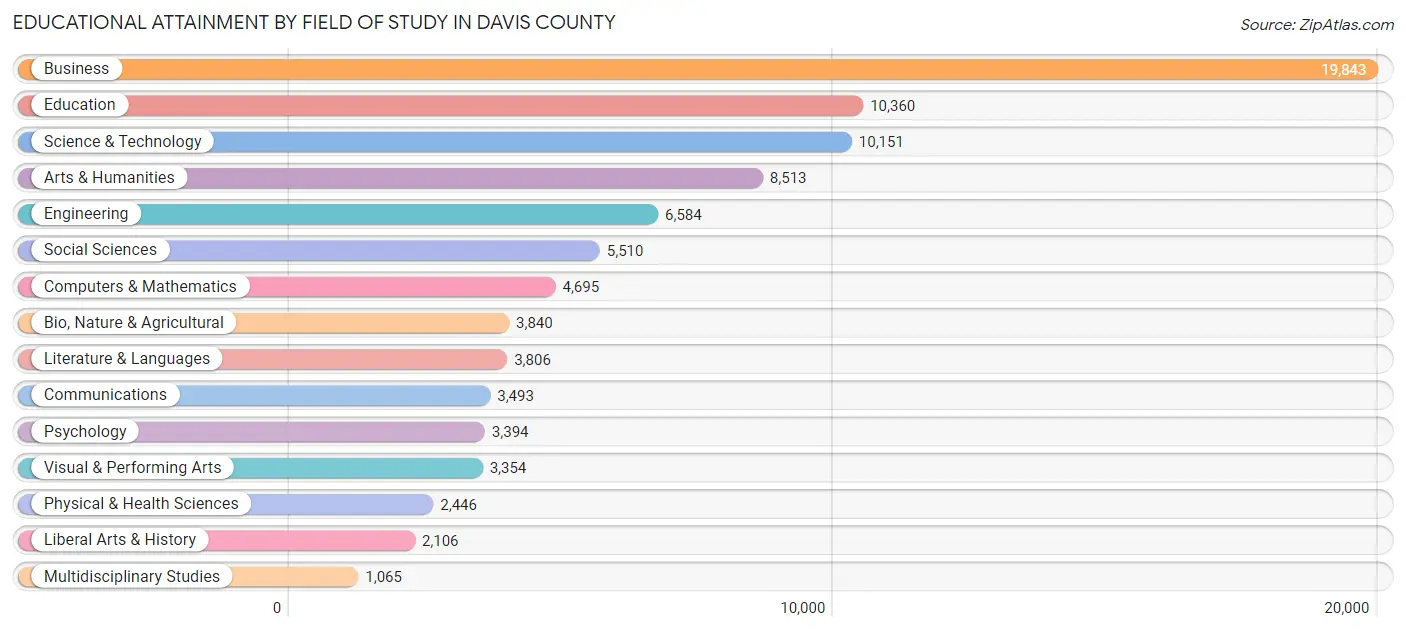
Educational Attainment by Field of Study in Davis County
Business (19,843 | 22.3%), education (10,360 | 11.6%), science & technology (10,151 | 11.4%), arts & humanities (8,513 | 9.6%), and engineering (6,584 | 7.4%) are the most common fields of study among 89,160 individuals in Davis County who have obtained a bachelor's degree or higher.
| Field of Study | # Graduates | % Graduates |
| Computers & Mathematics | 4,695 | 5.3% |
| Bio, Nature & Agricultural | 3,840 | 4.3% |
| Physical & Health Sciences | 2,446 | 2.7% |
| Psychology | 3,394 | 3.8% |
| Social Sciences | 5,510 | 6.2% |
| Engineering | 6,584 | 7.4% |
| Multidisciplinary Studies | 1,065 | 1.2% |
| Science & Technology | 10,151 | 11.4% |
| Business | 19,843 | 22.3% |
| Education | 10,360 | 11.6% |
| Literature & Languages | 3,806 | 4.3% |
| Liberal Arts & History | 2,106 | 2.4% |
| Visual & Performing Arts | 3,354 | 3.8% |
| Communications | 3,493 | 3.9% |
| Arts & Humanities | 8,513 | 9.6% |
| Total | 89,160 | 100.0% |
Transportation & Commute in Davis County
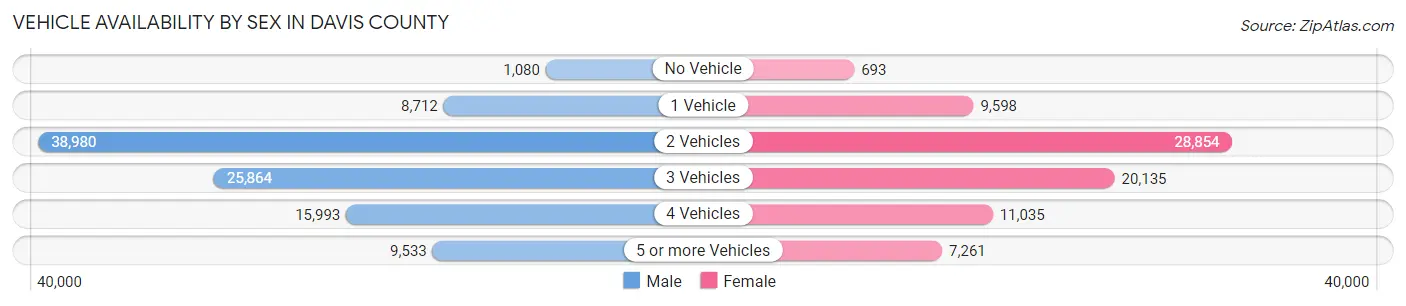
Vehicle Availability by Sex in Davis County
The most prevalent vehicle ownership categories in Davis County are males with 2 vehicles (38,980, accounting for 38.9%) and females with 2 vehicles (28,854, making up 50.2%).
| Vehicles Available | Male | Female |
| No Vehicle | 1,080 (1.1%) | 693 (0.9%) |
| 1 Vehicle | 8,712 (8.7%) | 9,598 (12.4%) |
| 2 Vehicles | 38,980 (38.9%) | 28,854 (37.2%) |
| 3 Vehicles | 25,864 (25.8%) | 20,135 (26.0%) |
| 4 Vehicles | 15,993 (16.0%) | 11,035 (14.2%) |
| 5 or more Vehicles | 9,533 (9.5%) | 7,261 (9.4%) |
| Total | 100,162 (100.0%) | 77,576 (100.0%) |
Commute Time in Davis County
The most frequently occuring commute durations in Davis County are 15 to 19 minutes (26,635 commuters, 17.4%), 20 to 24 minutes (24,847 commuters, 16.3%), and 10 to 14 minutes (22,887 commuters, 15.0%).
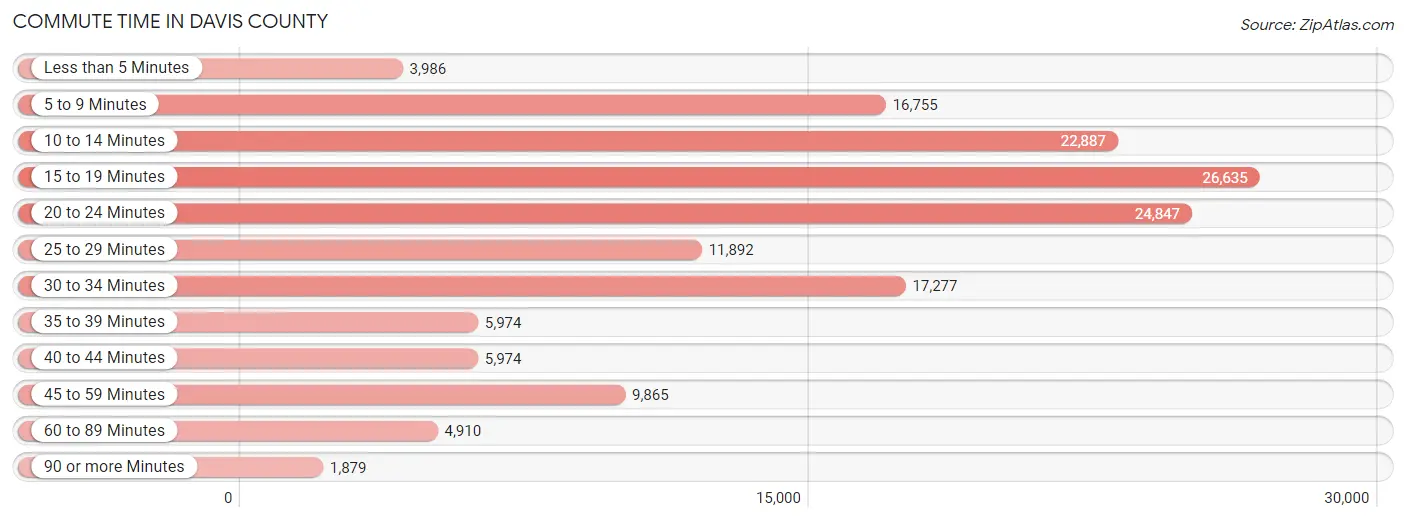
| Commute Time | # Commuters | % Commuters |
| Less than 5 Minutes | 3,986 | 2.6% |
| 5 to 9 Minutes | 16,755 | 11.0% |
| 10 to 14 Minutes | 22,887 | 15.0% |
| 15 to 19 Minutes | 26,635 | 17.4% |
| 20 to 24 Minutes | 24,847 | 16.3% |
| 25 to 29 Minutes | 11,892 | 7.8% |
| 30 to 34 Minutes | 17,277 | 11.3% |
| 35 to 39 Minutes | 5,974 | 3.9% |
| 40 to 44 Minutes | 5,974 | 3.9% |
| 45 to 59 Minutes | 9,865 | 6.5% |
| 60 to 89 Minutes | 4,910 | 3.2% |
| 90 or more Minutes | 1,879 | 1.2% |
Commute Time by Sex in Davis County
The most common commute times in Davis County are 15 to 19 minutes (14,548 commuters, 16.7%) for males and 15 to 19 minutes (12,087 commuters, 18.4%) for females.
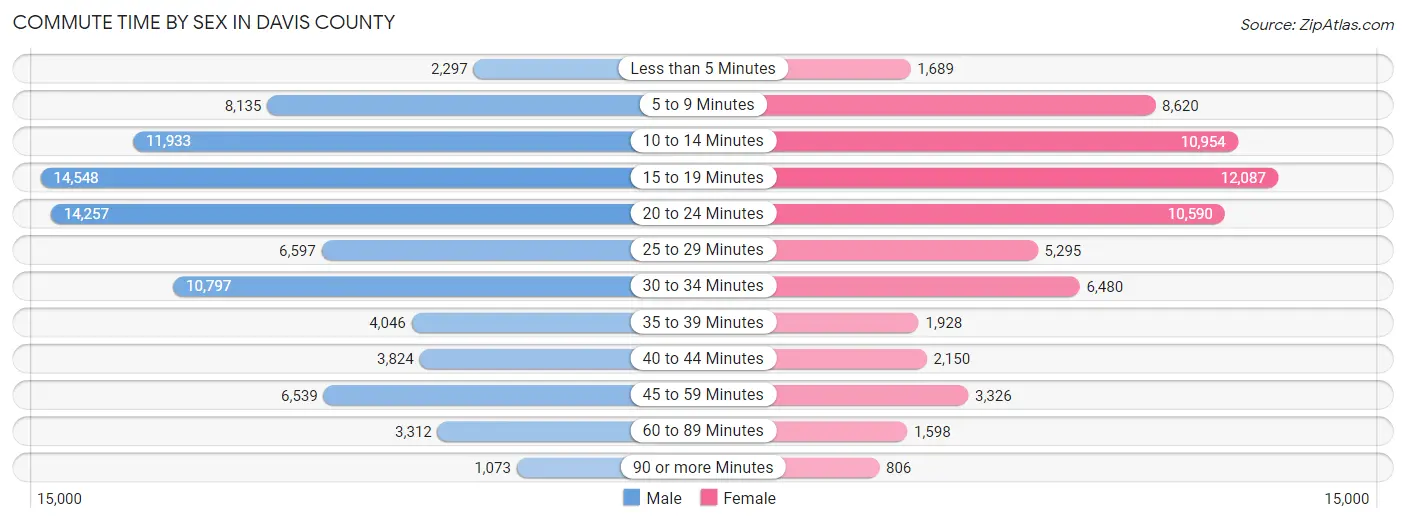
| Commute Time | Male | Female |
| Less than 5 Minutes | 2,297 (2.6%) | 1,689 (2.6%) |
| 5 to 9 Minutes | 8,135 (9.3%) | 8,620 (13.2%) |
| 10 to 14 Minutes | 11,933 (13.7%) | 10,954 (16.7%) |
| 15 to 19 Minutes | 14,548 (16.7%) | 12,087 (18.4%) |
| 20 to 24 Minutes | 14,257 (16.3%) | 10,590 (16.2%) |
| 25 to 29 Minutes | 6,597 (7.5%) | 5,295 (8.1%) |
| 30 to 34 Minutes | 10,797 (12.4%) | 6,480 (9.9%) |
| 35 to 39 Minutes | 4,046 (4.6%) | 1,928 (2.9%) |
| 40 to 44 Minutes | 3,824 (4.4%) | 2,150 (3.3%) |
| 45 to 59 Minutes | 6,539 (7.5%) | 3,326 (5.1%) |
| 60 to 89 Minutes | 3,312 (3.8%) | 1,598 (2.4%) |
| 90 or more Minutes | 1,073 (1.2%) | 806 (1.2%) |
Time of Departure to Work by Sex in Davis County
The most frequent times of departure to work in Davis County are 7:00 AM to 7:29 AM (12,094, 13.8%) for males and 8:00 AM to 8:29 AM (8,433, 12.9%) for females.
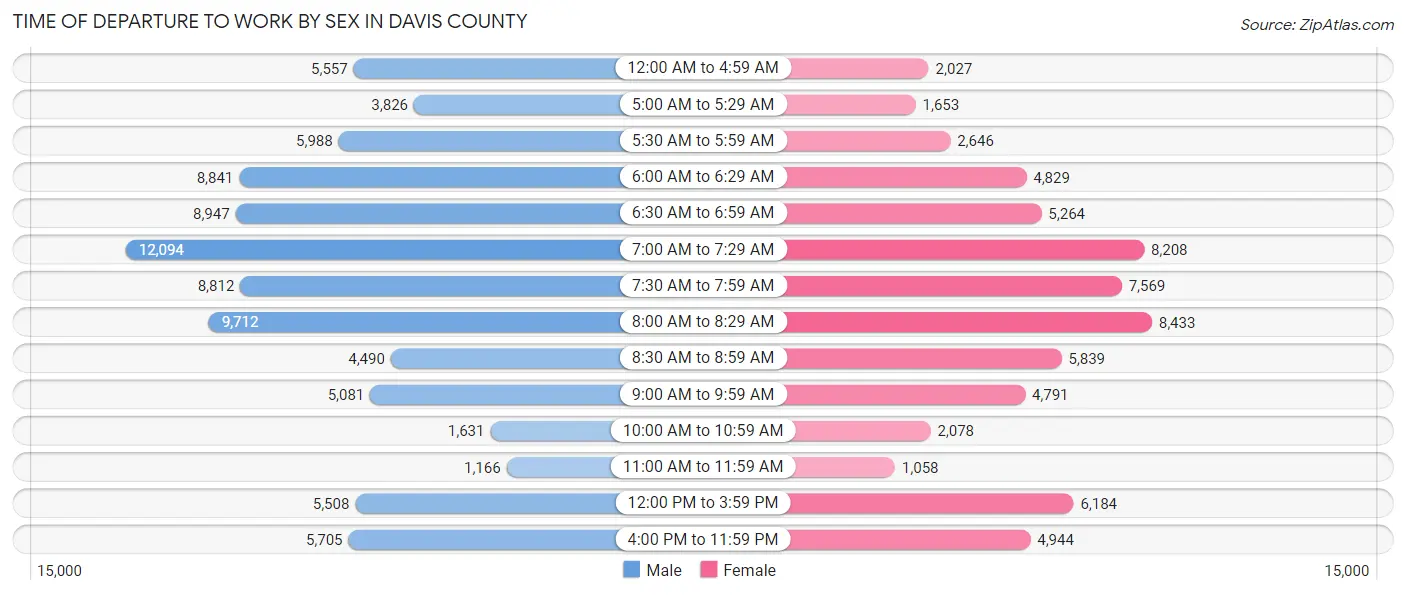
| Time of Departure | Male | Female |
| 12:00 AM to 4:59 AM | 5,557 (6.4%) | 2,027 (3.1%) |
| 5:00 AM to 5:29 AM | 3,826 (4.4%) | 1,653 (2.5%) |
| 5:30 AM to 5:59 AM | 5,988 (6.9%) | 2,646 (4.0%) |
| 6:00 AM to 6:29 AM | 8,841 (10.1%) | 4,829 (7.4%) |
| 6:30 AM to 6:59 AM | 8,947 (10.2%) | 5,264 (8.0%) |
| 7:00 AM to 7:29 AM | 12,094 (13.8%) | 8,208 (12.5%) |
| 7:30 AM to 7:59 AM | 8,812 (10.1%) | 7,569 (11.6%) |
| 8:00 AM to 8:29 AM | 9,712 (11.1%) | 8,433 (12.9%) |
| 8:30 AM to 8:59 AM | 4,490 (5.1%) | 5,839 (8.9%) |
| 9:00 AM to 9:59 AM | 5,081 (5.8%) | 4,791 (7.3%) |
| 10:00 AM to 10:59 AM | 1,631 (1.9%) | 2,078 (3.2%) |
| 11:00 AM to 11:59 AM | 1,166 (1.3%) | 1,058 (1.6%) |
| 12:00 PM to 3:59 PM | 5,508 (6.3%) | 6,184 (9.4%) |
| 4:00 PM to 11:59 PM | 5,705 (6.5%) | 4,944 (7.5%) |
| Total | 87,358 (100.0%) | 65,523 (100.0%) |
Housing Occupancy in Davis County
Occupancy by Ownership in Davis County
Of the total 112,155 dwellings in Davis County, owner-occupied units account for 87,150 (77.7%), while renter-occupied units make up 25,005 (22.3%).
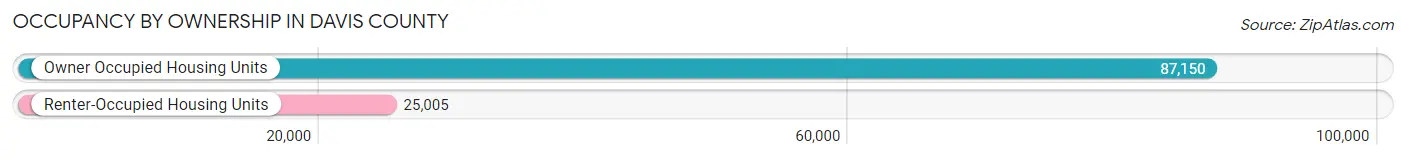
| Occupancy | # Housing Units | % Housing Units |
| Owner Occupied Housing Units | 87,150 | 77.7% |
| Renter-Occupied Housing Units | 25,005 | 22.3% |
| Total Occupied Housing Units | 112,155 | 100.0% |
Occupancy by Household Size in Davis County
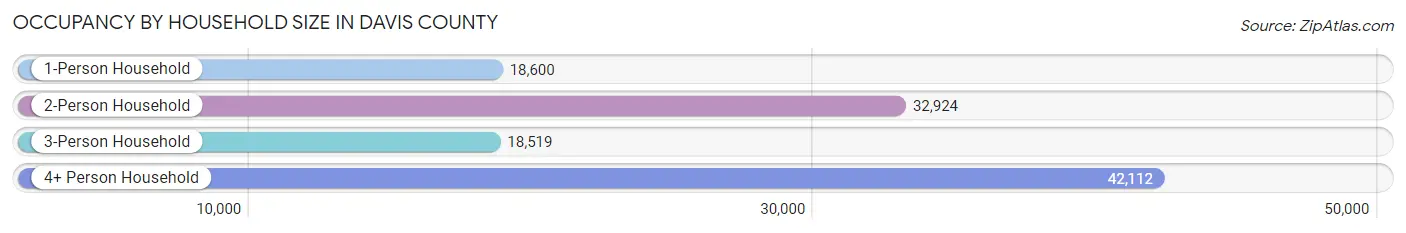
| Household Size | # Housing Units | % Housing Units |
| 1-Person Household | 18,600 | 16.6% |
| 2-Person Household | 32,924 | 29.4% |
| 3-Person Household | 18,519 | 16.5% |
| 4+ Person Household | 42,112 | 37.6% |
| Total Housing Units | 112,155 | 100.0% |
Occupancy by Ownership by Household Size in Davis County
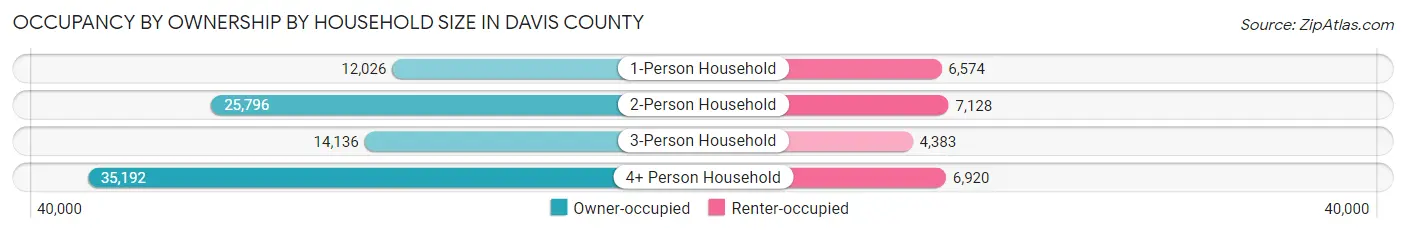
| Household Size | Owner-occupied | Renter-occupied |
| 1-Person Household | 12,026 (64.7%) | 6,574 (35.3%) |
| 2-Person Household | 25,796 (78.3%) | 7,128 (21.6%) |
| 3-Person Household | 14,136 (76.3%) | 4,383 (23.7%) |
| 4+ Person Household | 35,192 (83.6%) | 6,920 (16.4%) |
| Total Housing Units | 87,150 (77.7%) | 25,005 (22.3%) |
Occupancy by Educational Attainment in Davis County
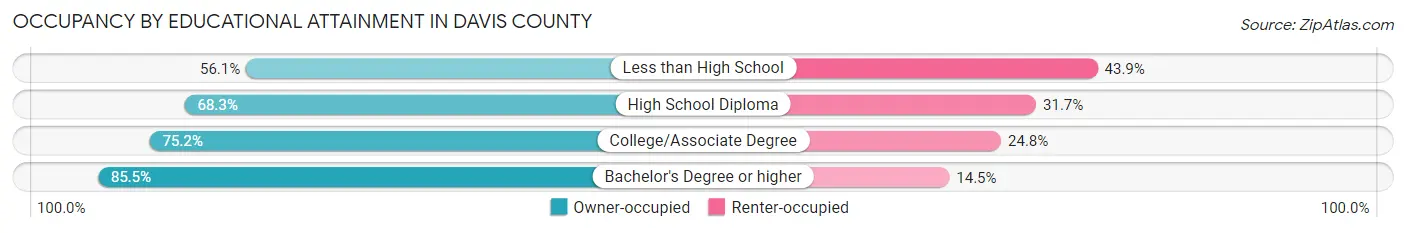
| Household Size | Owner-occupied | Renter-occupied |
| Less than High School | 2,429 (56.1%) | 1,901 (43.9%) |
| High School Diploma | 12,939 (68.3%) | 6,009 (31.7%) |
| College/Associate Degree | 30,803 (75.2%) | 10,142 (24.8%) |
| Bachelor's Degree or higher | 40,979 (85.5%) | 6,953 (14.5%) |
Occupancy by Age of Householder in Davis County
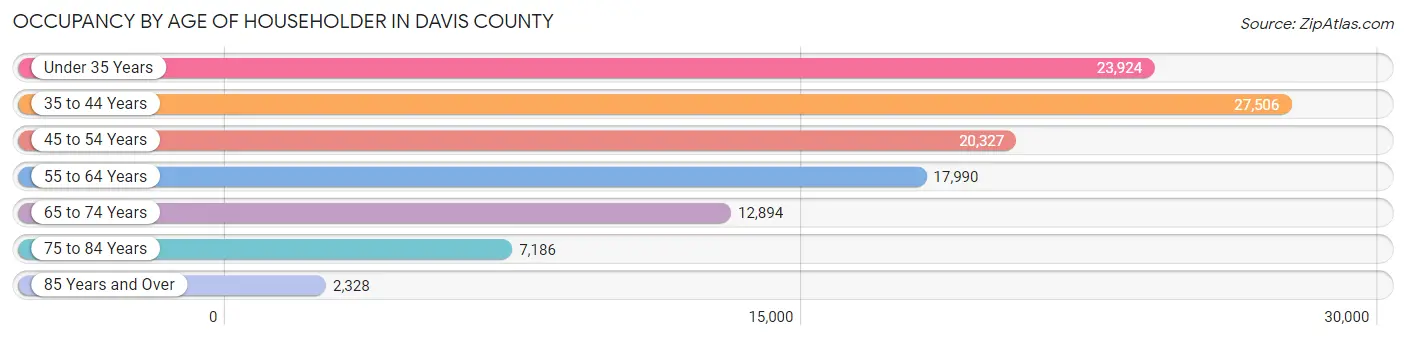
| Age Bracket | # Households | % Households |
| Under 35 Years | 23,924 | 21.3% |
| 35 to 44 Years | 27,506 | 24.5% |
| 45 to 54 Years | 20,327 | 18.1% |
| 55 to 64 Years | 17,990 | 16.0% |
| 65 to 74 Years | 12,894 | 11.5% |
| 75 to 84 Years | 7,186 | 6.4% |
| 85 Years and Over | 2,328 | 2.1% |
| Total | 112,155 | 100.0% |
Housing Finances in Davis County
Median Income by Occupancy in Davis County
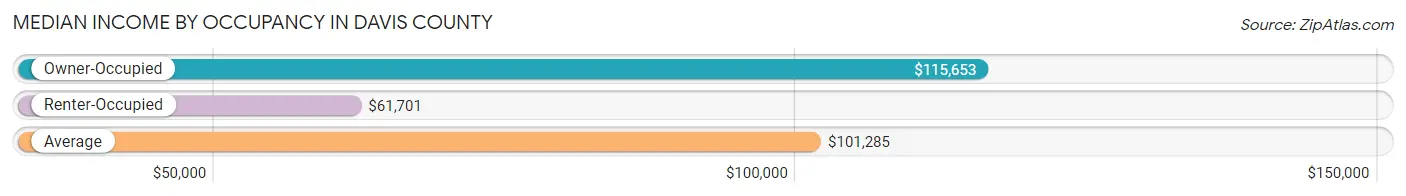
| Occupancy Type | # Households | Median Income |
| Owner-Occupied | 87,150 (77.7%) | $115,653 |
| Renter-Occupied | 25,005 (22.3%) | $61,701 |
| Average | 112,155 (100.0%) | $101,285 |
Occupancy by Householder Income Bracket in Davis County
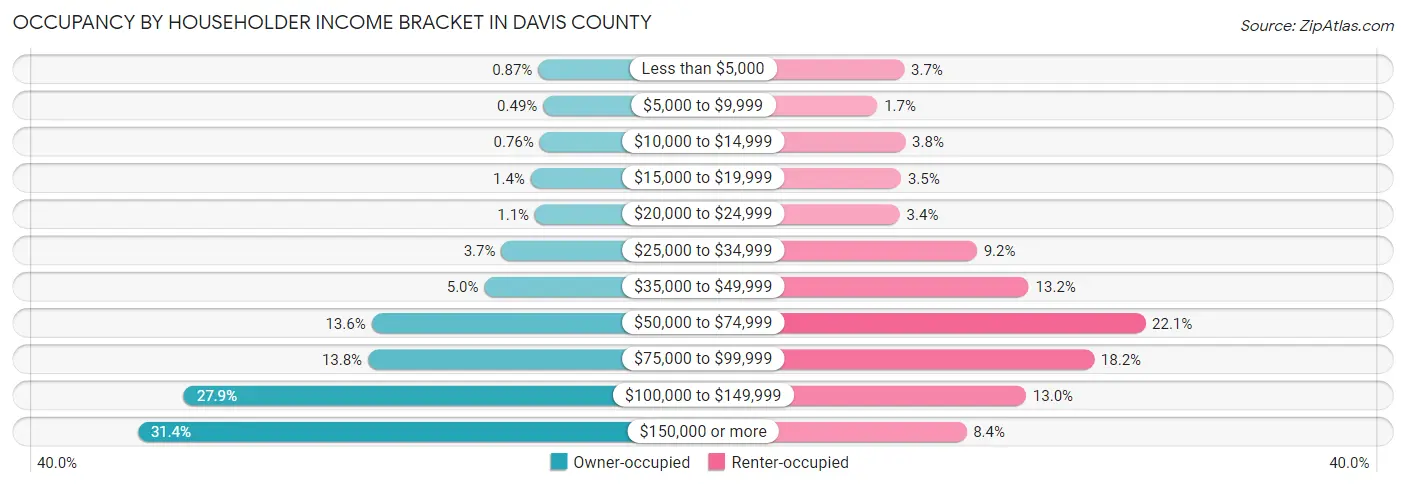
| Income Bracket | Owner-occupied | Renter-occupied |
| Less than $5,000 | 759 (0.9%) | 924 (3.7%) |
| $5,000 to $9,999 | 431 (0.5%) | 413 (1.7%) |
| $10,000 to $14,999 | 664 (0.8%) | 946 (3.8%) |
| $15,000 to $19,999 | 1,258 (1.4%) | 866 (3.5%) |
| $20,000 to $24,999 | 980 (1.1%) | 841 (3.4%) |
| $25,000 to $34,999 | 3,205 (3.7%) | 2,307 (9.2%) |
| $35,000 to $49,999 | 4,334 (5.0%) | 3,299 (13.2%) |
| $50,000 to $74,999 | 11,824 (13.6%) | 5,517 (22.1%) |
| $75,000 to $99,999 | 12,060 (13.8%) | 4,540 (18.2%) |
| $100,000 to $149,999 | 24,290 (27.9%) | 3,245 (13.0%) |
| $150,000 or more | 27,345 (31.4%) | 2,107 (8.4%) |
| Total | 87,150 (100.0%) | 25,005 (100.0%) |
Monthly Housing Cost Tiers in Davis County
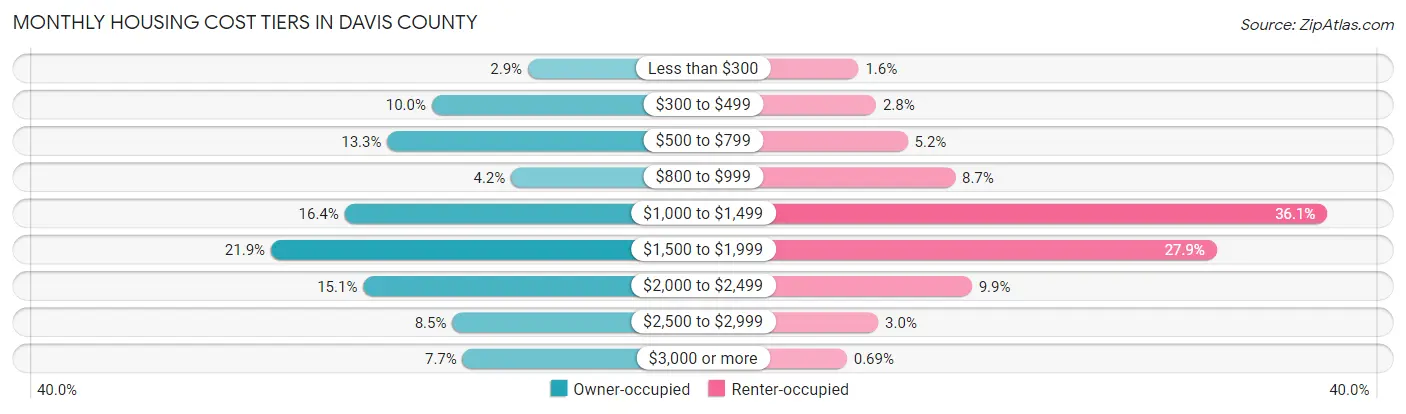
| Monthly Cost | Owner-occupied | Renter-occupied |
| Less than $300 | 2,554 (2.9%) | 387 (1.5%) |
| $300 to $499 | 8,727 (10.0%) | 710 (2.8%) |
| $500 to $799 | 11,579 (13.3%) | 1,293 (5.2%) |
| $800 to $999 | 3,633 (4.2%) | 2,165 (8.7%) |
| $1,000 to $1,499 | 14,318 (16.4%) | 9,020 (36.1%) |
| $1,500 to $1,999 | 19,055 (21.9%) | 6,983 (27.9%) |
| $2,000 to $2,499 | 13,128 (15.1%) | 2,472 (9.9%) |
| $2,500 to $2,999 | 7,407 (8.5%) | 751 (3.0%) |
| $3,000 or more | 6,749 (7.7%) | 173 (0.7%) |
| Total | 87,150 (100.0%) | 25,005 (100.0%) |
Physical Housing Characteristics in Davis County
Housing Structures in Davis County
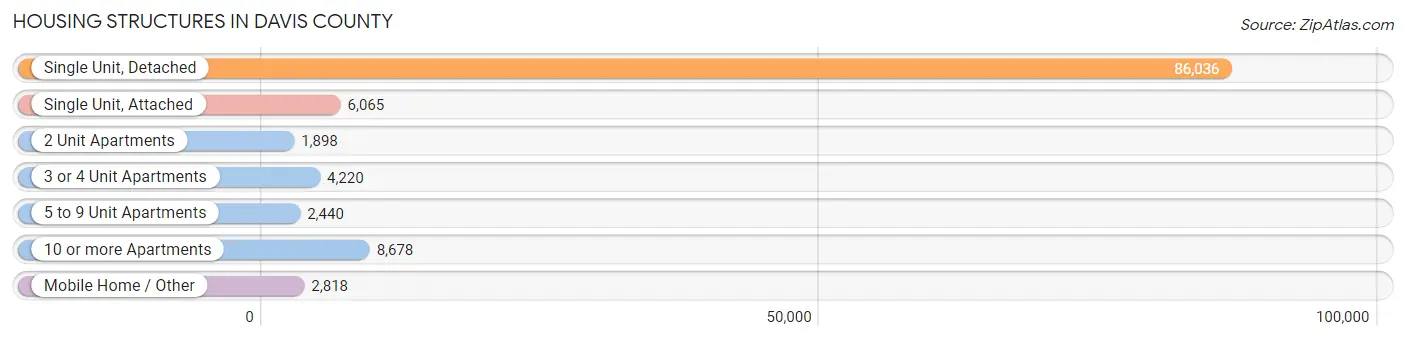
| Structure Type | # Housing Units | % Housing Units |
| Single Unit, Detached | 86,036 | 76.7% |
| Single Unit, Attached | 6,065 | 5.4% |
| 2 Unit Apartments | 1,898 | 1.7% |
| 3 or 4 Unit Apartments | 4,220 | 3.8% |
| 5 to 9 Unit Apartments | 2,440 | 2.2% |
| 10 or more Apartments | 8,678 | 7.7% |
| Mobile Home / Other | 2,818 | 2.5% |
| Total | 112,155 | 100.0% |
Housing Structures by Occupancy in Davis County
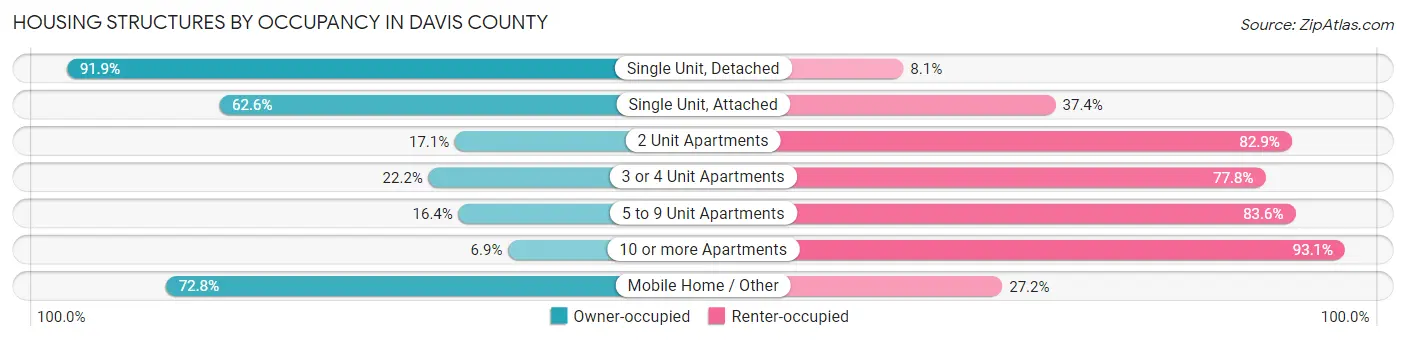
| Structure Type | Owner-occupied | Renter-occupied |
| Single Unit, Detached | 79,044 (91.9%) | 6,992 (8.1%) |
| Single Unit, Attached | 3,794 (62.6%) | 2,271 (37.4%) |
| 2 Unit Apartments | 325 (17.1%) | 1,573 (82.9%) |
| 3 or 4 Unit Apartments | 937 (22.2%) | 3,283 (77.8%) |
| 5 to 9 Unit Apartments | 401 (16.4%) | 2,039 (83.6%) |
| 10 or more Apartments | 597 (6.9%) | 8,081 (93.1%) |
| Mobile Home / Other | 2,052 (72.8%) | 766 (27.2%) |
| Total | 87,150 (77.7%) | 25,005 (22.3%) |
Housing Structures by Number of Rooms in Davis County
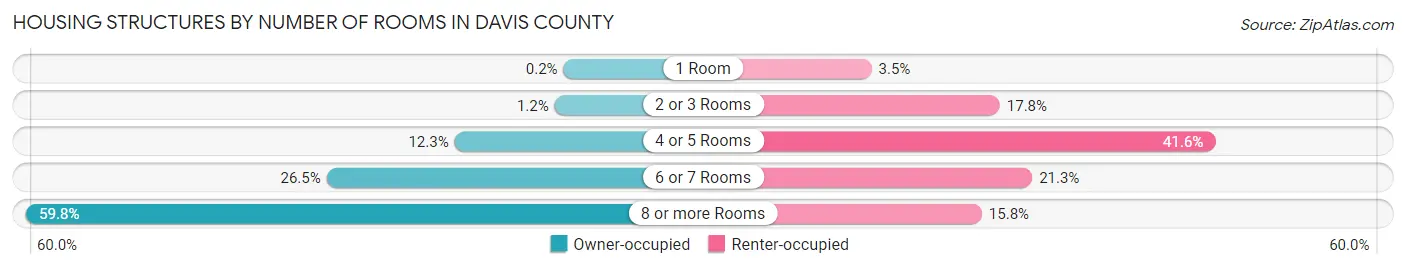
| Number of Rooms | Owner-occupied | Renter-occupied |
| 1 Room | 172 (0.2%) | 879 (3.5%) |
| 2 or 3 Rooms | 1,035 (1.2%) | 4,438 (17.7%) |
| 4 or 5 Rooms | 10,709 (12.3%) | 10,412 (41.6%) |
| 6 or 7 Rooms | 23,088 (26.5%) | 5,335 (21.3%) |
| 8 or more Rooms | 52,146 (59.8%) | 3,941 (15.8%) |
| Total | 87,150 (100.0%) | 25,005 (100.0%) |
Housing Structure by Heating Type in Davis County
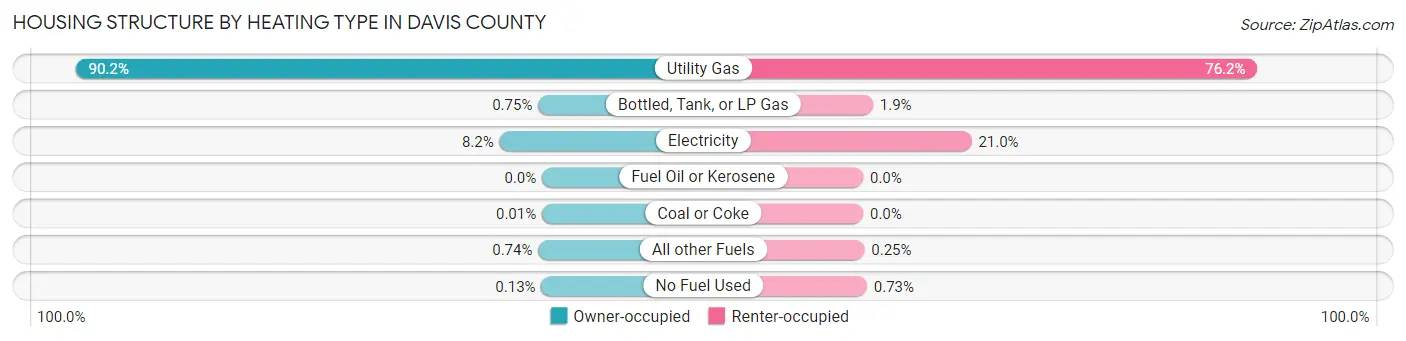
| Heating Type | Owner-occupied | Renter-occupied |
| Utility Gas | 78,567 (90.1%) | 19,047 (76.2%) |
| Bottled, Tank, or LP Gas | 650 (0.7%) | 474 (1.9%) |
| Electricity | 7,164 (8.2%) | 5,239 (20.9%) |
| Fuel Oil or Kerosene | 0 (0.0%) | 0 (0.0%) |
| Coal or Coke | 9 (0.0%) | 0 (0.0%) |
| All other Fuels | 647 (0.7%) | 63 (0.3%) |
| No Fuel Used | 113 (0.1%) | 182 (0.7%) |
| Total | 87,150 (100.0%) | 25,005 (100.0%) |
Household Vehicle Usage in Davis County
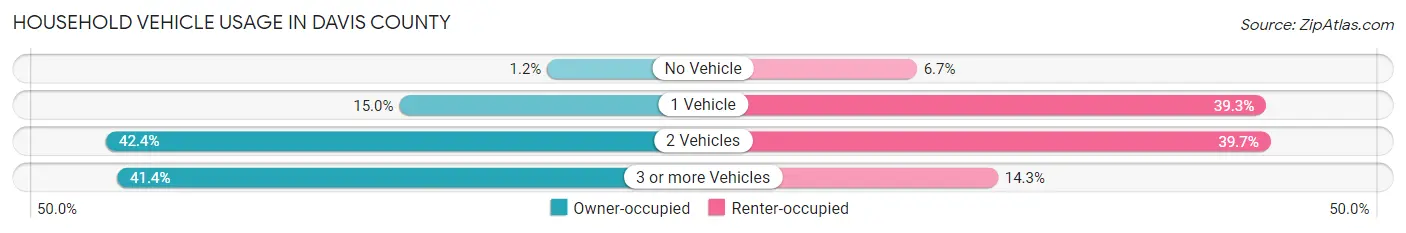
| Vehicles per Household | Owner-occupied | Renter-occupied |
| No Vehicle | 1,066 (1.2%) | 1,675 (6.7%) |
| 1 Vehicle | 13,091 (15.0%) | 9,829 (39.3%) |
| 2 Vehicles | 36,945 (42.4%) | 9,934 (39.7%) |
| 3 or more Vehicles | 36,048 (41.4%) | 3,567 (14.3%) |
| Total | 87,150 (100.0%) | 25,005 (100.0%) |
Real Estate & Mortgages in Davis County
Real Estate and Mortgage Overview in Davis County
| Characteristic | Without Mortgage | With Mortgage |
| Housing Units | 23,943 | 63,207 |
| Median Property Value | $411,600 | $427,200 |
| Median Household Income | $89,867 | $21,324 |
| Monthly Housing Costs | $521 | $6,698 |
| Real Estate Taxes | $2,429 | $1,322 |
Property Value by Mortgage Status in Davis County
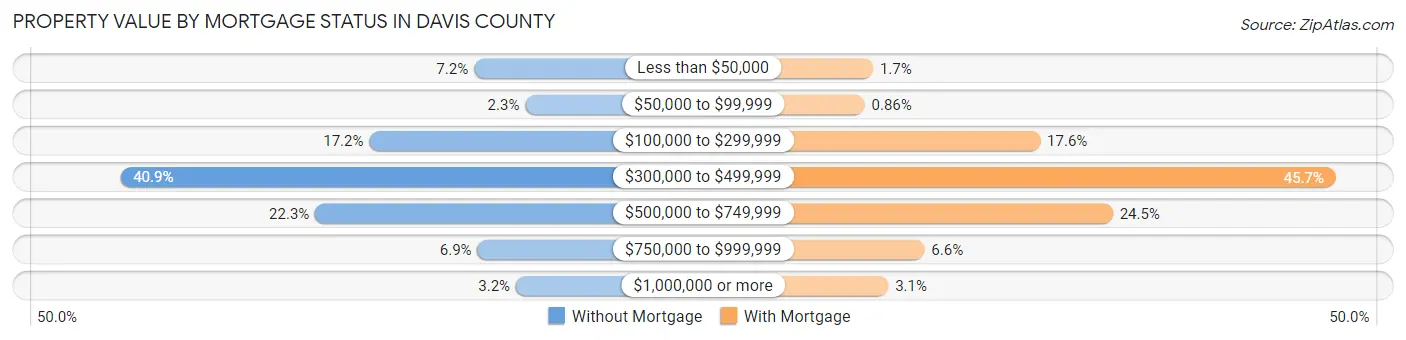
| Property Value | Without Mortgage | With Mortgage |
| Less than $50,000 | 1,725 (7.2%) | 1,049 (1.7%) |
| $50,000 to $99,999 | 555 (2.3%) | 546 (0.9%) |
| $100,000 to $299,999 | 4,111 (17.2%) | 11,112 (17.6%) |
| $300,000 to $499,999 | 9,791 (40.9%) | 28,912 (45.7%) |
| $500,000 to $749,999 | 5,346 (22.3%) | 15,478 (24.5%) |
| $750,000 to $999,999 | 1,646 (6.9%) | 4,147 (6.6%) |
| $1,000,000 or more | 769 (3.2%) | 1,963 (3.1%) |
| Total | 23,943 (100.0%) | 63,207 (100.0%) |
Household Income by Mortgage Status in Davis County
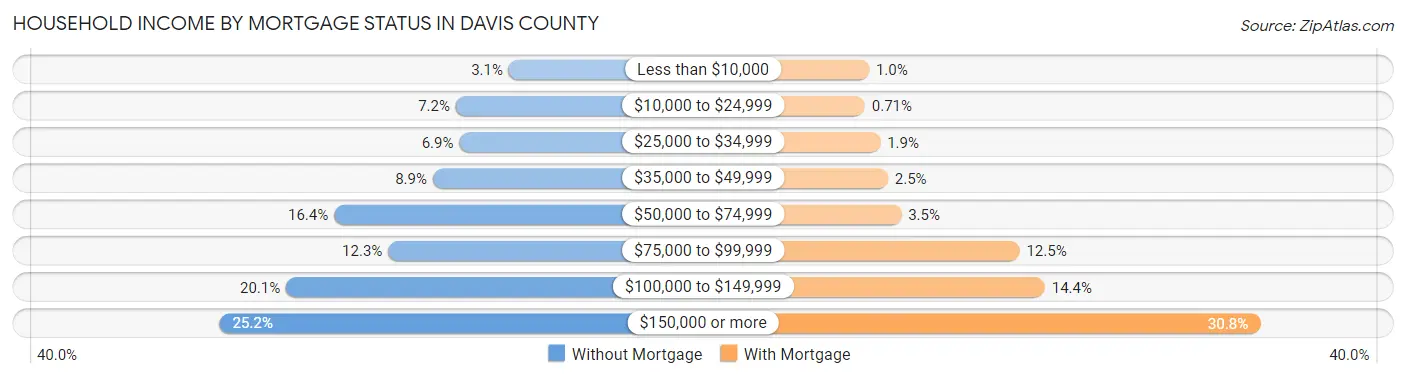
| Household Income | Without Mortgage | With Mortgage |
| Less than $10,000 | 744 (3.1%) | 646 (1.0%) |
| $10,000 to $24,999 | 1,713 (7.1%) | 446 (0.7%) |
| $25,000 to $34,999 | 1,648 (6.9%) | 1,189 (1.9%) |
| $35,000 to $49,999 | 2,132 (8.9%) | 1,557 (2.5%) |
| $50,000 to $74,999 | 3,932 (16.4%) | 2,202 (3.5%) |
| $75,000 to $99,999 | 2,945 (12.3%) | 7,892 (12.5%) |
| $100,000 to $149,999 | 4,808 (20.1%) | 9,115 (14.4%) |
| $150,000 or more | 6,021 (25.2%) | 19,482 (30.8%) |
| Total | 23,943 (100.0%) | 63,207 (100.0%) |
Property Value to Household Income Ratio in Davis County
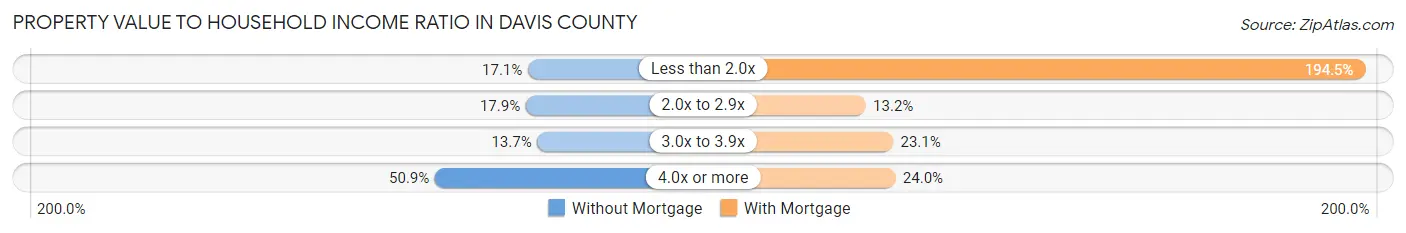
| Value-to-Income Ratio | Without Mortgage | With Mortgage |
| Less than 2.0x | 4,096 (17.1%) | 122,925 (194.5%) |
| 2.0x to 2.9x | 4,281 (17.9%) | 8,317 (13.2%) |
| 3.0x to 3.9x | 3,281 (13.7%) | 14,603 (23.1%) |
| 4.0x or more | 12,184 (50.9%) | 15,147 (24.0%) |
| Total | 23,943 (100.0%) | 63,207 (100.0%) |
Real Estate Taxes by Mortgage Status in Davis County
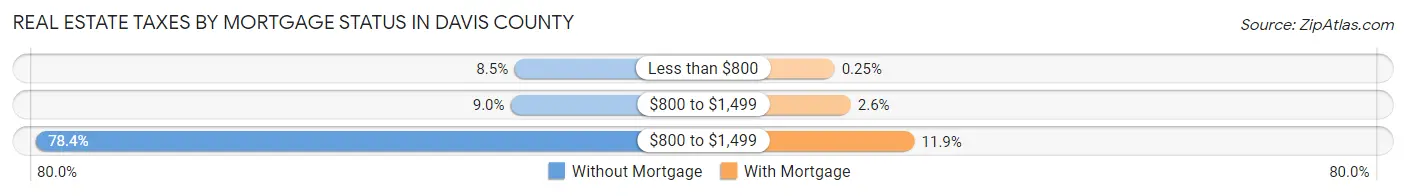
| Property Taxes | Without Mortgage | With Mortgage |
| Less than $800 | 2,032 (8.5%) | 156 (0.3%) |
| $800 to $1,499 | 2,159 (9.0%) | 1,644 (2.6%) |
| $800 to $1,499 | 18,781 (78.4%) | 7,536 (11.9%) |
| Total | 23,943 (100.0%) | 63,207 (100.0%) |
Health & Disability in Davis County
Health Insurance Coverage by Age in Davis County
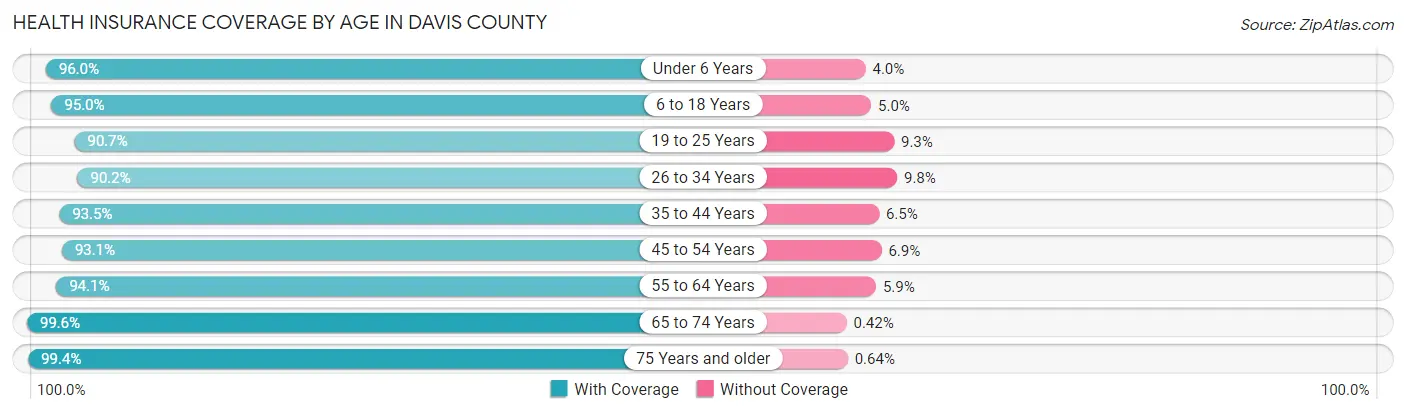
| Age Bracket | With Coverage | Without Coverage |
| Under 6 Years | 32,697 (96.0%) | 1,348 (4.0%) |
| 6 to 18 Years | 80,676 (95.0%) | 4,250 (5.0%) |
| 19 to 25 Years | 29,290 (90.7%) | 2,996 (9.3%) |
| 26 to 34 Years | 38,995 (90.2%) | 4,257 (9.8%) |
| 35 to 44 Years | 50,517 (93.5%) | 3,489 (6.5%) |
| 45 to 54 Years | 36,237 (93.1%) | 2,697 (6.9%) |
| 55 to 64 Years | 31,695 (94.1%) | 1,992 (5.9%) |
| 65 to 74 Years | 22,748 (99.6%) | 97 (0.4%) |
| 75 Years and older | 14,559 (99.4%) | 94 (0.6%) |
| Total | 337,414 (94.1%) | 21,220 (5.9%) |
Health Insurance Coverage by Citizenship Status in Davis County
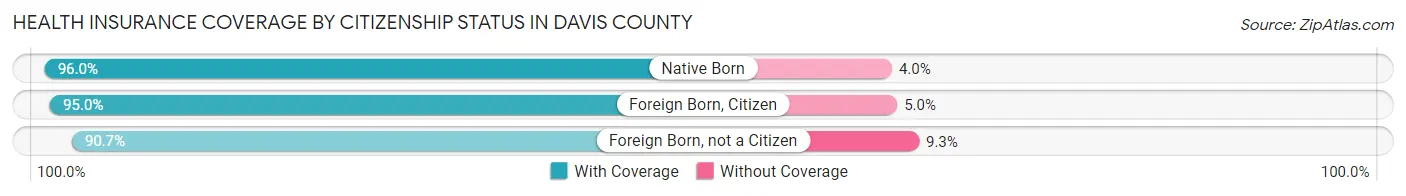
| Citizenship Status | With Coverage | Without Coverage |
| Native Born | 32,697 (96.0%) | 1,348 (4.0%) |
| Foreign Born, Citizen | 80,676 (95.0%) | 4,250 (5.0%) |
| Foreign Born, not a Citizen | 29,290 (90.7%) | 2,996 (9.3%) |
Health Insurance Coverage by Household Income in Davis County
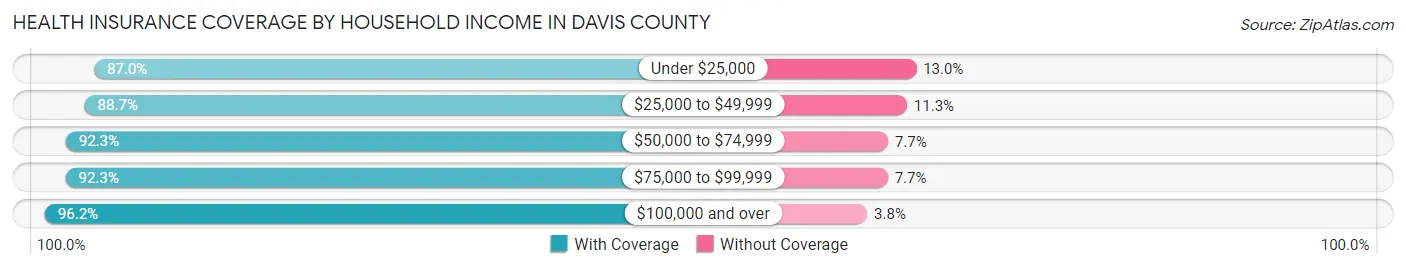
| Household Income | With Coverage | Without Coverage |
| Under $25,000 | 13,891 (87.0%) | 2,076 (13.0%) |
| $25,000 to $49,999 | 25,394 (88.7%) | 3,221 (11.3%) |
| $50,000 to $74,999 | 42,406 (92.3%) | 3,546 (7.7%) |
| $75,000 to $99,999 | 49,722 (92.3%) | 4,132 (7.7%) |
| $100,000 and over | 205,623 (96.2%) | 8,155 (3.8%) |
Public vs Private Health Insurance Coverage by Age in Davis County
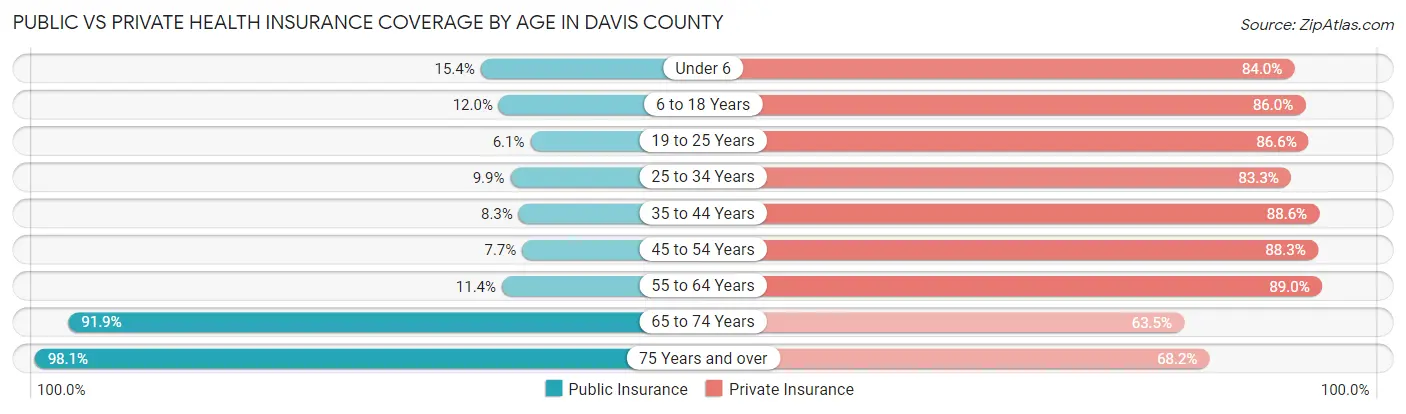
| Age Bracket | Public Insurance | Private Insurance |
| Under 6 | 5,234 (15.4%) | 28,580 (84.0%) |
| 6 to 18 Years | 10,181 (12.0%) | 73,013 (86.0%) |
| 19 to 25 Years | 1,978 (6.1%) | 27,966 (86.6%) |
| 25 to 34 Years | 4,260 (9.9%) | 36,033 (83.3%) |
| 35 to 44 Years | 4,483 (8.3%) | 47,824 (88.5%) |
| 45 to 54 Years | 2,978 (7.6%) | 34,373 (88.3%) |
| 55 to 64 Years | 3,843 (11.4%) | 29,991 (89.0%) |
| 65 to 74 Years | 20,988 (91.9%) | 14,499 (63.5%) |
| 75 Years and over | 14,378 (98.1%) | 9,992 (68.2%) |
| Total | 68,323 (19.1%) | 302,271 (84.3%) |
Disability Status by Sex by Age in Davis County
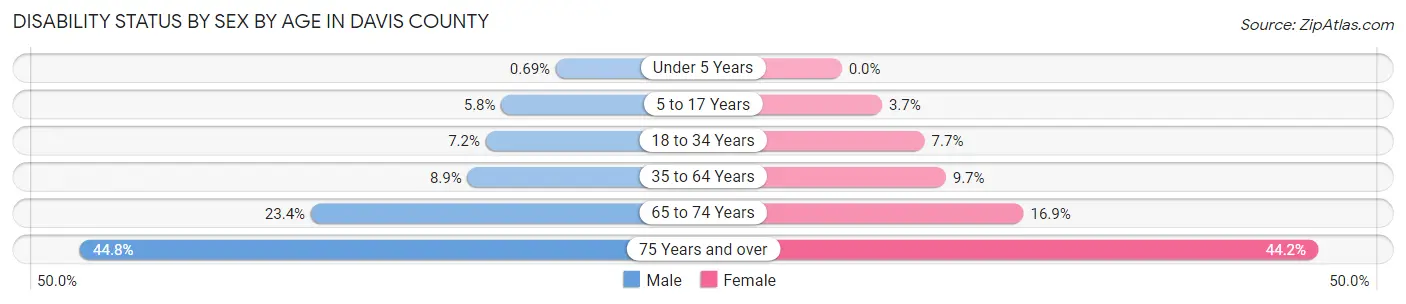
| Age Bracket | Male | Female |
| Under 5 Years | 98 (0.7%) | 0 (0.0%) |
| 5 to 17 Years | 2,548 (5.8%) | 1,527 (3.7%) |
| 18 to 34 Years | 2,971 (7.2%) | 3,113 (7.7%) |
| 35 to 64 Years | 5,688 (8.9%) | 6,051 (9.7%) |
| 65 to 74 Years | 2,574 (23.4%) | 2,001 (16.9%) |
| 75 Years and over | 2,882 (44.8%) | 3,634 (44.2%) |
Disability Class by Sex by Age in Davis County
Disability Class: Hearing Difficulty
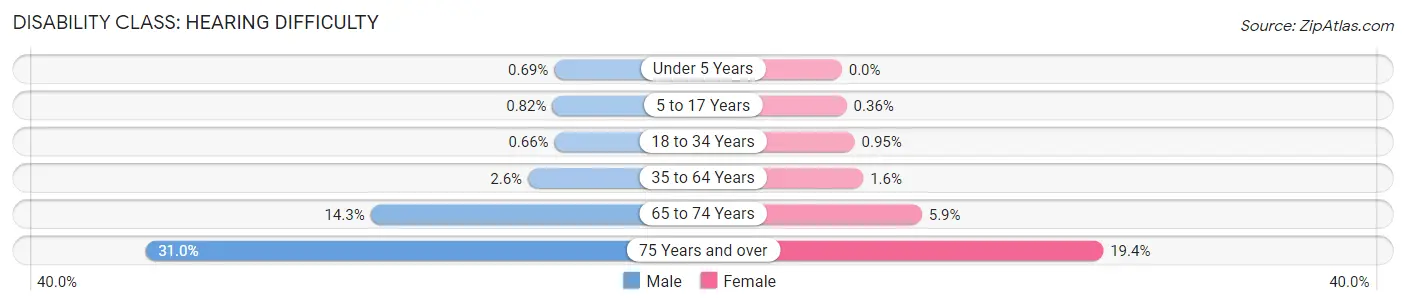
| Age Bracket | Male | Female |
| Under 5 Years | 98 (0.7%) | 0 (0.0%) |
| 5 to 17 Years | 364 (0.8%) | 147 (0.4%) |
| 18 to 34 Years | 274 (0.7%) | 385 (0.9%) |
| 35 to 64 Years | 1,683 (2.6%) | 996 (1.6%) |
| 65 to 74 Years | 1,573 (14.3%) | 704 (5.9%) |
| 75 Years and over | 1,995 (31.0%) | 1,597 (19.4%) |
Disability Class: Vision Difficulty
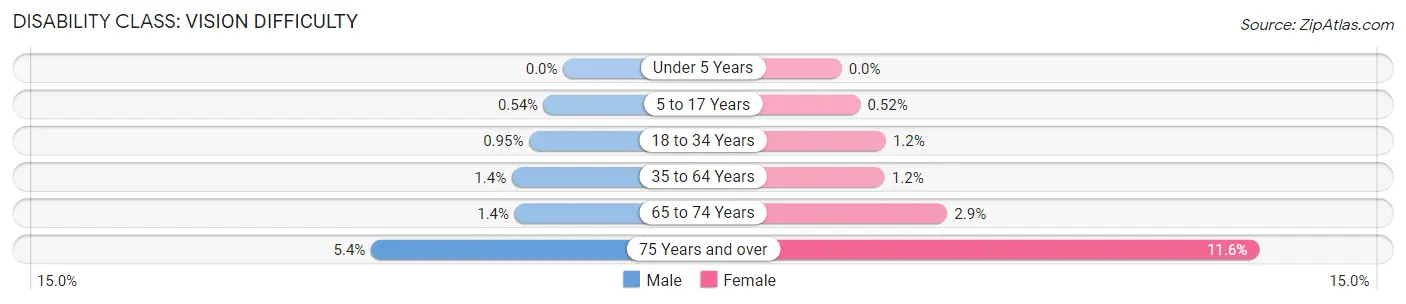
| Age Bracket | Male | Female |
| Under 5 Years | 0 (0.0%) | 0 (0.0%) |
| 5 to 17 Years | 241 (0.5%) | 212 (0.5%) |
| 18 to 34 Years | 392 (0.9%) | 499 (1.2%) |
| 35 to 64 Years | 914 (1.4%) | 754 (1.2%) |
| 65 to 74 Years | 148 (1.3%) | 349 (2.9%) |
| 75 Years and over | 344 (5.3%) | 956 (11.6%) |
Disability Class: Cognitive Difficulty
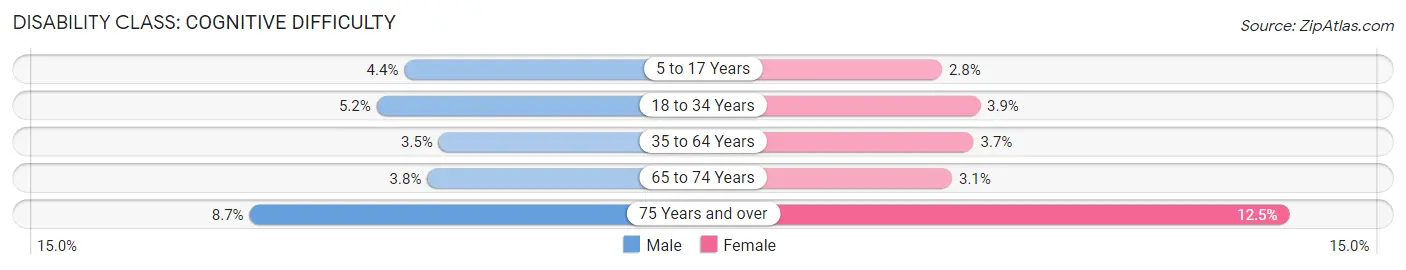
| Age Bracket | Male | Female |
| 5 to 17 Years | 1,961 (4.4%) | 1,143 (2.8%) |
| 18 to 34 Years | 2,144 (5.2%) | 1,557 (3.8%) |
| 35 to 64 Years | 2,222 (3.5%) | 2,298 (3.7%) |
| 65 to 74 Years | 416 (3.8%) | 364 (3.1%) |
| 75 Years and over | 562 (8.7%) | 1,025 (12.5%) |
Disability Class: Ambulatory Difficulty
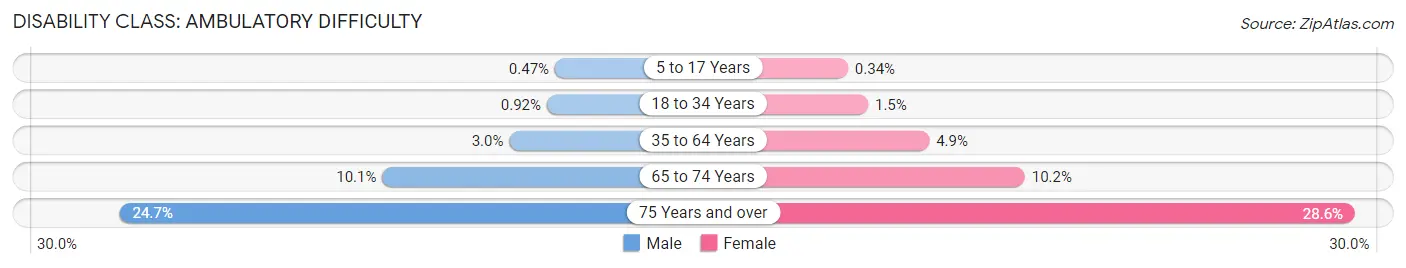
| Age Bracket | Male | Female |
| 5 to 17 Years | 207 (0.5%) | 139 (0.3%) |
| 18 to 34 Years | 378 (0.9%) | 591 (1.5%) |
| 35 to 64 Years | 1,922 (3.0%) | 3,051 (4.9%) |
| 65 to 74 Years | 1,107 (10.1%) | 1,209 (10.2%) |
| 75 Years and over | 1,588 (24.7%) | 2,350 (28.6%) |
Disability Class: Self-Care Difficulty
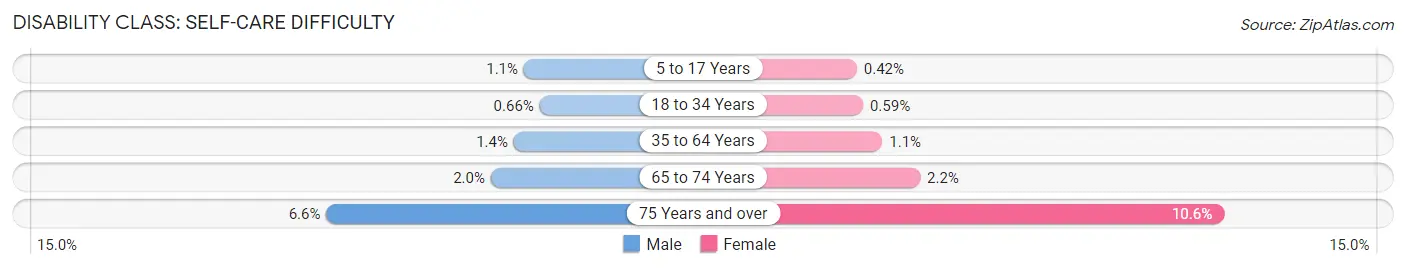
| Age Bracket | Male | Female |
| 5 to 17 Years | 489 (1.1%) | 173 (0.4%) |
| 18 to 34 Years | 274 (0.7%) | 239 (0.6%) |
| 35 to 64 Years | 884 (1.4%) | 711 (1.1%) |
| 65 to 74 Years | 222 (2.0%) | 259 (2.2%) |
| 75 Years and over | 424 (6.6%) | 875 (10.6%) |
Technology Access in Davis County
Computing Device Access in Davis County
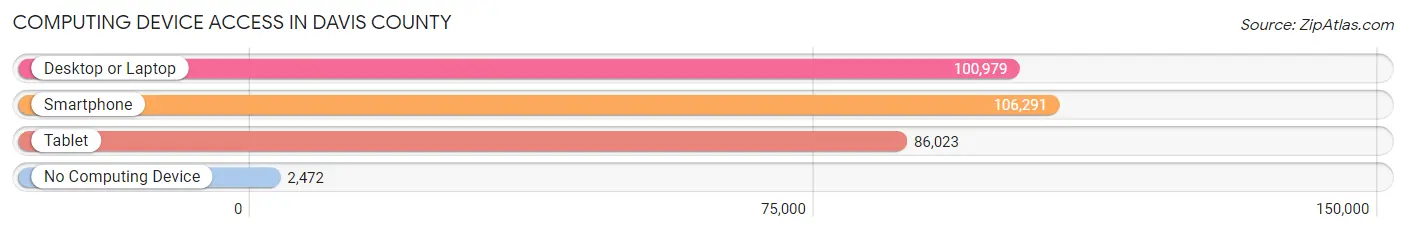
| Device Type | # Households | % Households |
| Desktop or Laptop | 100,979 | 90.0% |
| Smartphone | 106,291 | 94.8% |
| Tablet | 86,023 | 76.7% |
| No Computing Device | 2,472 | 2.2% |
| Total | 112,155 | 100.0% |
Internet Access in Davis County
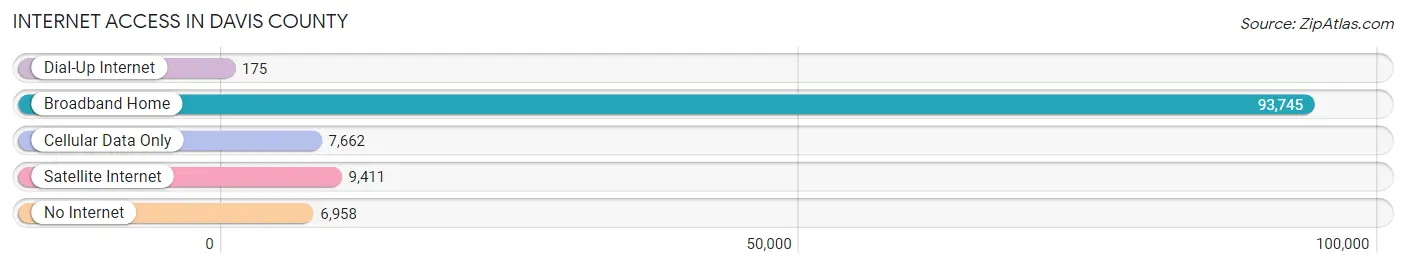
| Internet Type | # Households | % Households |
| Dial-Up Internet | 175 | 0.2% |
| Broadband Home | 93,745 | 83.6% |
| Cellular Data Only | 7,662 | 6.8% |
| Satellite Internet | 9,411 | 8.4% |
| No Internet | 6,958 | 6.2% |
| Total | 112,155 | 100.0% |
Davis County Summary
Davis County, Utah is located in the northern part of the state and is part of the Ogden-Clearfield Metropolitan Statistical Area. It is bordered by Weber County to the north, Morgan County to the east, Salt Lake County to the south, and Box Elder County to the west. The county seat is Farmington, and the largest city is Layton. As of the 2010 census, the population of Davis County was 306,479, making it the second most populous county in Utah.
Geography
Davis County is located in the northern part of Utah, and is part of the Wasatch Front. It is bordered by Weber County to the north, Morgan County to the east, Salt Lake County to the south, and Box Elder County to the west. The county has a total area of 577 square miles, of which 574 square miles is land and 3 square miles is water. The terrain is mostly flat, with some rolling hills in the western part of the county. The highest point in the county is the summit of Traverse Mountain, at an elevation of 6,845 feet.
The county is home to several bodies of water, including the Great Salt Lake, Farmington Bay, and the Weber and Ogden Rivers. The Great Salt Lake is the largest lake in the state, and is a popular destination for boating, fishing, and bird watching. Farmington Bay is a shallow, marshy bay located in the northern part of the county, and is a popular spot for waterfowl hunting.
Climate
Davis County has a semi-arid climate, with hot summers and cold winters. The average annual temperature is 48°F, and the average annual precipitation is 16.5 inches. The county is located in the rain shadow of the Wasatch Mountains, and receives less precipitation than other parts of the state.
Demographics
As of the 2010 census, there were 306,479 people, 97,919 households, and 76,845 families living in Davis County. The population density was 531.3 people per square mile. The racial makeup of the county was 87.3% White, 2.2% African American, 0.7% Native American, 2.7% Asian, 0.2% Pacific Islander, 4.7% from other races, and 2.2% from two or more races. Hispanic or Latino of any race were 11.2% of the population.
The median income for a household in the county was $63,945, and the median income for a family was $71,837. The per capita income for the county was $25,945. About 4.3% of families and 6.2% of the population were below the poverty line, including 8.2% of those under age 18 and 4.2% of those age 65 or over.
Economy
Davis County is home to several major employers, including Hill Air Force Base, Intermountain Healthcare, and the Davis School District. Hill Air Force Base is the largest employer in the county, with over 15,000 employees. Intermountain Healthcare is the second largest employer, with over 8,000 employees. The Davis School District is the third largest employer, with over 5,000 employees.
The county is also home to several major industries, including manufacturing, retail, and healthcare. Manufacturing is the largest industry in the county, accounting for over 25% of the total employment. Retail is the second largest industry, accounting for over 20% of the total employment. Healthcare is the third largest industry, accounting for over 15% of the total employment.
Davis County is also home to several major attractions, including Lagoon Amusement Park, Antelope Island State Park, and the Great Salt Lake. Lagoon Amusement Park is a popular destination for families, and features roller coasters, water rides, and other attractions. Antelope Island State Park is a popular destination for camping, hiking, and wildlife viewing. The Great Salt Lake is a popular destination for boating, fishing, and bird watching.
Conclusion
Davis County, Utah is located in the northern part of the state and is part of the Ogden-Clearfield Metropolitan Statistical Area. It is bordered by Weber County to the north, Morgan County to the east, Salt Lake County to the south, and Box Elder County to the west. The county has a total area of 577 square miles, and the population was 306,479 as of the 2010 census. The county has a semi-arid climate, with hot summers and cold winters. The median income for a household in the county was $63,945, and the median income for a family was $71,837. The largest employers in the county are Hill Air Force Base, Intermountain Healthcare, and the Davis School District. The county is also home to several major industries, including manufacturing, retail, and healthcare. Davis County is also home to several major attractions, including Lagoon Amusement Park, Antelope Island State Park, and the Great Salt Lake.
Common Questions
What is the Total Population of Davis County?
Total Population of Davis County is 363,032.
What is the Total Male Population of Davis County?
Total Male Population of Davis County is 184,446.
What is the Total Female Population of Davis County?
Total Female Population of Davis County is 178,586.
What is the Ratio of Males per 100 Females in Davis County?
There are 103.28 Males per 100 Females in Davis County.
What is the Ratio of Females per 100 Males in Davis County?
There are 96.82 Females per 100 Males in Davis County.
What is the Median Population Age in Davis County?
Median Population Age in Davis County is 32.0 Years.
What is the Average Family Size in Davis County
Average Family Size in Davis County is 3.6 People.
What is the Average Household Size in Davis County
Average Household Size in Davis County is 3.2 People.
What is Per Capita Income in Davis County?
Per Capita income in Davis County is $39,218.
What is the Median Family Income in Davis County?
Median Family Income in Davis County is $113,192.
What is the Median Household income in Davis County?
Median Household Income in Davis County is $101,285.
What is Income or Wage Gap in Davis County?
Income or Wage Gap in Davis County is 47.0%.
Women in Davis County earn 53.0 cents for every dollar earned by a man.
What is Family Income Deficit in Davis County?
Family Income Deficit in Davis County is $10,707.
Families that are below poverty line in Davis County earn $10,707 less on average than the poverty threshold level.
What is Inequality or Gini Index in Davis County?
Inequality or Gini Index in Davis County is 0.40.
How Large is the Labor Force in Davis County?
There are 185,713 People in the Labor Forcein in Davis County.
What is the Percentage of People in the Labor Force in Davis County?
70.6% of People are in the Labor Force in Davis County.
What is the Unemployment Rate in Davis County?
Unemployment Rate in Davis County is 2.5%.