Daggett County, UT
Daggett County Map
Daggett County Overview
638
TOTAL POPULATION
366
MALE POPULATION
272
FEMALE POPULATION
134.56
MALES / 100 FEMALES
74.32
FEMALES / 100 MALES
43.3
MEDIAN AGE
3.4
AVG FAMILY SIZE
2.4
AVG HOUSEHOLD SIZE
$27,261
PER CAPITA INCOME
$91,250
AVG FAMILY INCOME
$61,250
AVG HOUSEHOLD INCOME
0.39
INEQUALITY / GINI INDEX
270
LABOR FORCE [ PEOPLE ]
54.9%
PERCENT IN LABOR FORCE
3.5%
UNEMPLOYMENT RATE
Daggett County Area Codes
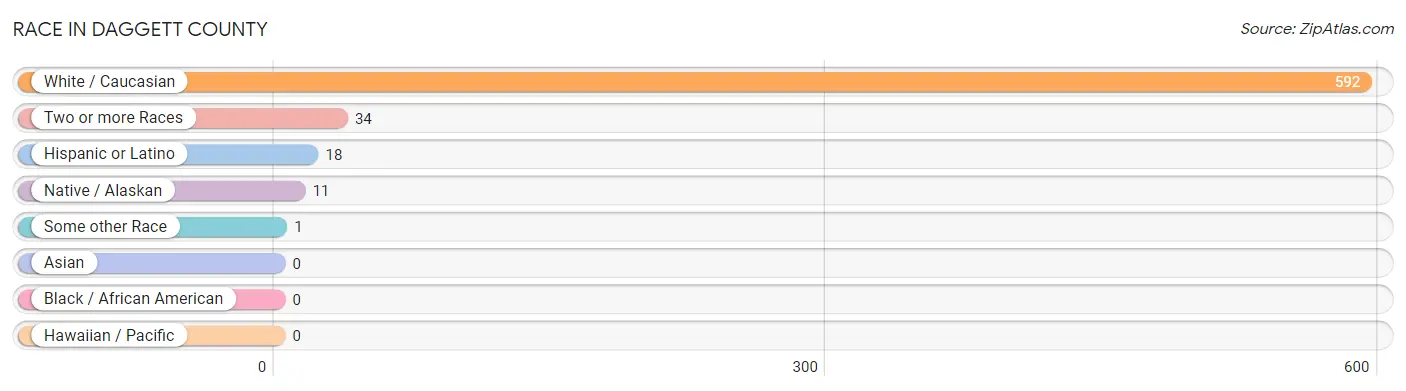
Race in Daggett County
The most populous races in Daggett County are White / Caucasian (592 | 92.8%), Two or more Races (34 | 5.3%), and Hispanic or Latino (18 | 2.8%).
| Race | # Population | % Population |
| Asian | 0 | 0.0% |
| Black / African American | 0 | 0.0% |
| Hawaiian / Pacific | 0 | 0.0% |
| Hispanic or Latino | 18 | 2.8% |
| Native / Alaskan | 11 | 1.7% |
| White / Caucasian | 592 | 92.8% |
| Two or more Races | 34 | 5.3% |
| Some other Race | 1 | 0.2% |
| Total | 638 | 100.0% |
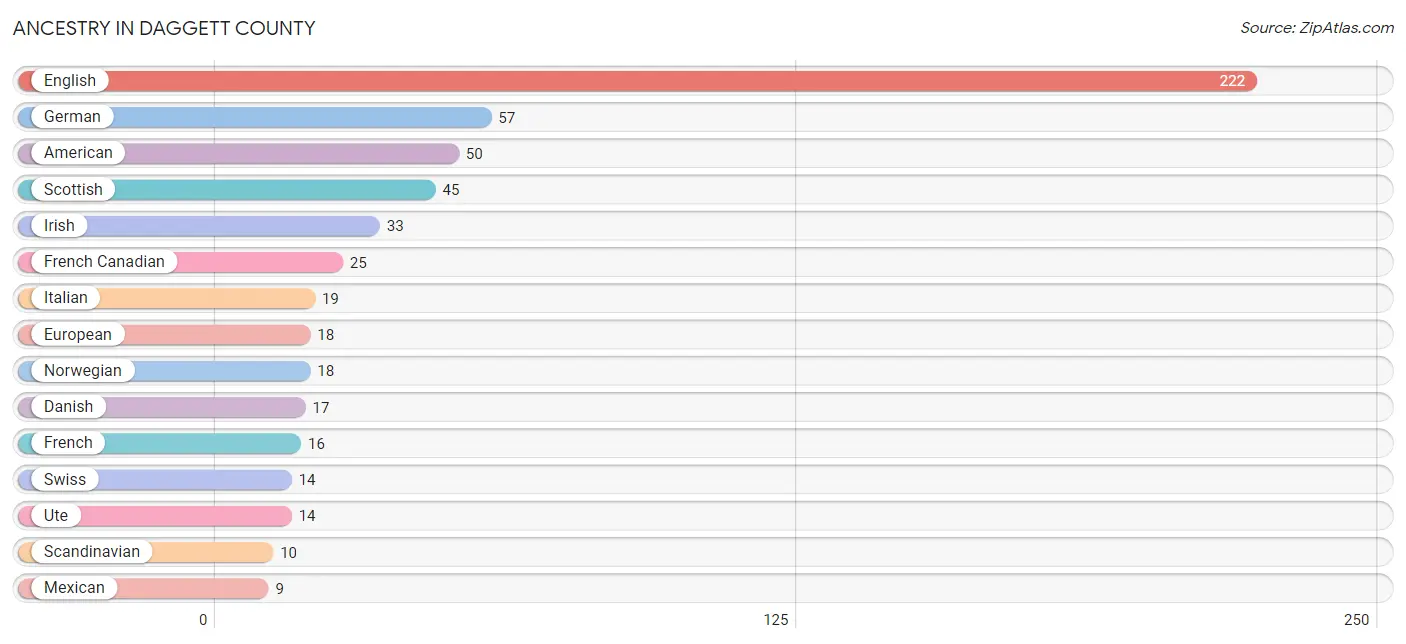
Ancestry in Daggett County
The most populous ancestries reported in Daggett County are English (222 | 34.8%), German (57 | 8.9%), American (50 | 7.8%), Scottish (45 | 7.0%), and Irish (33 | 5.2%), together accounting for 63.8% of all Daggett County residents.
| Ancestry | # Population | % Population |
| American | 50 | 7.8% |
| Bhutanese | 4 | 0.6% |
| Blackfeet | 5 | 0.8% |
| British | 6 | 0.9% |
| Central American | 1 | 0.2% |
| Cherokee | 5 | 0.8% |
| Danish | 17 | 2.7% |
| Dutch | 1 | 0.2% |
| English | 222 | 34.8% |
| European | 18 | 2.8% |
| French | 16 | 2.5% |
| French Canadian | 25 | 3.9% |
| German | 57 | 8.9% |
| Irish | 33 | 5.2% |
| Italian | 19 | 3.0% |
| Mexican | 9 | 1.4% |
| Navajo | 8 | 1.3% |
| Northern European | 5 | 0.8% |
| Norwegian | 18 | 2.8% |
| Paiute | 2 | 0.3% |
| Polish | 4 | 0.6% |
| Puerto Rican | 8 | 1.3% |
| Russian | 2 | 0.3% |
| Salvadoran | 1 | 0.2% |
| Scandinavian | 10 | 1.6% |
| Scottish | 45 | 7.0% |
| Swedish | 8 | 1.3% |
| Swiss | 14 | 2.2% |
| Ute | 14 | 2.2% |
| Welsh | 1 | 0.2% |
| Yugoslavian | 4 | 0.6% | View All 31 Rows |
Immigrants in Daggett County

| Immigration Origin | # Population | % Population | View All 0 Rows |
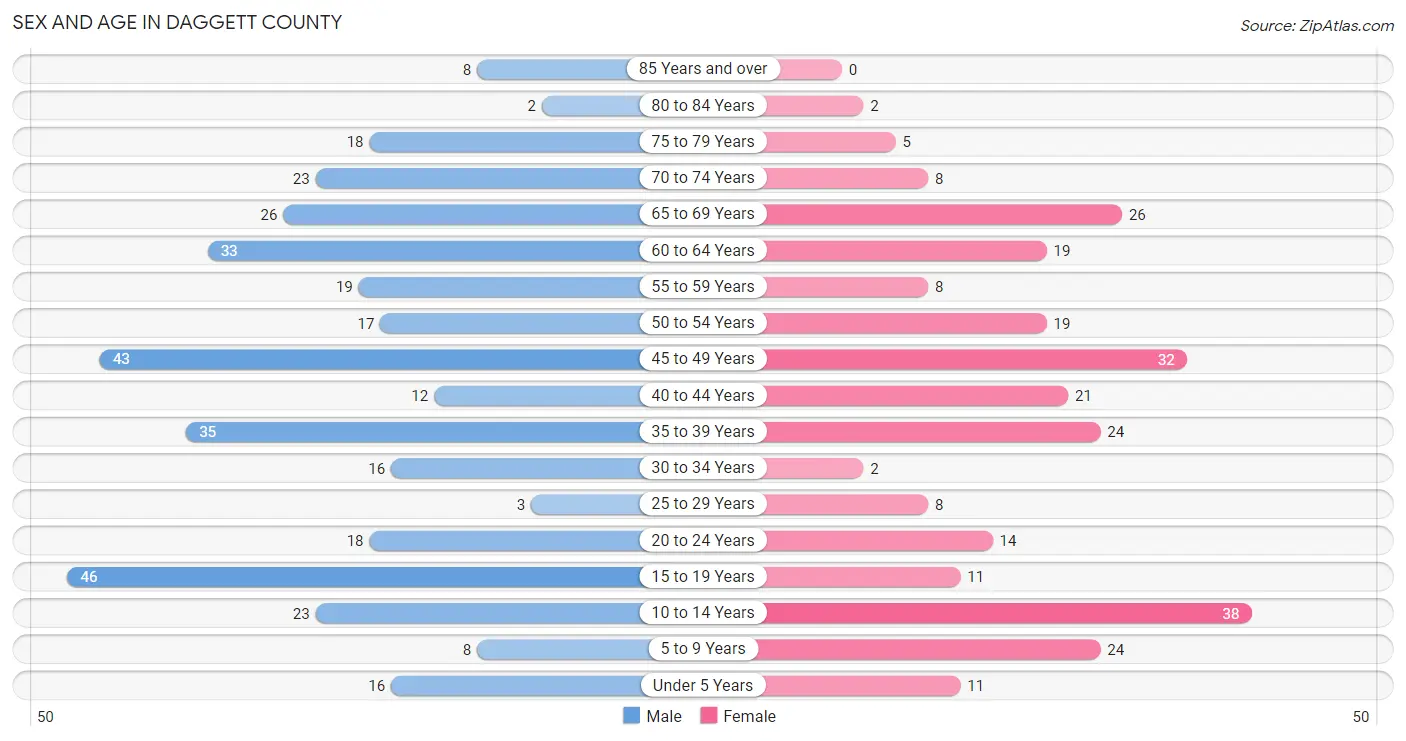
Sex and Age in Daggett County
Sex and Age in Daggett County
The most populous age groups in Daggett County are 15 to 19 Years (46 | 12.6%) for men and 10 to 14 Years (38 | 14.0%) for women.
| Age Bracket | Male | Female |
| Under 5 Years | 16 (4.4%) | 11 (4.0%) |
| 5 to 9 Years | 8 (2.2%) | 24 (8.8%) |
| 10 to 14 Years | 23 (6.3%) | 38 (14.0%) |
| 15 to 19 Years | 46 (12.6%) | 11 (4.0%) |
| 20 to 24 Years | 18 (4.9%) | 14 (5.1%) |
| 25 to 29 Years | 3 (0.8%) | 8 (2.9%) |
| 30 to 34 Years | 16 (4.4%) | 2 (0.7%) |
| 35 to 39 Years | 35 (9.6%) | 24 (8.8%) |
| 40 to 44 Years | 12 (3.3%) | 21 (7.7%) |
| 45 to 49 Years | 43 (11.7%) | 32 (11.8%) |
| 50 to 54 Years | 17 (4.6%) | 19 (7.0%) |
| 55 to 59 Years | 19 (5.2%) | 8 (2.9%) |
| 60 to 64 Years | 33 (9.0%) | 19 (7.0%) |
| 65 to 69 Years | 26 (7.1%) | 26 (9.6%) |
| 70 to 74 Years | 23 (6.3%) | 8 (2.9%) |
| 75 to 79 Years | 18 (4.9%) | 5 (1.8%) |
| 80 to 84 Years | 2 (0.5%) | 2 (0.7%) |
| 85 Years and over | 8 (2.2%) | 0 (0.0%) |
| Total | 366 (100.0%) | 272 (100.0%) |
Families and Households in Daggett County
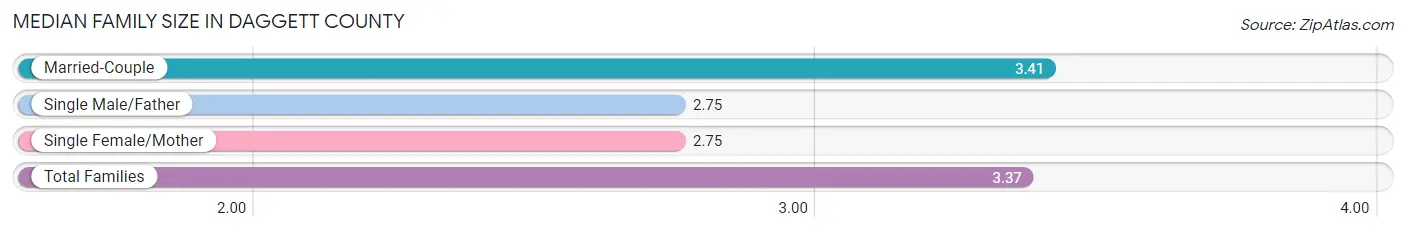
Median Family Size in Daggett County
The median family size in Daggett County is 3.37 persons per family, with married-couple families (131 | 94.2%) accounting for the largest median family size of 3.41 persons per family. On the other hand, single male/father families (4 | 2.9%) represent the smallest median family size with 2.75 persons per family.
| Family Type | # Families | Family Size |
| Married-Couple | 131 (94.2%) | 3.41 |
| Single Male/Father | 4 (2.9%) | 2.75 |
| Single Female/Mother | 4 (2.9%) | 2.75 |
| Total Families | 139 (100.0%) | 3.37 |
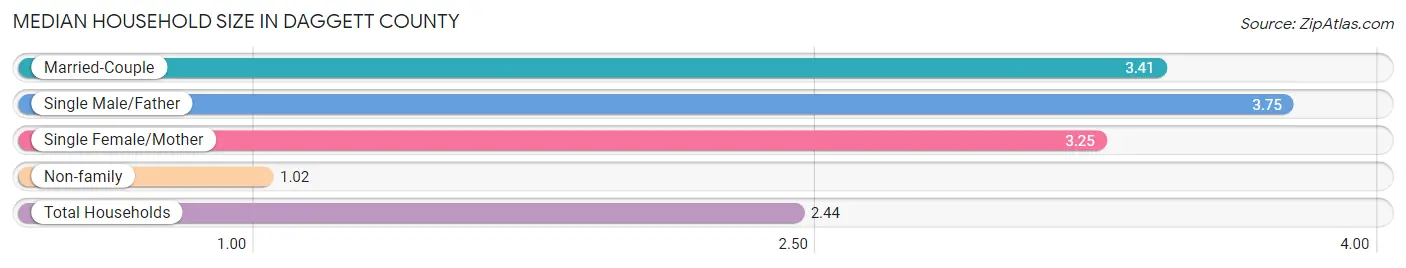
Median Household Size in Daggett County
The median household size in Daggett County is 2.44 persons per household, with single male/father households (4 | 1.7%) accounting for the largest median household size of 3.75 persons per household. non-family households (96 | 40.8%) represent the smallest median household size with 1.02 persons per household.
| Household Type | # Households | Household Size |
| Married-Couple | 131 (55.7%) | 3.41 |
| Single Male/Father | 4 (1.7%) | 3.75 |
| Single Female/Mother | 4 (1.7%) | 3.25 |
| Non-family | 96 (40.8%) | 1.02 |
| Total Households | 235 (100.0%) | 2.44 |
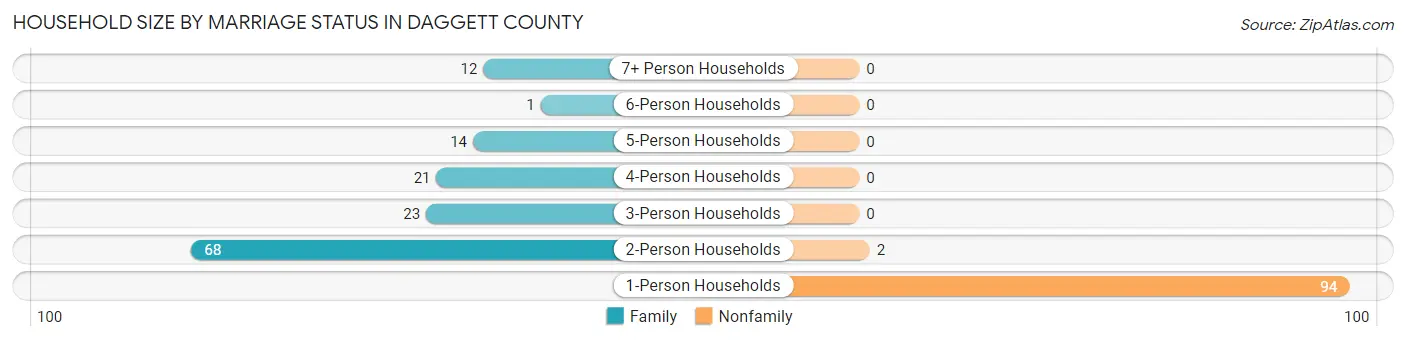
Household Size by Marriage Status in Daggett County
Out of a total of 235 households in Daggett County, 139 (59.2%) are family households, while 96 (40.8%) are nonfamily households. The most numerous type of family households are 2-person households, comprising 68, and the most common type of nonfamily households are 1-person households, comprising 94.
| Household Size | Family Households | Nonfamily Households |
| 1-Person Households | - | 94 (40.0%) |
| 2-Person Households | 68 (28.9%) | 2 (0.9%) |
| 3-Person Households | 23 (9.8%) | 0 (0.0%) |
| 4-Person Households | 21 (8.9%) | 0 (0.0%) |
| 5-Person Households | 14 (6.0%) | 0 (0.0%) |
| 6-Person Households | 1 (0.4%) | 0 (0.0%) |
| 7+ Person Households | 12 (5.1%) | 0 (0.0%) |
| Total | 139 (59.2%) | 96 (40.8%) |
Female Fertility in Daggett County
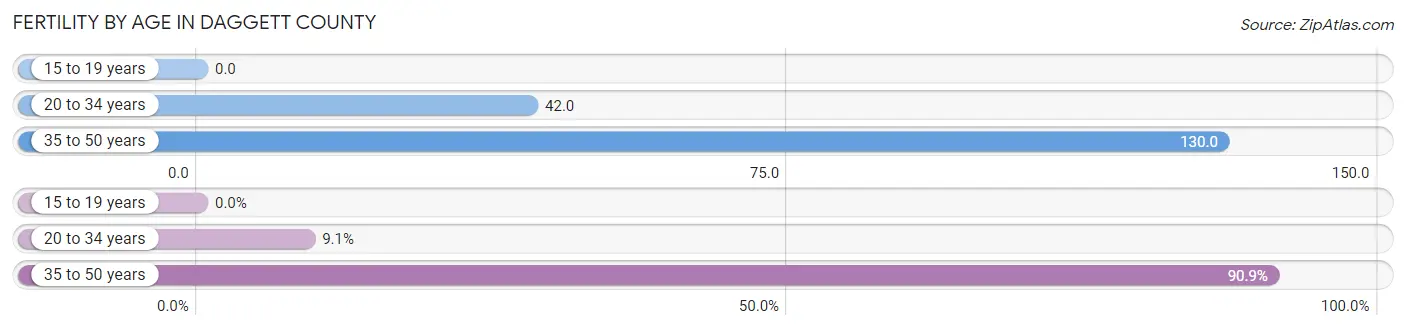
Fertility by Age in Daggett County
Average fertility rate in Daggett County is 98.0 births per 1,000 women. Women in the age bracket of 35 to 50 years have the highest fertility rate with 130.0 births per 1,000 women. Women in the age bracket of 35 to 50 years acount for 90.9% of all women with births.
| Age Bracket | Women with Births | Births / 1,000 Women |
| 15 to 19 years | 0 (0.0%) | 0.0 |
| 20 to 34 years | 1 (9.1%) | 42.0 |
| 35 to 50 years | 10 (90.9%) | 130.0 |
| Total | 11 (100.0%) | 98.0 |
Fertility by Age by Marriage Status in Daggett County
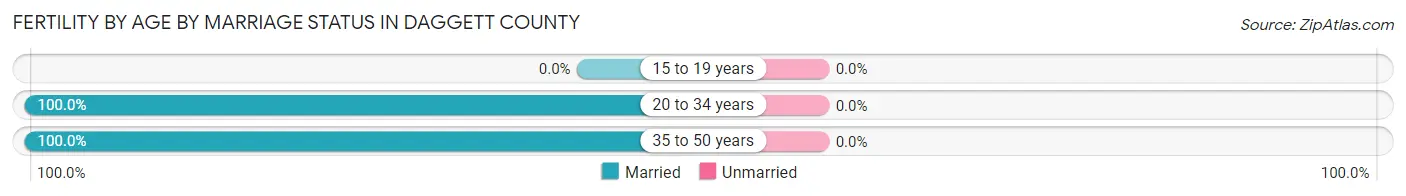
| Age Bracket | Married | Unmarried |
| 15 to 19 years | 0 (0.0%) | 0 (0.0%) |
| 20 to 34 years | 1 (100.0%) | 0 (0.0%) |
| 35 to 50 years | 10 (100.0%) | 0 (0.0%) |
| Total | 11 (100.0%) | 0 (0.0%) |
Fertility by Education in Daggett County
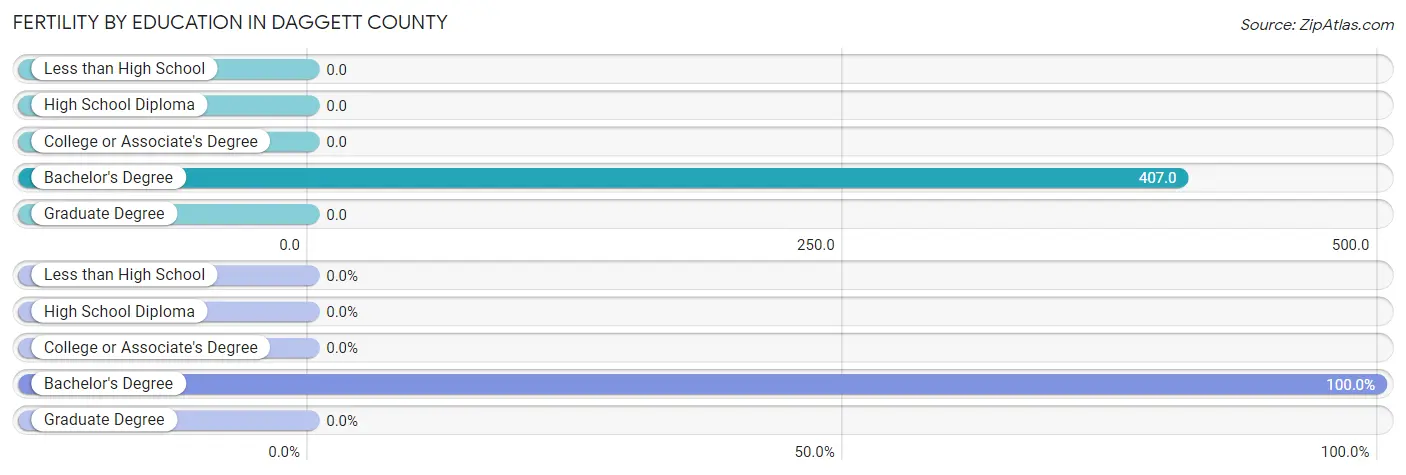
| Educational Attainment | Women with Births | Births / 1,000 Women |
| Less than High School | 0 (0.0%) | 0.0 |
| High School Diploma | 0 (0.0%) | 0.0 |
| College or Associate's Degree | 0 (0.0%) | 0.0 |
| Bachelor's Degree | 11 (100.0%) | 407.0 |
| Graduate Degree | 0 (0.0%) | 0.0 |
| Total | 11 (100.0%) | 98.0 |
Fertility by Education by Marriage Status in Daggett County
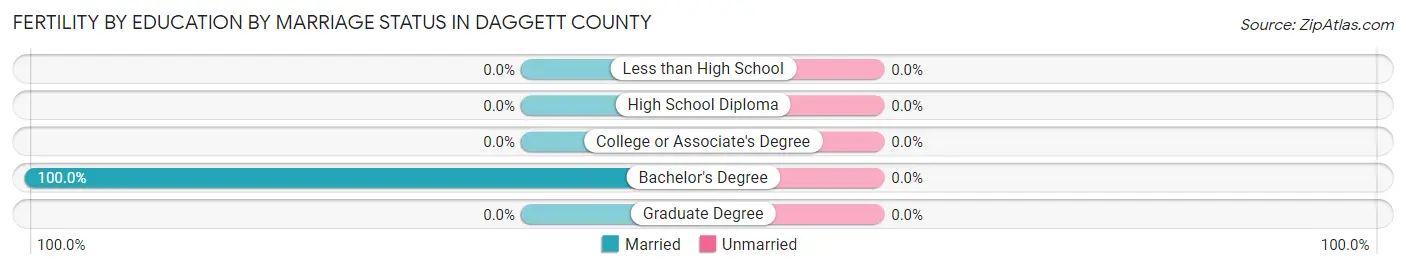
| Educational Attainment | Married | Unmarried |
| Less than High School | 0 (0.0%) | 0 (0.0%) |
| High School Diploma | 0 (0.0%) | 0 (0.0%) |
| College or Associate's Degree | 0 (0.0%) | 0 (0.0%) |
| Bachelor's Degree | 11 (100.0%) | 0 (0.0%) |
| Graduate Degree | 0 (0.0%) | 0 (0.0%) |
| Total | 11 (100.0%) | 0 (0.0%) |
Income in Daggett County
Income Overview in Daggett County
Per Capita Income in Daggett County is $27,261, while median incomes of families and households are $91,250 and $61,250 respectively.
| Characteristic | Number | Measure |
| Per Capita Income | 638 | $27,261 |
| Median Family Income | 139 | $91,250 |
| Mean Family Income | 139 | $99,157 |
| Median Household Income | 235 | $61,250 |
| Mean Household Income | 235 | $73,434 |
| Income Deficit | 139 | $0 |
| Wage / Income Gap (%) | 638 | 0.00% |
| Wage / Income Gap ($) | 638 | 100.00¢ per $1 |
| Gini / Inequality Index | 638 | 0.39 |
Earnings by Sex in Daggett County
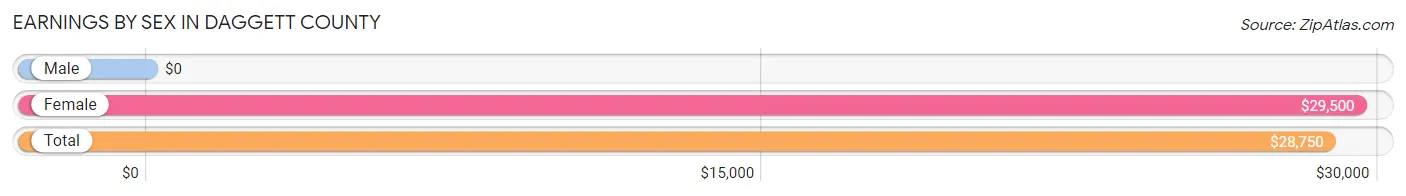
| Sex | Number | Average Earnings |
| Male | 181 (58.2%) | $0 |
| Female | 130 (41.8%) | $29,500 |
| Total | 311 (100.0%) | $28,750 |
Earnings by Sex by Income Bracket in Daggett County
The most common earnings brackets in Daggett County are $5,000 to $7,499 for men (29 | 16.0%) and $2,499 or less for women (17 | 13.1%).
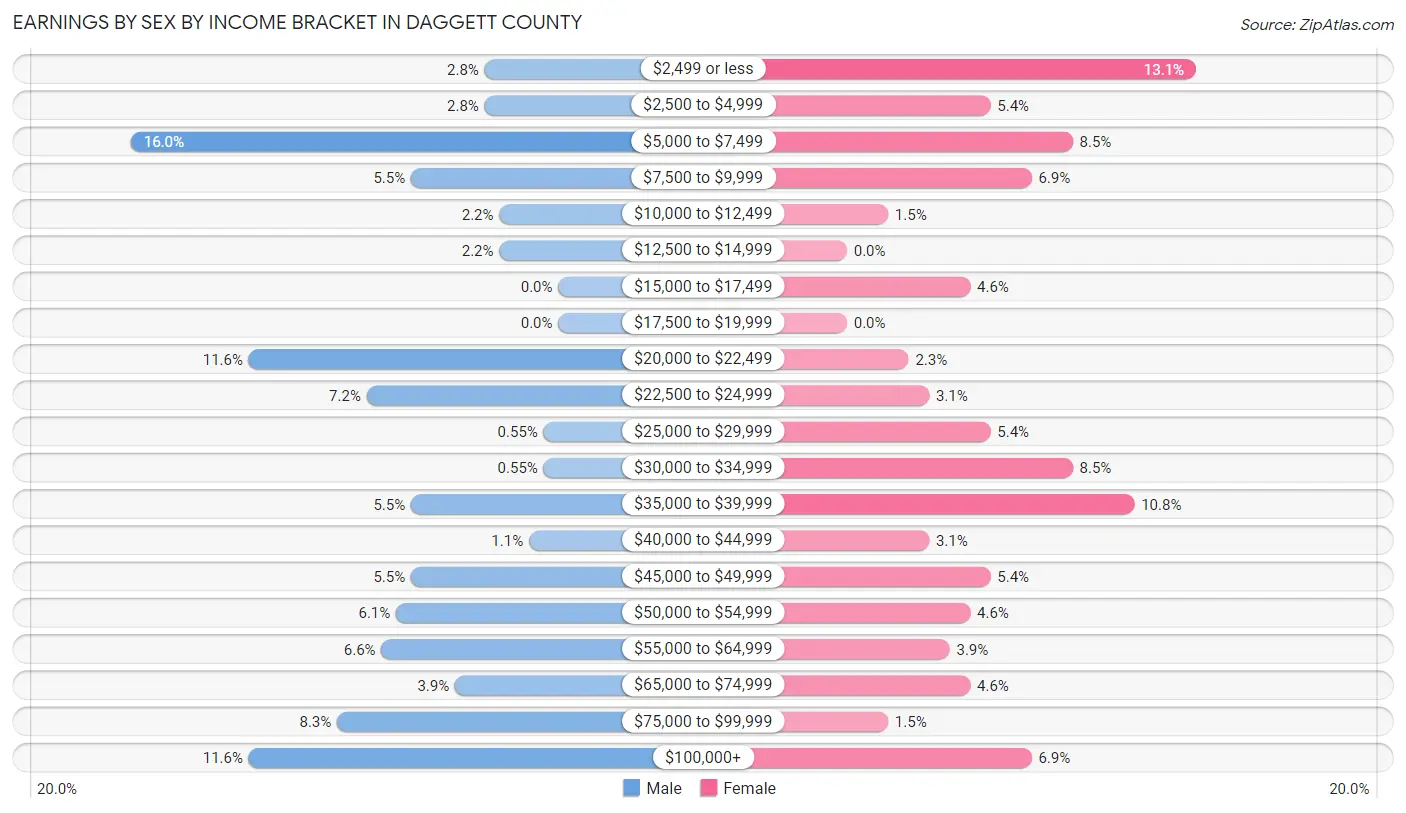
| Income | Male | Female |
| $2,499 or less | 5 (2.8%) | 17 (13.1%) |
| $2,500 to $4,999 | 5 (2.8%) | 7 (5.4%) |
| $5,000 to $7,499 | 29 (16.0%) | 11 (8.5%) |
| $7,500 to $9,999 | 10 (5.5%) | 9 (6.9%) |
| $10,000 to $12,499 | 4 (2.2%) | 2 (1.5%) |
| $12,500 to $14,999 | 4 (2.2%) | 0 (0.0%) |
| $15,000 to $17,499 | 0 (0.0%) | 6 (4.6%) |
| $17,500 to $19,999 | 0 (0.0%) | 0 (0.0%) |
| $20,000 to $22,499 | 21 (11.6%) | 3 (2.3%) |
| $22,500 to $24,999 | 13 (7.2%) | 4 (3.1%) |
| $25,000 to $29,999 | 1 (0.5%) | 7 (5.4%) |
| $30,000 to $34,999 | 1 (0.5%) | 11 (8.5%) |
| $35,000 to $39,999 | 10 (5.5%) | 14 (10.8%) |
| $40,000 to $44,999 | 2 (1.1%) | 4 (3.1%) |
| $45,000 to $49,999 | 10 (5.5%) | 7 (5.4%) |
| $50,000 to $54,999 | 11 (6.1%) | 6 (4.6%) |
| $55,000 to $64,999 | 12 (6.6%) | 5 (3.8%) |
| $65,000 to $74,999 | 7 (3.9%) | 6 (4.6%) |
| $75,000 to $99,999 | 15 (8.3%) | 2 (1.5%) |
| $100,000+ | 21 (11.6%) | 9 (6.9%) |
| Total | 181 (100.0%) | 130 (100.0%) |
Earnings by Sex by Educational Attainment in Daggett County
Average earnings in Daggett County are $39,792 for men and $32,159 for women, a difference of 19.2%. Men with an educational attainment of graduate degree enjoy the highest average annual earnings of $65,625, while those with less than high school education earn the least with $6,250. Women with an educational attainment of bachelor's degree earn the most with the average annual earnings of $36,667, while those with high school diploma education have the smallest earnings of $31,786.
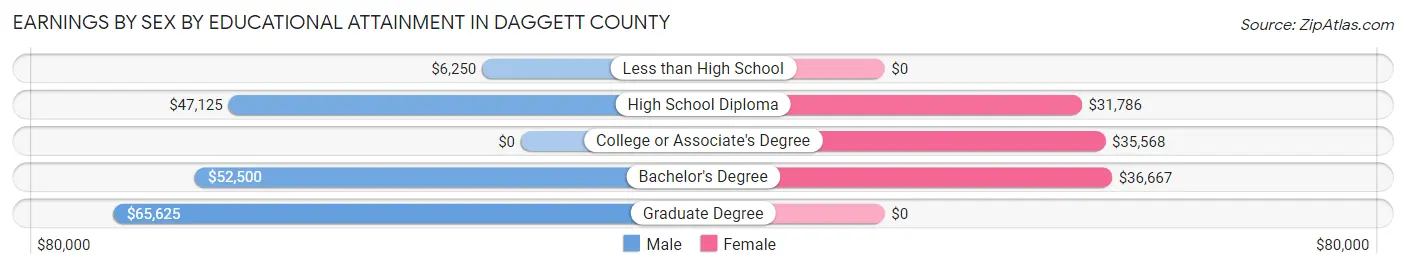
| Educational Attainment | Male Income | Female Income |
| Less than High School | $6,250 | $0 |
| High School Diploma | $47,125 | $31,786 |
| College or Associate's Degree | - | - |
| Bachelor's Degree | $52,500 | $36,667 |
| Graduate Degree | $65,625 | $0 |
| Total | $39,792 | $32,159 |
Family Income in Daggett County
Family Income Brackets in Daggett County
According to the Daggett County family income data, there are 47 families falling into the $100,000 to $149,999 income range, which is the most common income bracket and makes up 33.8% of all families. Conversely, the $10,000 to $14,999 income bracket is the least frequent group with only 1 families (0.7%) belonging to this category.
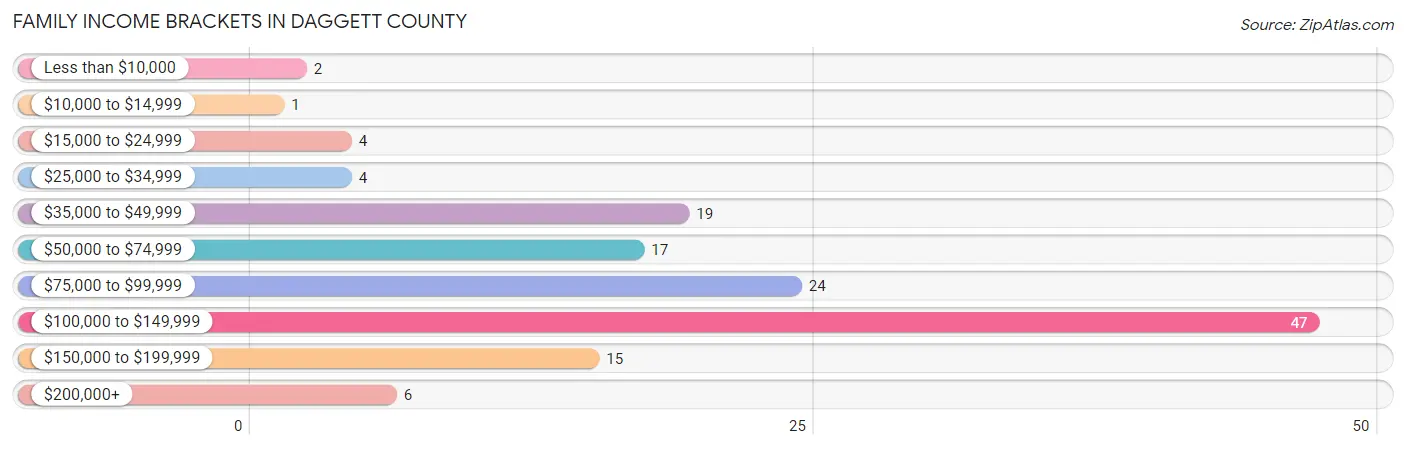
| Income Bracket | # Families | % Families |
| Less than $10,000 | 2 | 1.4% |
| $10,000 to $14,999 | 1 | 0.7% |
| $15,000 to $24,999 | 4 | 2.9% |
| $25,000 to $34,999 | 4 | 2.9% |
| $35,000 to $49,999 | 19 | 13.7% |
| $50,000 to $74,999 | 17 | 12.2% |
| $75,000 to $99,999 | 24 | 17.3% |
| $100,000 to $149,999 | 47 | 33.8% |
| $150,000 to $199,999 | 15 | 10.8% |
| $200,000+ | 6 | 4.3% |
Family Income by Famaliy Size in Daggett County
7+ person families (12 | 8.6%) account for the highest median family income in Daggett County with $135,357 per family, while 2-person families (74 | 53.2%) have the highest median income of $35,750 per family member.
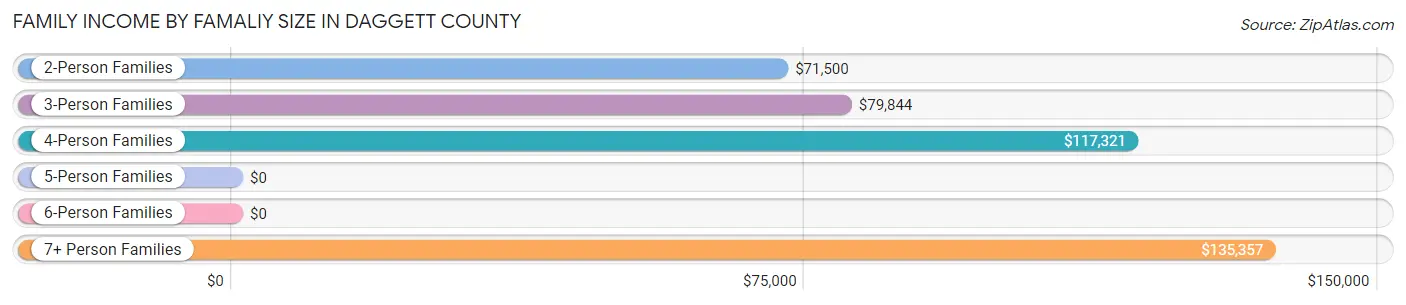
| Income Bracket | # Families | Median Income |
| 2-Person Families | 74 (53.2%) | $71,500 |
| 3-Person Families | 17 (12.2%) | $79,844 |
| 4-Person Families | 21 (15.1%) | $117,321 |
| 5-Person Families | 14 (10.1%) | $0 |
| 6-Person Families | 1 (0.7%) | $0 |
| 7+ Person Families | 12 (8.6%) | $135,357 |
| Total | 139 (100.0%) | $91,250 |
Family Income by Number of Earners in Daggett County
The median family income in Daggett County is $91,250, with families comprising 3+ earners (24) having the highest median family income of $126,429, while families with 1 earner (48) have the lowest median family income of $71,500, accounting for 17.3% and 34.5% of families, respectively.
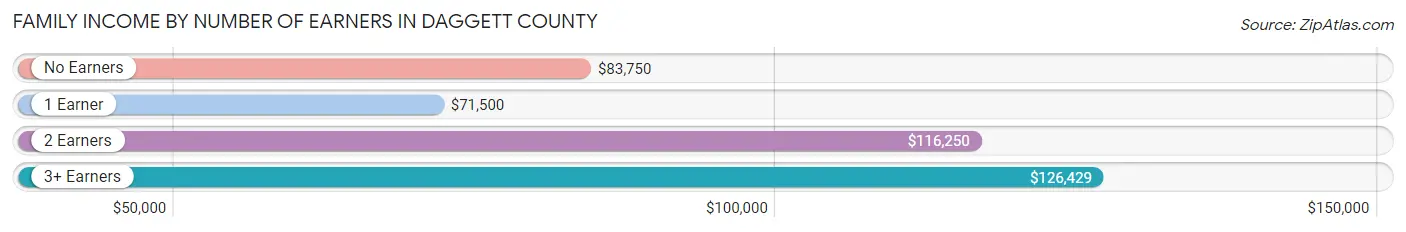
| Number of Earners | # Families | Median Income |
| No Earners | 22 (15.8%) | $83,750 |
| 1 Earner | 48 (34.5%) | $71,500 |
| 2 Earners | 45 (32.4%) | $116,250 |
| 3+ Earners | 24 (17.3%) | $126,429 |
| Total | 139 (100.0%) | $91,250 |
Household Income in Daggett County
Household Income Brackets in Daggett County
With 50 households falling in the category, the $100,000 to $149,999 income range is the most frequent in Daggett County, accounting for 21.3% of all households. In contrast, only 6 households (2.5%) fall into the $10,000 to $14,999 income bracket, making it the least populous group.
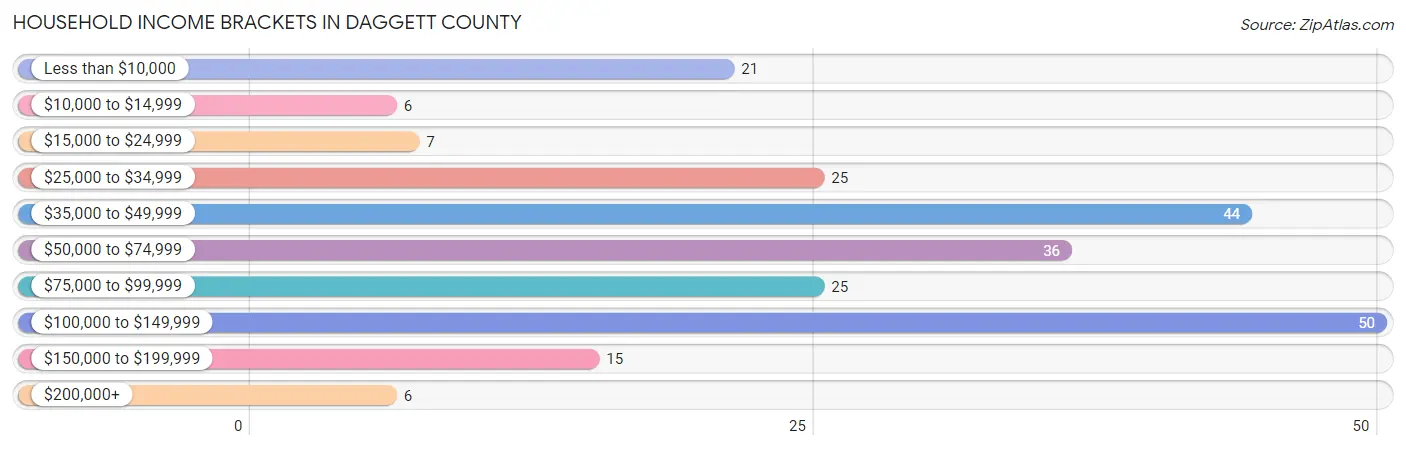
| Income Bracket | # Households | % Households |
| Less than $10,000 | 21 | 8.9% |
| $10,000 to $14,999 | 6 | 2.6% |
| $15,000 to $24,999 | 7 | 3.0% |
| $25,000 to $34,999 | 25 | 10.6% |
| $35,000 to $49,999 | 44 | 18.7% |
| $50,000 to $74,999 | 36 | 15.3% |
| $75,000 to $99,999 | 25 | 10.6% |
| $100,000 to $149,999 | 50 | 21.3% |
| $150,000 to $199,999 | 15 | 6.4% |
| $200,000+ | 6 | 2.6% |
Household Income by Householder Age in Daggett County
The median household income in Daggett County is $61,250, with the highest median household income of $113,000 found in the 25 to 44 years age bracket for the primary householder. A total of 48 households (20.4%) fall into this category.
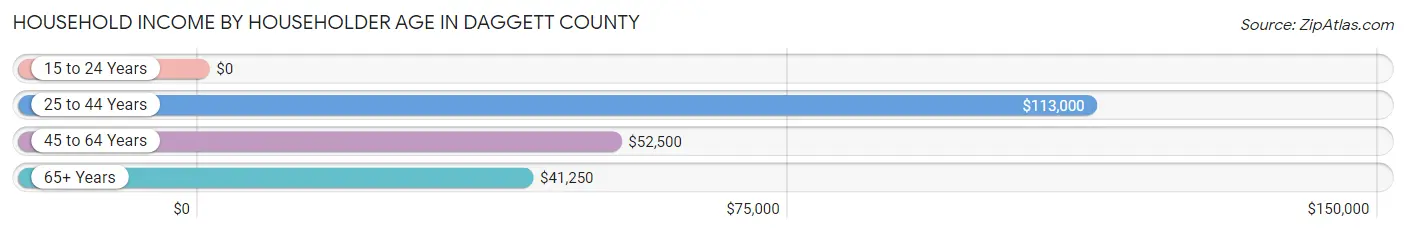
| Income Bracket | # Households | Median Income |
| 15 to 24 Years | 0 (0.0%) | $0 |
| 25 to 44 Years | 48 (20.4%) | $113,000 |
| 45 to 64 Years | 118 (50.2%) | $52,500 |
| 65+ Years | 69 (29.4%) | $41,250 |
| Total | 235 (100.0%) | $61,250 |
Poverty in Daggett County
Income Below Poverty by Sex and Age in Daggett County
With 8.2% poverty level for males and 7.4% for females among the residents of Daggett County, 25 to 34 year old males and 25 to 34 year old females are the most vulnerable to poverty, with 9 males (50.0%) and 2 females (20.0%) in their respective age groups living below the poverty level.
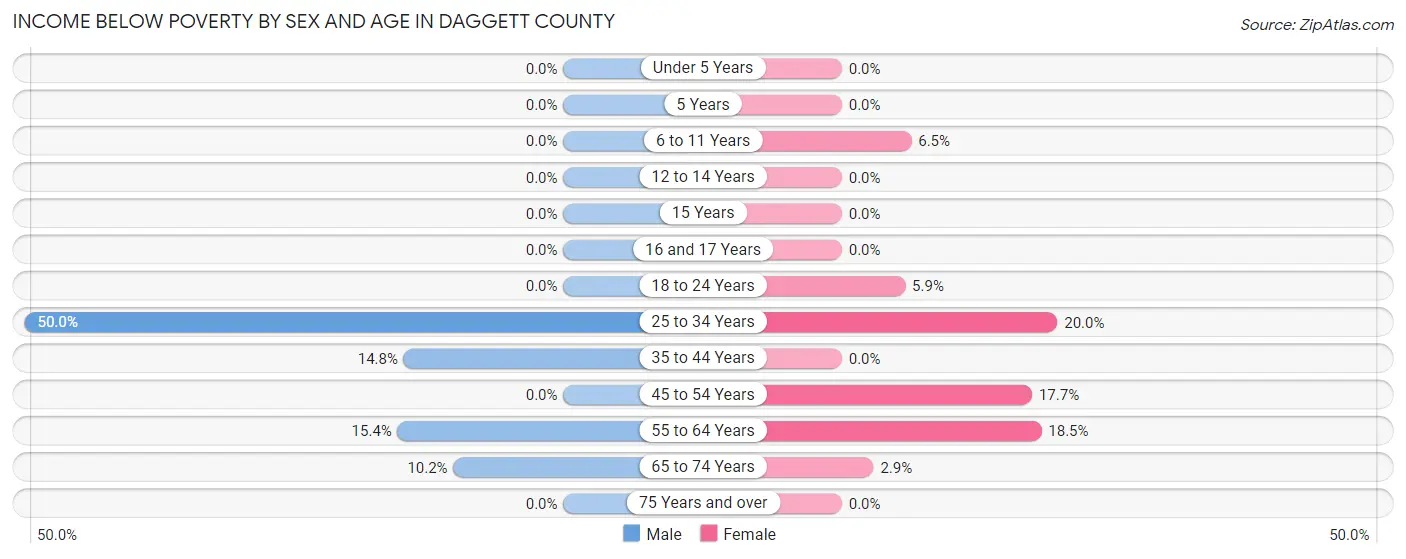
| Age Bracket | Male | Female |
| Under 5 Years | 0 (0.0%) | 0 (0.0%) |
| 5 Years | 0 (0.0%) | 0 (0.0%) |
| 6 to 11 Years | 0 (0.0%) | 2 (6.5%) |
| 12 to 14 Years | 0 (0.0%) | 0 (0.0%) |
| 15 Years | 0 (0.0%) | 0 (0.0%) |
| 16 and 17 Years | 0 (0.0%) | 0 (0.0%) |
| 18 to 24 Years | 0 (0.0%) | 1 (5.9%) |
| 25 to 34 Years | 9 (50.0%) | 2 (20.0%) |
| 35 to 44 Years | 4 (14.8%) | 0 (0.0%) |
| 45 to 54 Years | 0 (0.0%) | 9 (17.6%) |
| 55 to 64 Years | 8 (15.4%) | 5 (18.5%) |
| 65 to 74 Years | 5 (10.2%) | 1 (2.9%) |
| 75 Years and over | 0 (0.0%) | 0 (0.0%) |
| Total | 26 (8.2%) | 20 (7.4%) |
Income Above Poverty by Sex and Age in Daggett County
According to the poverty statistics in Daggett County, males aged under 5 years and females aged under 5 years are the age groups that are most secure financially, with 100.0% of males and 100.0% of females in these age groups living above the poverty line.
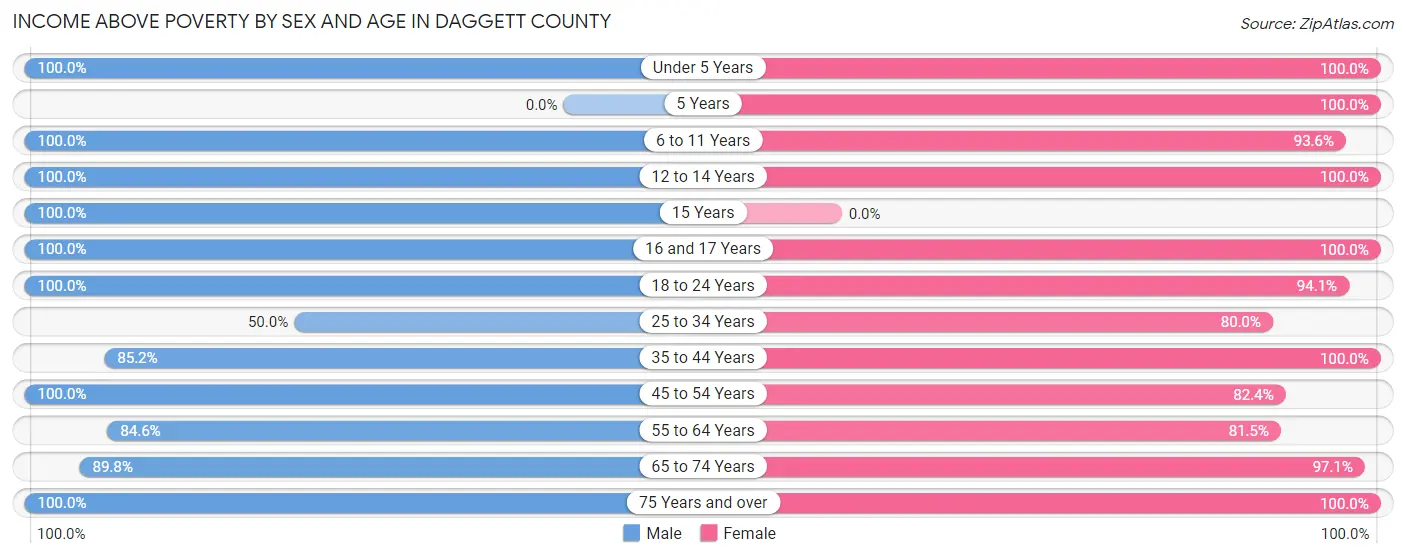
| Age Bracket | Male | Female |
| Under 5 Years | 16 (100.0%) | 11 (100.0%) |
| 5 Years | 0 (0.0%) | 2 (100.0%) |
| 6 to 11 Years | 12 (100.0%) | 29 (93.5%) |
| 12 to 14 Years | 19 (100.0%) | 29 (100.0%) |
| 15 Years | 25 (100.0%) | 0 (0.0%) |
| 16 and 17 Years | 9 (100.0%) | 7 (100.0%) |
| 18 to 24 Years | 10 (100.0%) | 16 (94.1%) |
| 25 to 34 Years | 9 (50.0%) | 8 (80.0%) |
| 35 to 44 Years | 23 (85.2%) | 45 (100.0%) |
| 45 to 54 Years | 53 (100.0%) | 42 (82.4%) |
| 55 to 64 Years | 44 (84.6%) | 22 (81.5%) |
| 65 to 74 Years | 44 (89.8%) | 33 (97.1%) |
| 75 Years and over | 28 (100.0%) | 7 (100.0%) |
| Total | 292 (91.8%) | 251 (92.6%) |
Income Below Poverty Among Married-Couple Families in Daggett County
The poverty statistics for married-couple families in Daggett County show that 0.8% or 1 of the total 131 families live below the poverty line. Families with no children have the highest poverty rate of 1.3%, comprising of 1 families. On the other hand, families with 1 or 2 children have the lowest poverty rate of 0.0%, which includes 0 families.
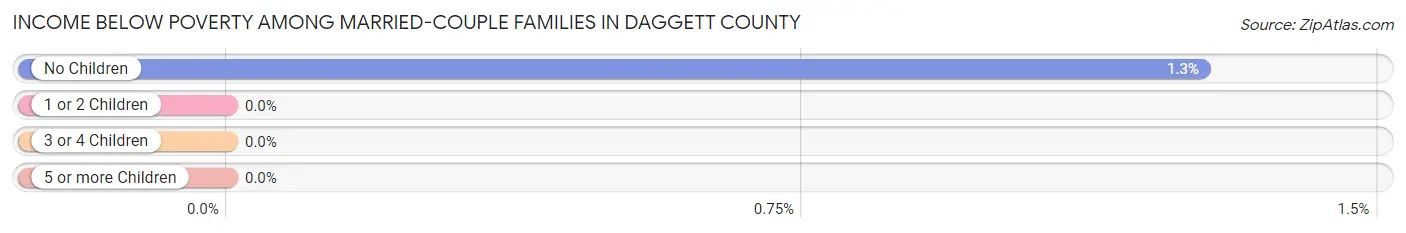
| Children | Above Poverty | Below Poverty |
| No Children | 78 (98.7%) | 1 (1.3%) |
| 1 or 2 Children | 25 (100.0%) | 0 (0.0%) |
| 3 or 4 Children | 22 (100.0%) | 0 (0.0%) |
| 5 or more Children | 5 (100.0%) | 0 (0.0%) |
| Total | 130 (99.2%) | 1 (0.8%) |
Income Below Poverty Among Single-Parent Households in Daggett County
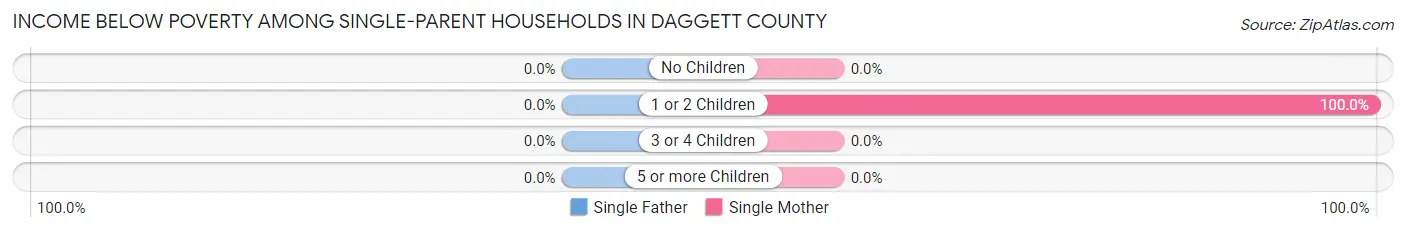
| Children | Single Father | Single Mother |
| No Children | 0 (0.0%) | 0 (0.0%) |
| 1 or 2 Children | 0 (0.0%) | 2 (100.0%) |
| 3 or 4 Children | 0 (0.0%) | 0 (0.0%) |
| 5 or more Children | 0 (0.0%) | 0 (0.0%) |
| Total | 0 (0.0%) | 2 (50.0%) |
Income Below Poverty Among Married-Couple vs Single-Parent Households in Daggett County
The poverty data for Daggett County shows that 1 of the married-couple family households (0.8%) and 2 of the single-parent households (25.0%) are living below the poverty level. Within the married-couple family households, those with no children have the highest poverty rate, with 1 households (1.3%) falling below the poverty line. Among the single-parent households, those with 1 or 2 children have the highest poverty rate, with 2 household (33.3%) living below poverty.
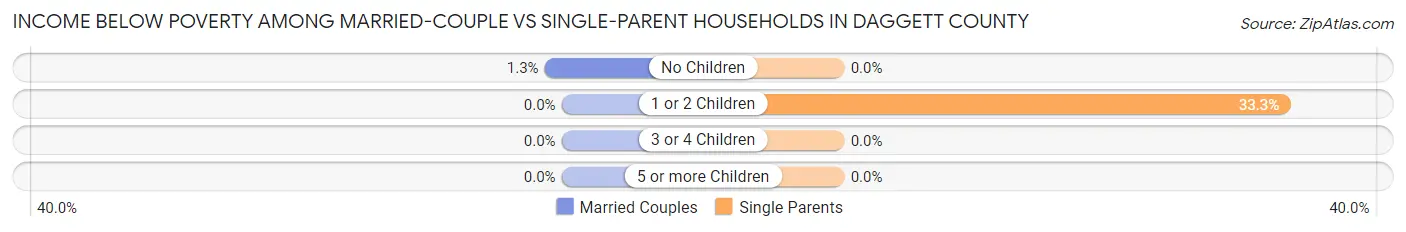
| Children | Married-Couple Families | Single-Parent Households |
| No Children | 1 (1.3%) | 0 (0.0%) |
| 1 or 2 Children | 0 (0.0%) | 2 (33.3%) |
| 3 or 4 Children | 0 (0.0%) | 0 (0.0%) |
| 5 or more Children | 0 (0.0%) | 0 (0.0%) |
| Total | 1 (0.8%) | 2 (25.0%) |
Employment Characteristics in Daggett County
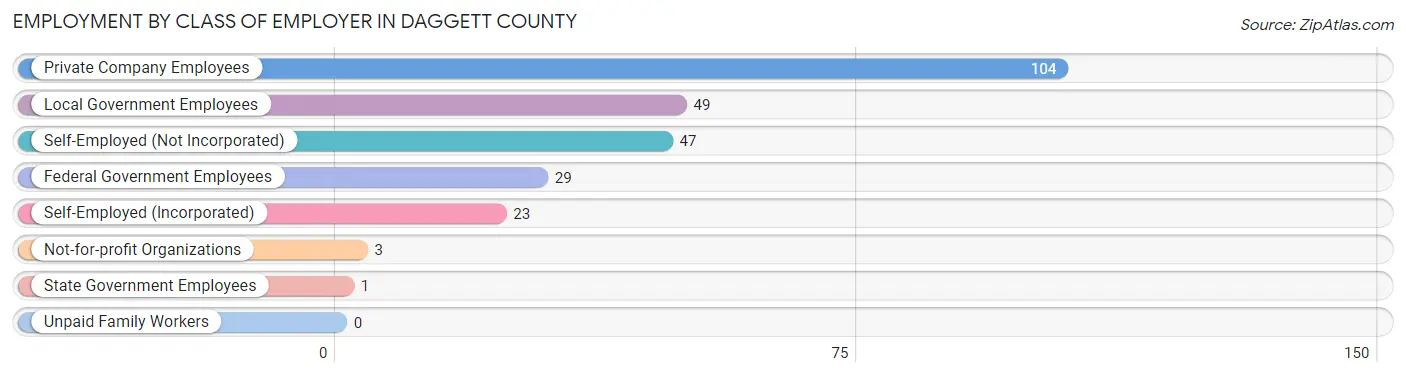
Employment by Class of Employer in Daggett County
Among the 256 employed individuals in Daggett County, private company employees (104 | 40.6%), local government employees (49 | 19.1%), and self-employed (not incorporated) (47 | 18.4%) make up the most common classes of employment.
| Employer Class | # Employees | % Employees |
| Private Company Employees | 104 | 40.6% |
| Self-Employed (Incorporated) | 23 | 9.0% |
| Self-Employed (Not Incorporated) | 47 | 18.4% |
| Not-for-profit Organizations | 3 | 1.2% |
| Local Government Employees | 49 | 19.1% |
| State Government Employees | 1 | 0.4% |
| Federal Government Employees | 29 | 11.3% |
| Unpaid Family Workers | 0 | 0.0% |
| Total | 256 | 100.0% |
Employment Status by Age in Daggett County
According to the labor force statistics for Daggett County, out of the total population over 16 years of age (492), 54.9% or 270 individuals are in the labor force, with 3.5% or 9 of them unemployed. The age group with the highest labor force participation rate is 25 to 29 years, with 90.9% or 10 individuals in the labor force. Within the labor force, the 16 to 19 years age range has the highest percentage of unemployed individuals, with 30.8% or 4 of them being unemployed.
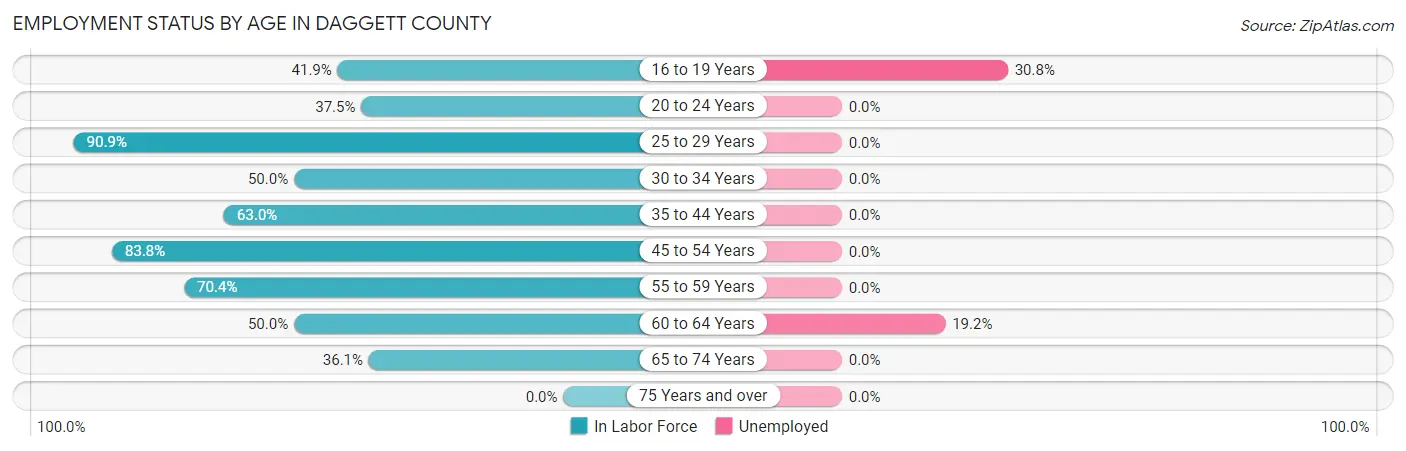
| Age Bracket | In Labor Force | Unemployed |
| 16 to 19 Years | 13 (41.9%) | 4 (30.8%) |
| 20 to 24 Years | 12 (37.5%) | 0 (0.0%) |
| 25 to 29 Years | 10 (90.9%) | 0 (0.0%) |
| 30 to 34 Years | 9 (50.0%) | 0 (0.0%) |
| 35 to 44 Years | 58 (63.0%) | 0 (0.0%) |
| 45 to 54 Years | 93 (83.8%) | 0 (0.0%) |
| 55 to 59 Years | 19 (70.4%) | 0 (0.0%) |
| 60 to 64 Years | 26 (50.0%) | 5 (19.2%) |
| 65 to 74 Years | 30 (36.1%) | 0 (0.0%) |
| 75 Years and over | 0 (0.0%) | 0 (0.0%) |
| Total | 270 (54.9%) | 9 (3.5%) |
Employment Status by Educational Attainment in Daggett County
According to labor force statistics for Daggett County, 69.1% of individuals (215) out of the total population between 25 and 64 years of age (311) are in the labor force, with 2.5% or 5 of them being unemployed. The group with the highest labor force participation rate are those with the educational attainment of less than high school, with 86.7% or 13 individuals in the labor force. Within the labor force, individuals with high school diploma education have the highest percentage of unemployment, with 7.5% or 5 of them being unemployed.
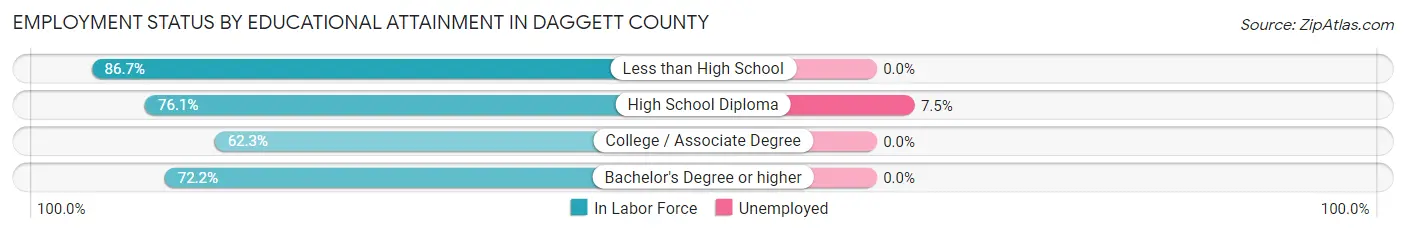
| Educational Attainment | In Labor Force | Unemployed |
| Less than High School | 13 (86.7%) | 0 (0.0%) |
| High School Diploma | 67 (76.1%) | 7 (7.5%) |
| College / Associate Degree | 96 (62.3%) | 0 (0.0%) |
| Bachelor's Degree or higher | 39 (72.2%) | 0 (0.0%) |
| Total | 215 (69.1%) | 8 (2.5%) |
Employment Occupations by Sex in Daggett County
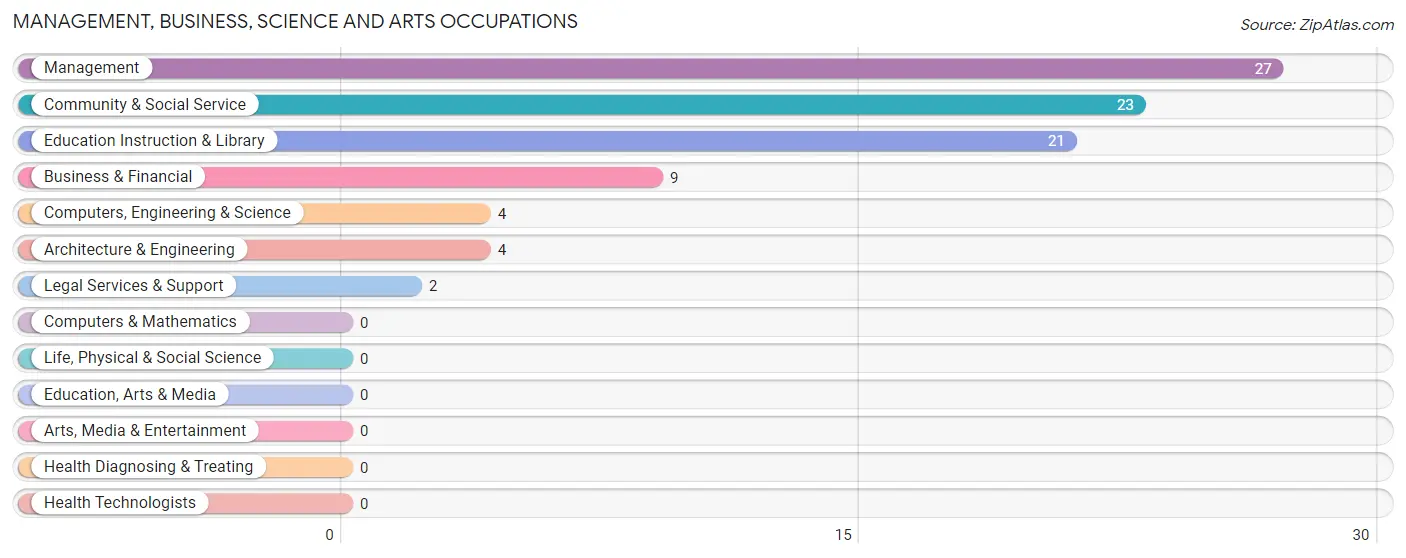
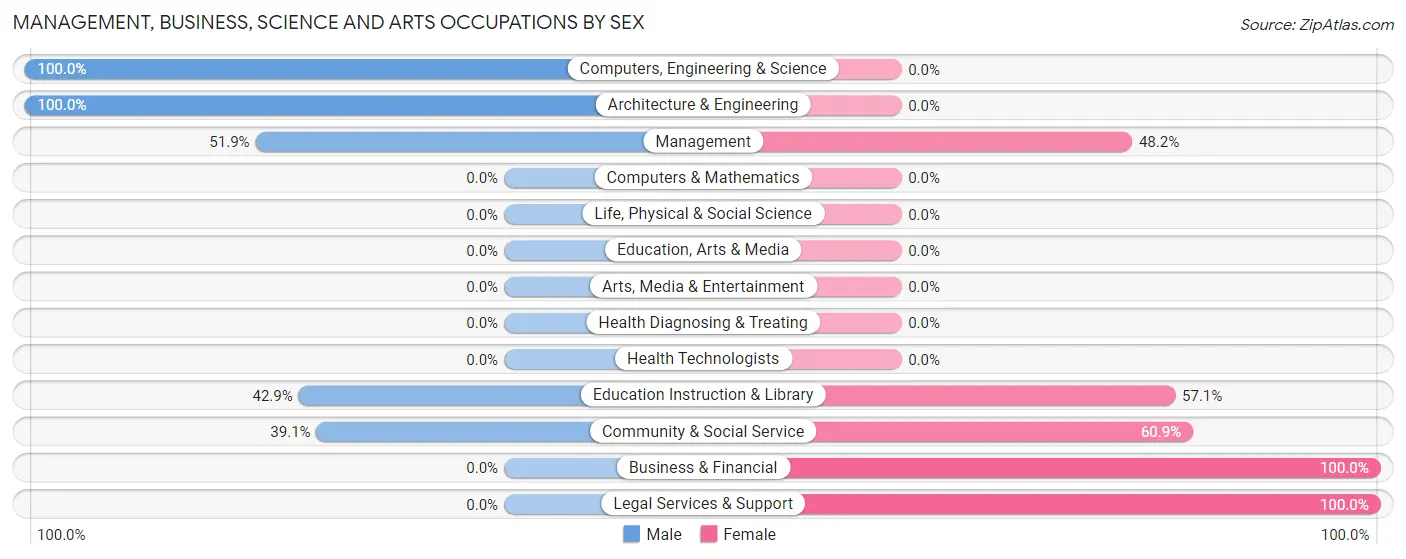
Management, Business, Science and Arts Occupations
The most common Management, Business, Science and Arts occupations in Daggett County are Management (27 | 10.8%), Community & Social Service (23 | 9.2%), Education Instruction & Library (21 | 8.4%), Business & Financial (9 | 3.6%), and Computers, Engineering & Science (4 | 1.6%).
Management, Business, Science and Arts Occupations by Sex
Within the Management, Business, Science and Arts occupations in Daggett County, the most male-oriented occupations are Computers, Engineering & Science (100.0%), Architecture & Engineering (100.0%), and Management (51.8%), while the most female-oriented occupations are Business & Financial (100.0%), Legal Services & Support (100.0%), and Community & Social Service (60.9%).
| Occupation | Male | Female |
| Management | 14 (51.8%) | 13 (48.1%) |
| Business & Financial | 0 (0.0%) | 9 (100.0%) |
| Computers, Engineering & Science | 4 (100.0%) | 0 (0.0%) |
| Computers & Mathematics | 0 (0.0%) | 0 (0.0%) |
| Architecture & Engineering | 4 (100.0%) | 0 (0.0%) |
| Life, Physical & Social Science | 0 (0.0%) | 0 (0.0%) |
| Community & Social Service | 9 (39.1%) | 14 (60.9%) |
| Education, Arts & Media | 0 (0.0%) | 0 (0.0%) |
| Legal Services & Support | 0 (0.0%) | 2 (100.0%) |
| Education Instruction & Library | 9 (42.9%) | 12 (57.1%) |
| Arts, Media & Entertainment | 0 (0.0%) | 0 (0.0%) |
| Health Diagnosing & Treating | 0 (0.0%) | 0 (0.0%) |
| Health Technologists | 0 (0.0%) | 0 (0.0%) |
| Total (Category) | 27 (42.9%) | 36 (57.1%) |
| Total (Overall) | 130 (52.2%) | 119 (47.8%) |
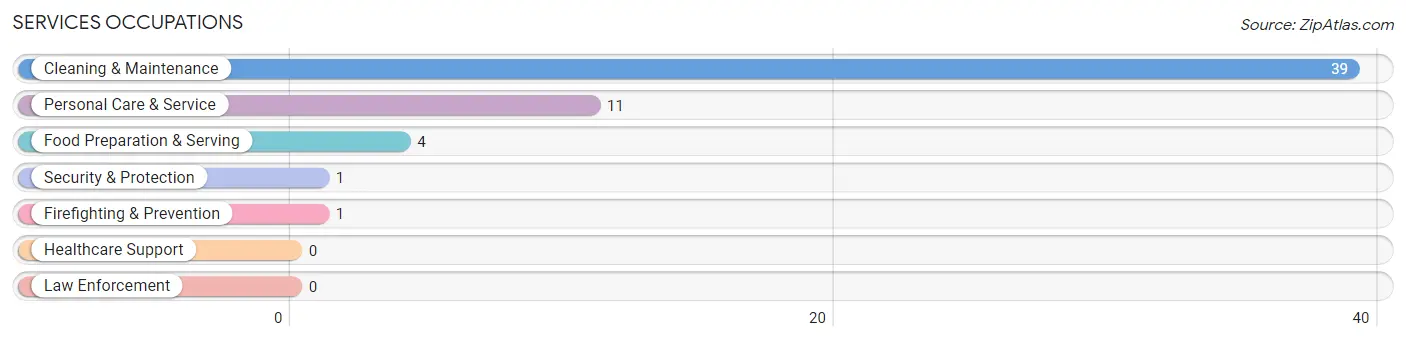
Services Occupations
The most common Services occupations in Daggett County are Cleaning & Maintenance (39 | 15.7%), Personal Care & Service (11 | 4.4%), Food Preparation & Serving (4 | 1.6%), Security & Protection (1 | 0.4%), and Firefighting & Prevention (1 | 0.4%).
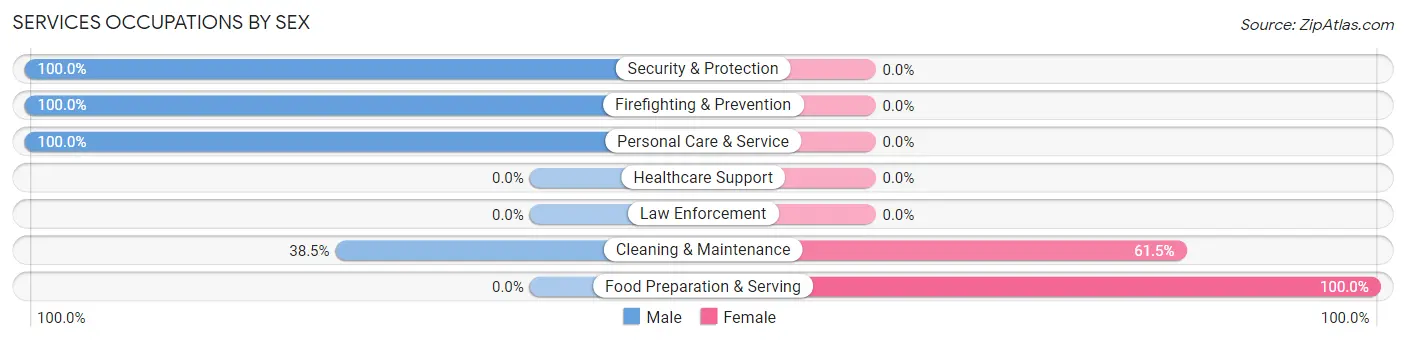
Services Occupations by Sex
Within the Services occupations in Daggett County, the most male-oriented occupations are Security & Protection (100.0%), Firefighting & Prevention (100.0%), and Personal Care & Service (100.0%), while the most female-oriented occupations are Food Preparation & Serving (100.0%), and Cleaning & Maintenance (61.5%).
| Occupation | Male | Female |
| Healthcare Support | 0 (0.0%) | 0 (0.0%) |
| Security & Protection | 1 (100.0%) | 0 (0.0%) |
| Firefighting & Prevention | 1 (100.0%) | 0 (0.0%) |
| Law Enforcement | 0 (0.0%) | 0 (0.0%) |
| Food Preparation & Serving | 0 (0.0%) | 4 (100.0%) |
| Cleaning & Maintenance | 15 (38.5%) | 24 (61.5%) |
| Personal Care & Service | 11 (100.0%) | 0 (0.0%) |
| Total (Category) | 27 (49.1%) | 28 (50.9%) |
| Total (Overall) | 130 (52.2%) | 119 (47.8%) |
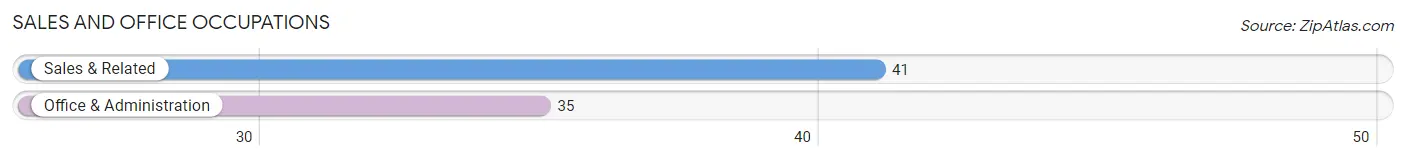
Sales and Office Occupations
The most common Sales and Office occupations in Daggett County are Sales & Related (41 | 16.5%), and Office & Administration (35 | 14.1%).
Sales and Office Occupations by Sex
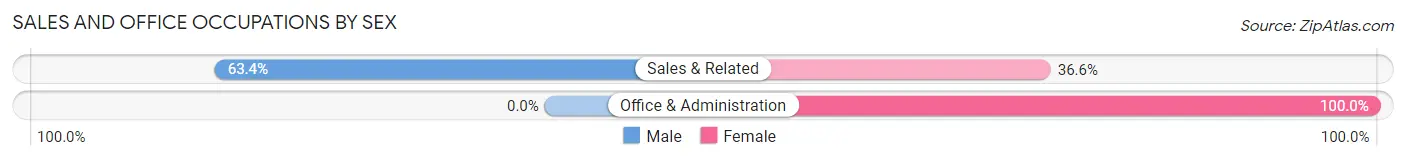
| Occupation | Male | Female |
| Sales & Related | 26 (63.4%) | 15 (36.6%) |
| Office & Administration | 0 (0.0%) | 35 (100.0%) |
| Total (Category) | 26 (34.2%) | 50 (65.8%) |
| Total (Overall) | 130 (52.2%) | 119 (47.8%) |
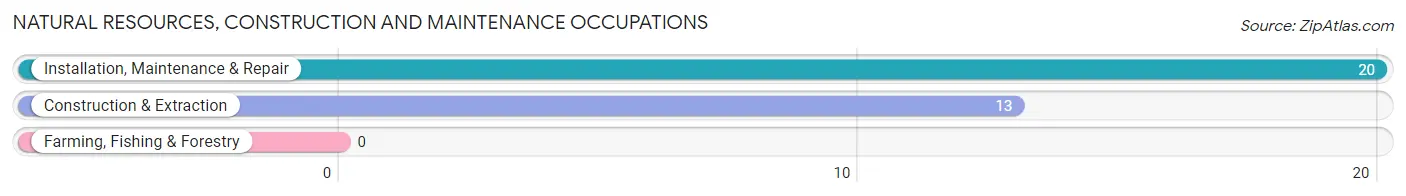
Natural Resources, Construction and Maintenance Occupations
The most common Natural Resources, Construction and Maintenance occupations in Daggett County are Installation, Maintenance & Repair (20 | 8.0%), and Construction & Extraction (13 | 5.2%).
Natural Resources, Construction and Maintenance Occupations by Sex
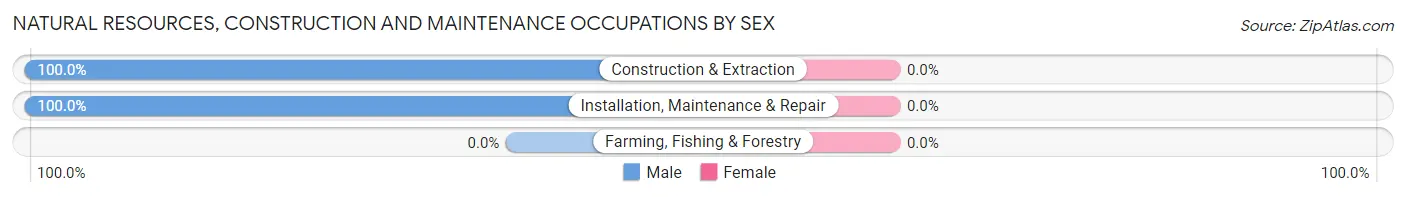
| Occupation | Male | Female |
| Farming, Fishing & Forestry | 0 (0.0%) | 0 (0.0%) |
| Construction & Extraction | 13 (100.0%) | 0 (0.0%) |
| Installation, Maintenance & Repair | 20 (100.0%) | 0 (0.0%) |
| Total (Category) | 33 (100.0%) | 0 (0.0%) |
| Total (Overall) | 130 (52.2%) | 119 (47.8%) |
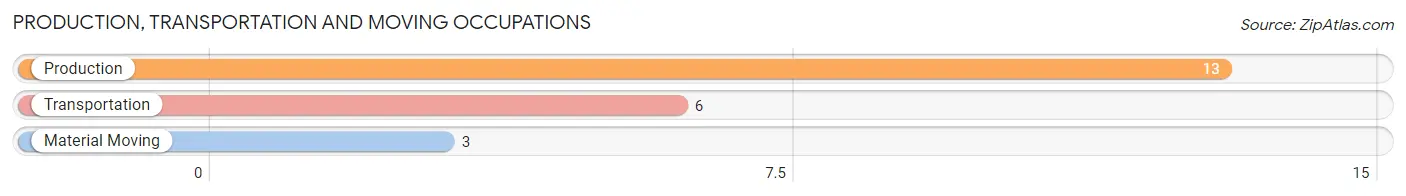
Production, Transportation and Moving Occupations
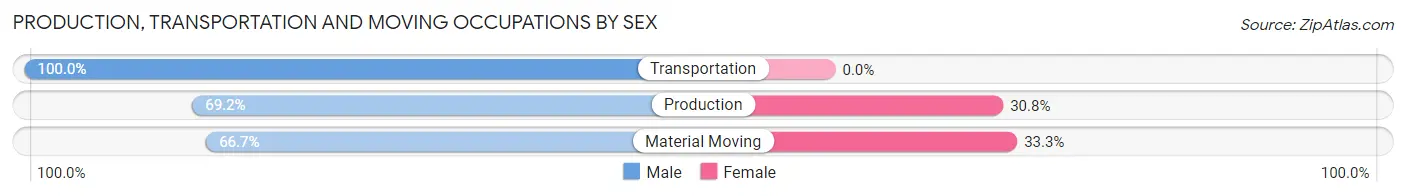
The most common Production, Transportation and Moving occupations in Daggett County are Production (13 | 5.2%), Transportation (6 | 2.4%), and Material Moving (3 | 1.2%).
Production, Transportation and Moving Occupations by Sex
| Occupation | Male | Female |
| Production | 9 (69.2%) | 4 (30.8%) |
| Transportation | 6 (100.0%) | 0 (0.0%) |
| Material Moving | 2 (66.7%) | 1 (33.3%) |
| Total (Category) | 17 (77.3%) | 5 (22.7%) |
| Total (Overall) | 130 (52.2%) | 119 (47.8%) |
Employment Industries by Sex in Daggett County
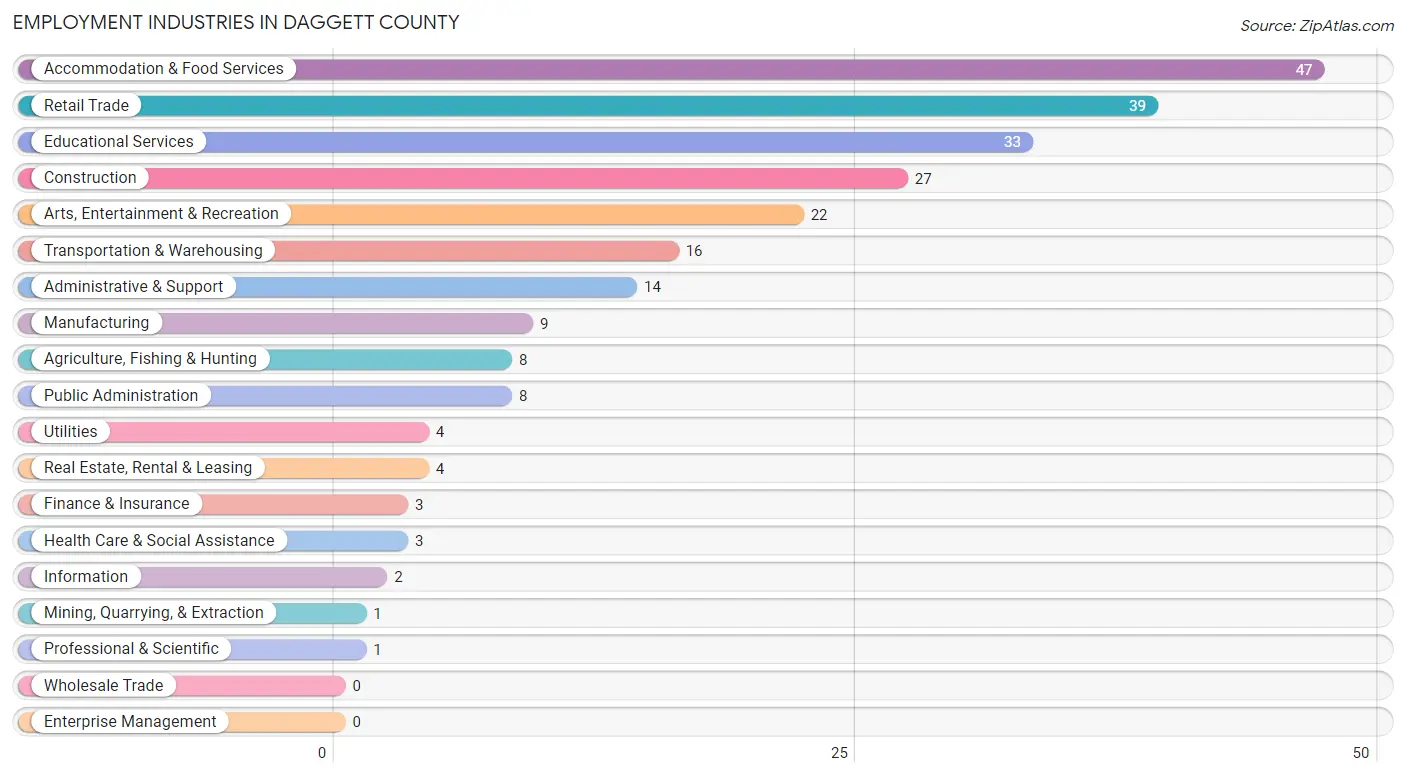
Employment Industries in Daggett County
The major employment industries in Daggett County include Accommodation & Food Services (47 | 18.9%), Retail Trade (39 | 15.7%), Educational Services (33 | 13.3%), Construction (27 | 10.8%), and Arts, Entertainment & Recreation (22 | 8.8%).
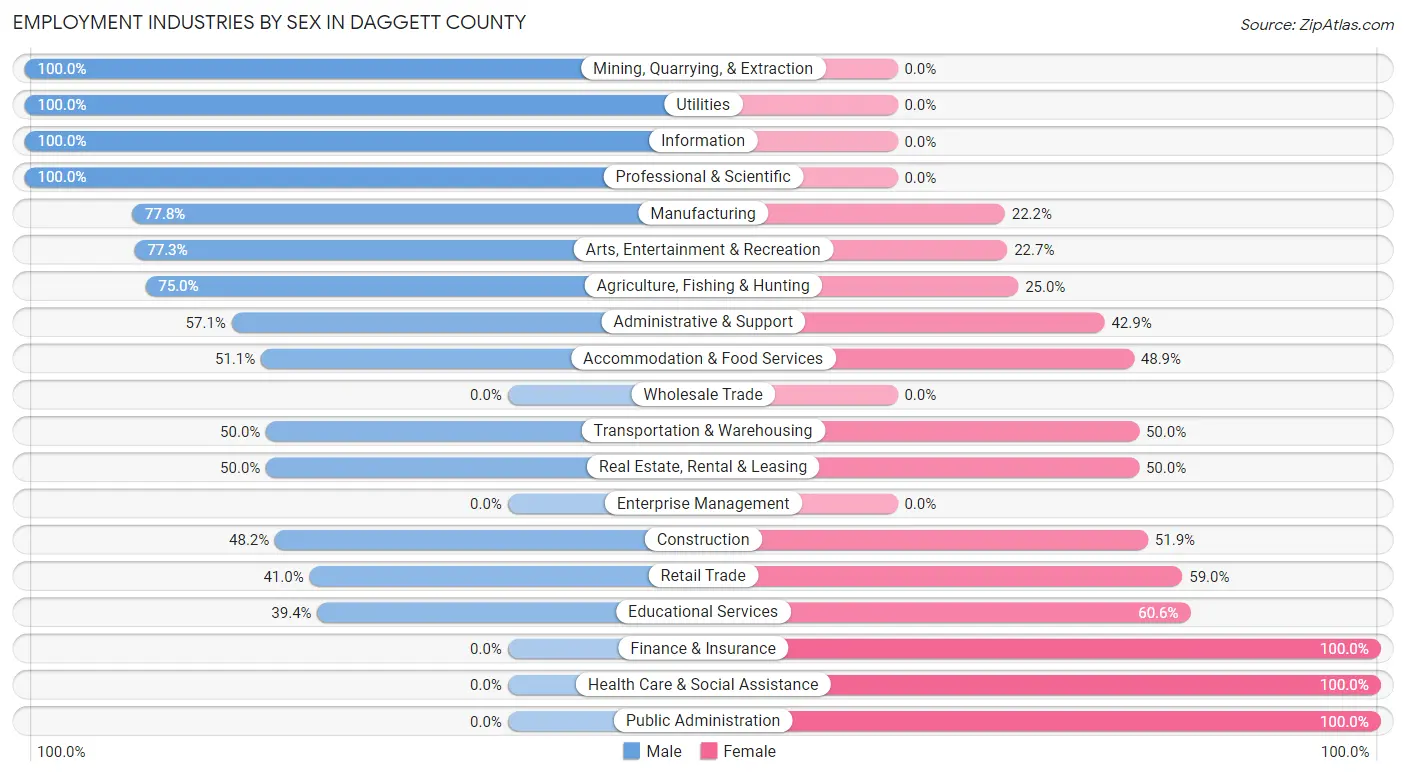
Employment Industries by Sex in Daggett County
The Daggett County industries that see more men than women are Mining, Quarrying, & Extraction (100.0%), Utilities (100.0%), and Information (100.0%), whereas the industries that tend to have a higher number of women are Finance & Insurance (100.0%), Health Care & Social Assistance (100.0%), and Public Administration (100.0%).
| Industry | Male | Female |
| Agriculture, Fishing & Hunting | 6 (75.0%) | 2 (25.0%) |
| Mining, Quarrying, & Extraction | 1 (100.0%) | 0 (0.0%) |
| Construction | 13 (48.1%) | 14 (51.8%) |
| Manufacturing | 7 (77.8%) | 2 (22.2%) |
| Wholesale Trade | 0 (0.0%) | 0 (0.0%) |
| Retail Trade | 16 (41.0%) | 23 (59.0%) |
| Transportation & Warehousing | 8 (50.0%) | 8 (50.0%) |
| Utilities | 4 (100.0%) | 0 (0.0%) |
| Information | 2 (100.0%) | 0 (0.0%) |
| Finance & Insurance | 0 (0.0%) | 3 (100.0%) |
| Real Estate, Rental & Leasing | 2 (50.0%) | 2 (50.0%) |
| Professional & Scientific | 1 (100.0%) | 0 (0.0%) |
| Enterprise Management | 0 (0.0%) | 0 (0.0%) |
| Administrative & Support | 8 (57.1%) | 6 (42.9%) |
| Educational Services | 13 (39.4%) | 20 (60.6%) |
| Health Care & Social Assistance | 0 (0.0%) | 3 (100.0%) |
| Arts, Entertainment & Recreation | 17 (77.3%) | 5 (22.7%) |
| Accommodation & Food Services | 24 (51.1%) | 23 (48.9%) |
| Public Administration | 0 (0.0%) | 8 (100.0%) |
| Total | 130 (52.2%) | 119 (47.8%) |
Education in Daggett County
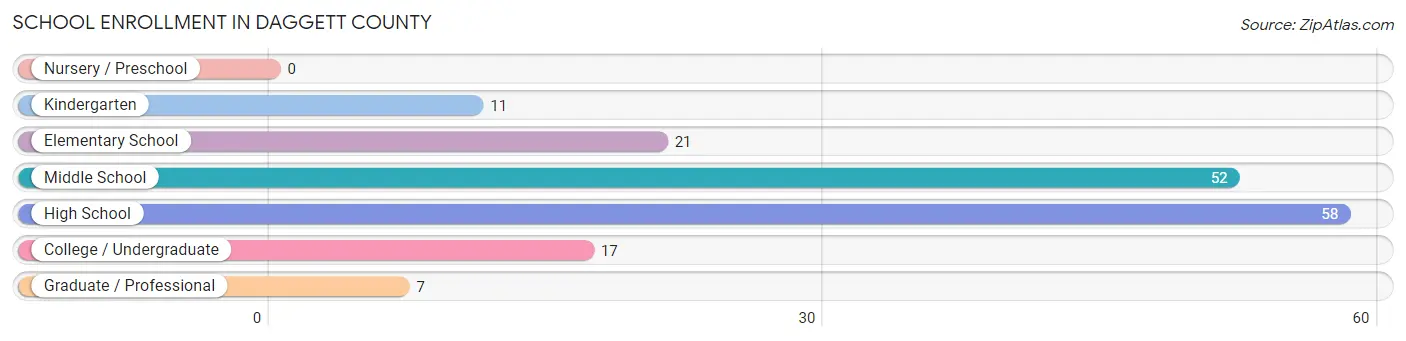
School Enrollment in Daggett County
The most common levels of schooling among the 166 students in Daggett County are high school (58 | 34.9%), middle school (52 | 31.3%), and elementary school (21 | 12.7%).
| School Level | # Students | % Students |
| Nursery / Preschool | 0 | 0.0% |
| Kindergarten | 11 | 6.6% |
| Elementary School | 21 | 12.7% |
| Middle School | 52 | 31.3% |
| High School | 58 | 34.9% |
| College / Undergraduate | 17 | 10.2% |
| Graduate / Professional | 7 | 4.2% |
| Total | 166 | 100.0% |
School Enrollment by Age by Funding Source in Daggett County
Out of a total of 166 students who are enrolled in schools in Daggett County, 5 (3.0%) attend a private institution, while the remaining 161 (97.0%) are enrolled in public schools. The age group of 20 to 24 year olds has the highest likelihood of being enrolled in private schools, with 2 (50.0% in the age bracket) enrolled. Conversely, the age group of 5 to 9 year old has the lowest likelihood of being enrolled in a private school, with 32 (100.0% in the age bracket) attending a public institution.
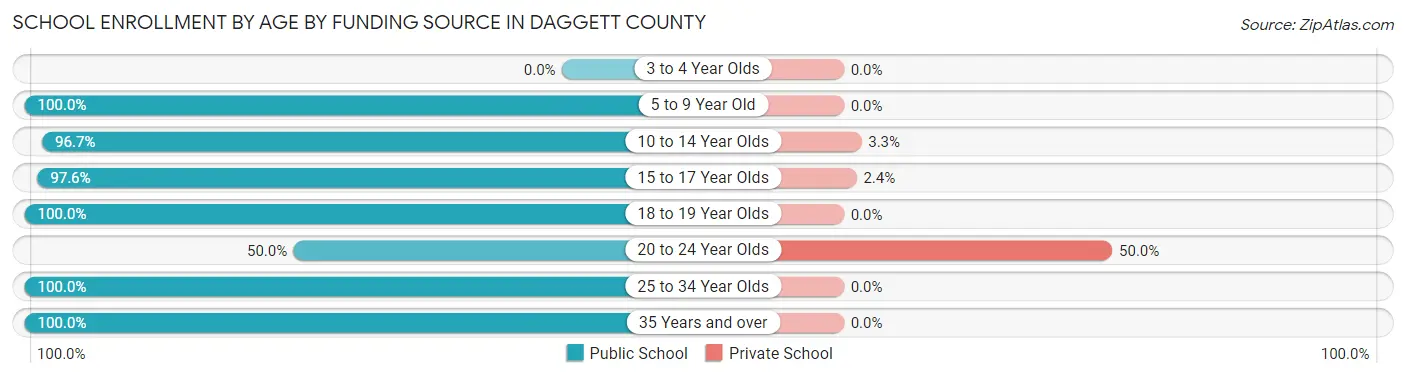
| Age Bracket | Public School | Private School |
| 3 to 4 Year Olds | 0 (0.0%) | 0 (0.0%) |
| 5 to 9 Year Old | 32 (100.0%) | 0 (0.0%) |
| 10 to 14 Year Olds | 59 (96.7%) | 2 (3.3%) |
| 15 to 17 Year Olds | 41 (97.6%) | 1 (2.4%) |
| 18 to 19 Year Olds | 9 (100.0%) | 0 (0.0%) |
| 20 to 24 Year Olds | 2 (50.0%) | 2 (50.0%) |
| 25 to 34 Year Olds | 2 (100.0%) | 0 (0.0%) |
| 35 Years and over | 16 (100.0%) | 0 (0.0%) |
| Total | 161 (97.0%) | 5 (3.0%) |
Educational Attainment by Field of Study in Daggett County
Education (34 | 37.4%), communications (11 | 12.1%), science & technology (10 | 11.0%), business (8 | 8.8%), and bio, nature & agricultural (7 | 7.7%) are the most common fields of study among 91 individuals in Daggett County who have obtained a bachelor's degree or higher.
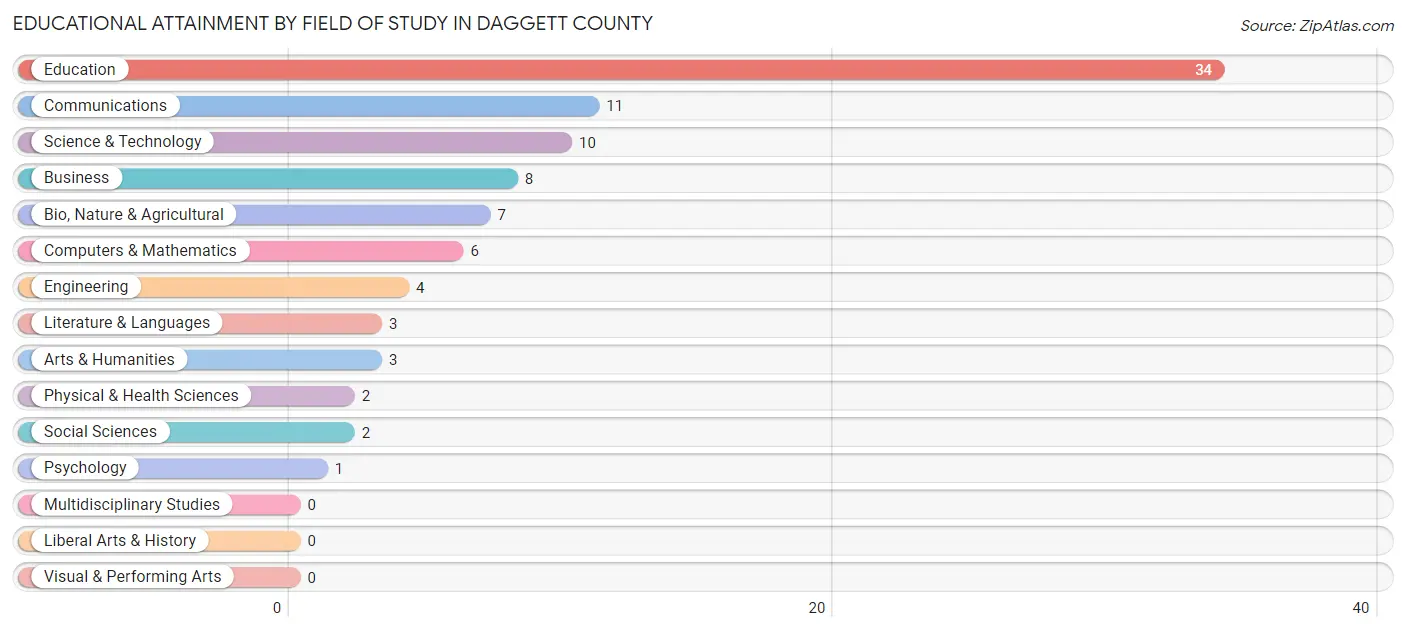
| Field of Study | # Graduates | % Graduates |
| Computers & Mathematics | 6 | 6.6% |
| Bio, Nature & Agricultural | 7 | 7.7% |
| Physical & Health Sciences | 2 | 2.2% |
| Psychology | 1 | 1.1% |
| Social Sciences | 2 | 2.2% |
| Engineering | 4 | 4.4% |
| Multidisciplinary Studies | 0 | 0.0% |
| Science & Technology | 10 | 11.0% |
| Business | 8 | 8.8% |
| Education | 34 | 37.4% |
| Literature & Languages | 3 | 3.3% |
| Liberal Arts & History | 0 | 0.0% |
| Visual & Performing Arts | 0 | 0.0% |
| Communications | 11 | 12.1% |
| Arts & Humanities | 3 | 3.3% |
| Total | 91 | 100.0% |
Transportation & Commute in Daggett County
Vehicle Availability by Sex in Daggett County
The most prevalent vehicle ownership categories in Daggett County are males with 3 vehicles (51, accounting for 37.8%) and females with 3 vehicles (50, making up 43.6%).
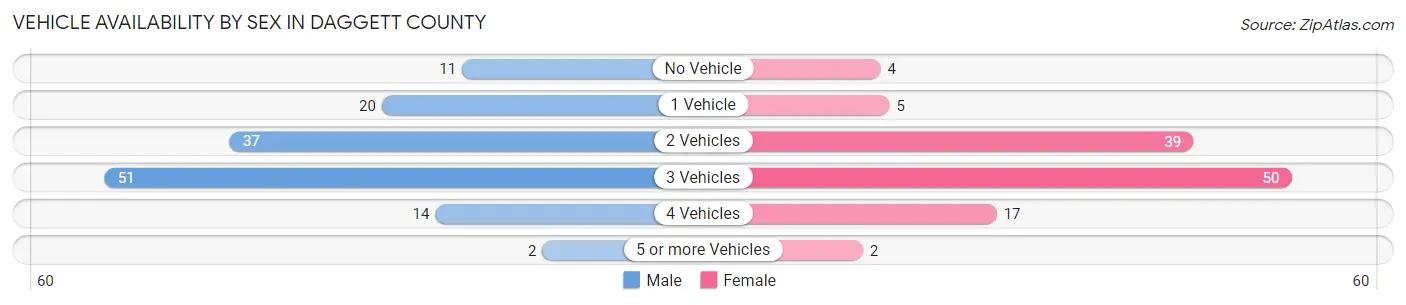
| Vehicles Available | Male | Female |
| No Vehicle | 11 (8.2%) | 4 (3.4%) |
| 1 Vehicle | 20 (14.8%) | 5 (4.3%) |
| 2 Vehicles | 37 (27.4%) | 39 (33.3%) |
| 3 Vehicles | 51 (37.8%) | 50 (42.7%) |
| 4 Vehicles | 14 (10.4%) | 17 (14.5%) |
| 5 or more Vehicles | 2 (1.5%) | 2 (1.7%) |
| Total | 135 (100.0%) | 117 (100.0%) |
Commute Time in Daggett County
The most frequently occuring commute durations in Daggett County are 5 to 9 minutes (90 commuters, 37.5%), less than 5 minutes (64 commuters, 26.7%), and 10 to 14 minutes (24 commuters, 10.0%).
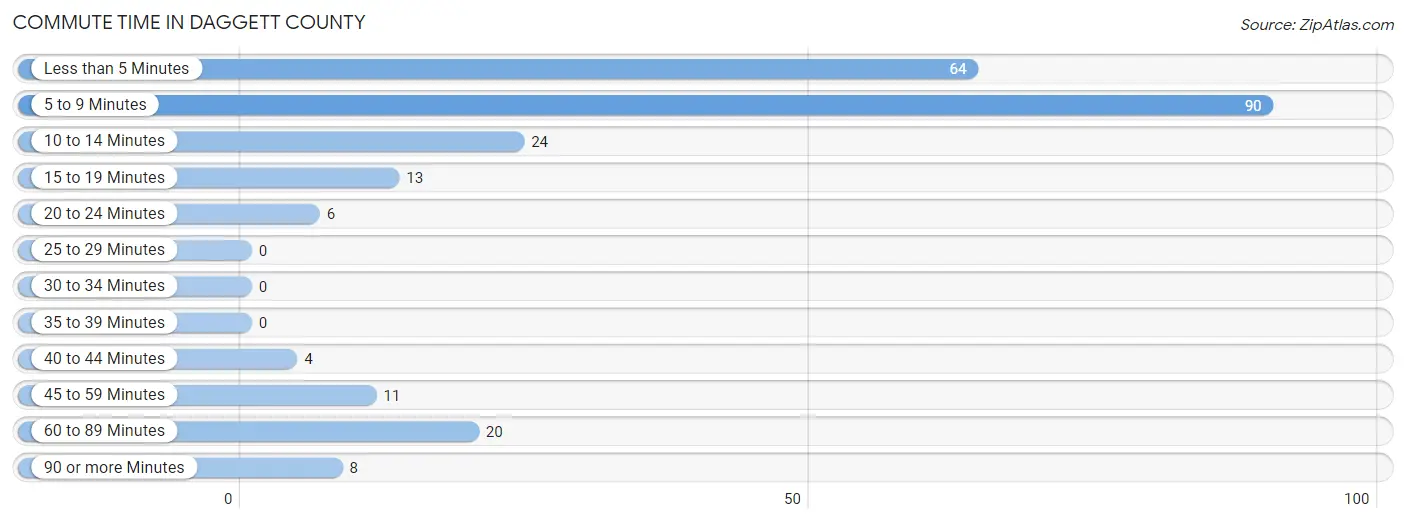
| Commute Time | # Commuters | % Commuters |
| Less than 5 Minutes | 64 | 26.7% |
| 5 to 9 Minutes | 90 | 37.5% |
| 10 to 14 Minutes | 24 | 10.0% |
| 15 to 19 Minutes | 13 | 5.4% |
| 20 to 24 Minutes | 6 | 2.5% |
| 25 to 29 Minutes | 0 | 0.0% |
| 30 to 34 Minutes | 0 | 0.0% |
| 35 to 39 Minutes | 0 | 0.0% |
| 40 to 44 Minutes | 4 | 1.7% |
| 45 to 59 Minutes | 11 | 4.6% |
| 60 to 89 Minutes | 20 | 8.3% |
| 90 or more Minutes | 8 | 3.3% |
Commute Time by Sex in Daggett County
The most common commute times in Daggett County are 5 to 9 minutes (47 commuters, 35.1%) for males and 5 to 9 minutes (43 commuters, 40.6%) for females.
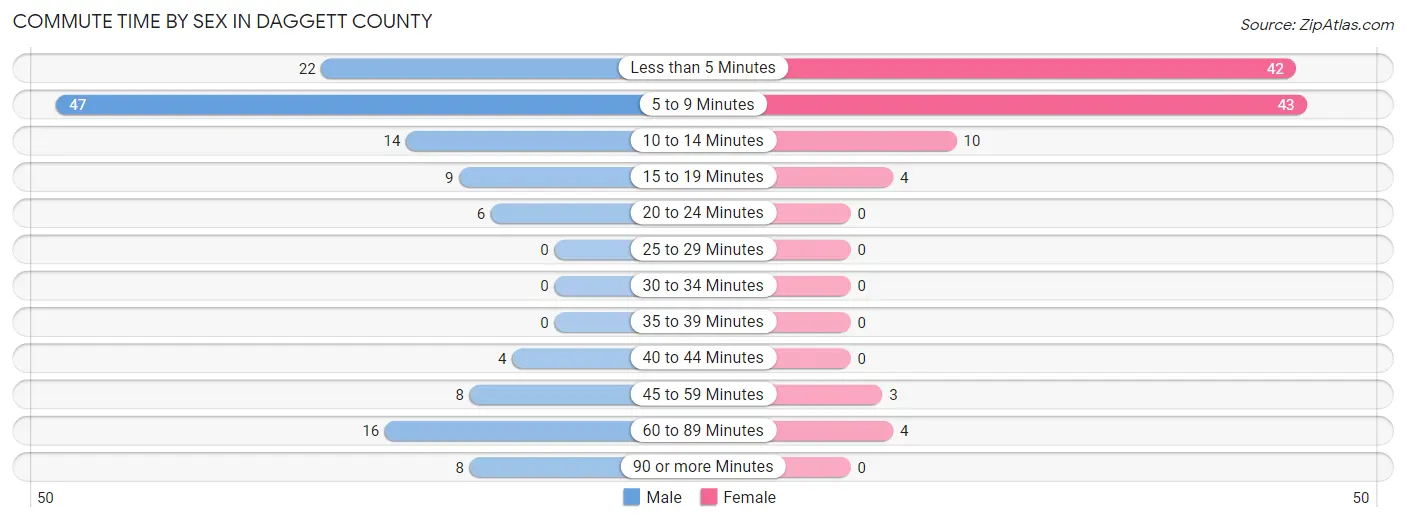
| Commute Time | Male | Female |
| Less than 5 Minutes | 22 (16.4%) | 42 (39.6%) |
| 5 to 9 Minutes | 47 (35.1%) | 43 (40.6%) |
| 10 to 14 Minutes | 14 (10.4%) | 10 (9.4%) |
| 15 to 19 Minutes | 9 (6.7%) | 4 (3.8%) |
| 20 to 24 Minutes | 6 (4.5%) | 0 (0.0%) |
| 25 to 29 Minutes | 0 (0.0%) | 0 (0.0%) |
| 30 to 34 Minutes | 0 (0.0%) | 0 (0.0%) |
| 35 to 39 Minutes | 0 (0.0%) | 0 (0.0%) |
| 40 to 44 Minutes | 4 (3.0%) | 0 (0.0%) |
| 45 to 59 Minutes | 8 (6.0%) | 3 (2.8%) |
| 60 to 89 Minutes | 16 (11.9%) | 4 (3.8%) |
| 90 or more Minutes | 8 (6.0%) | 0 (0.0%) |
Time of Departure to Work by Sex in Daggett County
The most frequent times of departure to work in Daggett County are 5:00 AM to 5:29 AM (34, 25.4%) for males and 7:30 AM to 7:59 AM (41, 38.7%) for females.
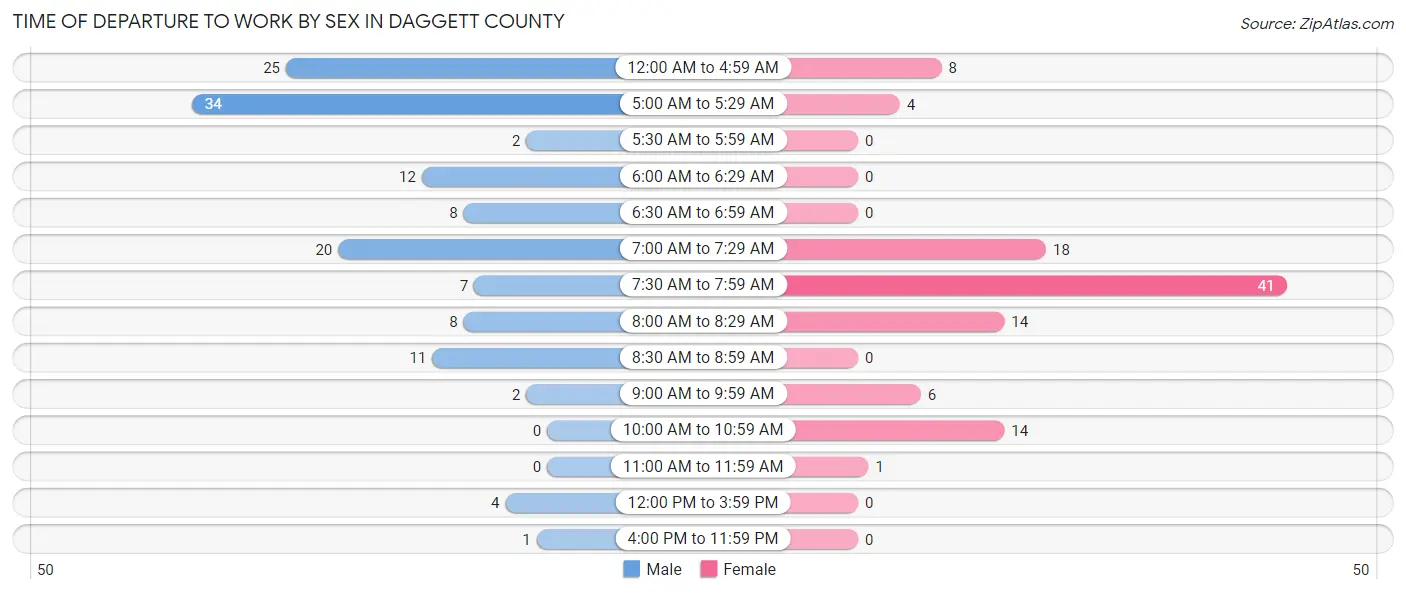
| Time of Departure | Male | Female |
| 12:00 AM to 4:59 AM | 25 (18.7%) | 8 (7.5%) |
| 5:00 AM to 5:29 AM | 34 (25.4%) | 4 (3.8%) |
| 5:30 AM to 5:59 AM | 2 (1.5%) | 0 (0.0%) |
| 6:00 AM to 6:29 AM | 12 (9.0%) | 0 (0.0%) |
| 6:30 AM to 6:59 AM | 8 (6.0%) | 0 (0.0%) |
| 7:00 AM to 7:29 AM | 20 (14.9%) | 18 (17.0%) |
| 7:30 AM to 7:59 AM | 7 (5.2%) | 41 (38.7%) |
| 8:00 AM to 8:29 AM | 8 (6.0%) | 14 (13.2%) |
| 8:30 AM to 8:59 AM | 11 (8.2%) | 0 (0.0%) |
| 9:00 AM to 9:59 AM | 2 (1.5%) | 6 (5.7%) |
| 10:00 AM to 10:59 AM | 0 (0.0%) | 14 (13.2%) |
| 11:00 AM to 11:59 AM | 0 (0.0%) | 1 (0.9%) |
| 12:00 PM to 3:59 PM | 4 (3.0%) | 0 (0.0%) |
| 4:00 PM to 11:59 PM | 1 (0.7%) | 0 (0.0%) |
| Total | 134 (100.0%) | 106 (100.0%) |
Housing Occupancy in Daggett County
Occupancy by Ownership in Daggett County
Of the total 235 dwellings in Daggett County, owner-occupied units account for 197 (83.8%), while renter-occupied units make up 38 (16.2%).
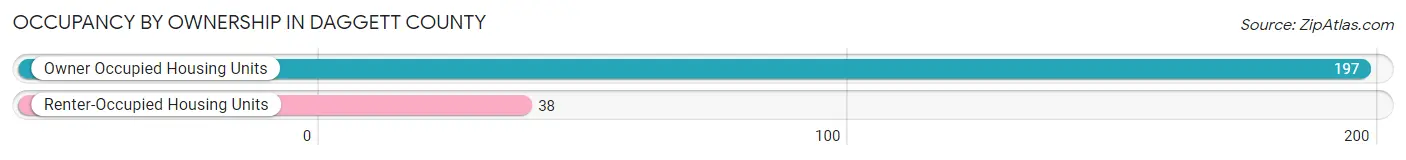
| Occupancy | # Housing Units | % Housing Units |
| Owner Occupied Housing Units | 197 | 83.8% |
| Renter-Occupied Housing Units | 38 | 16.2% |
| Total Occupied Housing Units | 235 | 100.0% |
Occupancy by Household Size in Daggett County
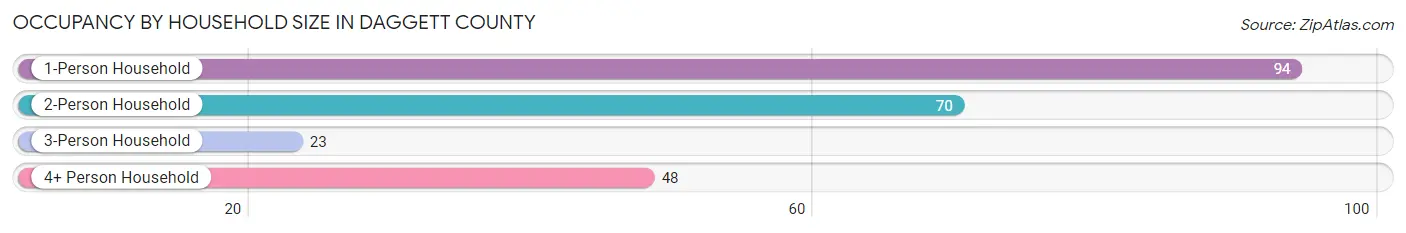
| Household Size | # Housing Units | % Housing Units |
| 1-Person Household | 94 | 40.0% |
| 2-Person Household | 70 | 29.8% |
| 3-Person Household | 23 | 9.8% |
| 4+ Person Household | 48 | 20.4% |
| Total Housing Units | 235 | 100.0% |
Occupancy by Ownership by Household Size in Daggett County
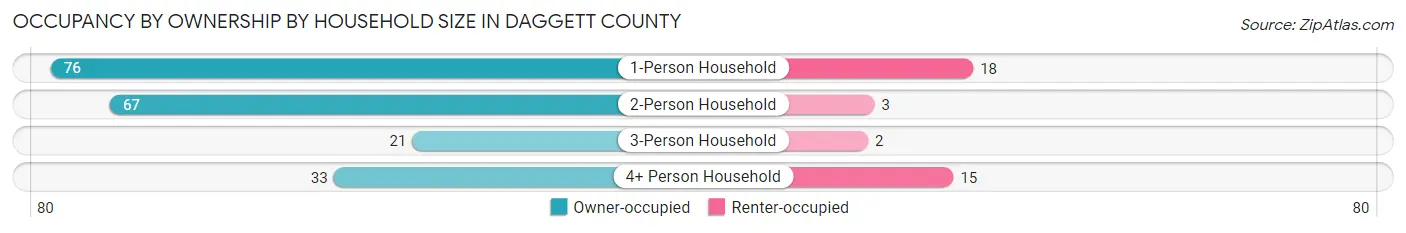
| Household Size | Owner-occupied | Renter-occupied |
| 1-Person Household | 76 (80.8%) | 18 (19.2%) |
| 2-Person Household | 67 (95.7%) | 3 (4.3%) |
| 3-Person Household | 21 (91.3%) | 2 (8.7%) |
| 4+ Person Household | 33 (68.8%) | 15 (31.2%) |
| Total Housing Units | 197 (83.8%) | 38 (16.2%) |
Occupancy by Educational Attainment in Daggett County
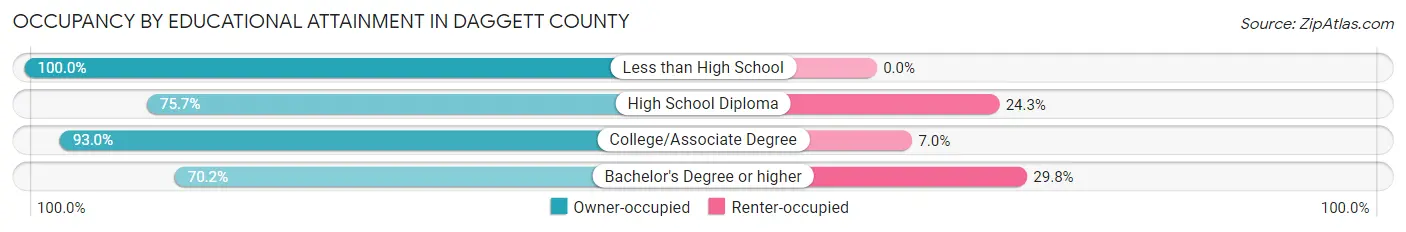
| Household Size | Owner-occupied | Renter-occupied |
| Less than High School | 18 (100.0%) | 0 (0.0%) |
| High School Diploma | 53 (75.7%) | 17 (24.3%) |
| College/Associate Degree | 93 (93.0%) | 7 (7.0%) |
| Bachelor's Degree or higher | 33 (70.2%) | 14 (29.8%) |
Occupancy by Age of Householder in Daggett County
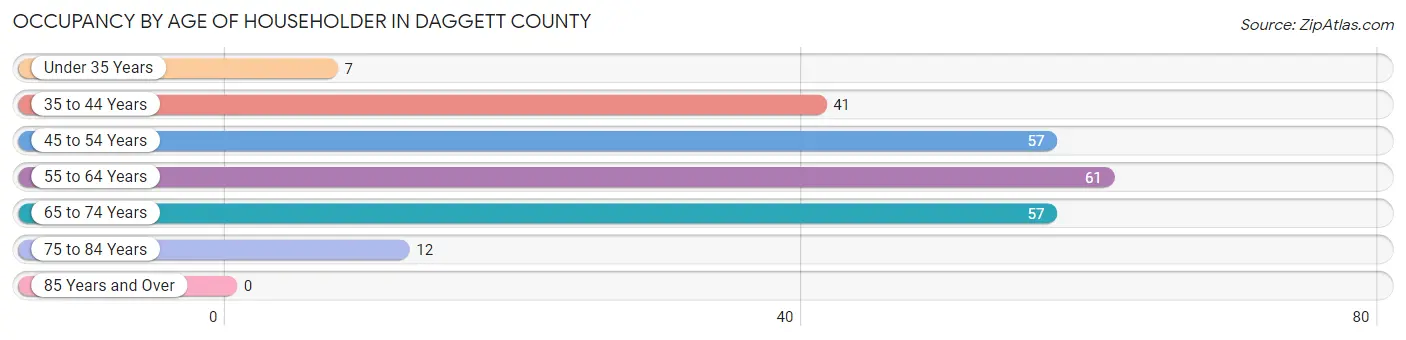
| Age Bracket | # Households | % Households |
| Under 35 Years | 7 | 3.0% |
| 35 to 44 Years | 41 | 17.4% |
| 45 to 54 Years | 57 | 24.3% |
| 55 to 64 Years | 61 | 26.0% |
| 65 to 74 Years | 57 | 24.3% |
| 75 to 84 Years | 12 | 5.1% |
| 85 Years and Over | 0 | 0.0% |
| Total | 235 | 100.0% |
Housing Finances in Daggett County
Median Income by Occupancy in Daggett County
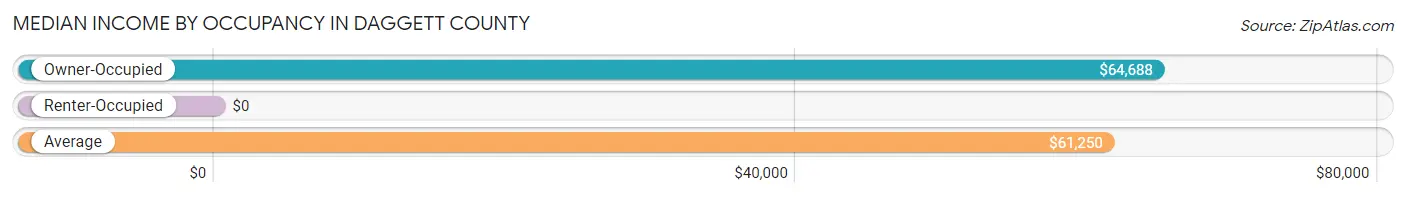
| Occupancy Type | # Households | Median Income |
| Owner-Occupied | 197 (83.8%) | $64,688 |
| Renter-Occupied | 38 (16.2%) | $0 |
| Average | 235 (100.0%) | $61,250 |
Occupancy by Householder Income Bracket in Daggett County
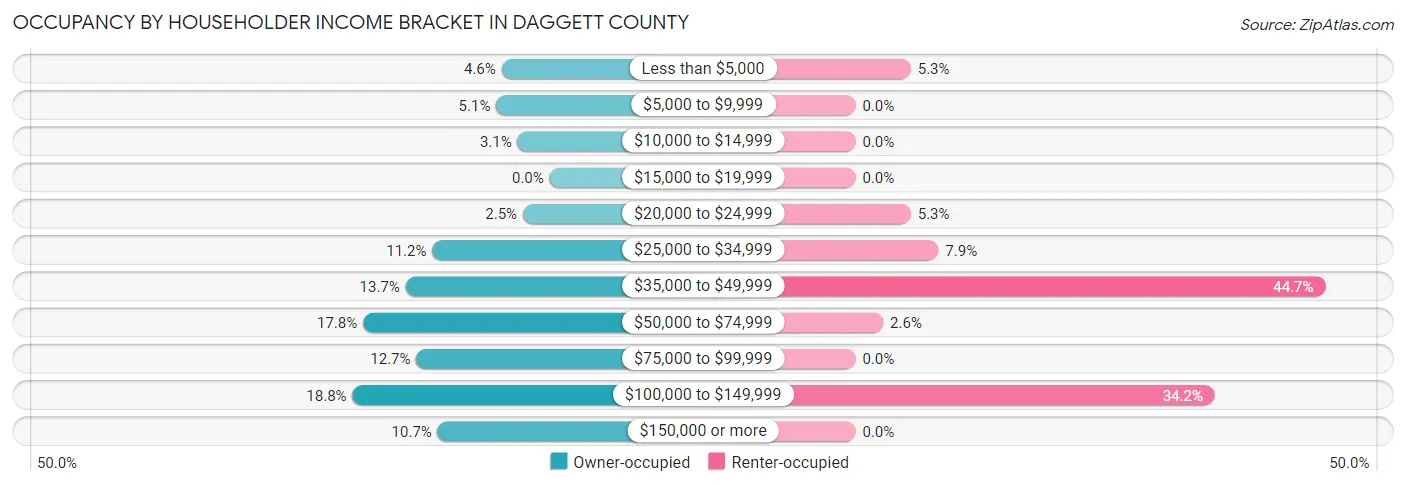
| Income Bracket | Owner-occupied | Renter-occupied |
| Less than $5,000 | 9 (4.6%) | 2 (5.3%) |
| $5,000 to $9,999 | 10 (5.1%) | 0 (0.0%) |
| $10,000 to $14,999 | 6 (3.0%) | 0 (0.0%) |
| $15,000 to $19,999 | 0 (0.0%) | 0 (0.0%) |
| $20,000 to $24,999 | 5 (2.5%) | 2 (5.3%) |
| $25,000 to $34,999 | 22 (11.2%) | 3 (7.9%) |
| $35,000 to $49,999 | 27 (13.7%) | 17 (44.7%) |
| $50,000 to $74,999 | 35 (17.8%) | 1 (2.6%) |
| $75,000 to $99,999 | 25 (12.7%) | 0 (0.0%) |
| $100,000 to $149,999 | 37 (18.8%) | 13 (34.2%) |
| $150,000 or more | 21 (10.7%) | 0 (0.0%) |
| Total | 197 (100.0%) | 38 (100.0%) |
Monthly Housing Cost Tiers in Daggett County
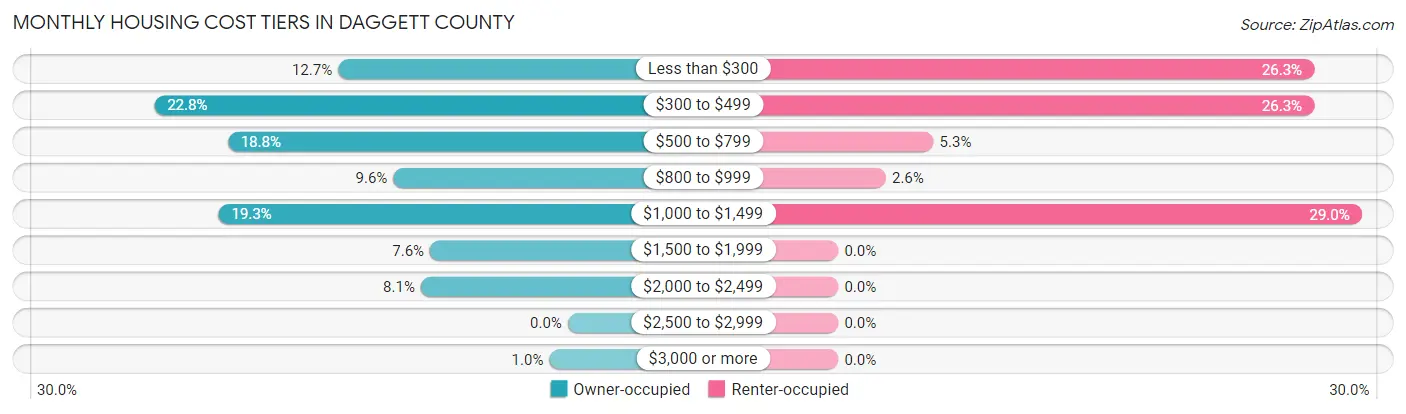
| Monthly Cost | Owner-occupied | Renter-occupied |
| Less than $300 | 25 (12.7%) | 10 (26.3%) |
| $300 to $499 | 45 (22.8%) | 10 (26.3%) |
| $500 to $799 | 37 (18.8%) | 2 (5.3%) |
| $800 to $999 | 19 (9.6%) | 1 (2.6%) |
| $1,000 to $1,499 | 38 (19.3%) | 11 (28.9%) |
| $1,500 to $1,999 | 15 (7.6%) | 0 (0.0%) |
| $2,000 to $2,499 | 16 (8.1%) | 0 (0.0%) |
| $2,500 to $2,999 | 0 (0.0%) | 0 (0.0%) |
| $3,000 or more | 2 (1.0%) | 0 (0.0%) |
| Total | 197 (100.0%) | 38 (100.0%) |
Physical Housing Characteristics in Daggett County
Housing Structures in Daggett County
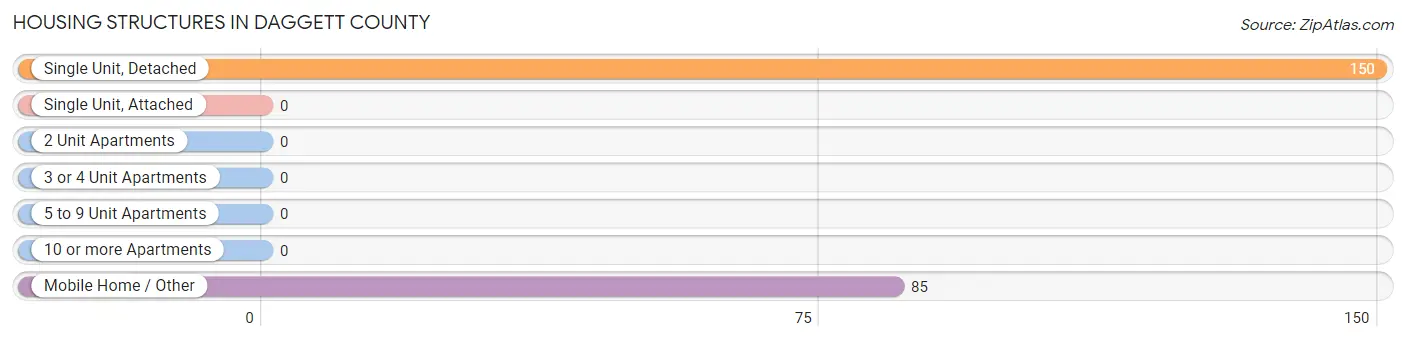
| Structure Type | # Housing Units | % Housing Units |
| Single Unit, Detached | 150 | 63.8% |
| Single Unit, Attached | 0 | 0.0% |
| 2 Unit Apartments | 0 | 0.0% |
| 3 or 4 Unit Apartments | 0 | 0.0% |
| 5 to 9 Unit Apartments | 0 | 0.0% |
| 10 or more Apartments | 0 | 0.0% |
| Mobile Home / Other | 85 | 36.2% |
| Total | 235 | 100.0% |
Housing Structures by Occupancy in Daggett County
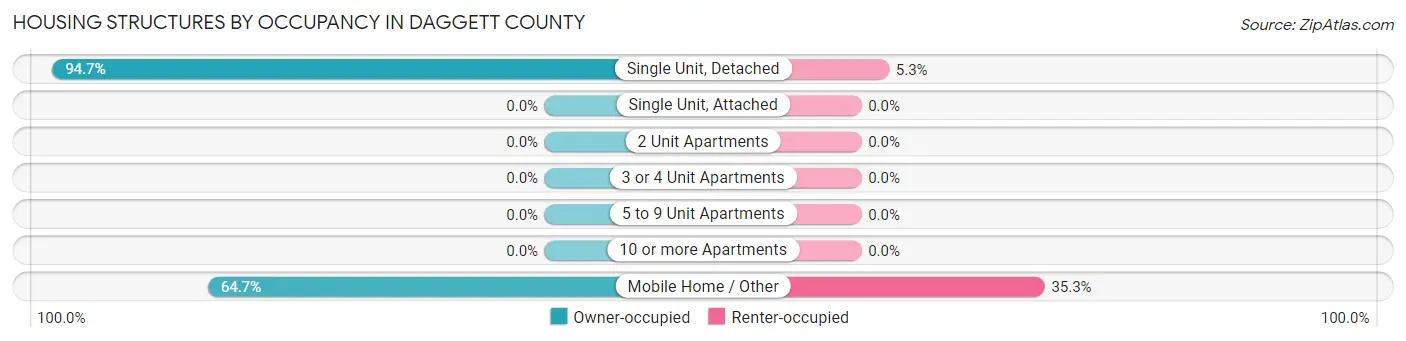
| Structure Type | Owner-occupied | Renter-occupied |
| Single Unit, Detached | 142 (94.7%) | 8 (5.3%) |
| Single Unit, Attached | 0 (0.0%) | 0 (0.0%) |
| 2 Unit Apartments | 0 (0.0%) | 0 (0.0%) |
| 3 or 4 Unit Apartments | 0 (0.0%) | 0 (0.0%) |
| 5 to 9 Unit Apartments | 0 (0.0%) | 0 (0.0%) |
| 10 or more Apartments | 0 (0.0%) | 0 (0.0%) |
| Mobile Home / Other | 55 (64.7%) | 30 (35.3%) |
| Total | 197 (83.8%) | 38 (16.2%) |
Housing Structures by Number of Rooms in Daggett County
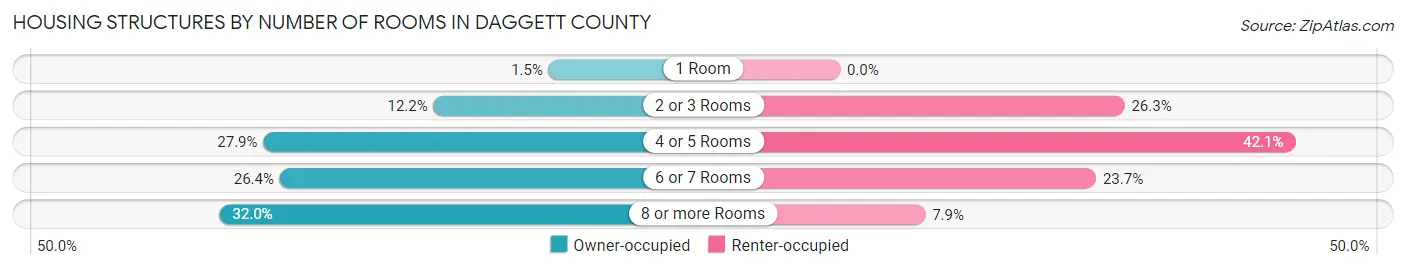
| Number of Rooms | Owner-occupied | Renter-occupied |
| 1 Room | 3 (1.5%) | 0 (0.0%) |
| 2 or 3 Rooms | 24 (12.2%) | 10 (26.3%) |
| 4 or 5 Rooms | 55 (27.9%) | 16 (42.1%) |
| 6 or 7 Rooms | 52 (26.4%) | 9 (23.7%) |
| 8 or more Rooms | 63 (32.0%) | 3 (7.9%) |
| Total | 197 (100.0%) | 38 (100.0%) |
Housing Structure by Heating Type in Daggett County
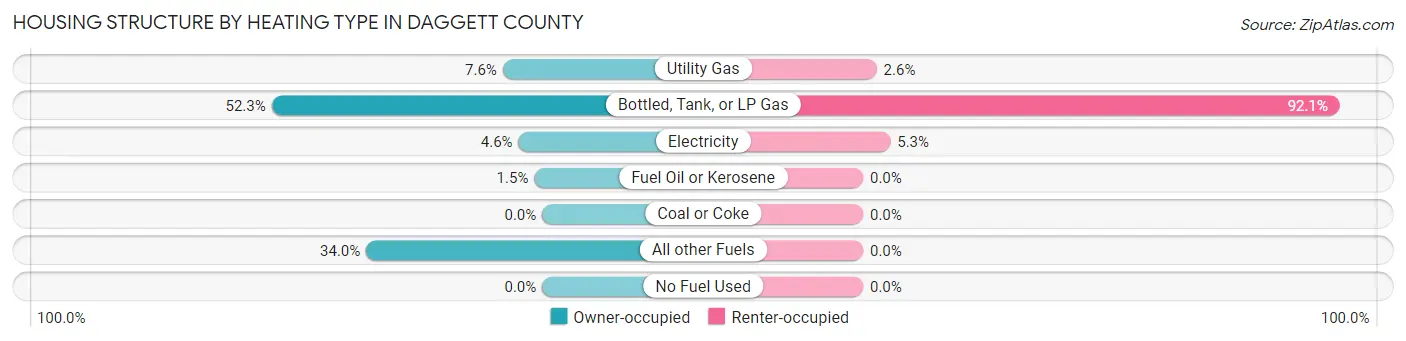
| Heating Type | Owner-occupied | Renter-occupied |
| Utility Gas | 15 (7.6%) | 1 (2.6%) |
| Bottled, Tank, or LP Gas | 103 (52.3%) | 35 (92.1%) |
| Electricity | 9 (4.6%) | 2 (5.3%) |
| Fuel Oil or Kerosene | 3 (1.5%) | 0 (0.0%) |
| Coal or Coke | 0 (0.0%) | 0 (0.0%) |
| All other Fuels | 67 (34.0%) | 0 (0.0%) |
| No Fuel Used | 0 (0.0%) | 0 (0.0%) |
| Total | 197 (100.0%) | 38 (100.0%) |
Household Vehicle Usage in Daggett County
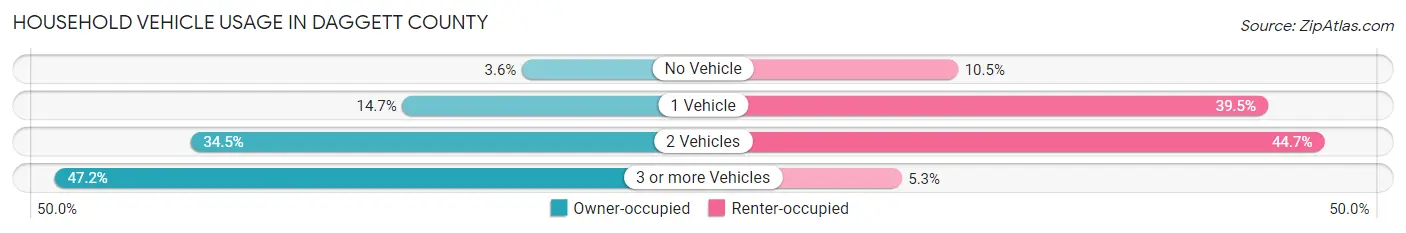
| Vehicles per Household | Owner-occupied | Renter-occupied |
| No Vehicle | 7 (3.5%) | 4 (10.5%) |
| 1 Vehicle | 29 (14.7%) | 15 (39.5%) |
| 2 Vehicles | 68 (34.5%) | 17 (44.7%) |
| 3 or more Vehicles | 93 (47.2%) | 2 (5.3%) |
| Total | 197 (100.0%) | 38 (100.0%) |
Real Estate & Mortgages in Daggett County
Real Estate and Mortgage Overview in Daggett County
| Characteristic | Without Mortgage | With Mortgage |
| Housing Units | 117 | 80 |
| Median Property Value | $243,800 | $283,300 |
| Median Household Income | $54,107 | $11 |
| Monthly Housing Costs | $466 | $2 |
| Real Estate Taxes | $1,007 | $4 |
Property Value by Mortgage Status in Daggett County
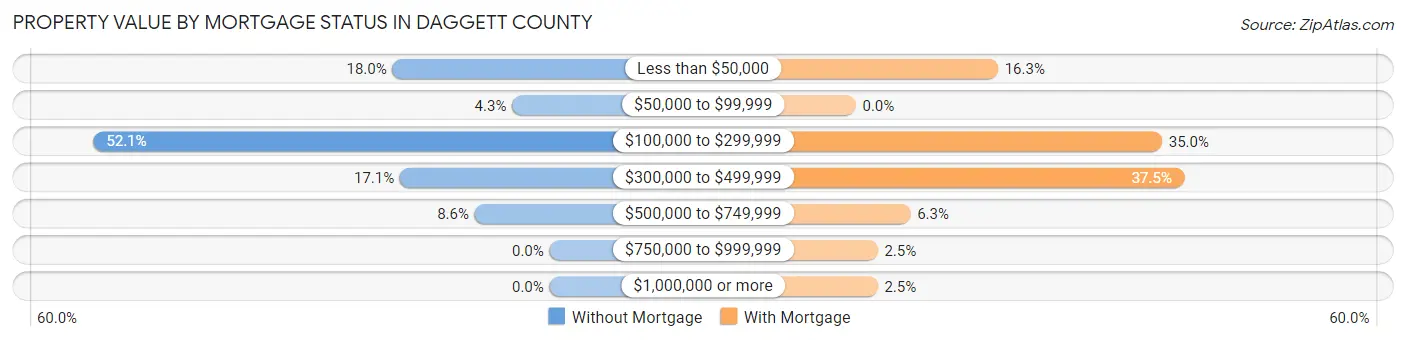
| Property Value | Without Mortgage | With Mortgage |
| Less than $50,000 | 21 (17.9%) | 13 (16.3%) |
| $50,000 to $99,999 | 5 (4.3%) | 0 (0.0%) |
| $100,000 to $299,999 | 61 (52.1%) | 28 (35.0%) |
| $300,000 to $499,999 | 20 (17.1%) | 30 (37.5%) |
| $500,000 to $749,999 | 10 (8.6%) | 5 (6.2%) |
| $750,000 to $999,999 | 0 (0.0%) | 2 (2.5%) |
| $1,000,000 or more | 0 (0.0%) | 2 (2.5%) |
| Total | 117 (100.0%) | 80 (100.0%) |
Household Income by Mortgage Status in Daggett County
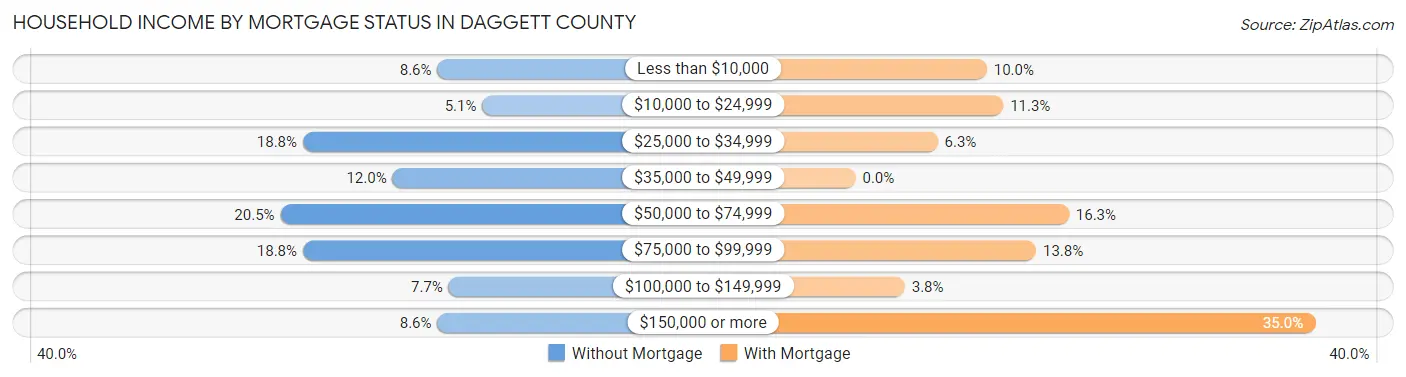
| Household Income | Without Mortgage | With Mortgage |
| Less than $10,000 | 10 (8.6%) | 8 (10.0%) |
| $10,000 to $24,999 | 6 (5.1%) | 9 (11.3%) |
| $25,000 to $34,999 | 22 (18.8%) | 5 (6.2%) |
| $35,000 to $49,999 | 14 (12.0%) | 0 (0.0%) |
| $50,000 to $74,999 | 24 (20.5%) | 13 (16.3%) |
| $75,000 to $99,999 | 22 (18.8%) | 11 (13.8%) |
| $100,000 to $149,999 | 9 (7.7%) | 3 (3.7%) |
| $150,000 or more | 10 (8.6%) | 28 (35.0%) |
| Total | 117 (100.0%) | 80 (100.0%) |
Property Value to Household Income Ratio in Daggett County
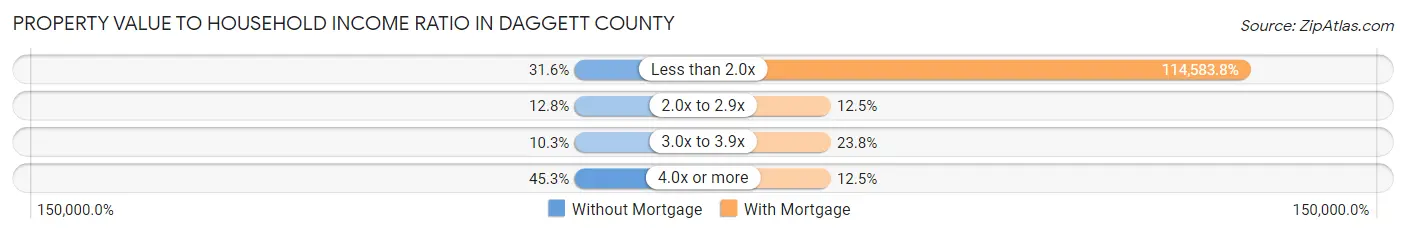
| Value-to-Income Ratio | Without Mortgage | With Mortgage |
| Less than 2.0x | 37 (31.6%) | 91,667 (114,583.8%) |
| 2.0x to 2.9x | 15 (12.8%) | 10 (12.5%) |
| 3.0x to 3.9x | 12 (10.3%) | 19 (23.7%) |
| 4.0x or more | 53 (45.3%) | 10 (12.5%) |
| Total | 117 (100.0%) | 80 (100.0%) |
Real Estate Taxes by Mortgage Status in Daggett County
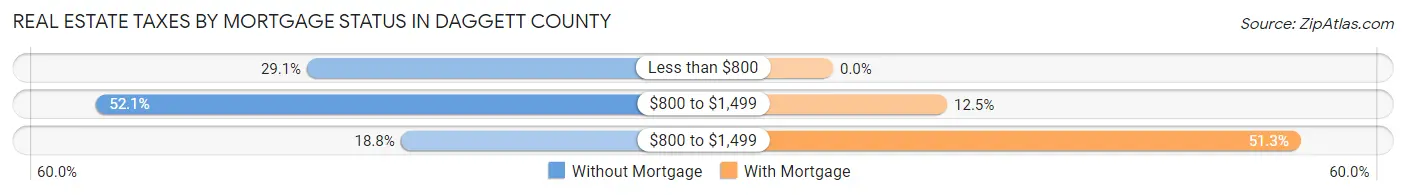
| Property Taxes | Without Mortgage | With Mortgage |
| Less than $800 | 34 (29.1%) | 0 (0.0%) |
| $800 to $1,499 | 61 (52.1%) | 10 (12.5%) |
| $800 to $1,499 | 22 (18.8%) | 41 (51.2%) |
| Total | 117 (100.0%) | 80 (100.0%) |
Health & Disability in Daggett County
Health Insurance Coverage by Age in Daggett County
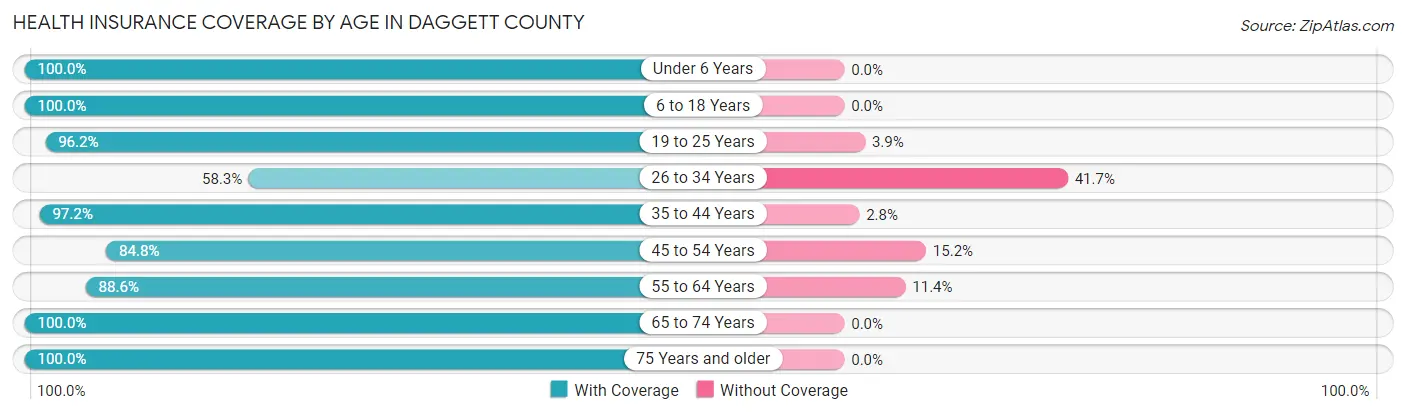
| Age Bracket | With Coverage | Without Coverage |
| Under 6 Years | 29 (100.0%) | 0 (0.0%) |
| 6 to 18 Years | 137 (100.0%) | 0 (0.0%) |
| 19 to 25 Years | 25 (96.2%) | 1 (3.8%) |
| 26 to 34 Years | 14 (58.3%) | 10 (41.7%) |
| 35 to 44 Years | 70 (97.2%) | 2 (2.8%) |
| 45 to 54 Years | 78 (84.8%) | 14 (15.2%) |
| 55 to 64 Years | 70 (88.6%) | 9 (11.4%) |
| 65 to 74 Years | 83 (100.0%) | 0 (0.0%) |
| 75 Years and older | 35 (100.0%) | 0 (0.0%) |
| Total | 541 (93.8%) | 36 (6.2%) |
Health Insurance Coverage by Citizenship Status in Daggett County
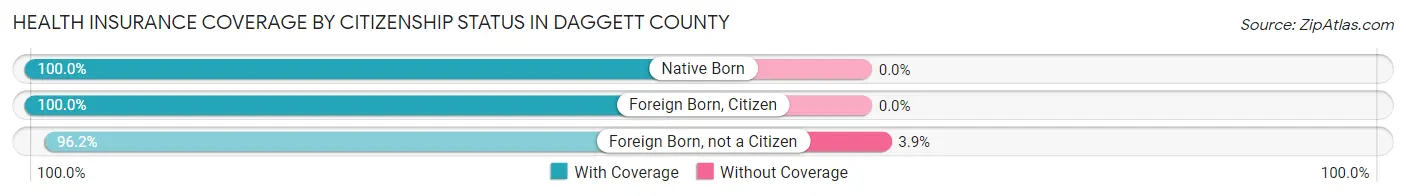
| Citizenship Status | With Coverage | Without Coverage |
| Native Born | 29 (100.0%) | 0 (0.0%) |
| Foreign Born, Citizen | 137 (100.0%) | 0 (0.0%) |
| Foreign Born, not a Citizen | 25 (96.2%) | 1 (3.8%) |
Health Insurance Coverage by Household Income in Daggett County
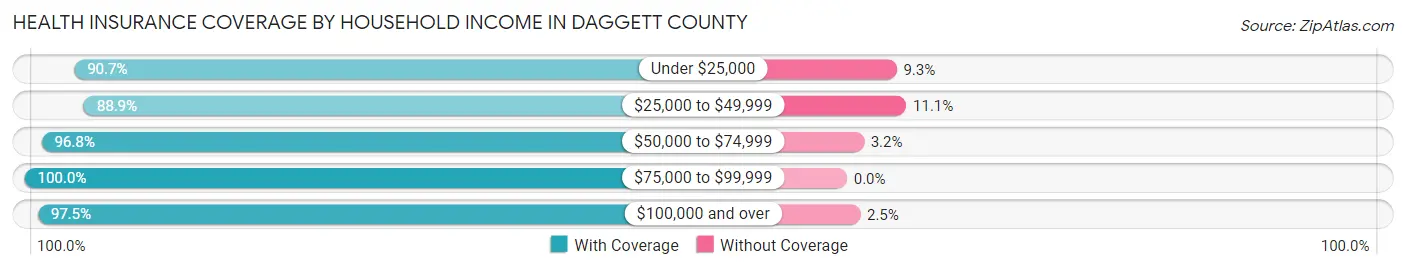
| Household Income | With Coverage | Without Coverage |
| Under $25,000 | 39 (90.7%) | 4 (9.3%) |
| $25,000 to $49,999 | 96 (88.9%) | 12 (11.1%) |
| $50,000 to $74,999 | 61 (96.8%) | 2 (3.2%) |
| $75,000 to $99,999 | 65 (100.0%) | 0 (0.0%) |
| $100,000 and over | 275 (97.5%) | 7 (2.5%) |
Public vs Private Health Insurance Coverage by Age in Daggett County
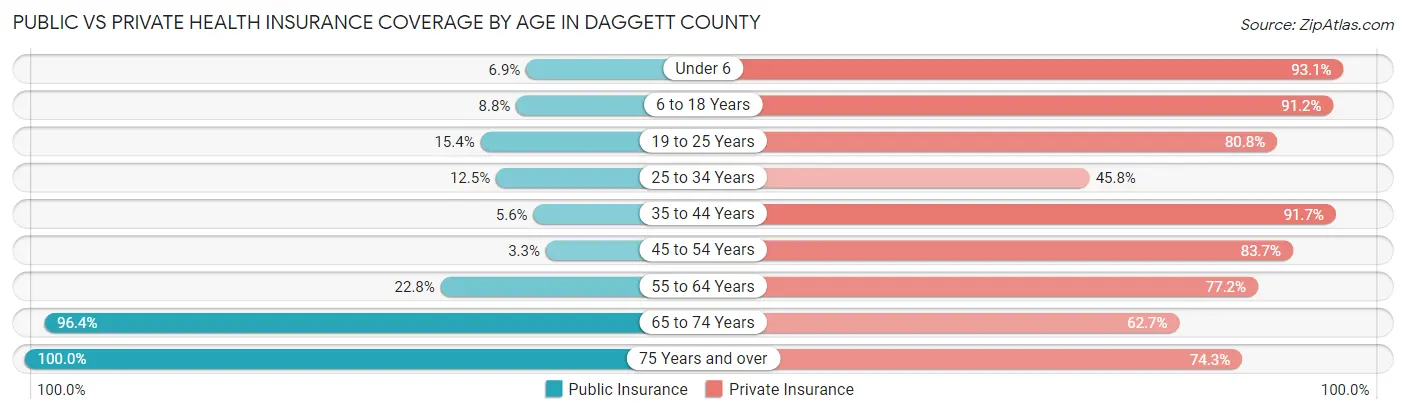
| Age Bracket | Public Insurance | Private Insurance |
| Under 6 | 2 (6.9%) | 27 (93.1%) |
| 6 to 18 Years | 12 (8.8%) | 125 (91.2%) |
| 19 to 25 Years | 4 (15.4%) | 21 (80.8%) |
| 25 to 34 Years | 3 (12.5%) | 11 (45.8%) |
| 35 to 44 Years | 4 (5.6%) | 66 (91.7%) |
| 45 to 54 Years | 3 (3.3%) | 77 (83.7%) |
| 55 to 64 Years | 18 (22.8%) | 61 (77.2%) |
| 65 to 74 Years | 80 (96.4%) | 52 (62.6%) |
| 75 Years and over | 35 (100.0%) | 26 (74.3%) |
| Total | 161 (27.9%) | 466 (80.8%) |
Disability Status by Sex by Age in Daggett County
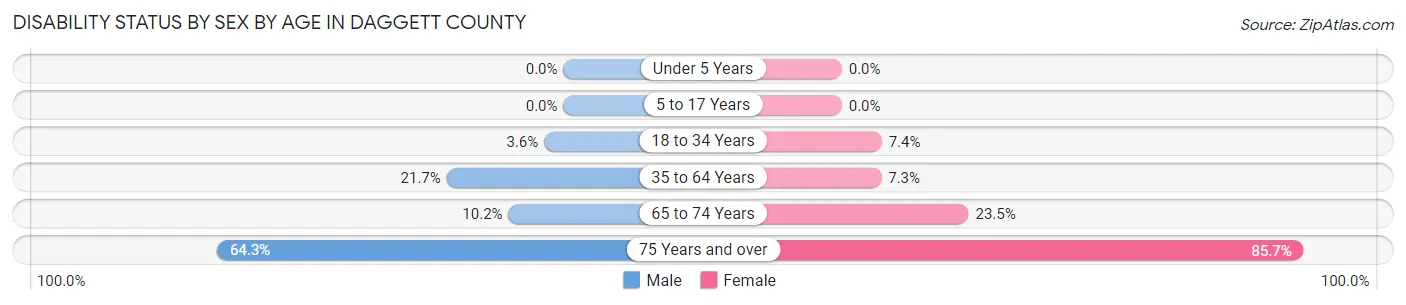
| Age Bracket | Male | Female |
| Under 5 Years | 0 (0.0%) | 0 (0.0%) |
| 5 to 17 Years | 0 (0.0%) | 0 (0.0%) |
| 18 to 34 Years | 1 (3.6%) | 2 (7.4%) |
| 35 to 64 Years | 26 (21.7%) | 9 (7.3%) |
| 65 to 74 Years | 5 (10.2%) | 8 (23.5%) |
| 75 Years and over | 18 (64.3%) | 6 (85.7%) |
Disability Class by Sex by Age in Daggett County
Disability Class: Hearing Difficulty
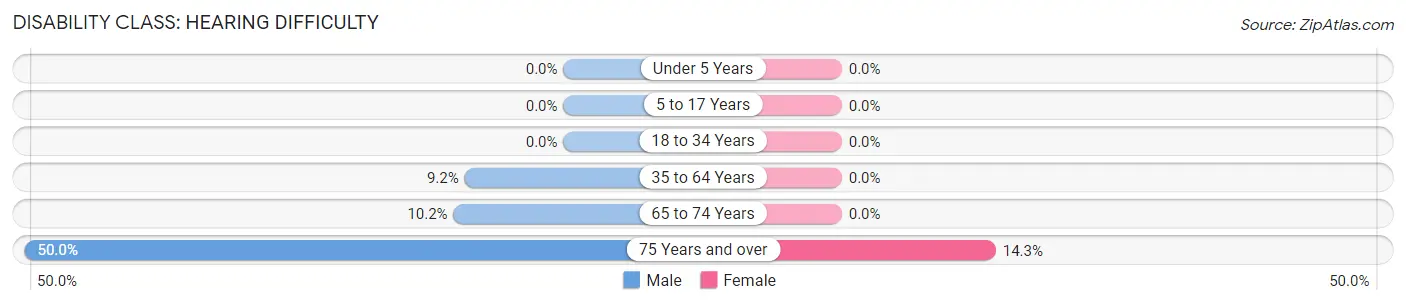
| Age Bracket | Male | Female |
| Under 5 Years | 0 (0.0%) | 0 (0.0%) |
| 5 to 17 Years | 0 (0.0%) | 0 (0.0%) |
| 18 to 34 Years | 0 (0.0%) | 0 (0.0%) |
| 35 to 64 Years | 11 (9.2%) | 0 (0.0%) |
| 65 to 74 Years | 5 (10.2%) | 0 (0.0%) |
| 75 Years and over | 14 (50.0%) | 1 (14.3%) |
Disability Class: Vision Difficulty
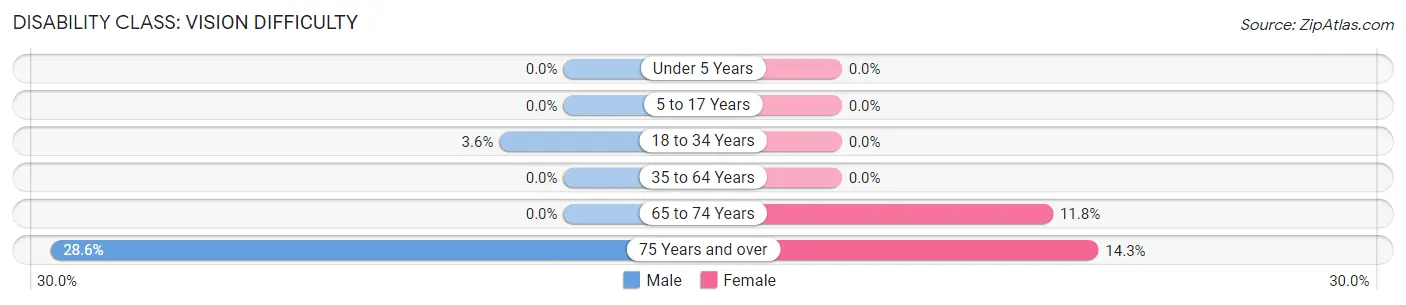
| Age Bracket | Male | Female |
| Under 5 Years | 0 (0.0%) | 0 (0.0%) |
| 5 to 17 Years | 0 (0.0%) | 0 (0.0%) |
| 18 to 34 Years | 1 (3.6%) | 0 (0.0%) |
| 35 to 64 Years | 0 (0.0%) | 0 (0.0%) |
| 65 to 74 Years | 0 (0.0%) | 4 (11.8%) |
| 75 Years and over | 8 (28.6%) | 1 (14.3%) |
Disability Class: Cognitive Difficulty
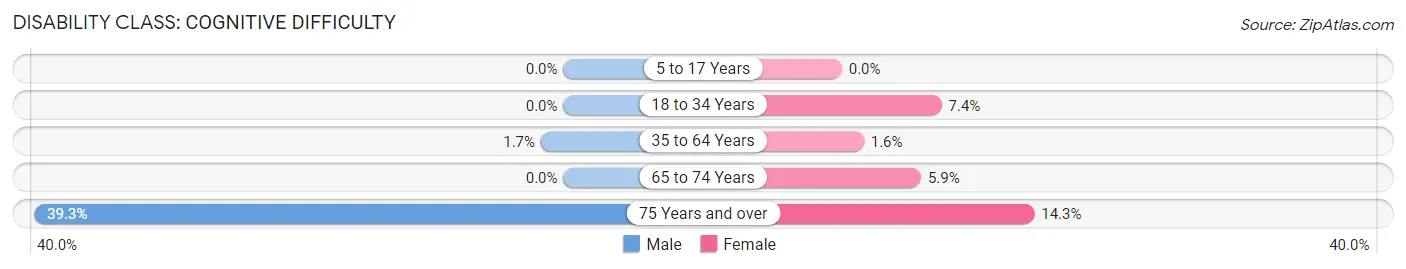
| Age Bracket | Male | Female |
| 5 to 17 Years | 0 (0.0%) | 0 (0.0%) |
| 18 to 34 Years | 0 (0.0%) | 2 (7.4%) |
| 35 to 64 Years | 2 (1.7%) | 2 (1.6%) |
| 65 to 74 Years | 0 (0.0%) | 2 (5.9%) |
| 75 Years and over | 11 (39.3%) | 1 (14.3%) |
Disability Class: Ambulatory Difficulty
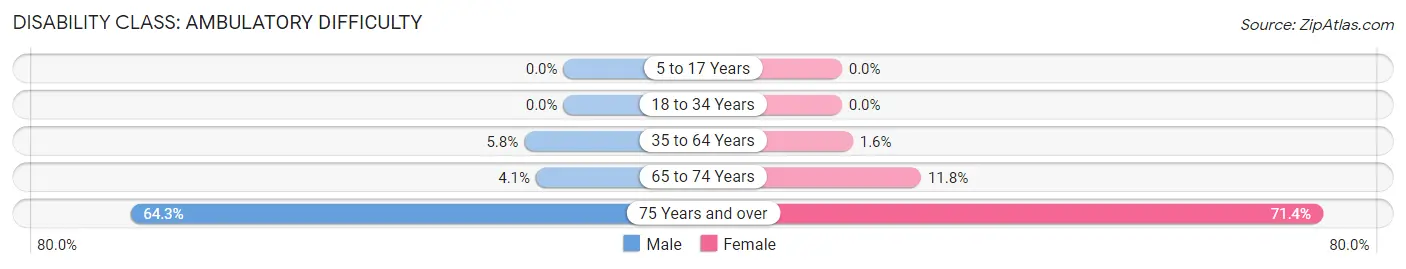
| Age Bracket | Male | Female |
| 5 to 17 Years | 0 (0.0%) | 0 (0.0%) |
| 18 to 34 Years | 0 (0.0%) | 0 (0.0%) |
| 35 to 64 Years | 7 (5.8%) | 2 (1.6%) |
| 65 to 74 Years | 2 (4.1%) | 4 (11.8%) |
| 75 Years and over | 18 (64.3%) | 5 (71.4%) |
Disability Class: Self-Care Difficulty
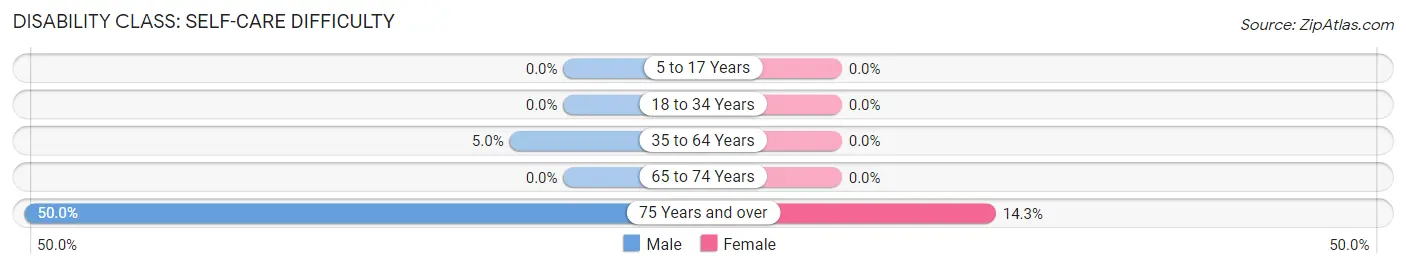
| Age Bracket | Male | Female |
| 5 to 17 Years | 0 (0.0%) | 0 (0.0%) |
| 18 to 34 Years | 0 (0.0%) | 0 (0.0%) |
| 35 to 64 Years | 6 (5.0%) | 0 (0.0%) |
| 65 to 74 Years | 0 (0.0%) | 0 (0.0%) |
| 75 Years and over | 14 (50.0%) | 1 (14.3%) |
Technology Access in Daggett County
Computing Device Access in Daggett County
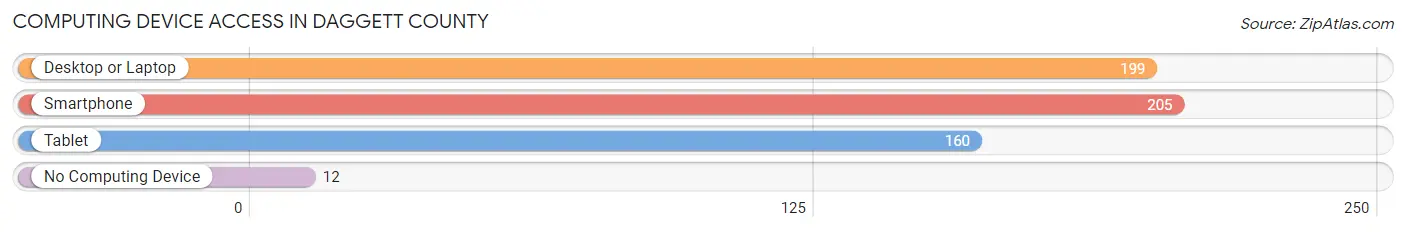
| Device Type | # Households | % Households |
| Desktop or Laptop | 199 | 84.7% |
| Smartphone | 205 | 87.2% |
| Tablet | 160 | 68.1% |
| No Computing Device | 12 | 5.1% |
| Total | 235 | 100.0% |
Internet Access in Daggett County
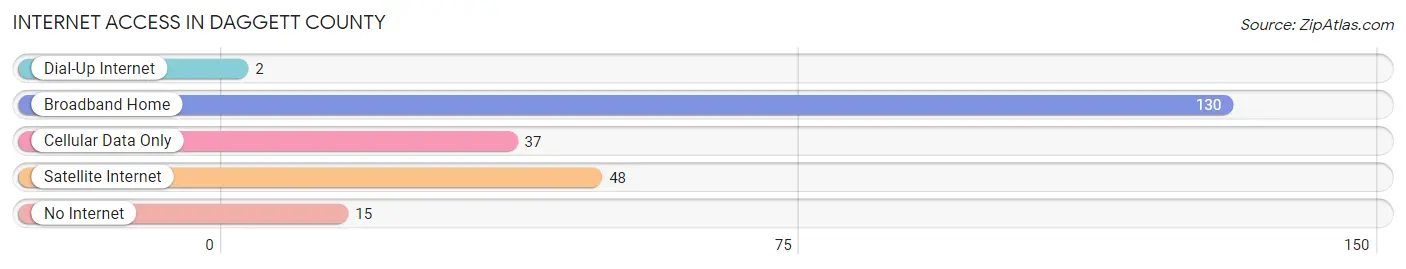
| Internet Type | # Households | % Households |
| Dial-Up Internet | 2 | 0.9% |
| Broadband Home | 130 | 55.3% |
| Cellular Data Only | 37 | 15.7% |
| Satellite Internet | 48 | 20.4% |
| No Internet | 15 | 6.4% |
| Total | 235 | 100.0% |
Daggett County Summary
Daggett County is a county located in the northeastern corner of the U.S. state of Utah. As of the 2010 United States Census, the population was 1,059, making it the least populous county in Utah. Its county seat and only municipality is Manila. The county was named for Ellsworth Daggett, the first surveyor general of Utah.
Geography
Daggett County is located in the northeast corner of Utah. It is bordered by Wyoming to the north, Uintah County to the south, Summit County to the west, and Carbon County to the east. The county covers an area of 1,890 square miles, making it the fifth-largest county in Utah. The terrain is mostly mountainous, with the Uinta Mountains to the south and the Wasatch Range to the west. The highest point in the county is Kings Peak, which has an elevation of 13,528 feet. The county also contains several reservoirs, including Flaming Gorge Reservoir, which is located on the Green River.
Demographics
As of the 2010 United States Census, there were 1,059 people living in Daggett County. The racial makeup of the county was 94.2% White, 0.3% Black or African American, 0.7% Native American, 0.2% Asian, 0.1% Pacific Islander, 2.7% from other races, and 1.7% from two or more races. 6.3% of the population were Hispanic or Latino of any race.
The median income for a household in the county was $37,917, and the median income for a family was $41,250. The per capita income for the county was $17,945. About 11.2% of families and 13.2% of the population were below the poverty line, including 16.2% of those under age 18 and 8.3% of those age 65 or over.
Economy
The economy of Daggett County is largely based on agriculture and tourism. The county is home to several ranches and farms, which produce hay, cattle, sheep, and other livestock. Tourism is also an important part of the economy, with visitors coming to the area to enjoy the scenery and outdoor activities such as fishing, hunting, and camping.
The county is also home to several energy-related industries, including oil and gas production, coal mining, and uranium mining. The county is also home to several power plants, including the Flaming Gorge Dam, which provides electricity to the region.
Conclusion
Daggett County is a small, rural county located in the northeastern corner of Utah. The county is home to a diverse economy, with agriculture, tourism, and energy-related industries all playing an important role. The county is also home to several reservoirs, including Flaming Gorge Reservoir, which provides electricity to the region. The population of the county is small, but diverse, with a mix of races and ethnicities.
Common Questions
What is the Total Population of Daggett County?
Total Population of Daggett County is 638.
What is the Total Male Population of Daggett County?
Total Male Population of Daggett County is 366.
What is the Total Female Population of Daggett County?
Total Female Population of Daggett County is 272.
What is the Ratio of Males per 100 Females in Daggett County?
There are 134.56 Males per 100 Females in Daggett County.
What is the Ratio of Females per 100 Males in Daggett County?
There are 74.32 Females per 100 Males in Daggett County.
What is the Median Population Age in Daggett County?
Median Population Age in Daggett County is 43.3 Years.
What is the Average Family Size in Daggett County
Average Family Size in Daggett County is 3.4 People.
What is the Average Household Size in Daggett County
Average Household Size in Daggett County is 2.4 People.
What is Per Capita Income in Daggett County?
Per Capita income in Daggett County is $27,261.
What is the Median Family Income in Daggett County?
Median Family Income in Daggett County is $91,250.
What is the Median Household income in Daggett County?
Median Household Income in Daggett County is $61,250.
What is Inequality or Gini Index in Daggett County?
Inequality or Gini Index in Daggett County is 0.39.
How Large is the Labor Force in Daggett County?
There are 270 People in the Labor Forcein in Daggett County.
What is the Percentage of People in the Labor Force in Daggett County?
54.9% of People are in the Labor Force in Daggett County.
What is the Unemployment Rate in Daggett County?
Unemployment Rate in Daggett County is 3.5%.