Carbon County, UT
Carbon County Map
Carbon County Overview
20,338
TOTAL POPULATION
10,219
MALE POPULATION
10,119
FEMALE POPULATION
100.99
MALES / 100 FEMALES
99.02
FEMALES / 100 MALES
37.8
MEDIAN AGE
3.1
AVG FAMILY SIZE
2.5
AVG HOUSEHOLD SIZE
$26,450
PER CAPITA INCOME
$71,143
AVG FAMILY INCOME
$53,734
AVG HOUSEHOLD INCOME
64.8%
WAGE / INCOME GAP [ % ]
35.2¢/ $1
WAGE / INCOME GAP [ $ ]
$9,509
FAMILY INCOME DEFICIT
0.42
INEQUALITY / GINI INDEX
8,905
LABOR FORCE [ PEOPLE ]
56.7%
PERCENT IN LABOR FORCE
6.7%
UNEMPLOYMENT RATE
Carbon County Area Codes
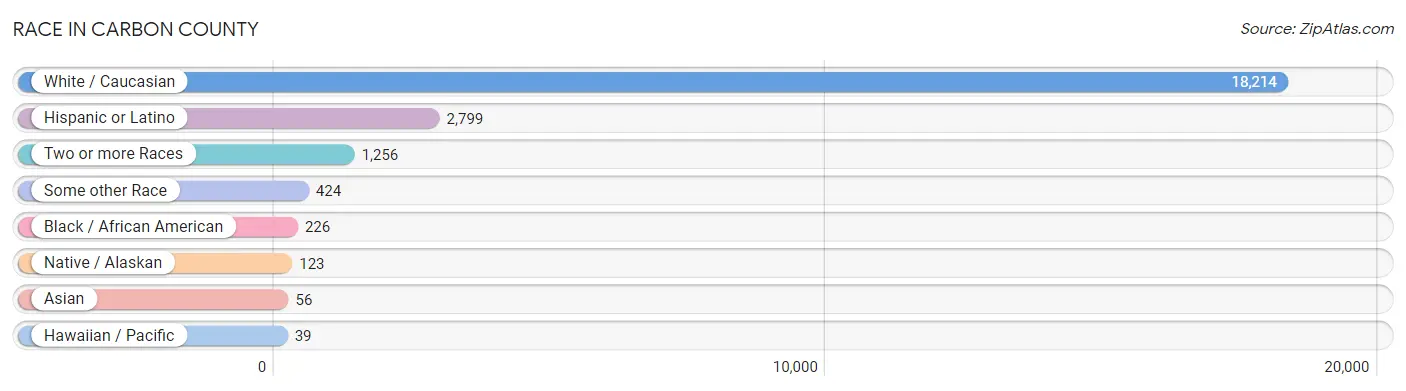
Race in Carbon County
The most populous races in Carbon County are White / Caucasian (18,214 | 89.6%), Hispanic or Latino (2,799 | 13.8%), and Two or more Races (1,256 | 6.2%).
| Race | # Population | % Population |
| Asian | 56 | 0.3% |
| Black / African American | 226 | 1.1% |
| Hawaiian / Pacific | 39 | 0.2% |
| Hispanic or Latino | 2,799 | 13.8% |
| Native / Alaskan | 123 | 0.6% |
| White / Caucasian | 18,214 | 89.6% |
| Two or more Races | 1,256 | 6.2% |
| Some other Race | 424 | 2.1% |
| Total | 20,338 | 100.0% |
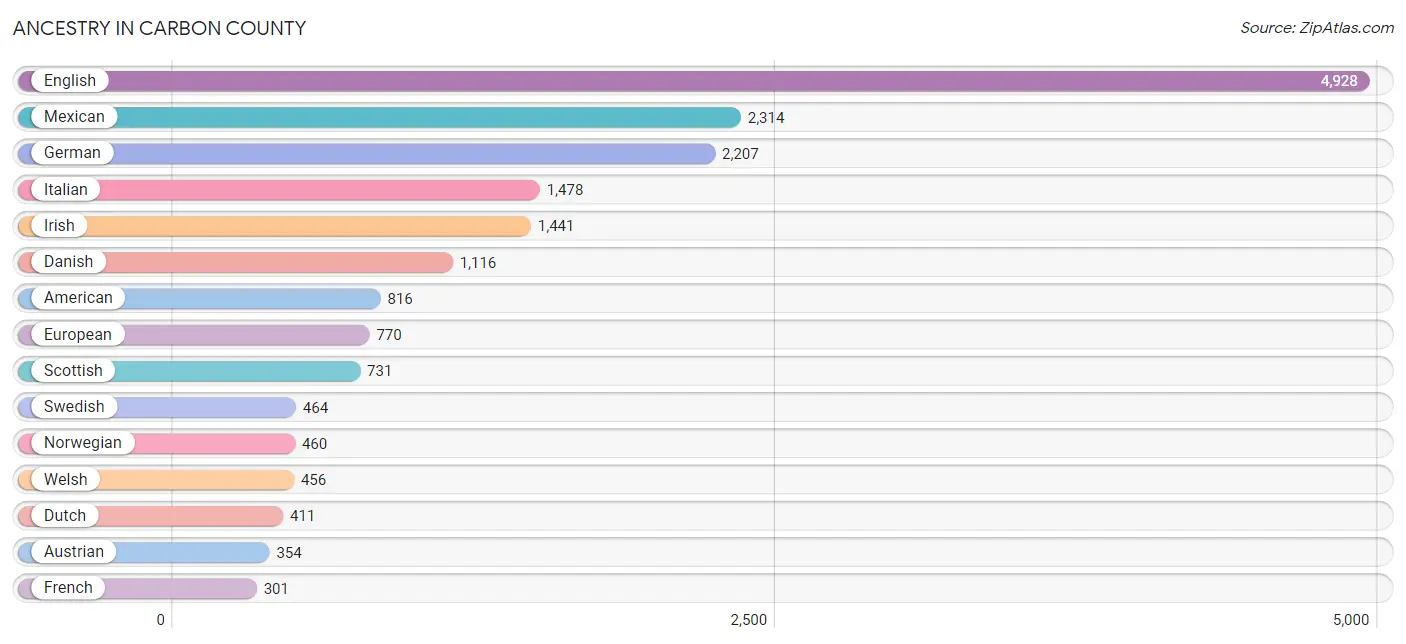
Ancestry in Carbon County
The most populous ancestries reported in Carbon County are English (4,928 | 24.2%), Mexican (2,314 | 11.4%), German (2,207 | 10.8%), Italian (1,478 | 7.3%), and Irish (1,441 | 7.1%), together accounting for 60.8% of all Carbon County residents.
| Ancestry | # Population | % Population |
| African | 29 | 0.1% |
| American | 816 | 4.0% |
| Apache | 20 | 0.1% |
| Argentinean | 22 | 0.1% |
| Austrian | 354 | 1.7% |
| Basque | 11 | 0.1% |
| Bhutanese | 20 | 0.1% |
| Brazilian | 8 | 0.0% |
| British | 130 | 0.6% |
| Burmese | 21 | 0.1% |
| Canadian | 57 | 0.3% |
| Central American | 31 | 0.2% |
| Cherokee | 46 | 0.2% |
| Chilean | 21 | 0.1% |
| Choctaw | 6 | 0.0% |
| Colombian | 2 | 0.0% |
| Croatian | 19 | 0.1% |
| Cuban | 39 | 0.2% |
| Danish | 1,116 | 5.5% |
| Dutch | 411 | 2.0% |
| Eastern European | 8 | 0.0% |
| Ecuadorian | 16 | 0.1% |
| English | 4,928 | 24.2% |
| European | 770 | 3.8% |
| French | 301 | 1.5% |
| French Canadian | 194 | 0.9% |
| German | 2,207 | 10.8% |
| Greek | 236 | 1.2% |
| Hungarian | 11 | 0.1% |
| Icelander | 45 | 0.2% |
| Indian (Asian) | 61 | 0.3% |
| Irish | 1,441 | 7.1% |
| Israeli | 22 | 0.1% |
| Italian | 1,478 | 7.3% |
| Korean | 121 | 0.6% |
| Mexican | 2,314 | 11.4% |
| Mexican American Indian | 24 | 0.1% |
| Native Hawaiian | 34 | 0.2% |
| Navajo | 139 | 0.7% |
| Northern European | 9 | 0.0% |
| Norwegian | 460 | 2.3% |
| Polish | 233 | 1.1% |
| Portuguese | 11 | 0.1% |
| Pueblo | 15 | 0.1% |
| Puerto Rican | 5 | 0.0% |
| Romanian | 5 | 0.0% |
| Russian | 2 | 0.0% |
| Salvadoran | 31 | 0.2% |
| Samoan | 54 | 0.3% |
| Scandinavian | 295 | 1.5% |
| Scotch-Irish | 193 | 0.9% |
| Scottish | 731 | 3.6% |
| Sioux | 13 | 0.1% |
| Slavic | 8 | 0.0% |
| Slovak | 18 | 0.1% |
| Slovene | 52 | 0.3% |
| South American | 68 | 0.3% |
| Spaniard | 173 | 0.9% |
| Spanish | 64 | 0.3% |
| Sri Lankan | 60 | 0.3% |
| Subsaharan African | 29 | 0.1% |
| Swedish | 464 | 2.3% |
| Swiss | 113 | 0.6% |
| Thai | 60 | 0.3% |
| Ute | 21 | 0.1% |
| Venezuelan | 7 | 0.0% |
| Welsh | 456 | 2.2% |
| Yugoslavian | 62 | 0.3% | View All 68 Rows |
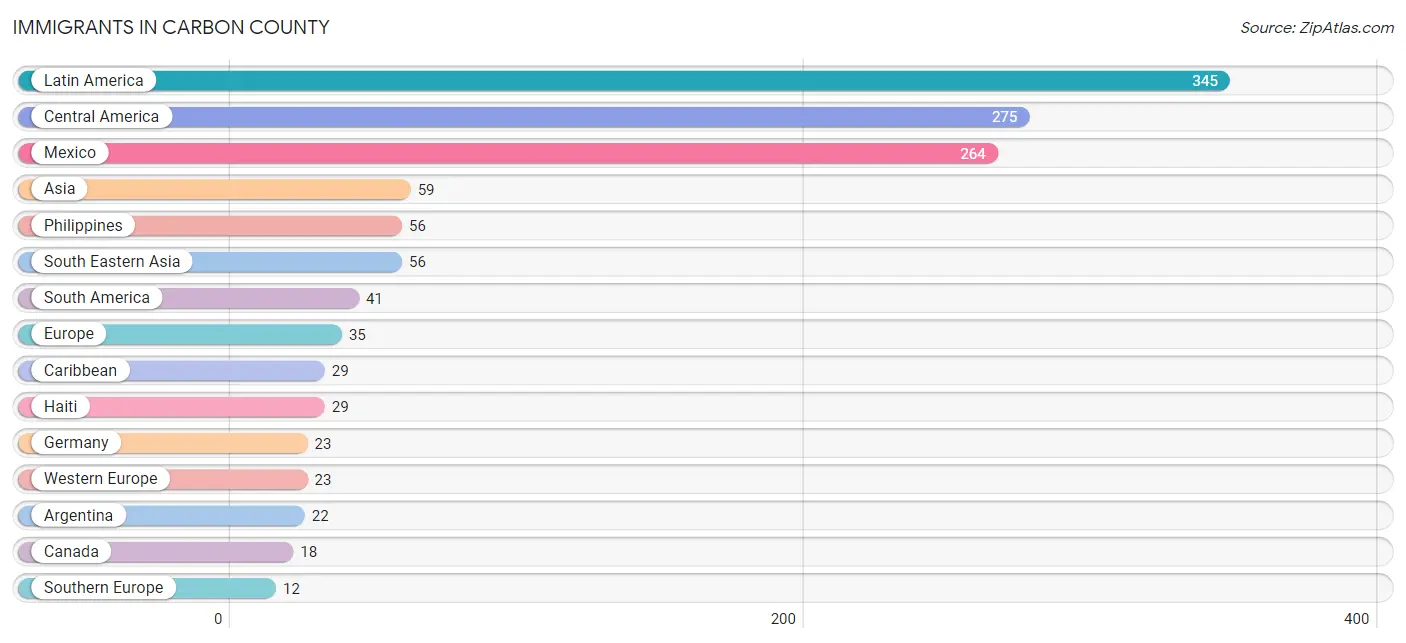
Immigrants in Carbon County
The most numerous immigrant groups reported in Carbon County came from Latin America (345 | 1.7%), Central America (275 | 1.3%), Mexico (264 | 1.3%), Asia (59 | 0.3%), and Philippines (56 | 0.3%), together accounting for 4.9% of all Carbon County residents.
| Immigration Origin | # Population | % Population |
| Argentina | 22 | 0.1% |
| Asia | 59 | 0.3% |
| Brazil | 8 | 0.0% |
| Canada | 18 | 0.1% |
| Caribbean | 29 | 0.1% |
| Central America | 275 | 1.3% |
| Chile | 11 | 0.1% |
| China | 1 | 0.0% |
| Eastern Asia | 3 | 0.0% |
| El Salvador | 11 | 0.1% |
| Europe | 35 | 0.2% |
| Germany | 23 | 0.1% |
| Haiti | 29 | 0.1% |
| Italy | 5 | 0.0% |
| Korea | 2 | 0.0% |
| Latin America | 345 | 1.7% |
| Mexico | 264 | 1.3% |
| Philippines | 56 | 0.3% |
| South America | 41 | 0.2% |
| South Eastern Asia | 56 | 0.3% |
| Southern Europe | 12 | 0.1% |
| Spain | 7 | 0.0% |
| Western Europe | 23 | 0.1% | View All 23 Rows |
Sex and Age in Carbon County
Sex and Age in Carbon County
The most populous age groups in Carbon County are 5 to 9 Years (858 | 8.4%) for men and 15 to 19 Years (827 | 8.2%) for women.
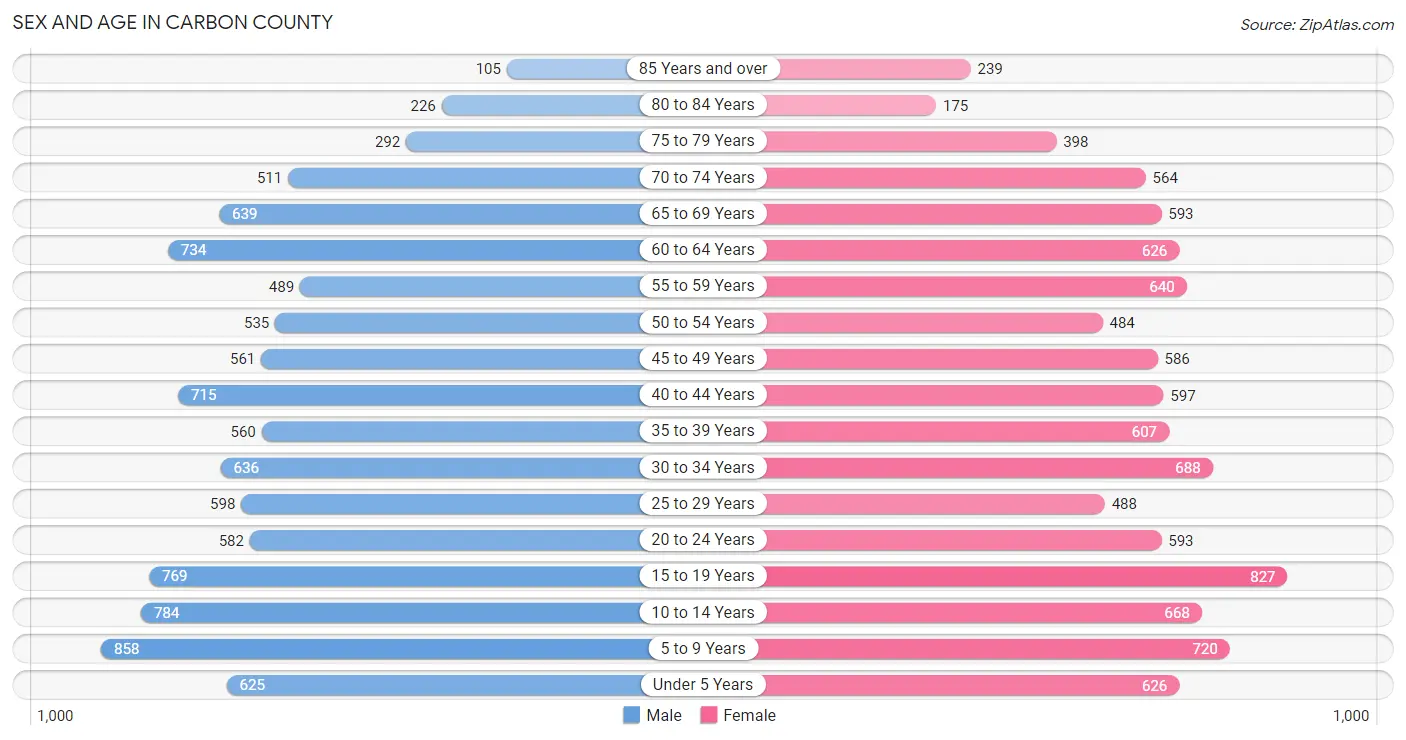
| Age Bracket | Male | Female |
| Under 5 Years | 625 (6.1%) | 626 (6.2%) |
| 5 to 9 Years | 858 (8.4%) | 720 (7.1%) |
| 10 to 14 Years | 784 (7.7%) | 668 (6.6%) |
| 15 to 19 Years | 769 (7.5%) | 827 (8.2%) |
| 20 to 24 Years | 582 (5.7%) | 593 (5.9%) |
| 25 to 29 Years | 598 (5.9%) | 488 (4.8%) |
| 30 to 34 Years | 636 (6.2%) | 688 (6.8%) |
| 35 to 39 Years | 560 (5.5%) | 607 (6.0%) |
| 40 to 44 Years | 715 (7.0%) | 597 (5.9%) |
| 45 to 49 Years | 561 (5.5%) | 586 (5.8%) |
| 50 to 54 Years | 535 (5.2%) | 484 (4.8%) |
| 55 to 59 Years | 489 (4.8%) | 640 (6.3%) |
| 60 to 64 Years | 734 (7.2%) | 626 (6.2%) |
| 65 to 69 Years | 639 (6.2%) | 593 (5.9%) |
| 70 to 74 Years | 511 (5.0%) | 564 (5.6%) |
| 75 to 79 Years | 292 (2.9%) | 398 (3.9%) |
| 80 to 84 Years | 226 (2.2%) | 175 (1.7%) |
| 85 Years and over | 105 (1.0%) | 239 (2.4%) |
| Total | 10,219 (100.0%) | 10,119 (100.0%) |
Families and Households in Carbon County
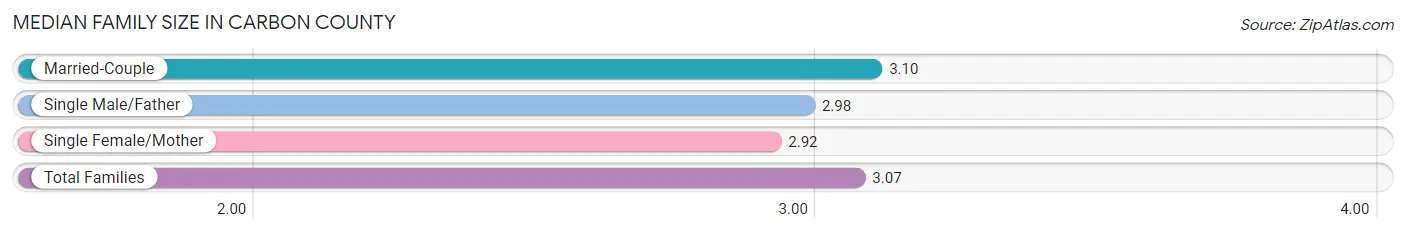
Median Family Size in Carbon County
The median family size in Carbon County is 3.07 persons per family, with married-couple families (4,377 | 81.5%) accounting for the largest median family size of 3.1 persons per family. On the other hand, single female/mother families (581 | 10.8%) represent the smallest median family size with 2.92 persons per family.
| Family Type | # Families | Family Size |
| Married-Couple | 4,377 (81.5%) | 3.10 |
| Single Male/Father | 414 (7.7%) | 2.98 |
| Single Female/Mother | 581 (10.8%) | 2.92 |
| Total Families | 5,372 (100.0%) | 3.07 |
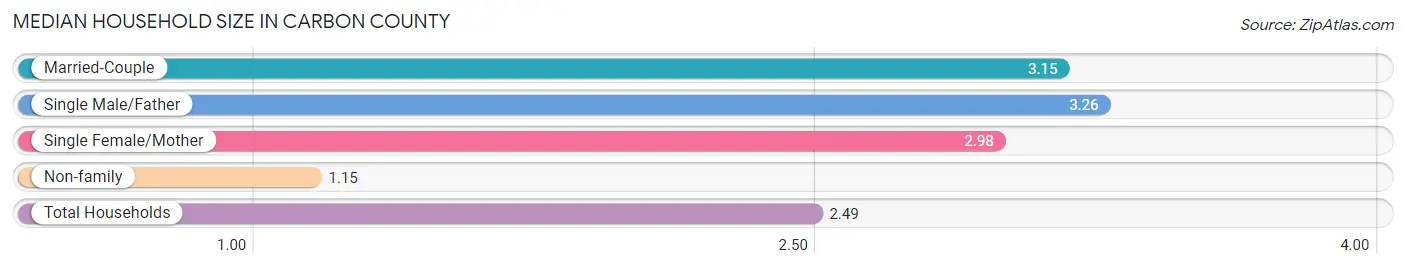
Median Household Size in Carbon County
The median household size in Carbon County is 2.49 persons per household, with single male/father households (414 | 5.2%) accounting for the largest median household size of 3.26 persons per household. non-family households (2,626 | 32.8%) represent the smallest median household size with 1.15 persons per household.
| Household Type | # Households | Household Size |
| Married-Couple | 4,377 (54.7%) | 3.15 |
| Single Male/Father | 414 (5.2%) | 3.26 |
| Single Female/Mother | 581 (7.3%) | 2.98 |
| Non-family | 2,626 (32.8%) | 1.15 |
| Total Households | 7,998 (100.0%) | 2.49 |
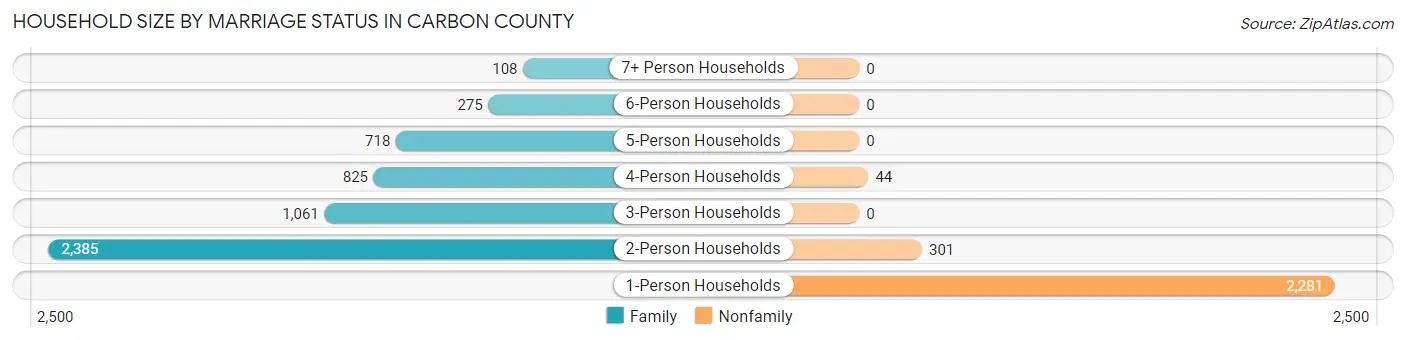
Household Size by Marriage Status in Carbon County
Out of a total of 7,998 households in Carbon County, 5,372 (67.2%) are family households, while 2,626 (32.8%) are nonfamily households. The most numerous type of family households are 2-person households, comprising 2,385, and the most common type of nonfamily households are 1-person households, comprising 2,281.
| Household Size | Family Households | Nonfamily Households |
| 1-Person Households | - | 2,281 (28.5%) |
| 2-Person Households | 2,385 (29.8%) | 301 (3.8%) |
| 3-Person Households | 1,061 (13.3%) | 0 (0.0%) |
| 4-Person Households | 825 (10.3%) | 44 (0.5%) |
| 5-Person Households | 718 (9.0%) | 0 (0.0%) |
| 6-Person Households | 275 (3.4%) | 0 (0.0%) |
| 7+ Person Households | 108 (1.3%) | 0 (0.0%) |
| Total | 5,372 (67.2%) | 2,626 (32.8%) |
Female Fertility in Carbon County
Fertility by Age in Carbon County
Average fertility rate in Carbon County is 58.0 births per 1,000 women. Women in the age bracket of 20 to 34 years have the highest fertility rate with 123.0 births per 1,000 women. Women in the age bracket of 20 to 34 years acount for 82.6% of all women with births.
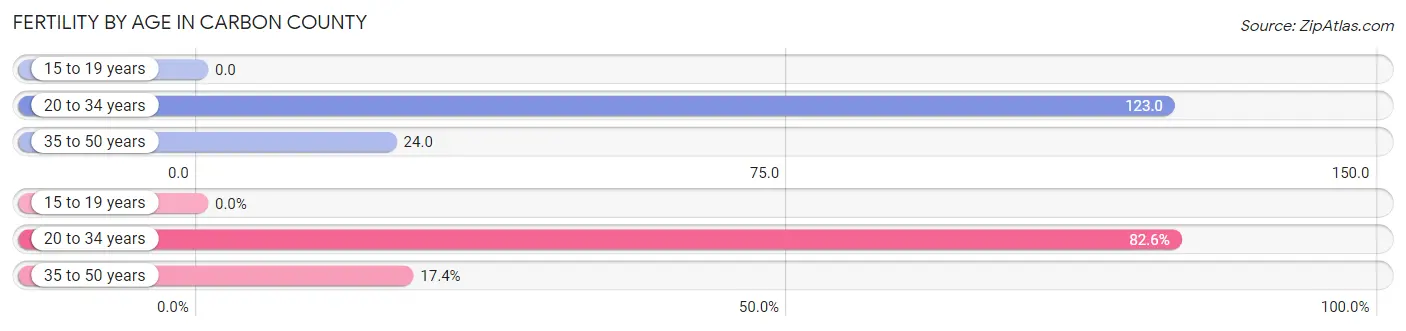
| Age Bracket | Women with Births | Births / 1,000 Women |
| 15 to 19 years | 0 (0.0%) | 0.0 |
| 20 to 34 years | 218 (82.6%) | 123.0 |
| 35 to 50 years | 46 (17.4%) | 24.0 |
| Total | 264 (100.0%) | 58.0 |
Fertility by Age by Marriage Status in Carbon County
81.1% of women with births (264) in Carbon County are married. The highest percentage of unmarried women with births falls into 35 to 50 years age bracket with 45.7% of them unmarried at the time of birth, while the lowest percentage of unmarried women with births belong to 20 to 34 years age bracket with 13.3% of them unmarried.
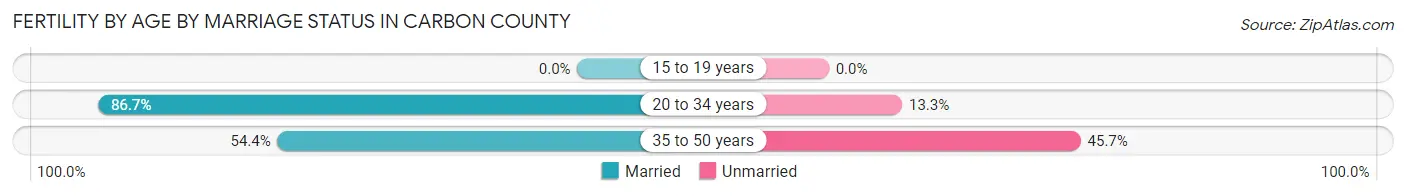
| Age Bracket | Married | Unmarried |
| 15 to 19 years | 0 (0.0%) | 0 (0.0%) |
| 20 to 34 years | 189 (86.7%) | 29 (13.3%) |
| 35 to 50 years | 25 (54.3%) | 21 (45.7%) |
| Total | 214 (81.1%) | 50 (18.9%) |
Fertility by Education in Carbon County
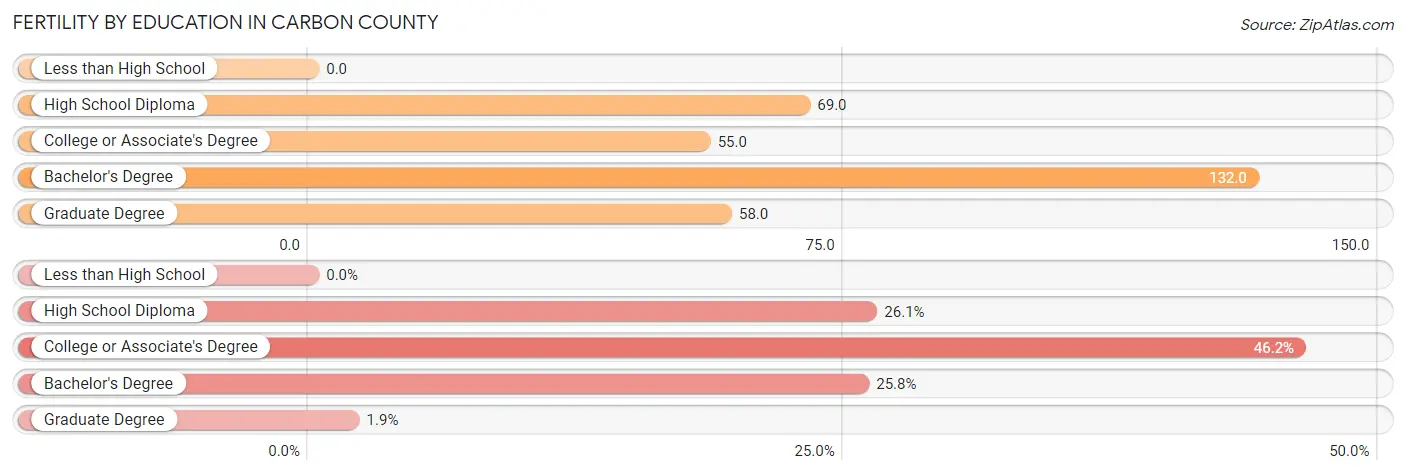
| Educational Attainment | Women with Births | Births / 1,000 Women |
| Less than High School | 0 (0.0%) | 0.0 |
| High School Diploma | 69 (26.1%) | 69.0 |
| College or Associate's Degree | 122 (46.2%) | 55.0 |
| Bachelor's Degree | 68 (25.8%) | 132.0 |
| Graduate Degree | 5 (1.9%) | 58.0 |
| Total | 264 (100.0%) | 58.0 |
Fertility by Education by Marriage Status in Carbon County
18.9% of women with births in Carbon County are unmarried. Women with the educational attainment of graduate degree are most likely to be married with 100.0% of them married at childbirth, while women with the educational attainment of college or associate's degree are least likely to be married with 22.1% of them unmarried at childbirth.
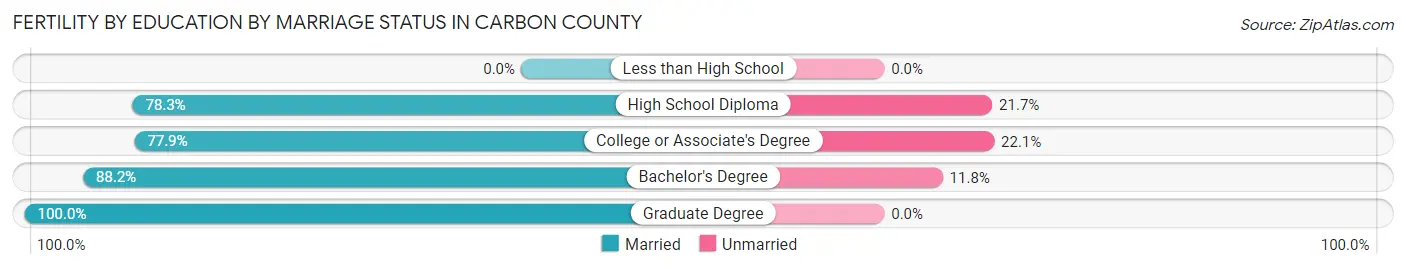
| Educational Attainment | Married | Unmarried |
| Less than High School | 0 (0.0%) | 0 (0.0%) |
| High School Diploma | 54 (78.3%) | 15 (21.7%) |
| College or Associate's Degree | 95 (77.9%) | 27 (22.1%) |
| Bachelor's Degree | 60 (88.2%) | 8 (11.8%) |
| Graduate Degree | 5 (100.0%) | 0 (0.0%) |
| Total | 214 (81.1%) | 50 (18.9%) |
Income in Carbon County
Income Overview in Carbon County
Per Capita Income in Carbon County is $26,450, while median incomes of families and households are $71,143 and $53,734 respectively.
| Characteristic | Number | Measure |
| Per Capita Income | 20,338 | $26,450 |
| Median Family Income | 5,372 | $71,143 |
| Mean Family Income | 5,372 | $78,481 |
| Median Household Income | 7,998 | $53,734 |
| Mean Household Income | 7,998 | $66,194 |
| Income Deficit | 5,372 | $9,509 |
| Wage / Income Gap (%) | 20,338 | 64.80% |
| Wage / Income Gap ($) | 20,338 | 35.20¢ per $1 |
| Gini / Inequality Index | 20,338 | 0.42 |
Earnings by Sex in Carbon County
Average Earnings in Carbon County are $30,142, $49,111 for men and $17,285 for women, a difference of 64.8%.
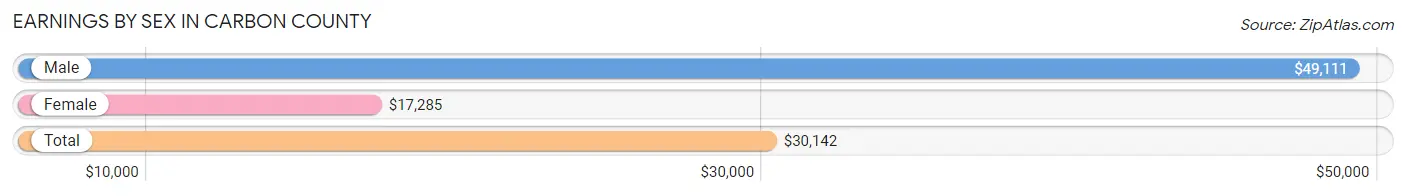
| Sex | Number | Average Earnings |
| Male | 4,981 (53.0%) | $49,111 |
| Female | 4,414 (47.0%) | $17,285 |
| Total | 9,395 (100.0%) | $30,142 |
Earnings by Sex by Income Bracket in Carbon County
The most common earnings brackets in Carbon County are $75,000 to $99,999 for men (771 | 15.5%) and $2,499 or less for women (620 | 14.1%).
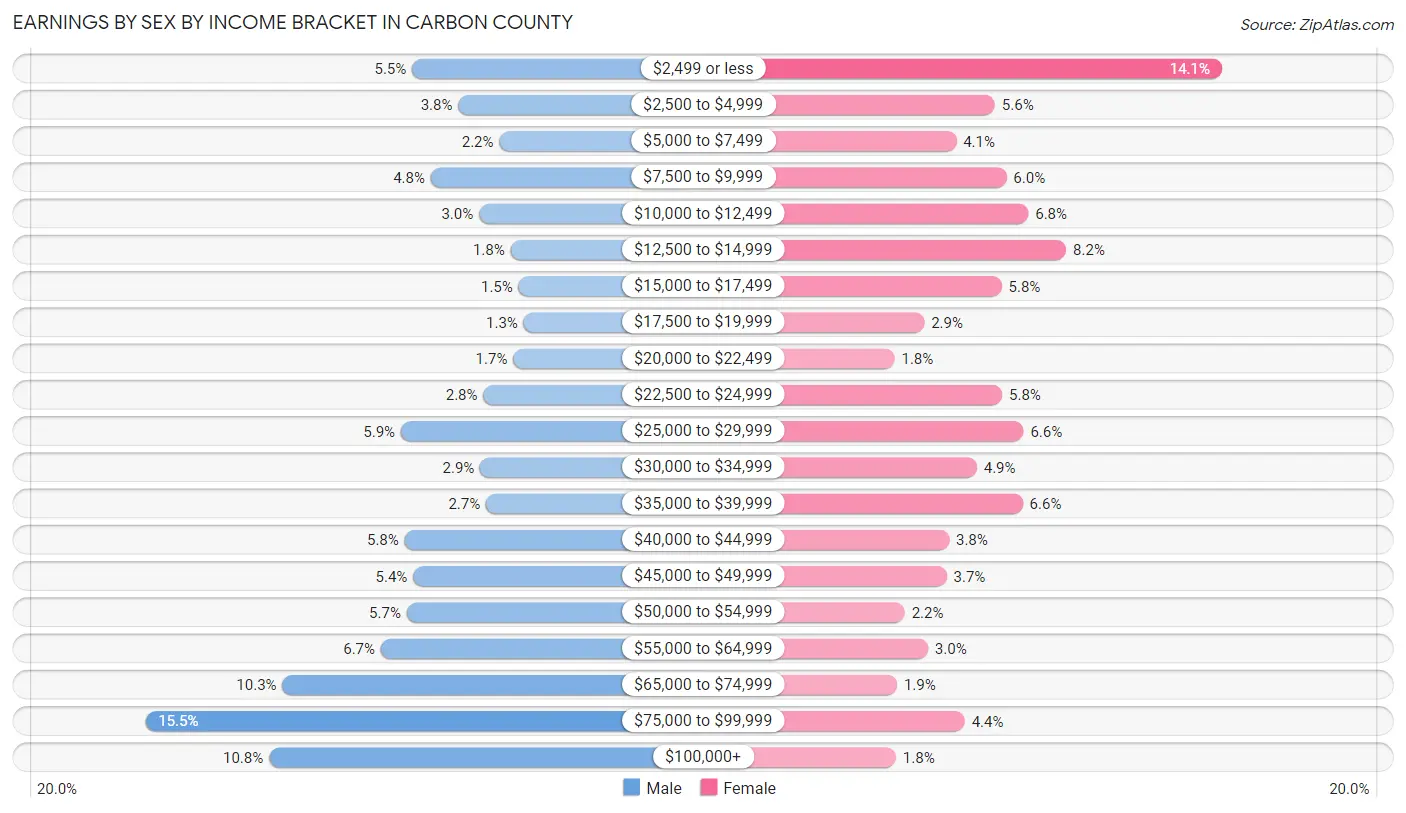
| Income | Male | Female |
| $2,499 or less | 273 (5.5%) | 620 (14.1%) |
| $2,500 to $4,999 | 187 (3.7%) | 245 (5.6%) |
| $5,000 to $7,499 | 110 (2.2%) | 181 (4.1%) |
| $7,500 to $9,999 | 238 (4.8%) | 264 (6.0%) |
| $10,000 to $12,499 | 148 (3.0%) | 300 (6.8%) |
| $12,500 to $14,999 | 89 (1.8%) | 363 (8.2%) |
| $15,000 to $17,499 | 74 (1.5%) | 256 (5.8%) |
| $17,500 to $19,999 | 65 (1.3%) | 128 (2.9%) |
| $20,000 to $22,499 | 84 (1.7%) | 79 (1.8%) |
| $22,500 to $24,999 | 140 (2.8%) | 257 (5.8%) |
| $25,000 to $29,999 | 294 (5.9%) | 292 (6.6%) |
| $30,000 to $34,999 | 146 (2.9%) | 215 (4.9%) |
| $35,000 to $39,999 | 135 (2.7%) | 291 (6.6%) |
| $40,000 to $44,999 | 287 (5.8%) | 169 (3.8%) |
| $45,000 to $49,999 | 271 (5.4%) | 165 (3.7%) |
| $50,000 to $54,999 | 283 (5.7%) | 96 (2.2%) |
| $55,000 to $64,999 | 331 (6.7%) | 134 (3.0%) |
| $65,000 to $74,999 | 515 (10.3%) | 83 (1.9%) |
| $75,000 to $99,999 | 771 (15.5%) | 195 (4.4%) |
| $100,000+ | 540 (10.8%) | 81 (1.8%) |
| Total | 4,981 (100.0%) | 4,414 (100.0%) |
Earnings by Sex by Educational Attainment in Carbon County
Average earnings in Carbon County are $56,025 for men and $22,506 for women, a difference of 59.8%. Men with an educational attainment of bachelor's degree enjoy the highest average annual earnings of $72,153, while those with less than high school education earn the least with $24,025. Women with an educational attainment of graduate degree earn the most with the average annual earnings of $38,456, while those with high school diploma education have the smallest earnings of $15,320.
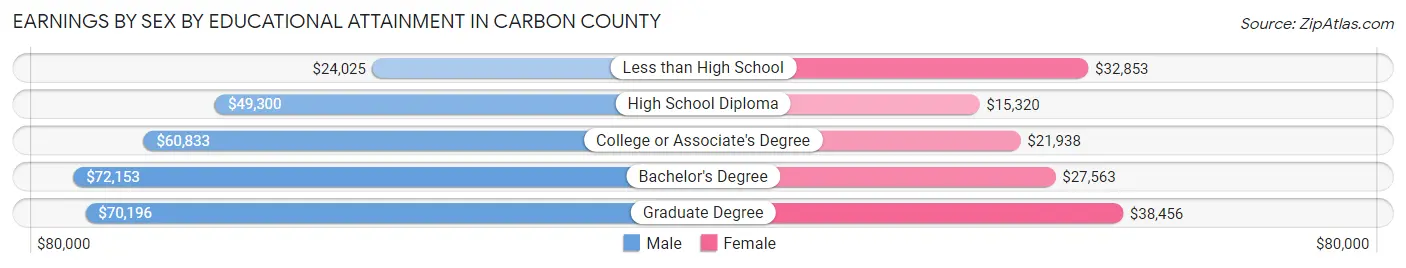
| Educational Attainment | Male Income | Female Income |
| Less than High School | $24,025 | $32,853 |
| High School Diploma | $49,300 | $15,320 |
| College or Associate's Degree | $60,833 | $21,938 |
| Bachelor's Degree | $72,153 | $27,563 |
| Graduate Degree | $70,196 | $38,456 |
| Total | $56,025 | $22,506 |
Family Income in Carbon County
Family Income Brackets in Carbon County
According to the Carbon County family income data, there are 1,139 families falling into the $75,000 to $99,999 income range, which is the most common income bracket and makes up 21.2% of all families. Conversely, the $10,000 to $14,999 income bracket is the least frequent group with only 124 families (2.3%) belonging to this category.
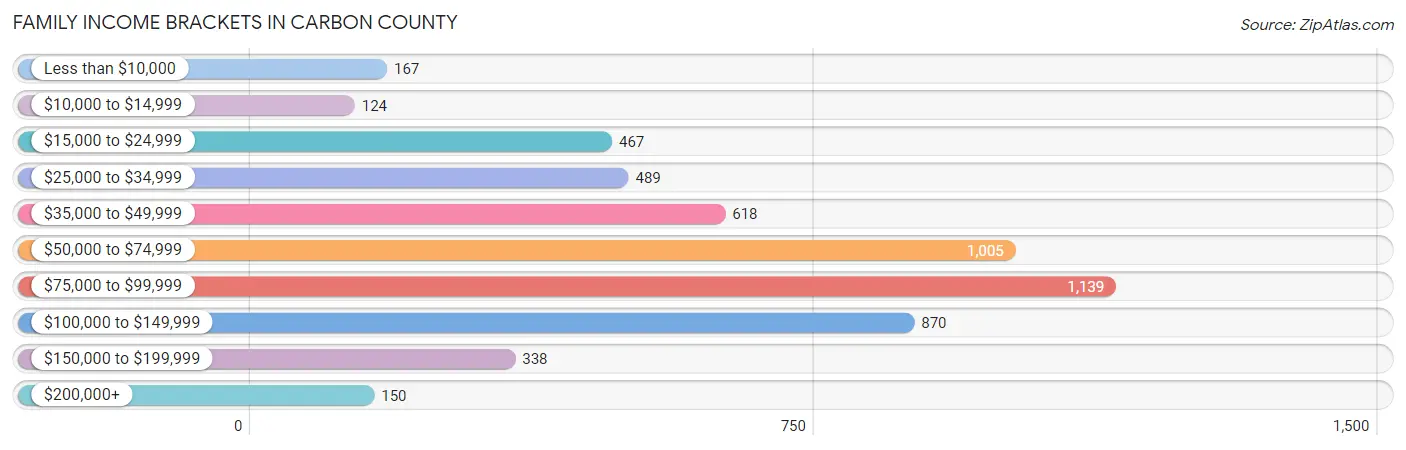
| Income Bracket | # Families | % Families |
| Less than $10,000 | 167 | 3.1% |
| $10,000 to $14,999 | 124 | 2.3% |
| $15,000 to $24,999 | 467 | 8.7% |
| $25,000 to $34,999 | 489 | 9.1% |
| $35,000 to $49,999 | 618 | 11.5% |
| $50,000 to $74,999 | 1,005 | 18.7% |
| $75,000 to $99,999 | 1,139 | 21.2% |
| $100,000 to $149,999 | 870 | 16.2% |
| $150,000 to $199,999 | 338 | 6.3% |
| $200,000+ | 150 | 2.8% |
Family Income by Famaliy Size in Carbon County
5-person families (616 | 11.5%) account for the highest median family income in Carbon County with $83,661 per family, while 2-person families (2,501 | 46.6%) have the highest median income of $32,002 per family member.
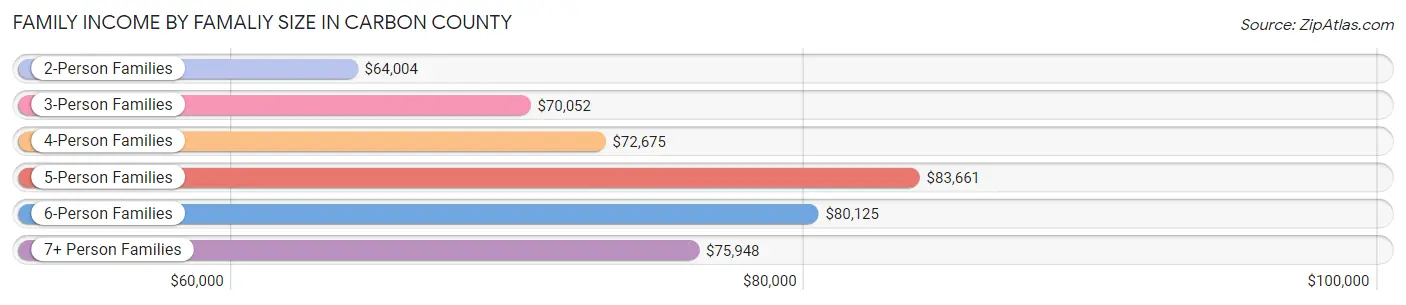
| Income Bracket | # Families | Median Income |
| 2-Person Families | 2,501 (46.6%) | $64,004 |
| 3-Person Families | 1,069 (19.9%) | $70,052 |
| 4-Person Families | 809 (15.1%) | $72,675 |
| 5-Person Families | 616 (11.5%) | $83,661 |
| 6-Person Families | 269 (5.0%) | $80,125 |
| 7+ Person Families | 108 (2.0%) | $75,948 |
| Total | 5,372 (100.0%) | $71,143 |
Family Income by Number of Earners in Carbon County
The median family income in Carbon County is $71,143, with families comprising 3+ earners (533) having the highest median family income of $94,954, while families with no earners (1,062) have the lowest median family income of $41,413, accounting for 9.9% and 19.8% of families, respectively.
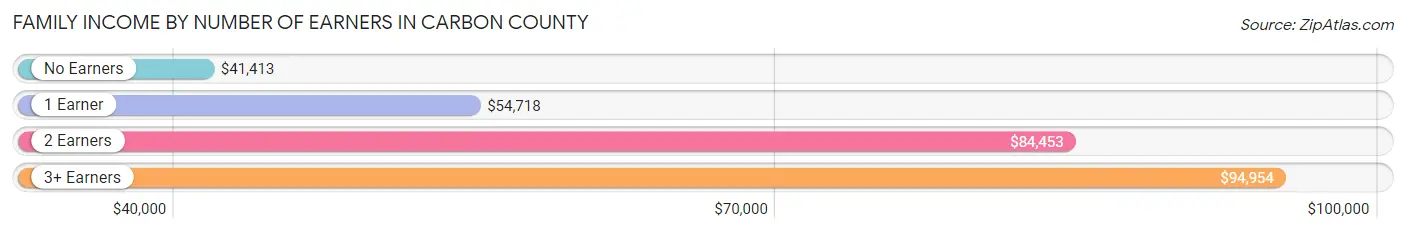
| Number of Earners | # Families | Median Income |
| No Earners | 1,062 (19.8%) | $41,413 |
| 1 Earner | 1,767 (32.9%) | $54,718 |
| 2 Earners | 2,010 (37.4%) | $84,453 |
| 3+ Earners | 533 (9.9%) | $94,954 |
| Total | 5,372 (100.0%) | $71,143 |
Household Income in Carbon County
Household Income Brackets in Carbon County
With 1,512 households falling in the category, the $50,000 to $74,999 income range is the most frequent in Carbon County, accounting for 18.9% of all households. In contrast, only 168 households (2.1%) fall into the $200,000+ income bracket, making it the least populous group.
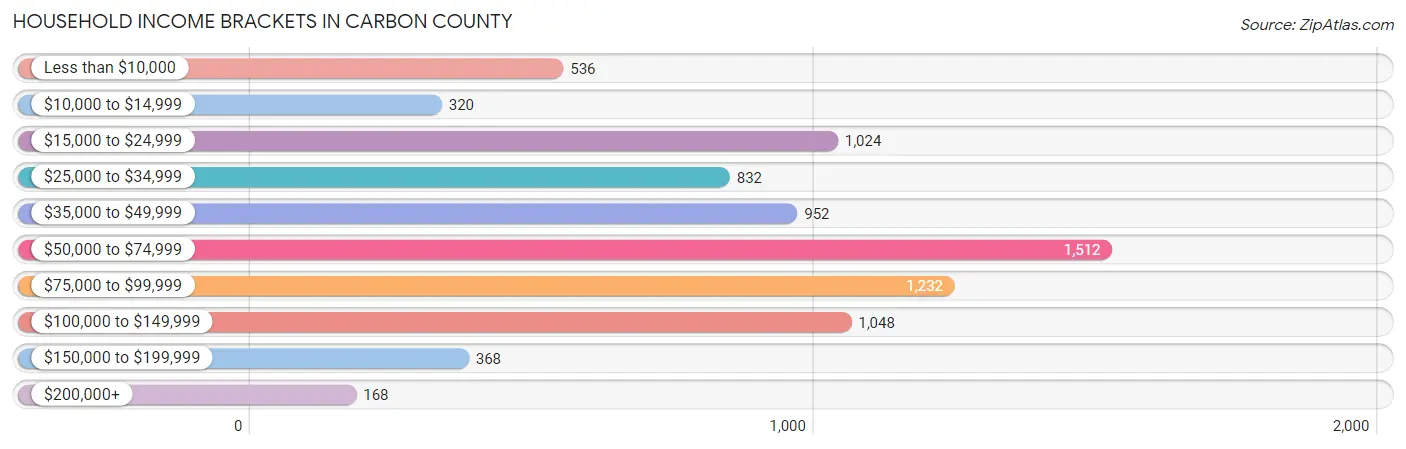
| Income Bracket | # Households | % Households |
| Less than $10,000 | 536 | 6.7% |
| $10,000 to $14,999 | 320 | 4.0% |
| $15,000 to $24,999 | 1,024 | 12.8% |
| $25,000 to $34,999 | 832 | 10.4% |
| $35,000 to $49,999 | 952 | 11.9% |
| $50,000 to $74,999 | 1,512 | 18.9% |
| $75,000 to $99,999 | 1,232 | 15.4% |
| $100,000 to $149,999 | 1,048 | 13.1% |
| $150,000 to $199,999 | 368 | 4.6% |
| $200,000+ | 168 | 2.1% |
Household Income by Householder Age in Carbon County
The median household income in Carbon County is $53,734, with the highest median household income of $62,215 found in the 25 to 44 years age bracket for the primary householder. A total of 2,457 households (30.7%) fall into this category. Meanwhile, the 65+ years age bracket for the primary householder has the lowest median household income of $48,167, with 2,447 households (30.6%) in this group.
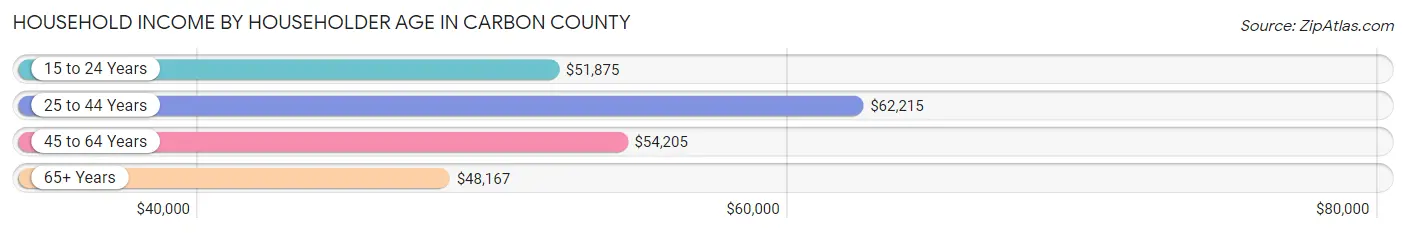
| Income Bracket | # Households | Median Income |
| 15 to 24 Years | 445 (5.6%) | $51,875 |
| 25 to 44 Years | 2,457 (30.7%) | $62,215 |
| 45 to 64 Years | 2,649 (33.1%) | $54,205 |
| 65+ Years | 2,447 (30.6%) | $48,167 |
| Total | 7,998 (100.0%) | $53,734 |
Poverty in Carbon County
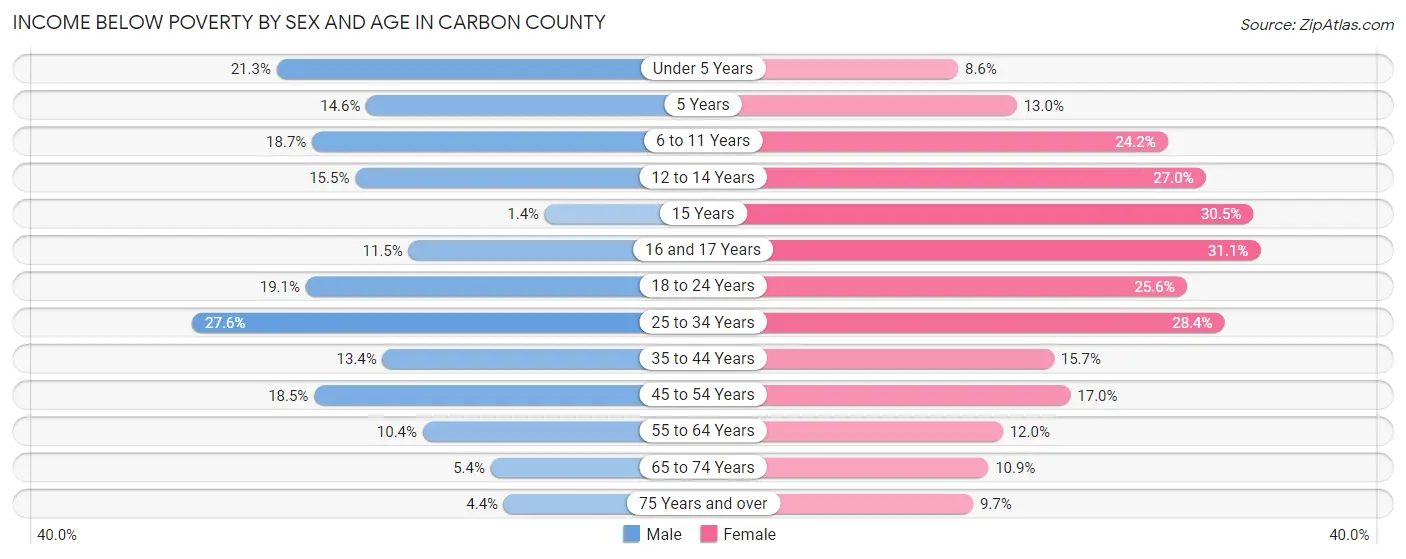
Income Below Poverty by Sex and Age in Carbon County
With 15.1% poverty level for males and 18.1% for females among the residents of Carbon County, 25 to 34 year old males and 16 and 17 year old females are the most vulnerable to poverty, with 331 males (27.6%) and 82 females (31.1%) in their respective age groups living below the poverty level.
| Age Bracket | Male | Female |
| Under 5 Years | 133 (21.3%) | 54 (8.6%) |
| 5 Years | 42 (14.6%) | 20 (13.0%) |
| 6 to 11 Years | 163 (18.6%) | 192 (24.2%) |
| 12 to 14 Years | 68 (15.4%) | 118 (27.0%) |
| 15 Years | 2 (1.4%) | 62 (30.5%) |
| 16 and 17 Years | 40 (11.5%) | 82 (31.1%) |
| 18 to 24 Years | 148 (19.1%) | 228 (25.6%) |
| 25 to 34 Years | 331 (27.6%) | 334 (28.4%) |
| 35 to 44 Years | 169 (13.4%) | 186 (15.7%) |
| 45 to 54 Years | 200 (18.5%) | 178 (17.0%) |
| 55 to 64 Years | 127 (10.4%) | 151 (11.9%) |
| 65 to 74 Years | 62 (5.4%) | 125 (10.9%) |
| 75 Years and over | 27 (4.4%) | 75 (9.7%) |
| Total | 1,512 (15.1%) | 1,805 (18.1%) |
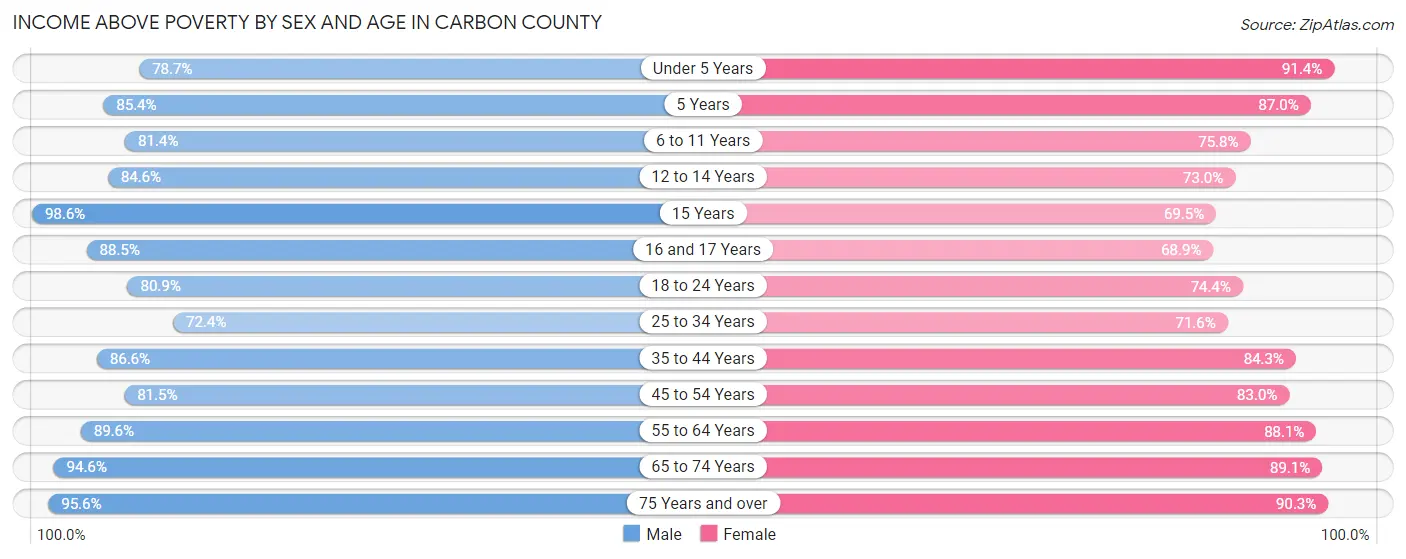
Income Above Poverty by Sex and Age in Carbon County
According to the poverty statistics in Carbon County, males aged 15 years and females aged under 5 years are the age groups that are most secure financially, with 98.6% of males and 91.4% of females in these age groups living above the poverty line.
| Age Bracket | Male | Female |
| Under 5 Years | 492 (78.7%) | 572 (91.4%) |
| 5 Years | 245 (85.4%) | 134 (87.0%) |
| 6 to 11 Years | 711 (81.4%) | 602 (75.8%) |
| 12 to 14 Years | 372 (84.6%) | 319 (73.0%) |
| 15 Years | 144 (98.6%) | 141 (69.5%) |
| 16 and 17 Years | 308 (88.5%) | 182 (68.9%) |
| 18 to 24 Years | 626 (80.9%) | 663 (74.4%) |
| 25 to 34 Years | 870 (72.4%) | 842 (71.6%) |
| 35 to 44 Years | 1,090 (86.6%) | 996 (84.3%) |
| 45 to 54 Years | 881 (81.5%) | 871 (83.0%) |
| 55 to 64 Years | 1,091 (89.6%) | 1,113 (88.0%) |
| 65 to 74 Years | 1,088 (94.6%) | 1,025 (89.1%) |
| 75 Years and over | 585 (95.6%) | 695 (90.3%) |
| Total | 8,503 (84.9%) | 8,155 (81.9%) |
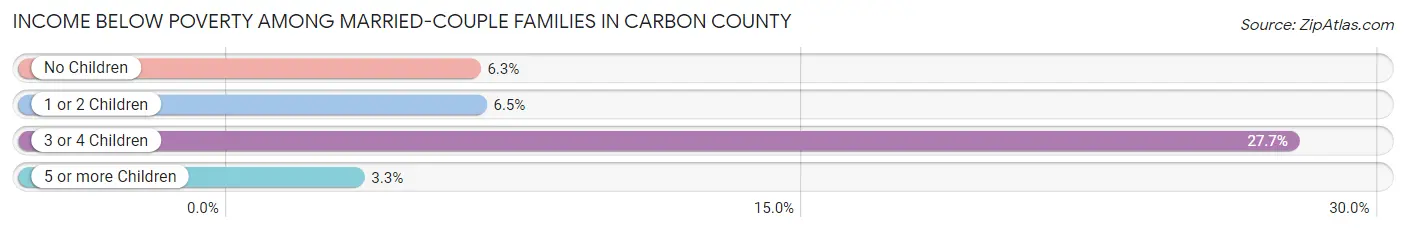
Income Below Poverty Among Married-Couple Families in Carbon County
The poverty statistics for married-couple families in Carbon County show that 9.5% or 416 of the total 4,377 families live below the poverty line. Families with 3 or 4 children have the highest poverty rate of 27.7%, comprising of 181 families. On the other hand, families with 5 or more children have the lowest poverty rate of 3.3%, which includes 3 families.
| Children | Above Poverty | Below Poverty |
| No Children | 2,206 (93.7%) | 149 (6.3%) |
| 1 or 2 Children | 1,195 (93.5%) | 83 (6.5%) |
| 3 or 4 Children | 472 (72.3%) | 181 (27.7%) |
| 5 or more Children | 88 (96.7%) | 3 (3.3%) |
| Total | 3,961 (90.5%) | 416 (9.5%) |
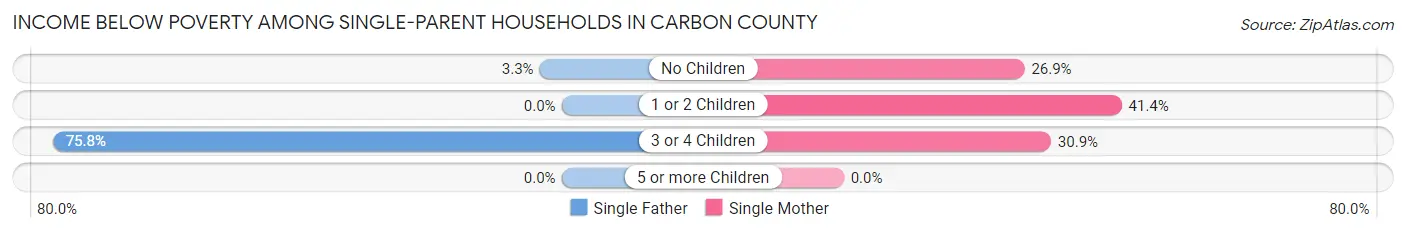
Income Below Poverty Among Single-Parent Households in Carbon County
According to the poverty data in Carbon County, 12.6% or 52 single-father households and 34.1% or 198 single-mother households are living below the poverty line. Among single-father households, those with 3 or 4 children have the highest poverty rate, with 47 households (75.8%) experiencing poverty. Likewise, among single-mother households, those with 1 or 2 children have the highest poverty rate, with 111 households (41.4%) falling below the poverty line.
| Children | Single Father | Single Mother |
| No Children | 5 (3.3%) | 66 (26.9%) |
| 1 or 2 Children | 0 (0.0%) | 111 (41.4%) |
| 3 or 4 Children | 47 (75.8%) | 21 (30.9%) |
| 5 or more Children | 0 (0.0%) | 0 (0.0%) |
| Total | 52 (12.6%) | 198 (34.1%) |
Income Below Poverty Among Married-Couple vs Single-Parent Households in Carbon County
The poverty data for Carbon County shows that 416 of the married-couple family households (9.5%) and 250 of the single-parent households (25.1%) are living below the poverty level. Within the married-couple family households, those with 3 or 4 children have the highest poverty rate, with 181 households (27.7%) falling below the poverty line. Among the single-parent households, those with 3 or 4 children have the highest poverty rate, with 68 household (52.3%) living below poverty.
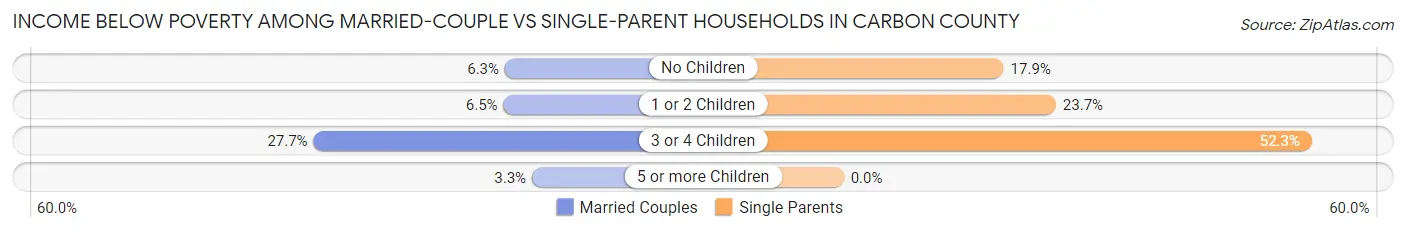
| Children | Married-Couple Families | Single-Parent Households |
| No Children | 149 (6.3%) | 71 (17.9%) |
| 1 or 2 Children | 83 (6.5%) | 111 (23.7%) |
| 3 or 4 Children | 181 (27.7%) | 68 (52.3%) |
| 5 or more Children | 3 (3.3%) | 0 (0.0%) |
| Total | 416 (9.5%) | 250 (25.1%) |
Employment Characteristics in Carbon County
Employment by Class of Employer in Carbon County
Among the 8,067 employed individuals in Carbon County, private company employees (5,339 | 66.2%), local government employees (930 | 11.5%), and state government employees (505 | 6.3%) make up the most common classes of employment.
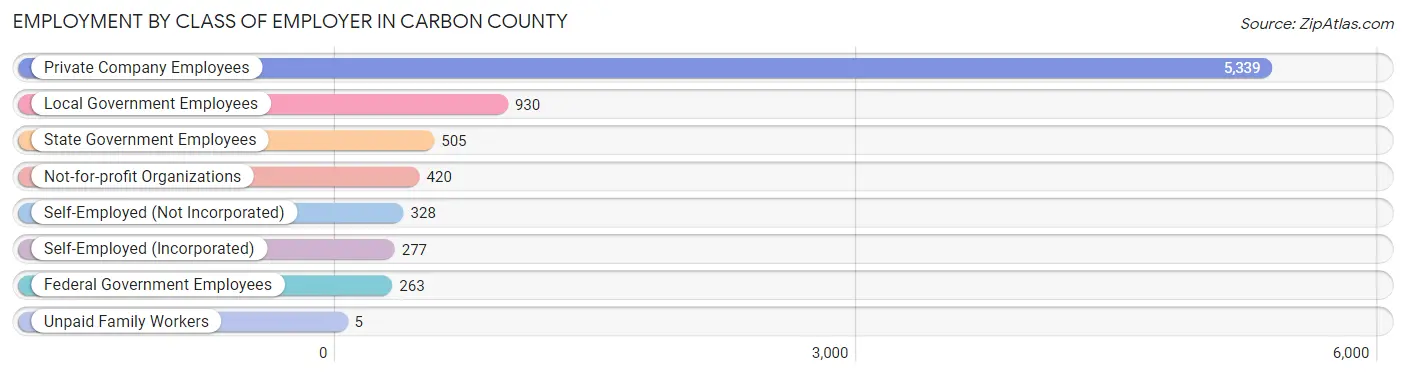
| Employer Class | # Employees | % Employees |
| Private Company Employees | 5,339 | 66.2% |
| Self-Employed (Incorporated) | 277 | 3.4% |
| Self-Employed (Not Incorporated) | 328 | 4.1% |
| Not-for-profit Organizations | 420 | 5.2% |
| Local Government Employees | 930 | 11.5% |
| State Government Employees | 505 | 6.3% |
| Federal Government Employees | 263 | 3.3% |
| Unpaid Family Workers | 5 | 0.1% |
| Total | 8,067 | 100.0% |
Employment Status by Age in Carbon County
According to the labor force statistics for Carbon County, out of the total population over 16 years of age (15,706), 56.7% or 8,905 individuals are in the labor force, with 6.7% or 597 of them unemployed. The age group with the highest labor force participation rate is 35 to 44 years, with 84.1% or 2,085 individuals in the labor force. Within the labor force, the 16 to 19 years age range has the highest percentage of unemployed individuals, with 19.8% or 127 of them being unemployed.
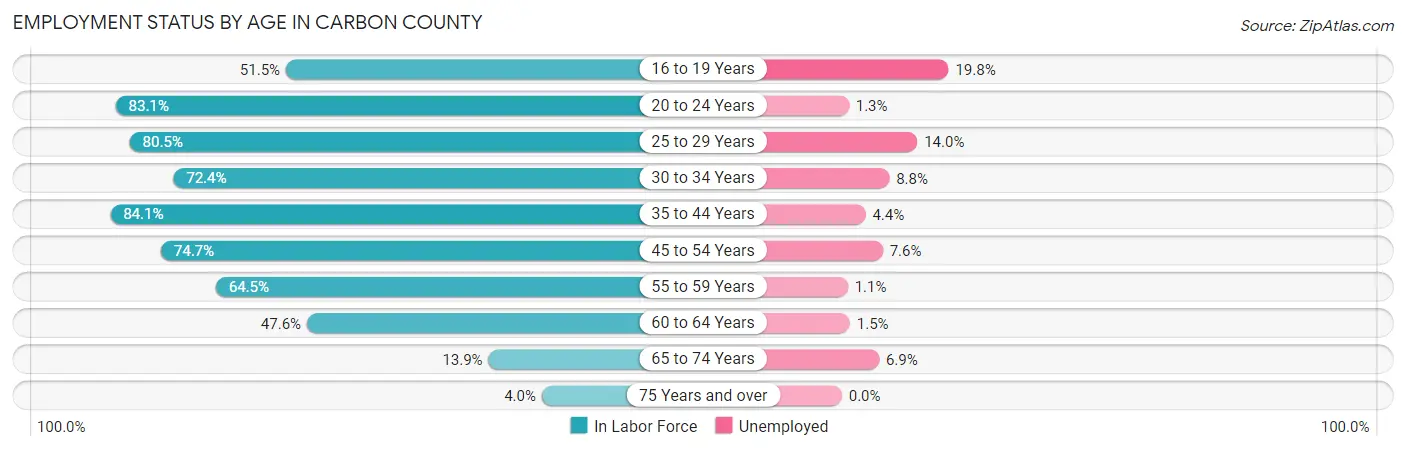
| Age Bracket | In Labor Force | Unemployed |
| 16 to 19 Years | 641 (51.5%) | 127 (19.8%) |
| 20 to 24 Years | 976 (83.1%) | 13 (1.3%) |
| 25 to 29 Years | 874 (80.5%) | 122 (14.0%) |
| 30 to 34 Years | 959 (72.4%) | 84 (8.8%) |
| 35 to 44 Years | 2,085 (84.1%) | 92 (4.4%) |
| 45 to 54 Years | 1,618 (74.7%) | 123 (7.6%) |
| 55 to 59 Years | 728 (64.5%) | 8 (1.1%) |
| 60 to 64 Years | 647 (47.6%) | 10 (1.5%) |
| 65 to 74 Years | 321 (13.9%) | 22 (6.9%) |
| 75 Years and over | 57 (4.0%) | 0 (0.0%) |
| Total | 8,905 (56.7%) | 597 (6.7%) |
Employment Status by Educational Attainment in Carbon County
According to labor force statistics for Carbon County, 72.4% of individuals (6,910) out of the total population between 25 and 64 years of age (9,544) are in the labor force, with 6.3% or 435 of them being unemployed. The group with the highest labor force participation rate are those with the educational attainment of bachelor's degree or higher, with 80.4% or 1,221 individuals in the labor force. Within the labor force, individuals with less than high school education have the highest percentage of unemployment, with 22.4% or 87 of them being unemployed.
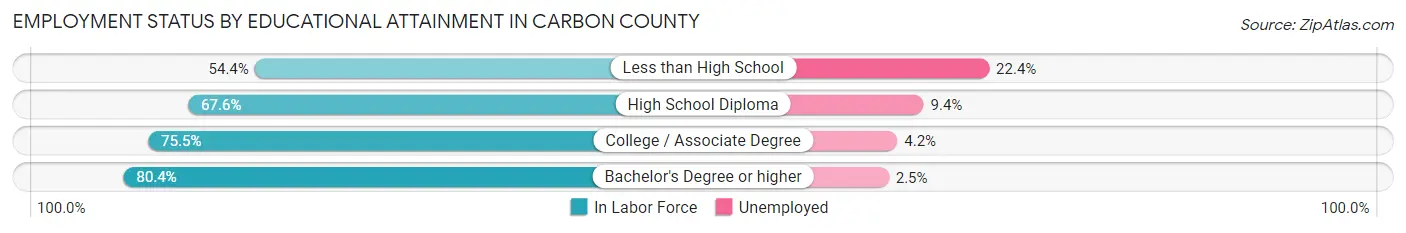
| Educational Attainment | In Labor Force | Unemployed |
| Less than High School | 389 (54.4%) | 160 (22.4%) |
| High School Diploma | 1,866 (67.6%) | 259 (9.4%) |
| College / Associate Degree | 3,435 (75.5%) | 191 (4.2%) |
| Bachelor's Degree or higher | 1,221 (80.4%) | 38 (2.5%) |
| Total | 6,910 (72.4%) | 601 (6.3%) |
Employment Occupations by Sex in Carbon County
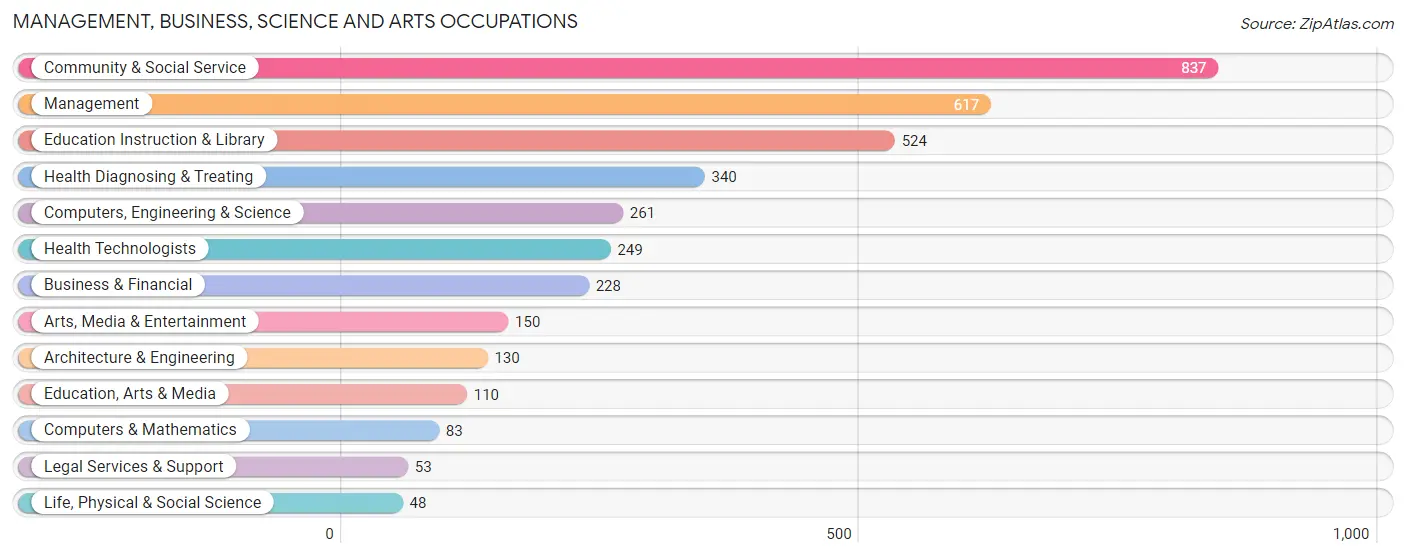
Management, Business, Science and Arts Occupations
The most common Management, Business, Science and Arts occupations in Carbon County are Community & Social Service (837 | 10.1%), Management (617 | 7.5%), Education Instruction & Library (524 | 6.4%), Health Diagnosing & Treating (340 | 4.1%), and Computers, Engineering & Science (261 | 3.2%).
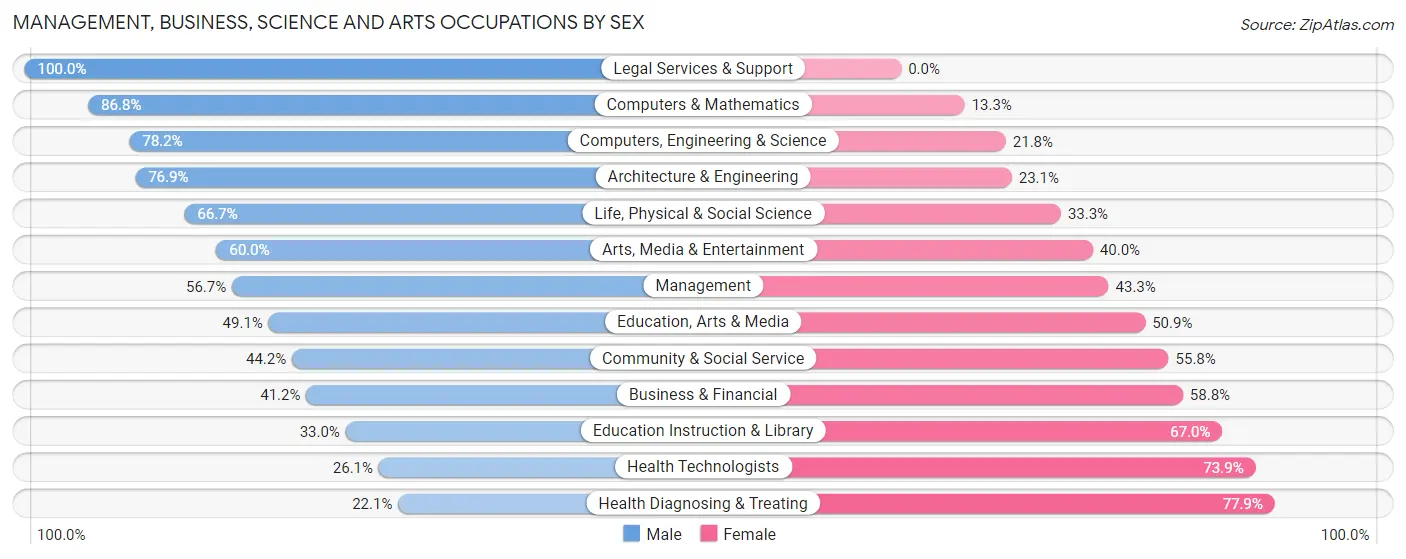
Management, Business, Science and Arts Occupations by Sex
Within the Management, Business, Science and Arts occupations in Carbon County, the most male-oriented occupations are Legal Services & Support (100.0%), Computers & Mathematics (86.8%), and Computers, Engineering & Science (78.2%), while the most female-oriented occupations are Health Diagnosing & Treating (77.9%), Health Technologists (73.9%), and Education Instruction & Library (67.0%).
| Occupation | Male | Female |
| Management | 350 (56.7%) | 267 (43.3%) |
| Business & Financial | 94 (41.2%) | 134 (58.8%) |
| Computers, Engineering & Science | 204 (78.2%) | 57 (21.8%) |
| Computers & Mathematics | 72 (86.8%) | 11 (13.3%) |
| Architecture & Engineering | 100 (76.9%) | 30 (23.1%) |
| Life, Physical & Social Science | 32 (66.7%) | 16 (33.3%) |
| Community & Social Service | 370 (44.2%) | 467 (55.8%) |
| Education, Arts & Media | 54 (49.1%) | 56 (50.9%) |
| Legal Services & Support | 53 (100.0%) | 0 (0.0%) |
| Education Instruction & Library | 173 (33.0%) | 351 (67.0%) |
| Arts, Media & Entertainment | 90 (60.0%) | 60 (40.0%) |
| Health Diagnosing & Treating | 75 (22.1%) | 265 (77.9%) |
| Health Technologists | 65 (26.1%) | 184 (73.9%) |
| Total (Category) | 1,093 (47.9%) | 1,190 (52.1%) |
| Total (Overall) | 4,442 (53.8%) | 3,814 (46.2%) |
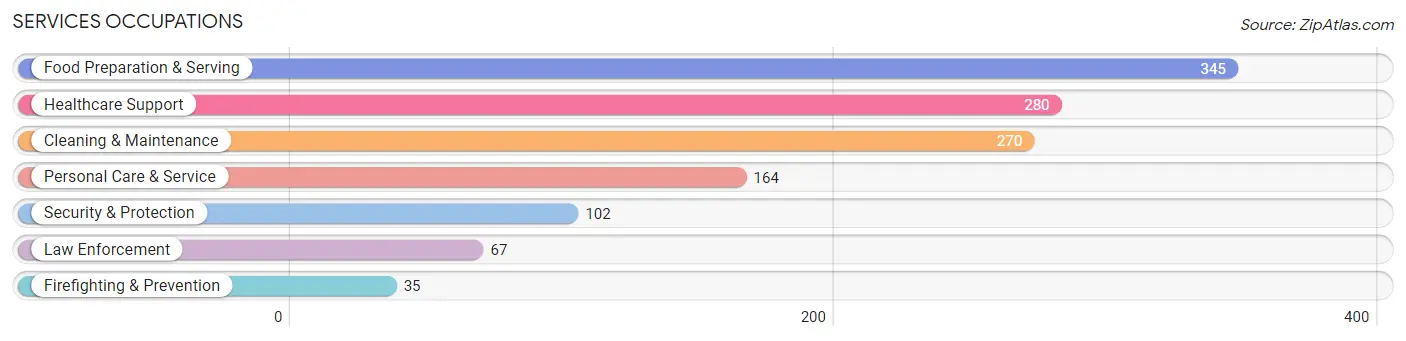
Services Occupations
The most common Services occupations in Carbon County are Food Preparation & Serving (345 | 4.2%), Healthcare Support (280 | 3.4%), Cleaning & Maintenance (270 | 3.3%), Personal Care & Service (164 | 2.0%), and Security & Protection (102 | 1.2%).
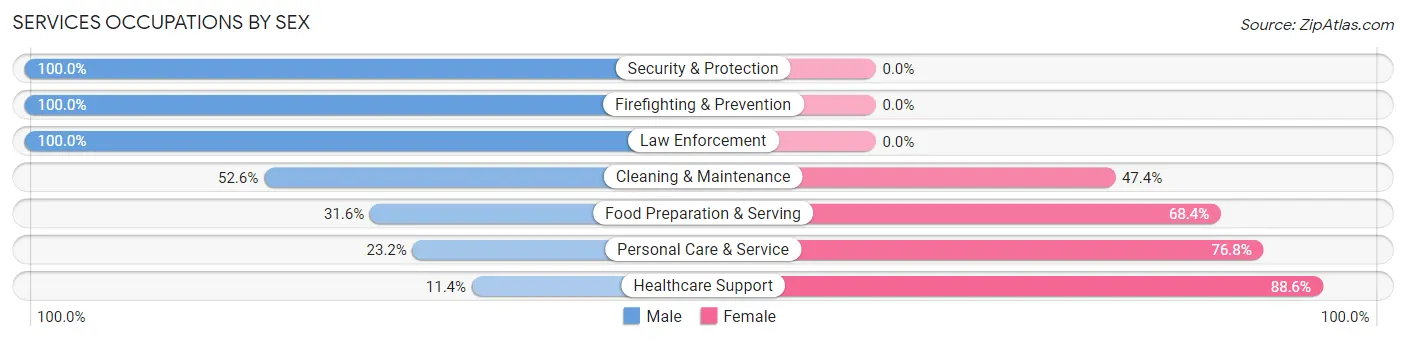
Services Occupations by Sex
Within the Services occupations in Carbon County, the most male-oriented occupations are Security & Protection (100.0%), Firefighting & Prevention (100.0%), and Law Enforcement (100.0%), while the most female-oriented occupations are Healthcare Support (88.6%), Personal Care & Service (76.8%), and Food Preparation & Serving (68.4%).
| Occupation | Male | Female |
| Healthcare Support | 32 (11.4%) | 248 (88.6%) |
| Security & Protection | 102 (100.0%) | 0 (0.0%) |
| Firefighting & Prevention | 35 (100.0%) | 0 (0.0%) |
| Law Enforcement | 67 (100.0%) | 0 (0.0%) |
| Food Preparation & Serving | 109 (31.6%) | 236 (68.4%) |
| Cleaning & Maintenance | 142 (52.6%) | 128 (47.4%) |
| Personal Care & Service | 38 (23.2%) | 126 (76.8%) |
| Total (Category) | 423 (36.4%) | 738 (63.6%) |
| Total (Overall) | 4,442 (53.8%) | 3,814 (46.2%) |
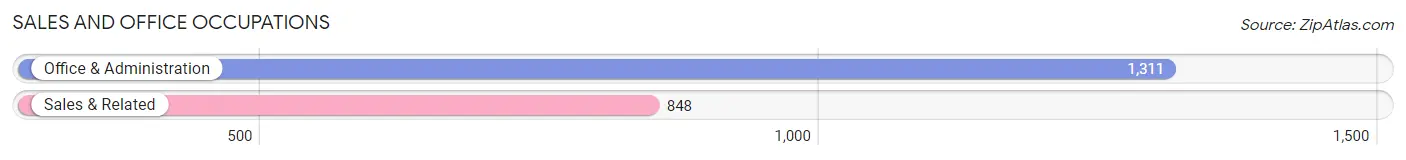
Sales and Office Occupations
The most common Sales and Office occupations in Carbon County are Office & Administration (1,311 | 15.9%), and Sales & Related (848 | 10.3%).
Sales and Office Occupations by Sex
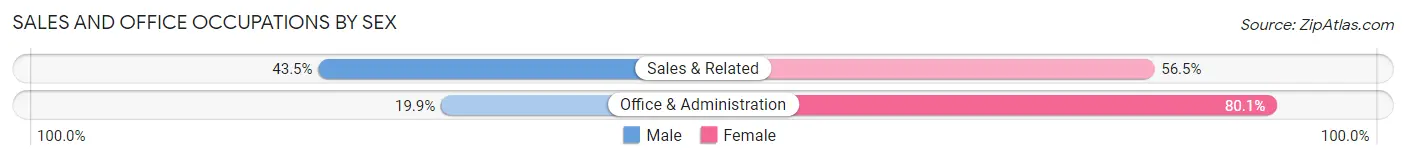
| Occupation | Male | Female |
| Sales & Related | 369 (43.5%) | 479 (56.5%) |
| Office & Administration | 261 (19.9%) | 1,050 (80.1%) |
| Total (Category) | 630 (29.2%) | 1,529 (70.8%) |
| Total (Overall) | 4,442 (53.8%) | 3,814 (46.2%) |
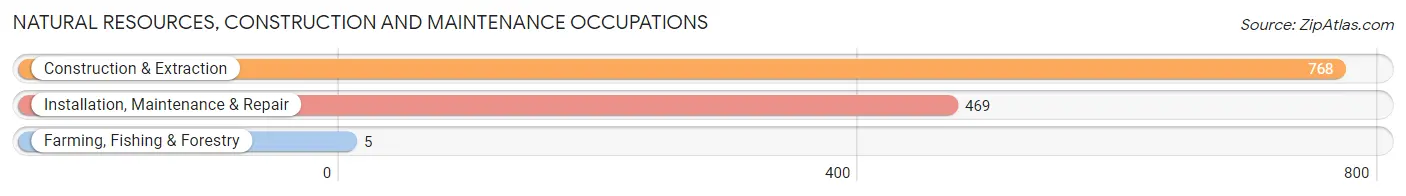
Natural Resources, Construction and Maintenance Occupations
The most common Natural Resources, Construction and Maintenance occupations in Carbon County are Construction & Extraction (768 | 9.3%), Installation, Maintenance & Repair (469 | 5.7%), and Farming, Fishing & Forestry (5 | 0.1%).
Natural Resources, Construction and Maintenance Occupations by Sex
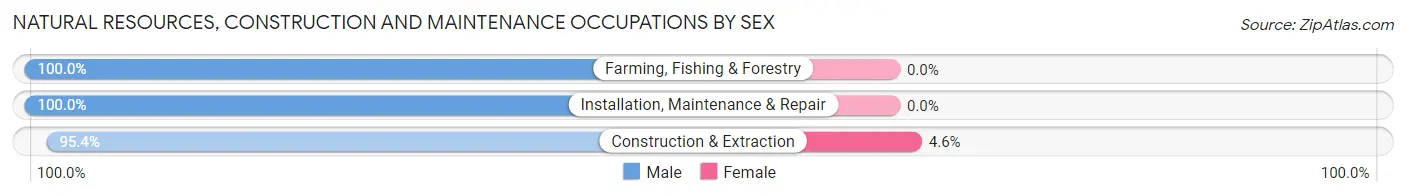
| Occupation | Male | Female |
| Farming, Fishing & Forestry | 5 (100.0%) | 0 (0.0%) |
| Construction & Extraction | 733 (95.4%) | 35 (4.6%) |
| Installation, Maintenance & Repair | 469 (100.0%) | 0 (0.0%) |
| Total (Category) | 1,207 (97.2%) | 35 (2.8%) |
| Total (Overall) | 4,442 (53.8%) | 3,814 (46.2%) |
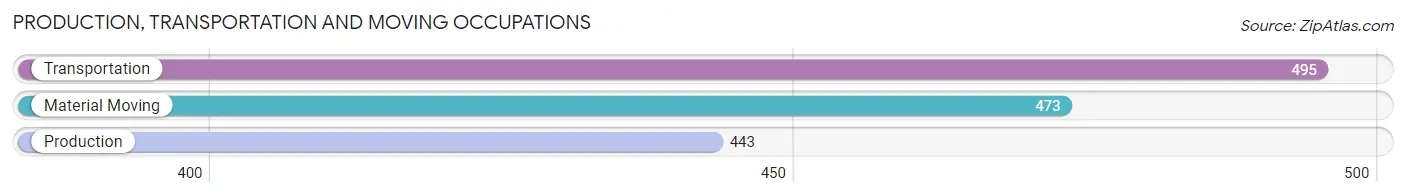
Production, Transportation and Moving Occupations
The most common Production, Transportation and Moving occupations in Carbon County are Transportation (495 | 6.0%), Material Moving (473 | 5.7%), and Production (443 | 5.4%).
Production, Transportation and Moving Occupations by Sex
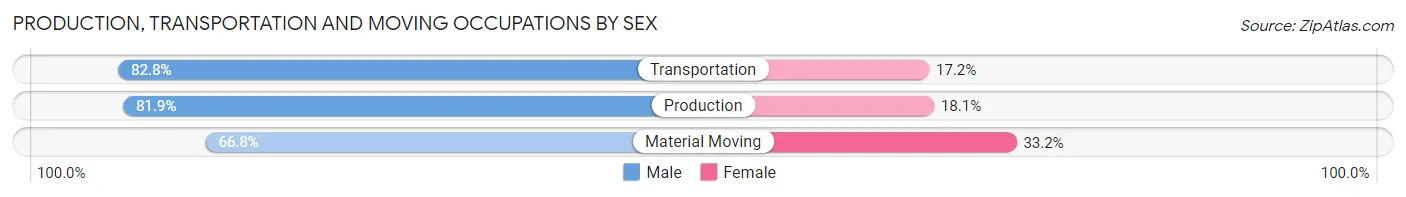
| Occupation | Male | Female |
| Production | 363 (81.9%) | 80 (18.1%) |
| Transportation | 410 (82.8%) | 85 (17.2%) |
| Material Moving | 316 (66.8%) | 157 (33.2%) |
| Total (Category) | 1,089 (77.2%) | 322 (22.8%) |
| Total (Overall) | 4,442 (53.8%) | 3,814 (46.2%) |
Employment Industries by Sex in Carbon County
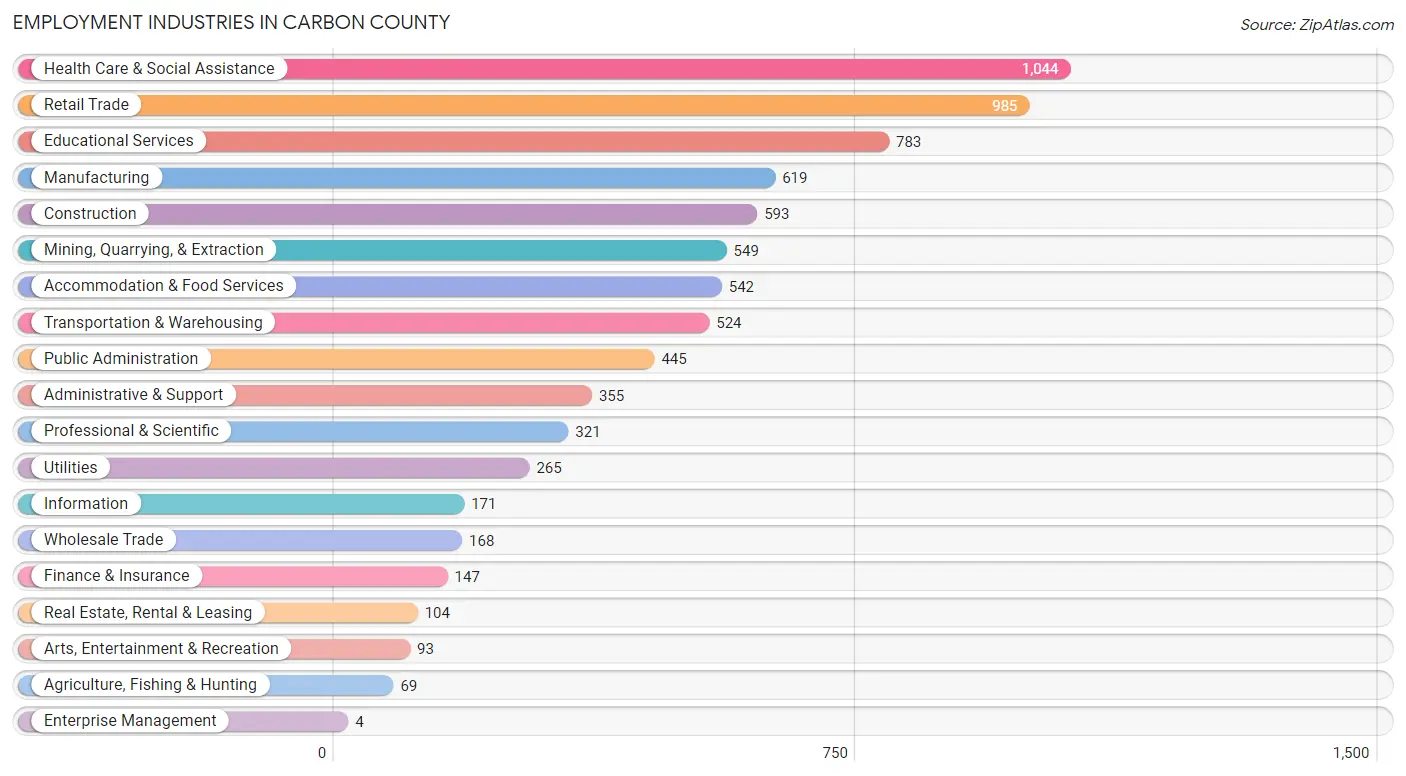
Employment Industries in Carbon County
The major employment industries in Carbon County include Health Care & Social Assistance (1,044 | 12.7%), Retail Trade (985 | 11.9%), Educational Services (783 | 9.5%), Manufacturing (619 | 7.5%), and Construction (593 | 7.2%).
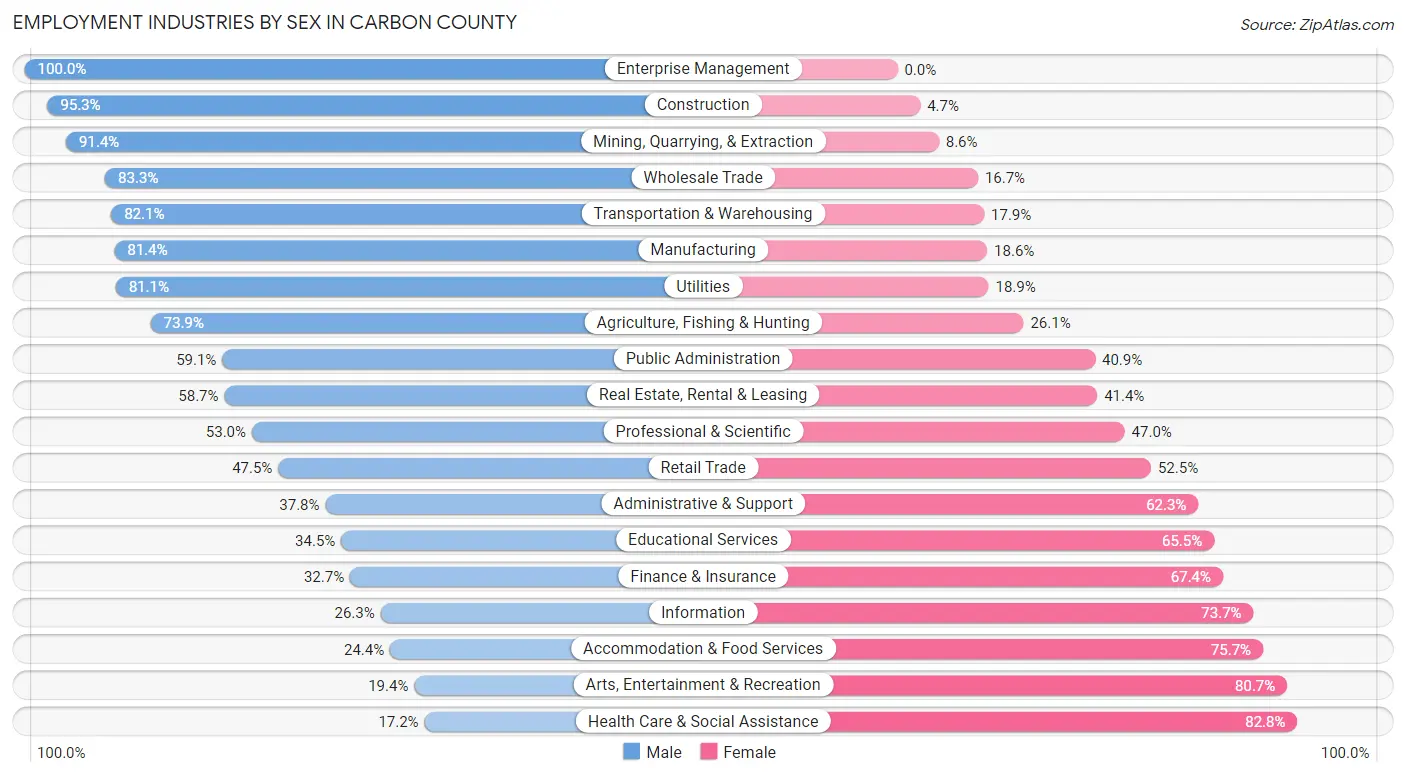
Employment Industries by Sex in Carbon County
The Carbon County industries that see more men than women are Enterprise Management (100.0%), Construction (95.3%), and Mining, Quarrying, & Extraction (91.4%), whereas the industries that tend to have a higher number of women are Health Care & Social Assistance (82.8%), Arts, Entertainment & Recreation (80.6%), and Accommodation & Food Services (75.6%).
| Industry | Male | Female |
| Agriculture, Fishing & Hunting | 51 (73.9%) | 18 (26.1%) |
| Mining, Quarrying, & Extraction | 502 (91.4%) | 47 (8.6%) |
| Construction | 565 (95.3%) | 28 (4.7%) |
| Manufacturing | 504 (81.4%) | 115 (18.6%) |
| Wholesale Trade | 140 (83.3%) | 28 (16.7%) |
| Retail Trade | 468 (47.5%) | 517 (52.5%) |
| Transportation & Warehousing | 430 (82.1%) | 94 (17.9%) |
| Utilities | 215 (81.1%) | 50 (18.9%) |
| Information | 45 (26.3%) | 126 (73.7%) |
| Finance & Insurance | 48 (32.7%) | 99 (67.3%) |
| Real Estate, Rental & Leasing | 61 (58.7%) | 43 (41.3%) |
| Professional & Scientific | 170 (53.0%) | 151 (47.0%) |
| Enterprise Management | 4 (100.0%) | 0 (0.0%) |
| Administrative & Support | 134 (37.8%) | 221 (62.3%) |
| Educational Services | 270 (34.5%) | 513 (65.5%) |
| Health Care & Social Assistance | 180 (17.2%) | 864 (82.8%) |
| Arts, Entertainment & Recreation | 18 (19.4%) | 75 (80.6%) |
| Accommodation & Food Services | 132 (24.3%) | 410 (75.6%) |
| Public Administration | 263 (59.1%) | 182 (40.9%) |
| Total | 4,442 (53.8%) | 3,814 (46.2%) |
Education in Carbon County
School Enrollment in Carbon County
The most common levels of schooling among the 5,165 students in Carbon County are high school (1,198 | 23.2%), middle school (1,170 | 22.7%), and elementary school (1,075 | 20.8%).
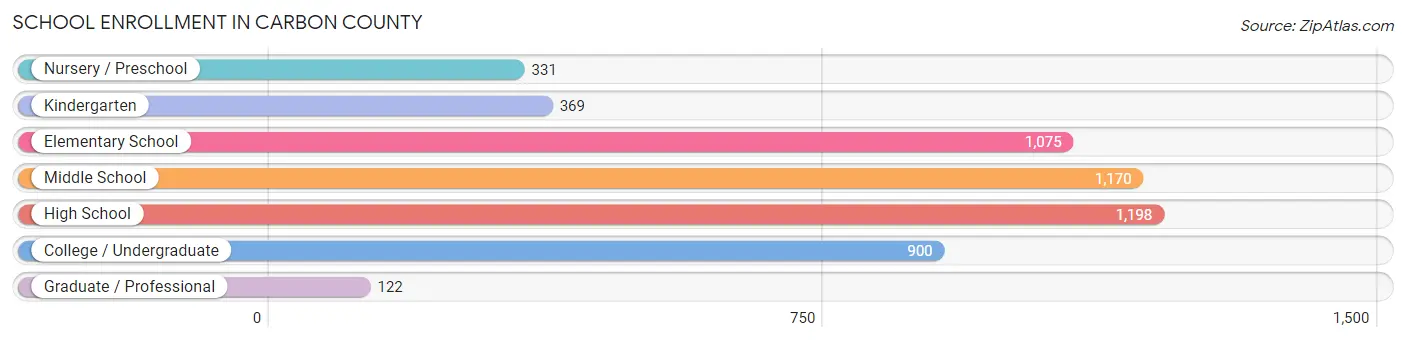
| School Level | # Students | % Students |
| Nursery / Preschool | 331 | 6.4% |
| Kindergarten | 369 | 7.1% |
| Elementary School | 1,075 | 20.8% |
| Middle School | 1,170 | 22.7% |
| High School | 1,198 | 23.2% |
| College / Undergraduate | 900 | 17.4% |
| Graduate / Professional | 122 | 2.4% |
| Total | 5,165 | 100.0% |
School Enrollment by Age by Funding Source in Carbon County
Out of a total of 5,165 students who are enrolled in schools in Carbon County, 413 (8.0%) attend a private institution, while the remaining 4,752 (92.0%) are enrolled in public schools. The age group of 3 to 4 year olds has the highest likelihood of being enrolled in private schools, with 34 (16.5% in the age bracket) enrolled. Conversely, the age group of 15 to 17 year olds has the lowest likelihood of being enrolled in a private school, with 880 (96.5% in the age bracket) attending a public institution.
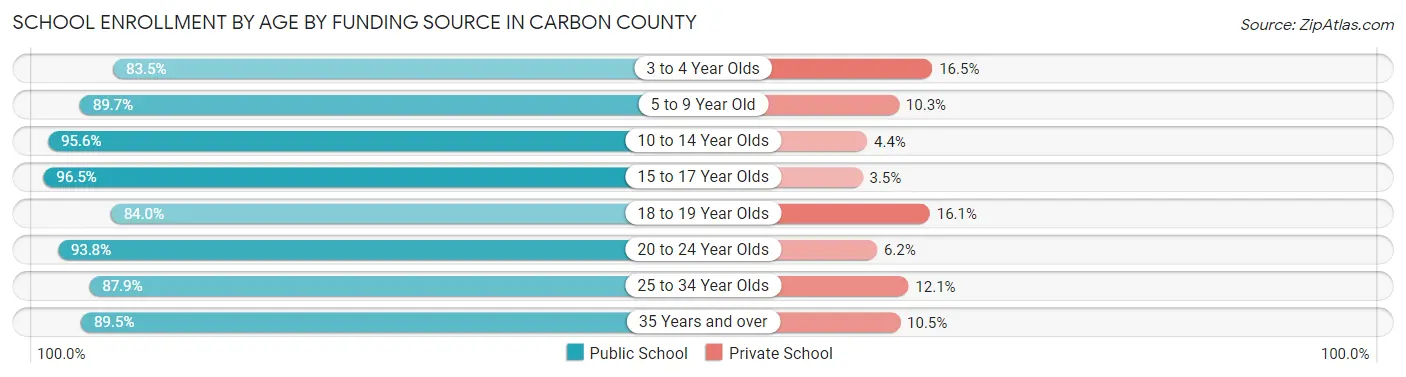
| Age Bracket | Public School | Private School |
| 3 to 4 Year Olds | 172 (83.5%) | 34 (16.5%) |
| 5 to 9 Year Old | 1,317 (89.7%) | 151 (10.3%) |
| 10 to 14 Year Olds | 1,339 (95.6%) | 61 (4.4%) |
| 15 to 17 Year Olds | 880 (96.5%) | 32 (3.5%) |
| 18 to 19 Year Olds | 293 (84.0%) | 56 (16.1%) |
| 20 to 24 Year Olds | 242 (93.8%) | 16 (6.2%) |
| 25 to 34 Year Olds | 277 (87.9%) | 38 (12.1%) |
| 35 Years and over | 230 (89.5%) | 27 (10.5%) |
| Total | 4,752 (92.0%) | 413 (8.0%) |
Educational Attainment by Field of Study in Carbon County
Education (547 | 22.9%), science & technology (291 | 12.2%), business (246 | 10.3%), arts & humanities (245 | 10.3%), and psychology (176 | 7.4%) are the most common fields of study among 2,385 individuals in Carbon County who have obtained a bachelor's degree or higher.
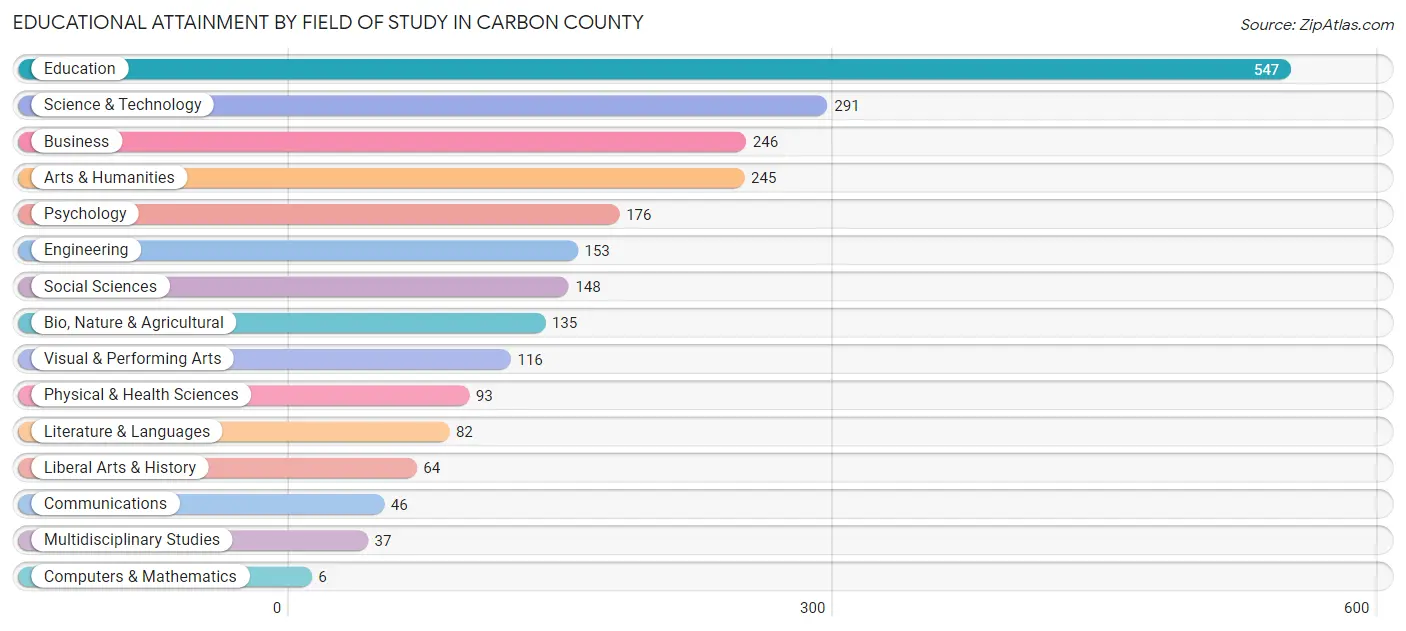
| Field of Study | # Graduates | % Graduates |
| Computers & Mathematics | 6 | 0.3% |
| Bio, Nature & Agricultural | 135 | 5.7% |
| Physical & Health Sciences | 93 | 3.9% |
| Psychology | 176 | 7.4% |
| Social Sciences | 148 | 6.2% |
| Engineering | 153 | 6.4% |
| Multidisciplinary Studies | 37 | 1.5% |
| Science & Technology | 291 | 12.2% |
| Business | 246 | 10.3% |
| Education | 547 | 22.9% |
| Literature & Languages | 82 | 3.4% |
| Liberal Arts & History | 64 | 2.7% |
| Visual & Performing Arts | 116 | 4.9% |
| Communications | 46 | 1.9% |
| Arts & Humanities | 245 | 10.3% |
| Total | 2,385 | 100.0% |
Transportation & Commute in Carbon County
Vehicle Availability by Sex in Carbon County
The most prevalent vehicle ownership categories in Carbon County are males with 2 vehicles (1,677, accounting for 38.2%) and females with 2 vehicles (1,243, making up 47.0%).
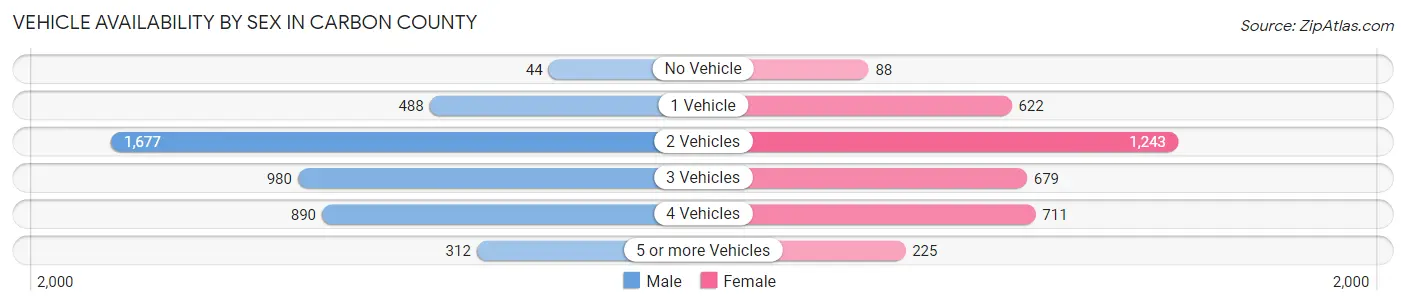
| Vehicles Available | Male | Female |
| No Vehicle | 44 (1.0%) | 88 (2.5%) |
| 1 Vehicle | 488 (11.1%) | 622 (17.4%) |
| 2 Vehicles | 1,677 (38.2%) | 1,243 (34.8%) |
| 3 Vehicles | 980 (22.3%) | 679 (19.0%) |
| 4 Vehicles | 890 (20.3%) | 711 (19.9%) |
| 5 or more Vehicles | 312 (7.1%) | 225 (6.3%) |
| Total | 4,391 (100.0%) | 3,568 (100.0%) |
Commute Time in Carbon County
The most frequently occuring commute durations in Carbon County are 5 to 9 minutes (1,840 commuters, 24.3%), 15 to 19 minutes (1,502 commuters, 19.9%), and 10 to 14 minutes (1,473 commuters, 19.5%).
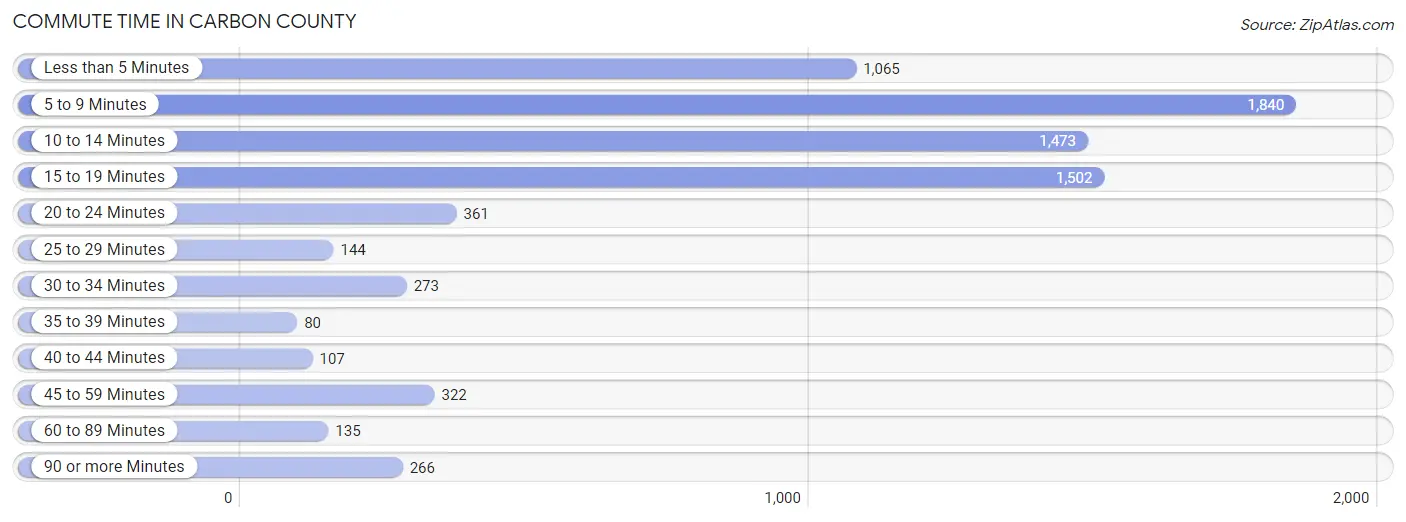
| Commute Time | # Commuters | % Commuters |
| Less than 5 Minutes | 1,065 | 14.1% |
| 5 to 9 Minutes | 1,840 | 24.3% |
| 10 to 14 Minutes | 1,473 | 19.5% |
| 15 to 19 Minutes | 1,502 | 19.9% |
| 20 to 24 Minutes | 361 | 4.8% |
| 25 to 29 Minutes | 144 | 1.9% |
| 30 to 34 Minutes | 273 | 3.6% |
| 35 to 39 Minutes | 80 | 1.1% |
| 40 to 44 Minutes | 107 | 1.4% |
| 45 to 59 Minutes | 322 | 4.3% |
| 60 to 89 Minutes | 135 | 1.8% |
| 90 or more Minutes | 266 | 3.5% |
Commute Time by Sex in Carbon County
The most common commute times in Carbon County are 5 to 9 minutes (1,054 commuters, 24.9%) for males and 5 to 9 minutes (786 commuters, 23.6%) for females.
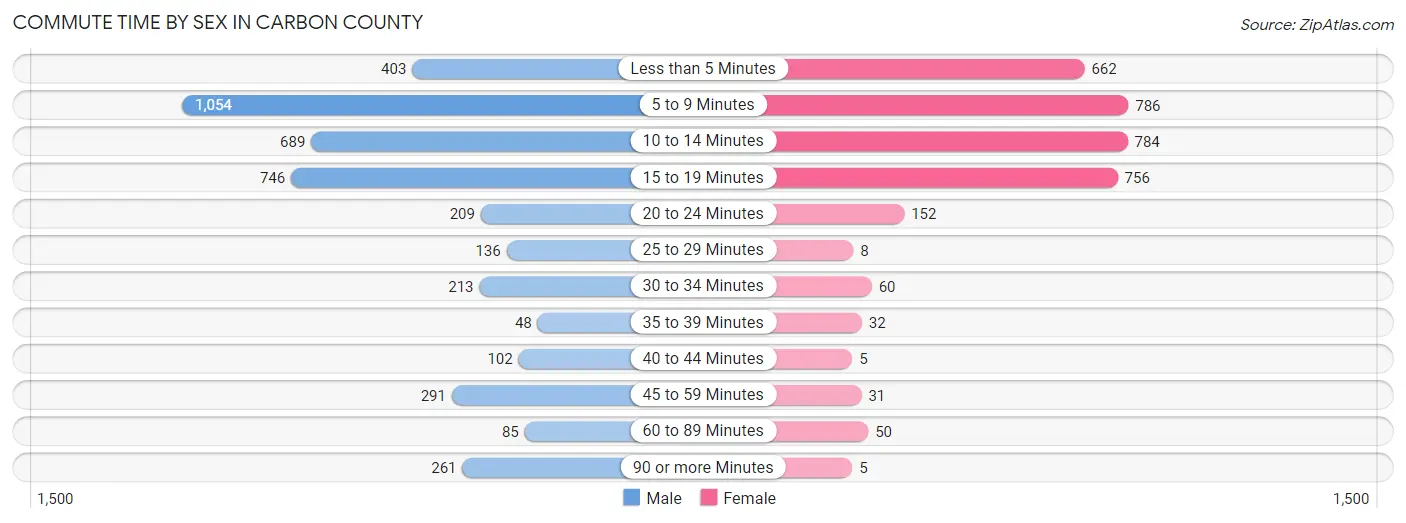
| Commute Time | Male | Female |
| Less than 5 Minutes | 403 (9.5%) | 662 (19.9%) |
| 5 to 9 Minutes | 1,054 (24.9%) | 786 (23.6%) |
| 10 to 14 Minutes | 689 (16.3%) | 784 (23.5%) |
| 15 to 19 Minutes | 746 (17.6%) | 756 (22.7%) |
| 20 to 24 Minutes | 209 (4.9%) | 152 (4.6%) |
| 25 to 29 Minutes | 136 (3.2%) | 8 (0.2%) |
| 30 to 34 Minutes | 213 (5.0%) | 60 (1.8%) |
| 35 to 39 Minutes | 48 (1.1%) | 32 (1.0%) |
| 40 to 44 Minutes | 102 (2.4%) | 5 (0.2%) |
| 45 to 59 Minutes | 291 (6.9%) | 31 (0.9%) |
| 60 to 89 Minutes | 85 (2.0%) | 50 (1.5%) |
| 90 or more Minutes | 261 (6.2%) | 5 (0.2%) |
Time of Departure to Work by Sex in Carbon County
The most frequent times of departure to work in Carbon County are 12:00 AM to 4:59 AM (582, 13.7%) for males and 7:30 AM to 7:59 AM (679, 20.4%) for females.
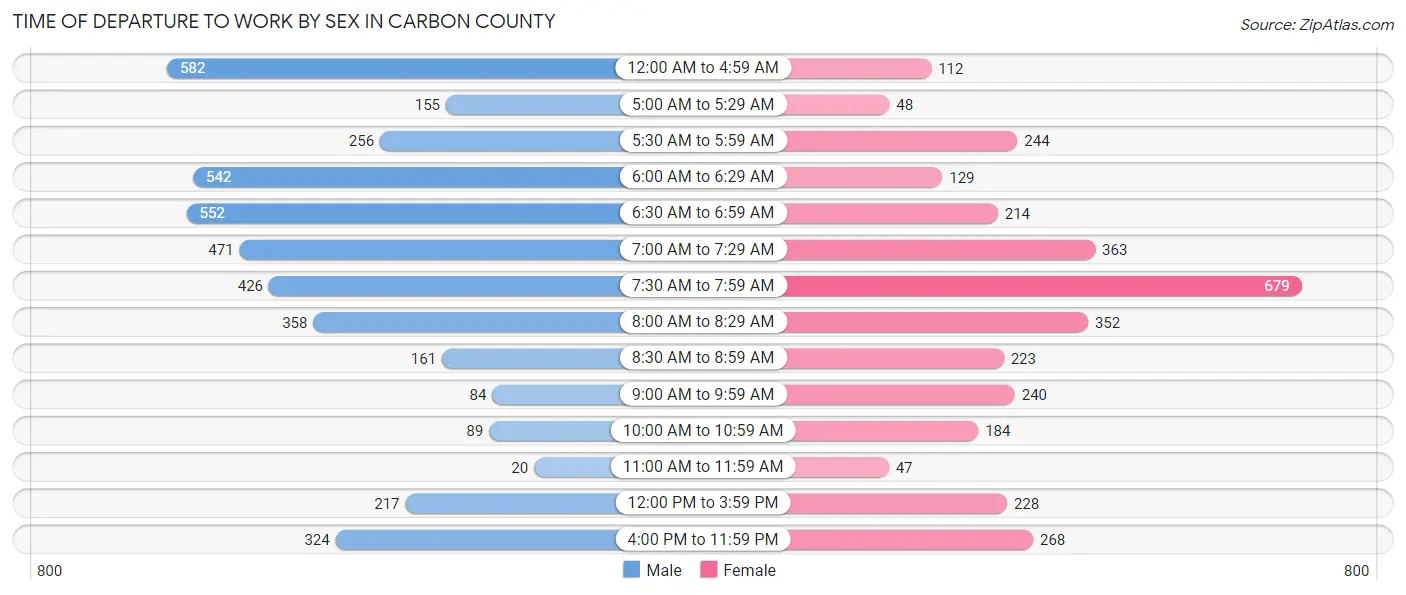
| Time of Departure | Male | Female |
| 12:00 AM to 4:59 AM | 582 (13.7%) | 112 (3.4%) |
| 5:00 AM to 5:29 AM | 155 (3.7%) | 48 (1.4%) |
| 5:30 AM to 5:59 AM | 256 (6.0%) | 244 (7.3%) |
| 6:00 AM to 6:29 AM | 542 (12.8%) | 129 (3.9%) |
| 6:30 AM to 6:59 AM | 552 (13.0%) | 214 (6.4%) |
| 7:00 AM to 7:29 AM | 471 (11.1%) | 363 (10.9%) |
| 7:30 AM to 7:59 AM | 426 (10.1%) | 679 (20.4%) |
| 8:00 AM to 8:29 AM | 358 (8.5%) | 352 (10.6%) |
| 8:30 AM to 8:59 AM | 161 (3.8%) | 223 (6.7%) |
| 9:00 AM to 9:59 AM | 84 (2.0%) | 240 (7.2%) |
| 10:00 AM to 10:59 AM | 89 (2.1%) | 184 (5.5%) |
| 11:00 AM to 11:59 AM | 20 (0.5%) | 47 (1.4%) |
| 12:00 PM to 3:59 PM | 217 (5.1%) | 228 (6.8%) |
| 4:00 PM to 11:59 PM | 324 (7.6%) | 268 (8.1%) |
| Total | 4,237 (100.0%) | 3,331 (100.0%) |
Housing Occupancy in Carbon County
Occupancy by Ownership in Carbon County
Of the total 7,998 dwellings in Carbon County, owner-occupied units account for 5,355 (66.9%), while renter-occupied units make up 2,643 (33.1%).
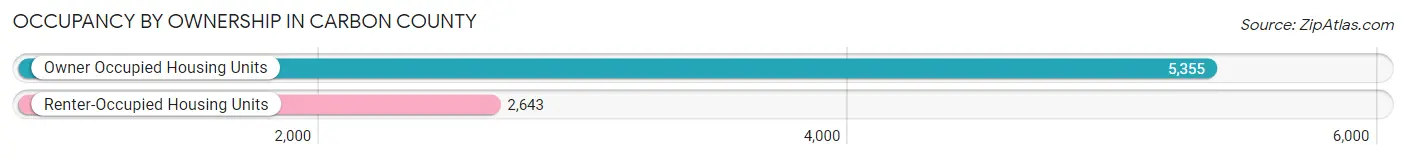
| Occupancy | # Housing Units | % Housing Units |
| Owner Occupied Housing Units | 5,355 | 66.9% |
| Renter-Occupied Housing Units | 2,643 | 33.1% |
| Total Occupied Housing Units | 7,998 | 100.0% |
Occupancy by Household Size in Carbon County
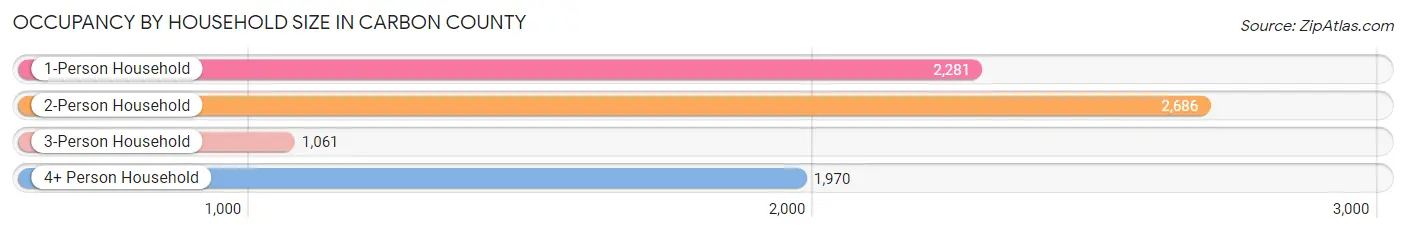
| Household Size | # Housing Units | % Housing Units |
| 1-Person Household | 2,281 | 28.5% |
| 2-Person Household | 2,686 | 33.6% |
| 3-Person Household | 1,061 | 13.3% |
| 4+ Person Household | 1,970 | 24.6% |
| Total Housing Units | 7,998 | 100.0% |
Occupancy by Ownership by Household Size in Carbon County
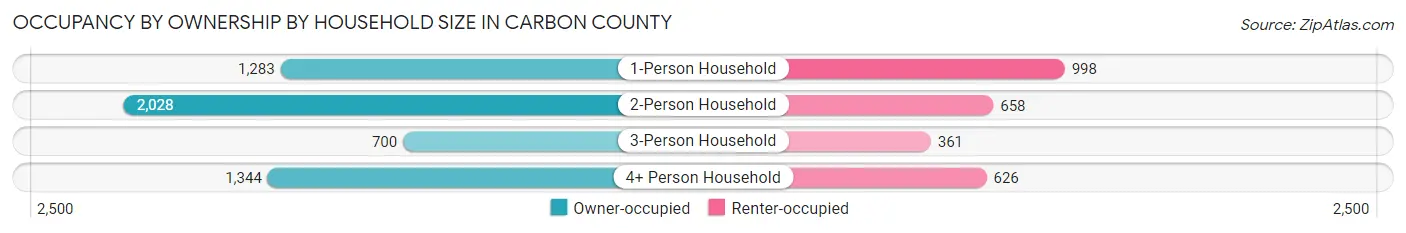
| Household Size | Owner-occupied | Renter-occupied |
| 1-Person Household | 1,283 (56.2%) | 998 (43.8%) |
| 2-Person Household | 2,028 (75.5%) | 658 (24.5%) |
| 3-Person Household | 700 (66.0%) | 361 (34.0%) |
| 4+ Person Household | 1,344 (68.2%) | 626 (31.8%) |
| Total Housing Units | 5,355 (66.9%) | 2,643 (33.1%) |
Occupancy by Educational Attainment in Carbon County
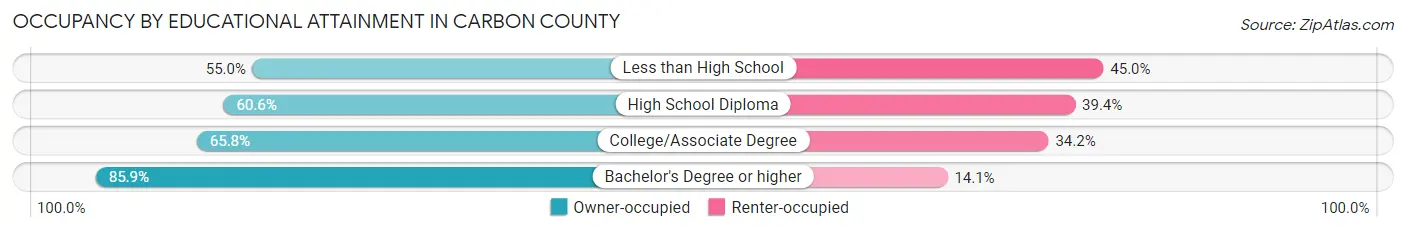
| Household Size | Owner-occupied | Renter-occupied |
| Less than High School | 316 (55.0%) | 259 (45.0%) |
| High School Diploma | 1,282 (60.6%) | 835 (39.4%) |
| College/Associate Degree | 2,627 (65.8%) | 1,363 (34.2%) |
| Bachelor's Degree or higher | 1,130 (85.9%) | 186 (14.1%) |
Occupancy by Age of Householder in Carbon County
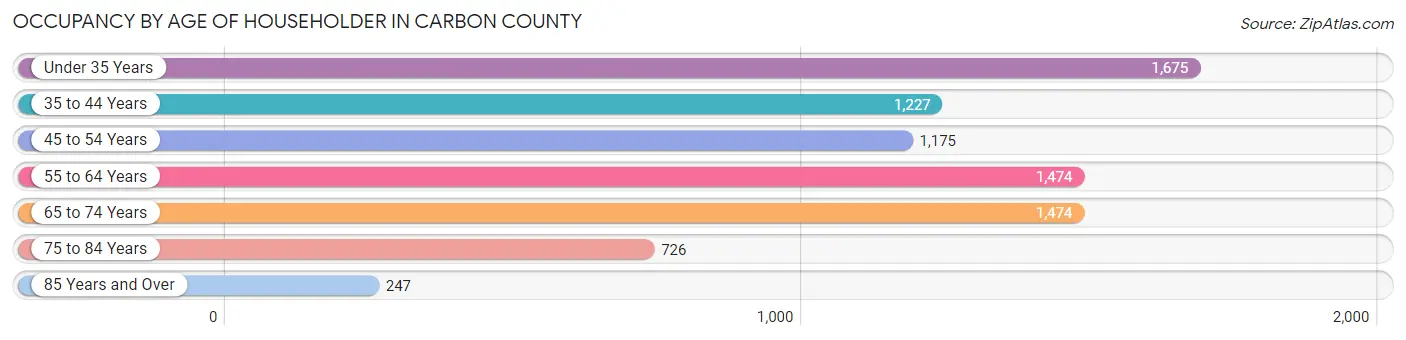
| Age Bracket | # Households | % Households |
| Under 35 Years | 1,675 | 20.9% |
| 35 to 44 Years | 1,227 | 15.3% |
| 45 to 54 Years | 1,175 | 14.7% |
| 55 to 64 Years | 1,474 | 18.4% |
| 65 to 74 Years | 1,474 | 18.4% |
| 75 to 84 Years | 726 | 9.1% |
| 85 Years and Over | 247 | 3.1% |
| Total | 7,998 | 100.0% |
Housing Finances in Carbon County
Median Income by Occupancy in Carbon County
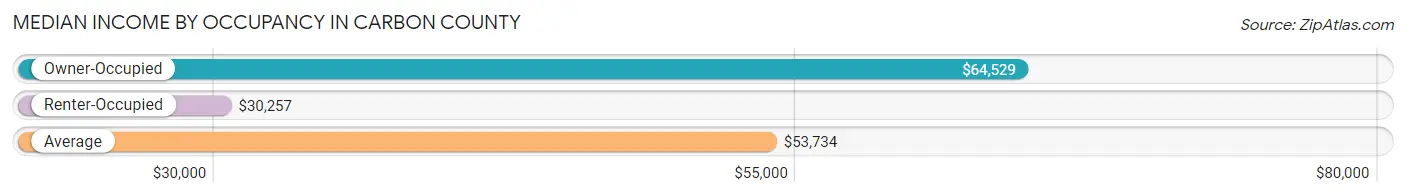
| Occupancy Type | # Households | Median Income |
| Owner-Occupied | 5,355 (66.9%) | $64,529 |
| Renter-Occupied | 2,643 (33.1%) | $30,257 |
| Average | 7,998 (100.0%) | $53,734 |
Occupancy by Householder Income Bracket in Carbon County
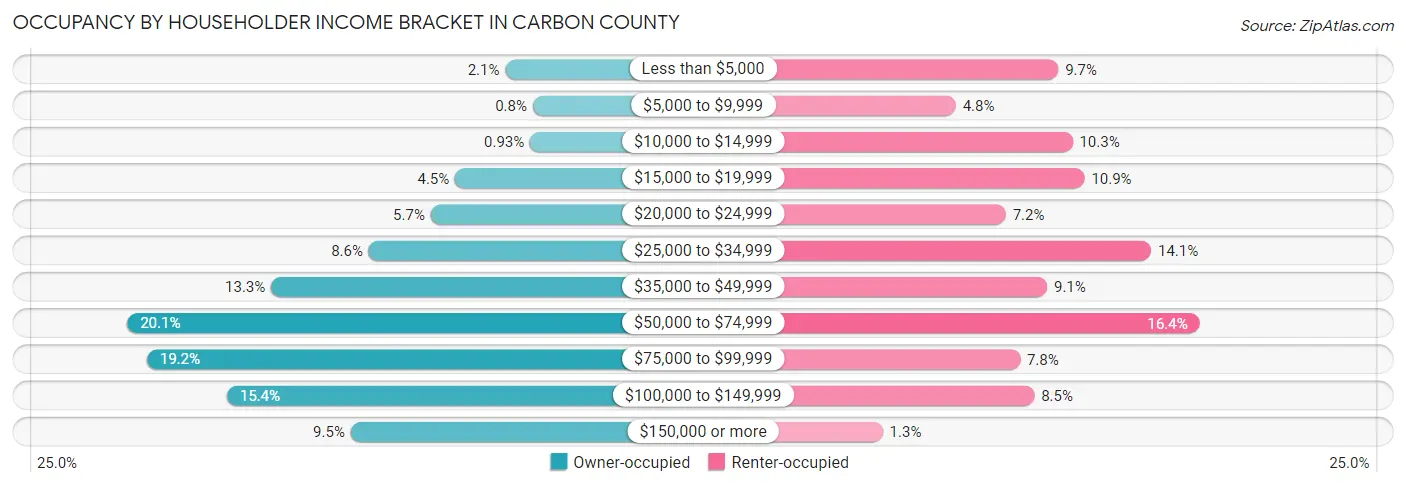
| Income Bracket | Owner-occupied | Renter-occupied |
| Less than $5,000 | 113 (2.1%) | 255 (9.7%) |
| $5,000 to $9,999 | 43 (0.8%) | 126 (4.8%) |
| $10,000 to $14,999 | 50 (0.9%) | 273 (10.3%) |
| $15,000 to $19,999 | 241 (4.5%) | 288 (10.9%) |
| $20,000 to $24,999 | 303 (5.7%) | 189 (7.1%) |
| $25,000 to $34,999 | 461 (8.6%) | 372 (14.1%) |
| $35,000 to $49,999 | 710 (13.3%) | 241 (9.1%) |
| $50,000 to $74,999 | 1,077 (20.1%) | 433 (16.4%) |
| $75,000 to $99,999 | 1,027 (19.2%) | 207 (7.8%) |
| $100,000 to $149,999 | 823 (15.4%) | 225 (8.5%) |
| $150,000 or more | 507 (9.5%) | 34 (1.3%) |
| Total | 5,355 (100.0%) | 2,643 (100.0%) |
Monthly Housing Cost Tiers in Carbon County
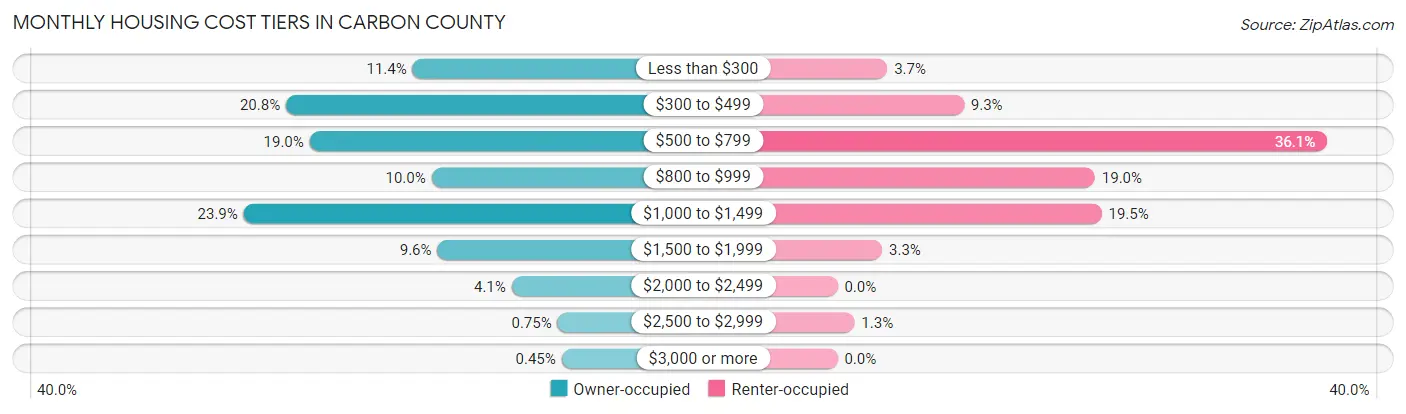
| Monthly Cost | Owner-occupied | Renter-occupied |
| Less than $300 | 612 (11.4%) | 97 (3.7%) |
| $300 to $499 | 1,111 (20.7%) | 246 (9.3%) |
| $500 to $799 | 1,018 (19.0%) | 953 (36.1%) |
| $800 to $999 | 537 (10.0%) | 501 (19.0%) |
| $1,000 to $1,499 | 1,278 (23.9%) | 514 (19.5%) |
| $1,500 to $1,999 | 514 (9.6%) | 87 (3.3%) |
| $2,000 to $2,499 | 221 (4.1%) | 0 (0.0%) |
| $2,500 to $2,999 | 40 (0.7%) | 33 (1.3%) |
| $3,000 or more | 24 (0.4%) | 0 (0.0%) |
| Total | 5,355 (100.0%) | 2,643 (100.0%) |
Physical Housing Characteristics in Carbon County
Housing Structures in Carbon County
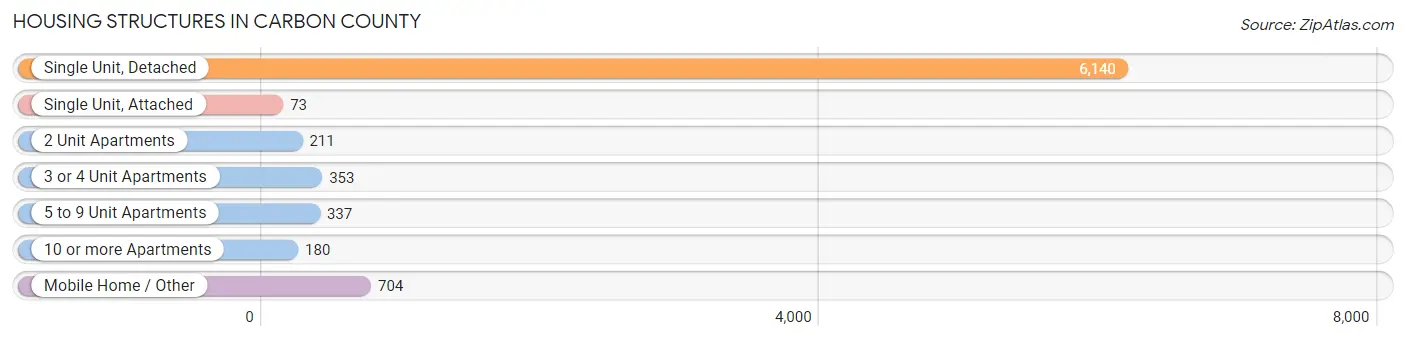
| Structure Type | # Housing Units | % Housing Units |
| Single Unit, Detached | 6,140 | 76.8% |
| Single Unit, Attached | 73 | 0.9% |
| 2 Unit Apartments | 211 | 2.6% |
| 3 or 4 Unit Apartments | 353 | 4.4% |
| 5 to 9 Unit Apartments | 337 | 4.2% |
| 10 or more Apartments | 180 | 2.2% |
| Mobile Home / Other | 704 | 8.8% |
| Total | 7,998 | 100.0% |
Housing Structures by Occupancy in Carbon County
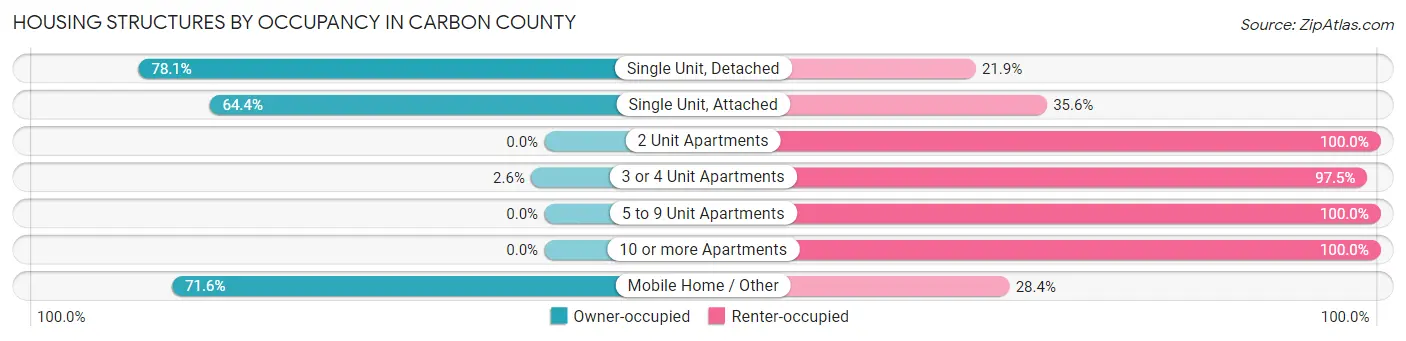
| Structure Type | Owner-occupied | Renter-occupied |
| Single Unit, Detached | 4,795 (78.1%) | 1,345 (21.9%) |
| Single Unit, Attached | 47 (64.4%) | 26 (35.6%) |
| 2 Unit Apartments | 0 (0.0%) | 211 (100.0%) |
| 3 or 4 Unit Apartments | 9 (2.5%) | 344 (97.5%) |
| 5 to 9 Unit Apartments | 0 (0.0%) | 337 (100.0%) |
| 10 or more Apartments | 0 (0.0%) | 180 (100.0%) |
| Mobile Home / Other | 504 (71.6%) | 200 (28.4%) |
| Total | 5,355 (66.9%) | 2,643 (33.1%) |
Housing Structures by Number of Rooms in Carbon County
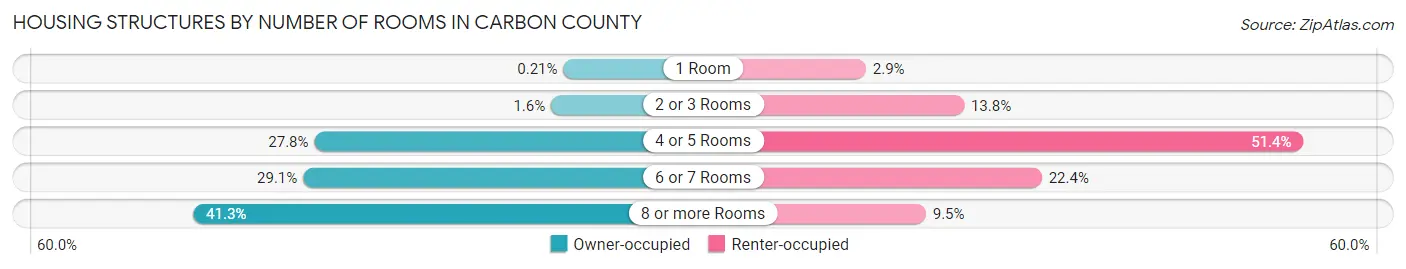
| Number of Rooms | Owner-occupied | Renter-occupied |
| 1 Room | 11 (0.2%) | 76 (2.9%) |
| 2 or 3 Rooms | 84 (1.6%) | 364 (13.8%) |
| 4 or 5 Rooms | 1,491 (27.8%) | 1,359 (51.4%) |
| 6 or 7 Rooms | 1,558 (29.1%) | 592 (22.4%) |
| 8 or more Rooms | 2,211 (41.3%) | 252 (9.5%) |
| Total | 5,355 (100.0%) | 2,643 (100.0%) |
Housing Structure by Heating Type in Carbon County
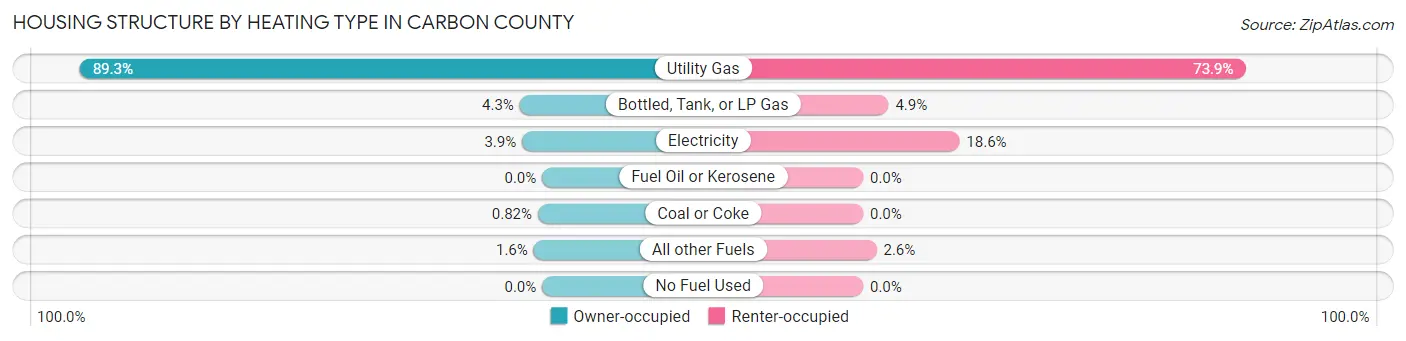
| Heating Type | Owner-occupied | Renter-occupied |
| Utility Gas | 4,784 (89.3%) | 1,952 (73.9%) |
| Bottled, Tank, or LP Gas | 232 (4.3%) | 130 (4.9%) |
| Electricity | 207 (3.9%) | 492 (18.6%) |
| Fuel Oil or Kerosene | 0 (0.0%) | 0 (0.0%) |
| Coal or Coke | 44 (0.8%) | 0 (0.0%) |
| All other Fuels | 88 (1.6%) | 69 (2.6%) |
| No Fuel Used | 0 (0.0%) | 0 (0.0%) |
| Total | 5,355 (100.0%) | 2,643 (100.0%) |
Household Vehicle Usage in Carbon County
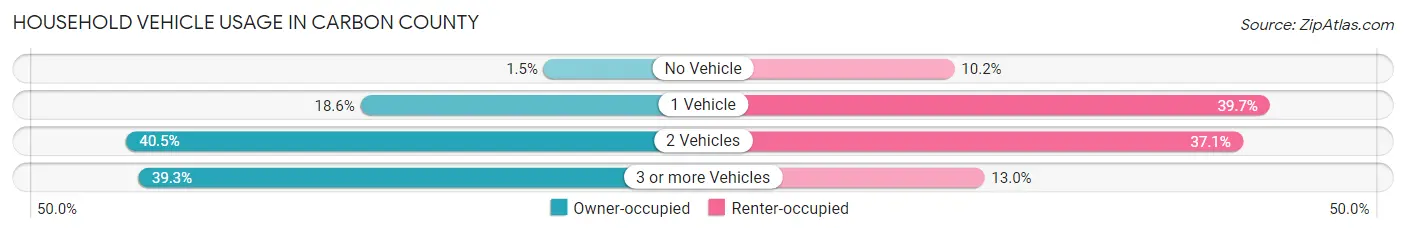
| Vehicles per Household | Owner-occupied | Renter-occupied |
| No Vehicle | 82 (1.5%) | 270 (10.2%) |
| 1 Vehicle | 998 (18.6%) | 1,048 (39.7%) |
| 2 Vehicles | 2,169 (40.5%) | 981 (37.1%) |
| 3 or more Vehicles | 2,106 (39.3%) | 344 (13.0%) |
| Total | 5,355 (100.0%) | 2,643 (100.0%) |
Real Estate & Mortgages in Carbon County
Real Estate and Mortgage Overview in Carbon County
| Characteristic | Without Mortgage | With Mortgage |
| Housing Units | 2,371 | 2,984 |
| Median Property Value | $160,300 | $185,700 |
| Median Household Income | $55,746 | $313 |
| Monthly Housing Costs | $408 | $24 |
| Real Estate Taxes | $1,205 | $66 |
Property Value by Mortgage Status in Carbon County
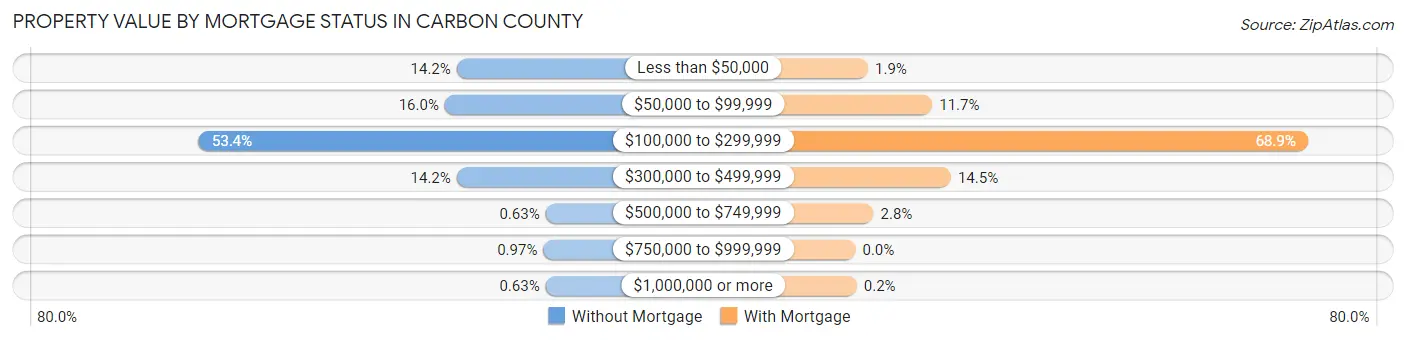
| Property Value | Without Mortgage | With Mortgage |
| Less than $50,000 | 336 (14.2%) | 57 (1.9%) |
| $50,000 to $99,999 | 379 (16.0%) | 349 (11.7%) |
| $100,000 to $299,999 | 1,267 (53.4%) | 2,056 (68.9%) |
| $300,000 to $499,999 | 336 (14.2%) | 434 (14.5%) |
| $500,000 to $749,999 | 15 (0.6%) | 82 (2.8%) |
| $750,000 to $999,999 | 23 (1.0%) | 0 (0.0%) |
| $1,000,000 or more | 15 (0.6%) | 6 (0.2%) |
| Total | 2,371 (100.0%) | 2,984 (100.0%) |
Household Income by Mortgage Status in Carbon County
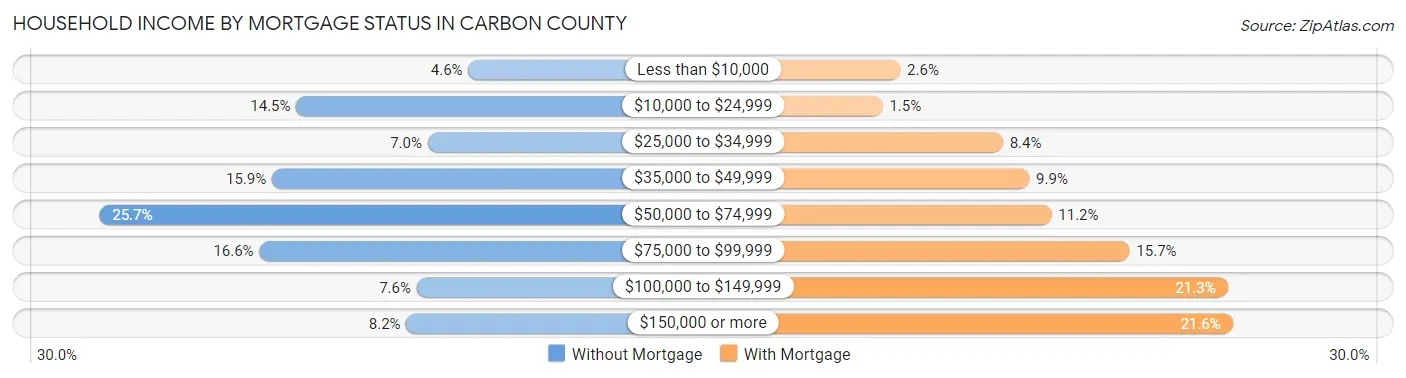
| Household Income | Without Mortgage | With Mortgage |
| Less than $10,000 | 110 (4.6%) | 76 (2.5%) |
| $10,000 to $24,999 | 343 (14.5%) | 46 (1.5%) |
| $25,000 to $34,999 | 165 (7.0%) | 251 (8.4%) |
| $35,000 to $49,999 | 376 (15.9%) | 296 (9.9%) |
| $50,000 to $74,999 | 610 (25.7%) | 334 (11.2%) |
| $75,000 to $99,999 | 393 (16.6%) | 467 (15.7%) |
| $100,000 to $149,999 | 180 (7.6%) | 634 (21.2%) |
| $150,000 or more | 194 (8.2%) | 643 (21.5%) |
| Total | 2,371 (100.0%) | 2,984 (100.0%) |
Property Value to Household Income Ratio in Carbon County
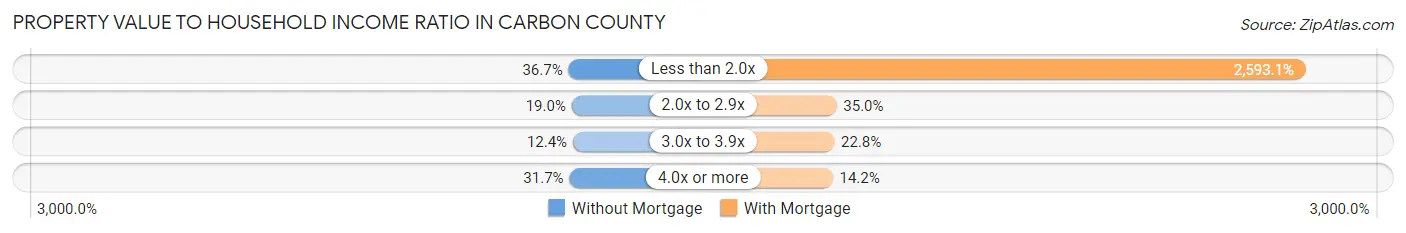
| Value-to-Income Ratio | Without Mortgage | With Mortgage |
| Less than 2.0x | 869 (36.6%) | 77,379 (2,593.1%) |
| 2.0x to 2.9x | 451 (19.0%) | 1,044 (35.0%) |
| 3.0x to 3.9x | 293 (12.4%) | 680 (22.8%) |
| 4.0x or more | 751 (31.7%) | 424 (14.2%) |
| Total | 2,371 (100.0%) | 2,984 (100.0%) |
Real Estate Taxes by Mortgage Status in Carbon County
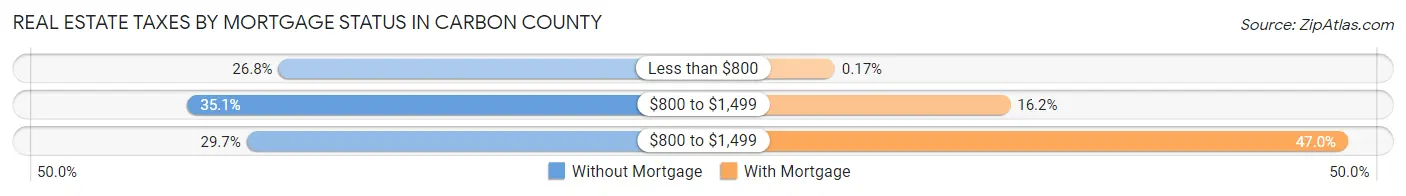
| Property Taxes | Without Mortgage | With Mortgage |
| Less than $800 | 636 (26.8%) | 5 (0.2%) |
| $800 to $1,499 | 833 (35.1%) | 483 (16.2%) |
| $800 to $1,499 | 705 (29.7%) | 1,403 (47.0%) |
| Total | 2,371 (100.0%) | 2,984 (100.0%) |
Health & Disability in Carbon County
Health Insurance Coverage by Age in Carbon County
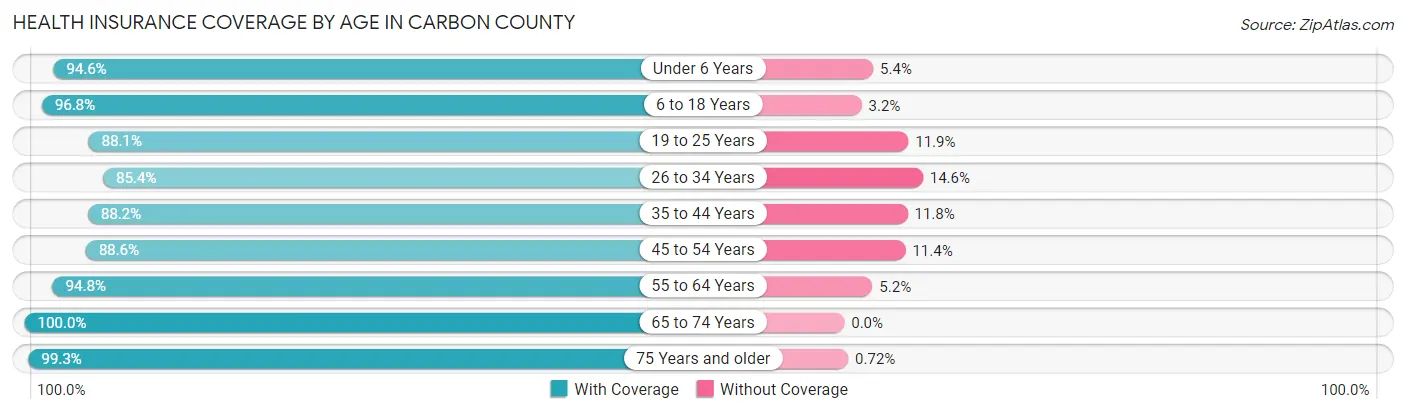
| Age Bracket | With Coverage | Without Coverage |
| Under 6 Years | 1,601 (94.6%) | 91 (5.4%) |
| 6 to 18 Years | 3,662 (96.8%) | 122 (3.2%) |
| 19 to 25 Years | 1,504 (88.1%) | 204 (11.9%) |
| 26 to 34 Years | 1,871 (85.4%) | 321 (14.6%) |
| 35 to 44 Years | 2,160 (88.2%) | 289 (11.8%) |
| 45 to 54 Years | 1,879 (88.6%) | 242 (11.4%) |
| 55 to 64 Years | 2,352 (94.8%) | 130 (5.2%) |
| 65 to 74 Years | 2,300 (100.0%) | 0 (0.0%) |
| 75 Years and older | 1,372 (99.3%) | 10 (0.7%) |
| Total | 18,701 (93.0%) | 1,409 (7.0%) |
Health Insurance Coverage by Citizenship Status in Carbon County
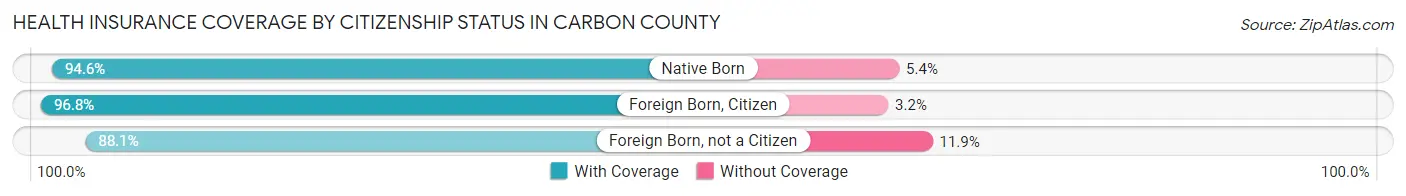
| Citizenship Status | With Coverage | Without Coverage |
| Native Born | 1,601 (94.6%) | 91 (5.4%) |
| Foreign Born, Citizen | 3,662 (96.8%) | 122 (3.2%) |
| Foreign Born, not a Citizen | 1,504 (88.1%) | 204 (11.9%) |
Health Insurance Coverage by Household Income in Carbon County
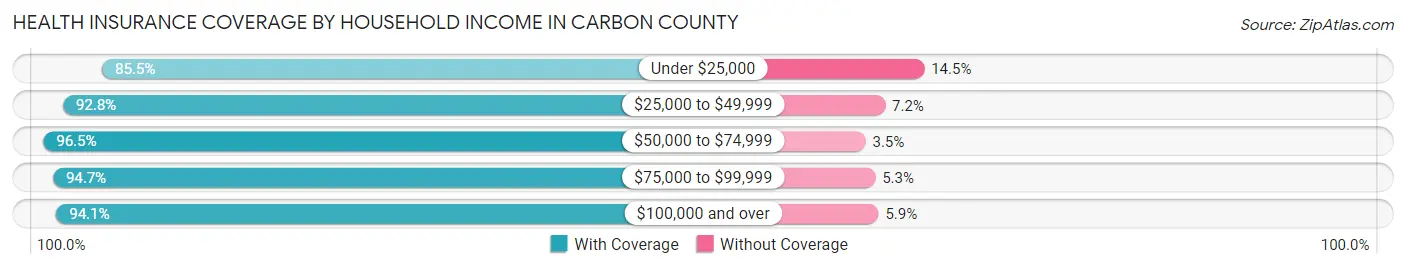
| Household Income | With Coverage | Without Coverage |
| Under $25,000 | 2,729 (85.5%) | 463 (14.5%) |
| $25,000 to $49,999 | 3,466 (92.8%) | 268 (7.2%) |
| $50,000 to $74,999 | 3,657 (96.5%) | 133 (3.5%) |
| $75,000 to $99,999 | 3,915 (94.7%) | 220 (5.3%) |
| $100,000 and over | 4,685 (94.1%) | 296 (5.9%) |
Public vs Private Health Insurance Coverage by Age in Carbon County
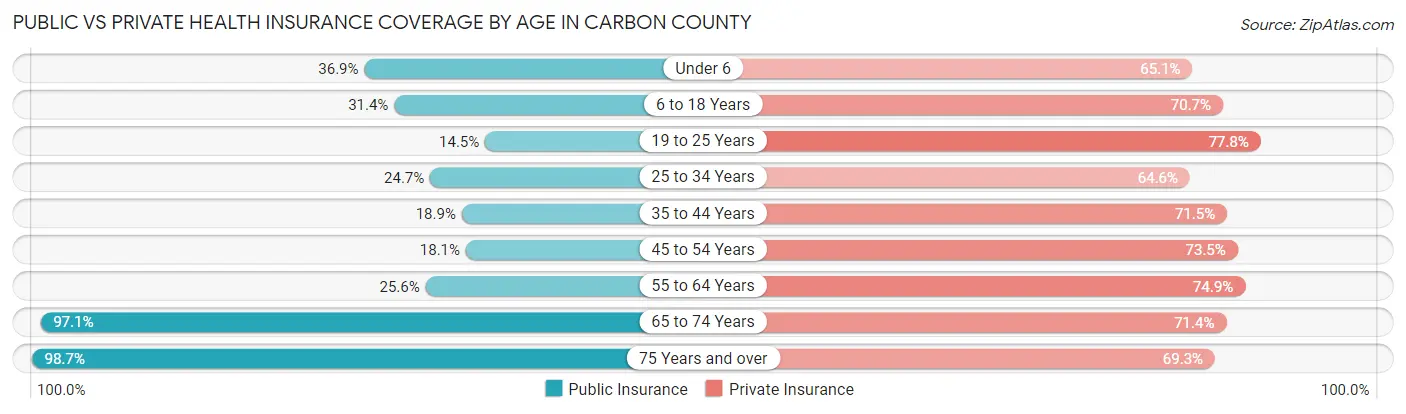
| Age Bracket | Public Insurance | Private Insurance |
| Under 6 | 625 (36.9%) | 1,101 (65.1%) |
| 6 to 18 Years | 1,188 (31.4%) | 2,676 (70.7%) |
| 19 to 25 Years | 248 (14.5%) | 1,328 (77.7%) |
| 25 to 34 Years | 542 (24.7%) | 1,416 (64.6%) |
| 35 to 44 Years | 462 (18.9%) | 1,751 (71.5%) |
| 45 to 54 Years | 384 (18.1%) | 1,558 (73.5%) |
| 55 to 64 Years | 635 (25.6%) | 1,858 (74.9%) |
| 65 to 74 Years | 2,233 (97.1%) | 1,641 (71.4%) |
| 75 Years and over | 1,364 (98.7%) | 957 (69.3%) |
| Total | 7,681 (38.2%) | 14,286 (71.0%) |
Disability Status by Sex by Age in Carbon County
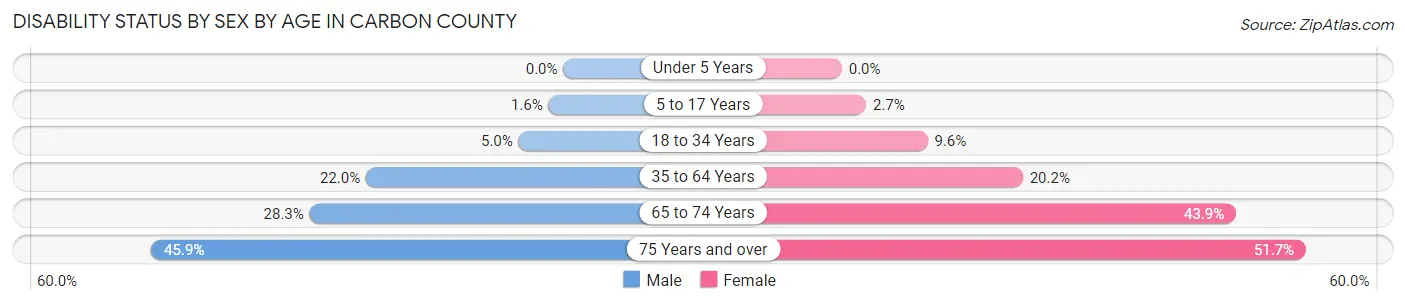
| Age Bracket | Male | Female |
| Under 5 Years | 0 (0.0%) | 0 (0.0%) |
| 5 to 17 Years | 35 (1.6%) | 50 (2.7%) |
| 18 to 34 Years | 100 (5.0%) | 203 (9.6%) |
| 35 to 64 Years | 780 (22.0%) | 706 (20.2%) |
| 65 to 74 Years | 325 (28.3%) | 505 (43.9%) |
| 75 Years and over | 281 (45.9%) | 398 (51.7%) |
Disability Class by Sex by Age in Carbon County
Disability Class: Hearing Difficulty
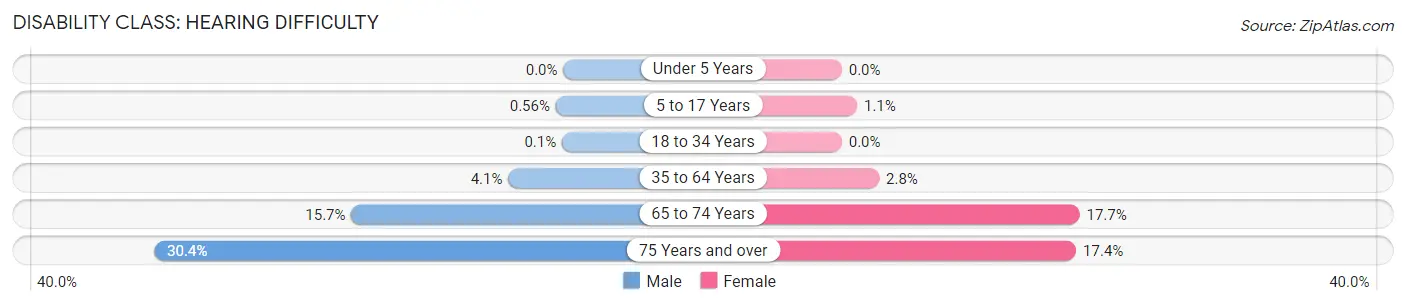
| Age Bracket | Male | Female |
| Under 5 Years | 0 (0.0%) | 0 (0.0%) |
| 5 to 17 Years | 12 (0.6%) | 21 (1.1%) |
| 18 to 34 Years | 2 (0.1%) | 0 (0.0%) |
| 35 to 64 Years | 145 (4.1%) | 97 (2.8%) |
| 65 to 74 Years | 181 (15.7%) | 203 (17.6%) |
| 75 Years and over | 186 (30.4%) | 134 (17.4%) |
Disability Class: Vision Difficulty
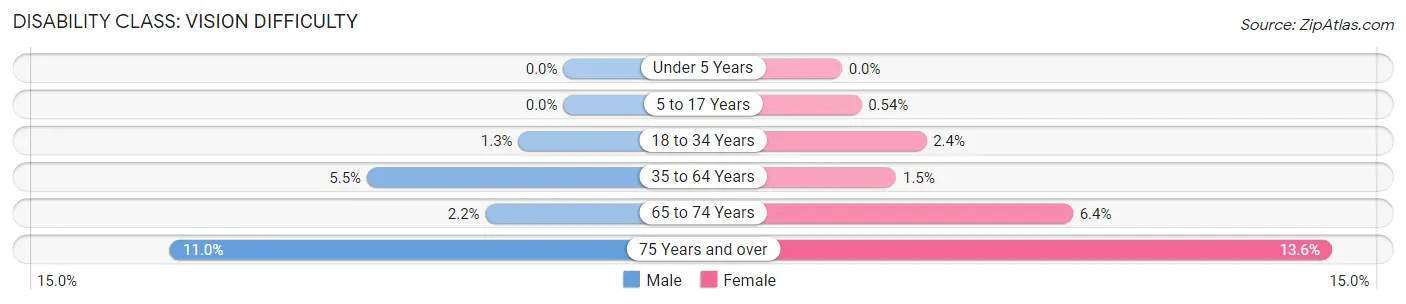
| Age Bracket | Male | Female |
| Under 5 Years | 0 (0.0%) | 0 (0.0%) |
| 5 to 17 Years | 0 (0.0%) | 10 (0.5%) |
| 18 to 34 Years | 25 (1.3%) | 50 (2.4%) |
| 35 to 64 Years | 194 (5.5%) | 53 (1.5%) |
| 65 to 74 Years | 25 (2.2%) | 74 (6.4%) |
| 75 Years and over | 67 (11.0%) | 105 (13.6%) |
Disability Class: Cognitive Difficulty
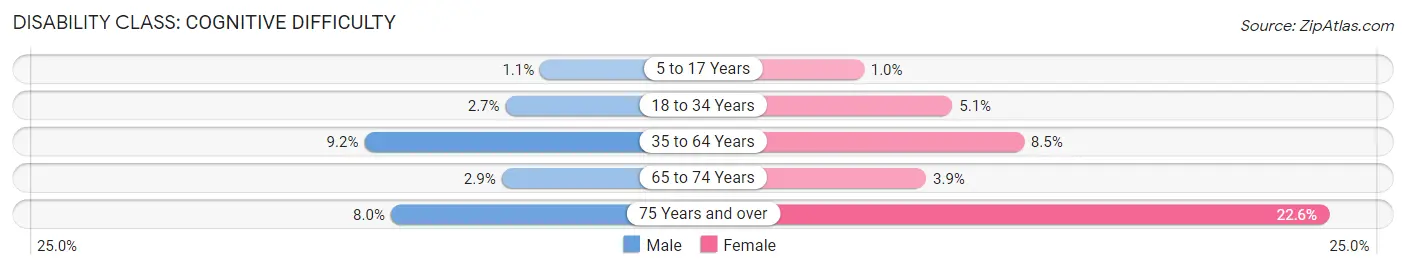
| Age Bracket | Male | Female |
| 5 to 17 Years | 23 (1.1%) | 19 (1.0%) |
| 18 to 34 Years | 54 (2.7%) | 109 (5.1%) |
| 35 to 64 Years | 328 (9.2%) | 296 (8.5%) |
| 65 to 74 Years | 33 (2.9%) | 45 (3.9%) |
| 75 Years and over | 49 (8.0%) | 174 (22.6%) |
Disability Class: Ambulatory Difficulty
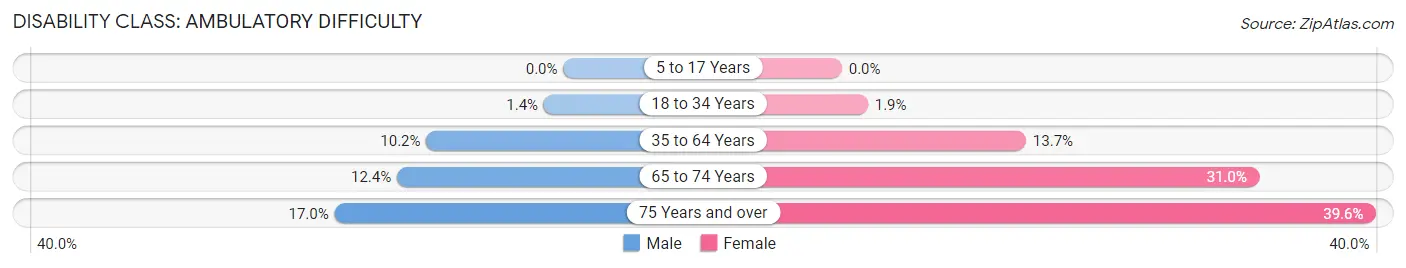
| Age Bracket | Male | Female |
| 5 to 17 Years | 0 (0.0%) | 0 (0.0%) |
| 18 to 34 Years | 29 (1.4%) | 41 (1.9%) |
| 35 to 64 Years | 361 (10.2%) | 479 (13.7%) |
| 65 to 74 Years | 142 (12.3%) | 356 (31.0%) |
| 75 Years and over | 104 (17.0%) | 305 (39.6%) |
Disability Class: Self-Care Difficulty
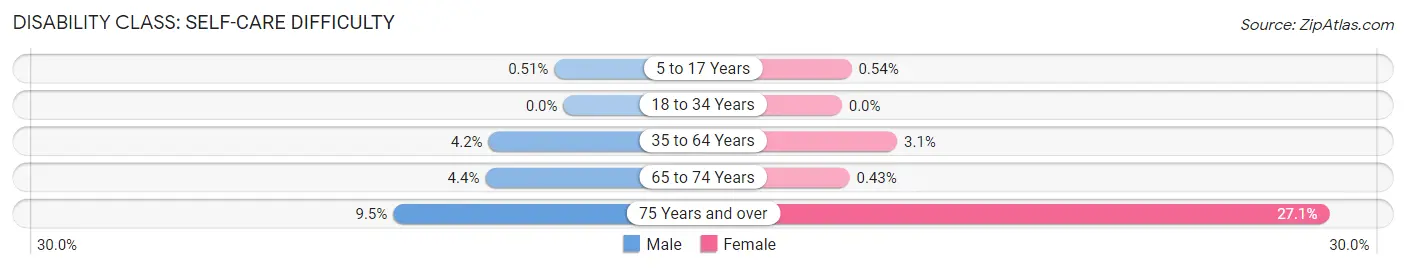
| Age Bracket | Male | Female |
| 5 to 17 Years | 11 (0.5%) | 10 (0.5%) |
| 18 to 34 Years | 0 (0.0%) | 0 (0.0%) |
| 35 to 64 Years | 148 (4.2%) | 108 (3.1%) |
| 65 to 74 Years | 50 (4.3%) | 5 (0.4%) |
| 75 Years and over | 58 (9.5%) | 209 (27.1%) |
Technology Access in Carbon County
Computing Device Access in Carbon County
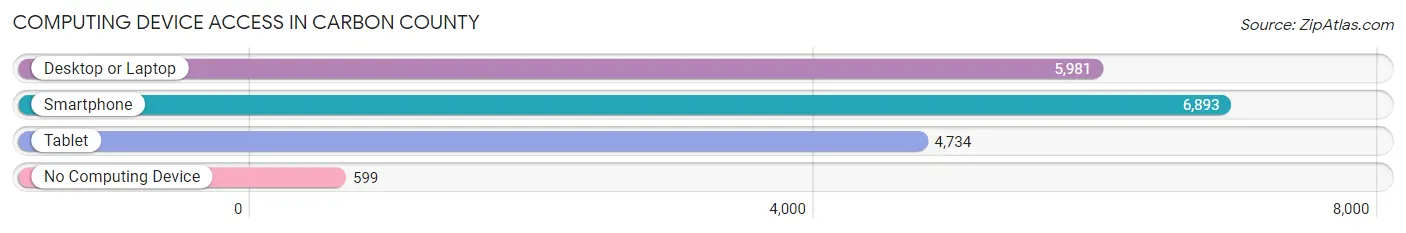
| Device Type | # Households | % Households |
| Desktop or Laptop | 5,981 | 74.8% |
| Smartphone | 6,893 | 86.2% |
| Tablet | 4,734 | 59.2% |
| No Computing Device | 599 | 7.5% |
| Total | 7,998 | 100.0% |
Internet Access in Carbon County
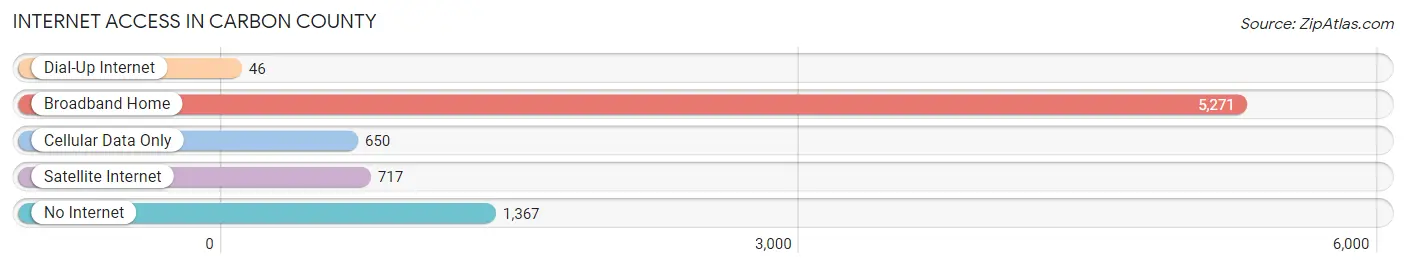
| Internet Type | # Households | % Households |
| Dial-Up Internet | 46 | 0.6% |
| Broadband Home | 5,271 | 65.9% |
| Cellular Data Only | 650 | 8.1% |
| Satellite Internet | 717 | 9.0% |
| No Internet | 1,367 | 17.1% |
| Total | 7,998 | 100.0% |
Carbon County Summary
Carbon County is located in the southeastern corner of Utah, and is bordered by Emery, Grand, San Juan, and Duchesne counties. It is the second-largest county in the state, with an area of 4,845 square miles. The county seat is Price, and the largest city is Helper. Carbon County is home to a diverse population of approximately 20,000 people.
History
The area that is now Carbon County was first inhabited by the Ute and Paiute tribes. The first European settlers arrived in the area in the late 1800s, and the county was officially established in 1894. The county was named for the coal deposits that were discovered in the area.
The coal industry was the primary driver of the county’s economy for much of the 20th century. The coal mines provided jobs for thousands of people, and the county’s population grew rapidly. The coal industry began to decline in the late 20th century, and the county’s population has since stabilized.
Geography
Carbon County is located in the southeastern corner of Utah, and is bordered by Emery, Grand, San Juan, and Duchesne counties. It is the second-largest county in the state, with an area of 4,845 square miles. The county is mostly mountainous, with the Wasatch Plateau to the north and the San Rafael Swell to the south. The county is home to several rivers, including the Price River, the Green River, and the San Rafael River.
Economy
The economy of Carbon County is largely based on agriculture, mining, and tourism. The county is home to several large coal mines, and coal is still the primary source of income for many residents. The county is also home to several large farms, and the agricultural industry is a major contributor to the local economy. Tourism is also an important part of the economy, as the county is home to several popular attractions, including the Nine Mile Canyon and the San Rafael Swell.
Demographics
As of the 2010 census, Carbon County had a population of 20,077. The population is largely white (86.3%), with smaller percentages of Hispanic (7.2%), Native American (2.2%), and Asian (1.2%) residents. The median household income is $41,945, and the median age is 36.7. The county is home to several small towns, including Price, Helper, and Wellington.
Common Questions
What is the Total Population of Carbon County?
Total Population of Carbon County is 20,338.
What is the Total Male Population of Carbon County?
Total Male Population of Carbon County is 10,219.
What is the Total Female Population of Carbon County?
Total Female Population of Carbon County is 10,119.
What is the Ratio of Males per 100 Females in Carbon County?
There are 100.99 Males per 100 Females in Carbon County.
What is the Ratio of Females per 100 Males in Carbon County?
There are 99.02 Females per 100 Males in Carbon County.
What is the Median Population Age in Carbon County?
Median Population Age in Carbon County is 37.8 Years.
What is the Average Family Size in Carbon County
Average Family Size in Carbon County is 3.1 People.
What is the Average Household Size in Carbon County
Average Household Size in Carbon County is 2.5 People.
What is Per Capita Income in Carbon County?
Per Capita income in Carbon County is $26,450.
What is the Median Family Income in Carbon County?
Median Family Income in Carbon County is $71,143.
What is the Median Household income in Carbon County?
Median Household Income in Carbon County is $53,734.
What is Income or Wage Gap in Carbon County?
Income or Wage Gap in Carbon County is 64.8%.
Women in Carbon County earn 35.2 cents for every dollar earned by a man.
What is Family Income Deficit in Carbon County?
Family Income Deficit in Carbon County is $9,509.
Families that are below poverty line in Carbon County earn $9,509 less on average than the poverty threshold level.
What is Inequality or Gini Index in Carbon County?
Inequality or Gini Index in Carbon County is 0.42.
How Large is the Labor Force in Carbon County?
There are 8,905 People in the Labor Forcein in Carbon County.
What is the Percentage of People in the Labor Force in Carbon County?
56.7% of People are in the Labor Force in Carbon County.
What is the Unemployment Rate in Carbon County?
Unemployment Rate in Carbon County is 6.7%.