Cache County, UT
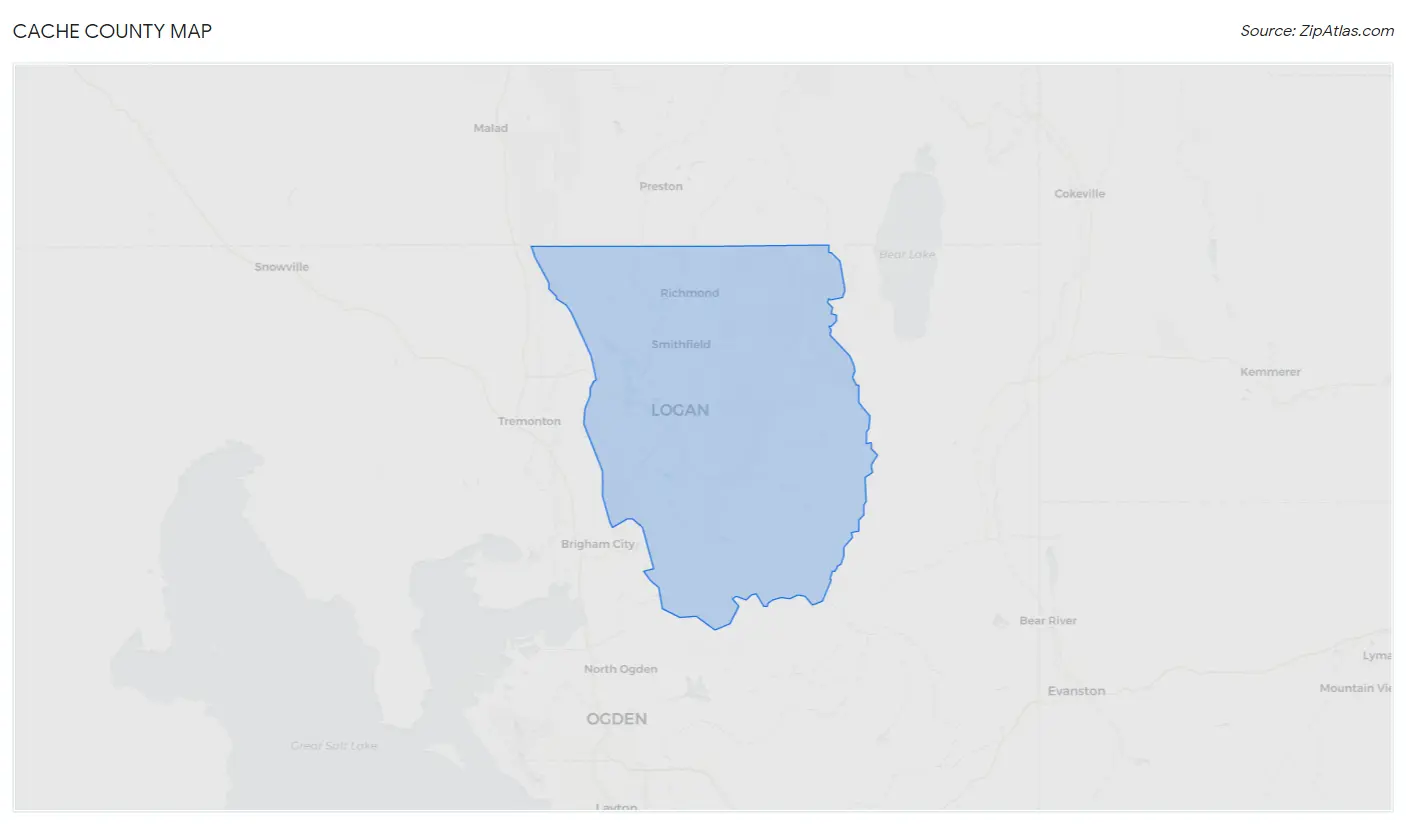
Cache County Map
Cache County Overview
134,428
TOTAL POPULATION
67,593
MALE POPULATION
66,835
FEMALE POPULATION
101.13
MALES / 100 FEMALES
98.88
FEMALES / 100 MALES
25.5
MEDIAN AGE
3.5
AVG FAMILY SIZE
3.1
AVG HOUSEHOLD SIZE
$29,298
PER CAPITA INCOME
$82,750
AVG FAMILY INCOME
$72,719
AVG HOUSEHOLD INCOME
52.0%
WAGE / INCOME GAP [ % ]
48.0¢/ $1
WAGE / INCOME GAP [ $ ]
$10,236
FAMILY INCOME DEFICIT
0.43
INEQUALITY / GINI INDEX
69,287
LABOR FORCE [ PEOPLE ]
70.1%
PERCENT IN LABOR FORCE
2.4%
UNEMPLOYMENT RATE
Cache County Area Codes
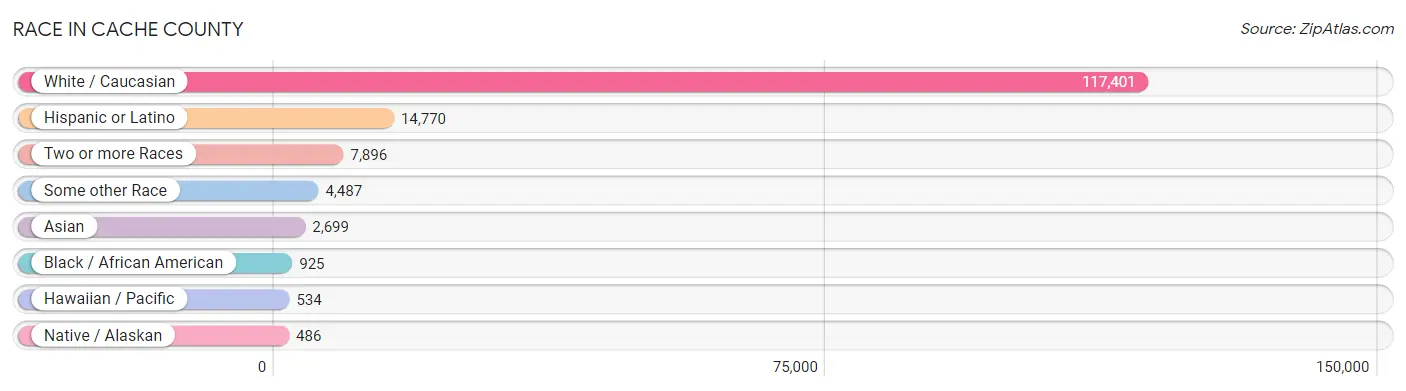
Race in Cache County
The most populous races in Cache County are White / Caucasian (117,401 | 87.3%), Hispanic or Latino (14,770 | 11.0%), and Two or more Races (7,896 | 5.9%).
| Race | # Population | % Population |
| Asian | 2,699 | 2.0% |
| Black / African American | 925 | 0.7% |
| Hawaiian / Pacific | 534 | 0.4% |
| Hispanic or Latino | 14,770 | 11.0% |
| Native / Alaskan | 486 | 0.4% |
| White / Caucasian | 117,401 | 87.3% |
| Two or more Races | 7,896 | 5.9% |
| Some other Race | 4,487 | 3.3% |
| Total | 134,428 | 100.0% |
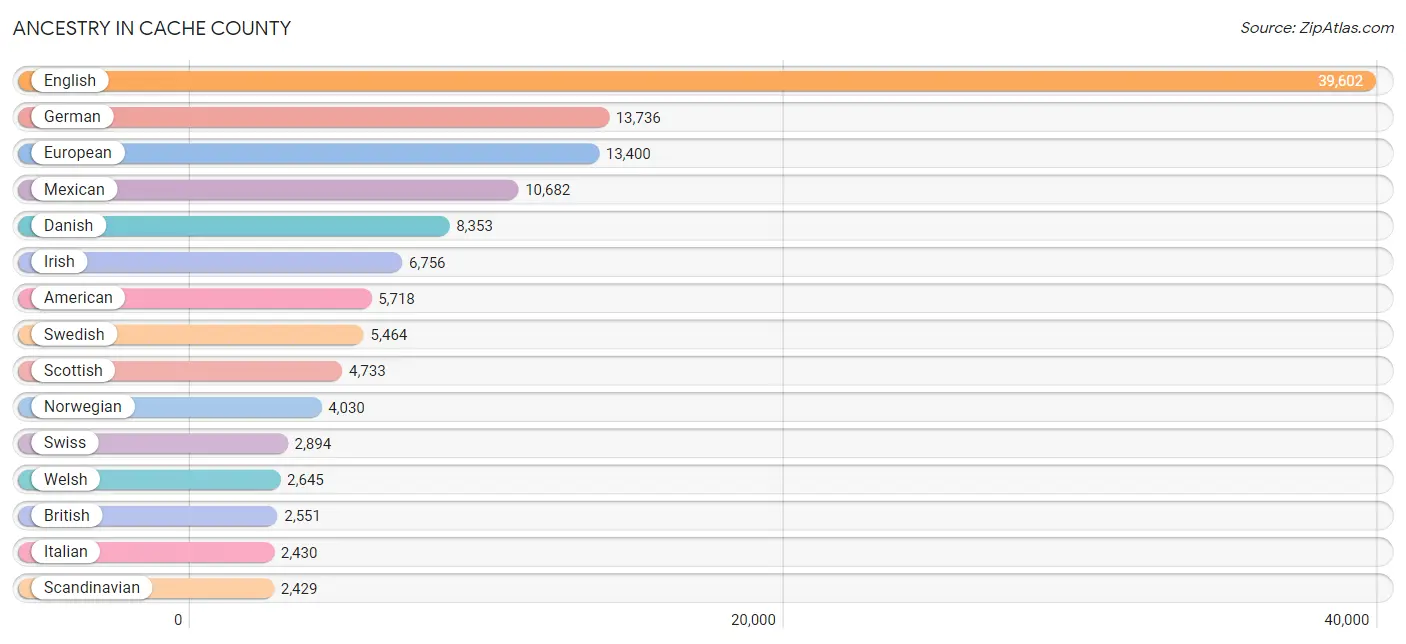
Ancestry in Cache County
The most populous ancestries reported in Cache County are English (39,602 | 29.5%), German (13,736 | 10.2%), European (13,400 | 10.0%), Mexican (10,682 | 8.0%), and Danish (8,353 | 6.2%), together accounting for 63.8% of all Cache County residents.
| Ancestry | # Population | % Population |
| Afghan | 2 | 0.0% |
| African | 474 | 0.4% |
| Alaska Native | 33 | 0.0% |
| American | 5,718 | 4.3% |
| Arab | 442 | 0.3% |
| Argentinean | 92 | 0.1% |
| Armenian | 14 | 0.0% |
| Australian | 76 | 0.1% |
| Austrian | 159 | 0.1% |
| Basque | 37 | 0.0% |
| Belgian | 85 | 0.1% |
| Bhutanese | 542 | 0.4% |
| Blackfeet | 108 | 0.1% |
| Bolivian | 54 | 0.0% |
| Brazilian | 79 | 0.1% |
| British | 2,551 | 1.9% |
| Burmese | 288 | 0.2% |
| Canadian | 407 | 0.3% |
| Celtic | 13 | 0.0% |
| Central American | 1,391 | 1.0% |
| Central American Indian | 1 | 0.0% |
| Cherokee | 290 | 0.2% |
| Cheyenne | 17 | 0.0% |
| Chickasaw | 82 | 0.1% |
| Chilean | 89 | 0.1% |
| Chippewa | 10 | 0.0% |
| Choctaw | 74 | 0.1% |
| Colombian | 116 | 0.1% |
| Comanche | 9 | 0.0% |
| Costa Rican | 1 | 0.0% |
| Cree | 10 | 0.0% |
| Creek | 47 | 0.0% |
| Croatian | 46 | 0.0% |
| Crow | 122 | 0.1% |
| Cuban | 14 | 0.0% |
| Czech | 178 | 0.1% |
| Czechoslovakian | 71 | 0.1% |
| Danish | 8,353 | 6.2% |
| Delaware | 68 | 0.1% |
| Dominican | 7 | 0.0% |
| Dutch | 1,660 | 1.2% |
| Dutch West Indian | 62 | 0.1% |
| Eastern European | 272 | 0.2% |
| Ecuadorian | 86 | 0.1% |
| Egyptian | 4 | 0.0% |
| English | 39,602 | 29.5% |
| Ethiopian | 104 | 0.1% |
| European | 13,400 | 10.0% |
| Fijian | 44 | 0.0% |
| Filipino | 38 | 0.0% |
| Finnish | 419 | 0.3% |
| French | 1,733 | 1.3% |
| French American Indian | 22 | 0.0% |
| French Canadian | 72 | 0.1% |
| German | 13,736 | 10.2% |
| German Russian | 8 | 0.0% |
| Greek | 370 | 0.3% |
| Guamanian / Chamorro | 21 | 0.0% |
| Guatemalan | 377 | 0.3% |
| Haitian | 112 | 0.1% |
| Honduran | 3 | 0.0% |
| Hungarian | 310 | 0.2% |
| Icelander | 194 | 0.1% |
| Indian (Asian) | 765 | 0.6% |
| Indonesian | 158 | 0.1% |
| Inupiat | 6 | 0.0% |
| Iranian | 79 | 0.1% |
| Irish | 6,756 | 5.0% |
| Iroquois | 21 | 0.0% |
| Israeli | 14 | 0.0% |
| Italian | 2,430 | 1.8% |
| Jamaican | 16 | 0.0% |
| Japanese | 491 | 0.4% |
| Korean | 670 | 0.5% |
| Lithuanian | 18 | 0.0% |
| Menominee | 22 | 0.0% |
| Mexican | 10,682 | 8.0% |
| Mexican American Indian | 202 | 0.2% |
| Moroccan | 122 | 0.1% |
| Native Hawaiian | 120 | 0.1% |
| Navajo | 339 | 0.3% |
| New Zealander | 13 | 0.0% |
| Nigerian | 114 | 0.1% |
| Northern European | 519 | 0.4% |
| Norwegian | 4,030 | 3.0% |
| Paiute | 4 | 0.0% |
| Pakistani | 212 | 0.2% |
| Palestinian | 9 | 0.0% |
| Panamanian | 13 | 0.0% |
| Pennsylvania German | 57 | 0.0% |
| Peruvian | 362 | 0.3% |
| Polish | 571 | 0.4% |
| Portuguese | 178 | 0.1% |
| Potawatomi | 7 | 0.0% |
| Puerto Rican | 604 | 0.4% |
| Puget Sound Salish | 21 | 0.0% |
| Romanian | 45 | 0.0% |
| Russian | 623 | 0.5% |
| Salvadoran | 997 | 0.7% |
| Samoan | 347 | 0.3% |
| Scandinavian | 2,429 | 1.8% |
| Scotch-Irish | 969 | 0.7% |
| Scottish | 4,733 | 3.5% |
| Seminole | 8 | 0.0% |
| Serbian | 38 | 0.0% |
| Shoshone | 83 | 0.1% |
| Sioux | 157 | 0.1% |
| Slovak | 98 | 0.1% |
| Slovene | 7 | 0.0% |
| Somali | 120 | 0.1% |
| South African | 22 | 0.0% |
| South American | 893 | 0.7% |
| South American Indian | 92 | 0.1% |
| Spaniard | 527 | 0.4% |
| Spanish | 200 | 0.2% |
| Sri Lankan | 270 | 0.2% |
| Subsaharan African | 896 | 0.7% |
| Swedish | 5,464 | 4.1% |
| Swiss | 2,894 | 2.1% |
| Thai | 213 | 0.2% |
| Tongan | 160 | 0.1% |
| Turkish | 38 | 0.0% |
| Ukrainian | 91 | 0.1% |
| Ute | 19 | 0.0% |
| Venezuelan | 94 | 0.1% |
| Welsh | 2,645 | 2.0% |
| Yugoslavian | 23 | 0.0% |
| Yup'ik | 7 | 0.0% | View All 128 Rows |
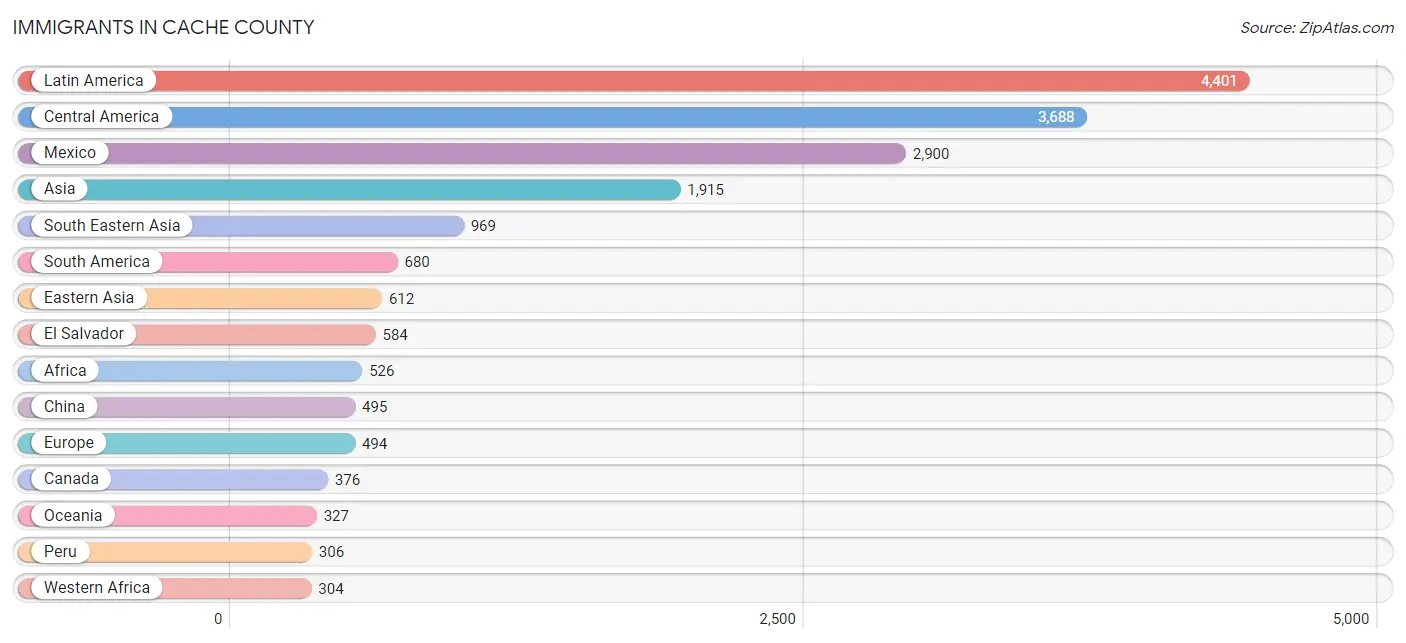
Immigrants in Cache County
The most numerous immigrant groups reported in Cache County came from Latin America (4,401 | 3.3%), Central America (3,688 | 2.7%), Mexico (2,900 | 2.2%), Asia (1,915 | 1.4%), and South Eastern Asia (969 | 0.7%), together accounting for 10.3% of all Cache County residents.
| Immigration Origin | # Population | % Population |
| Africa | 526 | 0.4% |
| Argentina | 74 | 0.1% |
| Armenia | 6 | 0.0% |
| Asia | 1,915 | 1.4% |
| Australia | 36 | 0.0% |
| Austria | 5 | 0.0% |
| Bangladesh | 19 | 0.0% |
| Belgium | 8 | 0.0% |
| Bolivia | 27 | 0.0% |
| Brazil | 130 | 0.1% |
| Cambodia | 200 | 0.2% |
| Canada | 376 | 0.3% |
| Caribbean | 33 | 0.0% |
| Central America | 3,688 | 2.7% |
| Chile | 19 | 0.0% |
| China | 495 | 0.4% |
| Colombia | 6 | 0.0% |
| Czechoslovakia | 11 | 0.0% |
| Denmark | 17 | 0.0% |
| Dominican Republic | 28 | 0.0% |
| Eastern Africa | 184 | 0.1% |
| Eastern Asia | 612 | 0.5% |
| Eastern Europe | 67 | 0.1% |
| Ecuador | 69 | 0.1% |
| El Salvador | 584 | 0.4% |
| England | 89 | 0.1% |
| Eritrea | 1 | 0.0% |
| Ethiopia | 44 | 0.0% |
| Europe | 494 | 0.4% |
| France | 28 | 0.0% |
| Germany | 70 | 0.1% |
| Ghana | 129 | 0.1% |
| Guatemala | 201 | 0.2% |
| Honduras | 3 | 0.0% |
| Hong Kong | 50 | 0.0% |
| India | 112 | 0.1% |
| Indonesia | 19 | 0.0% |
| Iraq | 18 | 0.0% |
| Ireland | 9 | 0.0% |
| Israel | 14 | 0.0% |
| Italy | 9 | 0.0% |
| Jamaica | 5 | 0.0% |
| Japan | 28 | 0.0% |
| Jordan | 3 | 0.0% |
| Kazakhstan | 17 | 0.0% |
| Korea | 89 | 0.1% |
| Kuwait | 38 | 0.0% |
| Laos | 12 | 0.0% |
| Latin America | 4,401 | 3.3% |
| Mexico | 2,900 | 2.2% |
| Micronesia | 41 | 0.0% |
| Middle Africa | 16 | 0.0% |
| Morocco | 12 | 0.0% |
| Nepal | 47 | 0.0% |
| Netherlands | 32 | 0.0% |
| Nigeria | 50 | 0.0% |
| Northern Africa | 12 | 0.0% |
| Northern Europe | 216 | 0.2% |
| Oceania | 327 | 0.2% |
| Pakistan | 8 | 0.0% |
| Peru | 306 | 0.2% |
| Philippines | 126 | 0.1% |
| Poland | 10 | 0.0% |
| Russia | 35 | 0.0% |
| Scotland | 57 | 0.0% |
| Somalia | 120 | 0.1% |
| South Africa | 10 | 0.0% |
| South America | 680 | 0.5% |
| South Central Asia | 203 | 0.2% |
| South Eastern Asia | 969 | 0.7% |
| Southern Europe | 57 | 0.0% |
| Spain | 48 | 0.0% |
| Sweden | 23 | 0.0% |
| Switzerland | 5 | 0.0% |
| Taiwan | 74 | 0.1% |
| Thailand | 283 | 0.2% |
| Turkey | 22 | 0.0% |
| Ukraine | 11 | 0.0% |
| Venezuela | 49 | 0.0% |
| Vietnam | 158 | 0.1% |
| Western Africa | 304 | 0.2% |
| Western Asia | 131 | 0.1% |
| Western Europe | 154 | 0.1% |
| Yemen | 4 | 0.0% |
| Zaire | 10 | 0.0% | View All 85 Rows |
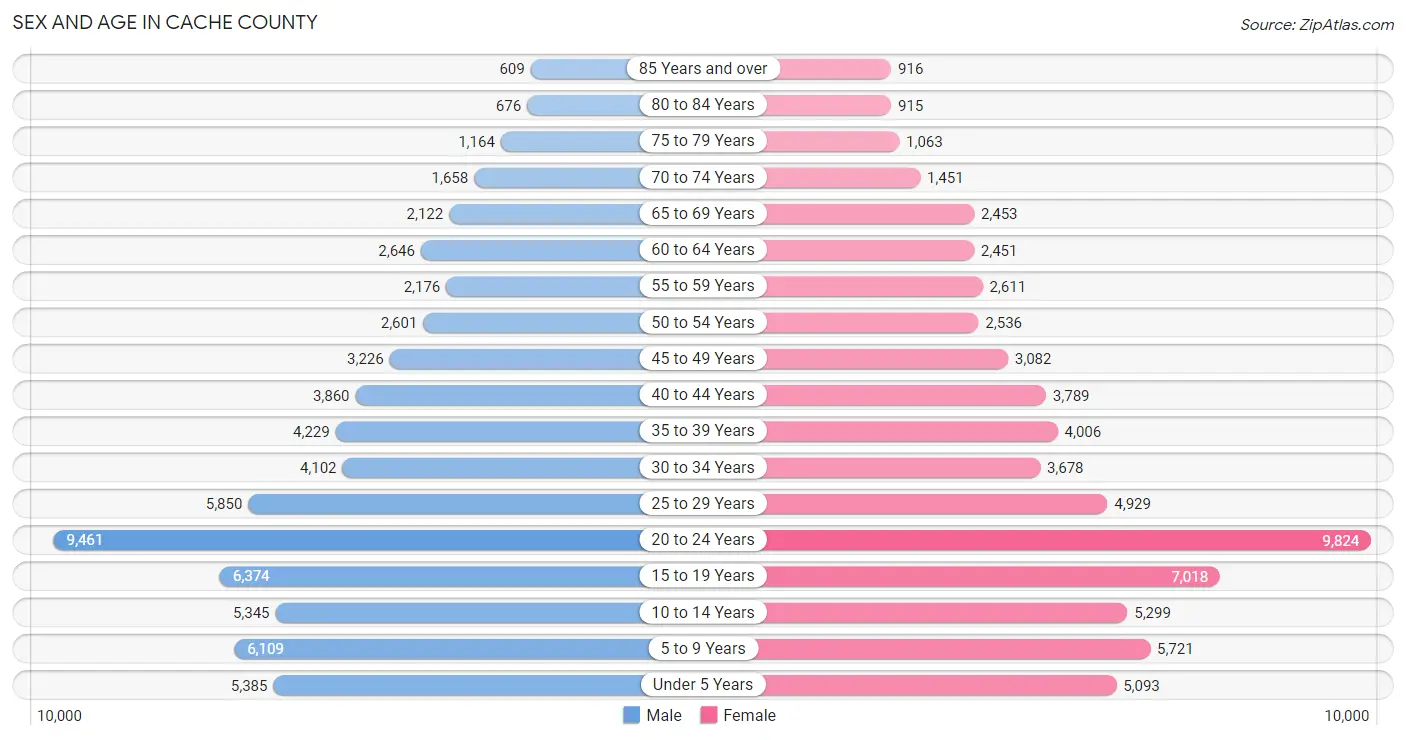
Sex and Age in Cache County
Sex and Age in Cache County
The most populous age groups in Cache County are 20 to 24 Years (9,461 | 14.0%) for men and 20 to 24 Years (9,824 | 14.7%) for women.
| Age Bracket | Male | Female |
| Under 5 Years | 5,385 (8.0%) | 5,093 (7.6%) |
| 5 to 9 Years | 6,109 (9.0%) | 5,721 (8.6%) |
| 10 to 14 Years | 5,345 (7.9%) | 5,299 (7.9%) |
| 15 to 19 Years | 6,374 (9.4%) | 7,018 (10.5%) |
| 20 to 24 Years | 9,461 (14.0%) | 9,824 (14.7%) |
| 25 to 29 Years | 5,850 (8.6%) | 4,929 (7.4%) |
| 30 to 34 Years | 4,102 (6.1%) | 3,678 (5.5%) |
| 35 to 39 Years | 4,229 (6.3%) | 4,006 (6.0%) |
| 40 to 44 Years | 3,860 (5.7%) | 3,789 (5.7%) |
| 45 to 49 Years | 3,226 (4.8%) | 3,082 (4.6%) |
| 50 to 54 Years | 2,601 (3.8%) | 2,536 (3.8%) |
| 55 to 59 Years | 2,176 (3.2%) | 2,611 (3.9%) |
| 60 to 64 Years | 2,646 (3.9%) | 2,451 (3.7%) |
| 65 to 69 Years | 2,122 (3.1%) | 2,453 (3.7%) |
| 70 to 74 Years | 1,658 (2.5%) | 1,451 (2.2%) |
| 75 to 79 Years | 1,164 (1.7%) | 1,063 (1.6%) |
| 80 to 84 Years | 676 (1.0%) | 915 (1.4%) |
| 85 Years and over | 609 (0.9%) | 916 (1.4%) |
| Total | 67,593 (100.0%) | 66,835 (100.0%) |
Families and Households in Cache County
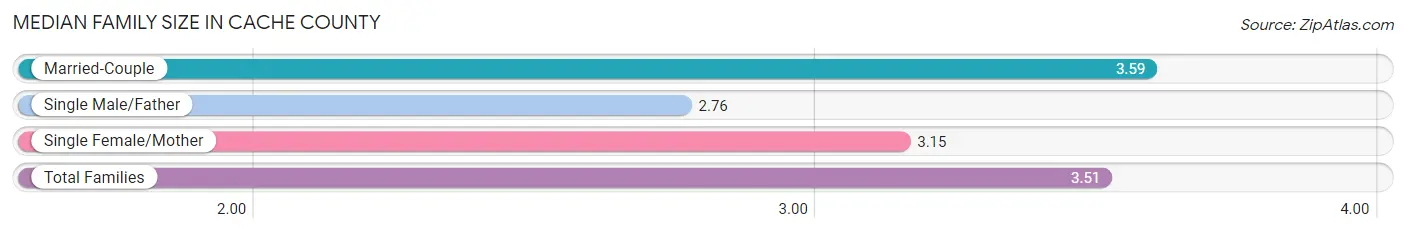
Median Family Size in Cache County
The median family size in Cache County is 3.51 persons per family, with married-couple families (26,894 | 84.7%) accounting for the largest median family size of 3.59 persons per family. On the other hand, single male/father families (1,414 | 4.4%) represent the smallest median family size with 2.76 persons per family.
| Family Type | # Families | Family Size |
| Married-Couple | 26,894 (84.7%) | 3.59 |
| Single Male/Father | 1,414 (4.4%) | 2.76 |
| Single Female/Mother | 3,438 (10.8%) | 3.15 |
| Total Families | 31,746 (100.0%) | 3.51 |
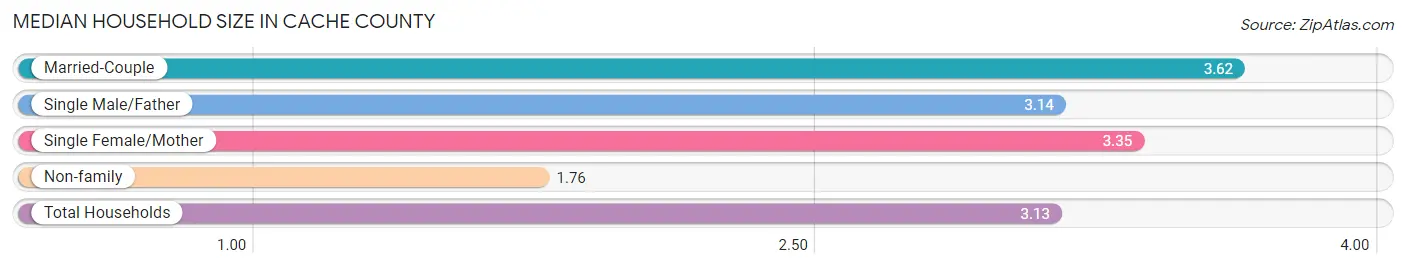
Median Household Size in Cache County
The median household size in Cache County is 3.13 persons per household, with married-couple households (26,894 | 64.5%) accounting for the largest median household size of 3.62 persons per household. non-family households (9,972 | 23.9%) represent the smallest median household size with 1.76 persons per household.
| Household Type | # Households | Household Size |
| Married-Couple | 26,894 (64.5%) | 3.62 |
| Single Male/Father | 1,414 (3.4%) | 3.14 |
| Single Female/Mother | 3,438 (8.2%) | 3.35 |
| Non-family | 9,972 (23.9%) | 1.76 |
| Total Households | 41,718 (100.0%) | 3.13 |
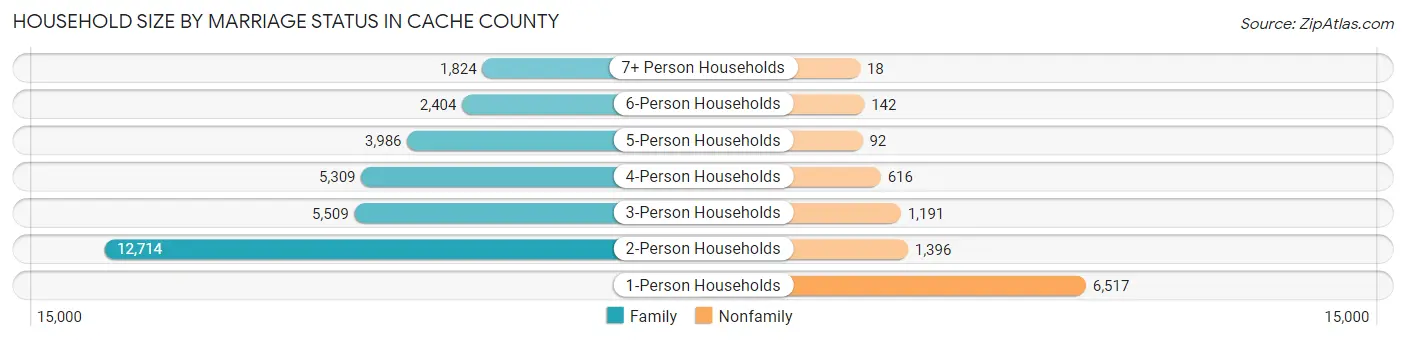
Household Size by Marriage Status in Cache County
Out of a total of 41,718 households in Cache County, 31,746 (76.1%) are family households, while 9,972 (23.9%) are nonfamily households. The most numerous type of family households are 2-person households, comprising 12,714, and the most common type of nonfamily households are 1-person households, comprising 6,517.
| Household Size | Family Households | Nonfamily Households |
| 1-Person Households | - | 6,517 (15.6%) |
| 2-Person Households | 12,714 (30.5%) | 1,396 (3.4%) |
| 3-Person Households | 5,509 (13.2%) | 1,191 (2.9%) |
| 4-Person Households | 5,309 (12.7%) | 616 (1.5%) |
| 5-Person Households | 3,986 (9.6%) | 92 (0.2%) |
| 6-Person Households | 2,404 (5.8%) | 142 (0.3%) |
| 7+ Person Households | 1,824 (4.4%) | 18 (0.0%) |
| Total | 31,746 (76.1%) | 9,972 (23.9%) |
Female Fertility in Cache County
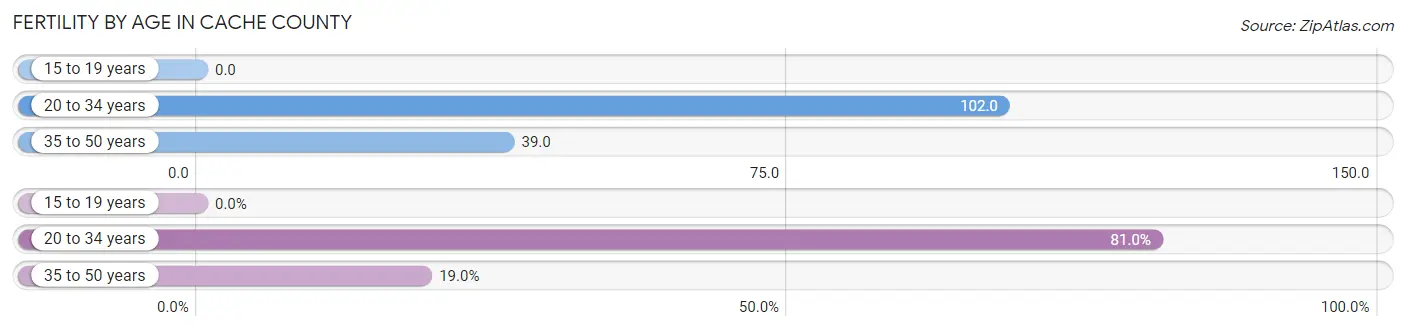
Fertility by Age in Cache County
Average fertility rate in Cache County is 63.0 births per 1,000 women. Women in the age bracket of 20 to 34 years have the highest fertility rate with 102.0 births per 1,000 women. Women in the age bracket of 20 to 34 years acount for 81.0% of all women with births.
| Age Bracket | Women with Births | Births / 1,000 Women |
| 15 to 19 years | 0 (0.0%) | 0.0 |
| 20 to 34 years | 1,882 (81.0%) | 102.0 |
| 35 to 50 years | 442 (19.0%) | 39.0 |
| Total | 2,324 (100.0%) | 63.0 |
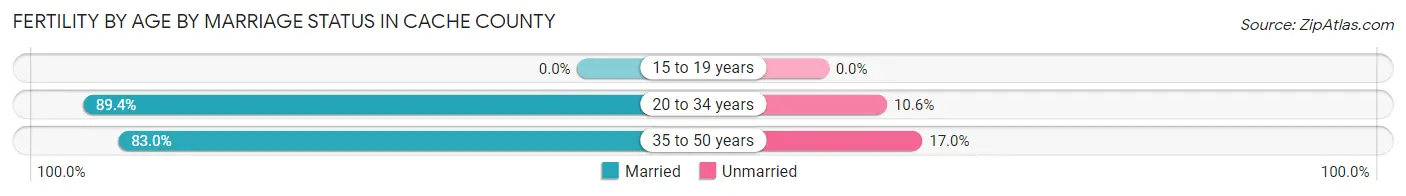
Fertility by Age by Marriage Status in Cache County
88.2% of women with births (2,324) in Cache County are married. The highest percentage of unmarried women with births falls into 35 to 50 years age bracket with 17.0% of them unmarried at the time of birth, while the lowest percentage of unmarried women with births belong to 20 to 34 years age bracket with 10.6% of them unmarried.
| Age Bracket | Married | Unmarried |
| 15 to 19 years | 0 (0.0%) | 0 (0.0%) |
| 20 to 34 years | 1,683 (89.4%) | 199 (10.6%) |
| 35 to 50 years | 367 (83.0%) | 75 (17.0%) |
| Total | 2,050 (88.2%) | 274 (11.8%) |
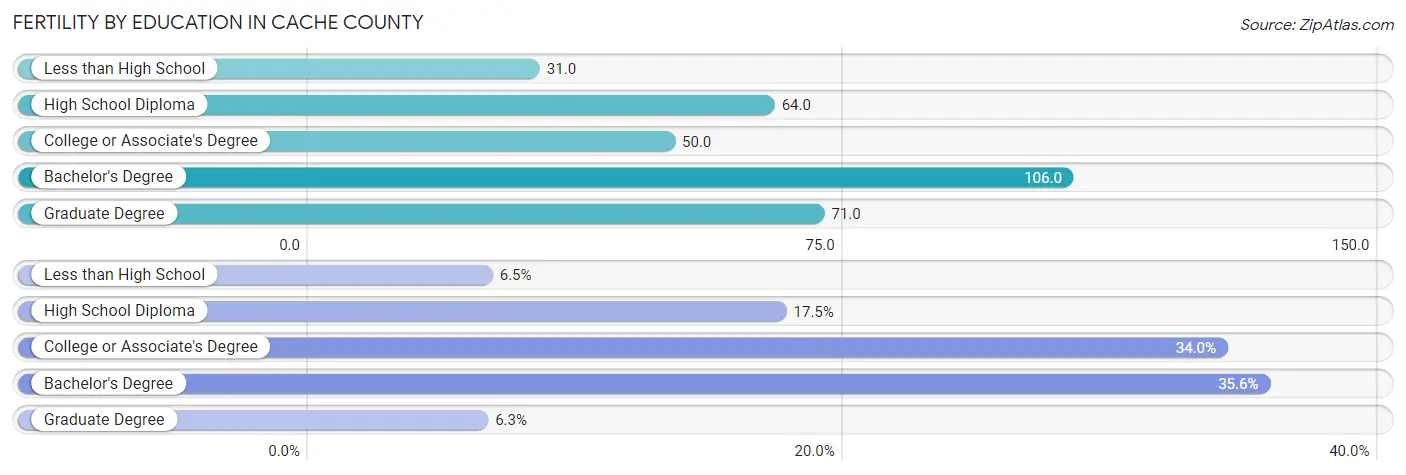
Fertility by Education in Cache County
Average fertility rate in Cache County is 63.0 births per 1,000 women. Women with the education attainment of bachelor's degree have the highest fertility rate of 106.0 births per 1,000 women, while women with the education attainment of less than high school have the lowest fertility at 31.0 births per 1,000 women. Women with the education attainment of bachelor's degree represent 35.6% of all women with births.
| Educational Attainment | Women with Births | Births / 1,000 Women |
| Less than High School | 151 (6.5%) | 31.0 |
| High School Diploma | 407 (17.5%) | 64.0 |
| College or Associate's Degree | 791 (34.0%) | 50.0 |
| Bachelor's Degree | 828 (35.6%) | 106.0 |
| Graduate Degree | 147 (6.3%) | 71.0 |
| Total | 2,324 (100.0%) | 63.0 |
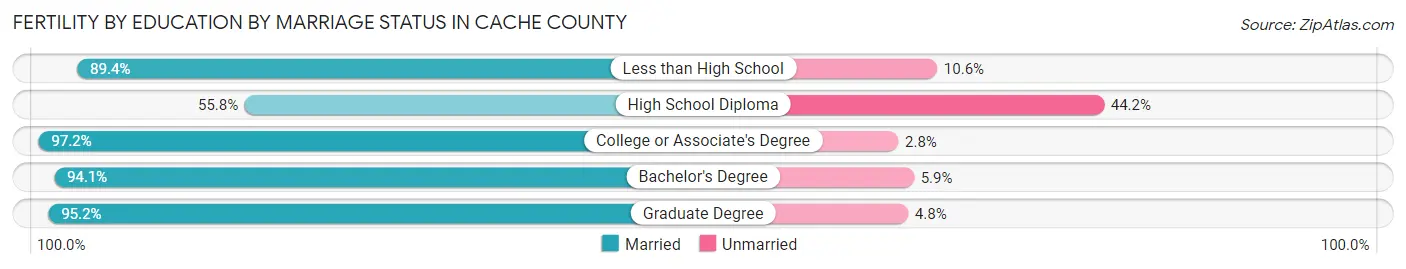
Fertility by Education by Marriage Status in Cache County
11.8% of women with births in Cache County are unmarried. Women with the educational attainment of college or associate's degree are most likely to be married with 97.2% of them married at childbirth, while women with the educational attainment of high school diploma are least likely to be married with 44.2% of them unmarried at childbirth.
| Educational Attainment | Married | Unmarried |
| Less than High School | 135 (89.4%) | 16 (10.6%) |
| High School Diploma | 227 (55.8%) | 180 (44.2%) |
| College or Associate's Degree | 769 (97.2%) | 22 (2.8%) |
| Bachelor's Degree | 779 (94.1%) | 49 (5.9%) |
| Graduate Degree | 140 (95.2%) | 7 (4.8%) |
| Total | 2,050 (88.2%) | 274 (11.8%) |
Income in Cache County
Income Overview in Cache County
Per Capita Income in Cache County is $29,298, while median incomes of families and households are $82,750 and $72,719 respectively.
| Characteristic | Number | Measure |
| Per Capita Income | 134,428 | $29,298 |
| Median Family Income | 31,746 | $82,750 |
| Mean Family Income | 31,746 | $103,196 |
| Median Household Income | 41,718 | $72,719 |
| Mean Household Income | 41,718 | $92,460 |
| Income Deficit | 31,746 | $10,236 |
| Wage / Income Gap (%) | 134,428 | 52.02% |
| Wage / Income Gap ($) | 134,428 | 47.98¢ per $1 |
| Gini / Inequality Index | 134,428 | 0.43 |
Earnings by Sex in Cache County
Average Earnings in Cache County are $29,602, $40,103 for men and $19,240 for women, a difference of 52.0%.
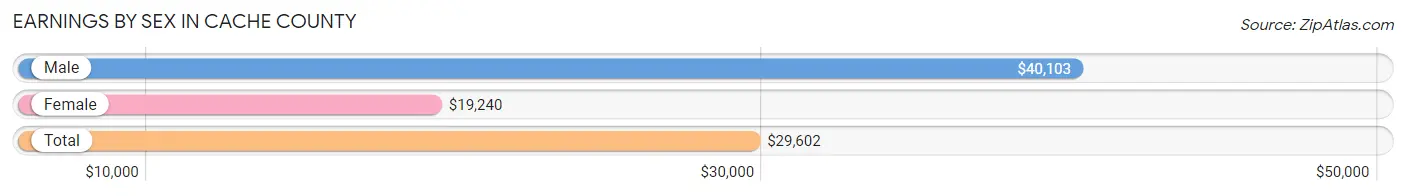
| Sex | Number | Average Earnings |
| Male | 40,711 (54.9%) | $40,103 |
| Female | 33,499 (45.1%) | $19,240 |
| Total | 74,210 (100.0%) | $29,602 |
Earnings by Sex by Income Bracket in Cache County
The most common earnings brackets in Cache County are $100,000+ for men (5,536 | 13.6%) and $2,499 or less for women (2,917 | 8.7%).
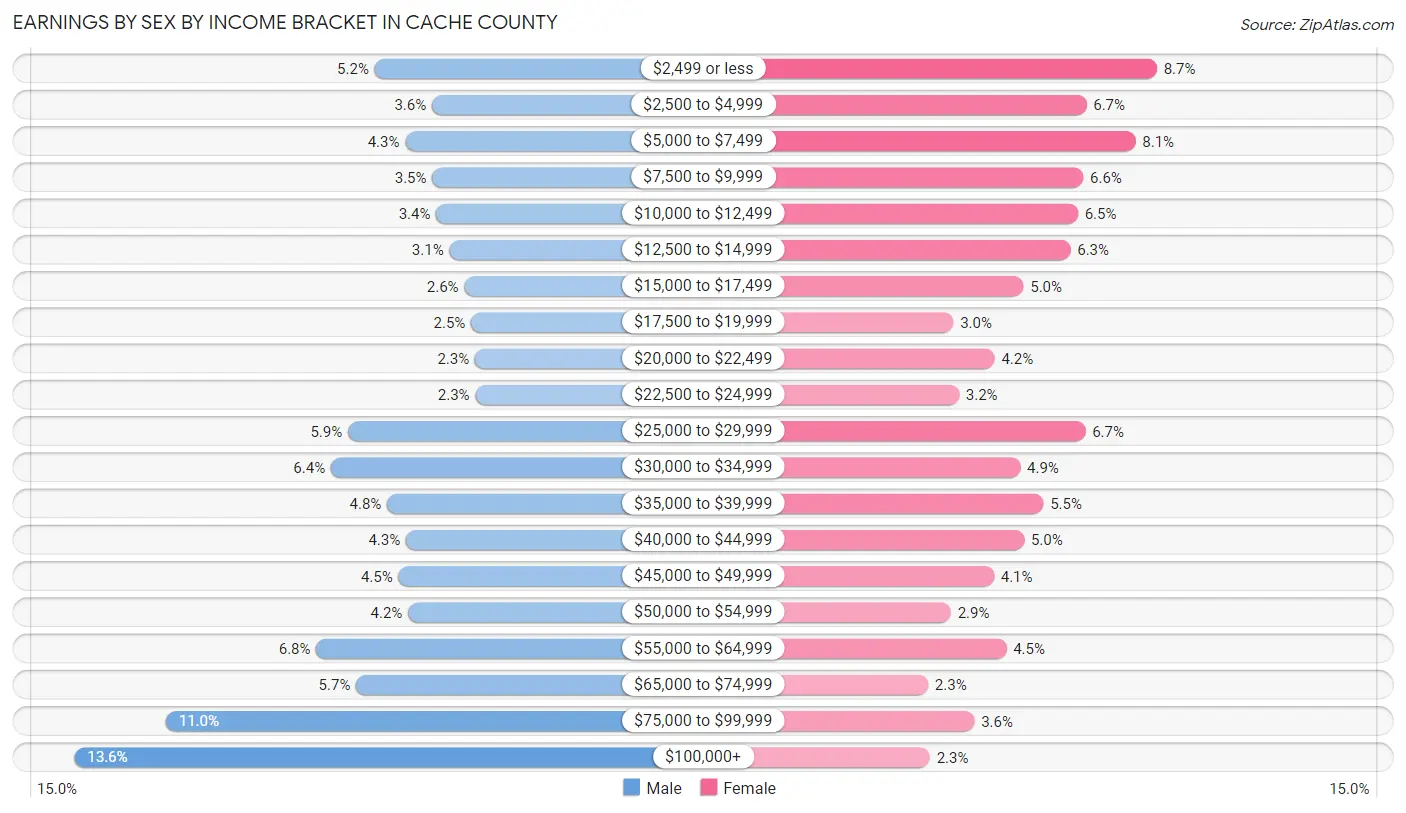
| Income | Male | Female |
| $2,499 or less | 2,102 (5.2%) | 2,917 (8.7%) |
| $2,500 to $4,999 | 1,447 (3.5%) | 2,256 (6.7%) |
| $5,000 to $7,499 | 1,750 (4.3%) | 2,718 (8.1%) |
| $7,500 to $9,999 | 1,442 (3.5%) | 2,224 (6.6%) |
| $10,000 to $12,499 | 1,396 (3.4%) | 2,174 (6.5%) |
| $12,500 to $14,999 | 1,244 (3.1%) | 2,103 (6.3%) |
| $15,000 to $17,499 | 1,073 (2.6%) | 1,660 (5.0%) |
| $17,500 to $19,999 | 996 (2.5%) | 1,002 (3.0%) |
| $20,000 to $22,499 | 952 (2.3%) | 1,390 (4.2%) |
| $22,500 to $24,999 | 948 (2.3%) | 1,054 (3.2%) |
| $25,000 to $29,999 | 2,407 (5.9%) | 2,245 (6.7%) |
| $30,000 to $34,999 | 2,600 (6.4%) | 1,633 (4.9%) |
| $35,000 to $39,999 | 1,958 (4.8%) | 1,849 (5.5%) |
| $40,000 to $44,999 | 1,741 (4.3%) | 1,667 (5.0%) |
| $45,000 to $49,999 | 1,828 (4.5%) | 1,382 (4.1%) |
| $50,000 to $54,999 | 1,718 (4.2%) | 977 (2.9%) |
| $55,000 to $64,999 | 2,769 (6.8%) | 1,502 (4.5%) |
| $65,000 to $74,999 | 2,314 (5.7%) | 765 (2.3%) |
| $75,000 to $99,999 | 4,490 (11.0%) | 1,200 (3.6%) |
| $100,000+ | 5,536 (13.6%) | 781 (2.3%) |
| Total | 40,711 (100.0%) | 33,499 (100.0%) |
Earnings by Sex by Educational Attainment in Cache County
Average earnings in Cache County are $55,917 for men and $31,412 for women, a difference of 43.8%. Men with an educational attainment of graduate degree enjoy the highest average annual earnings of $91,133, while those with less than high school education earn the least with $38,625. Women with an educational attainment of graduate degree earn the most with the average annual earnings of $50,038, while those with less than high school education have the smallest earnings of $22,569.
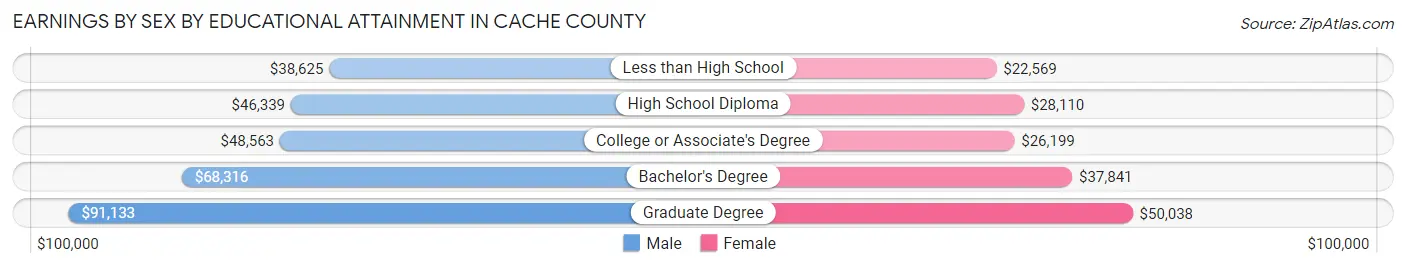
| Educational Attainment | Male Income | Female Income |
| Less than High School | $38,625 | $22,569 |
| High School Diploma | $46,339 | $28,110 |
| College or Associate's Degree | $48,563 | $26,199 |
| Bachelor's Degree | $68,316 | $37,841 |
| Graduate Degree | $91,133 | $50,038 |
| Total | $55,917 | $31,412 |
Family Income in Cache County
Family Income Brackets in Cache County
According to the Cache County family income data, there are 7,302 families falling into the $100,000 to $149,999 income range, which is the most common income bracket and makes up 23.0% of all families. Conversely, the $10,000 to $14,999 income bracket is the least frequent group with only 667 families (2.1%) belonging to this category.
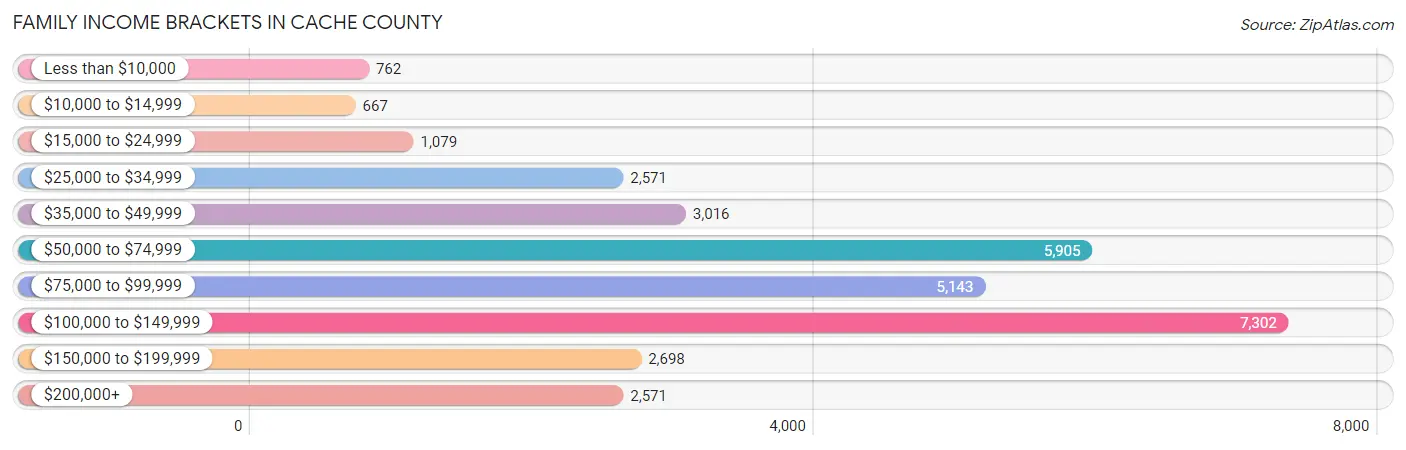
| Income Bracket | # Families | % Families |
| Less than $10,000 | 762 | 2.4% |
| $10,000 to $14,999 | 667 | 2.1% |
| $15,000 to $24,999 | 1,079 | 3.4% |
| $25,000 to $34,999 | 2,571 | 8.1% |
| $35,000 to $49,999 | 3,016 | 9.5% |
| $50,000 to $74,999 | 5,905 | 18.6% |
| $75,000 to $99,999 | 5,143 | 16.2% |
| $100,000 to $149,999 | 7,302 | 23.0% |
| $150,000 to $199,999 | 2,698 | 8.5% |
| $200,000+ | 2,571 | 8.1% |
Family Income by Famaliy Size in Cache County
7+ person families (1,637 | 5.2%) account for the highest median family income in Cache County with $106,639 per family, while 2-person families (13,291 | 41.9%) have the highest median income of $34,303 per family member.
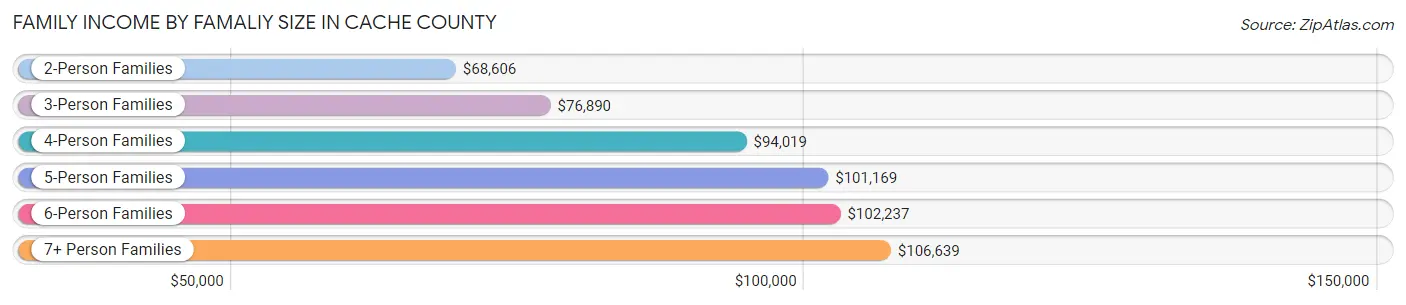
| Income Bracket | # Families | Median Income |
| 2-Person Families | 13,291 (41.9%) | $68,606 |
| 3-Person Families | 5,368 (16.9%) | $76,890 |
| 4-Person Families | 5,117 (16.1%) | $94,019 |
| 5-Person Families | 3,975 (12.5%) | $101,169 |
| 6-Person Families | 2,358 (7.4%) | $102,237 |
| 7+ Person Families | 1,637 (5.2%) | $106,639 |
| Total | 31,746 (100.0%) | $82,750 |
Family Income by Number of Earners in Cache County
The median family income in Cache County is $82,750, with families comprising 3+ earners (4,712) having the highest median family income of $131,731, while families with 1 earner (8,931) have the lowest median family income of $59,561, accounting for 14.8% and 28.1% of families, respectively.
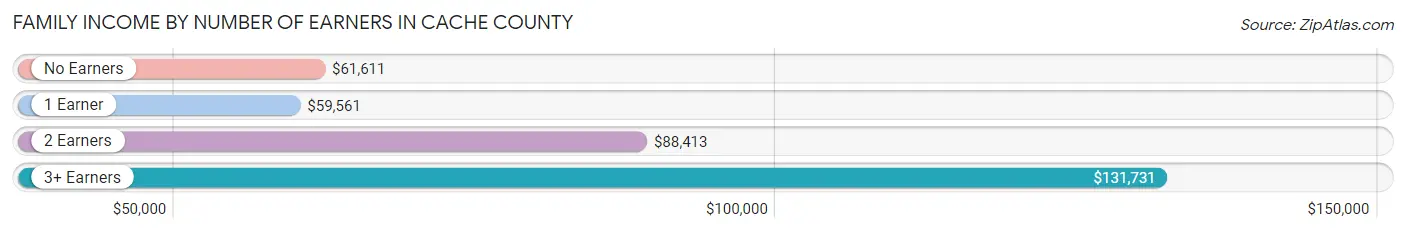
| Number of Earners | # Families | Median Income |
| No Earners | 2,907 (9.2%) | $61,611 |
| 1 Earner | 8,931 (28.1%) | $59,561 |
| 2 Earners | 15,196 (47.9%) | $88,413 |
| 3+ Earners | 4,712 (14.8%) | $131,731 |
| Total | 31,746 (100.0%) | $82,750 |
Household Income in Cache County
Household Income Brackets in Cache County
With 8,260 households falling in the category, the $100,000 to $149,999 income range is the most frequent in Cache County, accounting for 19.8% of all households. In contrast, only 1,043 households (2.5%) fall into the $10,000 to $14,999 income bracket, making it the least populous group.
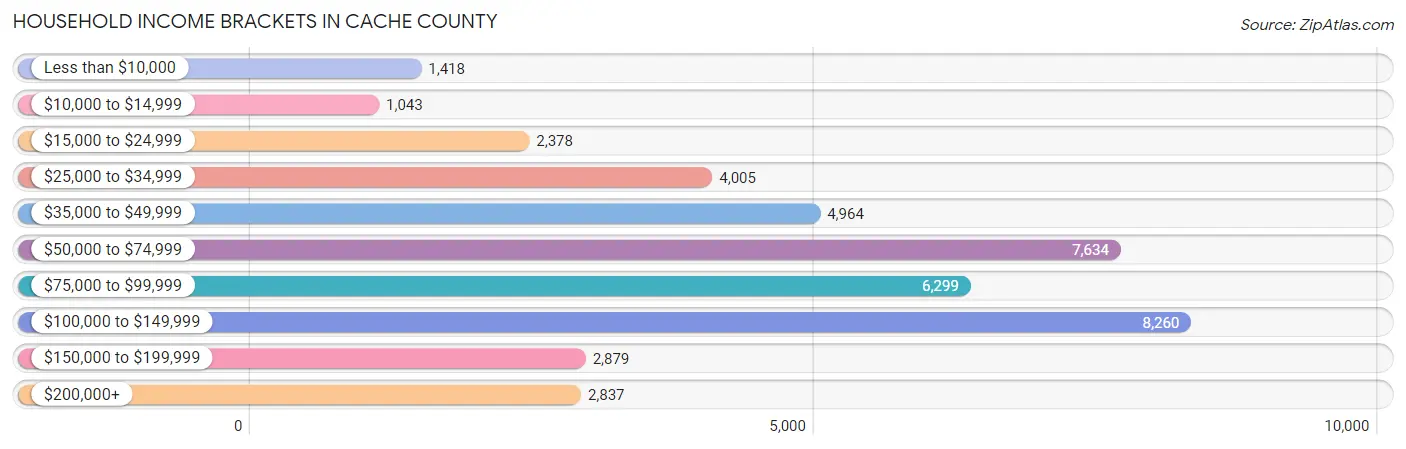
| Income Bracket | # Households | % Households |
| Less than $10,000 | 1,418 | 3.4% |
| $10,000 to $14,999 | 1,043 | 2.5% |
| $15,000 to $24,999 | 2,378 | 5.7% |
| $25,000 to $34,999 | 4,005 | 9.6% |
| $35,000 to $49,999 | 4,964 | 11.9% |
| $50,000 to $74,999 | 7,634 | 18.3% |
| $75,000 to $99,999 | 6,299 | 15.1% |
| $100,000 to $149,999 | 8,260 | 19.8% |
| $150,000 to $199,999 | 2,879 | 6.9% |
| $200,000+ | 2,837 | 6.8% |
Household Income by Householder Age in Cache County
The median household income in Cache County is $72,719, with the highest median household income of $102,017 found in the 45 to 64 years age bracket for the primary householder. A total of 11,536 households (27.7%) fall into this category. Meanwhile, the 15 to 24 years age bracket for the primary householder has the lowest median household income of $34,584, with 5,987 households (14.3%) in this group.
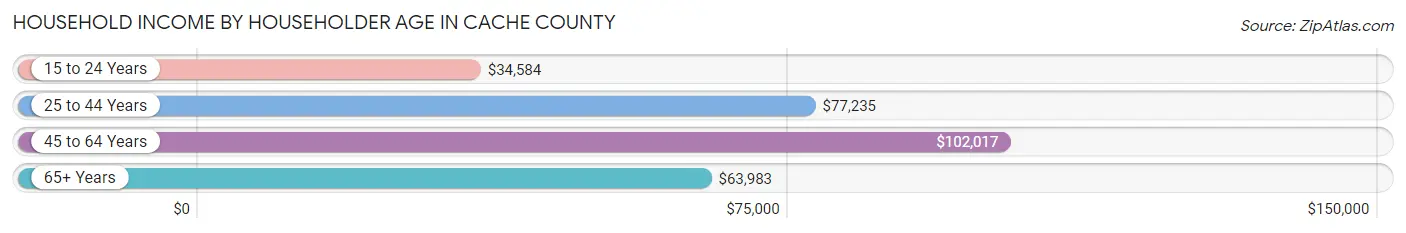
| Income Bracket | # Households | Median Income |
| 15 to 24 Years | 5,987 (14.3%) | $34,584 |
| 25 to 44 Years | 16,431 (39.4%) | $77,235 |
| 45 to 64 Years | 11,536 (27.7%) | $102,017 |
| 65+ Years | 7,764 (18.6%) | $63,983 |
| Total | 41,718 (100.0%) | $72,719 |
Poverty in Cache County
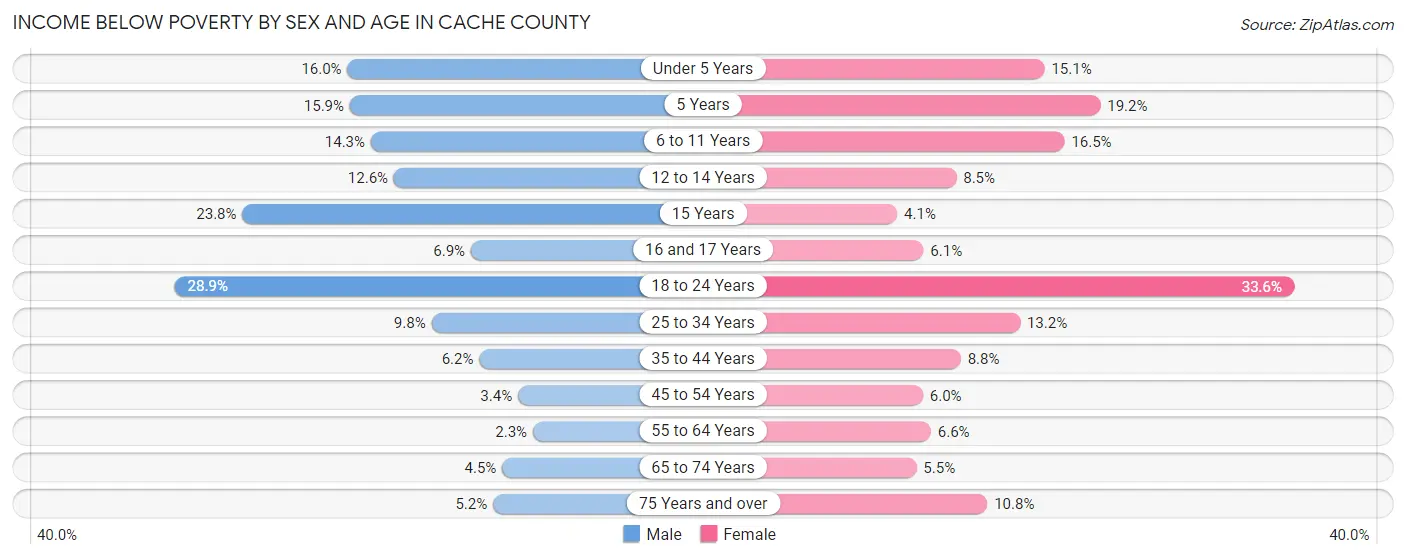
Income Below Poverty by Sex and Age in Cache County
With 12.4% poverty level for males and 14.7% for females among the residents of Cache County, 18 to 24 year old males and 18 to 24 year old females are the most vulnerable to poverty, with 3,184 males (28.9%) and 4,008 females (33.6%) in their respective age groups living below the poverty level.
| Age Bracket | Male | Female |
| Under 5 Years | 863 (16.0%) | 764 (15.0%) |
| 5 Years | 168 (15.9%) | 185 (19.2%) |
| 6 to 11 Years | 1,052 (14.3%) | 1,118 (16.5%) |
| 12 to 14 Years | 373 (12.6%) | 272 (8.5%) |
| 15 Years | 327 (23.8%) | 51 (4.1%) |
| 16 and 17 Years | 146 (6.9%) | 123 (6.1%) |
| 18 to 24 Years | 3,184 (28.9%) | 4,008 (33.6%) |
| 25 to 34 Years | 959 (9.8%) | 1,135 (13.2%) |
| 35 to 44 Years | 498 (6.2%) | 688 (8.8%) |
| 45 to 54 Years | 195 (3.4%) | 338 (6.0%) |
| 55 to 64 Years | 108 (2.3%) | 332 (6.6%) |
| 65 to 74 Years | 171 (4.5%) | 212 (5.5%) |
| 75 Years and over | 125 (5.2%) | 300 (10.8%) |
| Total | 8,169 (12.4%) | 9,526 (14.7%) |
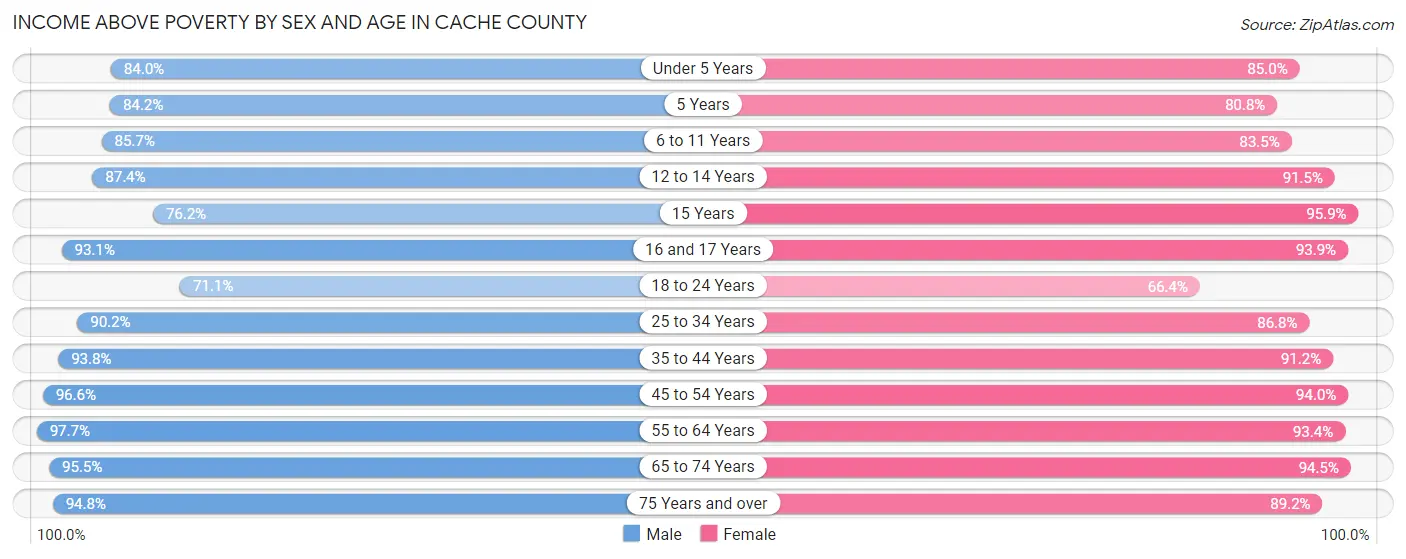
Income Above Poverty by Sex and Age in Cache County
According to the poverty statistics in Cache County, males aged 55 to 64 years and females aged 15 years are the age groups that are most secure financially, with 97.7% of males and 95.9% of females in these age groups living above the poverty line.
| Age Bracket | Male | Female |
| Under 5 Years | 4,519 (84.0%) | 4,314 (85.0%) |
| 5 Years | 892 (84.2%) | 779 (80.8%) |
| 6 to 11 Years | 6,309 (85.7%) | 5,645 (83.5%) |
| 12 to 14 Years | 2,592 (87.4%) | 2,928 (91.5%) |
| 15 Years | 1,045 (76.2%) | 1,189 (95.9%) |
| 16 and 17 Years | 1,982 (93.1%) | 1,908 (93.9%) |
| 18 to 24 Years | 7,849 (71.1%) | 7,936 (66.4%) |
| 25 to 34 Years | 8,837 (90.2%) | 7,444 (86.8%) |
| 35 to 44 Years | 7,479 (93.8%) | 7,107 (91.2%) |
| 45 to 54 Years | 5,588 (96.6%) | 5,274 (94.0%) |
| 55 to 64 Years | 4,674 (97.7%) | 4,688 (93.4%) |
| 65 to 74 Years | 3,598 (95.5%) | 3,615 (94.5%) |
| 75 Years and over | 2,271 (94.8%) | 2,479 (89.2%) |
| Total | 57,635 (87.6%) | 55,306 (85.3%) |
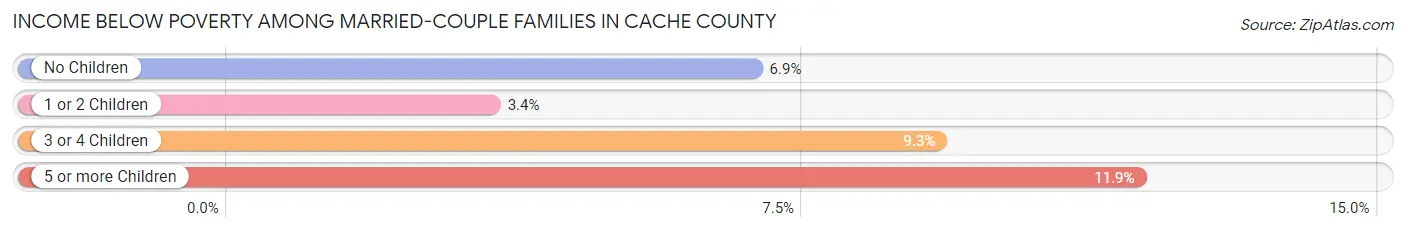
Income Below Poverty Among Married-Couple Families in Cache County
The poverty statistics for married-couple families in Cache County show that 6.5% or 1,736 of the total 26,894 families live below the poverty line. Families with 5 or more children have the highest poverty rate of 11.9%, comprising of 105 families. On the other hand, families with 1 or 2 children have the lowest poverty rate of 3.4%, which includes 269 families.
| Children | Above Poverty | Below Poverty |
| No Children | 12,384 (93.1%) | 911 (6.9%) |
| 1 or 2 Children | 7,573 (96.6%) | 269 (3.4%) |
| 3 or 4 Children | 4,421 (90.7%) | 451 (9.3%) |
| 5 or more Children | 780 (88.1%) | 105 (11.9%) |
| Total | 25,158 (93.5%) | 1,736 (6.5%) |
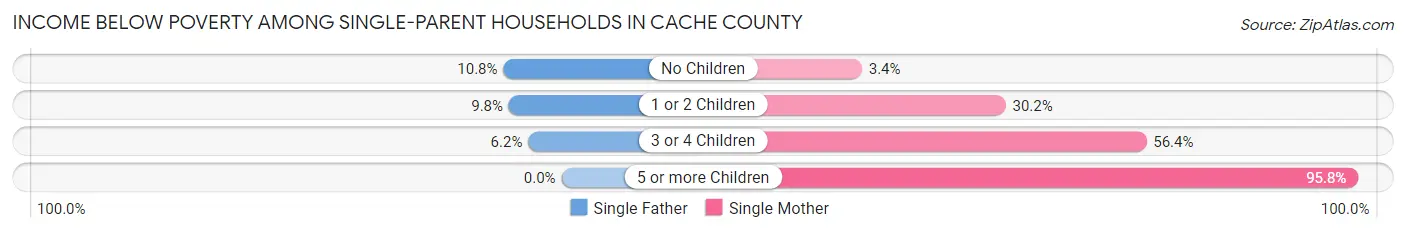
Income Below Poverty Among Single-Parent Households in Cache County
According to the poverty data in Cache County, 10.0% or 142 single-father households and 25.1% or 864 single-mother households are living below the poverty line. Among single-father households, those with no children have the highest poverty rate, with 82 households (10.8%) experiencing poverty. Likewise, among single-mother households, those with 5 or more children have the highest poverty rate, with 115 households (95.8%) falling below the poverty line.
| Children | Single Father | Single Mother |
| No Children | 82 (10.8%) | 42 (3.4%) |
| 1 or 2 Children | 54 (9.8%) | 530 (30.1%) |
| 3 or 4 Children | 6 (6.2%) | 177 (56.4%) |
| 5 or more Children | 0 (0.0%) | 115 (95.8%) |
| Total | 142 (10.0%) | 864 (25.1%) |
Income Below Poverty Among Married-Couple vs Single-Parent Households in Cache County
The poverty data for Cache County shows that 1,736 of the married-couple family households (6.5%) and 1,006 of the single-parent households (20.7%) are living below the poverty level. Within the married-couple family households, those with 5 or more children have the highest poverty rate, with 105 households (11.9%) falling below the poverty line. Among the single-parent households, those with 5 or more children have the highest poverty rate, with 115 household (89.8%) living below poverty.
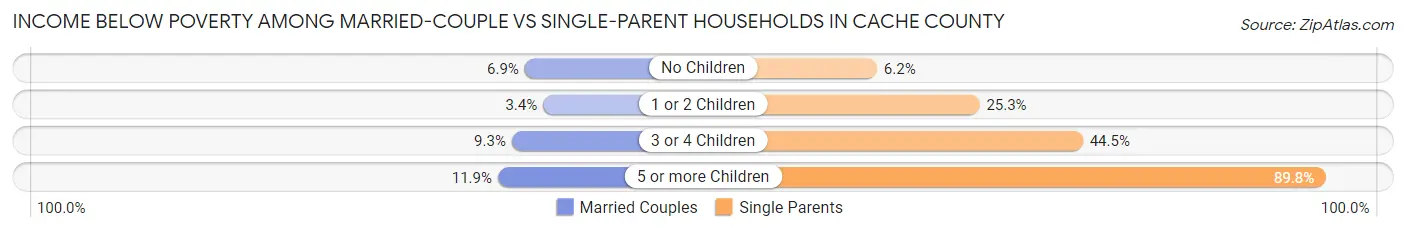
| Children | Married-Couple Families | Single-Parent Households |
| No Children | 911 (6.9%) | 124 (6.2%) |
| 1 or 2 Children | 269 (3.4%) | 584 (25.3%) |
| 3 or 4 Children | 451 (9.3%) | 183 (44.5%) |
| 5 or more Children | 105 (11.9%) | 115 (89.8%) |
| Total | 1,736 (6.5%) | 1,006 (20.7%) |
Employment Characteristics in Cache County
Employment by Class of Employer in Cache County
Among the 66,302 employed individuals in Cache County, private company employees (44,983 | 67.8%), state government employees (6,011 | 9.1%), and local government employees (4,383 | 6.6%) make up the most common classes of employment.
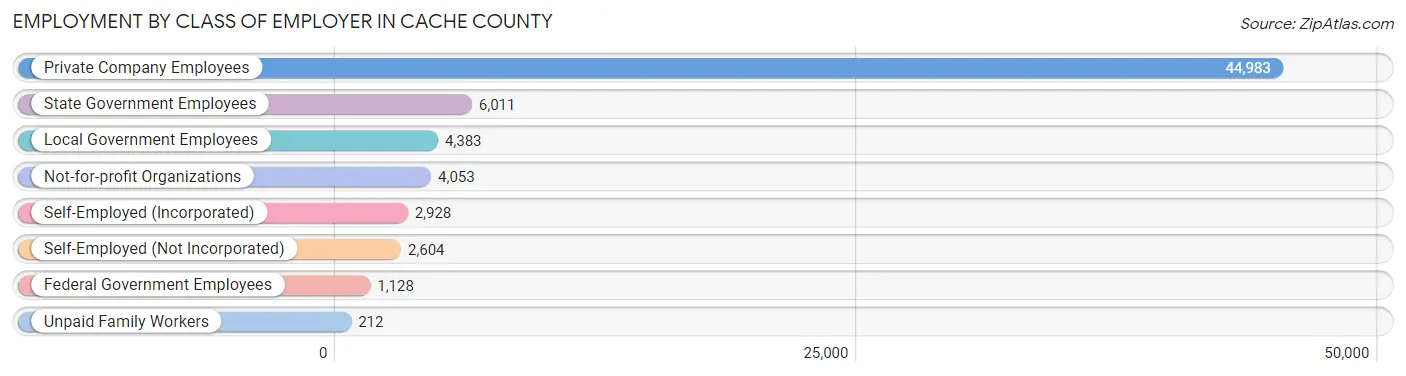
| Employer Class | # Employees | % Employees |
| Private Company Employees | 44,983 | 67.8% |
| Self-Employed (Incorporated) | 2,928 | 4.4% |
| Self-Employed (Not Incorporated) | 2,604 | 3.9% |
| Not-for-profit Organizations | 4,053 | 6.1% |
| Local Government Employees | 4,383 | 6.6% |
| State Government Employees | 6,011 | 9.1% |
| Federal Government Employees | 1,128 | 1.7% |
| Unpaid Family Workers | 212 | 0.3% |
| Total | 66,302 | 100.0% |
Employment Status by Age in Cache County
According to the labor force statistics for Cache County, out of the total population over 16 years of age (98,840), 70.1% or 69,287 individuals are in the labor force, with 2.4% or 1,663 of them unemployed. The age group with the highest labor force participation rate is 45 to 54 years, with 84.0% or 9,614 individuals in the labor force. Within the labor force, the 16 to 19 years age range has the highest percentage of unemployed individuals, with 6.0% or 364 of them being unemployed.
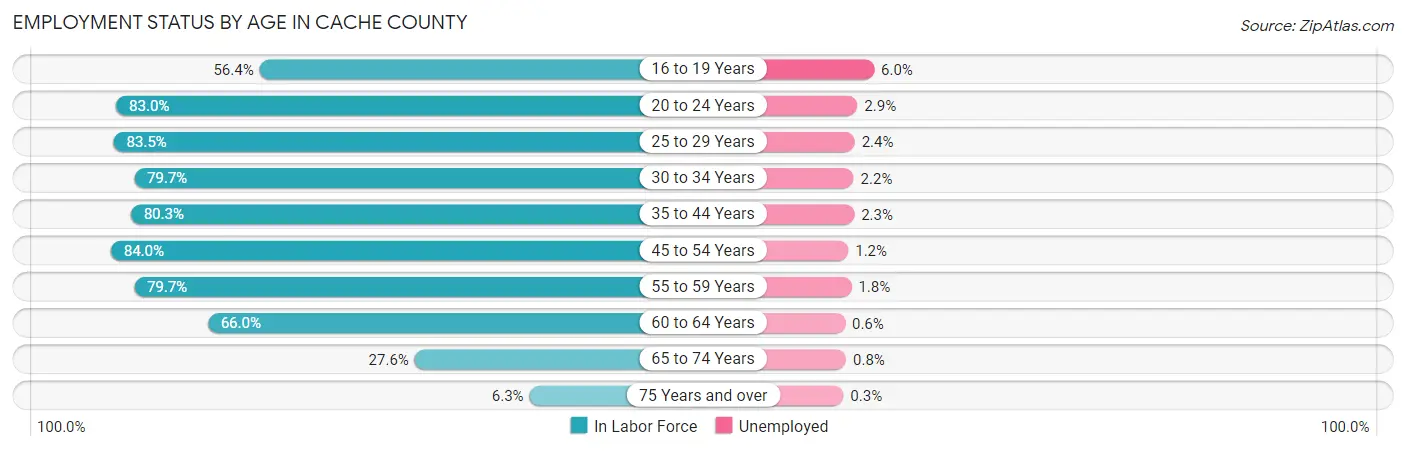
| Age Bracket | In Labor Force | Unemployed |
| 16 to 19 Years | 6,066 (56.4%) | 364 (6.0%) |
| 20 to 24 Years | 16,007 (83.0%) | 464 (2.9%) |
| 25 to 29 Years | 9,000 (83.5%) | 216 (2.4%) |
| 30 to 34 Years | 6,201 (79.7%) | 136 (2.2%) |
| 35 to 44 Years | 12,755 (80.3%) | 293 (2.3%) |
| 45 to 54 Years | 9,614 (84.0%) | 115 (1.2%) |
| 55 to 59 Years | 3,815 (79.7%) | 69 (1.8%) |
| 60 to 64 Years | 3,364 (66.0%) | 20 (0.6%) |
| 65 to 74 Years | 2,121 (27.6%) | 17 (0.8%) |
| 75 Years and over | 337 (6.3%) | 1 (0.3%) |
| Total | 69,287 (70.1%) | 1,663 (2.4%) |
Employment Status by Educational Attainment in Cache County
According to labor force statistics for Cache County, 80.2% of individuals (44,729) out of the total population between 25 and 64 years of age (55,772) are in the labor force, with 1.9% or 850 of them being unemployed. The group with the highest labor force participation rate are those with the educational attainment of bachelor's degree or higher, with 82.6% or 18,426 individuals in the labor force. Within the labor force, individuals with less than high school education have the highest percentage of unemployment, with 3.2% or 67 of them being unemployed.
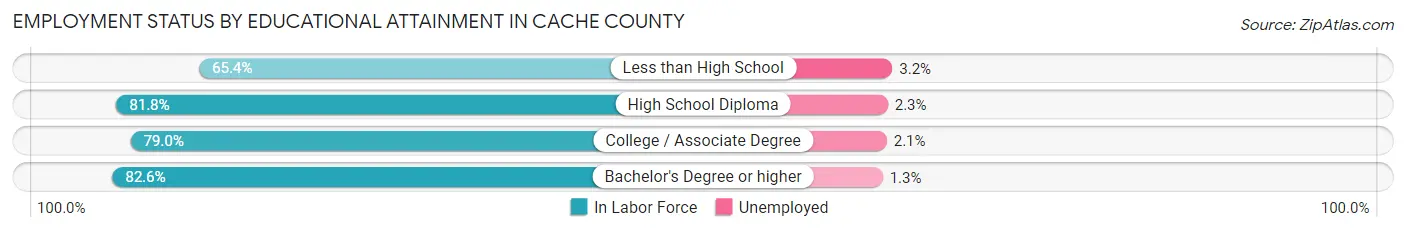
| Educational Attainment | In Labor Force | Unemployed |
| Less than High School | 2,082 (65.4%) | 102 (3.2%) |
| High School Diploma | 9,053 (81.8%) | 255 (2.3%) |
| College / Associate Degree | 15,180 (79.0%) | 404 (2.1%) |
| Bachelor's Degree or higher | 18,426 (82.6%) | 290 (1.3%) |
| Total | 44,729 (80.2%) | 1,060 (1.9%) |
Employment Occupations by Sex in Cache County
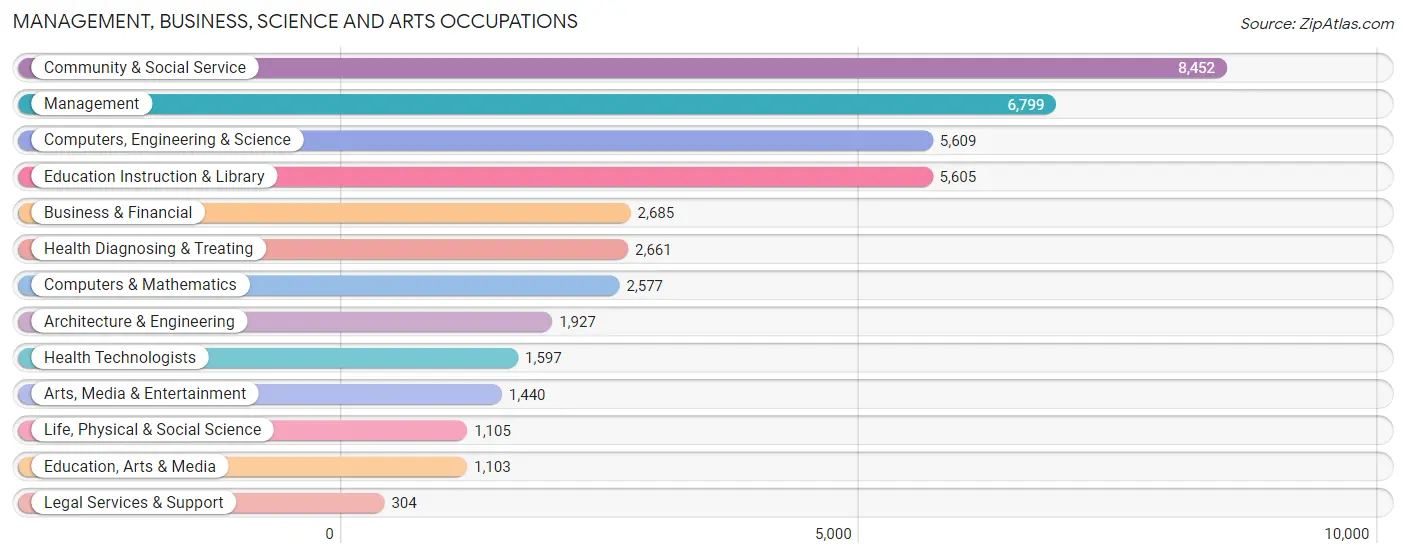
Management, Business, Science and Arts Occupations
The most common Management, Business, Science and Arts occupations in Cache County are Community & Social Service (8,452 | 12.5%), Management (6,799 | 10.1%), Computers, Engineering & Science (5,609 | 8.3%), Education Instruction & Library (5,605 | 8.3%), and Business & Financial (2,685 | 4.0%).
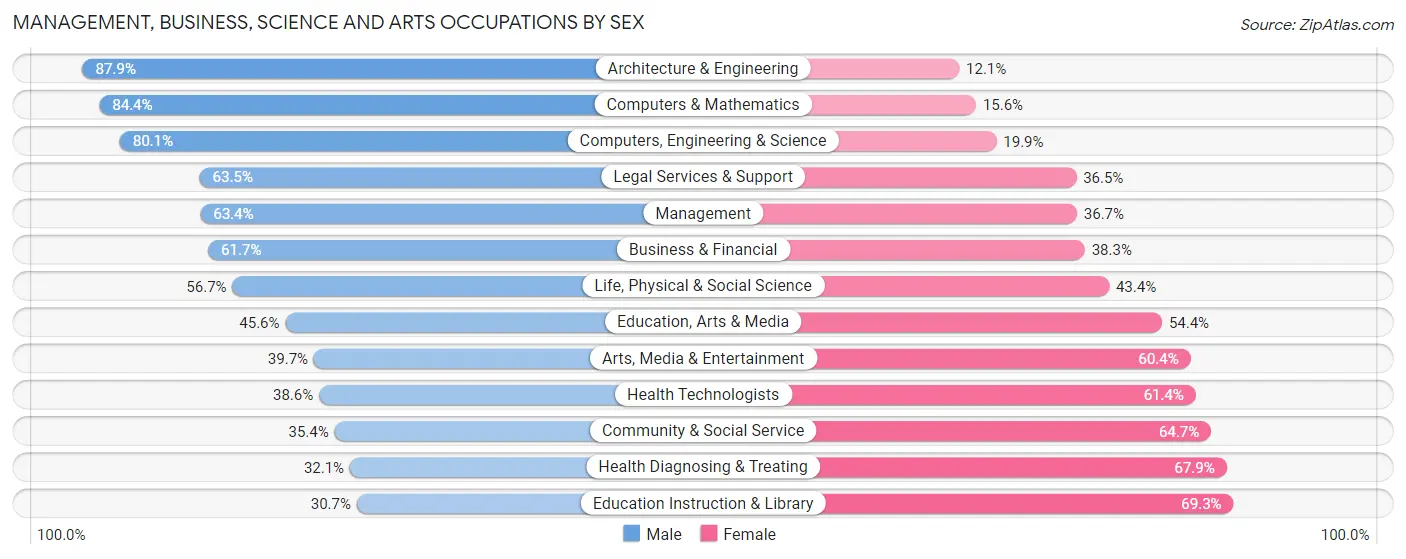
Management, Business, Science and Arts Occupations by Sex
Within the Management, Business, Science and Arts occupations in Cache County, the most male-oriented occupations are Architecture & Engineering (87.9%), Computers & Mathematics (84.4%), and Computers, Engineering & Science (80.1%), while the most female-oriented occupations are Education Instruction & Library (69.3%), Health Diagnosing & Treating (67.9%), and Community & Social Service (64.6%).
| Occupation | Male | Female |
| Management | 4,307 (63.3%) | 2,492 (36.6%) |
| Business & Financial | 1,657 (61.7%) | 1,028 (38.3%) |
| Computers, Engineering & Science | 4,495 (80.1%) | 1,114 (19.9%) |
| Computers & Mathematics | 2,175 (84.4%) | 402 (15.6%) |
| Architecture & Engineering | 1,694 (87.9%) | 233 (12.1%) |
| Life, Physical & Social Science | 626 (56.7%) | 479 (43.3%) |
| Community & Social Service | 2,988 (35.3%) | 5,464 (64.6%) |
| Education, Arts & Media | 503 (45.6%) | 600 (54.4%) |
| Legal Services & Support | 193 (63.5%) | 111 (36.5%) |
| Education Instruction & Library | 1,721 (30.7%) | 3,884 (69.3%) |
| Arts, Media & Entertainment | 571 (39.7%) | 869 (60.4%) |
| Health Diagnosing & Treating | 855 (32.1%) | 1,806 (67.9%) |
| Health Technologists | 616 (38.6%) | 981 (61.4%) |
| Total (Category) | 14,302 (54.6%) | 11,904 (45.4%) |
| Total (Overall) | 37,409 (55.4%) | 30,137 (44.6%) |
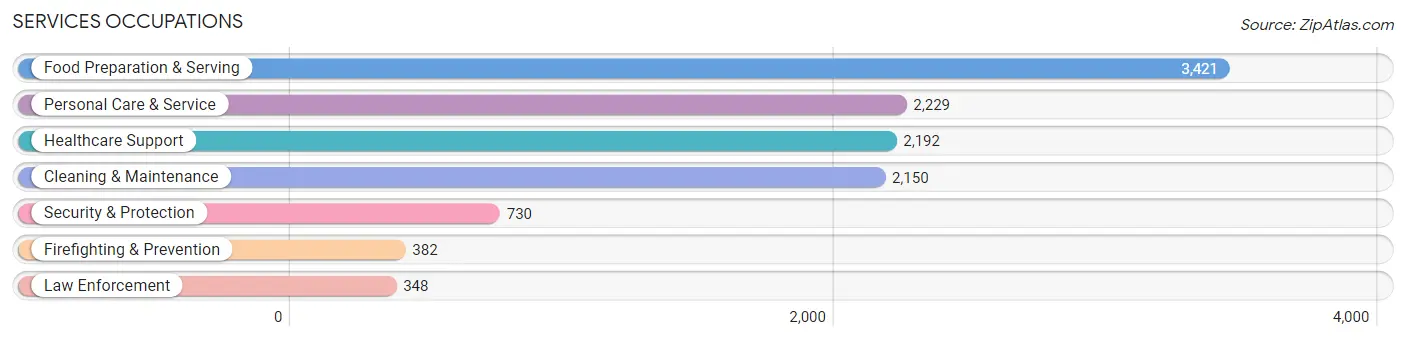
Services Occupations
The most common Services occupations in Cache County are Food Preparation & Serving (3,421 | 5.1%), Personal Care & Service (2,229 | 3.3%), Healthcare Support (2,192 | 3.3%), Cleaning & Maintenance (2,150 | 3.2%), and Security & Protection (730 | 1.1%).
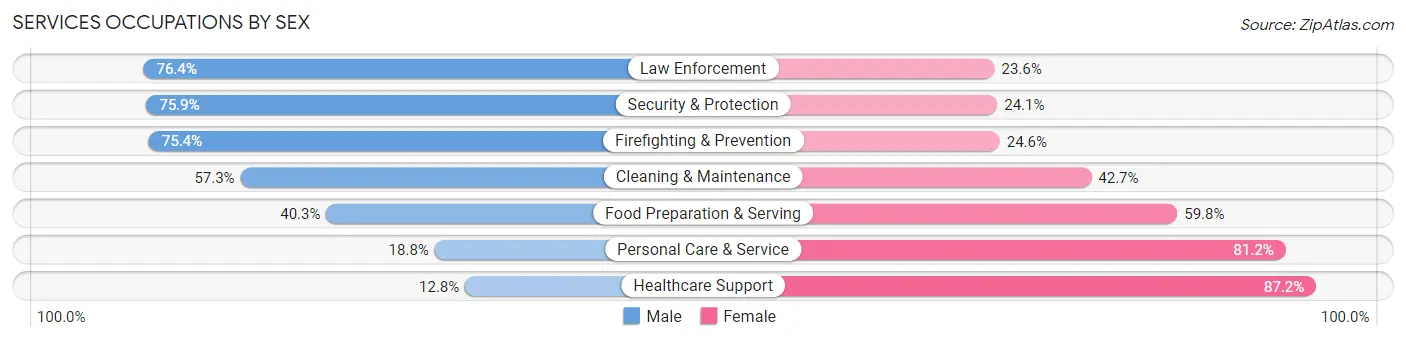
Services Occupations by Sex
Within the Services occupations in Cache County, the most male-oriented occupations are Law Enforcement (76.4%), Security & Protection (75.9%), and Firefighting & Prevention (75.4%), while the most female-oriented occupations are Healthcare Support (87.2%), Personal Care & Service (81.2%), and Food Preparation & Serving (59.8%).
| Occupation | Male | Female |
| Healthcare Support | 280 (12.8%) | 1,912 (87.2%) |
| Security & Protection | 554 (75.9%) | 176 (24.1%) |
| Firefighting & Prevention | 288 (75.4%) | 94 (24.6%) |
| Law Enforcement | 266 (76.4%) | 82 (23.6%) |
| Food Preparation & Serving | 1,377 (40.3%) | 2,044 (59.8%) |
| Cleaning & Maintenance | 1,231 (57.3%) | 919 (42.7%) |
| Personal Care & Service | 419 (18.8%) | 1,810 (81.2%) |
| Total (Category) | 3,861 (36.0%) | 6,861 (64.0%) |
| Total (Overall) | 37,409 (55.4%) | 30,137 (44.6%) |
Sales and Office Occupations
The most common Sales and Office occupations in Cache County are Office & Administration (8,169 | 12.1%), and Sales & Related (5,884 | 8.7%).

Sales and Office Occupations by Sex
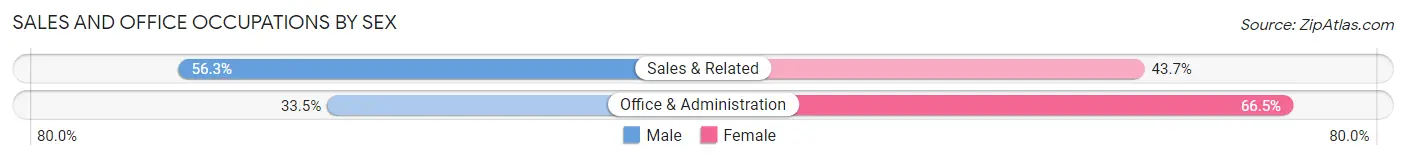
| Occupation | Male | Female |
| Sales & Related | 3,312 (56.3%) | 2,572 (43.7%) |
| Office & Administration | 2,735 (33.5%) | 5,434 (66.5%) |
| Total (Category) | 6,047 (43.0%) | 8,006 (57.0%) |
| Total (Overall) | 37,409 (55.4%) | 30,137 (44.6%) |
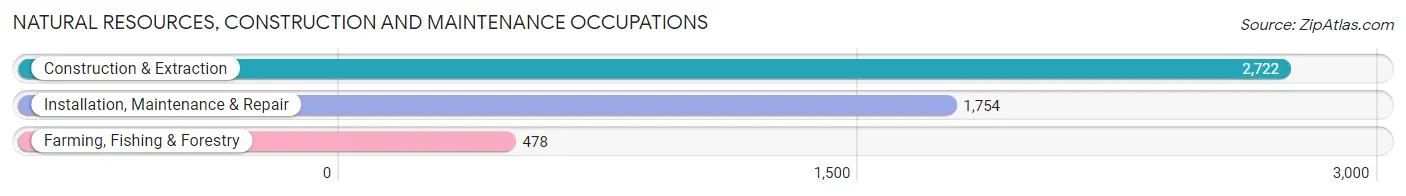
Natural Resources, Construction and Maintenance Occupations
The most common Natural Resources, Construction and Maintenance occupations in Cache County are Construction & Extraction (2,722 | 4.0%), Installation, Maintenance & Repair (1,754 | 2.6%), and Farming, Fishing & Forestry (478 | 0.7%).
Natural Resources, Construction and Maintenance Occupations by Sex
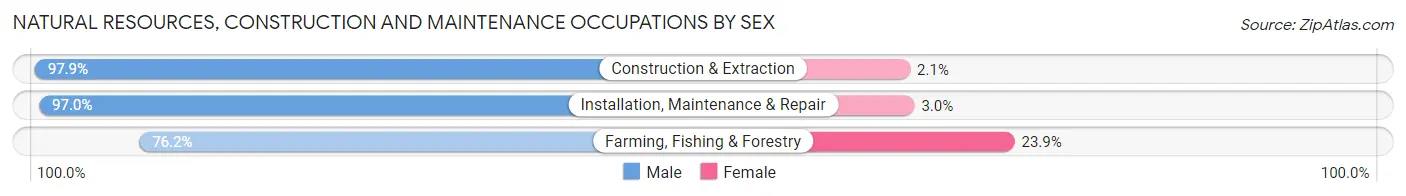
| Occupation | Male | Female |
| Farming, Fishing & Forestry | 364 (76.1%) | 114 (23.8%) |
| Construction & Extraction | 2,664 (97.9%) | 58 (2.1%) |
| Installation, Maintenance & Repair | 1,701 (97.0%) | 53 (3.0%) |
| Total (Category) | 4,729 (95.5%) | 225 (4.5%) |
| Total (Overall) | 37,409 (55.4%) | 30,137 (44.6%) |
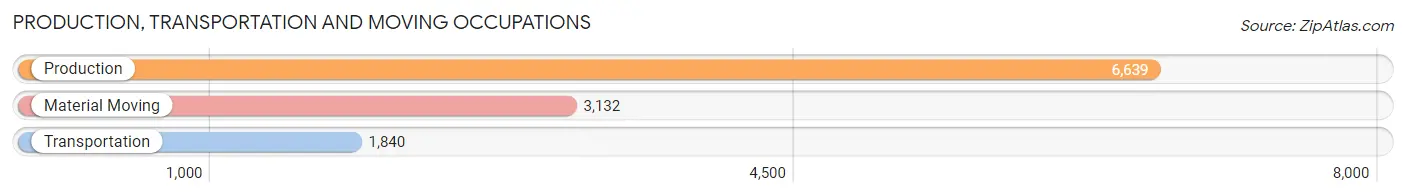
Production, Transportation and Moving Occupations
The most common Production, Transportation and Moving occupations in Cache County are Production (6,639 | 9.8%), Material Moving (3,132 | 4.6%), and Transportation (1,840 | 2.7%).
Production, Transportation and Moving Occupations by Sex
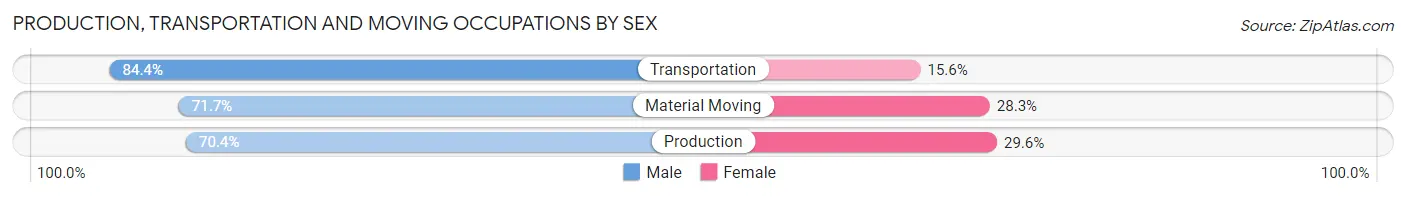
| Occupation | Male | Female |
| Production | 4,672 (70.4%) | 1,967 (29.6%) |
| Transportation | 1,553 (84.4%) | 287 (15.6%) |
| Material Moving | 2,245 (71.7%) | 887 (28.3%) |
| Total (Category) | 8,470 (73.0%) | 3,141 (27.1%) |
| Total (Overall) | 37,409 (55.4%) | 30,137 (44.6%) |
Employment Industries by Sex in Cache County
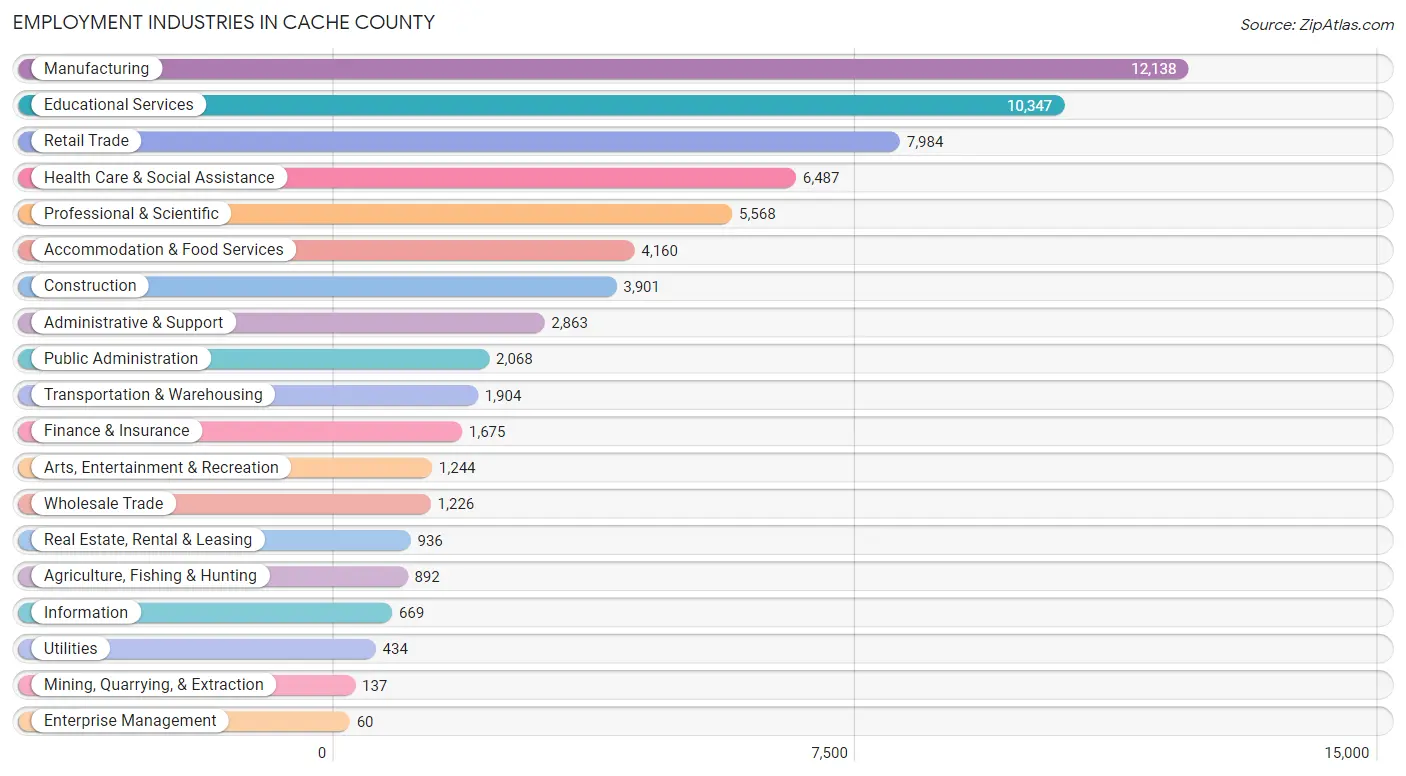
Employment Industries in Cache County
The major employment industries in Cache County include Manufacturing (12,138 | 18.0%), Educational Services (10,347 | 15.3%), Retail Trade (7,984 | 11.8%), Health Care & Social Assistance (6,487 | 9.6%), and Professional & Scientific (5,568 | 8.2%).
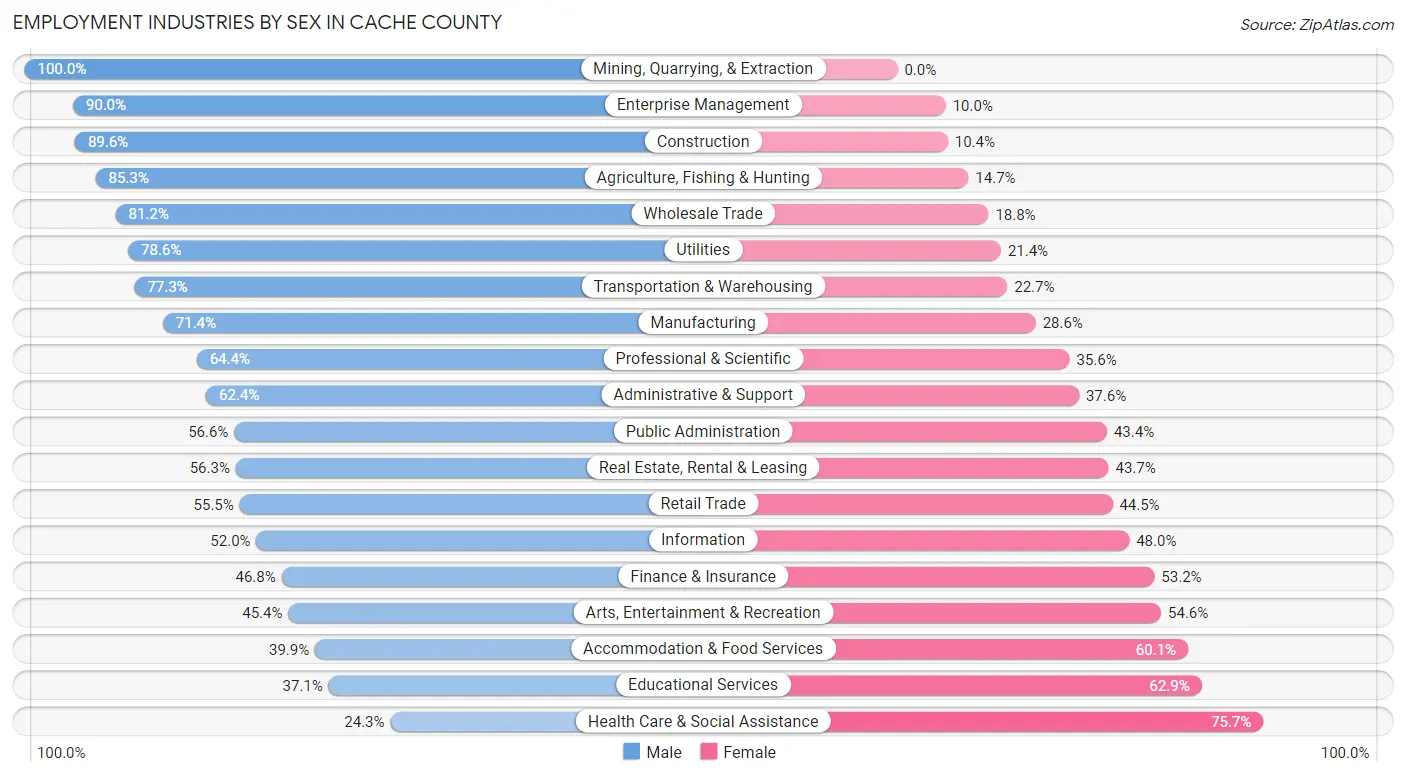
Employment Industries by Sex in Cache County
The Cache County industries that see more men than women are Mining, Quarrying, & Extraction (100.0%), Enterprise Management (90.0%), and Construction (89.6%), whereas the industries that tend to have a higher number of women are Health Care & Social Assistance (75.7%), Educational Services (62.9%), and Accommodation & Food Services (60.1%).
| Industry | Male | Female |
| Agriculture, Fishing & Hunting | 761 (85.3%) | 131 (14.7%) |
| Mining, Quarrying, & Extraction | 137 (100.0%) | 0 (0.0%) |
| Construction | 3,494 (89.6%) | 407 (10.4%) |
| Manufacturing | 8,664 (71.4%) | 3,474 (28.6%) |
| Wholesale Trade | 995 (81.2%) | 231 (18.8%) |
| Retail Trade | 4,430 (55.5%) | 3,554 (44.5%) |
| Transportation & Warehousing | 1,471 (77.3%) | 433 (22.7%) |
| Utilities | 341 (78.6%) | 93 (21.4%) |
| Information | 348 (52.0%) | 321 (48.0%) |
| Finance & Insurance | 784 (46.8%) | 891 (53.2%) |
| Real Estate, Rental & Leasing | 527 (56.3%) | 409 (43.7%) |
| Professional & Scientific | 3,584 (64.4%) | 1,984 (35.6%) |
| Enterprise Management | 54 (90.0%) | 6 (10.0%) |
| Administrative & Support | 1,787 (62.4%) | 1,076 (37.6%) |
| Educational Services | 3,835 (37.1%) | 6,512 (62.9%) |
| Health Care & Social Assistance | 1,576 (24.3%) | 4,911 (75.7%) |
| Arts, Entertainment & Recreation | 565 (45.4%) | 679 (54.6%) |
| Accommodation & Food Services | 1,659 (39.9%) | 2,501 (60.1%) |
| Public Administration | 1,171 (56.6%) | 897 (43.4%) |
| Total | 37,409 (55.4%) | 30,137 (44.6%) |
Education in Cache County
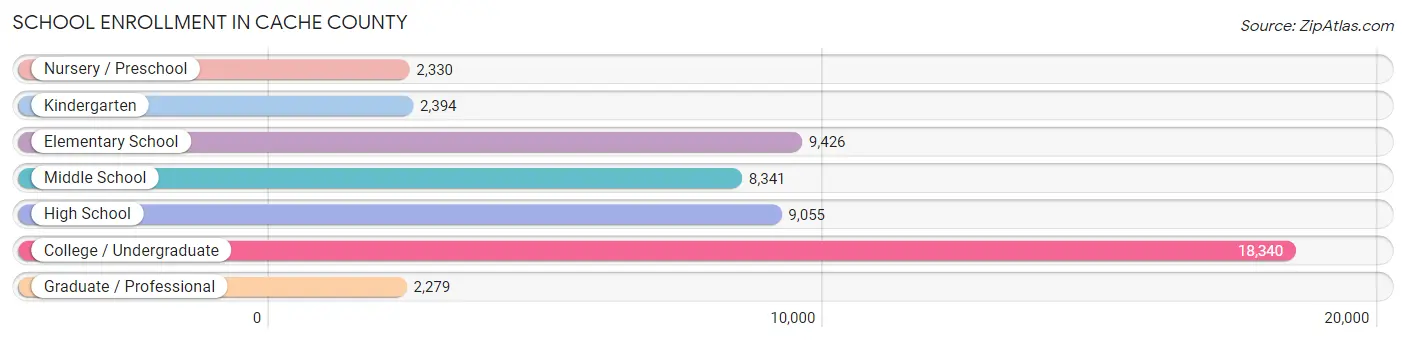
School Enrollment in Cache County
The most common levels of schooling among the 52,165 students in Cache County are college / undergraduate (18,340 | 35.2%), elementary school (9,426 | 18.1%), and high school (9,055 | 17.4%).
| School Level | # Students | % Students |
| Nursery / Preschool | 2,330 | 4.5% |
| Kindergarten | 2,394 | 4.6% |
| Elementary School | 9,426 | 18.1% |
| Middle School | 8,341 | 16.0% |
| High School | 9,055 | 17.4% |
| College / Undergraduate | 18,340 | 35.2% |
| Graduate / Professional | 2,279 | 4.4% |
| Total | 52,165 | 100.0% |
School Enrollment by Age by Funding Source in Cache County
Out of a total of 52,165 students who are enrolled in schools in Cache County, 4,121 (7.9%) attend a private institution, while the remaining 48,044 (92.1%) are enrolled in public schools. The age group of 3 to 4 year olds has the highest likelihood of being enrolled in private schools, with 674 (39.3% in the age bracket) enrolled. Conversely, the age group of 15 to 17 year olds has the lowest likelihood of being enrolled in a private school, with 6,493 (97.4% in the age bracket) attending a public institution.
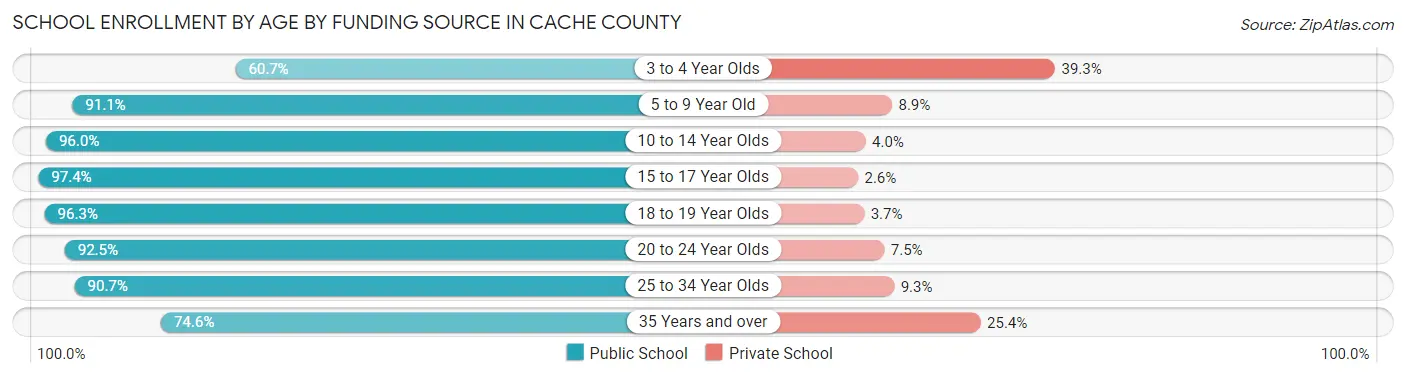
| Age Bracket | Public School | Private School |
| 3 to 4 Year Olds | 1,042 (60.7%) | 674 (39.3%) |
| 5 to 9 Year Old | 10,475 (91.1%) | 1,024 (8.9%) |
| 10 to 14 Year Olds | 10,012 (96.0%) | 416 (4.0%) |
| 15 to 17 Year Olds | 6,493 (97.4%) | 172 (2.6%) |
| 18 to 19 Year Olds | 4,781 (96.3%) | 185 (3.7%) |
| 20 to 24 Year Olds | 10,497 (92.5%) | 850 (7.5%) |
| 25 to 34 Year Olds | 3,521 (90.7%) | 362 (9.3%) |
| 35 Years and over | 1,239 (74.6%) | 422 (25.4%) |
| Total | 48,044 (92.1%) | 4,121 (7.9%) |
Educational Attainment by Field of Study in Cache County
Business (4,815 | 16.1%), education (4,301 | 14.4%), science & technology (2,853 | 9.5%), arts & humanities (2,813 | 9.4%), and bio, nature & agricultural (2,609 | 8.7%) are the most common fields of study among 29,941 individuals in Cache County who have obtained a bachelor's degree or higher.
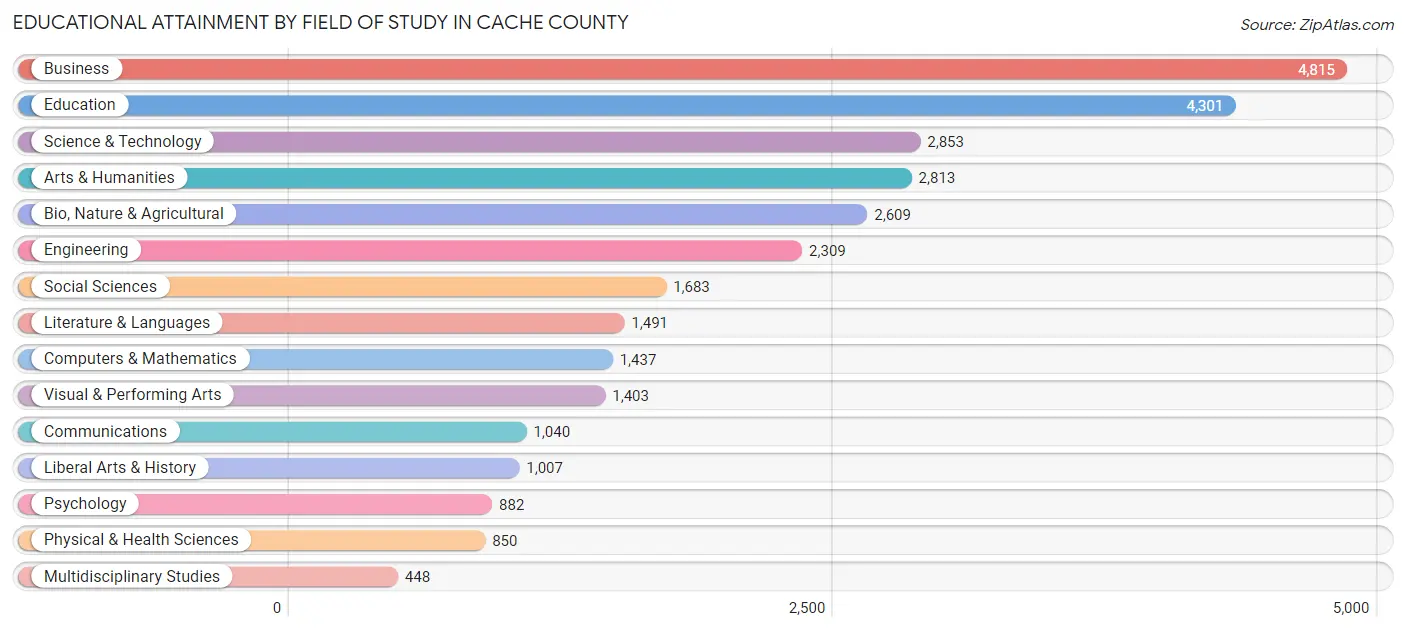
| Field of Study | # Graduates | % Graduates |
| Computers & Mathematics | 1,437 | 4.8% |
| Bio, Nature & Agricultural | 2,609 | 8.7% |
| Physical & Health Sciences | 850 | 2.8% |
| Psychology | 882 | 2.9% |
| Social Sciences | 1,683 | 5.6% |
| Engineering | 2,309 | 7.7% |
| Multidisciplinary Studies | 448 | 1.5% |
| Science & Technology | 2,853 | 9.5% |
| Business | 4,815 | 16.1% |
| Education | 4,301 | 14.4% |
| Literature & Languages | 1,491 | 5.0% |
| Liberal Arts & History | 1,007 | 3.4% |
| Visual & Performing Arts | 1,403 | 4.7% |
| Communications | 1,040 | 3.5% |
| Arts & Humanities | 2,813 | 9.4% |
| Total | 29,941 | 100.0% |
Transportation & Commute in Cache County
Vehicle Availability by Sex in Cache County
The most prevalent vehicle ownership categories in Cache County are males with 2 vehicles (13,614, accounting for 37.6%) and females with 2 vehicles (10,602, making up 48.1%).
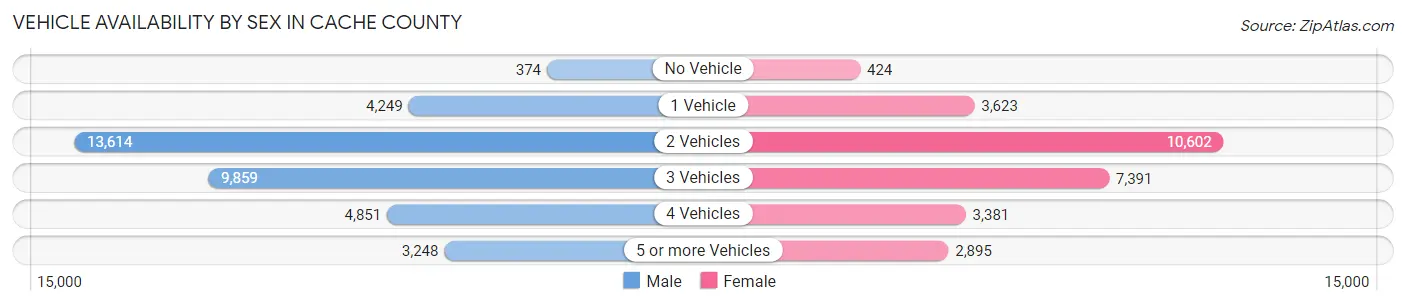
| Vehicles Available | Male | Female |
| No Vehicle | 374 (1.0%) | 424 (1.5%) |
| 1 Vehicle | 4,249 (11.7%) | 3,623 (12.8%) |
| 2 Vehicles | 13,614 (37.6%) | 10,602 (37.4%) |
| 3 Vehicles | 9,859 (27.2%) | 7,391 (26.1%) |
| 4 Vehicles | 4,851 (13.4%) | 3,381 (11.9%) |
| 5 or more Vehicles | 3,248 (9.0%) | 2,895 (10.2%) |
| Total | 36,195 (100.0%) | 28,316 (100.0%) |
Commute Time in Cache County
The most frequently occuring commute durations in Cache County are 10 to 14 minutes (14,483 commuters, 24.5%), 5 to 9 minutes (13,233 commuters, 22.4%), and 15 to 19 minutes (11,569 commuters, 19.6%).
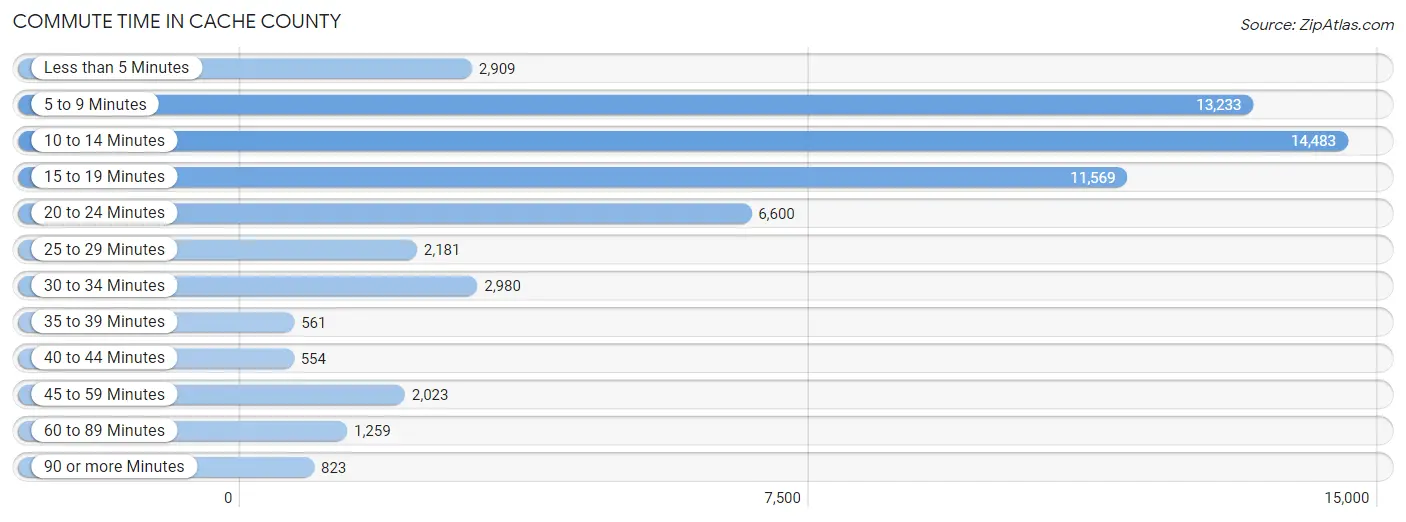
| Commute Time | # Commuters | % Commuters |
| Less than 5 Minutes | 2,909 | 4.9% |
| 5 to 9 Minutes | 13,233 | 22.4% |
| 10 to 14 Minutes | 14,483 | 24.5% |
| 15 to 19 Minutes | 11,569 | 19.6% |
| 20 to 24 Minutes | 6,600 | 11.2% |
| 25 to 29 Minutes | 2,181 | 3.7% |
| 30 to 34 Minutes | 2,980 | 5.0% |
| 35 to 39 Minutes | 561 | 0.9% |
| 40 to 44 Minutes | 554 | 0.9% |
| 45 to 59 Minutes | 2,023 | 3.4% |
| 60 to 89 Minutes | 1,259 | 2.1% |
| 90 or more Minutes | 823 | 1.4% |
Commute Time by Sex in Cache County
The most common commute times in Cache County are 10 to 14 minutes (7,557 commuters, 22.7%) for males and 10 to 14 minutes (6,926 commuters, 26.8%) for females.
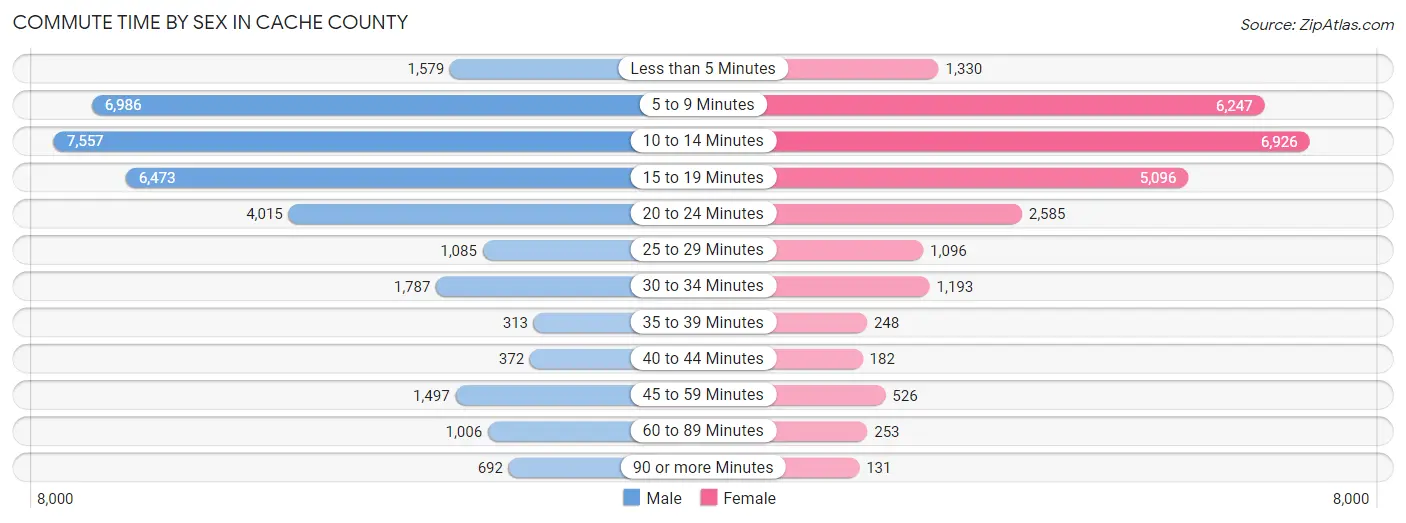
| Commute Time | Male | Female |
| Less than 5 Minutes | 1,579 (4.7%) | 1,330 (5.1%) |
| 5 to 9 Minutes | 6,986 (20.9%) | 6,247 (24.2%) |
| 10 to 14 Minutes | 7,557 (22.7%) | 6,926 (26.8%) |
| 15 to 19 Minutes | 6,473 (19.4%) | 5,096 (19.7%) |
| 20 to 24 Minutes | 4,015 (12.0%) | 2,585 (10.0%) |
| 25 to 29 Minutes | 1,085 (3.3%) | 1,096 (4.3%) |
| 30 to 34 Minutes | 1,787 (5.4%) | 1,193 (4.6%) |
| 35 to 39 Minutes | 313 (0.9%) | 248 (1.0%) |
| 40 to 44 Minutes | 372 (1.1%) | 182 (0.7%) |
| 45 to 59 Minutes | 1,497 (4.5%) | 526 (2.0%) |
| 60 to 89 Minutes | 1,006 (3.0%) | 253 (1.0%) |
| 90 or more Minutes | 692 (2.1%) | 131 (0.5%) |
Time of Departure to Work by Sex in Cache County
The most frequent times of departure to work in Cache County are 7:30 AM to 7:59 AM (4,380, 13.1%) for males and 7:30 AM to 7:59 AM (3,781, 14.6%) for females.
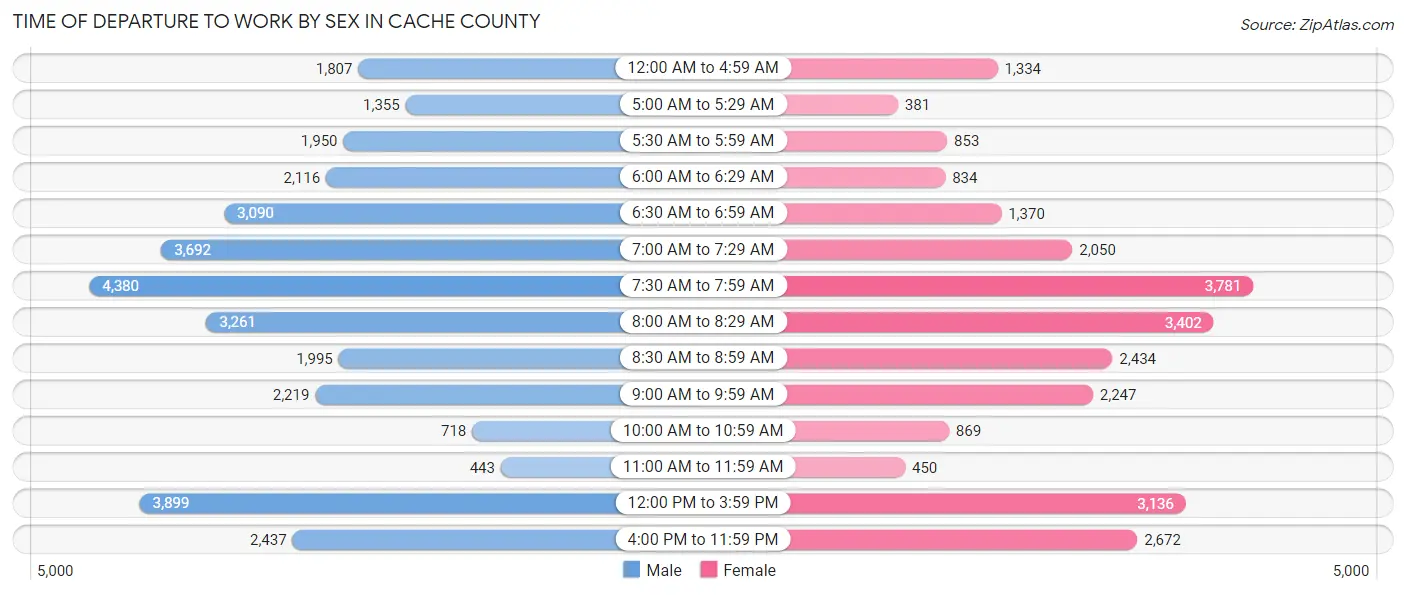
| Time of Departure | Male | Female |
| 12:00 AM to 4:59 AM | 1,807 (5.4%) | 1,334 (5.2%) |
| 5:00 AM to 5:29 AM | 1,355 (4.1%) | 381 (1.5%) |
| 5:30 AM to 5:59 AM | 1,950 (5.8%) | 853 (3.3%) |
| 6:00 AM to 6:29 AM | 2,116 (6.3%) | 834 (3.2%) |
| 6:30 AM to 6:59 AM | 3,090 (9.3%) | 1,370 (5.3%) |
| 7:00 AM to 7:29 AM | 3,692 (11.1%) | 2,050 (7.9%) |
| 7:30 AM to 7:59 AM | 4,380 (13.1%) | 3,781 (14.6%) |
| 8:00 AM to 8:29 AM | 3,261 (9.8%) | 3,402 (13.2%) |
| 8:30 AM to 8:59 AM | 1,995 (6.0%) | 2,434 (9.4%) |
| 9:00 AM to 9:59 AM | 2,219 (6.7%) | 2,247 (8.7%) |
| 10:00 AM to 10:59 AM | 718 (2.1%) | 869 (3.4%) |
| 11:00 AM to 11:59 AM | 443 (1.3%) | 450 (1.7%) |
| 12:00 PM to 3:59 PM | 3,899 (11.7%) | 3,136 (12.1%) |
| 4:00 PM to 11:59 PM | 2,437 (7.3%) | 2,672 (10.3%) |
| Total | 33,362 (100.0%) | 25,813 (100.0%) |
Housing Occupancy in Cache County
Occupancy by Ownership in Cache County
Of the total 41,718 dwellings in Cache County, owner-occupied units account for 26,748 (64.1%), while renter-occupied units make up 14,970 (35.9%).
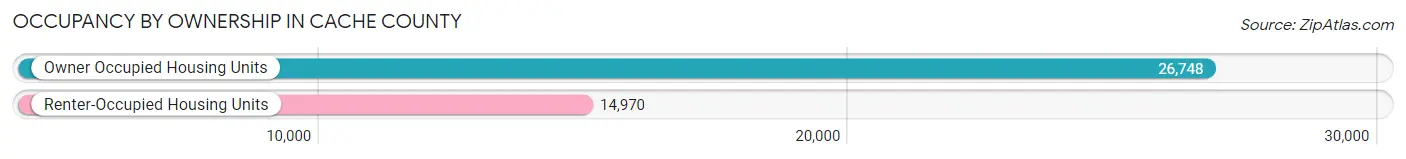
| Occupancy | # Housing Units | % Housing Units |
| Owner Occupied Housing Units | 26,748 | 64.1% |
| Renter-Occupied Housing Units | 14,970 | 35.9% |
| Total Occupied Housing Units | 41,718 | 100.0% |
Occupancy by Household Size in Cache County
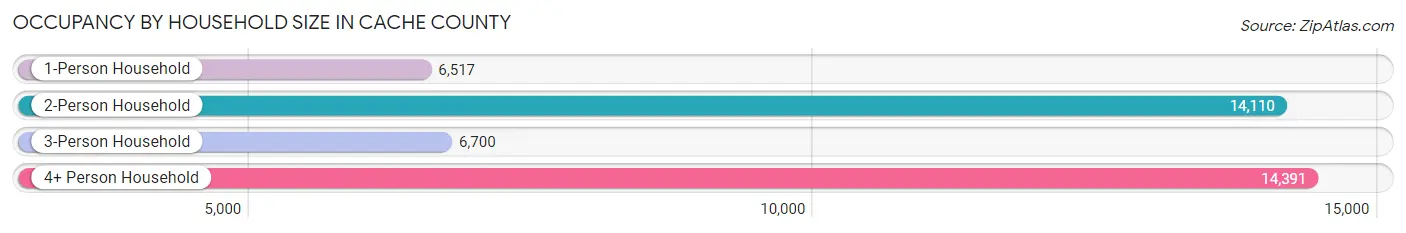
| Household Size | # Housing Units | % Housing Units |
| 1-Person Household | 6,517 | 15.6% |
| 2-Person Household | 14,110 | 33.8% |
| 3-Person Household | 6,700 | 16.1% |
| 4+ Person Household | 14,391 | 34.5% |
| Total Housing Units | 41,718 | 100.0% |
Occupancy by Ownership by Household Size in Cache County
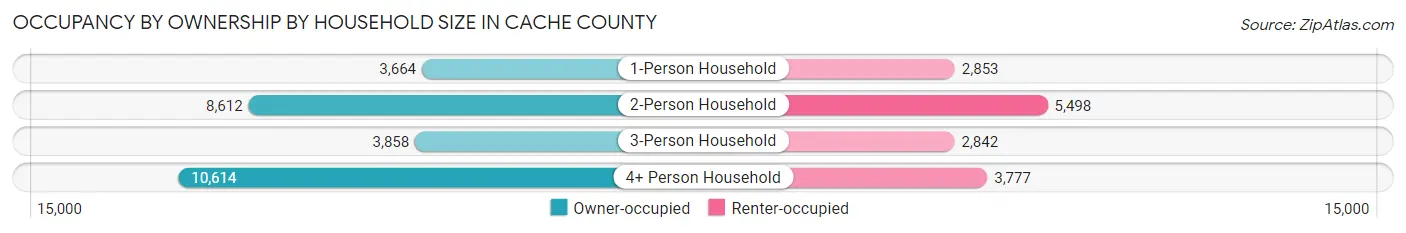
| Household Size | Owner-occupied | Renter-occupied |
| 1-Person Household | 3,664 (56.2%) | 2,853 (43.8%) |
| 2-Person Household | 8,612 (61.0%) | 5,498 (39.0%) |
| 3-Person Household | 3,858 (57.6%) | 2,842 (42.4%) |
| 4+ Person Household | 10,614 (73.8%) | 3,777 (26.3%) |
| Total Housing Units | 26,748 (64.1%) | 14,970 (35.9%) |
Occupancy by Educational Attainment in Cache County
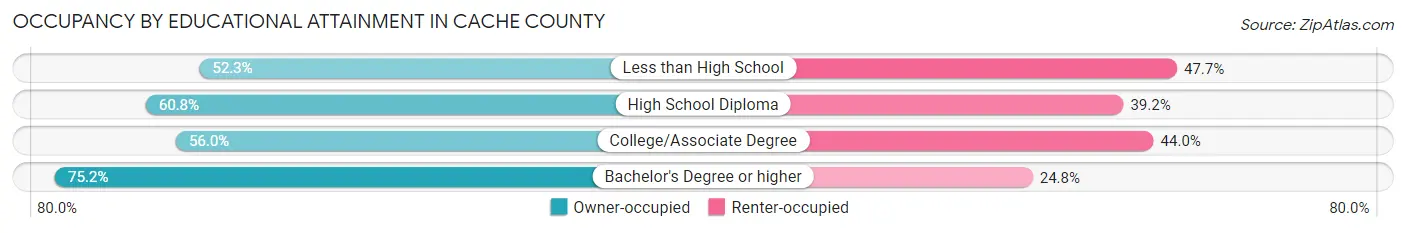
| Household Size | Owner-occupied | Renter-occupied |
| Less than High School | 951 (52.3%) | 868 (47.7%) |
| High School Diploma | 4,600 (60.8%) | 2,970 (39.2%) |
| College/Associate Degree | 9,056 (56.0%) | 7,119 (44.0%) |
| Bachelor's Degree or higher | 12,141 (75.2%) | 4,013 (24.8%) |
Occupancy by Age of Householder in Cache County
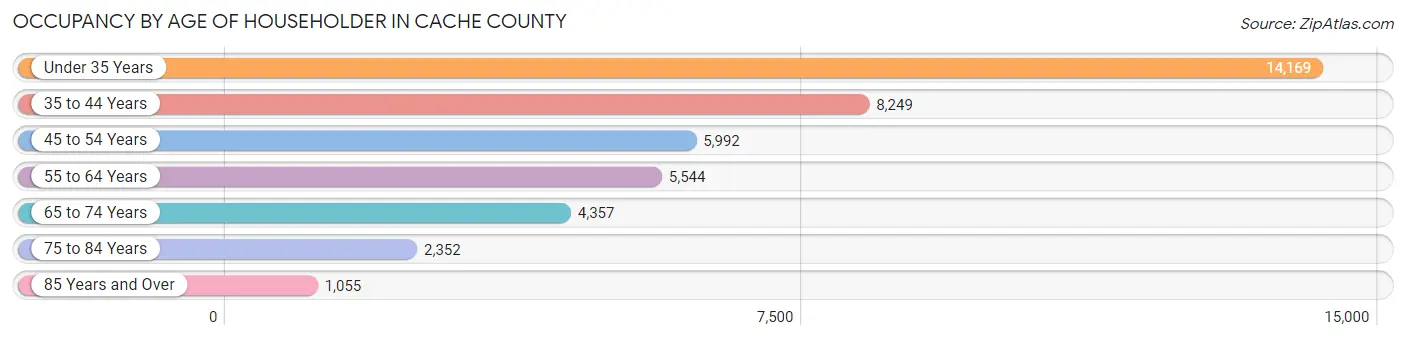
| Age Bracket | # Households | % Households |
| Under 35 Years | 14,169 | 34.0% |
| 35 to 44 Years | 8,249 | 19.8% |
| 45 to 54 Years | 5,992 | 14.4% |
| 55 to 64 Years | 5,544 | 13.3% |
| 65 to 74 Years | 4,357 | 10.4% |
| 75 to 84 Years | 2,352 | 5.6% |
| 85 Years and Over | 1,055 | 2.5% |
| Total | 41,718 | 100.0% |
Housing Finances in Cache County
Median Income by Occupancy in Cache County
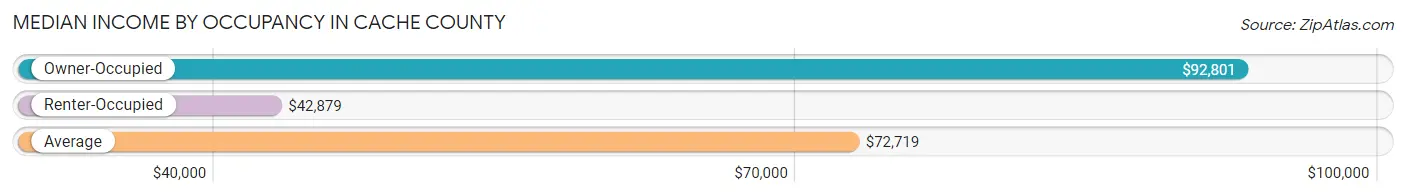
| Occupancy Type | # Households | Median Income |
| Owner-Occupied | 26,748 (64.1%) | $92,801 |
| Renter-Occupied | 14,970 (35.9%) | $42,879 |
| Average | 41,718 (100.0%) | $72,719 |
Occupancy by Householder Income Bracket in Cache County
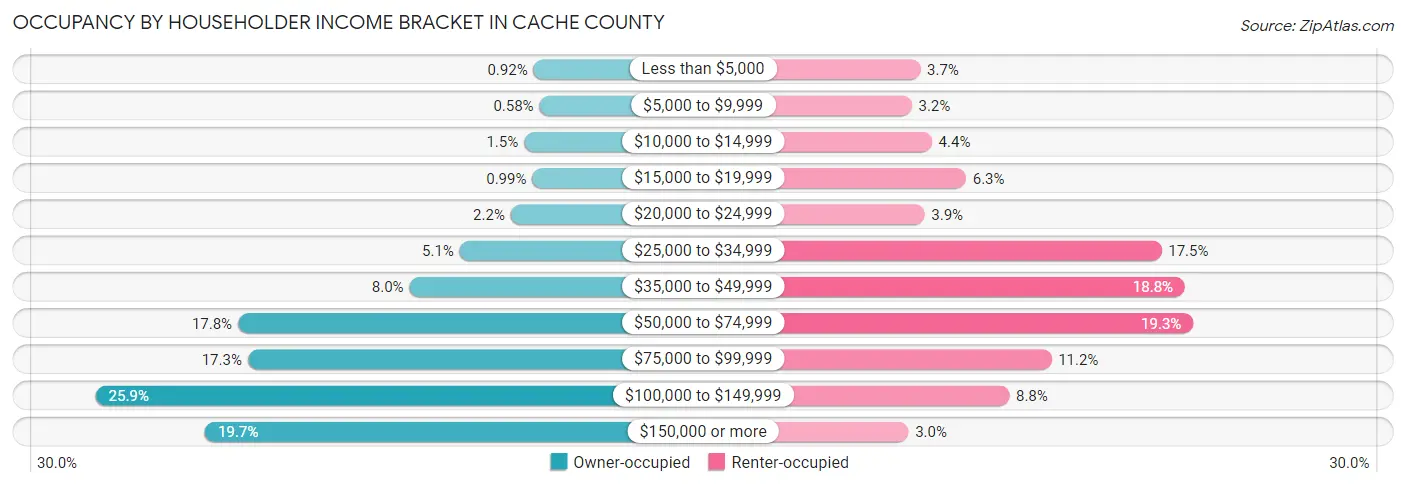
| Income Bracket | Owner-occupied | Renter-occupied |
| Less than $5,000 | 245 (0.9%) | 552 (3.7%) |
| $5,000 to $9,999 | 155 (0.6%) | 479 (3.2%) |
| $10,000 to $14,999 | 390 (1.5%) | 651 (4.3%) |
| $15,000 to $19,999 | 264 (1.0%) | 943 (6.3%) |
| $20,000 to $24,999 | 595 (2.2%) | 589 (3.9%) |
| $25,000 to $34,999 | 1,375 (5.1%) | 2,616 (17.5%) |
| $35,000 to $49,999 | 2,142 (8.0%) | 2,817 (18.8%) |
| $50,000 to $74,999 | 4,763 (17.8%) | 2,887 (19.3%) |
| $75,000 to $99,999 | 4,614 (17.2%) | 1,673 (11.2%) |
| $100,000 to $149,999 | 6,938 (25.9%) | 1,313 (8.8%) |
| $150,000 or more | 5,267 (19.7%) | 450 (3.0%) |
| Total | 26,748 (100.0%) | 14,970 (100.0%) |
Monthly Housing Cost Tiers in Cache County
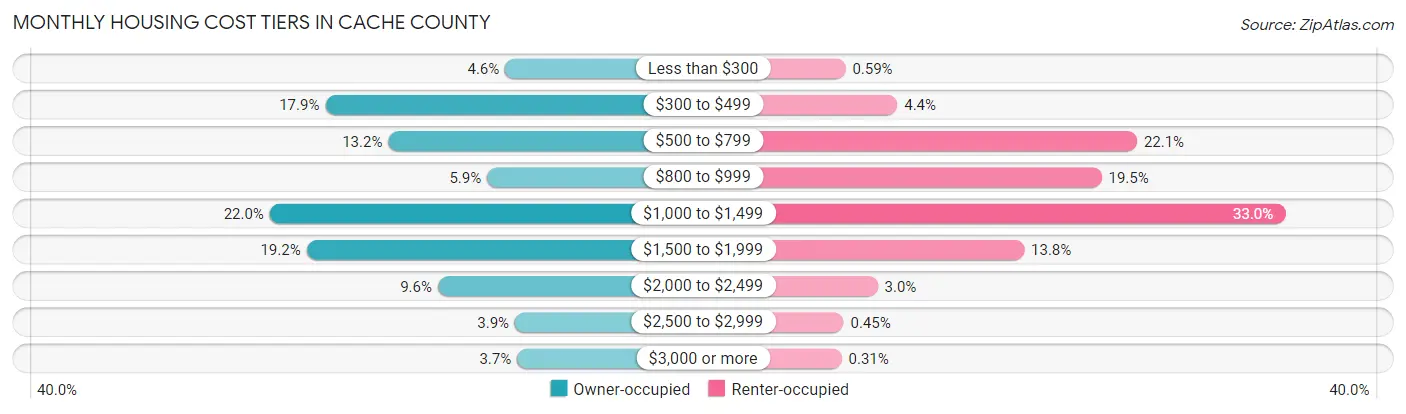
| Monthly Cost | Owner-occupied | Renter-occupied |
| Less than $300 | 1,234 (4.6%) | 88 (0.6%) |
| $300 to $499 | 4,776 (17.9%) | 660 (4.4%) |
| $500 to $799 | 3,535 (13.2%) | 3,303 (22.1%) |
| $800 to $999 | 1,588 (5.9%) | 2,912 (19.5%) |
| $1,000 to $1,499 | 5,871 (22.0%) | 4,935 (33.0%) |
| $1,500 to $1,999 | 5,145 (19.2%) | 2,058 (13.8%) |
| $2,000 to $2,499 | 2,560 (9.6%) | 443 (3.0%) |
| $2,500 to $2,999 | 1,041 (3.9%) | 68 (0.4%) |
| $3,000 or more | 998 (3.7%) | 47 (0.3%) |
| Total | 26,748 (100.0%) | 14,970 (100.0%) |
Physical Housing Characteristics in Cache County
Housing Structures in Cache County
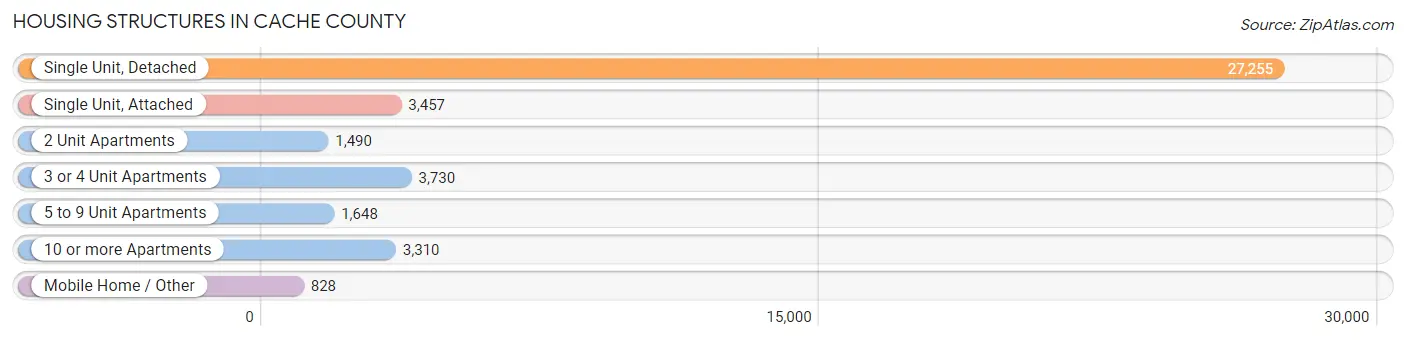
| Structure Type | # Housing Units | % Housing Units |
| Single Unit, Detached | 27,255 | 65.3% |
| Single Unit, Attached | 3,457 | 8.3% |
| 2 Unit Apartments | 1,490 | 3.6% |
| 3 or 4 Unit Apartments | 3,730 | 8.9% |
| 5 to 9 Unit Apartments | 1,648 | 4.0% |
| 10 or more Apartments | 3,310 | 7.9% |
| Mobile Home / Other | 828 | 2.0% |
| Total | 41,718 | 100.0% |
Housing Structures by Occupancy in Cache County
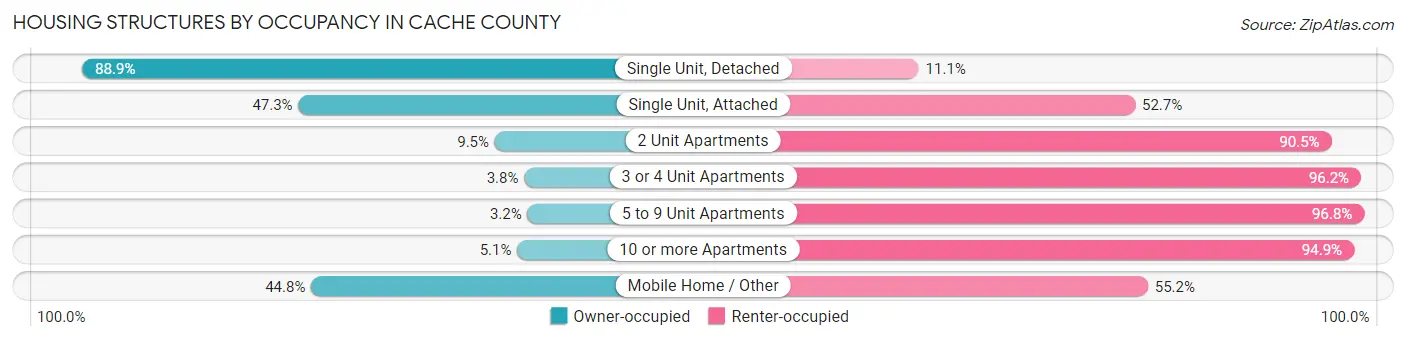
| Structure Type | Owner-occupied | Renter-occupied |
| Single Unit, Detached | 24,239 (88.9%) | 3,016 (11.1%) |
| Single Unit, Attached | 1,634 (47.3%) | 1,823 (52.7%) |
| 2 Unit Apartments | 141 (9.5%) | 1,349 (90.5%) |
| 3 or 4 Unit Apartments | 141 (3.8%) | 3,589 (96.2%) |
| 5 to 9 Unit Apartments | 52 (3.2%) | 1,596 (96.8%) |
| 10 or more Apartments | 170 (5.1%) | 3,140 (94.9%) |
| Mobile Home / Other | 371 (44.8%) | 457 (55.2%) |
| Total | 26,748 (64.1%) | 14,970 (35.9%) |
Housing Structures by Number of Rooms in Cache County
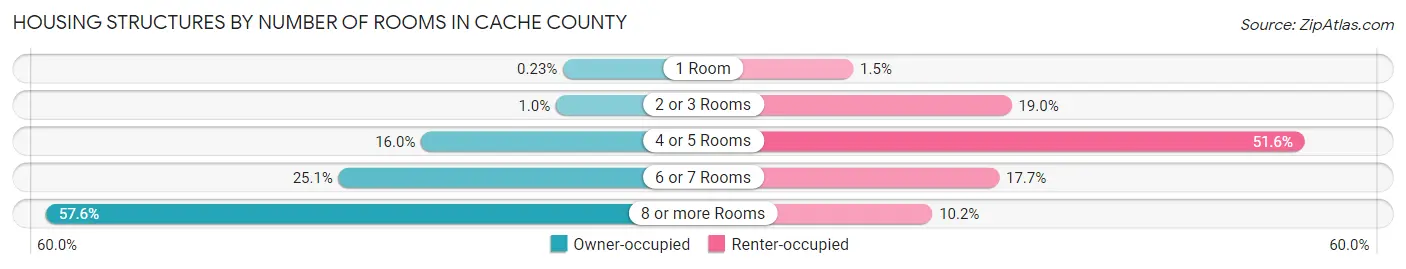
| Number of Rooms | Owner-occupied | Renter-occupied |
| 1 Room | 61 (0.2%) | 220 (1.5%) |
| 2 or 3 Rooms | 272 (1.0%) | 2,850 (19.0%) |
| 4 or 5 Rooms | 4,274 (16.0%) | 7,723 (51.6%) |
| 6 or 7 Rooms | 6,724 (25.1%) | 2,644 (17.7%) |
| 8 or more Rooms | 15,417 (57.6%) | 1,533 (10.2%) |
| Total | 26,748 (100.0%) | 14,970 (100.0%) |
Housing Structure by Heating Type in Cache County
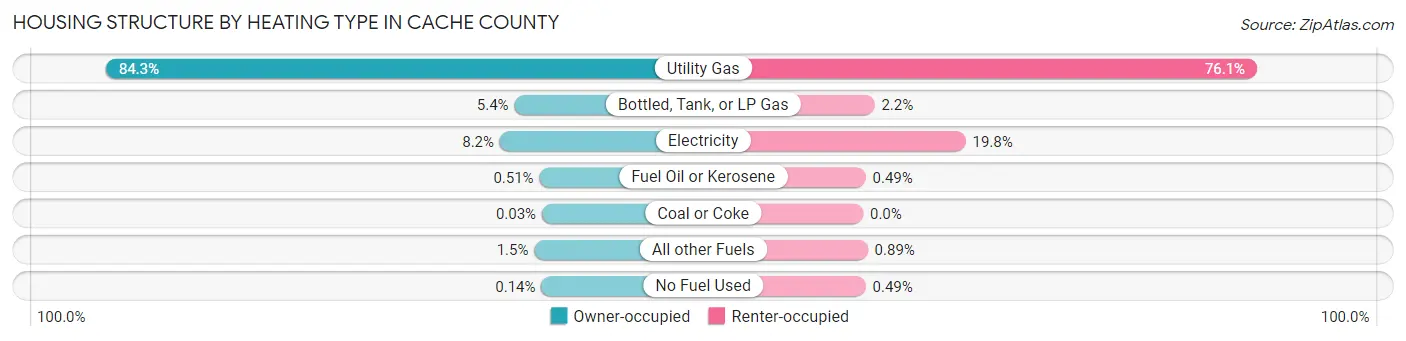
| Heating Type | Owner-occupied | Renter-occupied |
| Utility Gas | 22,550 (84.3%) | 11,394 (76.1%) |
| Bottled, Tank, or LP Gas | 1,432 (5.3%) | 331 (2.2%) |
| Electricity | 2,182 (8.2%) | 2,965 (19.8%) |
| Fuel Oil or Kerosene | 136 (0.5%) | 74 (0.5%) |
| Coal or Coke | 9 (0.0%) | 0 (0.0%) |
| All other Fuels | 401 (1.5%) | 133 (0.9%) |
| No Fuel Used | 38 (0.1%) | 73 (0.5%) |
| Total | 26,748 (100.0%) | 14,970 (100.0%) |
Household Vehicle Usage in Cache County
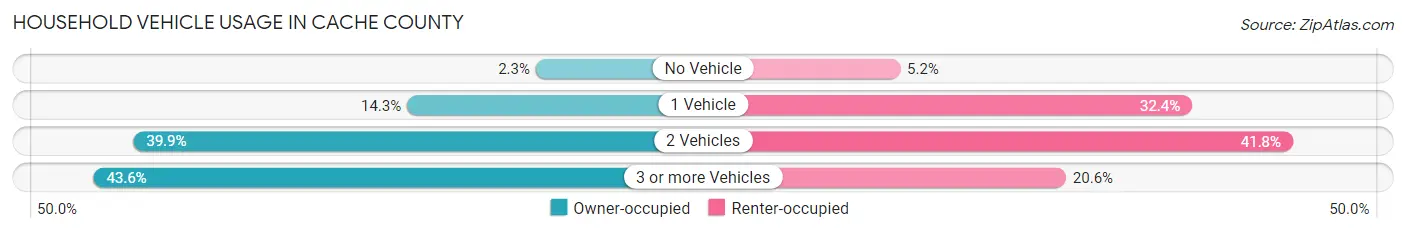
| Vehicles per Household | Owner-occupied | Renter-occupied |
| No Vehicle | 610 (2.3%) | 771 (5.1%) |
| 1 Vehicle | 3,825 (14.3%) | 4,851 (32.4%) |
| 2 Vehicles | 10,659 (39.9%) | 6,259 (41.8%) |
| 3 or more Vehicles | 11,654 (43.6%) | 3,089 (20.6%) |
| Total | 26,748 (100.0%) | 14,970 (100.0%) |
Real Estate & Mortgages in Cache County
Real Estate and Mortgage Overview in Cache County
| Characteristic | Without Mortgage | With Mortgage |
| Housing Units | 9,621 | 17,127 |
| Median Property Value | $343,900 | $356,000 |
| Median Household Income | $77,724 | $3,825 |
| Monthly Housing Costs | $458 | $985 |
| Real Estate Taxes | $1,809 | $418 |
Property Value by Mortgage Status in Cache County
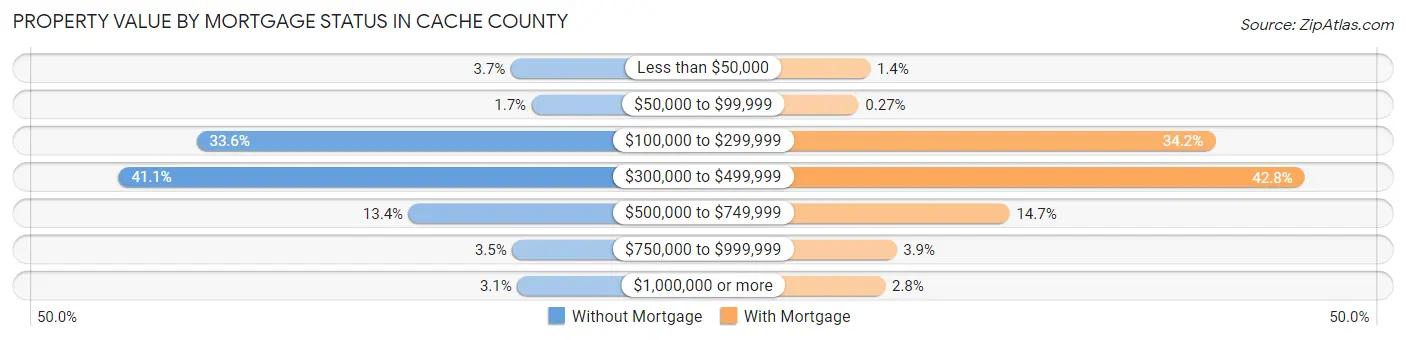
| Property Value | Without Mortgage | With Mortgage |
| Less than $50,000 | 352 (3.7%) | 236 (1.4%) |
| $50,000 to $99,999 | 162 (1.7%) | 46 (0.3%) |
| $100,000 to $299,999 | 3,235 (33.6%) | 5,865 (34.2%) |
| $300,000 to $499,999 | 3,950 (41.1%) | 7,325 (42.8%) |
| $500,000 to $749,999 | 1,289 (13.4%) | 2,510 (14.7%) |
| $750,000 to $999,999 | 340 (3.5%) | 664 (3.9%) |
| $1,000,000 or more | 293 (3.0%) | 481 (2.8%) |
| Total | 9,621 (100.0%) | 17,127 (100.0%) |
Household Income by Mortgage Status in Cache County
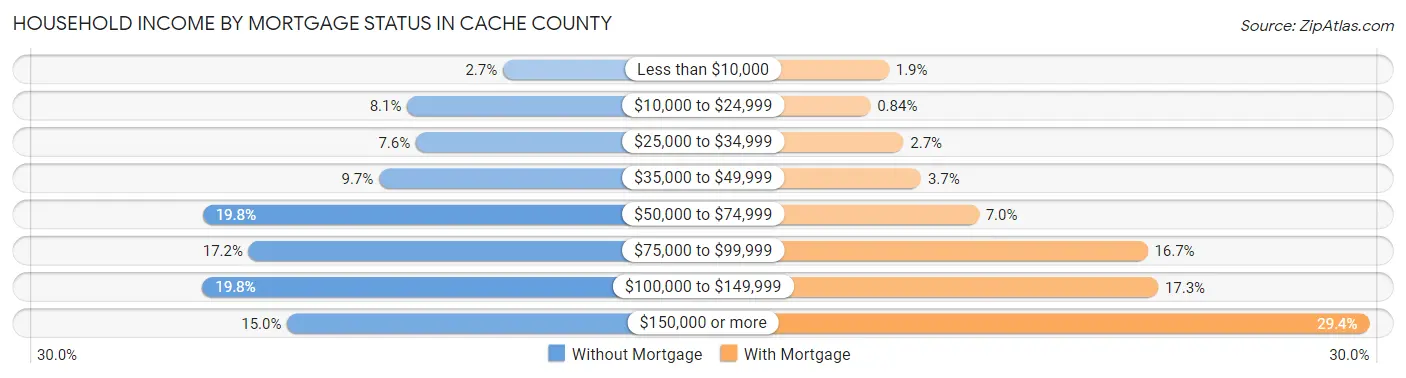
| Household Income | Without Mortgage | With Mortgage |
| Less than $10,000 | 256 (2.7%) | 325 (1.9%) |
| $10,000 to $24,999 | 782 (8.1%) | 144 (0.8%) |
| $25,000 to $34,999 | 734 (7.6%) | 467 (2.7%) |
| $35,000 to $49,999 | 937 (9.7%) | 641 (3.7%) |
| $50,000 to $74,999 | 1,907 (19.8%) | 1,205 (7.0%) |
| $75,000 to $99,999 | 1,654 (17.2%) | 2,856 (16.7%) |
| $100,000 to $149,999 | 1,909 (19.8%) | 2,960 (17.3%) |
| $150,000 or more | 1,442 (15.0%) | 5,029 (29.4%) |
| Total | 9,621 (100.0%) | 17,127 (100.0%) |
Property Value to Household Income Ratio in Cache County
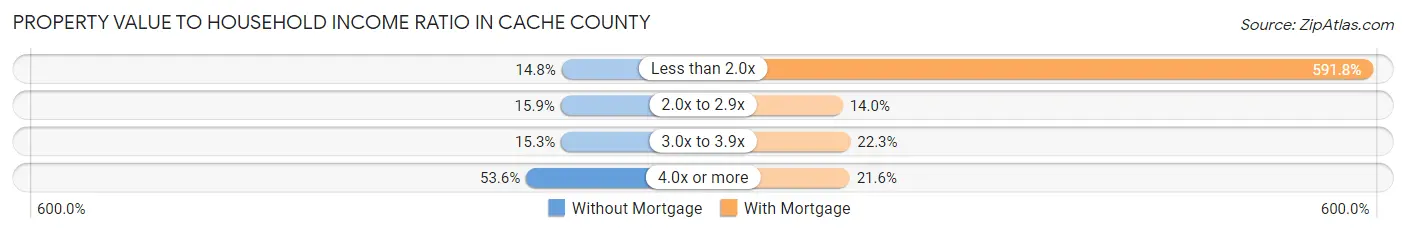
| Value-to-Income Ratio | Without Mortgage | With Mortgage |
| Less than 2.0x | 1,426 (14.8%) | 101,357 (591.8%) |
| 2.0x to 2.9x | 1,527 (15.9%) | 2,390 (14.0%) |
| 3.0x to 3.9x | 1,475 (15.3%) | 3,813 (22.3%) |
| 4.0x or more | 5,154 (53.6%) | 3,700 (21.6%) |
| Total | 9,621 (100.0%) | 17,127 (100.0%) |
Real Estate Taxes by Mortgage Status in Cache County
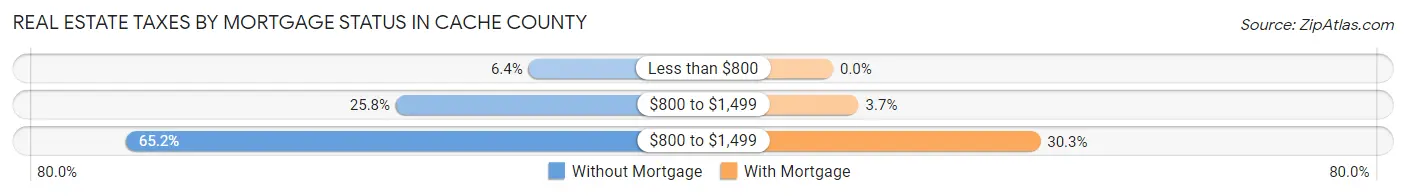
| Property Taxes | Without Mortgage | With Mortgage |
| Less than $800 | 612 (6.4%) | 0 (0.0%) |
| $800 to $1,499 | 2,477 (25.8%) | 640 (3.7%) |
| $800 to $1,499 | 6,272 (65.2%) | 5,186 (30.3%) |
| Total | 9,621 (100.0%) | 17,127 (100.0%) |
Health & Disability in Cache County
Health Insurance Coverage by Age in Cache County
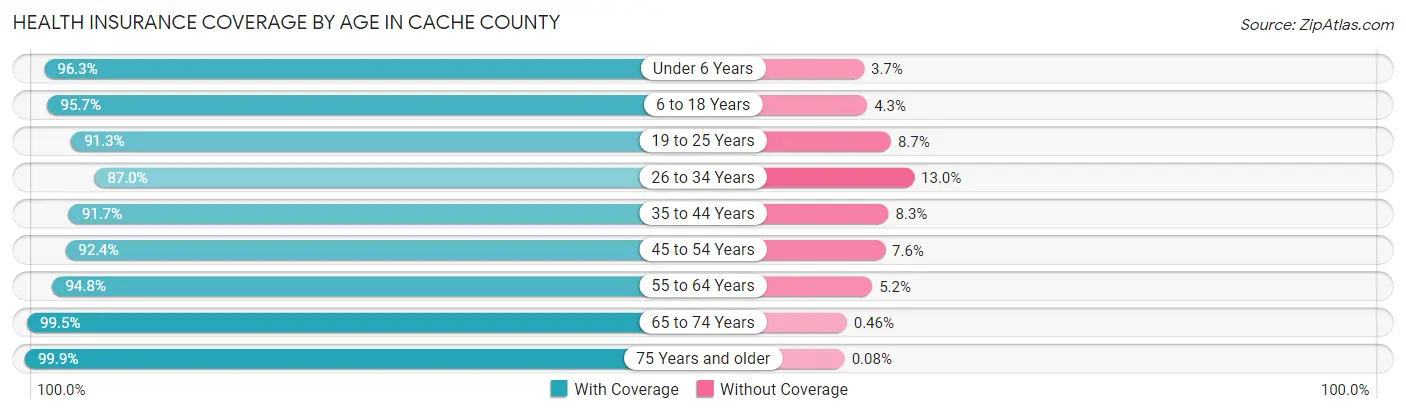
| Age Bracket | With Coverage | Without Coverage |
| Under 6 Years | 12,050 (96.3%) | 460 (3.7%) |
| 6 to 18 Years | 29,197 (95.7%) | 1,306 (4.3%) |
| 19 to 25 Years | 23,174 (91.3%) | 2,208 (8.7%) |
| 26 to 34 Years | 13,532 (87.0%) | 2,025 (13.0%) |
| 35 to 44 Years | 14,431 (91.7%) | 1,300 (8.3%) |
| 45 to 54 Years | 10,532 (92.4%) | 867 (7.6%) |
| 55 to 64 Years | 9,291 (94.8%) | 511 (5.2%) |
| 65 to 74 Years | 7,561 (99.5%) | 35 (0.5%) |
| 75 Years and older | 5,171 (99.9%) | 4 (0.1%) |
| Total | 124,939 (93.5%) | 8,716 (6.5%) |
Health Insurance Coverage by Citizenship Status in Cache County
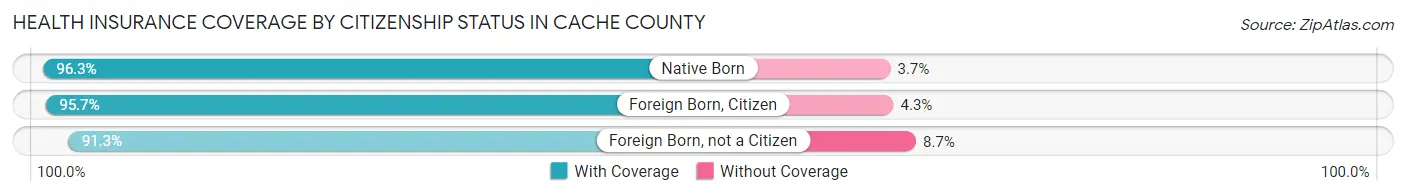
| Citizenship Status | With Coverage | Without Coverage |
| Native Born | 12,050 (96.3%) | 460 (3.7%) |
| Foreign Born, Citizen | 29,197 (95.7%) | 1,306 (4.3%) |
| Foreign Born, not a Citizen | 23,174 (91.3%) | 2,208 (8.7%) |
Health Insurance Coverage by Household Income in Cache County
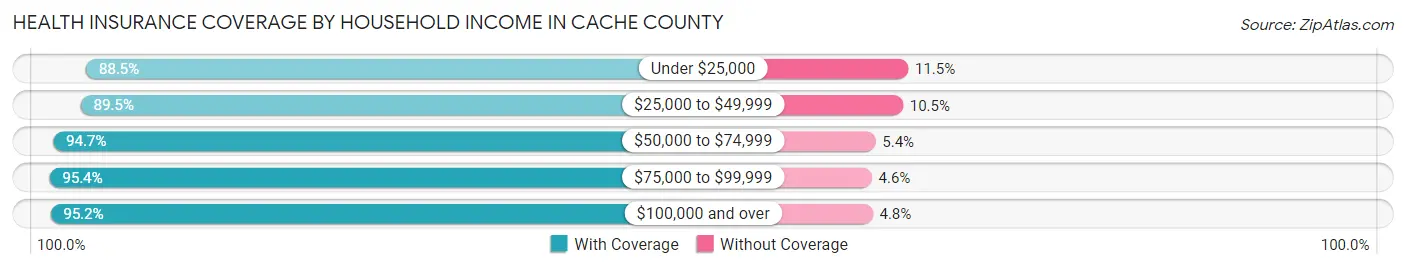
| Household Income | With Coverage | Without Coverage |
| Under $25,000 | 9,411 (88.5%) | 1,220 (11.5%) |
| $25,000 to $49,999 | 21,197 (89.5%) | 2,484 (10.5%) |
| $50,000 to $74,999 | 21,744 (94.7%) | 1,228 (5.3%) |
| $75,000 to $99,999 | 20,025 (95.4%) | 974 (4.6%) |
| $100,000 and over | 49,886 (95.2%) | 2,526 (4.8%) |
Public vs Private Health Insurance Coverage by Age in Cache County
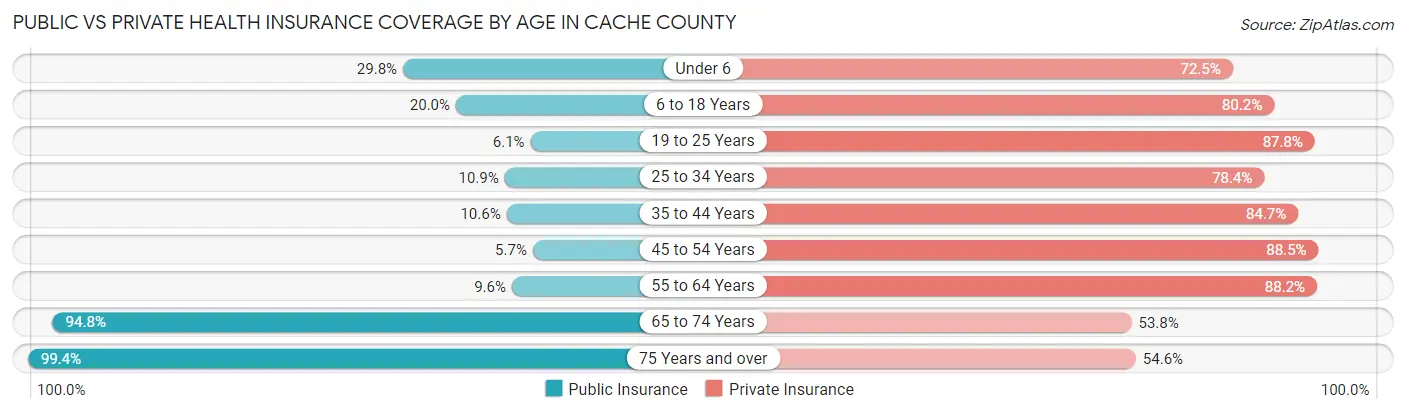
| Age Bracket | Public Insurance | Private Insurance |
| Under 6 | 3,726 (29.8%) | 9,074 (72.5%) |
| 6 to 18 Years | 6,085 (20.0%) | 24,477 (80.2%) |
| 19 to 25 Years | 1,552 (6.1%) | 22,277 (87.8%) |
| 25 to 34 Years | 1,697 (10.9%) | 12,197 (78.4%) |
| 35 to 44 Years | 1,659 (10.5%) | 13,322 (84.7%) |
| 45 to 54 Years | 648 (5.7%) | 10,083 (88.5%) |
| 55 to 64 Years | 938 (9.6%) | 8,643 (88.2%) |
| 65 to 74 Years | 7,200 (94.8%) | 4,085 (53.8%) |
| 75 Years and over | 5,144 (99.4%) | 2,825 (54.6%) |
| Total | 28,649 (21.4%) | 106,983 (80.0%) |
Disability Status by Sex by Age in Cache County
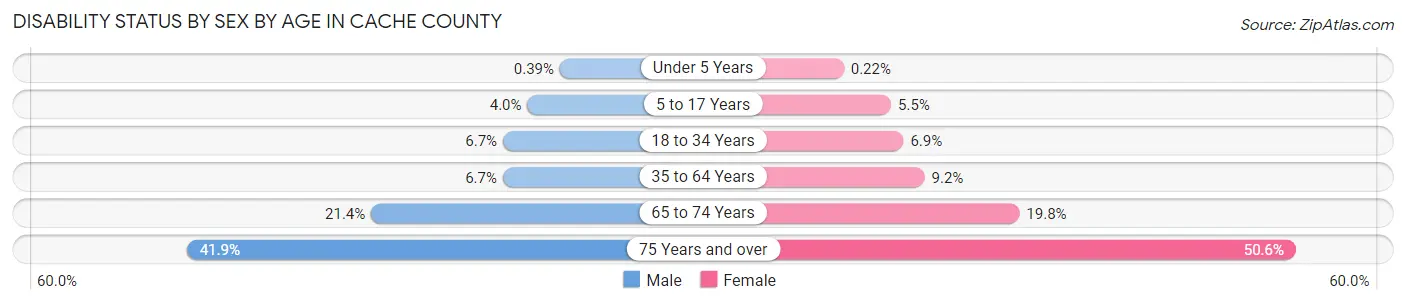
| Age Bracket | Male | Female |
| Under 5 Years | 21 (0.4%) | 11 (0.2%) |
| 5 to 17 Years | 601 (4.0%) | 787 (5.5%) |
| 18 to 34 Years | 1,487 (6.7%) | 1,516 (6.9%) |
| 35 to 64 Years | 1,247 (6.7%) | 1,700 (9.2%) |
| 65 to 74 Years | 807 (21.4%) | 757 (19.8%) |
| 75 Years and over | 1,005 (41.9%) | 1,405 (50.6%) |
Disability Class by Sex by Age in Cache County
Disability Class: Hearing Difficulty
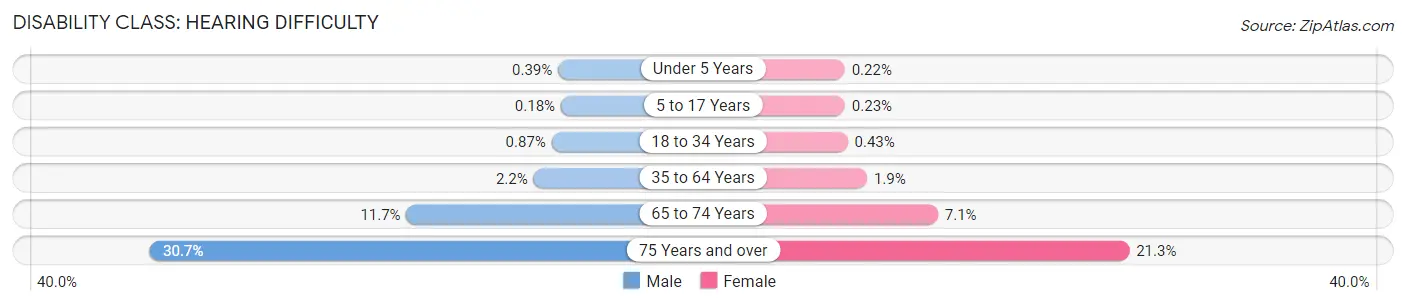
| Age Bracket | Male | Female |
| Under 5 Years | 21 (0.4%) | 11 (0.2%) |
| 5 to 17 Years | 27 (0.2%) | 33 (0.2%) |
| 18 to 34 Years | 193 (0.9%) | 94 (0.4%) |
| 35 to 64 Years | 408 (2.2%) | 345 (1.9%) |
| 65 to 74 Years | 439 (11.7%) | 273 (7.1%) |
| 75 Years and over | 735 (30.7%) | 593 (21.3%) |
Disability Class: Vision Difficulty
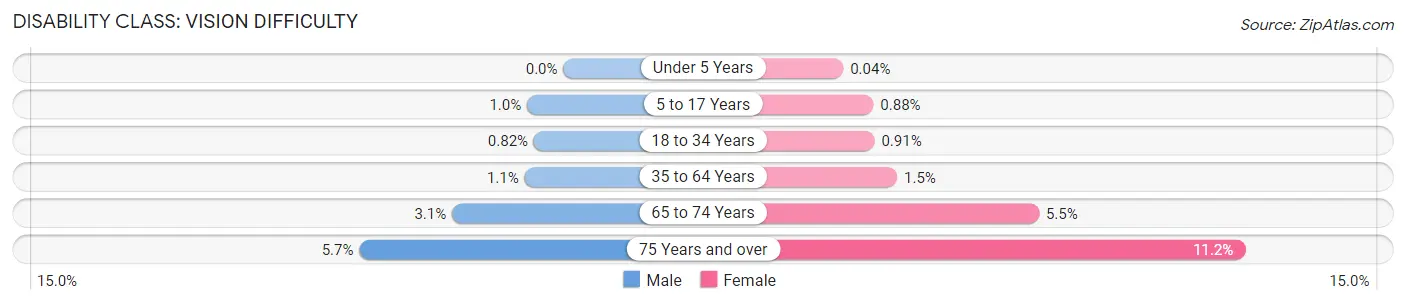
| Age Bracket | Male | Female |
| Under 5 Years | 0 (0.0%) | 2 (0.0%) |
| 5 to 17 Years | 151 (1.0%) | 126 (0.9%) |
| 18 to 34 Years | 181 (0.8%) | 201 (0.9%) |
| 35 to 64 Years | 199 (1.1%) | 283 (1.5%) |
| 65 to 74 Years | 117 (3.1%) | 210 (5.5%) |
| 75 Years and over | 136 (5.7%) | 312 (11.2%) |
Disability Class: Cognitive Difficulty
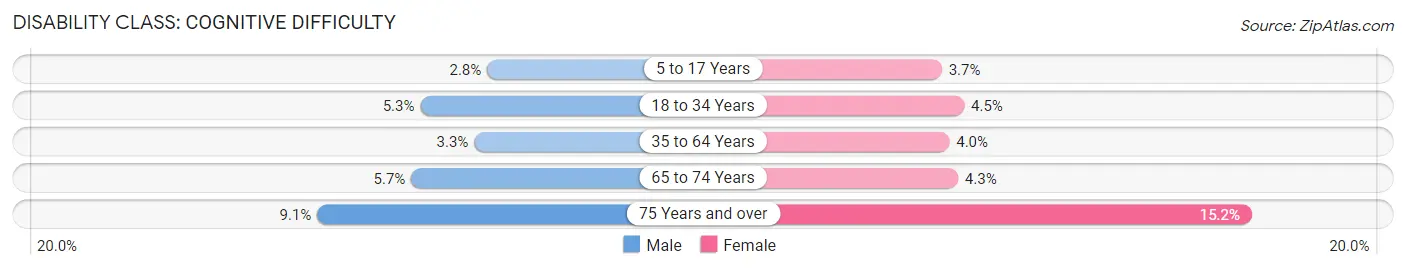
| Age Bracket | Male | Female |
| 5 to 17 Years | 424 (2.8%) | 532 (3.7%) |
| 18 to 34 Years | 1,174 (5.3%) | 1,002 (4.5%) |
| 35 to 64 Years | 612 (3.3%) | 735 (4.0%) |
| 65 to 74 Years | 213 (5.7%) | 165 (4.3%) |
| 75 Years and over | 219 (9.1%) | 423 (15.2%) |
Disability Class: Ambulatory Difficulty
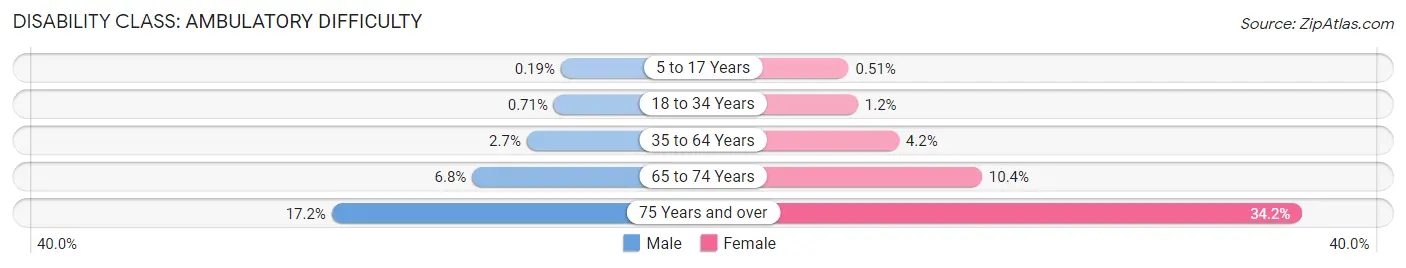
| Age Bracket | Male | Female |
| 5 to 17 Years | 28 (0.2%) | 73 (0.5%) |
| 18 to 34 Years | 158 (0.7%) | 263 (1.2%) |
| 35 to 64 Years | 503 (2.7%) | 781 (4.2%) |
| 65 to 74 Years | 255 (6.8%) | 398 (10.4%) |
| 75 Years and over | 412 (17.2%) | 950 (34.2%) |
Disability Class: Self-Care Difficulty
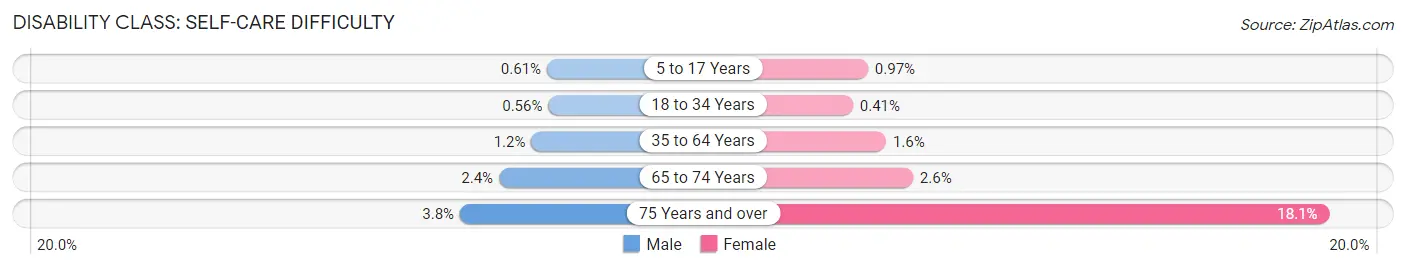
| Age Bracket | Male | Female |
| 5 to 17 Years | 92 (0.6%) | 139 (1.0%) |
| 18 to 34 Years | 123 (0.6%) | 91 (0.4%) |
| 35 to 64 Years | 220 (1.2%) | 303 (1.6%) |
| 65 to 74 Years | 90 (2.4%) | 101 (2.6%) |
| 75 Years and over | 92 (3.8%) | 503 (18.1%) |
Technology Access in Cache County
Computing Device Access in Cache County
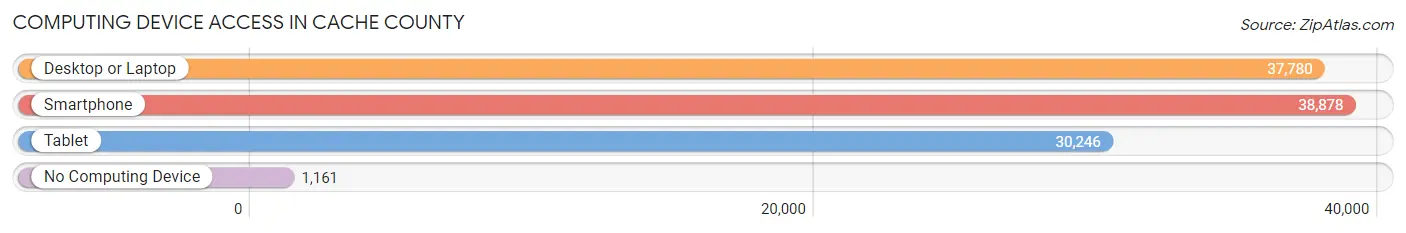
| Device Type | # Households | % Households |
| Desktop or Laptop | 37,780 | 90.6% |
| Smartphone | 38,878 | 93.2% |
| Tablet | 30,246 | 72.5% |
| No Computing Device | 1,161 | 2.8% |
| Total | 41,718 | 100.0% |
Internet Access in Cache County
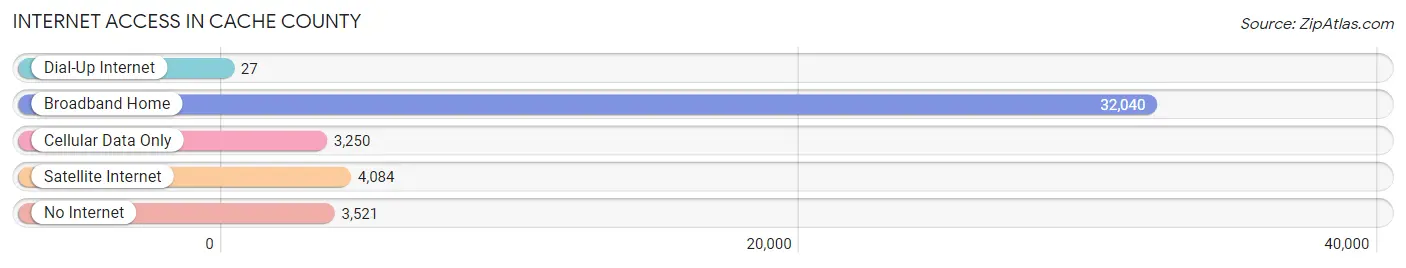
| Internet Type | # Households | % Households |
| Dial-Up Internet | 27 | 0.1% |
| Broadband Home | 32,040 | 76.8% |
| Cellular Data Only | 3,250 | 7.8% |
| Satellite Internet | 4,084 | 9.8% |
| No Internet | 3,521 | 8.4% |
| Total | 41,718 | 100.0% |
Cache County Summary
Cache County is located in the northern part of Utah, and is bordered by Box Elder County to the north, Rich County to the east, Weber County to the south, and Morgan and Davis Counties to the west. The county seat is Logan, and the county is part of the Logan Metropolitan Statistical Area. As of the 2010 census, the population of Cache County was 112,656, making it the fourth most populous county in Utah.
Geography
Cache County covers an area of 1,173 square miles, making it the fifth largest county in Utah. The county is located in the Wasatch Range of the Rocky Mountains, and is home to several mountain peaks, including Mount Logan, Mount Naomi, and Mount Magog. The county is also home to several rivers and streams, including the Bear River, Logan River, and Little Bear River. The county is mostly rural, with the majority of the population living in the cities of Logan, Smithfield, and Hyrum.
Climate
Cache County has a humid continental climate, with cold winters and hot summers. The average annual temperature is 44°F, and the average annual precipitation is 17.5 inches.
Demographics
As of the 2010 census, there were 112,656 people, 35,945 households, and 25,945 families living in Cache County. The population density was 96.3 people per square mile. The racial makeup of the county was 91.2% White, 0.7% African American, 0.7% Native American, 1.3% Asian, 0.2% Pacific Islander, 4.2% from other races, and 1.9% from two or more races. Hispanic or Latino of any race were 8.7% of the population.
The median income for a household in the county was $45,945, and the median income for a family was $54,945. The per capita income for the county was $20,945. About 8.2% of families and 11.2% of the population were below the poverty line, including 14.2% of those under age 18 and 6.2% of those age 65 or over.
Economy
Cache County is home to several major industries, including agriculture, manufacturing, and tourism. Agriculture is the largest industry in the county, with the majority of the agricultural production coming from livestock, hay, and potatoes. Manufacturing is also a major industry in the county, with the largest employers being Intermountain Healthcare, Utah State University, and the Cache Valley Electric Company. Tourism is also a major industry in the county, with the most popular attractions being the Logan Canyon Scenic Byway, the Logan Tabernacle, and the Logan Utah Temple.
Cache County is also home to several major employers, including Intermountain Healthcare, Utah State University, and the Cache Valley Electric Company. The county is also home to several major retail stores, including Walmart, Smith's Food and Drug, and Lowe's.
Conclusion
Cache County is a rural county located in the northern part of Utah. The county is home to several mountain peaks, rivers, and streams, and has a humid continental climate. As of the 2010 census, the population of Cache County was 112,656, and the median income for a household was $45,945. The county is home to several major industries, including agriculture, manufacturing, and tourism, and is also home to several major employers.
Common Questions
What is the Total Population of Cache County?
Total Population of Cache County is 134,428.
What is the Total Male Population of Cache County?
Total Male Population of Cache County is 67,593.
What is the Total Female Population of Cache County?
Total Female Population of Cache County is 66,835.
What is the Ratio of Males per 100 Females in Cache County?
There are 101.13 Males per 100 Females in Cache County.
What is the Ratio of Females per 100 Males in Cache County?
There are 98.88 Females per 100 Males in Cache County.
What is the Median Population Age in Cache County?
Median Population Age in Cache County is 25.5 Years.
What is the Average Family Size in Cache County
Average Family Size in Cache County is 3.5 People.
What is the Average Household Size in Cache County
Average Household Size in Cache County is 3.1 People.
What is Per Capita Income in Cache County?
Per Capita income in Cache County is $29,298.
What is the Median Family Income in Cache County?
Median Family Income in Cache County is $82,750.
What is the Median Household income in Cache County?
Median Household Income in Cache County is $72,719.
What is Income or Wage Gap in Cache County?
Income or Wage Gap in Cache County is 52.0%.
Women in Cache County earn 48.0 cents for every dollar earned by a man.
What is Family Income Deficit in Cache County?
Family Income Deficit in Cache County is $10,236.
Families that are below poverty line in Cache County earn $10,236 less on average than the poverty threshold level.
What is Inequality or Gini Index in Cache County?
Inequality or Gini Index in Cache County is 0.43.
How Large is the Labor Force in Cache County?
There are 69,287 People in the Labor Forcein in Cache County.
What is the Percentage of People in the Labor Force in Cache County?
70.1% of People are in the Labor Force in Cache County.
What is the Unemployment Rate in Cache County?
Unemployment Rate in Cache County is 2.4%.