Box Elder County, UT
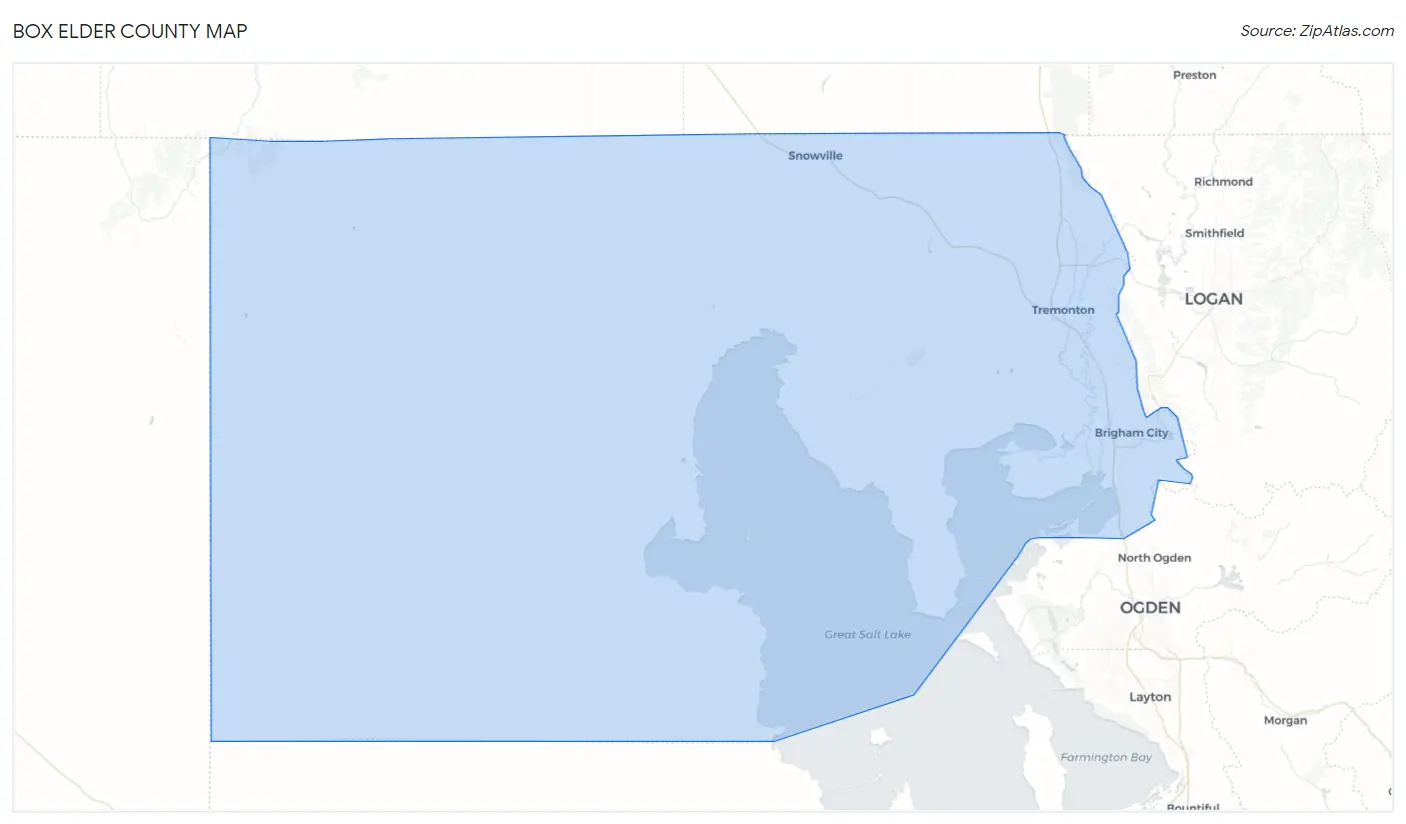
Box Elder County Map
Box Elder County Overview
58,291
TOTAL POPULATION
29,874
MALE POPULATION
28,417
FEMALE POPULATION
105.13
MALES / 100 FEMALES
95.12
FEMALES / 100 MALES
33.1
MEDIAN AGE
3.7
AVG FAMILY SIZE
3.1
AVG HOUSEHOLD SIZE
$30,762
PER CAPITA INCOME
$87,041
AVG FAMILY INCOME
$72,769
AVG HOUSEHOLD INCOME
51.0%
WAGE / INCOME GAP [ % ]
49.0¢/ $1
WAGE / INCOME GAP [ $ ]
$9,413
FAMILY INCOME DEFICIT
0.41
INEQUALITY / GINI INDEX
27,802
LABOR FORCE [ PEOPLE ]
65.6%
PERCENT IN LABOR FORCE
2.6%
UNEMPLOYMENT RATE
Box Elder County Area Codes
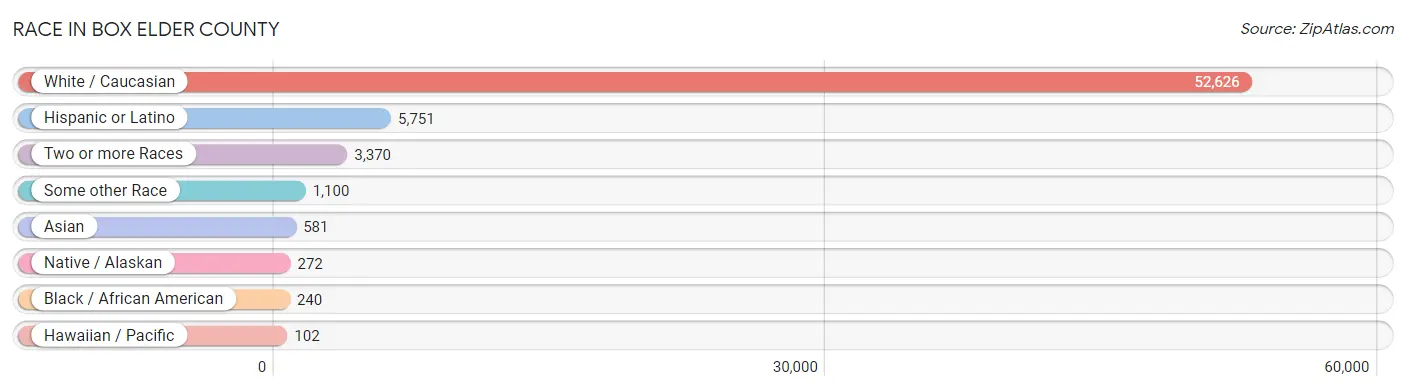
Race in Box Elder County
The most populous races in Box Elder County are White / Caucasian (52,626 | 90.3%), Hispanic or Latino (5,751 | 9.9%), and Two or more Races (3,370 | 5.8%).
| Race | # Population | % Population |
| Asian | 581 | 1.0% |
| Black / African American | 240 | 0.4% |
| Hawaiian / Pacific | 102 | 0.2% |
| Hispanic or Latino | 5,751 | 9.9% |
| Native / Alaskan | 272 | 0.5% |
| White / Caucasian | 52,626 | 90.3% |
| Two or more Races | 3,370 | 5.8% |
| Some other Race | 1,100 | 1.9% |
| Total | 58,291 | 100.0% |
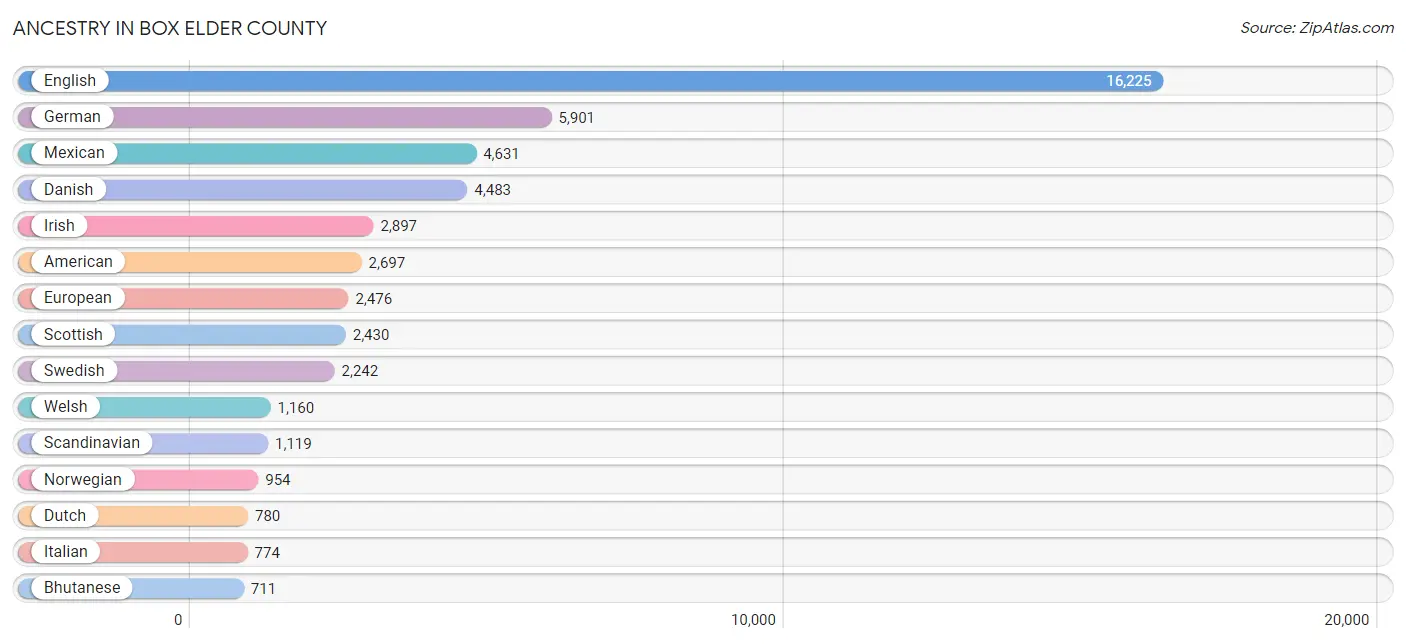
Ancestry in Box Elder County
The most populous ancestries reported in Box Elder County are English (16,225 | 27.8%), German (5,901 | 10.1%), Mexican (4,631 | 7.9%), Danish (4,483 | 7.7%), and Irish (2,897 | 5.0%), together accounting for 58.5% of all Box Elder County residents.
| Ancestry | # Population | % Population |
| African | 63 | 0.1% |
| Albanian | 38 | 0.1% |
| American | 2,697 | 4.6% |
| Apache | 12 | 0.0% |
| Armenian | 28 | 0.1% |
| Australian | 37 | 0.1% |
| Austrian | 150 | 0.3% |
| Basque | 1 | 0.0% |
| Belgian | 5 | 0.0% |
| Bhutanese | 711 | 1.2% |
| Blackfeet | 33 | 0.1% |
| Brazilian | 60 | 0.1% |
| British | 577 | 1.0% |
| Burmese | 84 | 0.1% |
| Canadian | 124 | 0.2% |
| Central American | 74 | 0.1% |
| Central American Indian | 8 | 0.0% |
| Cherokee | 126 | 0.2% |
| Cheyenne | 22 | 0.0% |
| Chilean | 21 | 0.0% |
| Colombian | 6 | 0.0% |
| Comanche | 2 | 0.0% |
| Costa Rican | 50 | 0.1% |
| Croatian | 8 | 0.0% |
| Cuban | 8 | 0.0% |
| Czech | 32 | 0.1% |
| Czechoslovakian | 36 | 0.1% |
| Danish | 4,483 | 7.7% |
| Dominican | 88 | 0.2% |
| Dutch | 780 | 1.3% |
| Eastern European | 22 | 0.0% |
| English | 16,225 | 27.8% |
| European | 2,476 | 4.3% |
| Fijian | 5 | 0.0% |
| Finnish | 24 | 0.0% |
| French | 561 | 1.0% |
| French Canadian | 72 | 0.1% |
| German | 5,901 | 10.1% |
| Greek | 112 | 0.2% |
| Honduran | 7 | 0.0% |
| Hopi | 3 | 0.0% |
| Hungarian | 20 | 0.0% |
| Icelander | 14 | 0.0% |
| Indian (Asian) | 54 | 0.1% |
| Iranian | 18 | 0.0% |
| Irish | 2,897 | 5.0% |
| Italian | 774 | 1.3% |
| Japanese | 29 | 0.1% |
| Korean | 36 | 0.1% |
| Lithuanian | 47 | 0.1% |
| Mexican | 4,631 | 7.9% |
| Mexican American Indian | 22 | 0.0% |
| Native Hawaiian | 58 | 0.1% |
| Navajo | 221 | 0.4% |
| New Zealander | 17 | 0.0% |
| Nigerian | 61 | 0.1% |
| Northern European | 111 | 0.2% |
| Norwegian | 954 | 1.6% |
| Ottawa | 26 | 0.0% |
| Paiute | 47 | 0.1% |
| Pennsylvania German | 2 | 0.0% |
| Peruvian | 199 | 0.3% |
| Pima | 6 | 0.0% |
| Polish | 130 | 0.2% |
| Portuguese | 40 | 0.1% |
| Puerto Rican | 160 | 0.3% |
| Romanian | 23 | 0.0% |
| Russian | 92 | 0.2% |
| Salvadoran | 17 | 0.0% |
| Samoan | 59 | 0.1% |
| Scandinavian | 1,119 | 1.9% |
| Scotch-Irish | 442 | 0.8% |
| Scottish | 2,430 | 4.2% |
| Shoshone | 6 | 0.0% |
| Sierra Leonean | 2 | 0.0% |
| Sioux | 8 | 0.0% |
| Slavic | 2 | 0.0% |
| Slovak | 4 | 0.0% |
| Slovene | 8 | 0.0% |
| South African | 28 | 0.1% |
| South American | 275 | 0.5% |
| Spaniard | 218 | 0.4% |
| Spanish | 93 | 0.2% |
| Sri Lankan | 100 | 0.2% |
| Subsaharan African | 154 | 0.3% |
| Swedish | 2,242 | 3.8% |
| Swiss | 670 | 1.1% |
| Thai | 22 | 0.0% |
| Turkish | 16 | 0.0% |
| Ukrainian | 18 | 0.0% |
| Ute | 13 | 0.0% |
| Venezuelan | 18 | 0.0% |
| Welsh | 1,160 | 2.0% |
| Yaqui | 4 | 0.0% |
| Yugoslavian | 19 | 0.0% | View All 95 Rows |
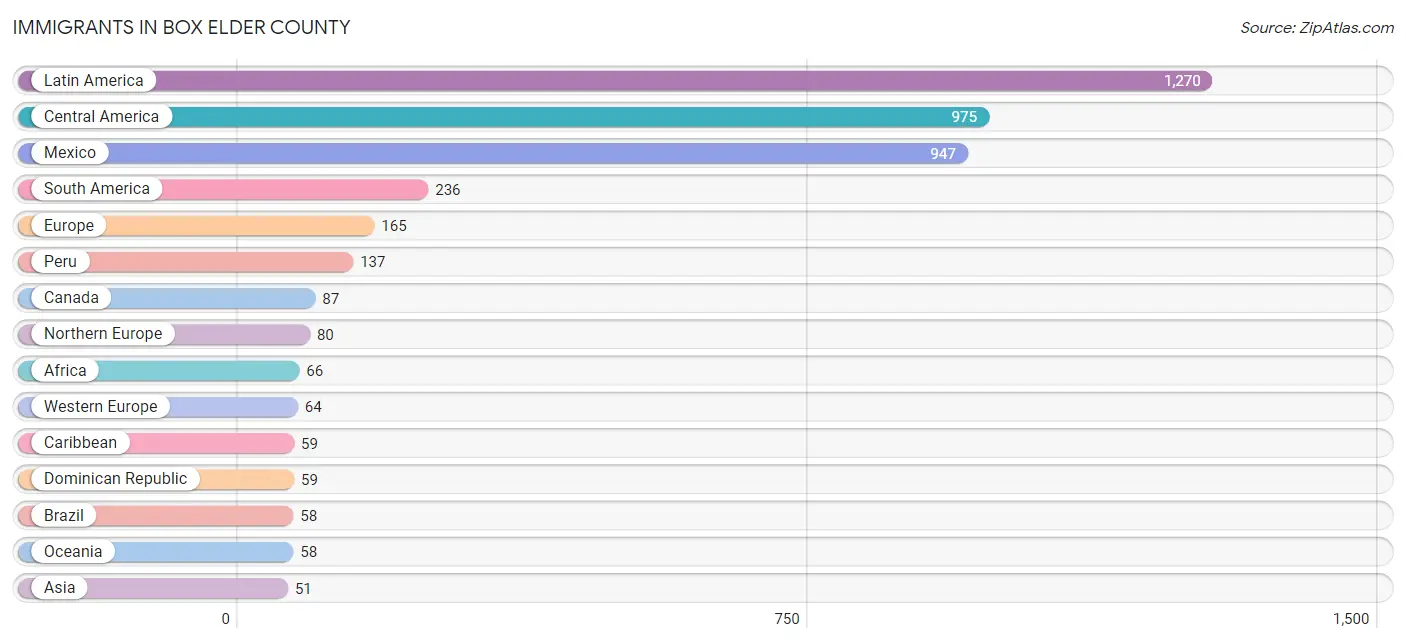
Immigrants in Box Elder County
The most numerous immigrant groups reported in Box Elder County came from Latin America (1,270 | 2.2%), Central America (975 | 1.7%), Mexico (947 | 1.6%), South America (236 | 0.4%), and Europe (165 | 0.3%), together accounting for 6.1% of all Box Elder County residents.
| Immigration Origin | # Population | % Population |
| Africa | 66 | 0.1% |
| Asia | 51 | 0.1% |
| Australia | 7 | 0.0% |
| Austria | 6 | 0.0% |
| Belgium | 10 | 0.0% |
| Brazil | 58 | 0.1% |
| Bulgaria | 7 | 0.0% |
| Canada | 87 | 0.2% |
| Caribbean | 59 | 0.1% |
| Central America | 975 | 1.7% |
| Chile | 17 | 0.0% |
| China | 17 | 0.0% |
| Colombia | 6 | 0.0% |
| Costa Rica | 21 | 0.0% |
| Dominican Republic | 59 | 0.1% |
| Eastern Asia | 27 | 0.1% |
| Eastern Europe | 21 | 0.0% |
| England | 38 | 0.1% |
| Europe | 165 | 0.3% |
| Germany | 48 | 0.1% |
| Honduras | 7 | 0.0% |
| India | 7 | 0.0% |
| Korea | 10 | 0.0% |
| Latin America | 1,270 | 2.2% |
| Liberia | 42 | 0.1% |
| Mexico | 947 | 1.6% |
| Micronesia | 24 | 0.0% |
| Nigeria | 3 | 0.0% |
| Northern Europe | 80 | 0.1% |
| Oceania | 58 | 0.1% |
| Peru | 137 | 0.2% |
| Philippines | 17 | 0.0% |
| Romania | 8 | 0.0% |
| Sierra Leone | 2 | 0.0% |
| South Africa | 6 | 0.0% |
| South America | 236 | 0.4% |
| South Central Asia | 7 | 0.0% |
| South Eastern Asia | 17 | 0.0% |
| Ukraine | 5 | 0.0% |
| Venezuela | 18 | 0.0% |
| Western Africa | 47 | 0.1% |
| Western Europe | 64 | 0.1% | View All 42 Rows |
Sex and Age in Box Elder County
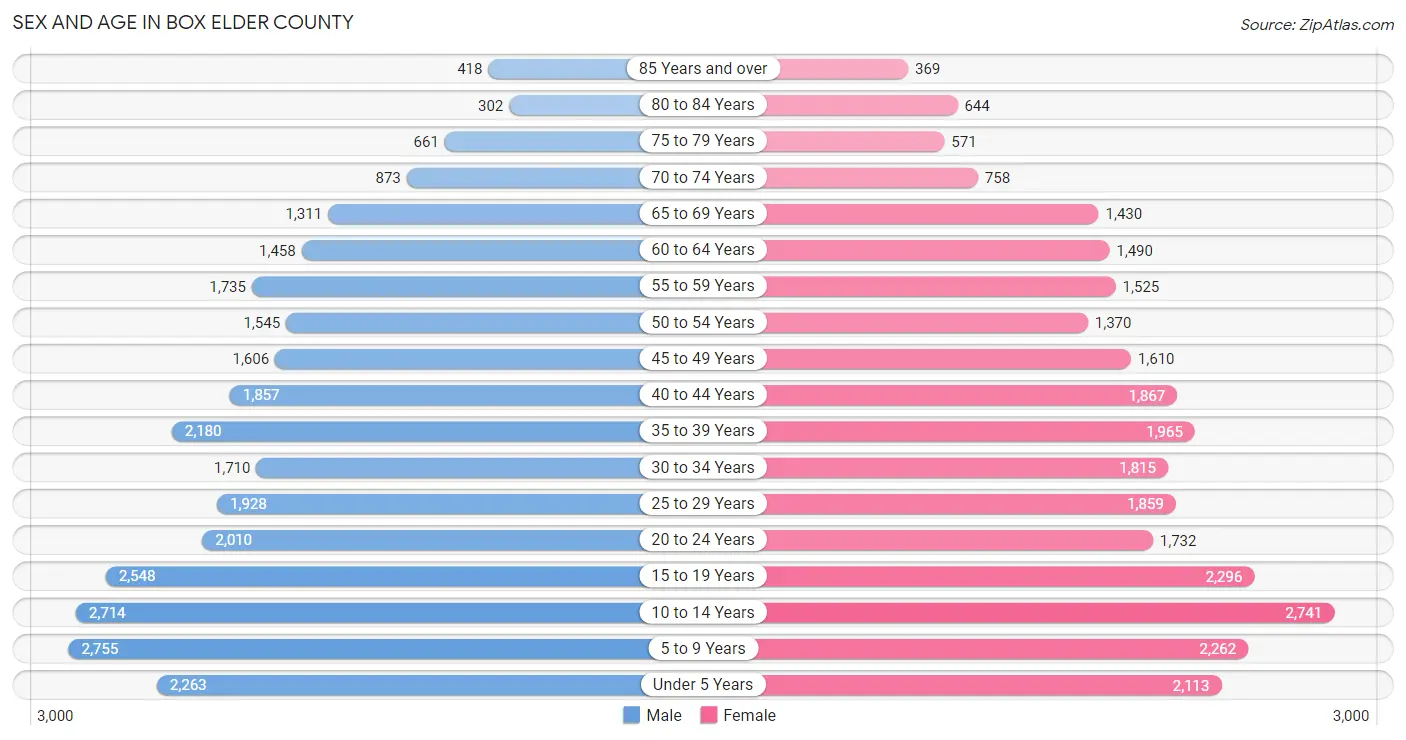
Sex and Age in Box Elder County
The most populous age groups in Box Elder County are 5 to 9 Years (2,755 | 9.2%) for men and 10 to 14 Years (2,741 | 9.7%) for women.
| Age Bracket | Male | Female |
| Under 5 Years | 2,263 (7.6%) | 2,113 (7.4%) |
| 5 to 9 Years | 2,755 (9.2%) | 2,262 (8.0%) |
| 10 to 14 Years | 2,714 (9.1%) | 2,741 (9.7%) |
| 15 to 19 Years | 2,548 (8.5%) | 2,296 (8.1%) |
| 20 to 24 Years | 2,010 (6.7%) | 1,732 (6.1%) |
| 25 to 29 Years | 1,928 (6.5%) | 1,859 (6.5%) |
| 30 to 34 Years | 1,710 (5.7%) | 1,815 (6.4%) |
| 35 to 39 Years | 2,180 (7.3%) | 1,965 (6.9%) |
| 40 to 44 Years | 1,857 (6.2%) | 1,867 (6.6%) |
| 45 to 49 Years | 1,606 (5.4%) | 1,610 (5.7%) |
| 50 to 54 Years | 1,545 (5.2%) | 1,370 (4.8%) |
| 55 to 59 Years | 1,735 (5.8%) | 1,525 (5.4%) |
| 60 to 64 Years | 1,458 (4.9%) | 1,490 (5.2%) |
| 65 to 69 Years | 1,311 (4.4%) | 1,430 (5.0%) |
| 70 to 74 Years | 873 (2.9%) | 758 (2.7%) |
| 75 to 79 Years | 661 (2.2%) | 571 (2.0%) |
| 80 to 84 Years | 302 (1.0%) | 644 (2.3%) |
| 85 Years and over | 418 (1.4%) | 369 (1.3%) |
| Total | 29,874 (100.0%) | 28,417 (100.0%) |
Families and Households in Box Elder County
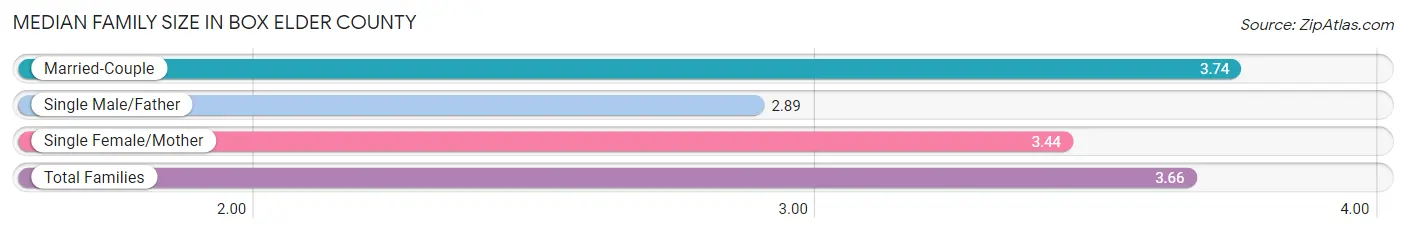
Median Family Size in Box Elder County
The median family size in Box Elder County is 3.66 persons per family, with married-couple families (12,067 | 85.0%) accounting for the largest median family size of 3.74 persons per family. On the other hand, single male/father families (887 | 6.2%) represent the smallest median family size with 2.89 persons per family.
| Family Type | # Families | Family Size |
| Married-Couple | 12,067 (85.0%) | 3.74 |
| Single Male/Father | 887 (6.2%) | 2.89 |
| Single Female/Mother | 1,250 (8.8%) | 3.44 |
| Total Families | 14,204 (100.0%) | 3.66 |
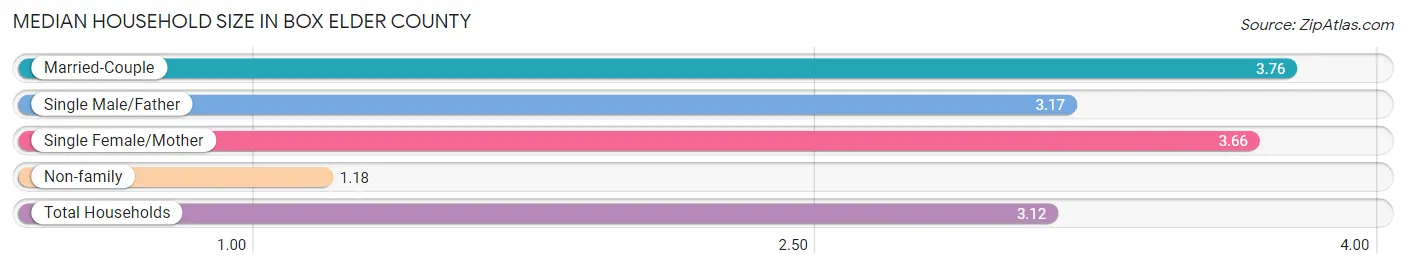
Median Household Size in Box Elder County
The median household size in Box Elder County is 3.12 persons per household, with married-couple households (12,067 | 65.0%) accounting for the largest median household size of 3.76 persons per household. non-family households (4,353 | 23.5%) represent the smallest median household size with 1.18 persons per household.
| Household Type | # Households | Household Size |
| Married-Couple | 12,067 (65.0%) | 3.76 |
| Single Male/Father | 887 (4.8%) | 3.17 |
| Single Female/Mother | 1,250 (6.7%) | 3.66 |
| Non-family | 4,353 (23.5%) | 1.18 |
| Total Households | 18,557 (100.0%) | 3.12 |
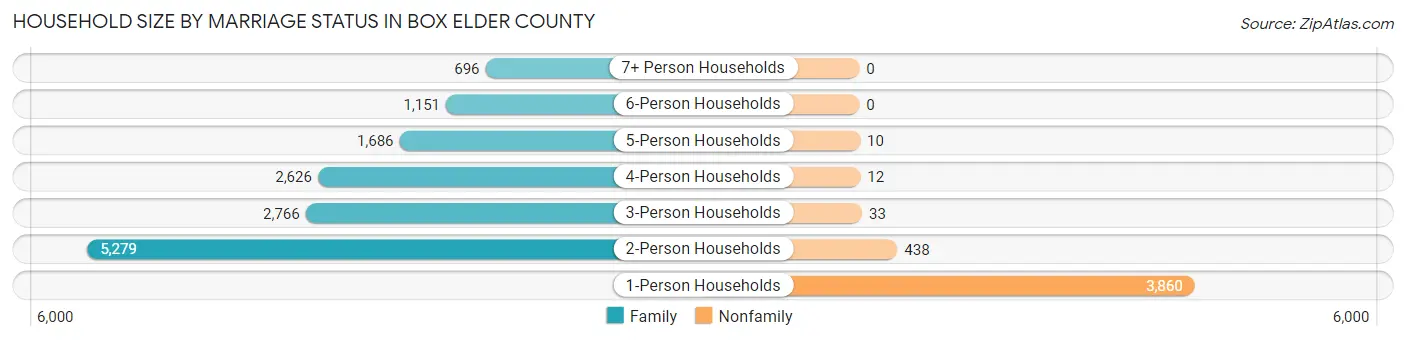
Household Size by Marriage Status in Box Elder County
Out of a total of 18,557 households in Box Elder County, 14,204 (76.5%) are family households, while 4,353 (23.5%) are nonfamily households. The most numerous type of family households are 2-person households, comprising 5,279, and the most common type of nonfamily households are 1-person households, comprising 3,860.
| Household Size | Family Households | Nonfamily Households |
| 1-Person Households | - | 3,860 (20.8%) |
| 2-Person Households | 5,279 (28.4%) | 438 (2.4%) |
| 3-Person Households | 2,766 (14.9%) | 33 (0.2%) |
| 4-Person Households | 2,626 (14.1%) | 12 (0.1%) |
| 5-Person Households | 1,686 (9.1%) | 10 (0.1%) |
| 6-Person Households | 1,151 (6.2%) | 0 (0.0%) |
| 7+ Person Households | 696 (3.7%) | 0 (0.0%) |
| Total | 14,204 (76.5%) | 4,353 (23.5%) |
Female Fertility in Box Elder County
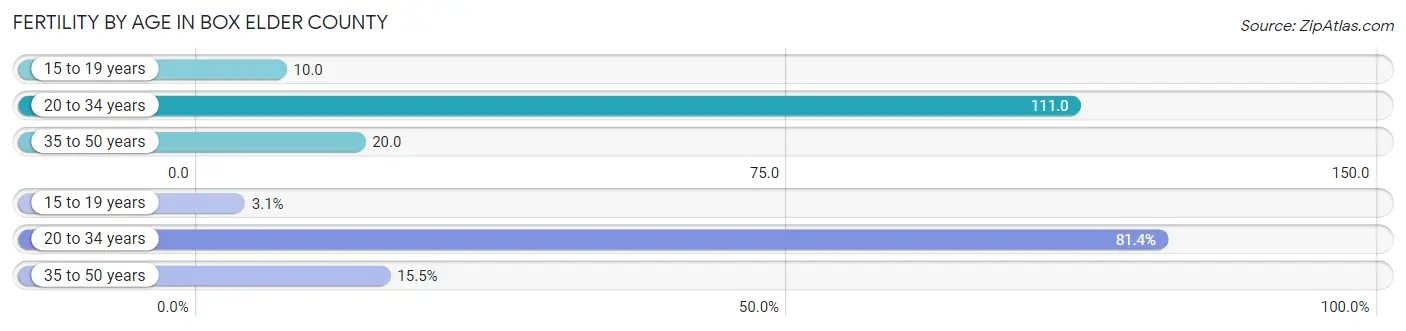
Fertility by Age in Box Elder County
Average fertility rate in Box Elder County is 55.0 births per 1,000 women. Women in the age bracket of 20 to 34 years have the highest fertility rate with 111.0 births per 1,000 women. Women in the age bracket of 20 to 34 years acount for 81.4% of all women with births.
| Age Bracket | Women with Births | Births / 1,000 Women |
| 15 to 19 years | 23 (3.1%) | 10.0 |
| 20 to 34 years | 600 (81.4%) | 111.0 |
| 35 to 50 years | 114 (15.5%) | 20.0 |
| Total | 737 (100.0%) | 55.0 |
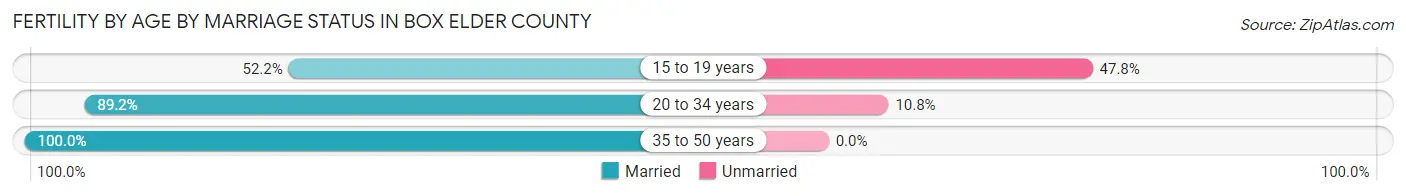
Fertility by Age by Marriage Status in Box Elder County
89.7% of women with births (737) in Box Elder County are married. The highest percentage of unmarried women with births falls into 15 to 19 years age bracket with 47.8% of them unmarried at the time of birth, while the lowest percentage of unmarried women with births belong to 35 to 50 years age bracket with 0.0% of them unmarried.
| Age Bracket | Married | Unmarried |
| 15 to 19 years | 12 (52.2%) | 11 (47.8%) |
| 20 to 34 years | 535 (89.2%) | 65 (10.8%) |
| 35 to 50 years | 114 (100.0%) | 0 (0.0%) |
| Total | 661 (89.7%) | 76 (10.3%) |
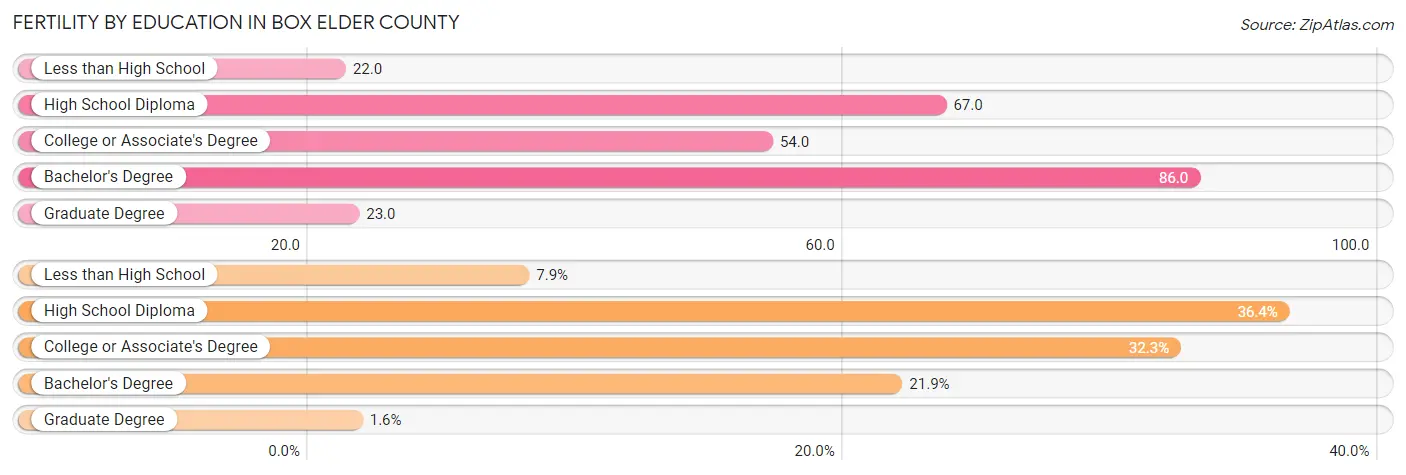
Fertility by Education in Box Elder County
Average fertility rate in Box Elder County is 55.0 births per 1,000 women. Women with the education attainment of bachelor's degree have the highest fertility rate of 86.0 births per 1,000 women, while women with the education attainment of less than high school have the lowest fertility at 22.0 births per 1,000 women. Women with the education attainment of high school diploma represent 36.4% of all women with births.
| Educational Attainment | Women with Births | Births / 1,000 Women |
| Less than High School | 58 (7.9%) | 22.0 |
| High School Diploma | 268 (36.4%) | 67.0 |
| College or Associate's Degree | 238 (32.3%) | 54.0 |
| Bachelor's Degree | 161 (21.8%) | 86.0 |
| Graduate Degree | 12 (1.6%) | 23.0 |
| Total | 737 (100.0%) | 55.0 |
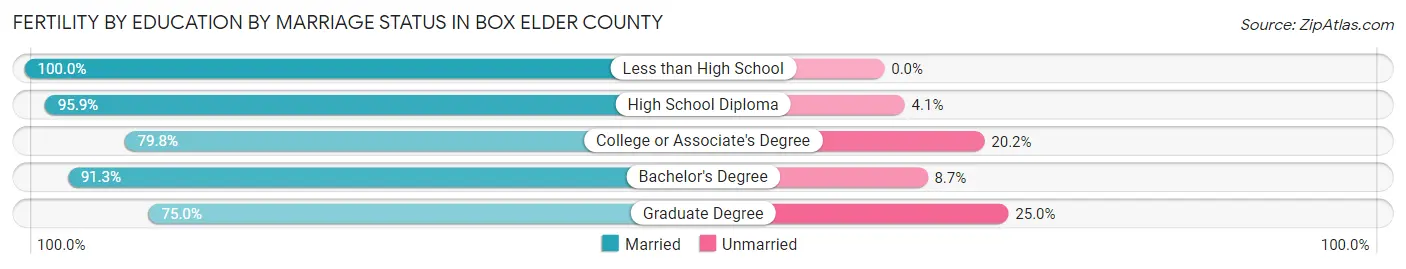
Fertility by Education by Marriage Status in Box Elder County
10.3% of women with births in Box Elder County are unmarried. Women with the educational attainment of less than high school are most likely to be married with 100.0% of them married at childbirth, while women with the educational attainment of graduate degree are least likely to be married with 25.0% of them unmarried at childbirth.
| Educational Attainment | Married | Unmarried |
| Less than High School | 58 (100.0%) | 0 (0.0%) |
| High School Diploma | 257 (95.9%) | 11 (4.1%) |
| College or Associate's Degree | 190 (79.8%) | 48 (20.2%) |
| Bachelor's Degree | 147 (91.3%) | 14 (8.7%) |
| Graduate Degree | 9 (75.0%) | 3 (25.0%) |
| Total | 661 (89.7%) | 76 (10.3%) |
Income in Box Elder County
Income Overview in Box Elder County
Per Capita Income in Box Elder County is $30,762, while median incomes of families and households are $87,041 and $72,769 respectively.
| Characteristic | Number | Measure |
| Per Capita Income | 58,291 | $30,762 |
| Median Family Income | 14,204 | $87,041 |
| Mean Family Income | 14,204 | $104,016 |
| Median Household Income | 18,557 | $72,769 |
| Mean Household Income | 18,557 | $91,694 |
| Income Deficit | 14,204 | $9,413 |
| Wage / Income Gap (%) | 58,291 | 50.99% |
| Wage / Income Gap ($) | 58,291 | 49.01¢ per $1 |
| Gini / Inequality Index | 58,291 | 0.41 |
Earnings by Sex in Box Elder County
Average Earnings in Box Elder County are $38,042, $50,655 for men and $24,826 for women, a difference of 51.0%.
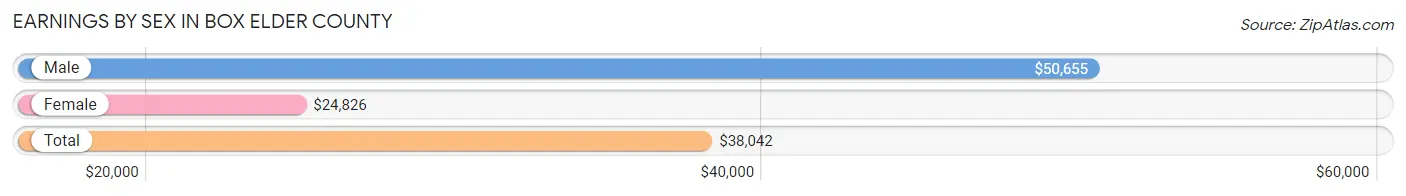
| Sex | Number | Average Earnings |
| Male | 16,780 (57.6%) | $50,655 |
| Female | 12,366 (42.4%) | $24,826 |
| Total | 29,146 (100.0%) | $38,042 |
Earnings by Sex by Income Bracket in Box Elder County
The most common earnings brackets in Box Elder County are $100,000+ for men (2,422 | 14.4%) and $2,499 or less for women (1,200 | 9.7%).
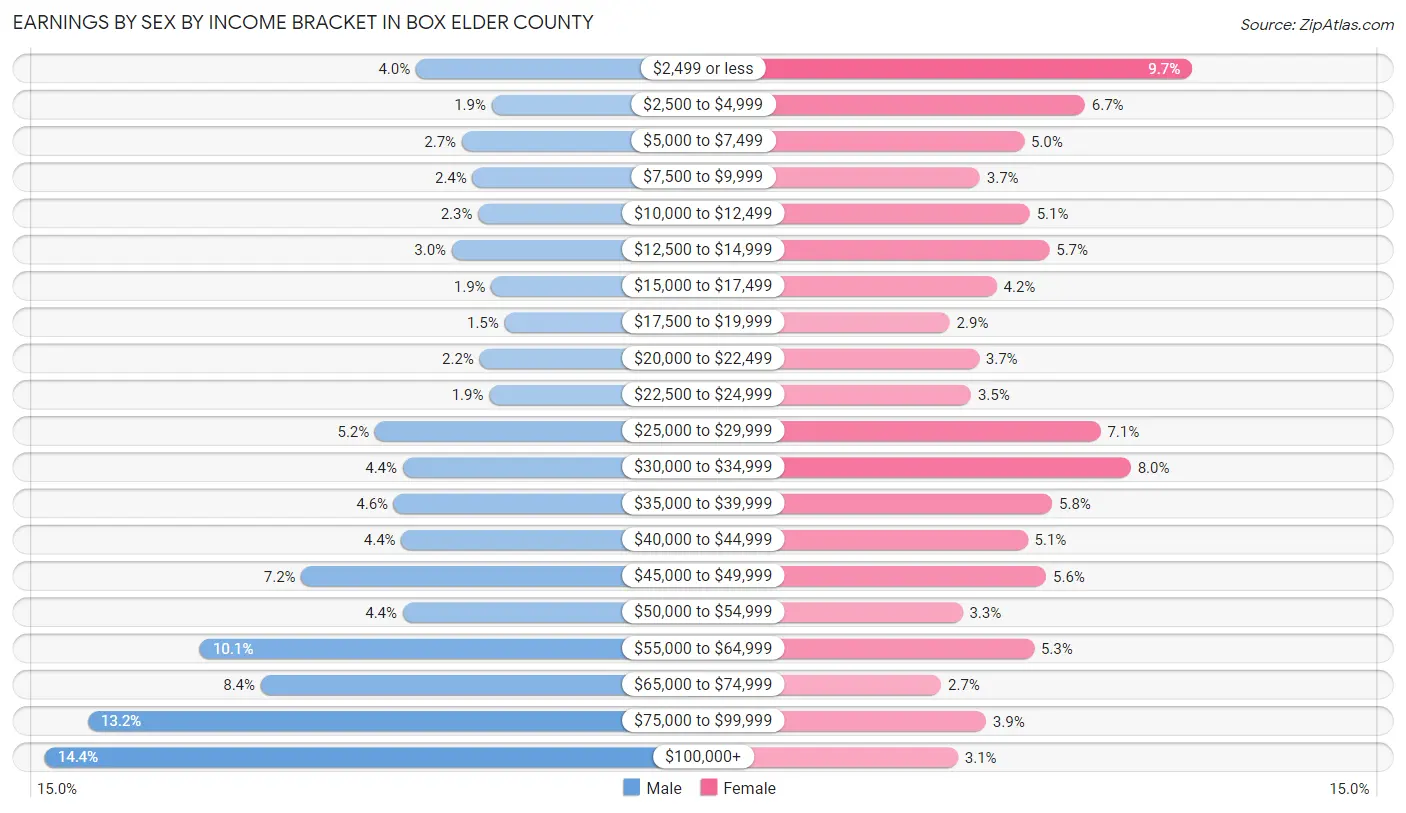
| Income | Male | Female |
| $2,499 or less | 671 (4.0%) | 1,200 (9.7%) |
| $2,500 to $4,999 | 314 (1.9%) | 827 (6.7%) |
| $5,000 to $7,499 | 455 (2.7%) | 616 (5.0%) |
| $7,500 to $9,999 | 404 (2.4%) | 462 (3.7%) |
| $10,000 to $12,499 | 377 (2.2%) | 635 (5.1%) |
| $12,500 to $14,999 | 501 (3.0%) | 704 (5.7%) |
| $15,000 to $17,499 | 316 (1.9%) | 521 (4.2%) |
| $17,500 to $19,999 | 253 (1.5%) | 357 (2.9%) |
| $20,000 to $22,499 | 371 (2.2%) | 459 (3.7%) |
| $22,500 to $24,999 | 325 (1.9%) | 432 (3.5%) |
| $25,000 to $29,999 | 865 (5.1%) | 882 (7.1%) |
| $30,000 to $34,999 | 734 (4.4%) | 987 (8.0%) |
| $35,000 to $39,999 | 776 (4.6%) | 714 (5.8%) |
| $40,000 to $44,999 | 740 (4.4%) | 628 (5.1%) |
| $45,000 to $49,999 | 1,212 (7.2%) | 692 (5.6%) |
| $50,000 to $54,999 | 733 (4.4%) | 402 (3.3%) |
| $55,000 to $64,999 | 1,690 (10.1%) | 651 (5.3%) |
| $65,000 to $74,999 | 1,402 (8.4%) | 328 (2.6%) |
| $75,000 to $99,999 | 2,219 (13.2%) | 483 (3.9%) |
| $100,000+ | 2,422 (14.4%) | 386 (3.1%) |
| Total | 16,780 (100.0%) | 12,366 (100.0%) |
Earnings by Sex by Educational Attainment in Box Elder County
Average earnings in Box Elder County are $58,494 for men and $30,907 for women, a difference of 47.2%. Men with an educational attainment of graduate degree enjoy the highest average annual earnings of $100,550, while those with less than high school education earn the least with $44,583. Women with an educational attainment of graduate degree earn the most with the average annual earnings of $59,159, while those with less than high school education have the smallest earnings of $19,786.
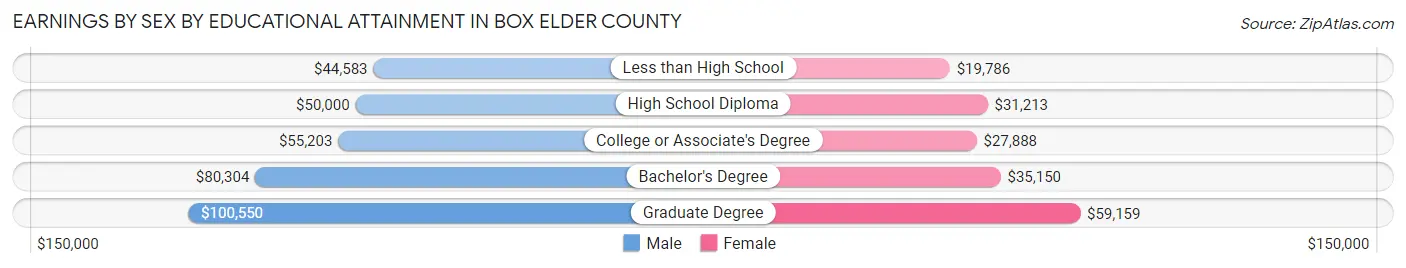
| Educational Attainment | Male Income | Female Income |
| Less than High School | $44,583 | $19,786 |
| High School Diploma | $50,000 | $31,213 |
| College or Associate's Degree | $55,203 | $27,888 |
| Bachelor's Degree | $80,304 | $35,150 |
| Graduate Degree | $100,550 | $59,159 |
| Total | $58,494 | $30,907 |
Family Income in Box Elder County
Family Income Brackets in Box Elder County
According to the Box Elder County family income data, there are 3,295 families falling into the $100,000 to $149,999 income range, which is the most common income bracket and makes up 23.2% of all families. Conversely, the $10,000 to $14,999 income bracket is the least frequent group with only 170 families (1.2%) belonging to this category.
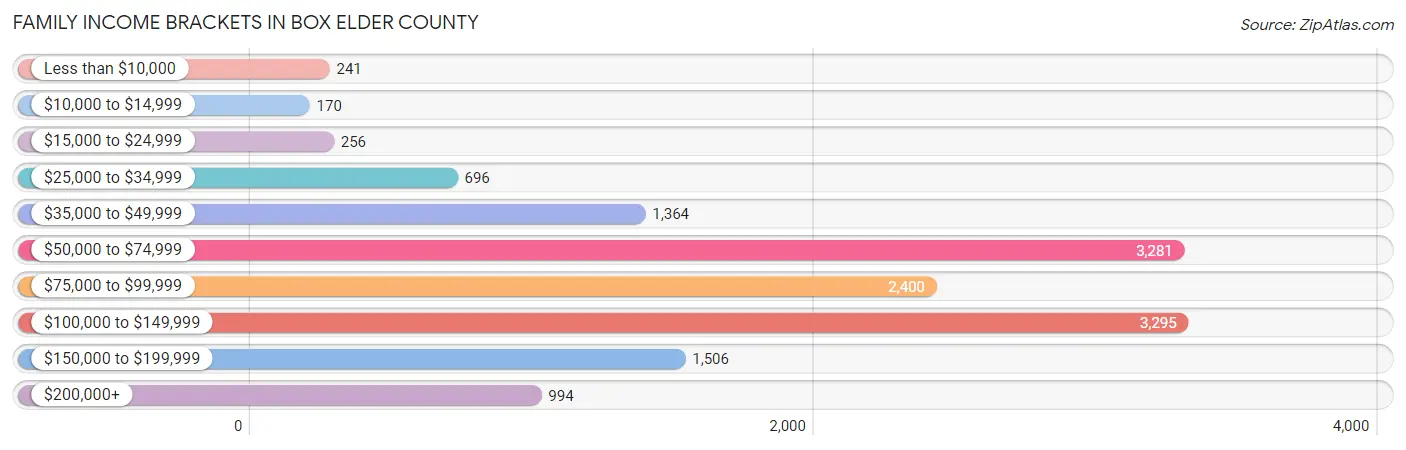
| Income Bracket | # Families | % Families |
| Less than $10,000 | 241 | 1.7% |
| $10,000 to $14,999 | 170 | 1.2% |
| $15,000 to $24,999 | 256 | 1.8% |
| $25,000 to $34,999 | 696 | 4.9% |
| $35,000 to $49,999 | 1,364 | 9.6% |
| $50,000 to $74,999 | 3,281 | 23.1% |
| $75,000 to $99,999 | 2,400 | 16.9% |
| $100,000 to $149,999 | 3,295 | 23.2% |
| $150,000 to $199,999 | 1,506 | 10.6% |
| $200,000+ | 994 | 7.0% |
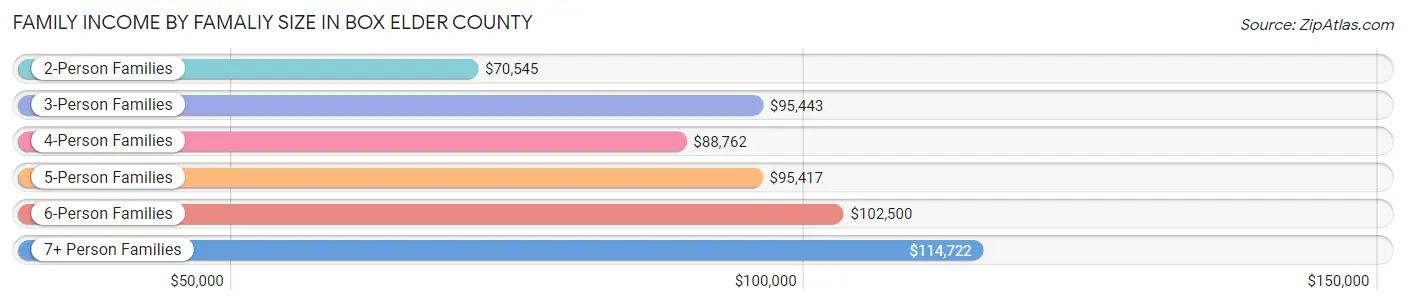
Family Income by Famaliy Size in Box Elder County
7+ person families (652 | 4.6%) account for the highest median family income in Box Elder County with $114,722 per family, while 2-person families (5,560 | 39.1%) have the highest median income of $35,272 per family member.
| Income Bracket | # Families | Median Income |
| 2-Person Families | 5,560 (39.1%) | $70,545 |
| 3-Person Families | 2,606 (18.3%) | $95,443 |
| 4-Person Families | 2,566 (18.1%) | $88,762 |
| 5-Person Families | 1,680 (11.8%) | $95,417 |
| 6-Person Families | 1,140 (8.0%) | $102,500 |
| 7+ Person Families | 652 (4.6%) | $114,722 |
| Total | 14,204 (100.0%) | $87,041 |
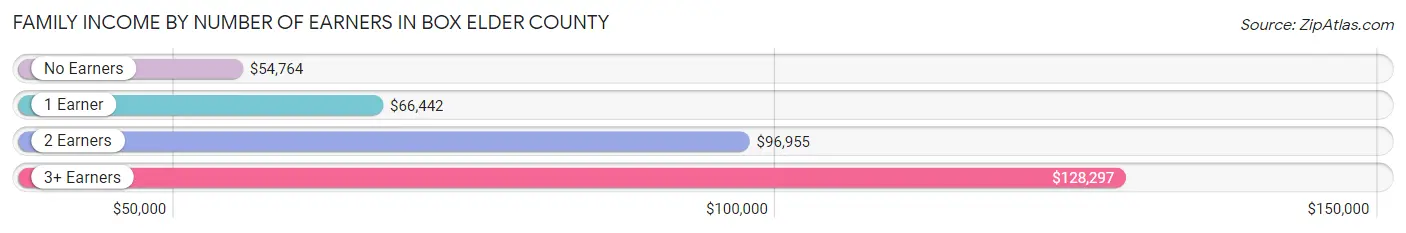
Family Income by Number of Earners in Box Elder County
The median family income in Box Elder County is $87,041, with families comprising 3+ earners (2,377) having the highest median family income of $128,297, while families with no earners (1,825) have the lowest median family income of $54,764, accounting for 16.7% and 12.9% of families, respectively.
| Number of Earners | # Families | Median Income |
| No Earners | 1,825 (12.9%) | $54,764 |
| 1 Earner | 4,167 (29.3%) | $66,442 |
| 2 Earners | 5,835 (41.1%) | $96,955 |
| 3+ Earners | 2,377 (16.7%) | $128,297 |
| Total | 14,204 (100.0%) | $87,041 |
Household Income in Box Elder County
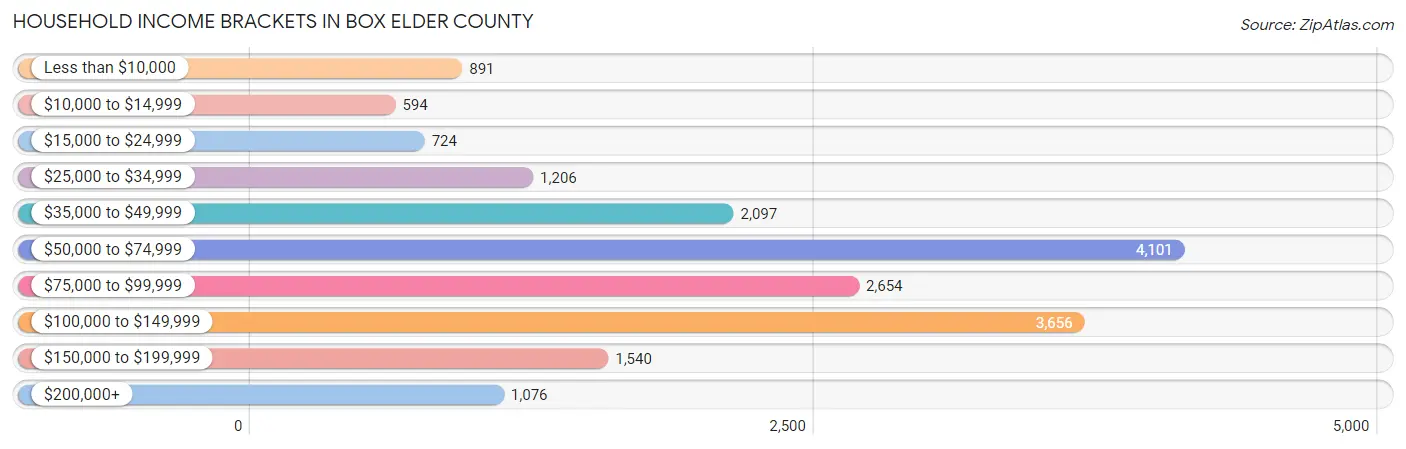
Household Income Brackets in Box Elder County
With 4,101 households falling in the category, the $50,000 to $74,999 income range is the most frequent in Box Elder County, accounting for 22.1% of all households. In contrast, only 594 households (3.2%) fall into the $10,000 to $14,999 income bracket, making it the least populous group.
| Income Bracket | # Households | % Households |
| Less than $10,000 | 891 | 4.8% |
| $10,000 to $14,999 | 594 | 3.2% |
| $15,000 to $24,999 | 724 | 3.9% |
| $25,000 to $34,999 | 1,206 | 6.5% |
| $35,000 to $49,999 | 2,097 | 11.3% |
| $50,000 to $74,999 | 4,101 | 22.1% |
| $75,000 to $99,999 | 2,654 | 14.3% |
| $100,000 to $149,999 | 3,656 | 19.7% |
| $150,000 to $199,999 | 1,540 | 8.3% |
| $200,000+ | 1,076 | 5.8% |
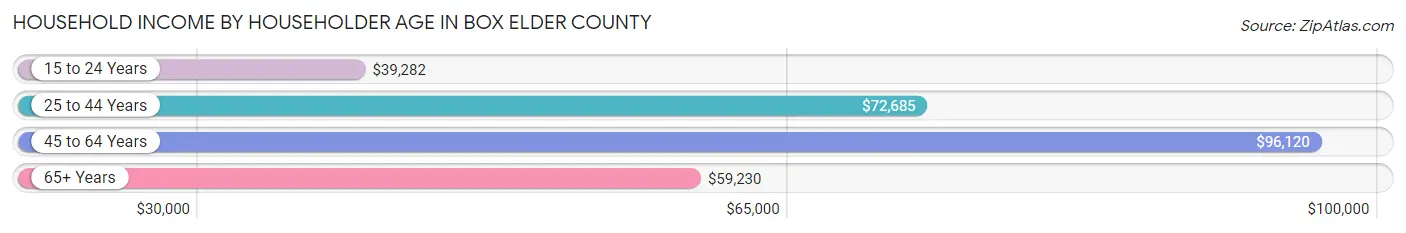
Household Income by Householder Age in Box Elder County
The median household income in Box Elder County is $72,769, with the highest median household income of $96,120 found in the 45 to 64 years age bracket for the primary householder. A total of 6,637 households (35.8%) fall into this category. Meanwhile, the 15 to 24 years age bracket for the primary householder has the lowest median household income of $39,282, with 763 households (4.1%) in this group.
| Income Bracket | # Households | Median Income |
| 15 to 24 Years | 763 (4.1%) | $39,282 |
| 25 to 44 Years | 6,722 (36.2%) | $72,685 |
| 45 to 64 Years | 6,637 (35.8%) | $96,120 |
| 65+ Years | 4,435 (23.9%) | $59,230 |
| Total | 18,557 (100.0%) | $72,769 |
Poverty in Box Elder County
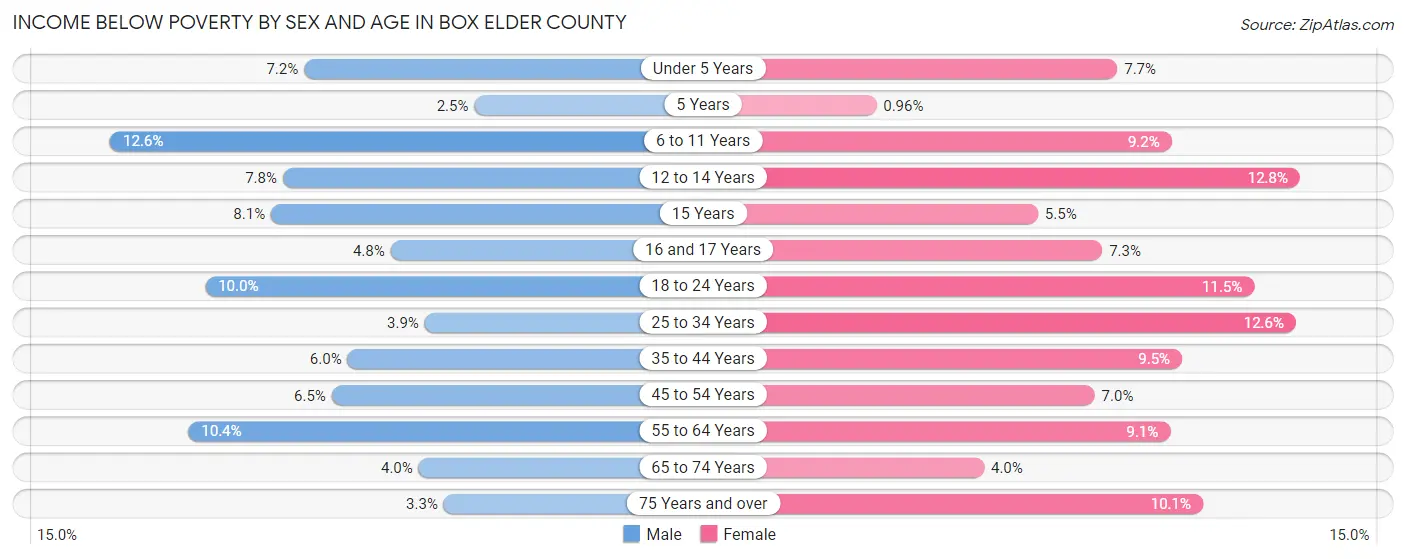
Income Below Poverty by Sex and Age in Box Elder County
With 7.2% poverty level for males and 9.1% for females among the residents of Box Elder County, 6 to 11 year old males and 12 to 14 year old females are the most vulnerable to poverty, with 423 males (12.6%) and 214 females (12.8%) in their respective age groups living below the poverty level.
| Age Bracket | Male | Female |
| Under 5 Years | 162 (7.2%) | 161 (7.7%) |
| 5 Years | 11 (2.5%) | 5 (1.0%) |
| 6 to 11 Years | 423 (12.6%) | 254 (9.2%) |
| 12 to 14 Years | 129 (7.8%) | 214 (12.8%) |
| 15 Years | 38 (8.1%) | 32 (5.5%) |
| 16 and 17 Years | 58 (4.8%) | 68 (7.2%) |
| 18 to 24 Years | 280 (10.0%) | 287 (11.5%) |
| 25 to 34 Years | 139 (3.9%) | 464 (12.6%) |
| 35 to 44 Years | 241 (6.0%) | 363 (9.5%) |
| 45 to 54 Years | 202 (6.5%) | 209 (7.0%) |
| 55 to 64 Years | 331 (10.4%) | 274 (9.1%) |
| 65 to 74 Years | 87 (4.0%) | 86 (4.0%) |
| 75 Years and over | 46 (3.3%) | 155 (10.1%) |
| Total | 2,147 (7.2%) | 2,572 (9.1%) |
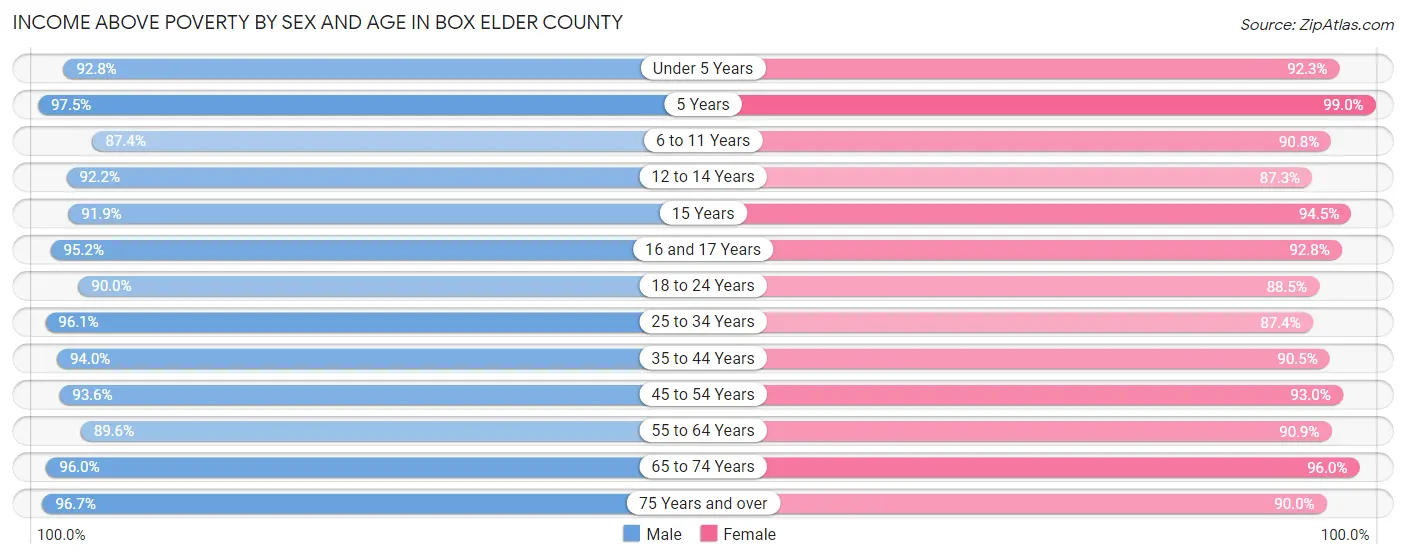
Income Above Poverty by Sex and Age in Box Elder County
According to the poverty statistics in Box Elder County, males aged 5 years and females aged 5 years are the age groups that are most secure financially, with 97.5% of males and 99.0% of females in these age groups living above the poverty line.
| Age Bracket | Male | Female |
| Under 5 Years | 2,082 (92.8%) | 1,939 (92.3%) |
| 5 Years | 433 (97.5%) | 517 (99.0%) |
| 6 to 11 Years | 2,930 (87.4%) | 2,513 (90.8%) |
| 12 to 14 Years | 1,523 (92.2%) | 1,464 (87.3%) |
| 15 Years | 429 (91.9%) | 554 (94.5%) |
| 16 and 17 Years | 1,149 (95.2%) | 870 (92.7%) |
| 18 to 24 Years | 2,528 (90.0%) | 2,213 (88.5%) |
| 25 to 34 Years | 3,462 (96.1%) | 3,206 (87.4%) |
| 35 to 44 Years | 3,772 (94.0%) | 3,469 (90.5%) |
| 45 to 54 Years | 2,932 (93.5%) | 2,761 (93.0%) |
| 55 to 64 Years | 2,840 (89.6%) | 2,723 (90.9%) |
| 65 to 74 Years | 2,074 (96.0%) | 2,084 (96.0%) |
| 75 Years and over | 1,335 (96.7%) | 1,387 (89.9%) |
| Total | 27,489 (92.8%) | 25,700 (90.9%) |
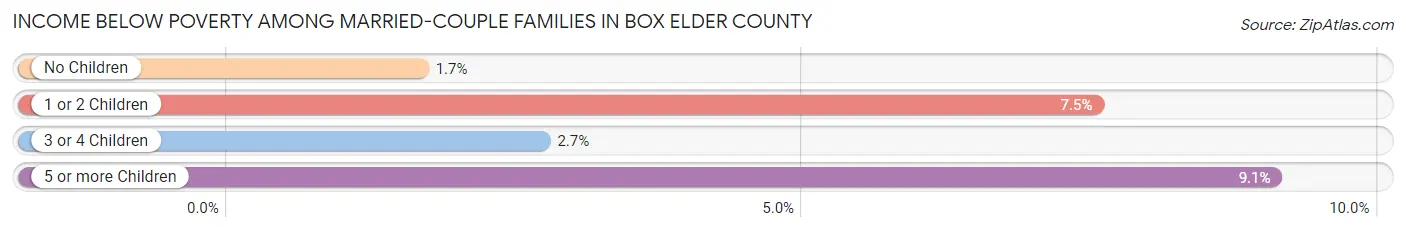
Income Below Poverty Among Married-Couple Families in Box Elder County
The poverty statistics for married-couple families in Box Elder County show that 3.9% or 470 of the total 12,067 families live below the poverty line. Families with 5 or more children have the highest poverty rate of 9.1%, comprising of 34 families. On the other hand, families with no children have the lowest poverty rate of 1.7%, which includes 95 families.
| Children | Above Poverty | Below Poverty |
| No Children | 5,618 (98.3%) | 95 (1.7%) |
| 1 or 2 Children | 3,419 (92.5%) | 279 (7.5%) |
| 3 or 4 Children | 2,220 (97.3%) | 62 (2.7%) |
| 5 or more Children | 340 (90.9%) | 34 (9.1%) |
| Total | 11,597 (96.1%) | 470 (3.9%) |
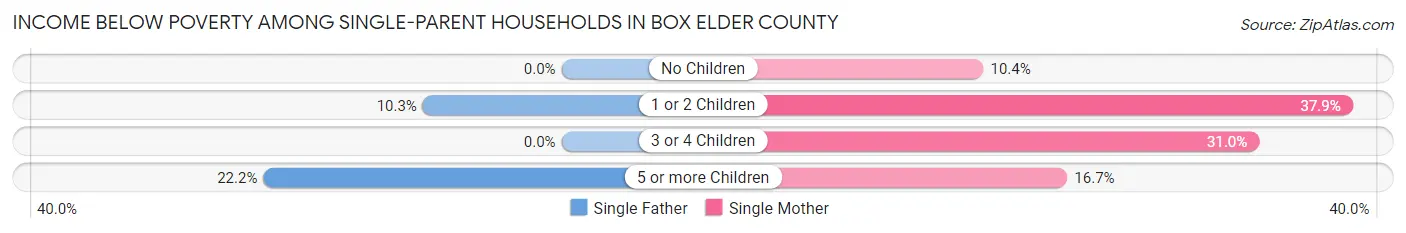
Income Below Poverty Among Single-Parent Households in Box Elder County
According to the poverty data in Box Elder County, 6.0% or 53 single-father households and 26.7% or 334 single-mother households are living below the poverty line. Among single-father households, those with 5 or more children have the highest poverty rate, with 8 households (22.2%) experiencing poverty. Likewise, among single-mother households, those with 1 or 2 children have the highest poverty rate, with 221 households (37.9%) falling below the poverty line.
| Children | Single Father | Single Mother |
| No Children | 0 (0.0%) | 47 (10.4%) |
| 1 or 2 Children | 45 (10.3%) | 221 (37.9%) |
| 3 or 4 Children | 0 (0.0%) | 65 (30.9%) |
| 5 or more Children | 8 (22.2%) | 1 (16.7%) |
| Total | 53 (6.0%) | 334 (26.7%) |
Income Below Poverty Among Married-Couple vs Single-Parent Households in Box Elder County
The poverty data for Box Elder County shows that 470 of the married-couple family households (3.9%) and 387 of the single-parent households (18.1%) are living below the poverty level. Within the married-couple family households, those with 5 or more children have the highest poverty rate, with 34 households (9.1%) falling below the poverty line. Among the single-parent households, those with 1 or 2 children have the highest poverty rate, with 266 household (26.1%) living below poverty.
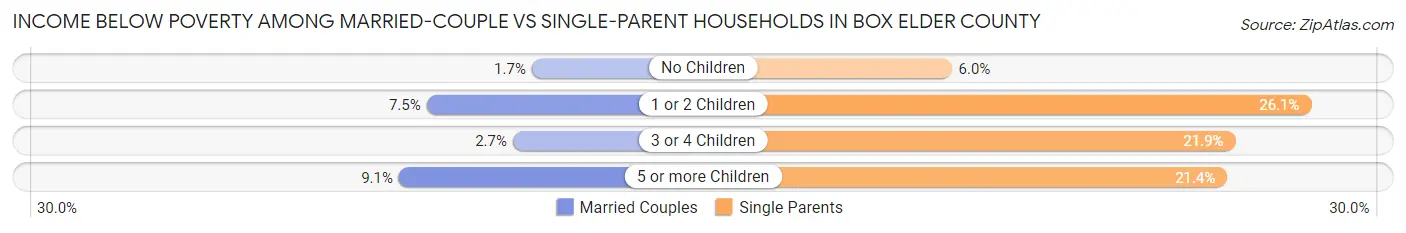
| Children | Married-Couple Families | Single-Parent Households |
| No Children | 95 (1.7%) | 47 (6.0%) |
| 1 or 2 Children | 279 (7.5%) | 266 (26.1%) |
| 3 or 4 Children | 62 (2.7%) | 65 (21.9%) |
| 5 or more Children | 34 (9.1%) | 9 (21.4%) |
| Total | 470 (3.9%) | 387 (18.1%) |
Employment Characteristics in Box Elder County
Employment by Class of Employer in Box Elder County
Among the 26,707 employed individuals in Box Elder County, private company employees (18,009 | 67.4%), local government employees (2,496 | 9.3%), and self-employed (not incorporated) (1,596 | 6.0%) make up the most common classes of employment.
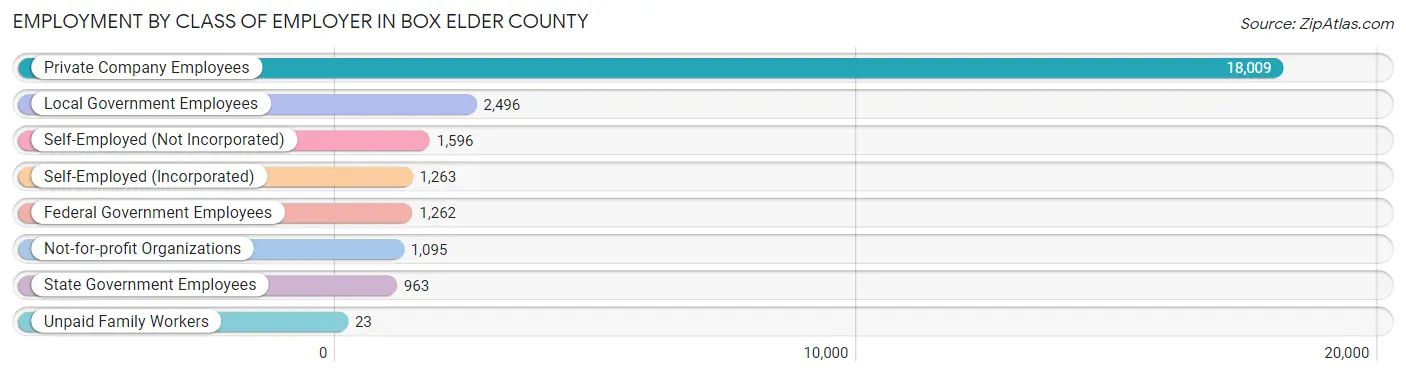
| Employer Class | # Employees | % Employees |
| Private Company Employees | 18,009 | 67.4% |
| Self-Employed (Incorporated) | 1,263 | 4.7% |
| Self-Employed (Not Incorporated) | 1,596 | 6.0% |
| Not-for-profit Organizations | 1,095 | 4.1% |
| Local Government Employees | 2,496 | 9.3% |
| State Government Employees | 963 | 3.6% |
| Federal Government Employees | 1,262 | 4.7% |
| Unpaid Family Workers | 23 | 0.1% |
| Total | 26,707 | 100.0% |
Employment Status by Age in Box Elder County
According to the labor force statistics for Box Elder County, out of the total population over 16 years of age (42,381), 65.6% or 27,802 individuals are in the labor force, with 2.6% or 723 of them unemployed. The age group with the highest labor force participation rate is 20 to 24 years, with 83.1% or 3,110 individuals in the labor force. Within the labor force, the 16 to 19 years age range has the highest percentage of unemployed individuals, with 12.8% or 271 of them being unemployed.
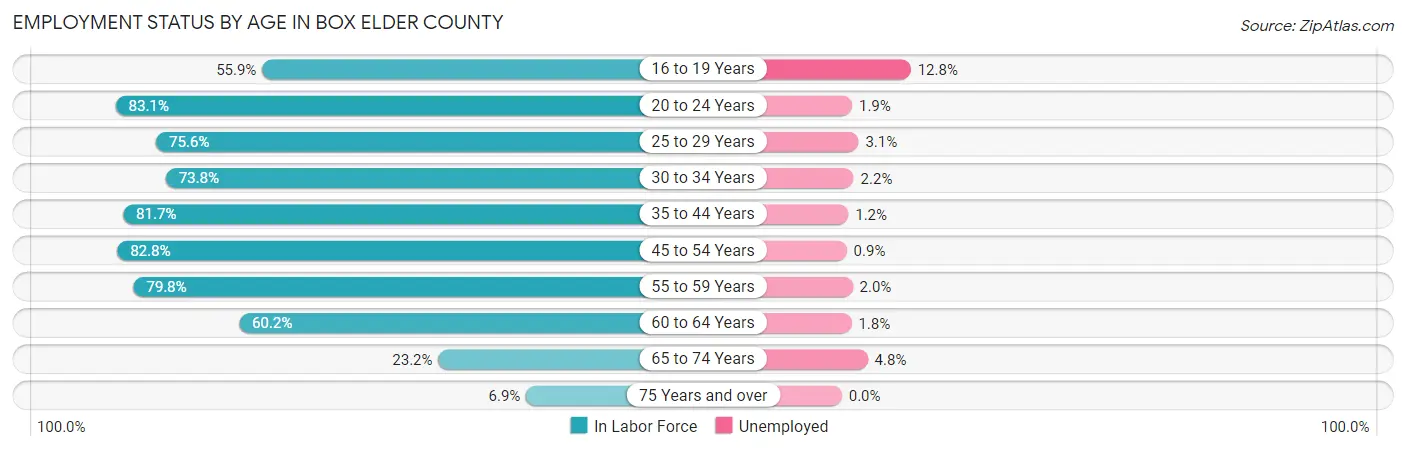
| Age Bracket | In Labor Force | Unemployed |
| 16 to 19 Years | 2,114 (55.9%) | 271 (12.8%) |
| 20 to 24 Years | 3,110 (83.1%) | 59 (1.9%) |
| 25 to 29 Years | 2,863 (75.6%) | 89 (3.1%) |
| 30 to 34 Years | 2,601 (73.8%) | 57 (2.2%) |
| 35 to 44 Years | 6,429 (81.7%) | 77 (1.2%) |
| 45 to 54 Years | 5,076 (82.8%) | 46 (0.9%) |
| 55 to 59 Years | 2,601 (79.8%) | 52 (2.0%) |
| 60 to 64 Years | 1,775 (60.2%) | 32 (1.8%) |
| 65 to 74 Years | 1,014 (23.2%) | 49 (4.8%) |
| 75 Years and over | 205 (6.9%) | 0 (0.0%) |
| Total | 27,802 (65.6%) | 723 (2.6%) |
Employment Status by Educational Attainment in Box Elder County
According to labor force statistics for Box Elder County, 77.6% of individuals (21,356) out of the total population between 25 and 64 years of age (27,520) are in the labor force, with 1.7% or 363 of them being unemployed. The group with the highest labor force participation rate are those with the educational attainment of college / associate degree, with 80.8% or 7,817 individuals in the labor force. Within the labor force, individuals with less than high school education have the highest percentage of unemployment, with 2.5% or 29 of them being unemployed.
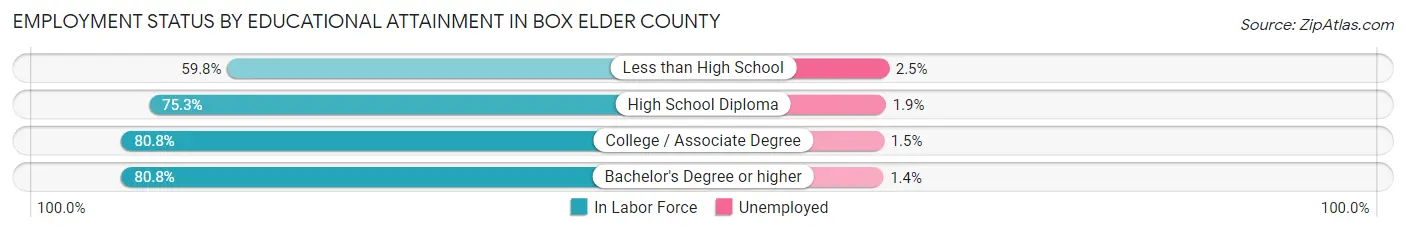
| Educational Attainment | In Labor Force | Unemployed |
| Less than High School | 1,145 (59.8%) | 48 (2.5%) |
| High School Diploma | 6,701 (75.3%) | 169 (1.9%) |
| College / Associate Degree | 7,817 (80.8%) | 145 (1.5%) |
| Bachelor's Degree or higher | 5,682 (80.8%) | 98 (1.4%) |
| Total | 21,356 (77.6%) | 468 (1.7%) |
Employment Occupations by Sex in Box Elder County
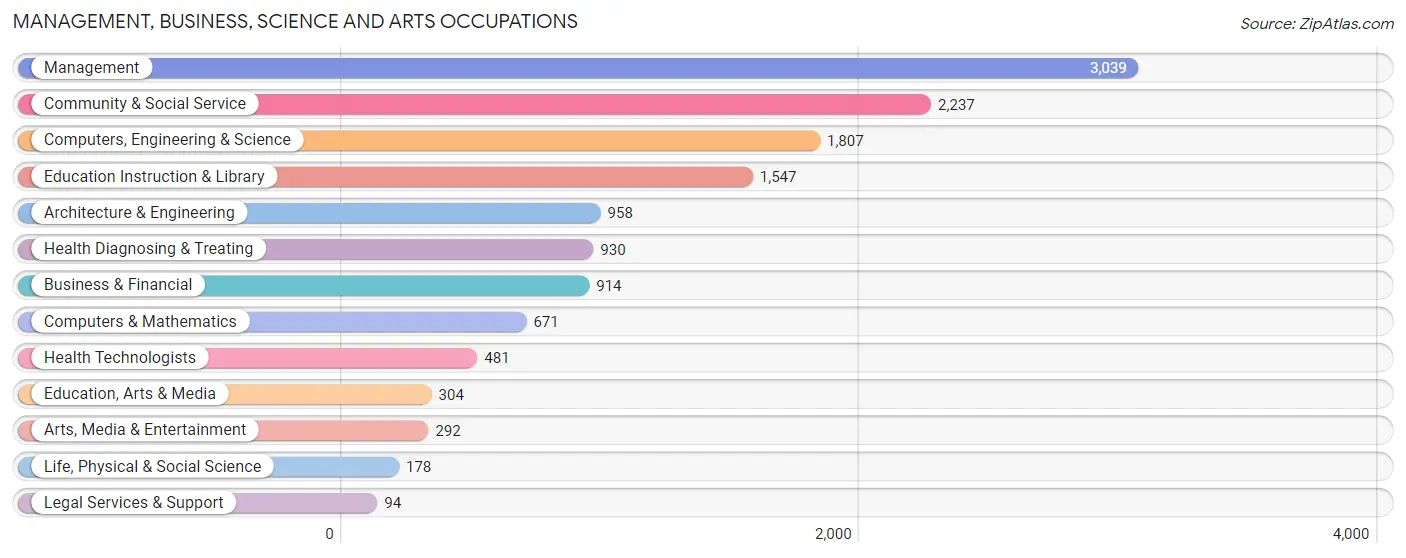
Management, Business, Science and Arts Occupations
The most common Management, Business, Science and Arts occupations in Box Elder County are Management (3,039 | 11.3%), Community & Social Service (2,237 | 8.3%), Computers, Engineering & Science (1,807 | 6.7%), Education Instruction & Library (1,547 | 5.7%), and Architecture & Engineering (958 | 3.5%).
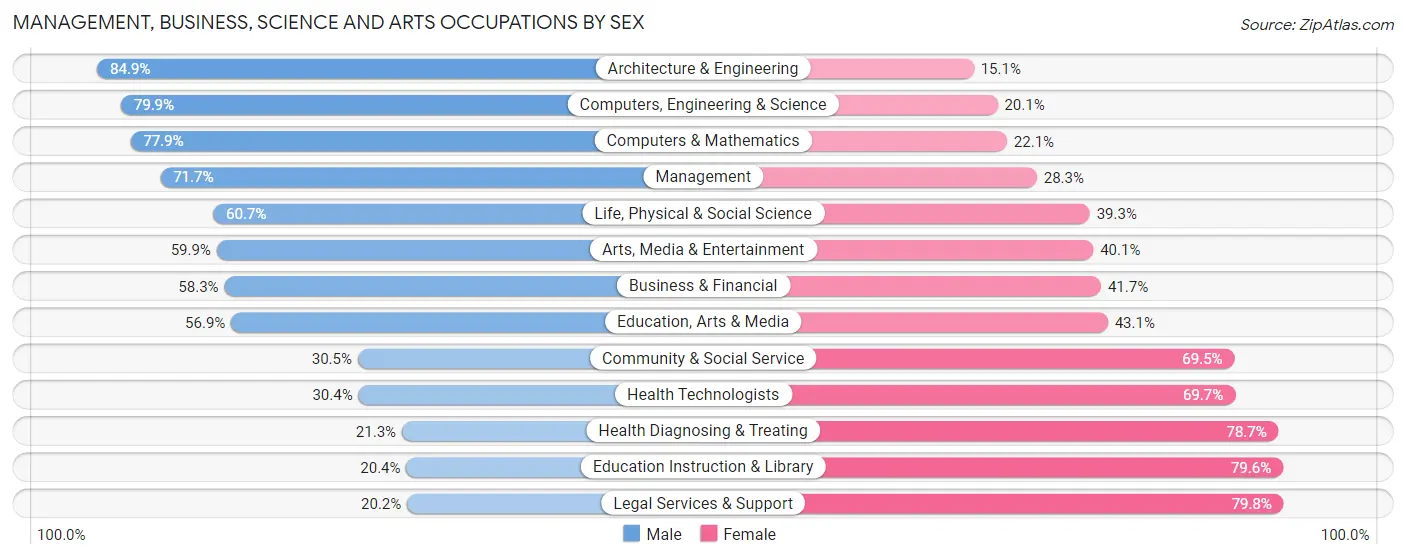
Management, Business, Science and Arts Occupations by Sex
Within the Management, Business, Science and Arts occupations in Box Elder County, the most male-oriented occupations are Architecture & Engineering (84.9%), Computers, Engineering & Science (79.9%), and Computers & Mathematics (77.9%), while the most female-oriented occupations are Legal Services & Support (79.8%), Education Instruction & Library (79.6%), and Health Diagnosing & Treating (78.7%).
| Occupation | Male | Female |
| Management | 2,179 (71.7%) | 860 (28.3%) |
| Business & Financial | 533 (58.3%) | 381 (41.7%) |
| Computers, Engineering & Science | 1,444 (79.9%) | 363 (20.1%) |
| Computers & Mathematics | 523 (77.9%) | 148 (22.1%) |
| Architecture & Engineering | 813 (84.9%) | 145 (15.1%) |
| Life, Physical & Social Science | 108 (60.7%) | 70 (39.3%) |
| Community & Social Service | 682 (30.5%) | 1,555 (69.5%) |
| Education, Arts & Media | 173 (56.9%) | 131 (43.1%) |
| Legal Services & Support | 19 (20.2%) | 75 (79.8%) |
| Education Instruction & Library | 315 (20.4%) | 1,232 (79.6%) |
| Arts, Media & Entertainment | 175 (59.9%) | 117 (40.1%) |
| Health Diagnosing & Treating | 198 (21.3%) | 732 (78.7%) |
| Health Technologists | 146 (30.3%) | 335 (69.7%) |
| Total (Category) | 5,036 (56.4%) | 3,891 (43.6%) |
| Total (Overall) | 15,853 (58.7%) | 11,140 (41.3%) |
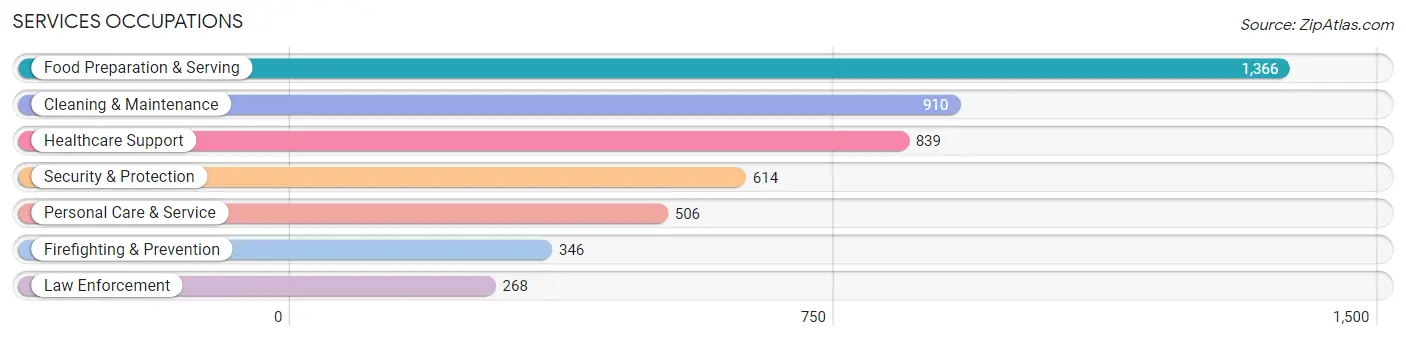
Services Occupations
The most common Services occupations in Box Elder County are Food Preparation & Serving (1,366 | 5.1%), Cleaning & Maintenance (910 | 3.4%), Healthcare Support (839 | 3.1%), Security & Protection (614 | 2.3%), and Personal Care & Service (506 | 1.9%).
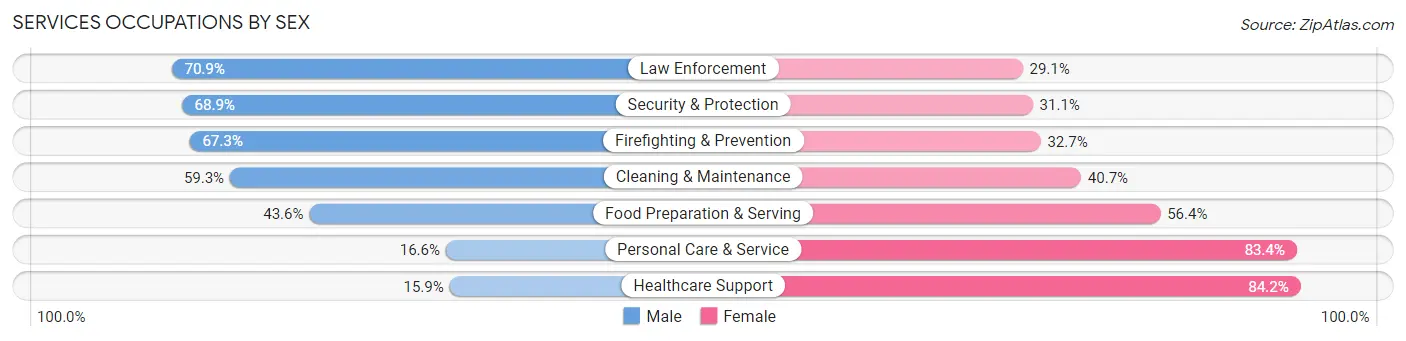
Services Occupations by Sex
Within the Services occupations in Box Elder County, the most male-oriented occupations are Law Enforcement (70.9%), Security & Protection (68.9%), and Firefighting & Prevention (67.3%), while the most female-oriented occupations are Healthcare Support (84.2%), Personal Care & Service (83.4%), and Food Preparation & Serving (56.4%).
| Occupation | Male | Female |
| Healthcare Support | 133 (15.9%) | 706 (84.2%) |
| Security & Protection | 423 (68.9%) | 191 (31.1%) |
| Firefighting & Prevention | 233 (67.3%) | 113 (32.7%) |
| Law Enforcement | 190 (70.9%) | 78 (29.1%) |
| Food Preparation & Serving | 596 (43.6%) | 770 (56.4%) |
| Cleaning & Maintenance | 540 (59.3%) | 370 (40.7%) |
| Personal Care & Service | 84 (16.6%) | 422 (83.4%) |
| Total (Category) | 1,776 (41.9%) | 2,459 (58.1%) |
| Total (Overall) | 15,853 (58.7%) | 11,140 (41.3%) |
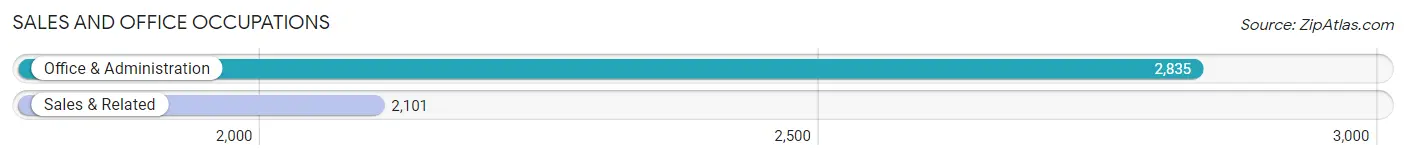
Sales and Office Occupations
The most common Sales and Office occupations in Box Elder County are Office & Administration (2,835 | 10.5%), and Sales & Related (2,101 | 7.8%).
Sales and Office Occupations by Sex
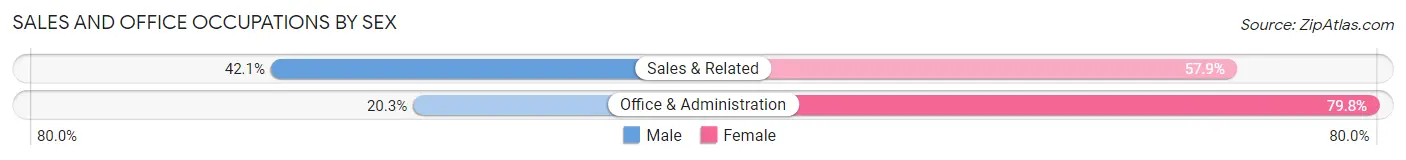
| Occupation | Male | Female |
| Sales & Related | 885 (42.1%) | 1,216 (57.9%) |
| Office & Administration | 574 (20.3%) | 2,261 (79.7%) |
| Total (Category) | 1,459 (29.6%) | 3,477 (70.4%) |
| Total (Overall) | 15,853 (58.7%) | 11,140 (41.3%) |
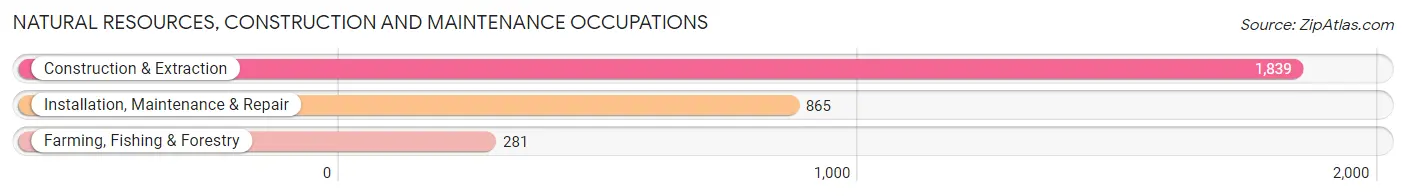
Natural Resources, Construction and Maintenance Occupations
The most common Natural Resources, Construction and Maintenance occupations in Box Elder County are Construction & Extraction (1,839 | 6.8%), Installation, Maintenance & Repair (865 | 3.2%), and Farming, Fishing & Forestry (281 | 1.0%).
Natural Resources, Construction and Maintenance Occupations by Sex
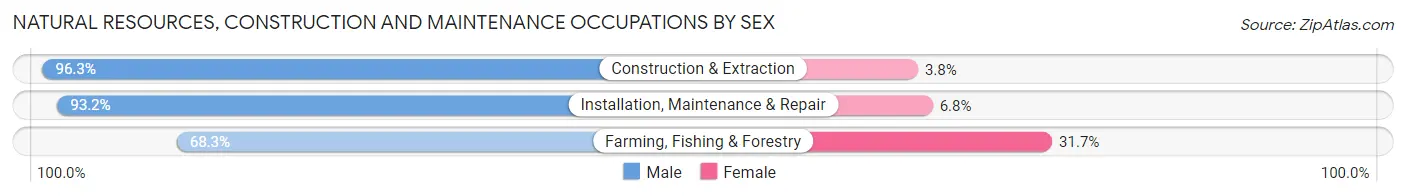
| Occupation | Male | Female |
| Farming, Fishing & Forestry | 192 (68.3%) | 89 (31.7%) |
| Construction & Extraction | 1,770 (96.3%) | 69 (3.7%) |
| Installation, Maintenance & Repair | 806 (93.2%) | 59 (6.8%) |
| Total (Category) | 2,768 (92.7%) | 217 (7.3%) |
| Total (Overall) | 15,853 (58.7%) | 11,140 (41.3%) |
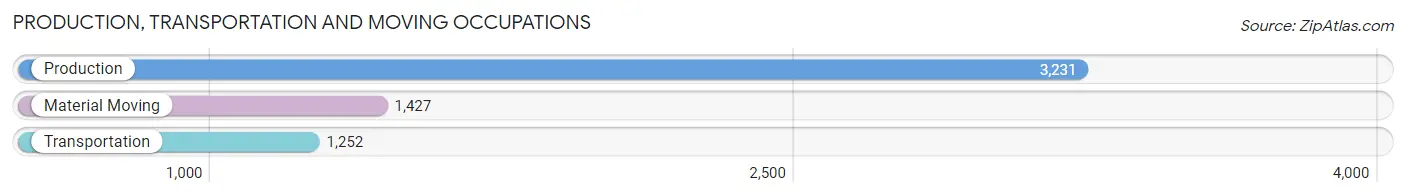
Production, Transportation and Moving Occupations
The most common Production, Transportation and Moving occupations in Box Elder County are Production (3,231 | 12.0%), Material Moving (1,427 | 5.3%), and Transportation (1,252 | 4.6%).
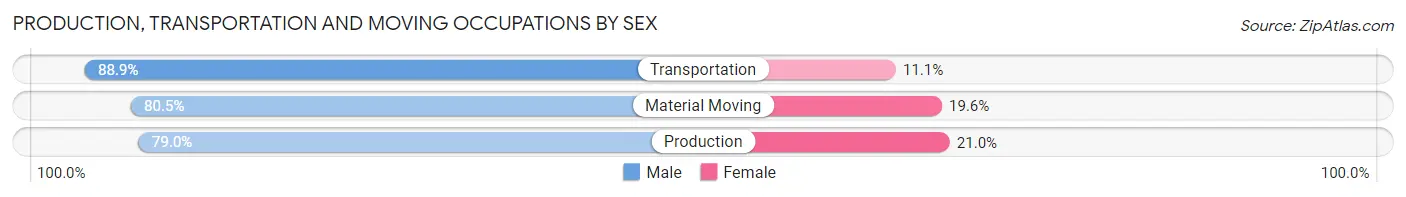
Production, Transportation and Moving Occupations by Sex
| Occupation | Male | Female |
| Production | 2,553 (79.0%) | 678 (21.0%) |
| Transportation | 1,113 (88.9%) | 139 (11.1%) |
| Material Moving | 1,148 (80.4%) | 279 (19.6%) |
| Total (Category) | 4,814 (81.5%) | 1,096 (18.5%) |
| Total (Overall) | 15,853 (58.7%) | 11,140 (41.3%) |
Employment Industries by Sex in Box Elder County
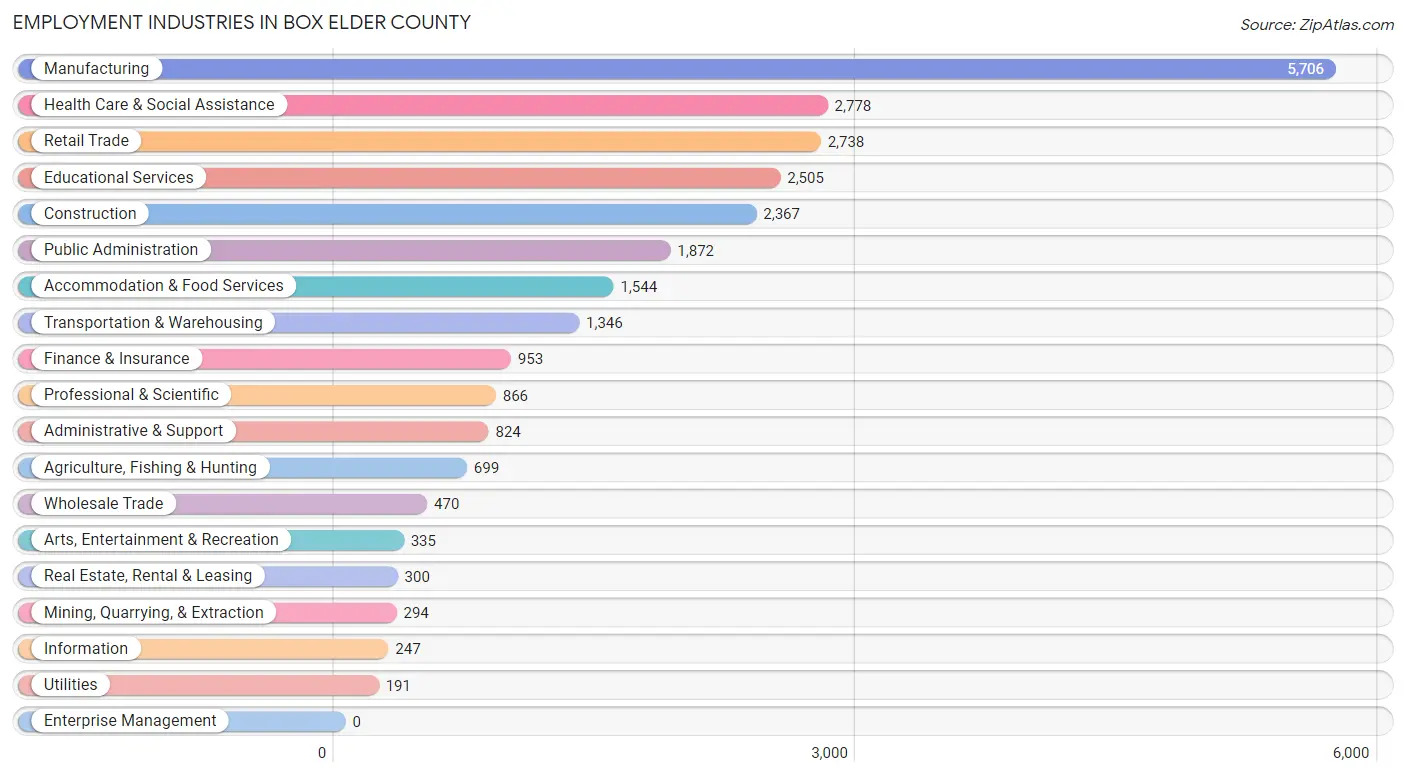
Employment Industries in Box Elder County
The major employment industries in Box Elder County include Manufacturing (5,706 | 21.1%), Health Care & Social Assistance (2,778 | 10.3%), Retail Trade (2,738 | 10.1%), Educational Services (2,505 | 9.3%), and Construction (2,367 | 8.8%).
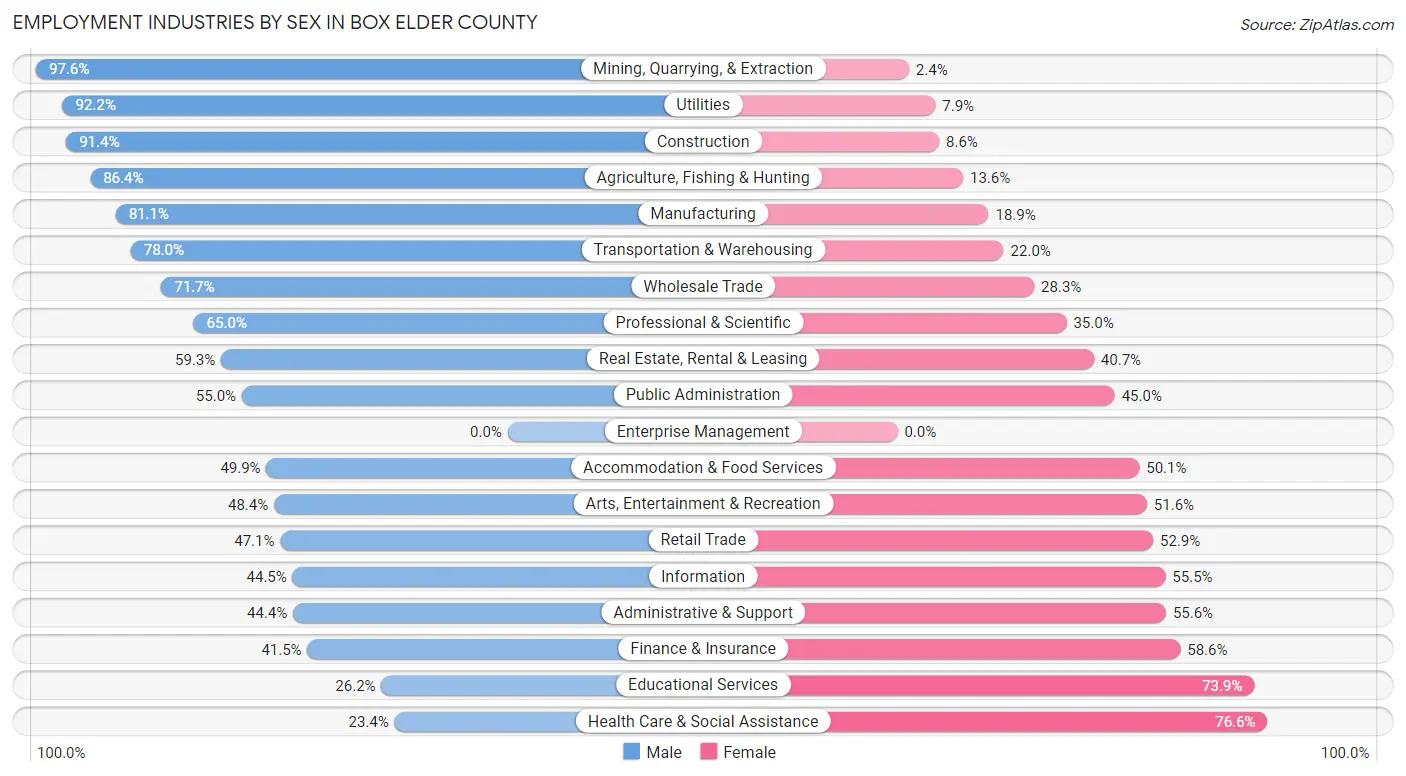
Employment Industries by Sex in Box Elder County
The Box Elder County industries that see more men than women are Mining, Quarrying, & Extraction (97.6%), Utilities (92.1%), and Construction (91.4%), whereas the industries that tend to have a higher number of women are Health Care & Social Assistance (76.6%), Educational Services (73.9%), and Finance & Insurance (58.6%).
| Industry | Male | Female |
| Agriculture, Fishing & Hunting | 604 (86.4%) | 95 (13.6%) |
| Mining, Quarrying, & Extraction | 287 (97.6%) | 7 (2.4%) |
| Construction | 2,163 (91.4%) | 204 (8.6%) |
| Manufacturing | 4,630 (81.1%) | 1,076 (18.9%) |
| Wholesale Trade | 337 (71.7%) | 133 (28.3%) |
| Retail Trade | 1,289 (47.1%) | 1,449 (52.9%) |
| Transportation & Warehousing | 1,050 (78.0%) | 296 (22.0%) |
| Utilities | 176 (92.1%) | 15 (7.9%) |
| Information | 110 (44.5%) | 137 (55.5%) |
| Finance & Insurance | 395 (41.4%) | 558 (58.6%) |
| Real Estate, Rental & Leasing | 178 (59.3%) | 122 (40.7%) |
| Professional & Scientific | 563 (65.0%) | 303 (35.0%) |
| Enterprise Management | 0 (0.0%) | 0 (0.0%) |
| Administrative & Support | 366 (44.4%) | 458 (55.6%) |
| Educational Services | 655 (26.2%) | 1,850 (73.9%) |
| Health Care & Social Assistance | 651 (23.4%) | 2,127 (76.6%) |
| Arts, Entertainment & Recreation | 162 (48.4%) | 173 (51.6%) |
| Accommodation & Food Services | 771 (49.9%) | 773 (50.1%) |
| Public Administration | 1,030 (55.0%) | 842 (45.0%) |
| Total | 15,853 (58.7%) | 11,140 (41.3%) |
Education in Box Elder County
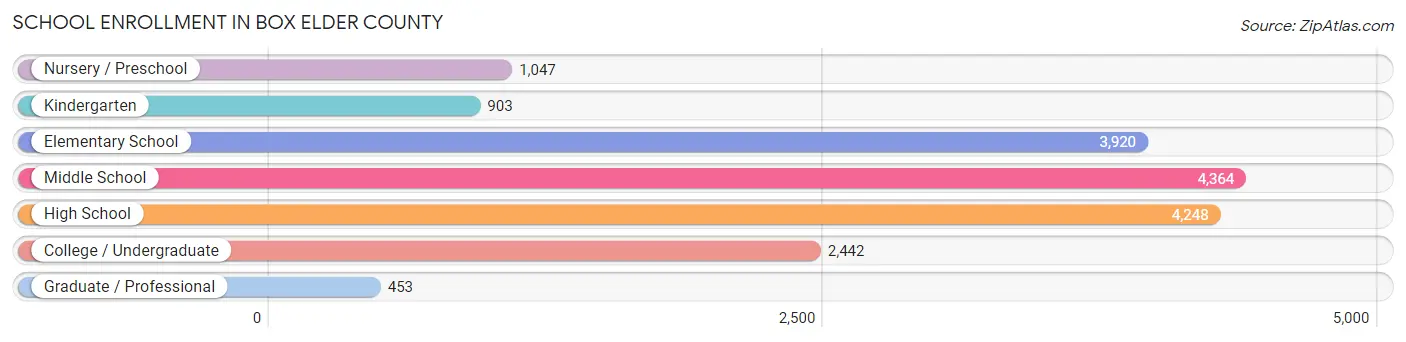
School Enrollment in Box Elder County
The most common levels of schooling among the 17,377 students in Box Elder County are middle school (4,364 | 25.1%), high school (4,248 | 24.4%), and elementary school (3,920 | 22.6%).
| School Level | # Students | % Students |
| Nursery / Preschool | 1,047 | 6.0% |
| Kindergarten | 903 | 5.2% |
| Elementary School | 3,920 | 22.6% |
| Middle School | 4,364 | 25.1% |
| High School | 4,248 | 24.4% |
| College / Undergraduate | 2,442 | 14.1% |
| Graduate / Professional | 453 | 2.6% |
| Total | 17,377 | 100.0% |
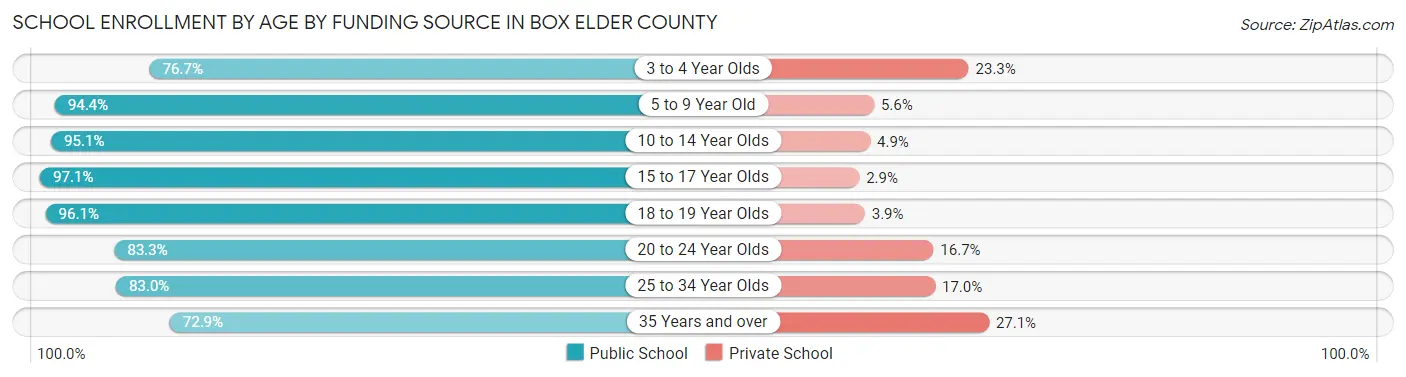
School Enrollment by Age by Funding Source in Box Elder County
Out of a total of 17,377 students who are enrolled in schools in Box Elder County, 1,355 (7.8%) attend a private institution, while the remaining 16,022 (92.2%) are enrolled in public schools. The age group of 35 years and over has the highest likelihood of being enrolled in private schools, with 240 (27.1% in the age bracket) enrolled. Conversely, the age group of 15 to 17 year olds has the lowest likelihood of being enrolled in a private school, with 3,060 (97.1% in the age bracket) attending a public institution.
| Age Bracket | Public School | Private School |
| 3 to 4 Year Olds | 554 (76.7%) | 168 (23.3%) |
| 5 to 9 Year Old | 4,336 (94.4%) | 259 (5.6%) |
| 10 to 14 Year Olds | 5,121 (95.1%) | 265 (4.9%) |
| 15 to 17 Year Olds | 3,060 (97.1%) | 91 (2.9%) |
| 18 to 19 Year Olds | 806 (96.1%) | 33 (3.9%) |
| 20 to 24 Year Olds | 792 (83.3%) | 159 (16.7%) |
| 25 to 34 Year Olds | 702 (83.0%) | 144 (17.0%) |
| 35 Years and over | 647 (72.9%) | 240 (27.1%) |
| Total | 16,022 (92.2%) | 1,355 (7.8%) |
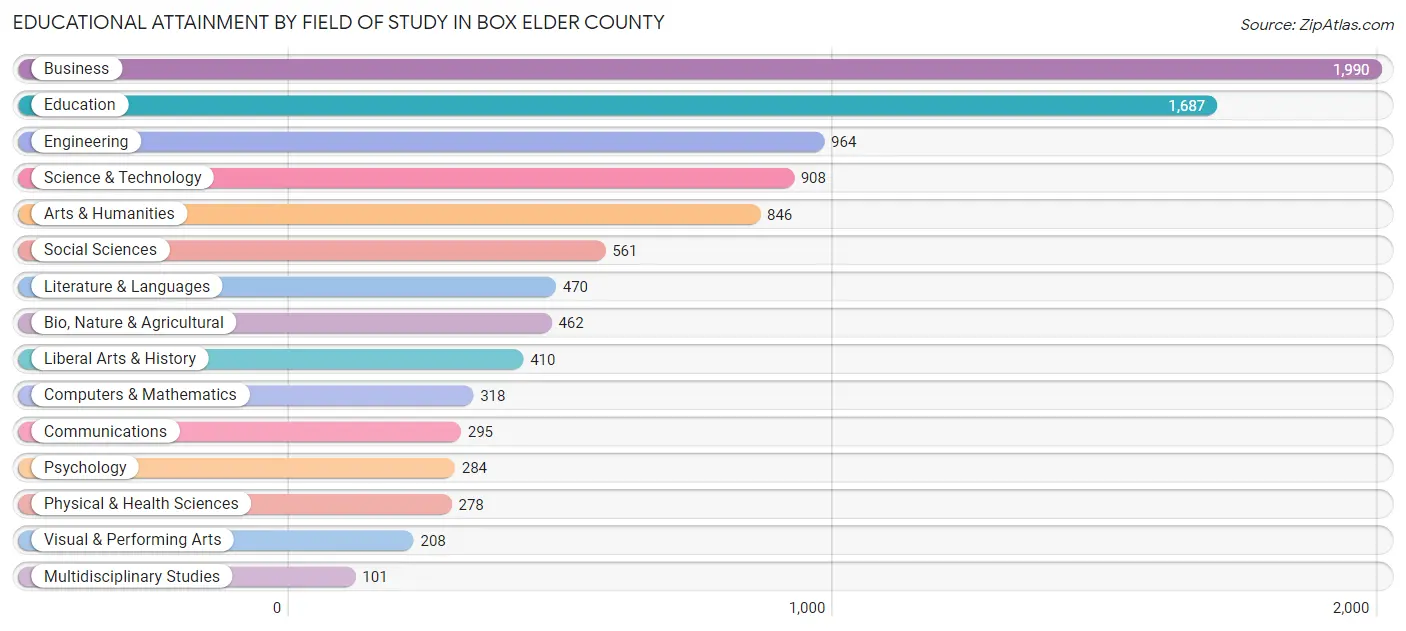
Educational Attainment by Field of Study in Box Elder County
Business (1,990 | 20.3%), education (1,687 | 17.2%), engineering (964 | 9.9%), science & technology (908 | 9.3%), and arts & humanities (846 | 8.6%) are the most common fields of study among 9,782 individuals in Box Elder County who have obtained a bachelor's degree or higher.
| Field of Study | # Graduates | % Graduates |
| Computers & Mathematics | 318 | 3.3% |
| Bio, Nature & Agricultural | 462 | 4.7% |
| Physical & Health Sciences | 278 | 2.8% |
| Psychology | 284 | 2.9% |
| Social Sciences | 561 | 5.7% |
| Engineering | 964 | 9.9% |
| Multidisciplinary Studies | 101 | 1.0% |
| Science & Technology | 908 | 9.3% |
| Business | 1,990 | 20.3% |
| Education | 1,687 | 17.2% |
| Literature & Languages | 470 | 4.8% |
| Liberal Arts & History | 410 | 4.2% |
| Visual & Performing Arts | 208 | 2.1% |
| Communications | 295 | 3.0% |
| Arts & Humanities | 846 | 8.6% |
| Total | 9,782 | 100.0% |
Transportation & Commute in Box Elder County
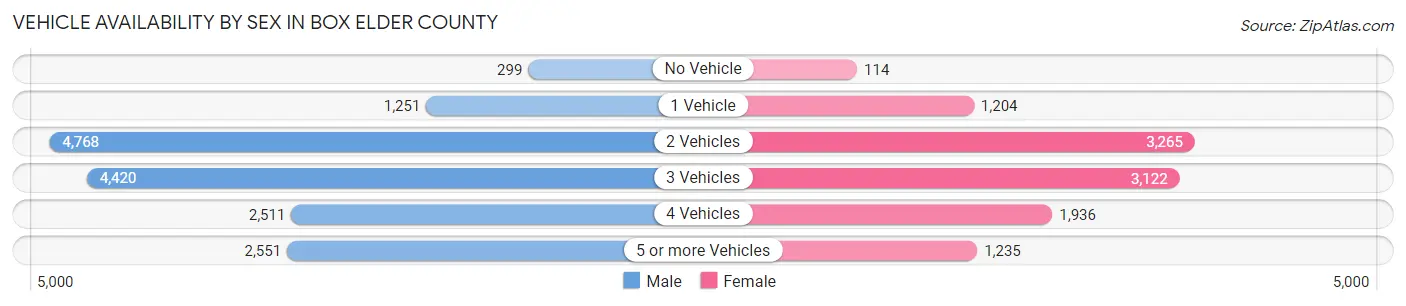
Vehicle Availability by Sex in Box Elder County
The most prevalent vehicle ownership categories in Box Elder County are males with 2 vehicles (4,768, accounting for 30.2%) and females with 2 vehicles (3,265, making up 43.8%).
| Vehicles Available | Male | Female |
| No Vehicle | 299 (1.9%) | 114 (1.1%) |
| 1 Vehicle | 1,251 (7.9%) | 1,204 (11.1%) |
| 2 Vehicles | 4,768 (30.2%) | 3,265 (30.0%) |
| 3 Vehicles | 4,420 (28.0%) | 3,122 (28.7%) |
| 4 Vehicles | 2,511 (15.9%) | 1,936 (17.8%) |
| 5 or more Vehicles | 2,551 (16.2%) | 1,235 (11.4%) |
| Total | 15,800 (100.0%) | 10,876 (100.0%) |
Commute Time in Box Elder County
The most frequently occuring commute durations in Box Elder County are 5 to 9 minutes (4,790 commuters, 19.9%), 10 to 14 minutes (3,526 commuters, 14.6%), and 30 to 34 minutes (3,235 commuters, 13.4%).
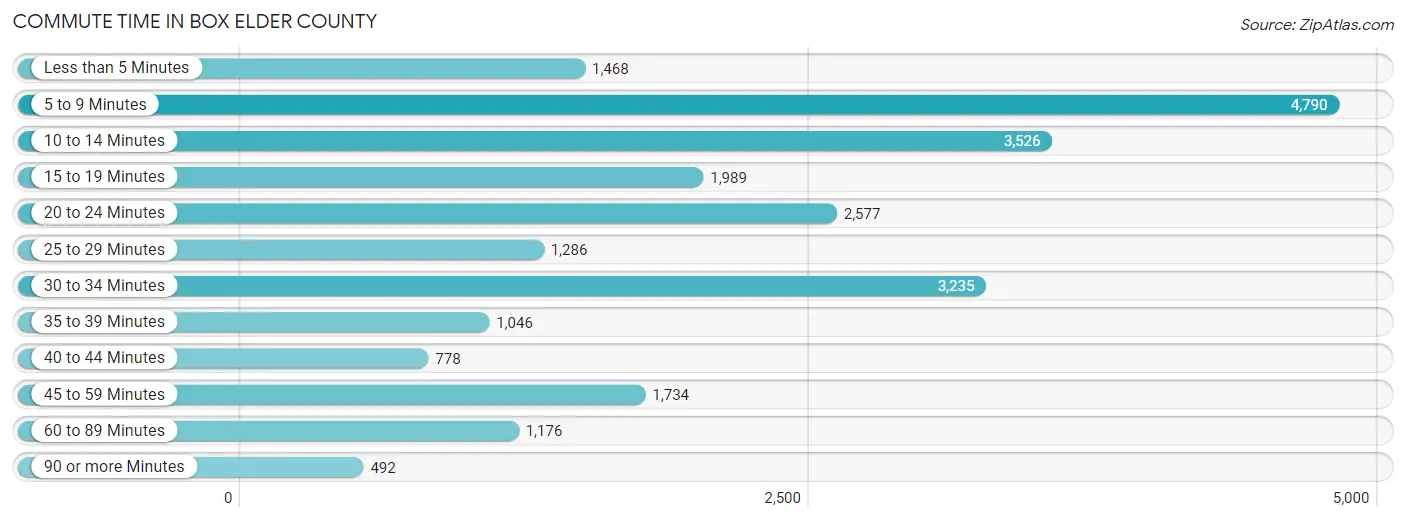
| Commute Time | # Commuters | % Commuters |
| Less than 5 Minutes | 1,468 | 6.1% |
| 5 to 9 Minutes | 4,790 | 19.9% |
| 10 to 14 Minutes | 3,526 | 14.6% |
| 15 to 19 Minutes | 1,989 | 8.3% |
| 20 to 24 Minutes | 2,577 | 10.7% |
| 25 to 29 Minutes | 1,286 | 5.3% |
| 30 to 34 Minutes | 3,235 | 13.4% |
| 35 to 39 Minutes | 1,046 | 4.3% |
| 40 to 44 Minutes | 778 | 3.2% |
| 45 to 59 Minutes | 1,734 | 7.2% |
| 60 to 89 Minutes | 1,176 | 4.9% |
| 90 or more Minutes | 492 | 2.0% |
Commute Time by Sex in Box Elder County
The most common commute times in Box Elder County are 5 to 9 minutes (2,297 commuters, 15.9%) for males and 5 to 9 minutes (2,493 commuters, 25.8%) for females.
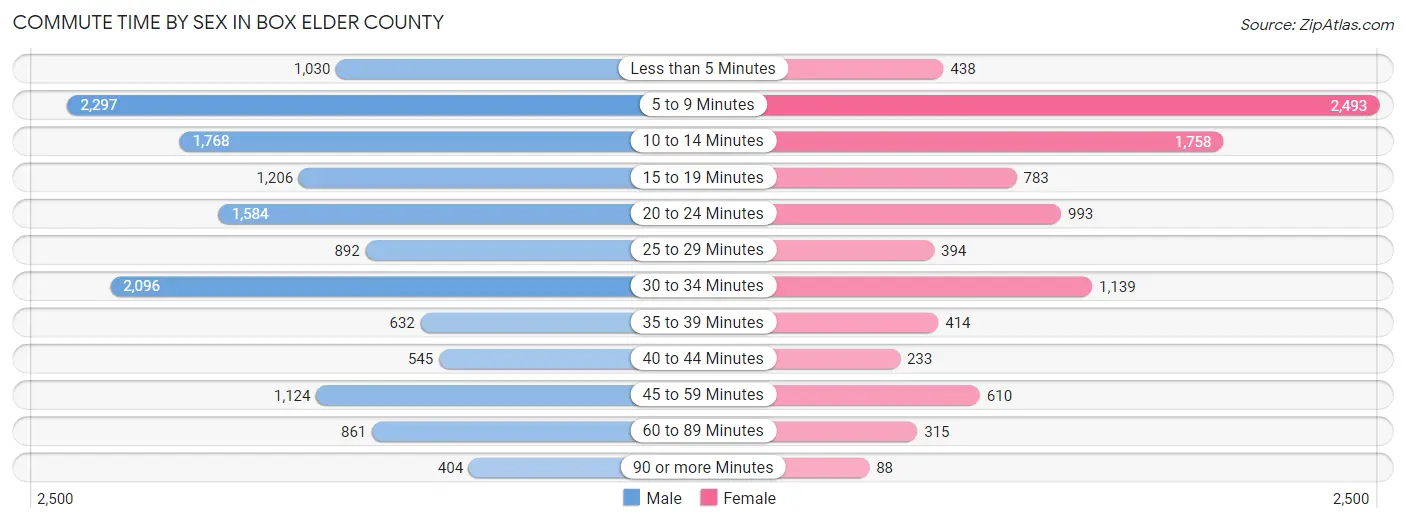
| Commute Time | Male | Female |
| Less than 5 Minutes | 1,030 (7.1%) | 438 (4.5%) |
| 5 to 9 Minutes | 2,297 (15.9%) | 2,493 (25.8%) |
| 10 to 14 Minutes | 1,768 (12.2%) | 1,758 (18.2%) |
| 15 to 19 Minutes | 1,206 (8.4%) | 783 (8.1%) |
| 20 to 24 Minutes | 1,584 (11.0%) | 993 (10.3%) |
| 25 to 29 Minutes | 892 (6.2%) | 394 (4.1%) |
| 30 to 34 Minutes | 2,096 (14.5%) | 1,139 (11.8%) |
| 35 to 39 Minutes | 632 (4.4%) | 414 (4.3%) |
| 40 to 44 Minutes | 545 (3.8%) | 233 (2.4%) |
| 45 to 59 Minutes | 1,124 (7.8%) | 610 (6.3%) |
| 60 to 89 Minutes | 861 (6.0%) | 315 (3.3%) |
| 90 or more Minutes | 404 (2.8%) | 88 (0.9%) |
Time of Departure to Work by Sex in Box Elder County
The most frequent times of departure to work in Box Elder County are 7:00 AM to 7:29 AM (1,899, 13.2%) for males and 7:30 AM to 7:59 AM (1,475, 15.3%) for females.
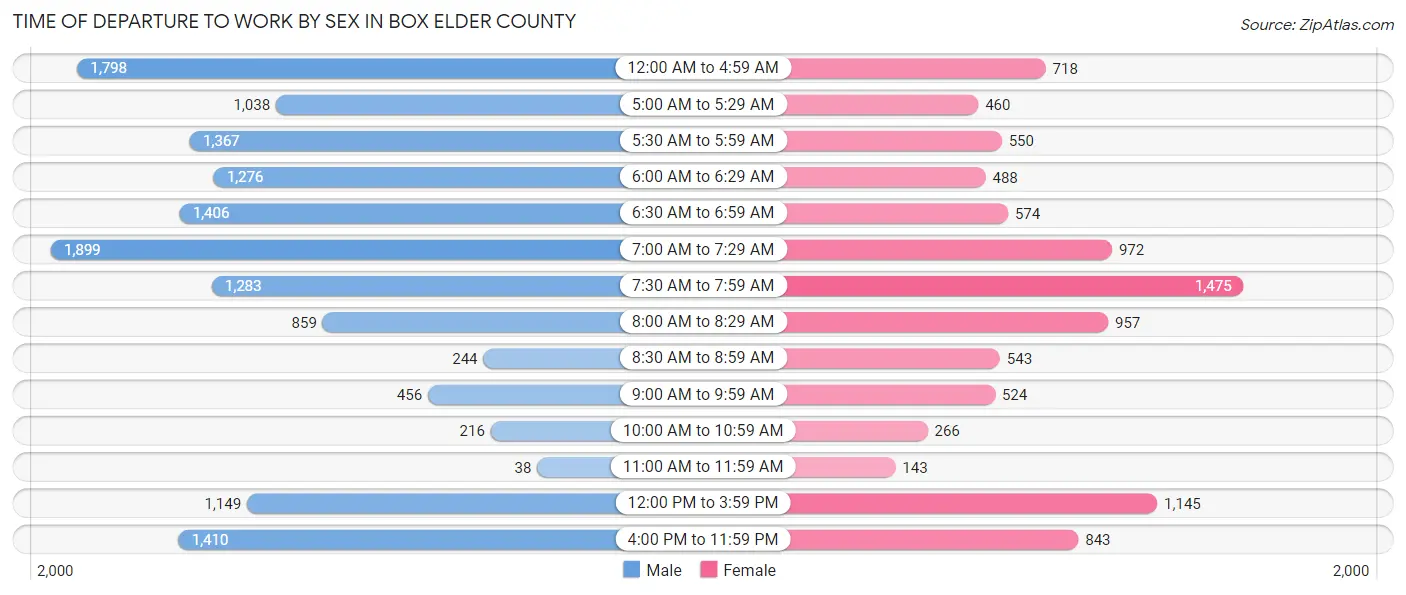
| Time of Departure | Male | Female |
| 12:00 AM to 4:59 AM | 1,798 (12.4%) | 718 (7.4%) |
| 5:00 AM to 5:29 AM | 1,038 (7.2%) | 460 (4.8%) |
| 5:30 AM to 5:59 AM | 1,367 (9.5%) | 550 (5.7%) |
| 6:00 AM to 6:29 AM | 1,276 (8.8%) | 488 (5.1%) |
| 6:30 AM to 6:59 AM | 1,406 (9.7%) | 574 (5.9%) |
| 7:00 AM to 7:29 AM | 1,899 (13.2%) | 972 (10.1%) |
| 7:30 AM to 7:59 AM | 1,283 (8.9%) | 1,475 (15.3%) |
| 8:00 AM to 8:29 AM | 859 (5.9%) | 957 (9.9%) |
| 8:30 AM to 8:59 AM | 244 (1.7%) | 543 (5.6%) |
| 9:00 AM to 9:59 AM | 456 (3.2%) | 524 (5.4%) |
| 10:00 AM to 10:59 AM | 216 (1.5%) | 266 (2.8%) |
| 11:00 AM to 11:59 AM | 38 (0.3%) | 143 (1.5%) |
| 12:00 PM to 3:59 PM | 1,149 (8.0%) | 1,145 (11.9%) |
| 4:00 PM to 11:59 PM | 1,410 (9.8%) | 843 (8.7%) |
| Total | 14,439 (100.0%) | 9,658 (100.0%) |
Housing Occupancy in Box Elder County
Occupancy by Ownership in Box Elder County
Of the total 18,557 dwellings in Box Elder County, owner-occupied units account for 14,116 (76.1%), while renter-occupied units make up 4,441 (23.9%).
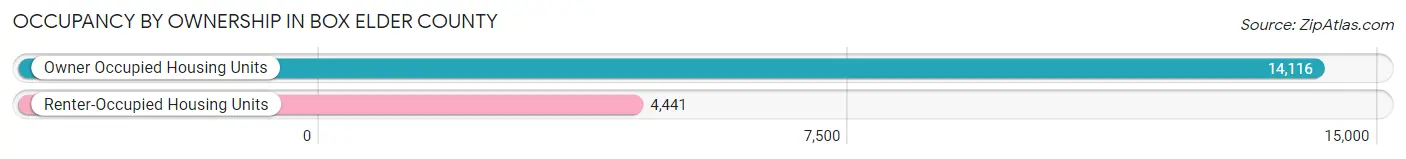
| Occupancy | # Housing Units | % Housing Units |
| Owner Occupied Housing Units | 14,116 | 76.1% |
| Renter-Occupied Housing Units | 4,441 | 23.9% |
| Total Occupied Housing Units | 18,557 | 100.0% |
Occupancy by Household Size in Box Elder County
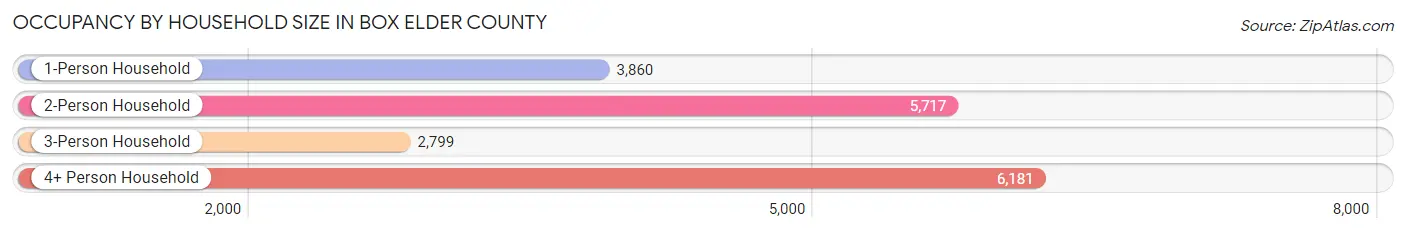
| Household Size | # Housing Units | % Housing Units |
| 1-Person Household | 3,860 | 20.8% |
| 2-Person Household | 5,717 | 30.8% |
| 3-Person Household | 2,799 | 15.1% |
| 4+ Person Household | 6,181 | 33.3% |
| Total Housing Units | 18,557 | 100.0% |
Occupancy by Ownership by Household Size in Box Elder County
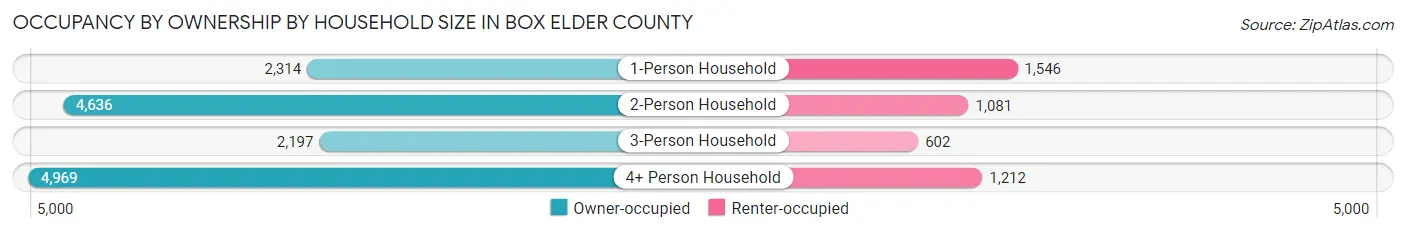
| Household Size | Owner-occupied | Renter-occupied |
| 1-Person Household | 2,314 (60.0%) | 1,546 (40.1%) |
| 2-Person Household | 4,636 (81.1%) | 1,081 (18.9%) |
| 3-Person Household | 2,197 (78.5%) | 602 (21.5%) |
| 4+ Person Household | 4,969 (80.4%) | 1,212 (19.6%) |
| Total Housing Units | 14,116 (76.1%) | 4,441 (23.9%) |
Occupancy by Educational Attainment in Box Elder County
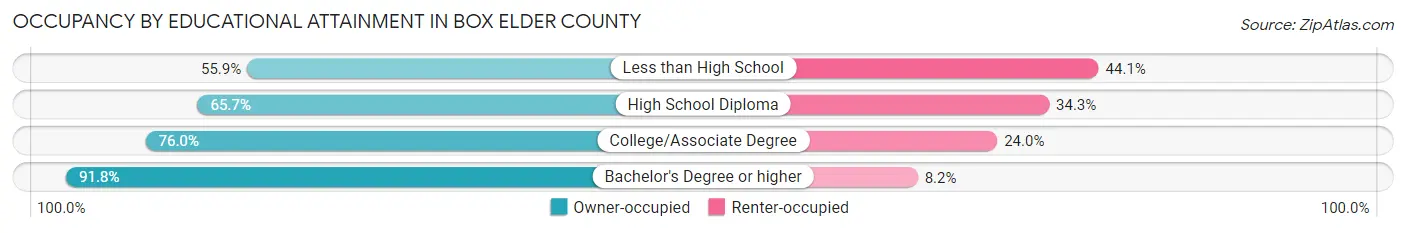
| Household Size | Owner-occupied | Renter-occupied |
| Less than High School | 593 (55.9%) | 468 (44.1%) |
| High School Diploma | 3,664 (65.7%) | 1,912 (34.3%) |
| College/Associate Degree | 5,203 (76.0%) | 1,643 (24.0%) |
| Bachelor's Degree or higher | 4,656 (91.8%) | 418 (8.2%) |
Occupancy by Age of Householder in Box Elder County
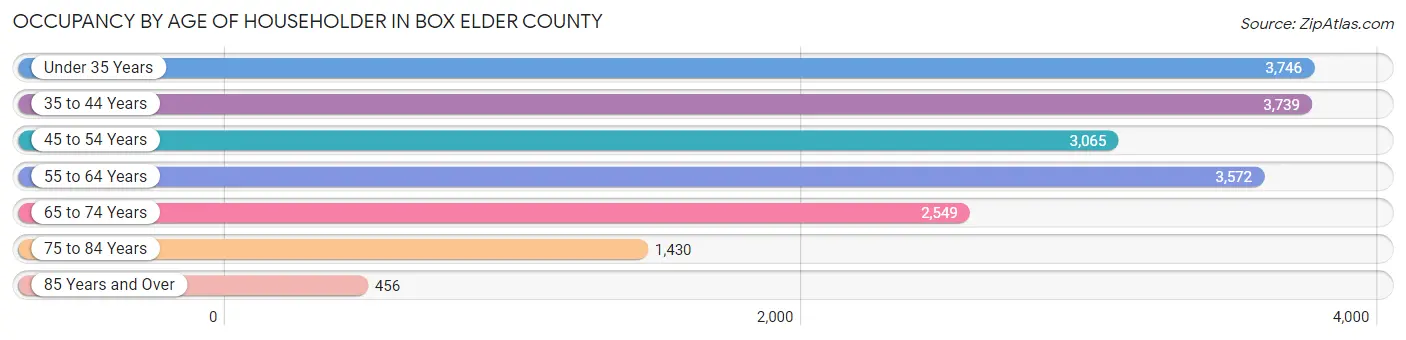
| Age Bracket | # Households | % Households |
| Under 35 Years | 3,746 | 20.2% |
| 35 to 44 Years | 3,739 | 20.2% |
| 45 to 54 Years | 3,065 | 16.5% |
| 55 to 64 Years | 3,572 | 19.3% |
| 65 to 74 Years | 2,549 | 13.7% |
| 75 to 84 Years | 1,430 | 7.7% |
| 85 Years and Over | 456 | 2.5% |
| Total | 18,557 | 100.0% |
Housing Finances in Box Elder County
Median Income by Occupancy in Box Elder County
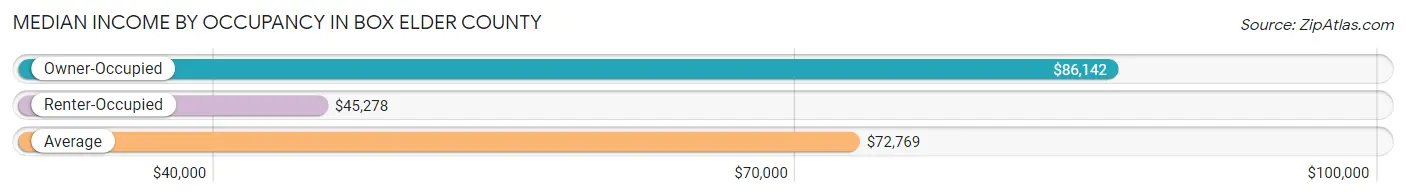
| Occupancy Type | # Households | Median Income |
| Owner-Occupied | 14,116 (76.1%) | $86,142 |
| Renter-Occupied | 4,441 (23.9%) | $45,278 |
| Average | 18,557 (100.0%) | $72,769 |
Occupancy by Householder Income Bracket in Box Elder County
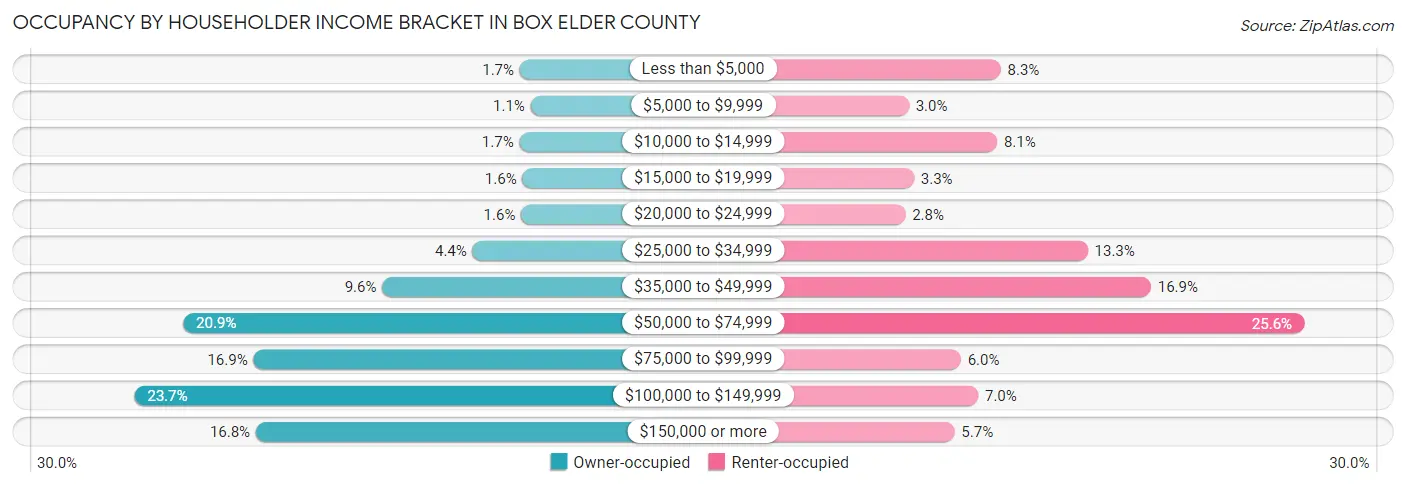
| Income Bracket | Owner-occupied | Renter-occupied |
| Less than $5,000 | 240 (1.7%) | 368 (8.3%) |
| $5,000 to $9,999 | 152 (1.1%) | 135 (3.0%) |
| $10,000 to $14,999 | 243 (1.7%) | 359 (8.1%) |
| $15,000 to $19,999 | 219 (1.5%) | 148 (3.3%) |
| $20,000 to $24,999 | 229 (1.6%) | 126 (2.8%) |
| $25,000 to $34,999 | 621 (4.4%) | 589 (13.3%) |
| $35,000 to $49,999 | 1,350 (9.6%) | 749 (16.9%) |
| $50,000 to $74,999 | 2,956 (20.9%) | 1,138 (25.6%) |
| $75,000 to $99,999 | 2,388 (16.9%) | 267 (6.0%) |
| $100,000 to $149,999 | 3,350 (23.7%) | 311 (7.0%) |
| $150,000 or more | 2,368 (16.8%) | 251 (5.7%) |
| Total | 14,116 (100.0%) | 4,441 (100.0%) |
Monthly Housing Cost Tiers in Box Elder County
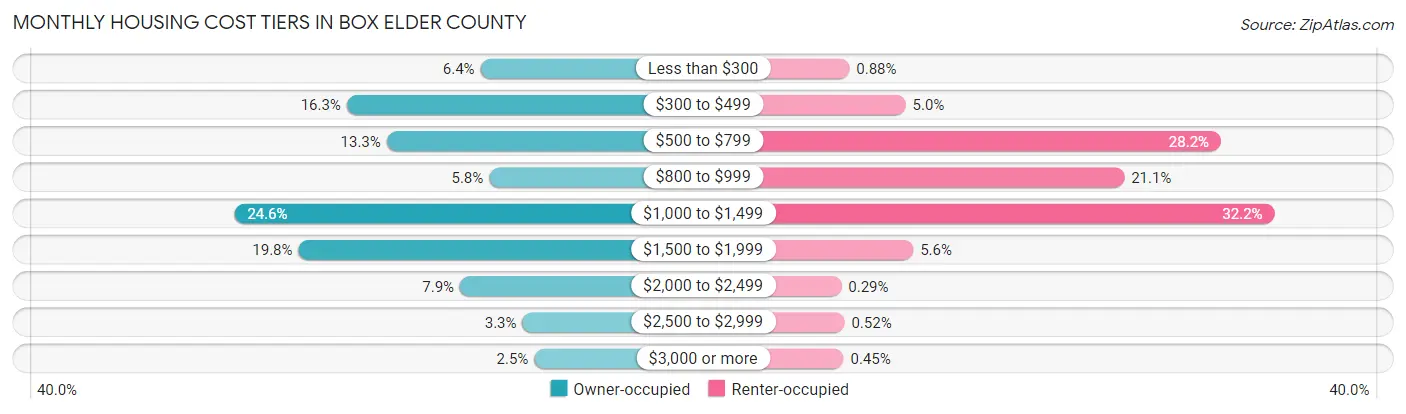
| Monthly Cost | Owner-occupied | Renter-occupied |
| Less than $300 | 908 (6.4%) | 39 (0.9%) |
| $300 to $499 | 2,298 (16.3%) | 223 (5.0%) |
| $500 to $799 | 1,883 (13.3%) | 1,254 (28.2%) |
| $800 to $999 | 818 (5.8%) | 938 (21.1%) |
| $1,000 to $1,499 | 3,467 (24.6%) | 1,429 (32.2%) |
| $1,500 to $1,999 | 2,800 (19.8%) | 248 (5.6%) |
| $2,000 to $2,499 | 1,121 (7.9%) | 13 (0.3%) |
| $2,500 to $2,999 | 472 (3.3%) | 23 (0.5%) |
| $3,000 or more | 349 (2.5%) | 20 (0.4%) |
| Total | 14,116 (100.0%) | 4,441 (100.0%) |
Physical Housing Characteristics in Box Elder County
Housing Structures in Box Elder County
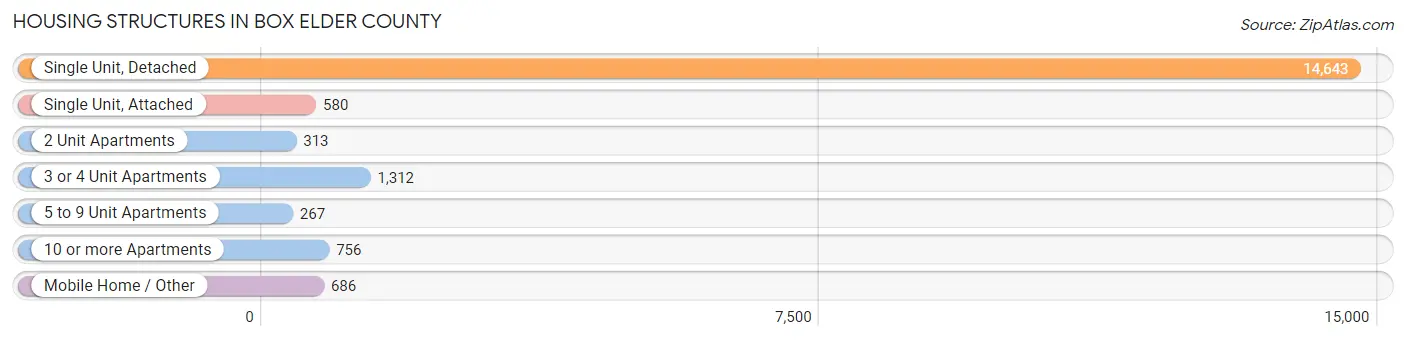
| Structure Type | # Housing Units | % Housing Units |
| Single Unit, Detached | 14,643 | 78.9% |
| Single Unit, Attached | 580 | 3.1% |
| 2 Unit Apartments | 313 | 1.7% |
| 3 or 4 Unit Apartments | 1,312 | 7.1% |
| 5 to 9 Unit Apartments | 267 | 1.4% |
| 10 or more Apartments | 756 | 4.1% |
| Mobile Home / Other | 686 | 3.7% |
| Total | 18,557 | 100.0% |
Housing Structures by Occupancy in Box Elder County
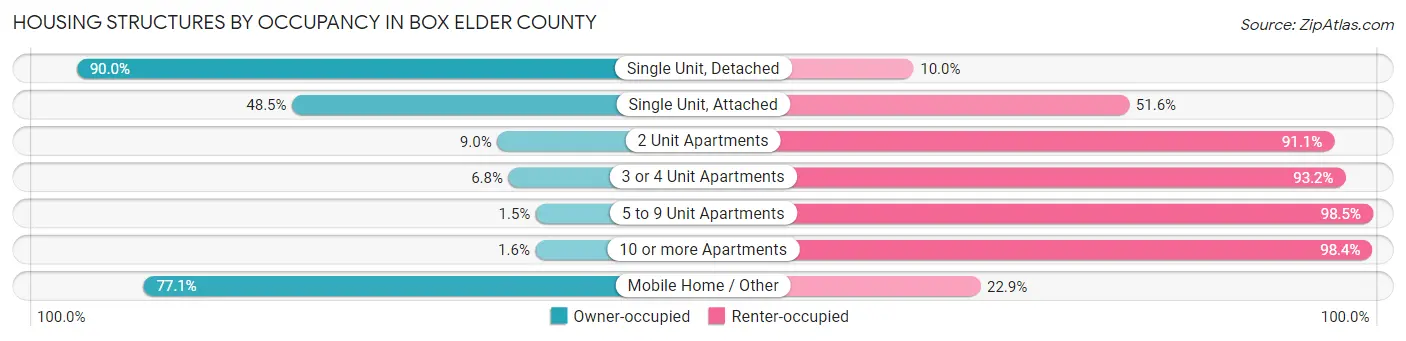
| Structure Type | Owner-occupied | Renter-occupied |
| Single Unit, Detached | 13,173 (90.0%) | 1,470 (10.0%) |
| Single Unit, Attached | 281 (48.4%) | 299 (51.5%) |
| 2 Unit Apartments | 28 (8.9%) | 285 (91.0%) |
| 3 or 4 Unit Apartments | 89 (6.8%) | 1,223 (93.2%) |
| 5 to 9 Unit Apartments | 4 (1.5%) | 263 (98.5%) |
| 10 or more Apartments | 12 (1.6%) | 744 (98.4%) |
| Mobile Home / Other | 529 (77.1%) | 157 (22.9%) |
| Total | 14,116 (76.1%) | 4,441 (23.9%) |
Housing Structures by Number of Rooms in Box Elder County
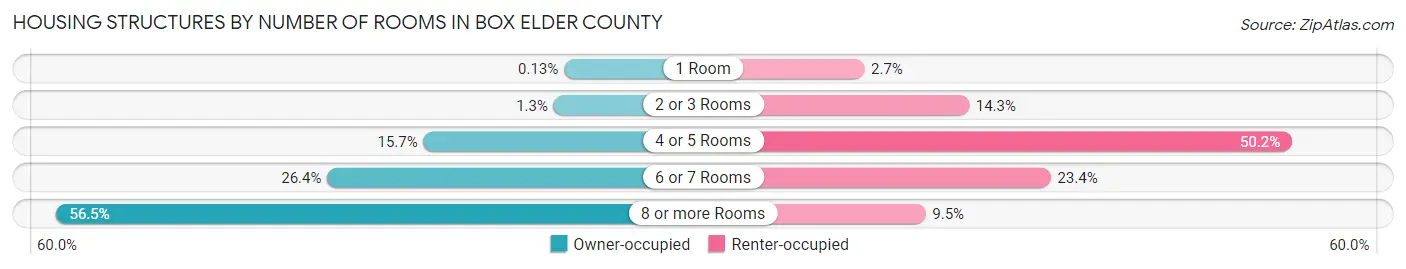
| Number of Rooms | Owner-occupied | Renter-occupied |
| 1 Room | 18 (0.1%) | 119 (2.7%) |
| 2 or 3 Rooms | 179 (1.3%) | 635 (14.3%) |
| 4 or 5 Rooms | 2,219 (15.7%) | 2,228 (50.2%) |
| 6 or 7 Rooms | 3,728 (26.4%) | 1,038 (23.4%) |
| 8 or more Rooms | 7,972 (56.5%) | 421 (9.5%) |
| Total | 14,116 (100.0%) | 4,441 (100.0%) |
Housing Structure by Heating Type in Box Elder County
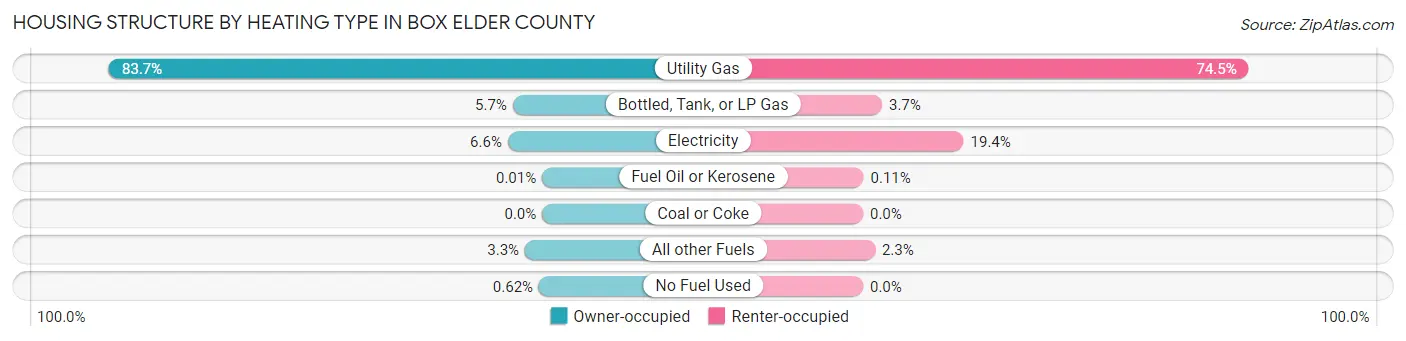
| Heating Type | Owner-occupied | Renter-occupied |
| Utility Gas | 11,817 (83.7%) | 3,308 (74.5%) |
| Bottled, Tank, or LP Gas | 802 (5.7%) | 163 (3.7%) |
| Electricity | 938 (6.6%) | 863 (19.4%) |
| Fuel Oil or Kerosene | 2 (0.0%) | 5 (0.1%) |
| Coal or Coke | 0 (0.0%) | 0 (0.0%) |
| All other Fuels | 469 (3.3%) | 102 (2.3%) |
| No Fuel Used | 88 (0.6%) | 0 (0.0%) |
| Total | 14,116 (100.0%) | 4,441 (100.0%) |
Household Vehicle Usage in Box Elder County
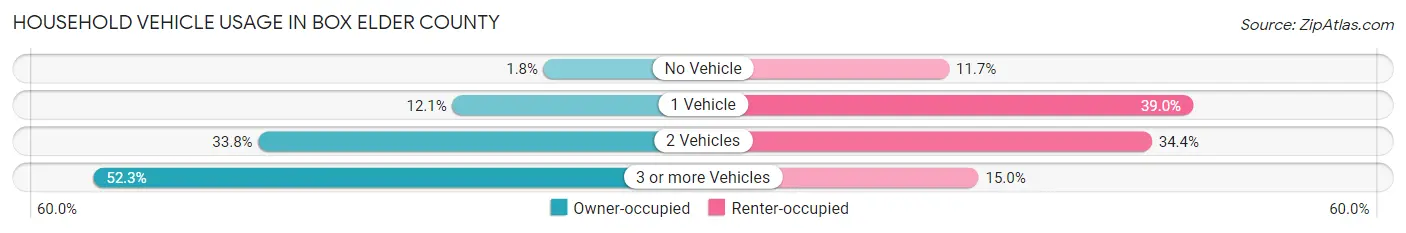
| Vehicles per Household | Owner-occupied | Renter-occupied |
| No Vehicle | 259 (1.8%) | 518 (11.7%) |
| 1 Vehicle | 1,703 (12.1%) | 1,731 (39.0%) |
| 2 Vehicles | 4,772 (33.8%) | 1,527 (34.4%) |
| 3 or more Vehicles | 7,382 (52.3%) | 665 (15.0%) |
| Total | 14,116 (100.0%) | 4,441 (100.0%) |
Real Estate & Mortgages in Box Elder County
Real Estate and Mortgage Overview in Box Elder County
| Characteristic | Without Mortgage | With Mortgage |
| Housing Units | 4,883 | 9,233 |
| Median Property Value | $289,600 | $318,000 |
| Median Household Income | $71,112 | $1,732 |
| Monthly Housing Costs | $449 | $349 |
| Real Estate Taxes | $1,627 | $84 |
Property Value by Mortgage Status in Box Elder County
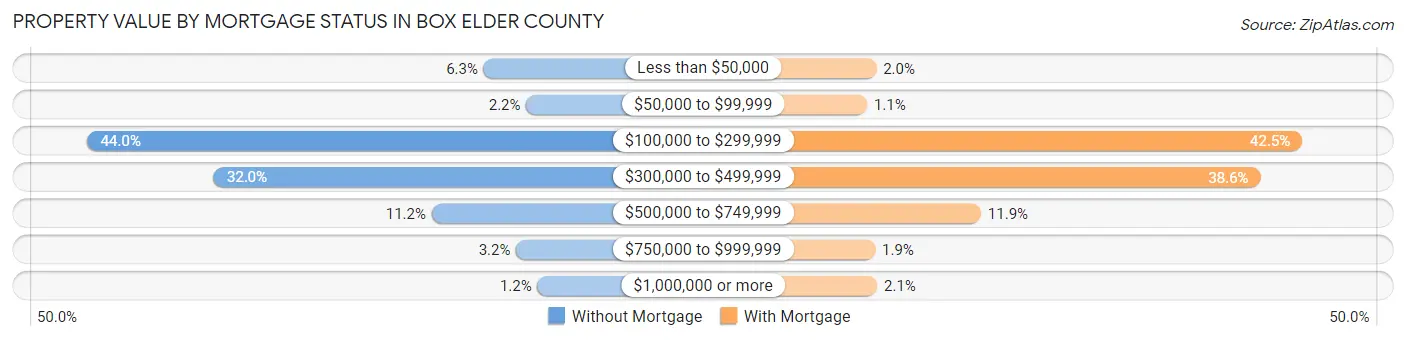
| Property Value | Without Mortgage | With Mortgage |
| Less than $50,000 | 306 (6.3%) | 182 (2.0%) |
| $50,000 to $99,999 | 108 (2.2%) | 101 (1.1%) |
| $100,000 to $299,999 | 2,149 (44.0%) | 3,927 (42.5%) |
| $300,000 to $499,999 | 1,561 (32.0%) | 3,560 (38.6%) |
| $500,000 to $749,999 | 548 (11.2%) | 1,102 (11.9%) |
| $750,000 to $999,999 | 155 (3.2%) | 172 (1.9%) |
| $1,000,000 or more | 56 (1.1%) | 189 (2.1%) |
| Total | 4,883 (100.0%) | 9,233 (100.0%) |
Household Income by Mortgage Status in Box Elder County
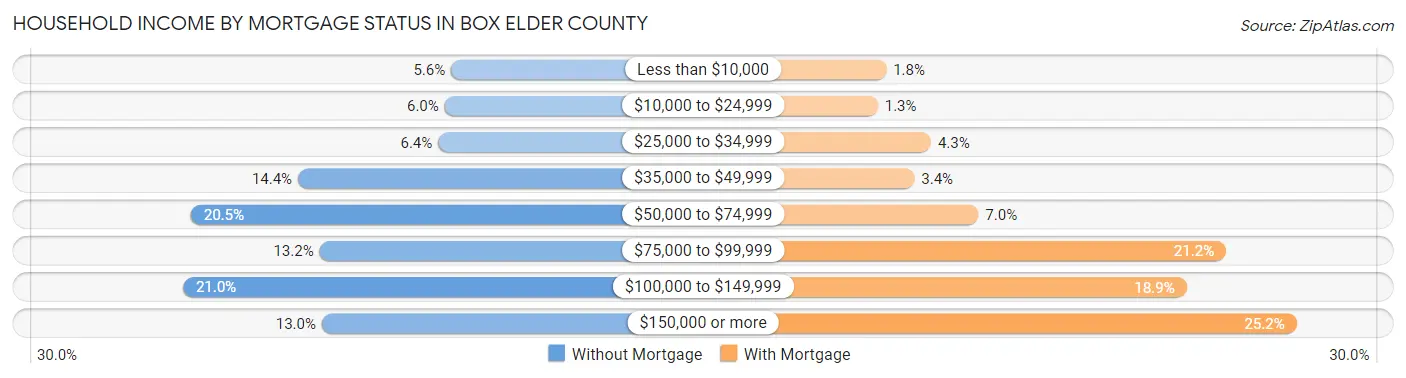
| Household Income | Without Mortgage | With Mortgage |
| Less than $10,000 | 275 (5.6%) | 162 (1.8%) |
| $10,000 to $24,999 | 293 (6.0%) | 117 (1.3%) |
| $25,000 to $34,999 | 311 (6.4%) | 398 (4.3%) |
| $35,000 to $49,999 | 702 (14.4%) | 310 (3.4%) |
| $50,000 to $74,999 | 1,001 (20.5%) | 648 (7.0%) |
| $75,000 to $99,999 | 642 (13.2%) | 1,955 (21.2%) |
| $100,000 to $149,999 | 1,023 (20.9%) | 1,746 (18.9%) |
| $150,000 or more | 636 (13.0%) | 2,327 (25.2%) |
| Total | 4,883 (100.0%) | 9,233 (100.0%) |
Property Value to Household Income Ratio in Box Elder County
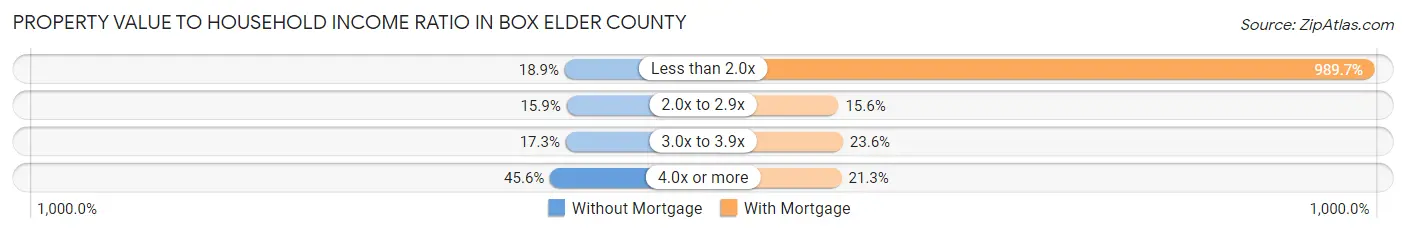
| Value-to-Income Ratio | Without Mortgage | With Mortgage |
| Less than 2.0x | 923 (18.9%) | 91,381 (989.7%) |
| 2.0x to 2.9x | 775 (15.9%) | 1,439 (15.6%) |
| 3.0x to 3.9x | 843 (17.3%) | 2,179 (23.6%) |
| 4.0x or more | 2,225 (45.6%) | 1,962 (21.2%) |
| Total | 4,883 (100.0%) | 9,233 (100.0%) |
Real Estate Taxes by Mortgage Status in Box Elder County
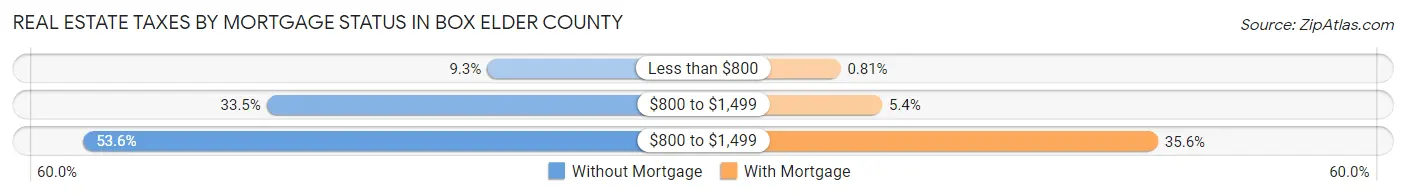
| Property Taxes | Without Mortgage | With Mortgage |
| Less than $800 | 455 (9.3%) | 75 (0.8%) |
| $800 to $1,499 | 1,635 (33.5%) | 496 (5.4%) |
| $800 to $1,499 | 2,616 (53.6%) | 3,287 (35.6%) |
| Total | 4,883 (100.0%) | 9,233 (100.0%) |
Health & Disability in Box Elder County
Health Insurance Coverage by Age in Box Elder County
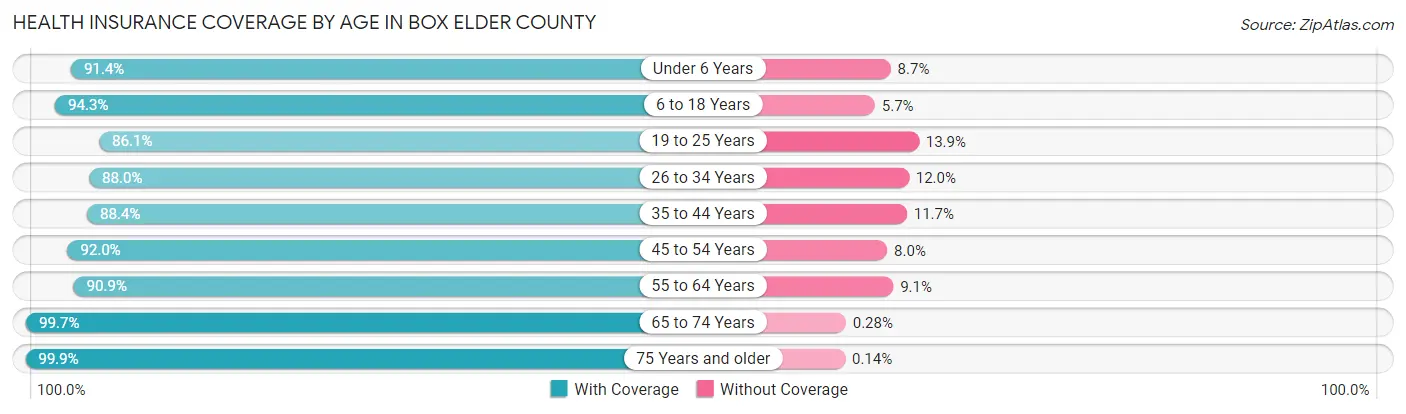
| Age Bracket | With Coverage | Without Coverage |
| Under 6 Years | 4,877 (91.3%) | 462 (8.6%) |
| 6 to 18 Years | 12,835 (94.3%) | 775 (5.7%) |
| 19 to 25 Years | 4,427 (86.1%) | 714 (13.9%) |
| 26 to 34 Years | 5,684 (88.0%) | 777 (12.0%) |
| 35 to 44 Years | 6,924 (88.3%) | 913 (11.7%) |
| 45 to 54 Years | 5,616 (92.0%) | 488 (8.0%) |
| 55 to 64 Years | 5,605 (90.9%) | 563 (9.1%) |
| 65 to 74 Years | 4,319 (99.7%) | 12 (0.3%) |
| 75 Years and older | 2,919 (99.9%) | 4 (0.1%) |
| Total | 53,206 (91.9%) | 4,708 (8.1%) |
Health Insurance Coverage by Citizenship Status in Box Elder County
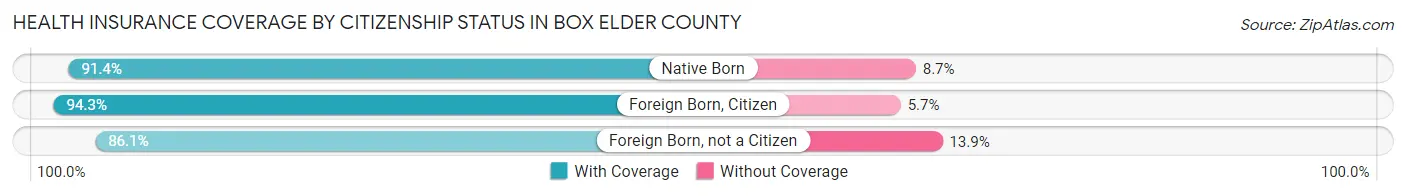
| Citizenship Status | With Coverage | Without Coverage |
| Native Born | 4,877 (91.3%) | 462 (8.6%) |
| Foreign Born, Citizen | 12,835 (94.3%) | 775 (5.7%) |
| Foreign Born, not a Citizen | 4,427 (86.1%) | 714 (13.9%) |
Health Insurance Coverage by Household Income in Box Elder County
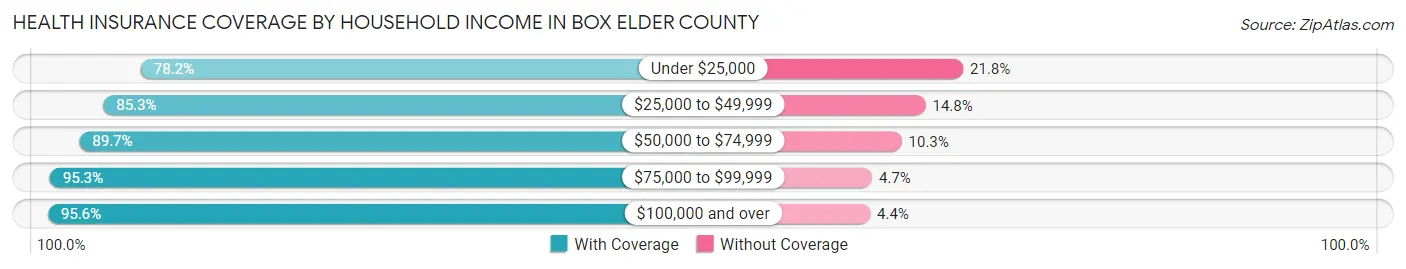
| Household Income | With Coverage | Without Coverage |
| Under $25,000 | 2,696 (78.2%) | 751 (21.8%) |
| $25,000 to $49,999 | 6,595 (85.3%) | 1,141 (14.7%) |
| $50,000 to $74,999 | 11,133 (89.7%) | 1,274 (10.3%) |
| $75,000 to $99,999 | 8,714 (95.3%) | 434 (4.7%) |
| $100,000 and over | 24,033 (95.6%) | 1,095 (4.4%) |
Public vs Private Health Insurance Coverage by Age in Box Elder County
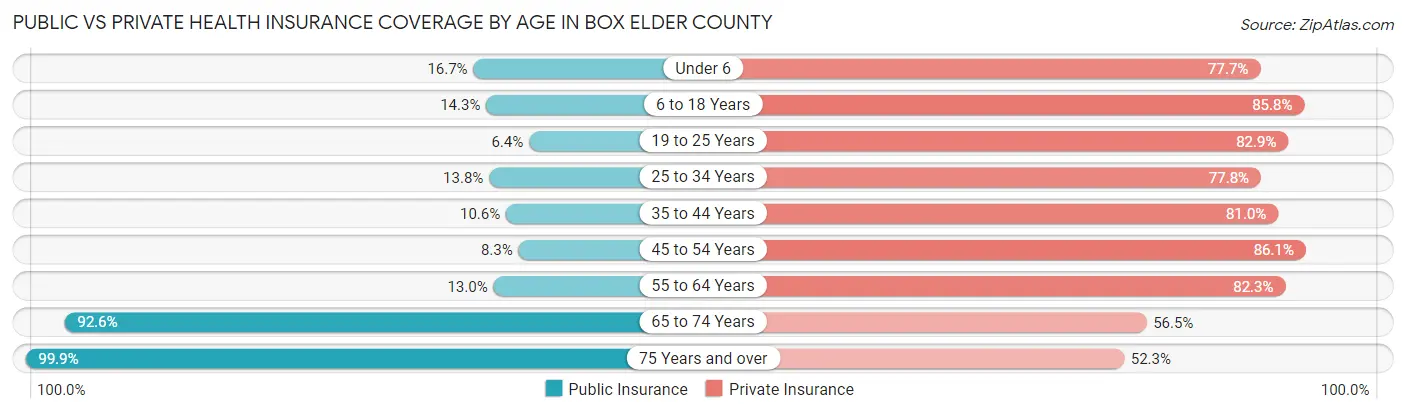
| Age Bracket | Public Insurance | Private Insurance |
| Under 6 | 891 (16.7%) | 4,146 (77.6%) |
| 6 to 18 Years | 1,947 (14.3%) | 11,682 (85.8%) |
| 19 to 25 Years | 327 (6.4%) | 4,260 (82.9%) |
| 25 to 34 Years | 890 (13.8%) | 5,026 (77.8%) |
| 35 to 44 Years | 833 (10.6%) | 6,347 (81.0%) |
| 45 to 54 Years | 508 (8.3%) | 5,256 (86.1%) |
| 55 to 64 Years | 800 (13.0%) | 5,077 (82.3%) |
| 65 to 74 Years | 4,012 (92.6%) | 2,447 (56.5%) |
| 75 Years and over | 2,919 (99.9%) | 1,530 (52.3%) |
| Total | 13,127 (22.7%) | 45,771 (79.0%) |
Disability Status by Sex by Age in Box Elder County
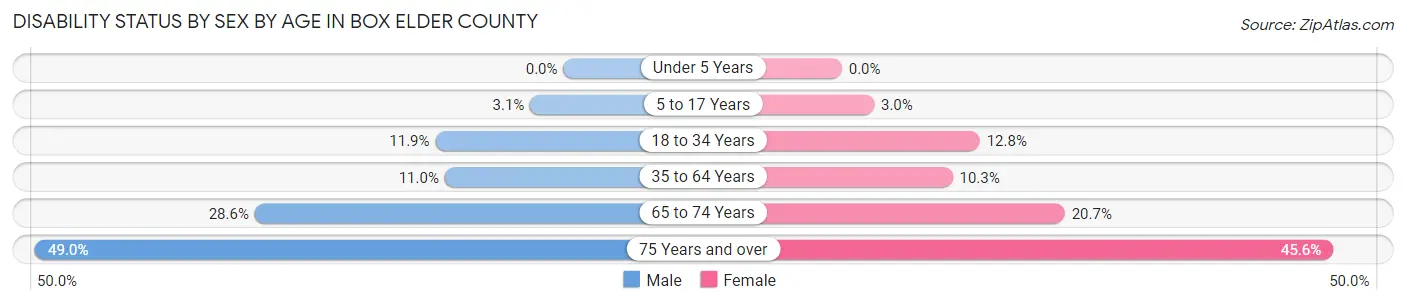
| Age Bracket | Male | Female |
| Under 5 Years | 0 (0.0%) | 0 (0.0%) |
| 5 to 17 Years | 220 (3.1%) | 195 (3.0%) |
| 18 to 34 Years | 754 (11.9%) | 790 (12.8%) |
| 35 to 64 Years | 1,135 (11.0%) | 1,007 (10.3%) |
| 65 to 74 Years | 619 (28.6%) | 449 (20.7%) |
| 75 Years and over | 677 (49.0%) | 703 (45.6%) |
Disability Class by Sex by Age in Box Elder County
Disability Class: Hearing Difficulty
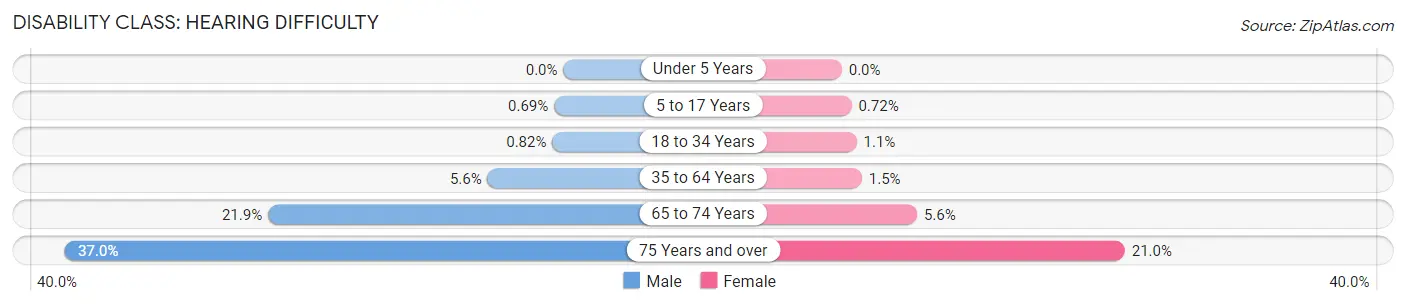
| Age Bracket | Male | Female |
| Under 5 Years | 0 (0.0%) | 0 (0.0%) |
| 5 to 17 Years | 49 (0.7%) | 47 (0.7%) |
| 18 to 34 Years | 52 (0.8%) | 68 (1.1%) |
| 35 to 64 Years | 580 (5.6%) | 146 (1.5%) |
| 65 to 74 Years | 474 (21.9%) | 121 (5.6%) |
| 75 Years and over | 511 (37.0%) | 324 (21.0%) |
Disability Class: Vision Difficulty
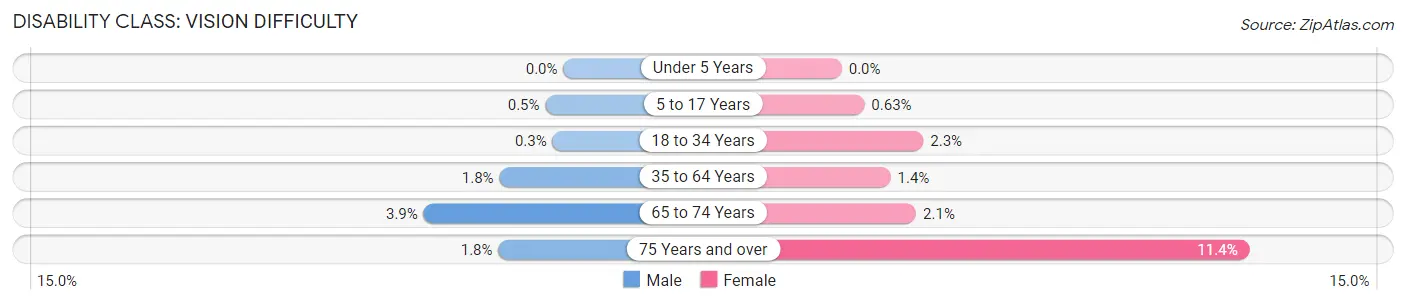
| Age Bracket | Male | Female |
| Under 5 Years | 0 (0.0%) | 0 (0.0%) |
| 5 to 17 Years | 36 (0.5%) | 41 (0.6%) |
| 18 to 34 Years | 19 (0.3%) | 140 (2.3%) |
| 35 to 64 Years | 184 (1.8%) | 133 (1.4%) |
| 65 to 74 Years | 84 (3.9%) | 45 (2.1%) |
| 75 Years and over | 25 (1.8%) | 175 (11.4%) |
Disability Class: Cognitive Difficulty
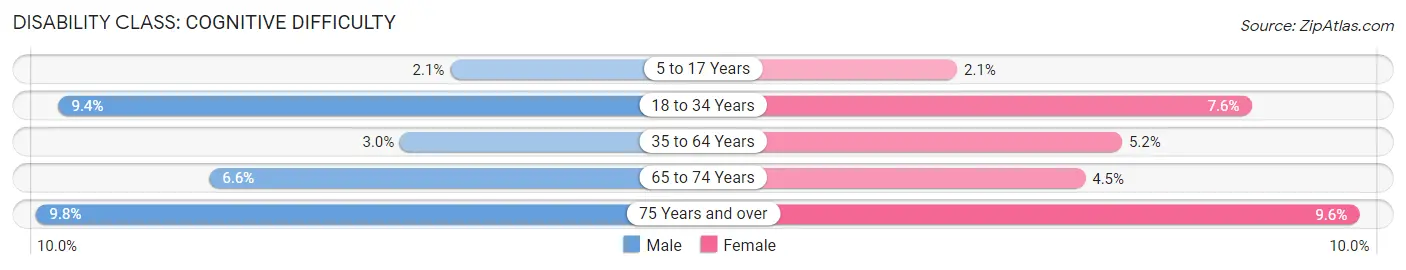
| Age Bracket | Male | Female |
| 5 to 17 Years | 150 (2.1%) | 140 (2.1%) |
| 18 to 34 Years | 595 (9.4%) | 469 (7.6%) |
| 35 to 64 Years | 312 (3.0%) | 510 (5.2%) |
| 65 to 74 Years | 142 (6.6%) | 98 (4.5%) |
| 75 Years and over | 135 (9.8%) | 148 (9.6%) |
Disability Class: Ambulatory Difficulty
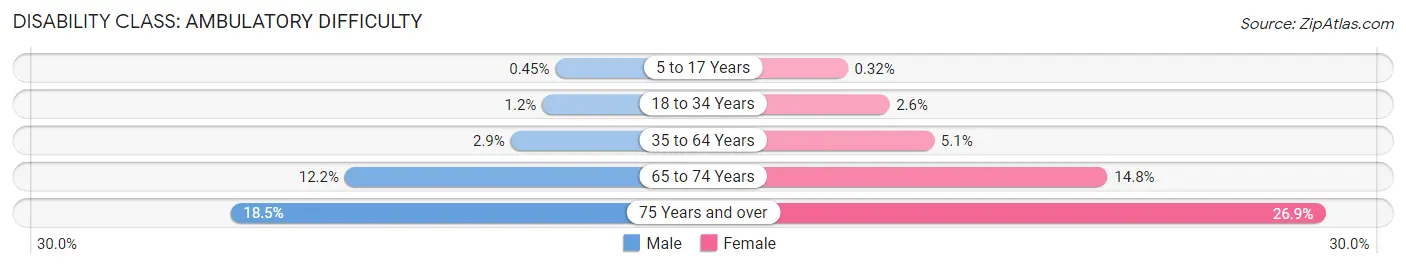
| Age Bracket | Male | Female |
| 5 to 17 Years | 32 (0.4%) | 21 (0.3%) |
| 18 to 34 Years | 75 (1.2%) | 163 (2.6%) |
| 35 to 64 Years | 303 (2.9%) | 503 (5.1%) |
| 65 to 74 Years | 263 (12.2%) | 321 (14.8%) |
| 75 Years and over | 256 (18.5%) | 415 (26.9%) |
Disability Class: Self-Care Difficulty
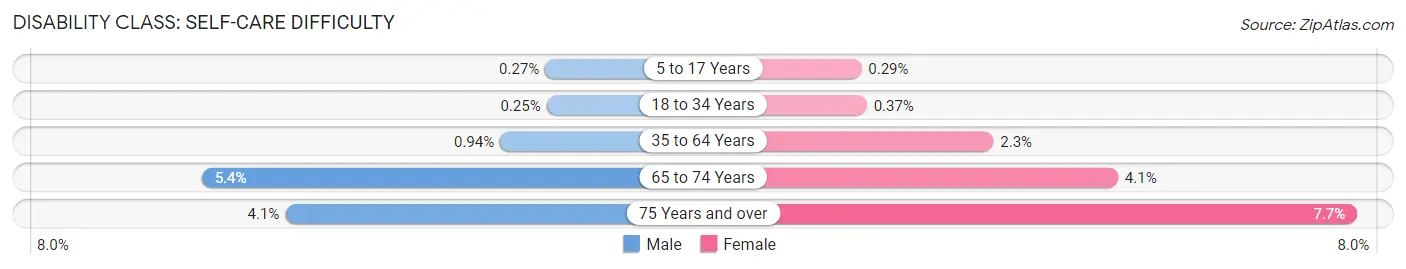
| Age Bracket | Male | Female |
| 5 to 17 Years | 19 (0.3%) | 19 (0.3%) |
| 18 to 34 Years | 16 (0.3%) | 23 (0.4%) |
| 35 to 64 Years | 97 (0.9%) | 220 (2.2%) |
| 65 to 74 Years | 116 (5.4%) | 89 (4.1%) |
| 75 Years and over | 57 (4.1%) | 118 (7.6%) |
Technology Access in Box Elder County
Computing Device Access in Box Elder County
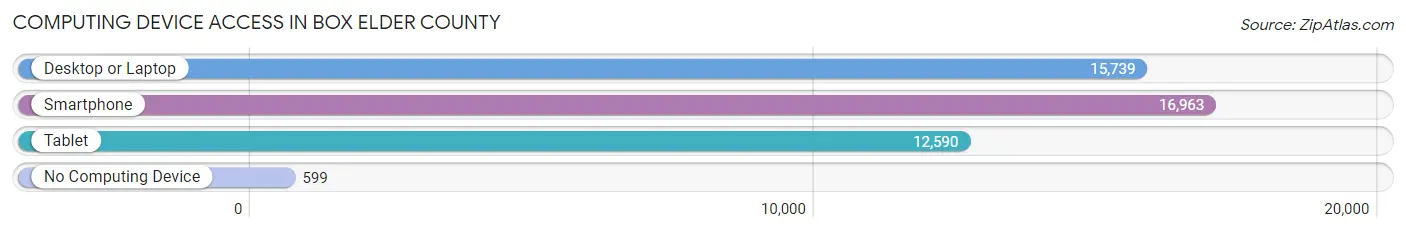
| Device Type | # Households | % Households |
| Desktop or Laptop | 15,739 | 84.8% |
| Smartphone | 16,963 | 91.4% |
| Tablet | 12,590 | 67.8% |
| No Computing Device | 599 | 3.2% |
| Total | 18,557 | 100.0% |
Internet Access in Box Elder County
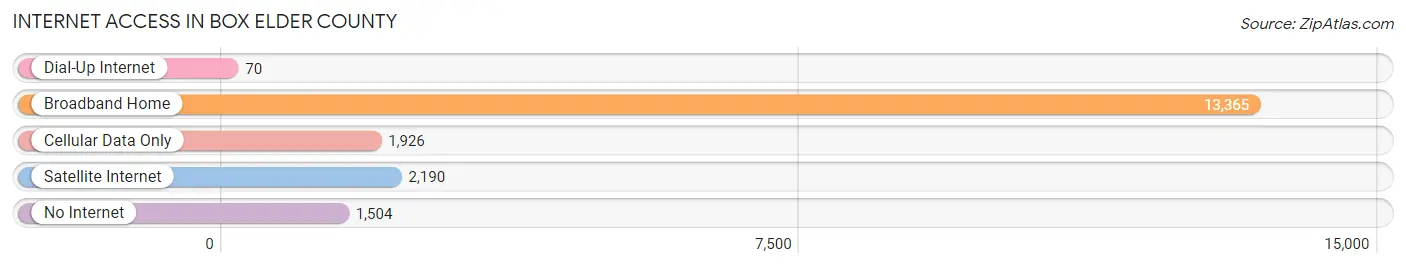
| Internet Type | # Households | % Households |
| Dial-Up Internet | 70 | 0.4% |
| Broadband Home | 13,365 | 72.0% |
| Cellular Data Only | 1,926 | 10.4% |
| Satellite Internet | 2,190 | 11.8% |
| No Internet | 1,504 | 8.1% |
| Total | 18,557 | 100.0% |
Box Elder County Summary
Introduction
Box Elder County is located in the northern part of Utah, and is the largest county in the state. It is bordered by Idaho to the north, Weber County to the south, and Tooele County to the west. The county seat is Brigham City, and the population was estimated to be 49,945 in 2019.
History
Box Elder County was created in 1856 as part of the Utah Territory. It was named after the box elder trees that were found in the area. The county was originally part of Weber County, but was split off in 1856. The county was initially populated by Mormon settlers, and the first county seat was located in Willard. In 1864, the county seat was moved to Brigham City, which is still the county seat today.
The county was an important agricultural center in the late 19th and early 20th centuries, and was home to many fruit orchards and farms. The county was also home to several mining operations, including copper, lead, and zinc.
Geography
Box Elder County is located in the northern part of Utah, and is the largest county in the state. It is bordered by Idaho to the north, Weber County to the south, and Tooele County to the west. The county covers an area of 2,172 square miles, and is mostly rural. The terrain is mostly flat, with some rolling hills in the western part of the county.
The county is home to several mountain ranges, including the Wellsville Mountains, the Raft River Mountains, and the Deep Creek Mountains. The county is also home to several rivers, including the Bear River, the Malad River, and the Little Bear River.
Economy
The economy of Box Elder County is largely based on agriculture and manufacturing. The county is home to several large agricultural operations, including fruit orchards, dairy farms, and livestock farms. The county is also home to several manufacturing companies, including aerospace, automotive, and food processing.
The county is also home to several military installations, including Hill Air Force Base and the Utah Test and Training Range. These installations provide a significant economic boost to the county.
Demographics
As of the 2010 census, the population of Box Elder County was 49,945. The population is mostly white (90.2%), with smaller percentages of Hispanic (4.3%), Asian (2.2%), and African American (1.2%) residents. The median household income is $50,945, and the median age is 30.
Conclusion
Box Elder County is located in the northern part of Utah, and is the largest county in the state. It is bordered by Idaho to the north, Weber County to the south, and Tooele County to the west. The county is mostly rural, and is home to several mountain ranges and rivers. The economy of the county is largely based on agriculture and manufacturing, and the county is home to several military installations. The population of the county is mostly white, with smaller percentages of Hispanic, Asian, and African American residents.
Common Questions
What is the Total Population of Box Elder County?
Total Population of Box Elder County is 58,291.
What is the Total Male Population of Box Elder County?
Total Male Population of Box Elder County is 29,874.
What is the Total Female Population of Box Elder County?
Total Female Population of Box Elder County is 28,417.
What is the Ratio of Males per 100 Females in Box Elder County?
There are 105.13 Males per 100 Females in Box Elder County.
What is the Ratio of Females per 100 Males in Box Elder County?
There are 95.12 Females per 100 Males in Box Elder County.
What is the Median Population Age in Box Elder County?
Median Population Age in Box Elder County is 33.1 Years.
What is the Average Family Size in Box Elder County
Average Family Size in Box Elder County is 3.7 People.
What is the Average Household Size in Box Elder County
Average Household Size in Box Elder County is 3.1 People.
What is Per Capita Income in Box Elder County?
Per Capita income in Box Elder County is $30,762.
What is the Median Family Income in Box Elder County?
Median Family Income in Box Elder County is $87,041.
What is the Median Household income in Box Elder County?
Median Household Income in Box Elder County is $72,769.
What is Income or Wage Gap in Box Elder County?
Income or Wage Gap in Box Elder County is 51.0%.
Women in Box Elder County earn 49.0 cents for every dollar earned by a man.
What is Family Income Deficit in Box Elder County?
Family Income Deficit in Box Elder County is $9,413.
Families that are below poverty line in Box Elder County earn $9,413 less on average than the poverty threshold level.
What is Inequality or Gini Index in Box Elder County?
Inequality or Gini Index in Box Elder County is 0.41.
How Large is the Labor Force in Box Elder County?
There are 27,802 People in the Labor Forcein in Box Elder County.
What is the Percentage of People in the Labor Force in Box Elder County?
65.6% of People are in the Labor Force in Box Elder County.
What is the Unemployment Rate in Box Elder County?
Unemployment Rate in Box Elder County is 2.6%.